Embed Size (px)
Citation preview
Cumulative Frequency Curves
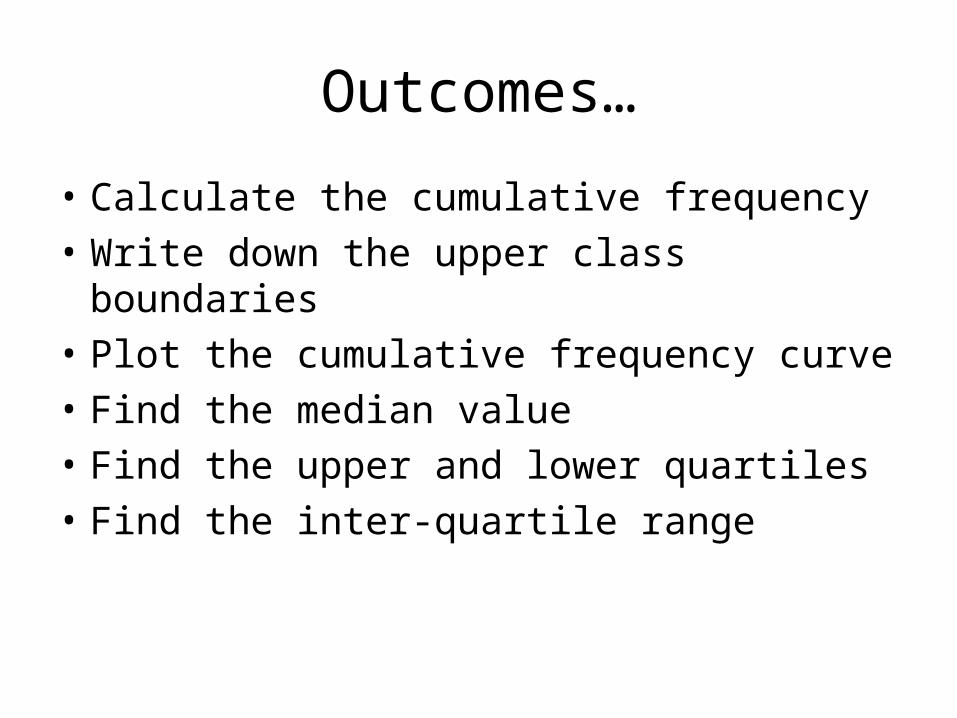
Outcomes…
• Calculate the cumulative frequency • Write down the upper class
boundaries• Plot the cumulative frequency curve• Find the median value• Find the upper and lower quartiles• Find the inter-quartile range
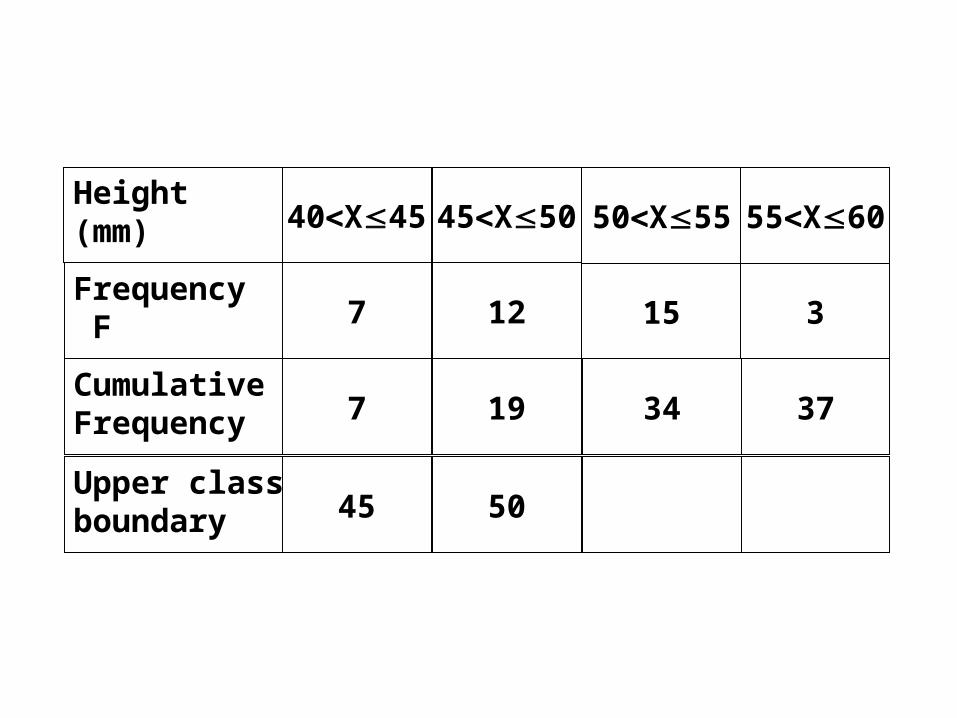
Cumulative Frequency
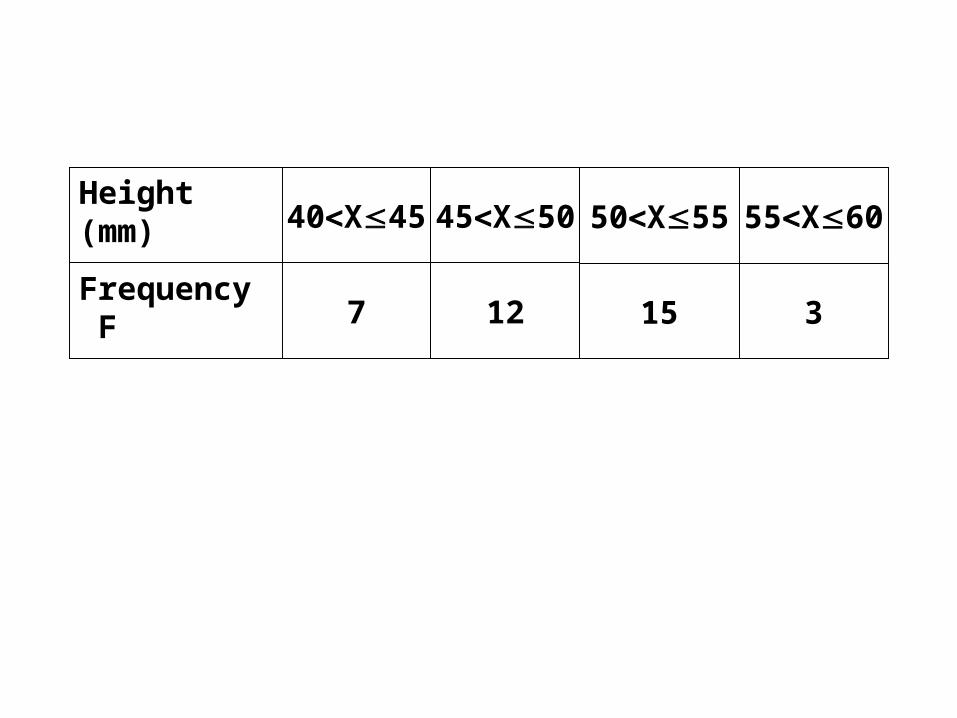
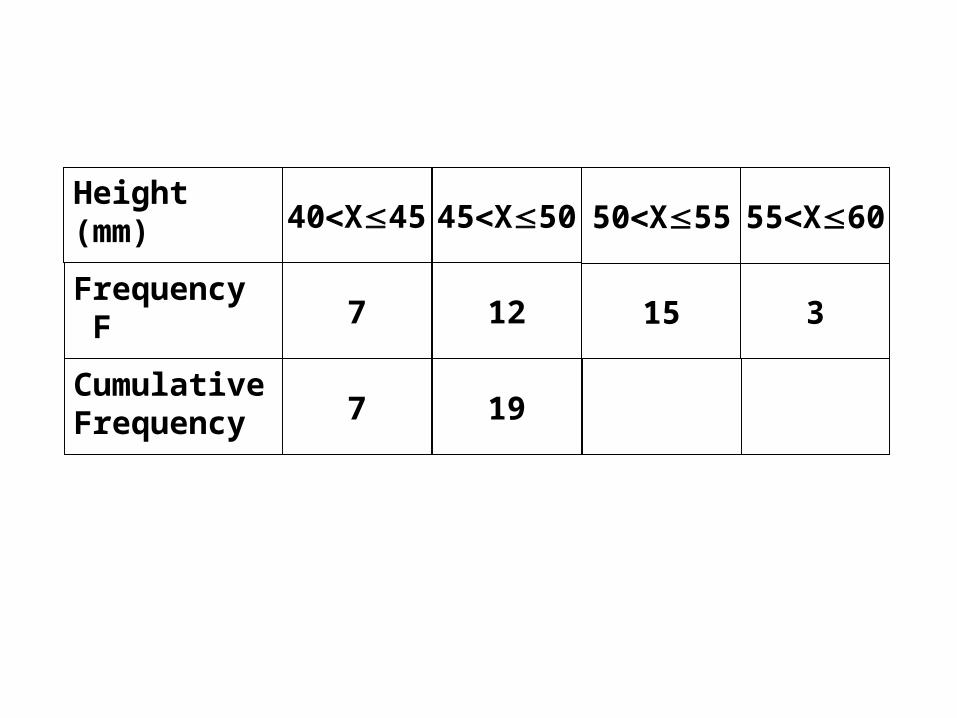
Height (mm)
Frequency F
40X45 45X50
7 12
50X55
15
55X60
3

Height (mm)
Frequency F
40X45 45X50
7 12
50X55
15
55X60
3
Cumulative Frequency
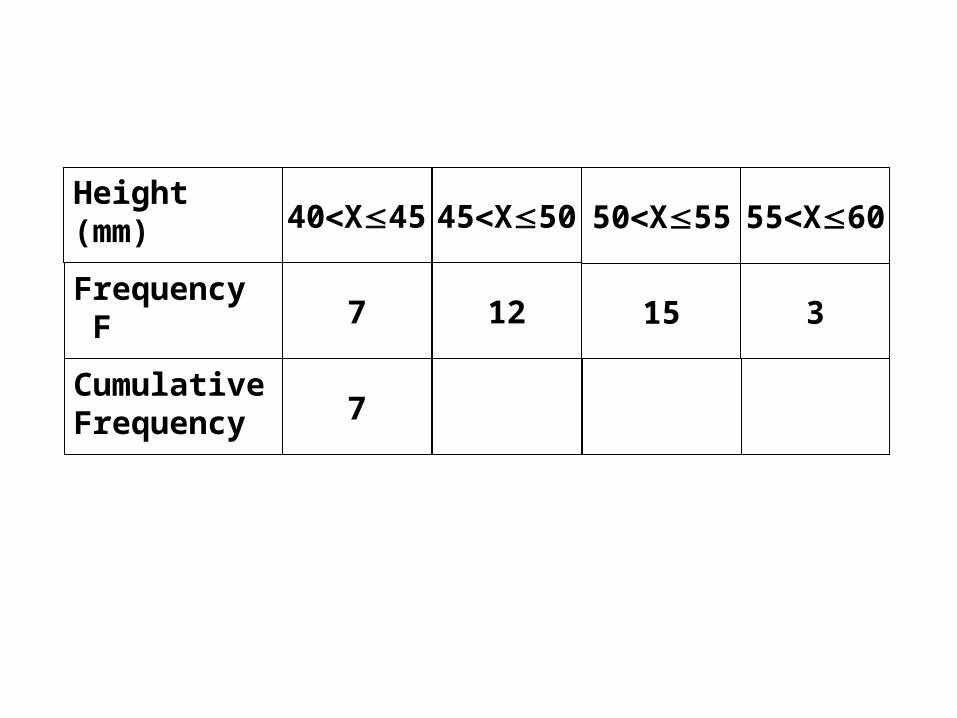
Height (mm)
Frequency F
40X45 45X50
7 12
50X55
15
55X60
3
Cumulative Frequency 7
Height (mm)
Frequency F
40X45 45X50
7 12
50X55
15
55X60
3
Cumulative Frequency 7 19
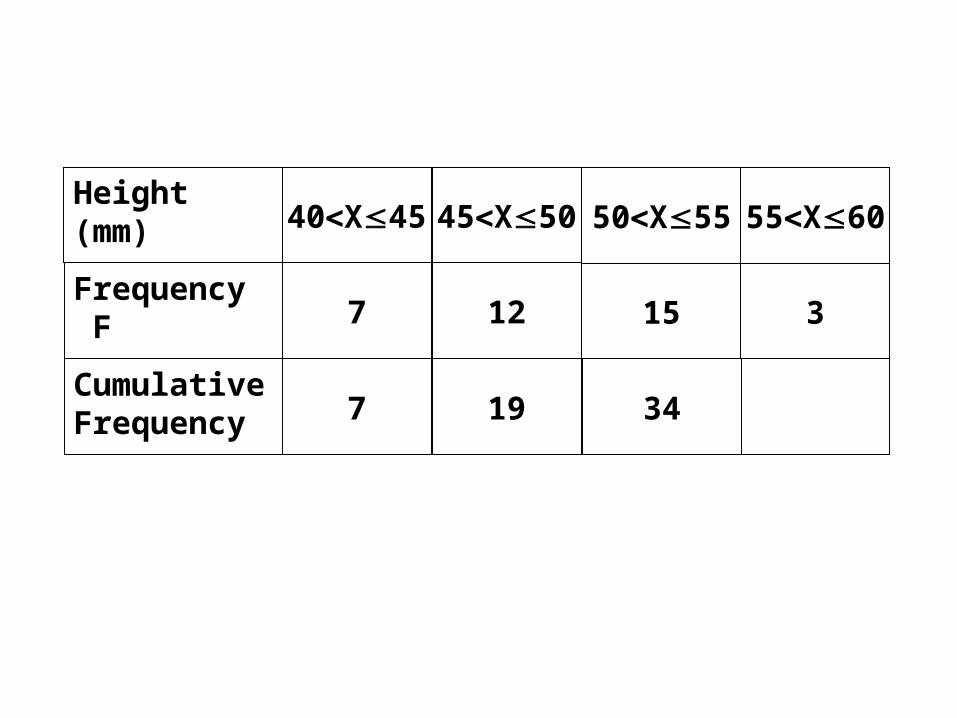
Height (mm)
Frequency F
40X45 45X50
7 12
50X55
15
55X60
3
Cumulative Frequency 7 19 34

Height (mm)
Frequency F
40X45 45X50
7 12
50X55
15
55X60
3
Cumulative Frequency 7 19 34 37

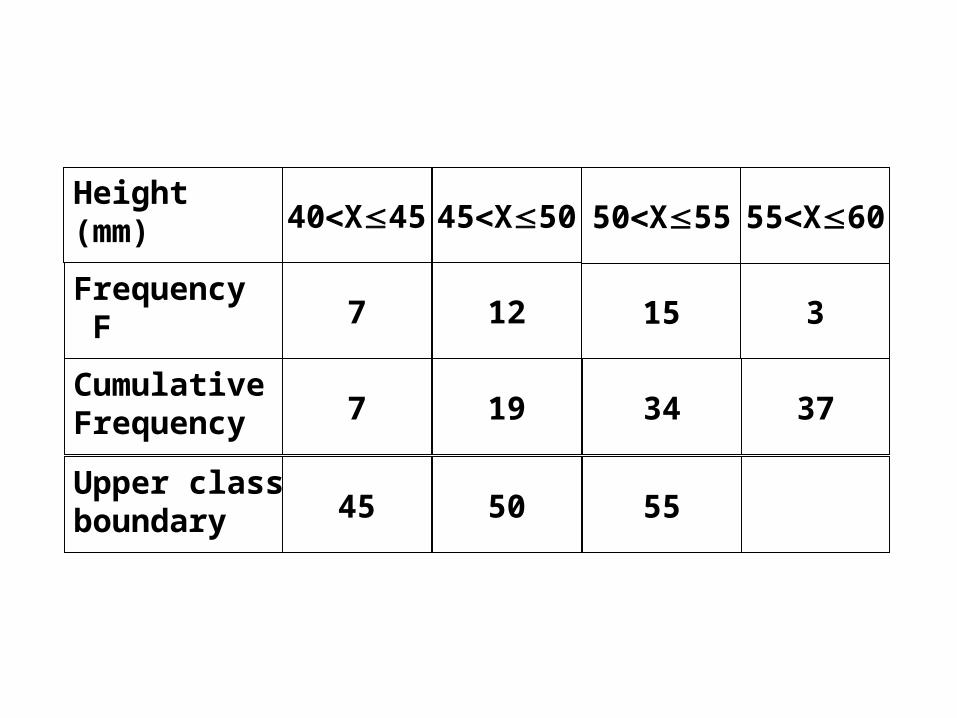
Upper Class Boundary
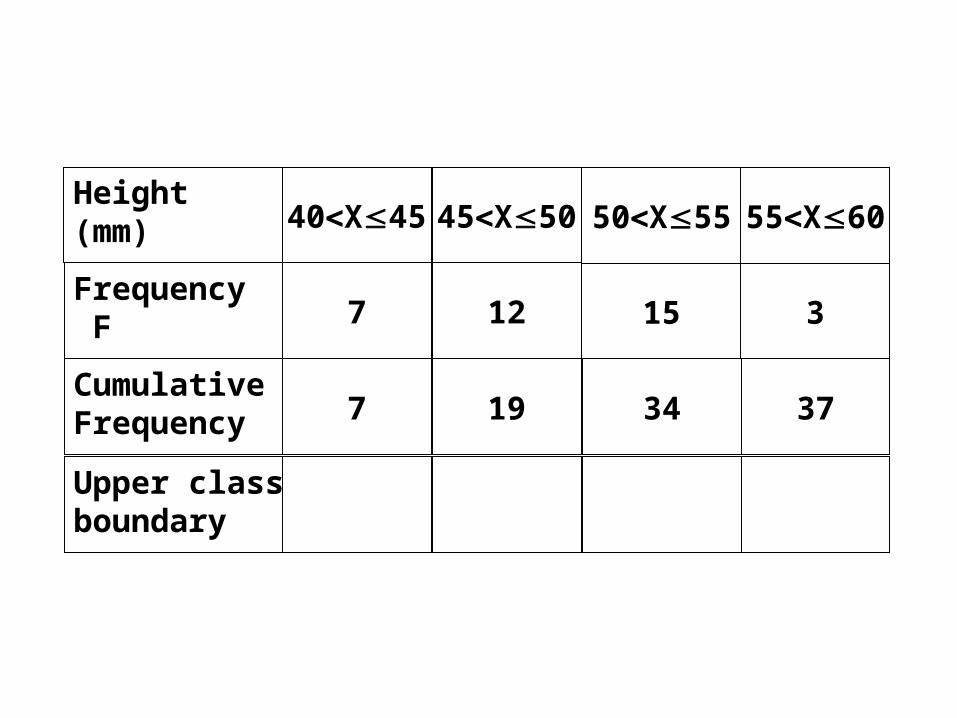
Height (mm)
Frequency F
40X45 45X50
7 12
50X55
15
55X60
3
Cumulative Frequency 7 19 34 37
Upper class boundary
Height (mm)
Frequency F
40X45 45X50
7 12
50X55
15
55X60
3
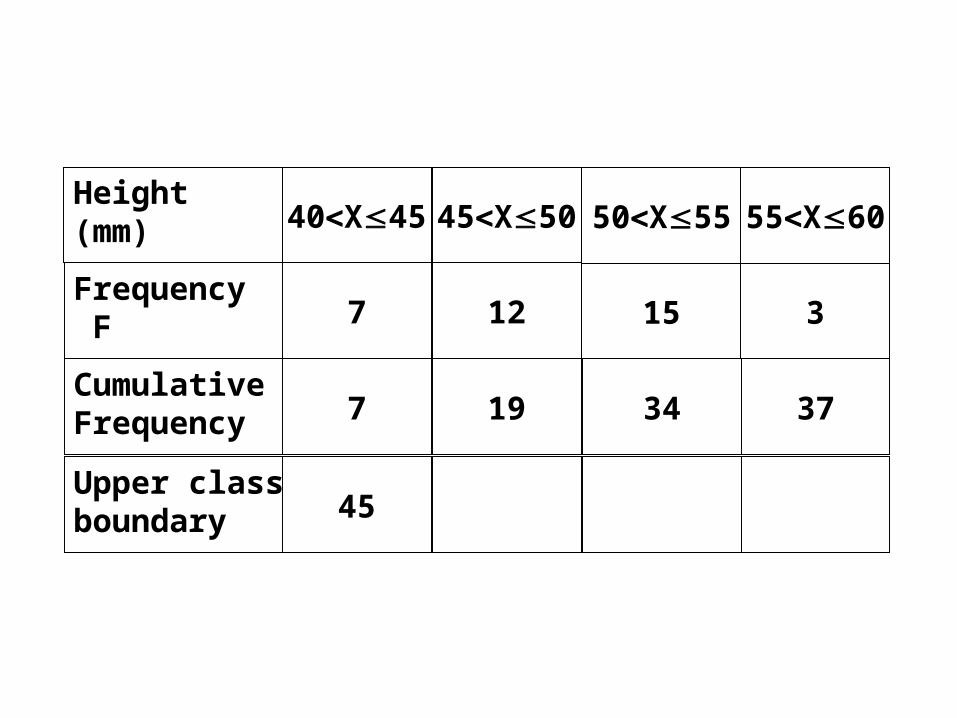
Cumulative Frequency 7 19 34 37
Upper class boundary 45
Height (mm)
Frequency F
40X45 45X50
7 12
50X55
15
55X60
3
Cumulative Frequency 7 19 34 37
Upper class boundary 45 50
Height (mm)
Frequency F
40X45 45X50
7 12
50X55
15
55X60
3
Cumulative Frequency 7 19 34 37
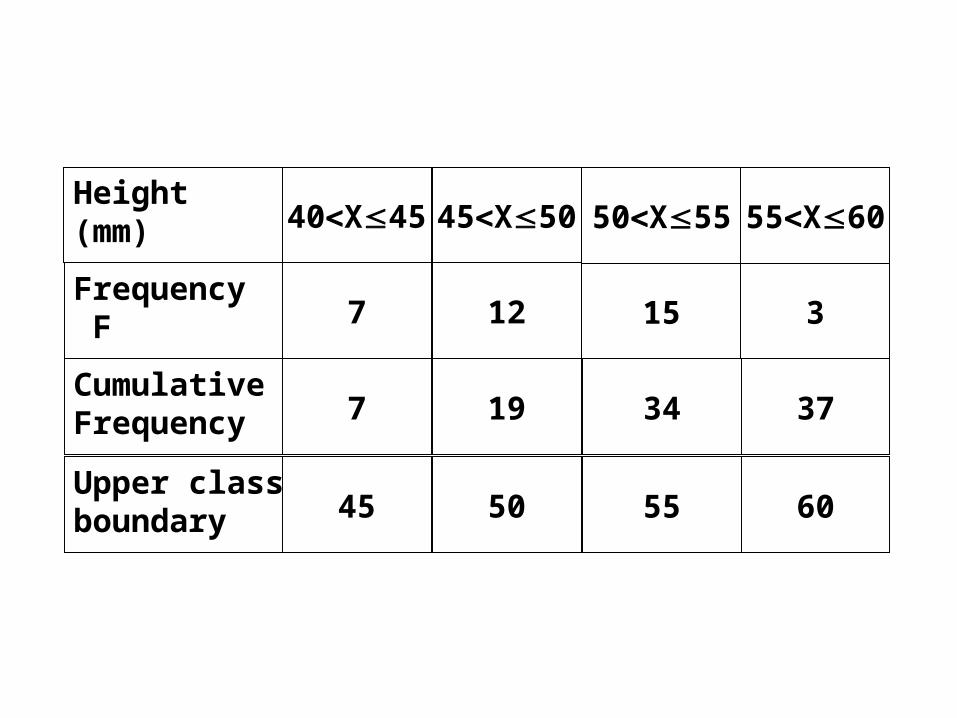
Upper class boundary 45 50 55
Height (mm)
Frequency F
40X45 45X50
7 12
50X55
15
55X60
3
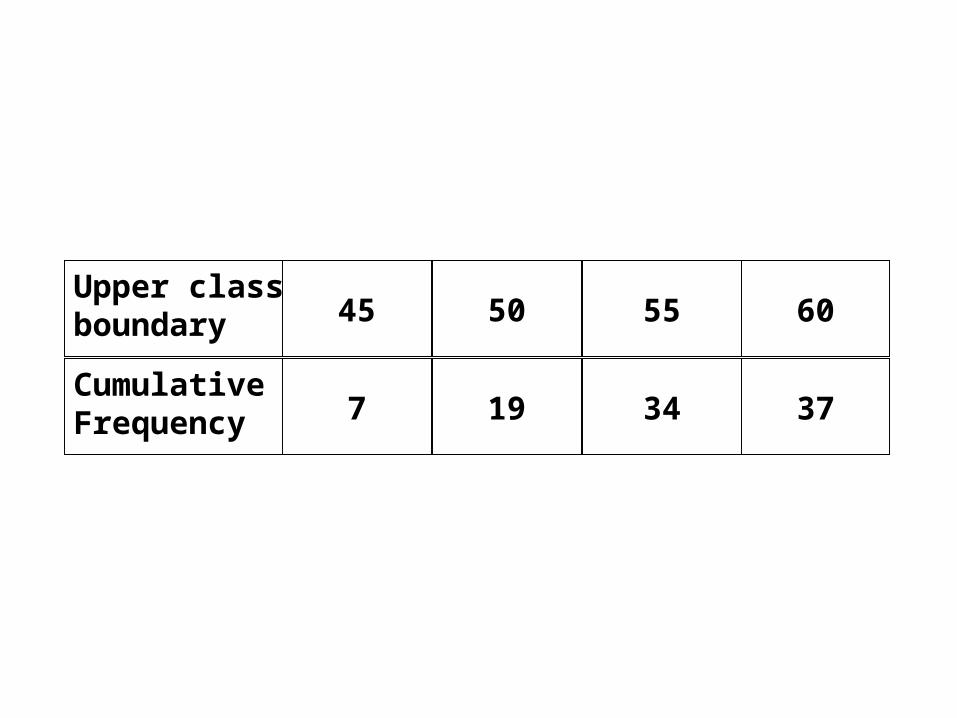
Cumulative Frequency 7 19 34 37
Upper class boundary 45 50 55 60

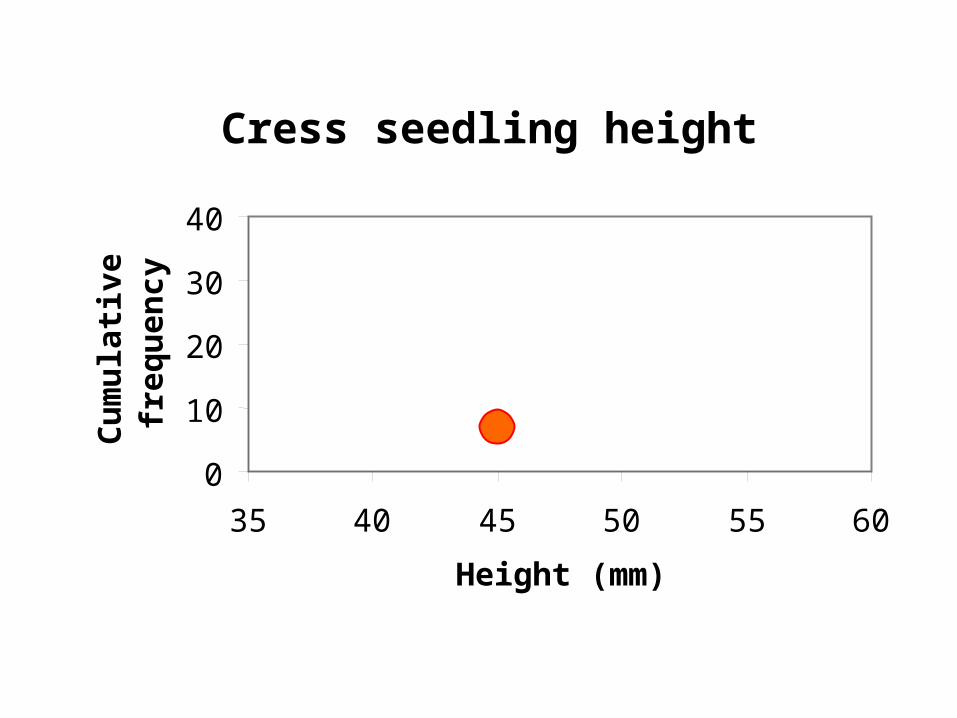
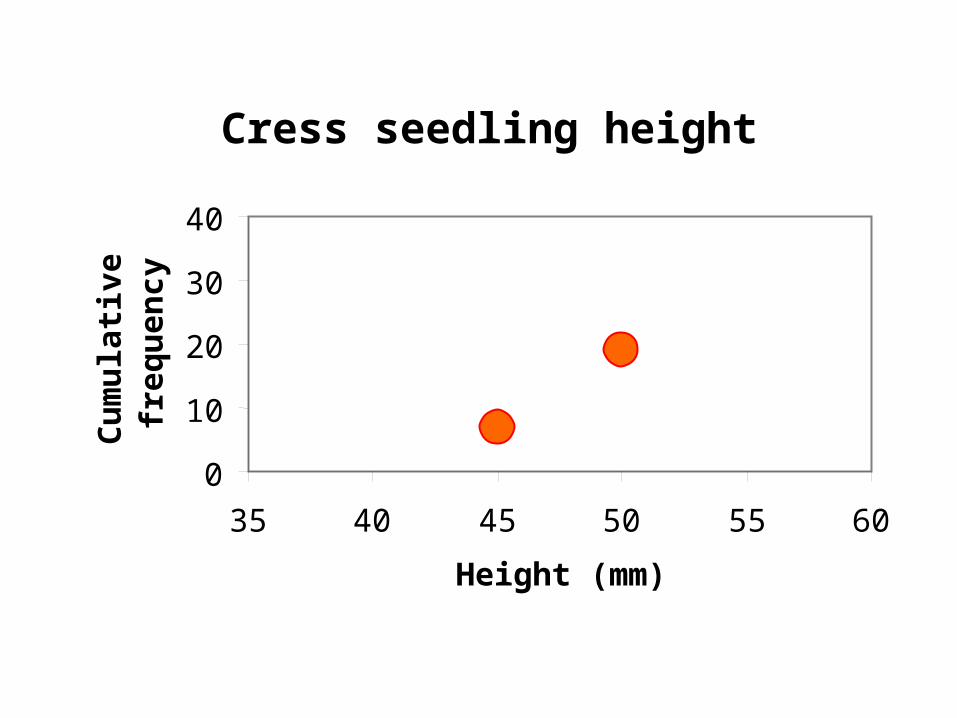
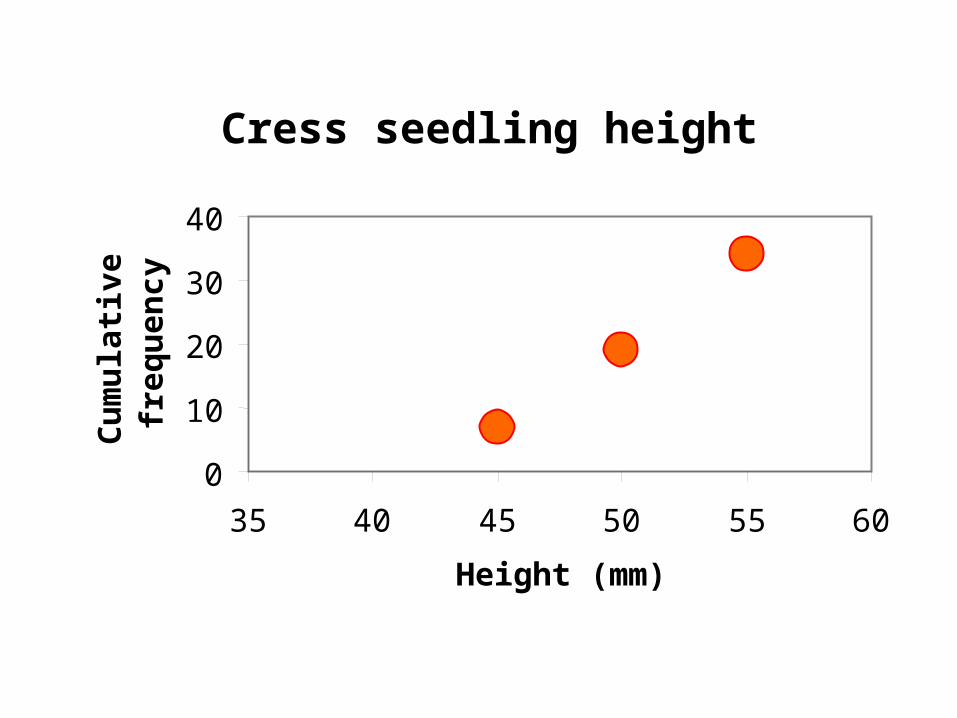
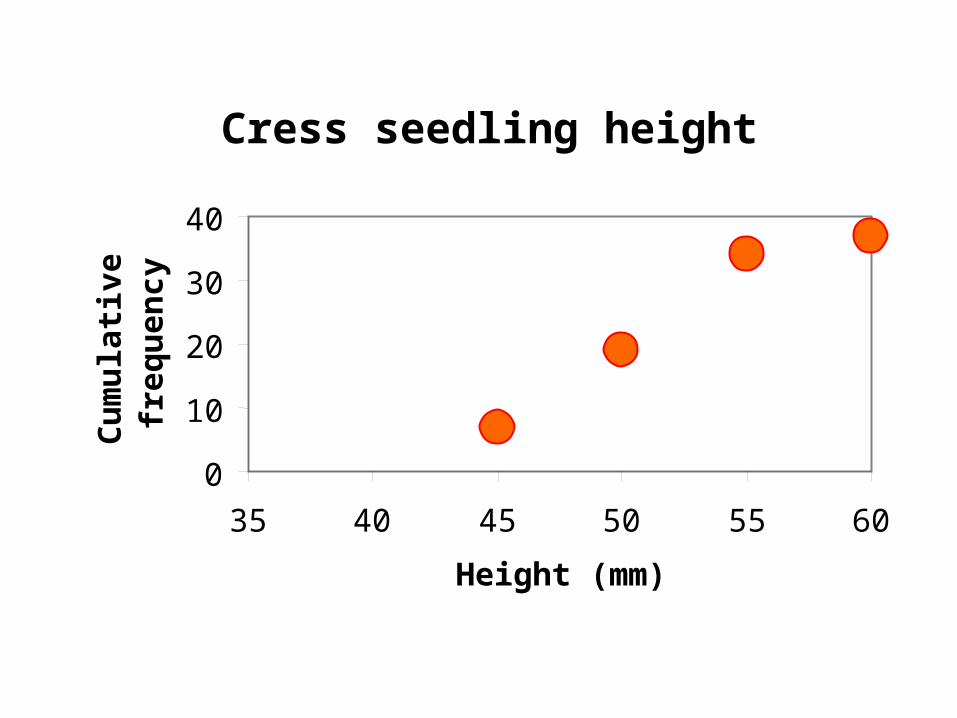
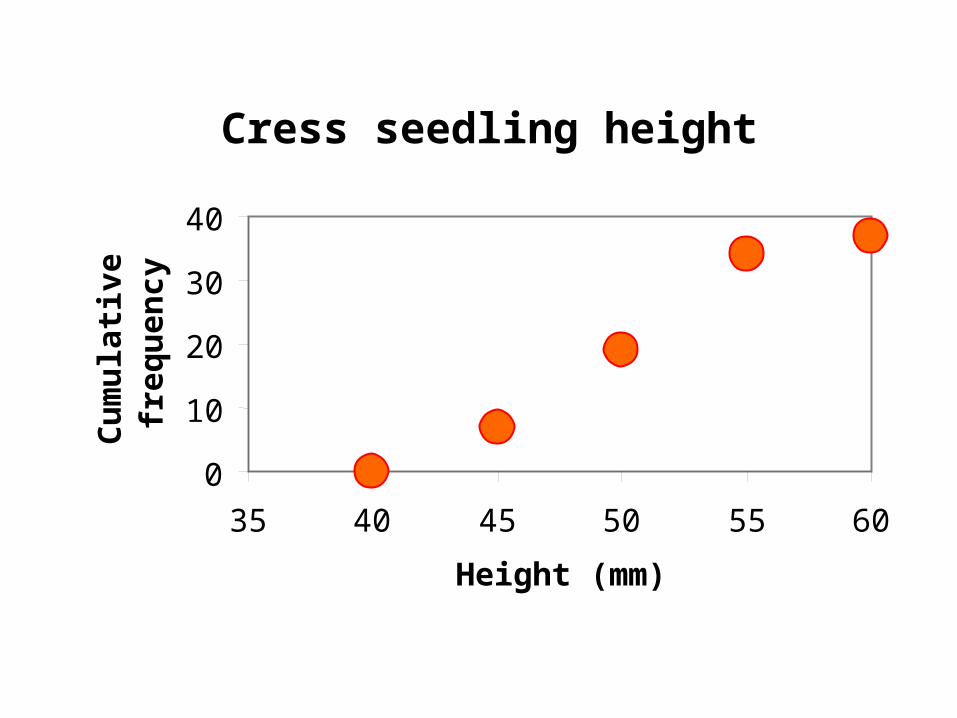
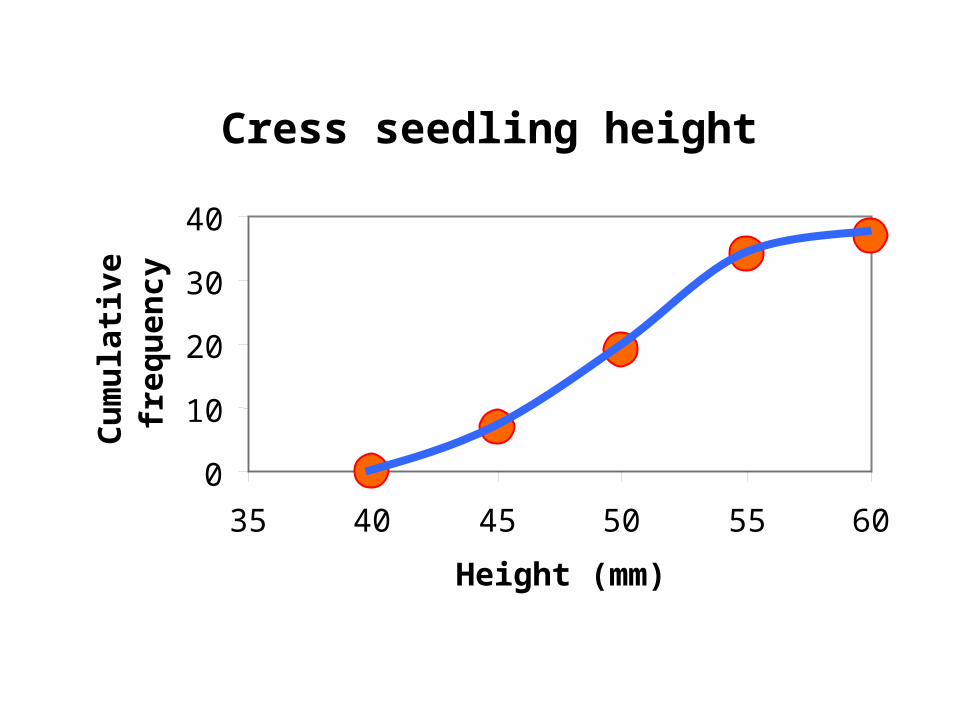
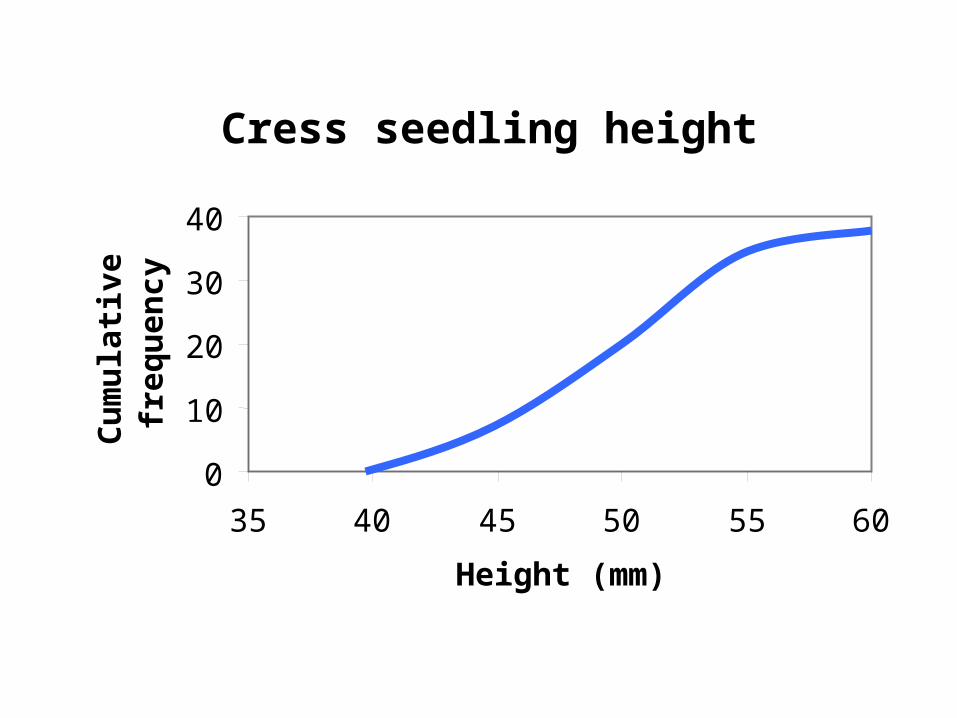
Plot the curve
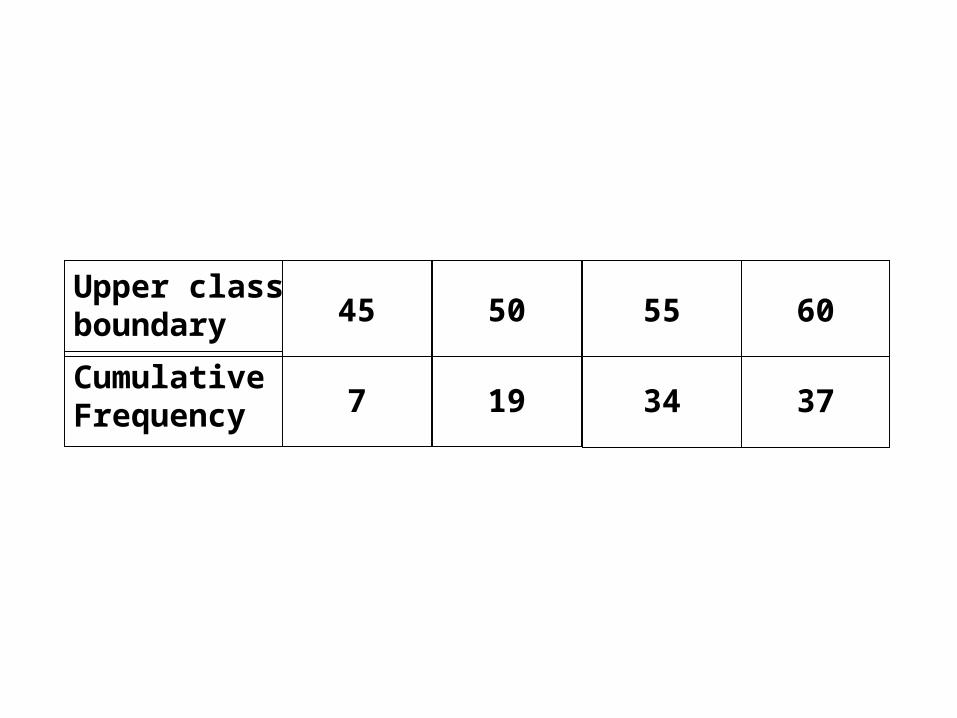
Cumulative Frequency 7 19 34 37
Upper class boundary 45 50 55 60
Cress seedling height
0
10
20
30
40
35 40 45 50 55 60
Height (mm)
Cu
mu
lati
ve
freq
uen
cy
Cress seedling height
0
10
20
30
40
35 40 45 50 55 60
Height (mm)
Cu
mu
lati
ve
freq
uen
cy
Cress seedling height
0
10
20
30
40
35 40 45 50 55 60
Height (mm)
Cu
mu
lati
ve
freq
uen
cy
Cress seedling height
0
10
20
30
40
35 40 45 50 55 60
Height (mm)
Cu
mu
lati
ve
freq
uen
cy
Cress seedling height
0
10
20
30
40
35 40 45 50 55 60
Height (mm)
Cu
mu
lati
ve
freq
uen
cy
Cress seedling height
0
10
20
30
40
35 40 45 50 55 60
Height (mm)
Cu
mu
lati
ve
freq
uen
cy
Cress seedling height
0
10
20
30
40
35 40 45 50 55 60
Height (mm)
Cu
mu
lati
ve
freq
uen
cy

Cress seedling height
0
10
20
30
40
35 40 45 50 55 60
Height (mm)
Cu
mu
lati
ve
freq
uen
cy

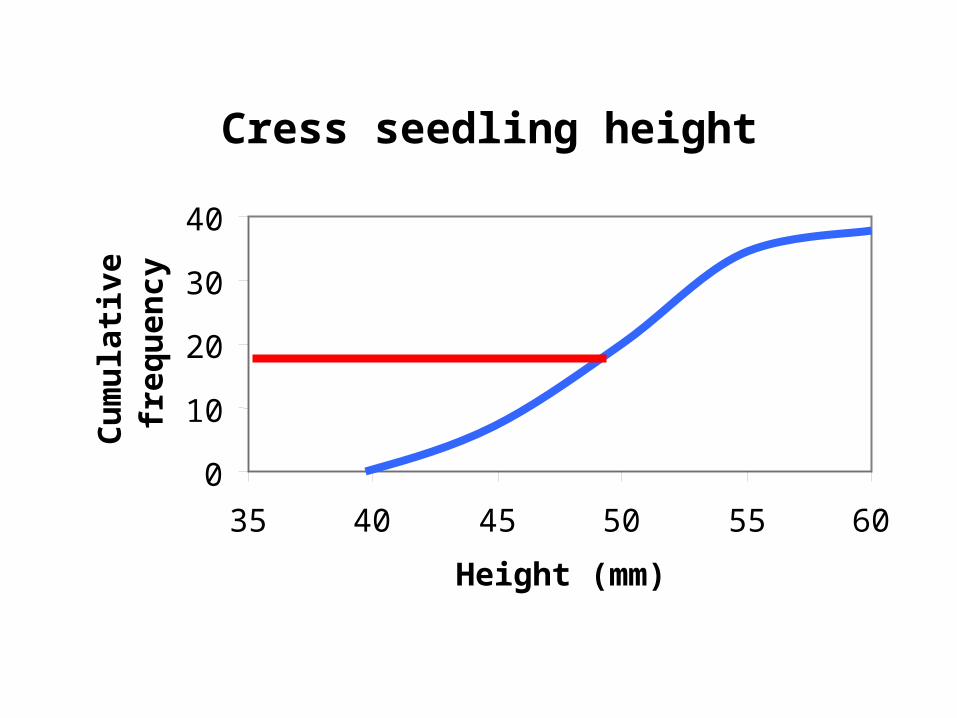
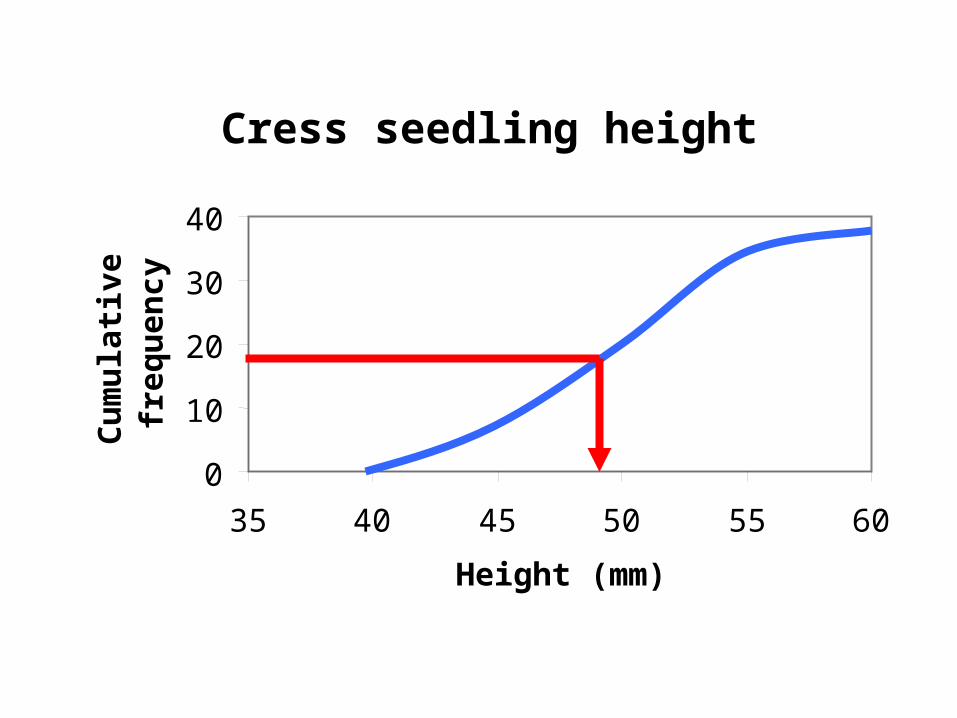
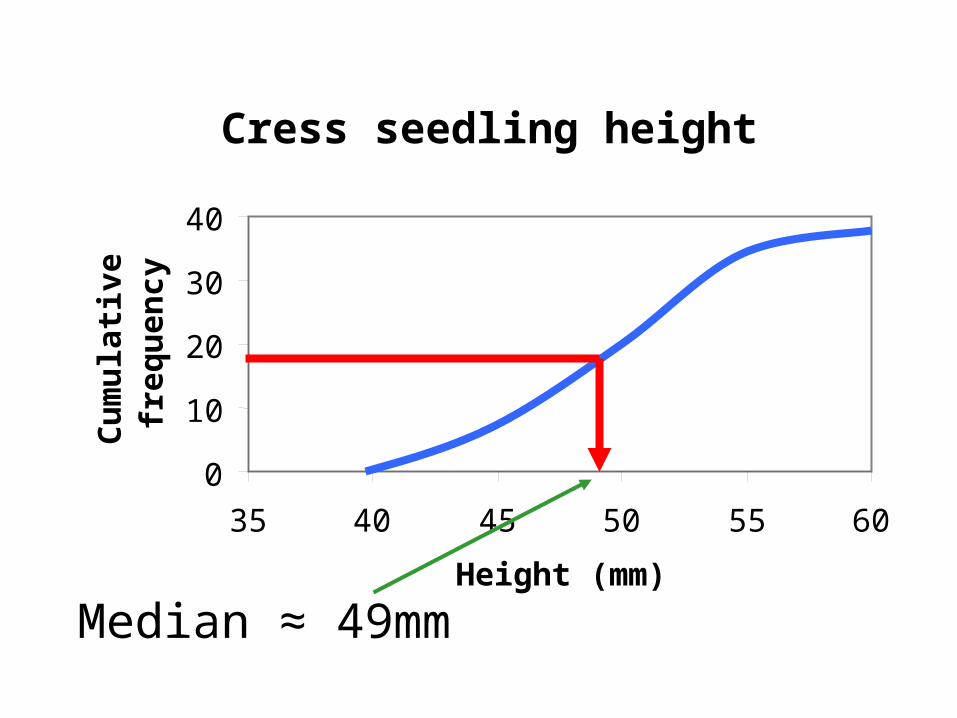
Median
Cumulative Frequency 7 19 34 37
Upper class boundary 45 50 55 60
Cress seedling height
0
10
20
30
40
35 40 45 50 55 60
Height (mm)
Cu
mu
lati
ve
freq
uen
cy
Cress seedling height
0
10
20
30
40
35 40 45 50 55 60
Height (mm)
Cu
mu
lati
ve
freq
uen
cy
Cress seedling height
0
10
20
30
40
35 40 45 50 55 60
Height (mm)
Cu
mu
lati
ve
freq
uen
cy
Cress seedling height
0
10
20
30
40
35 40 45 50 55 60
Height (mm)
Cu
mu
lati
ve
freq
uen
cy
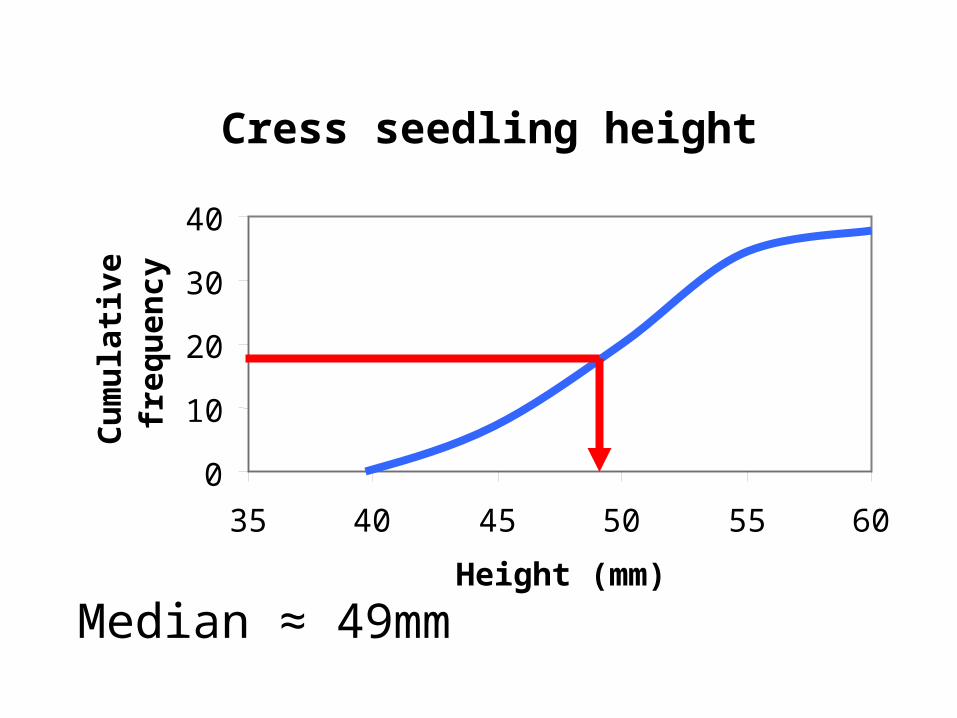
Median ≈ 49mm
Cress seedling height
0
10
20
30
40
35 40 45 50 55 60
Height (mm)
Cu
mu
lati
ve
freq
uen
cy
Median ≈ 49mm
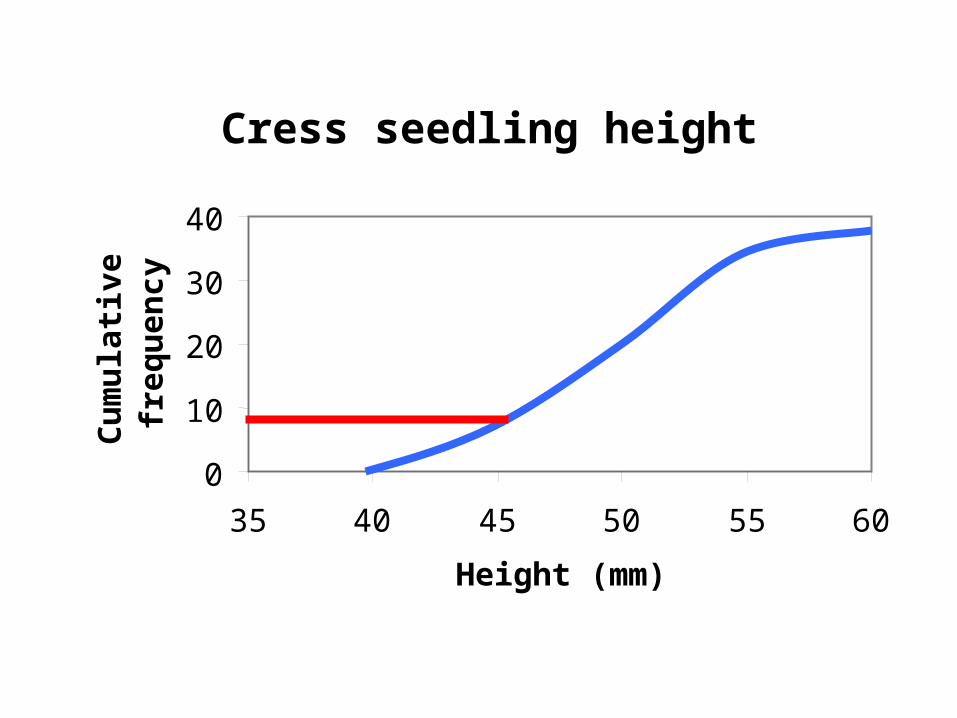
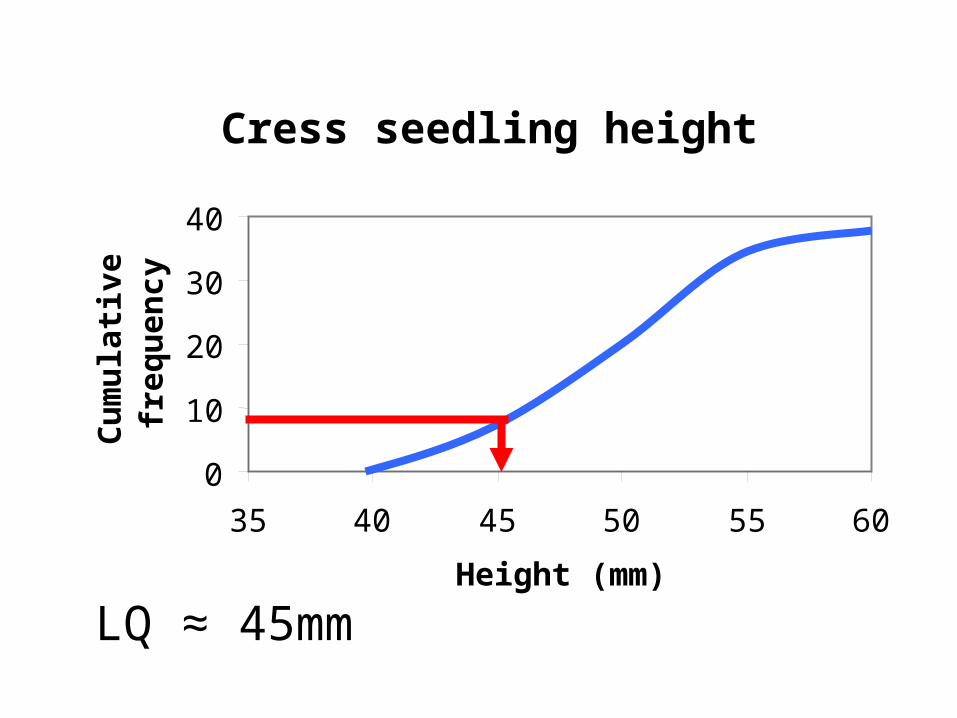
Quartiles
The lower quartile tells us what value 25% of the sample
are less than
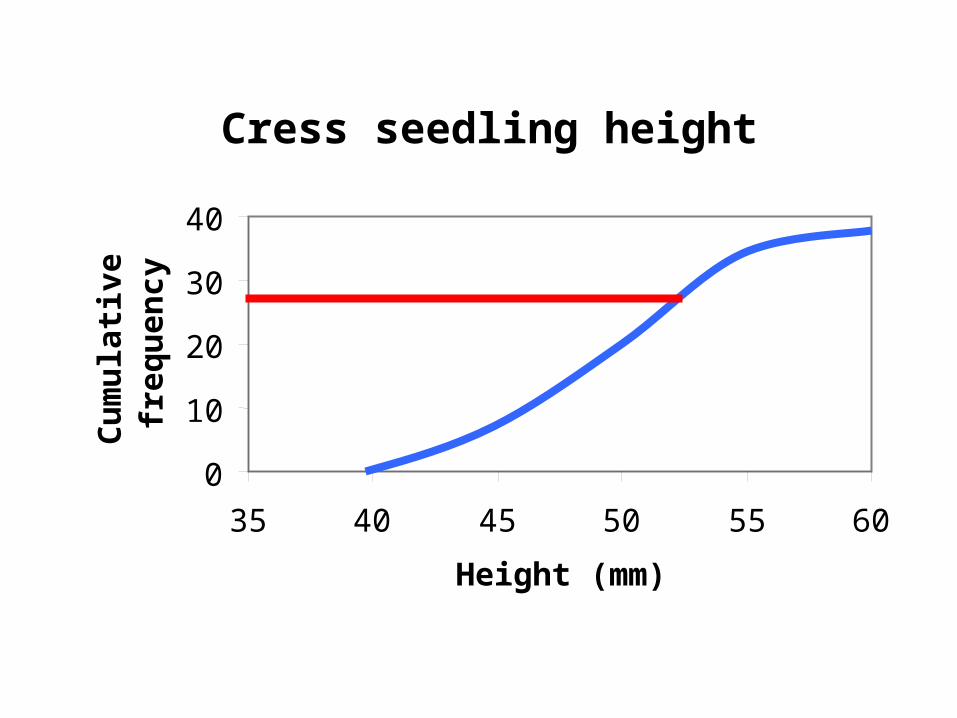
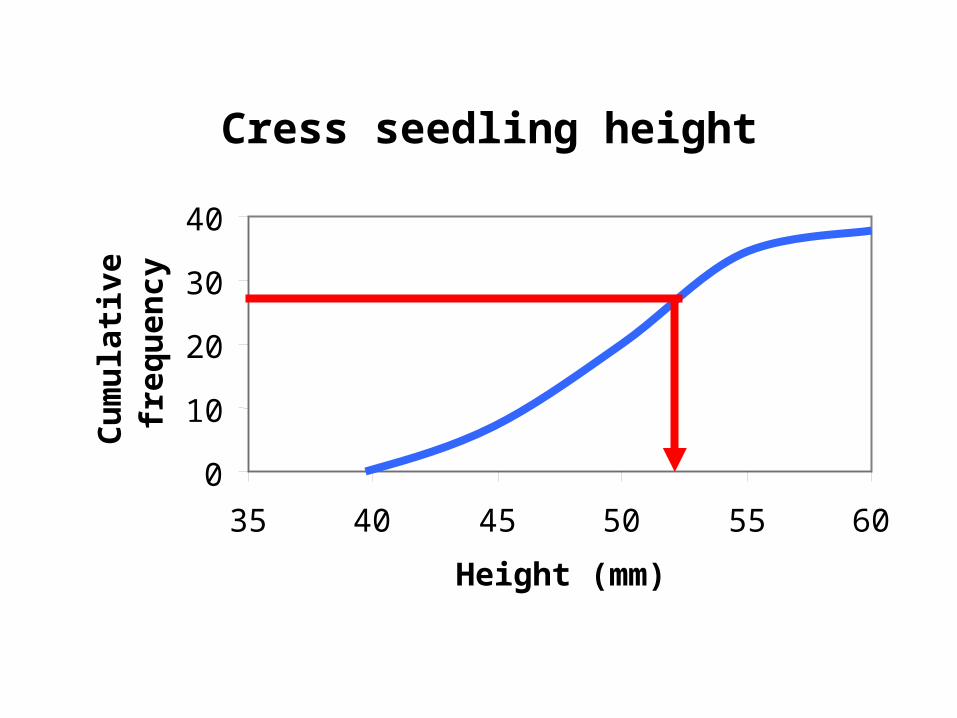
The upper quartile tells us what value 75% of the sample
are less than

37 cress seeds in total
A quarter of 37 is 9.25Three quarters is 27.75
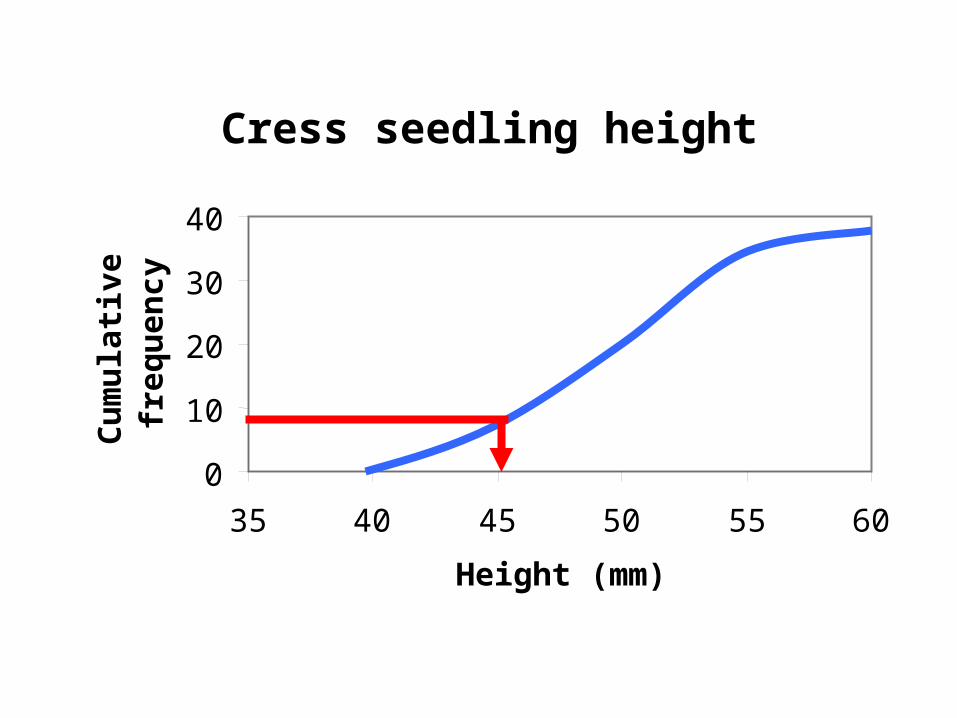
We use the graph to find what lengths correspond to
cumulative frequencies of 9.25 and 27.75

Cress seedling height
0
10
20
30
40
35 40 45 50 55 60
Height (mm)
Cu
mu
lati
ve
freq
uen
cy
Cress seedling height
0
10
20
30
40
35 40 45 50 55 60
Height (mm)
Cu
mu
lati
ve
freq
uen
cy
Cress seedling height
0
10
20
30
40
35 40 45 50 55 60
Height (mm)
Cu
mu
lati
ve
freq
uen
cy
Cress seedling height
0
10
20
30
40
35 40 45 50 55 60
Height (mm)
Cu
mu
lati
ve
freq
uen
cy
LQ ≈ 45mm

Cress seedling height
0
10
20
30
40
35 40 45 50 55 60
Height (mm)
Cu
mu
lati
ve
freq
uen
cy
Cress seedling height
0
10
20
30
40
35 40 45 50 55 60
Height (mm)
Cu
mu
lati
ve
freq
uen
cy
Cress seedling height
0
10
20
30
40
35 40 45 50 55 60
Height (mm)
Cu
mu
lati
ve
freq
uen
cy
Cress seedling height
0
10
20
30
40
35 40 45 50 55 60
Height (mm)
Cu
mu
lati
ve
freq
uen
cy
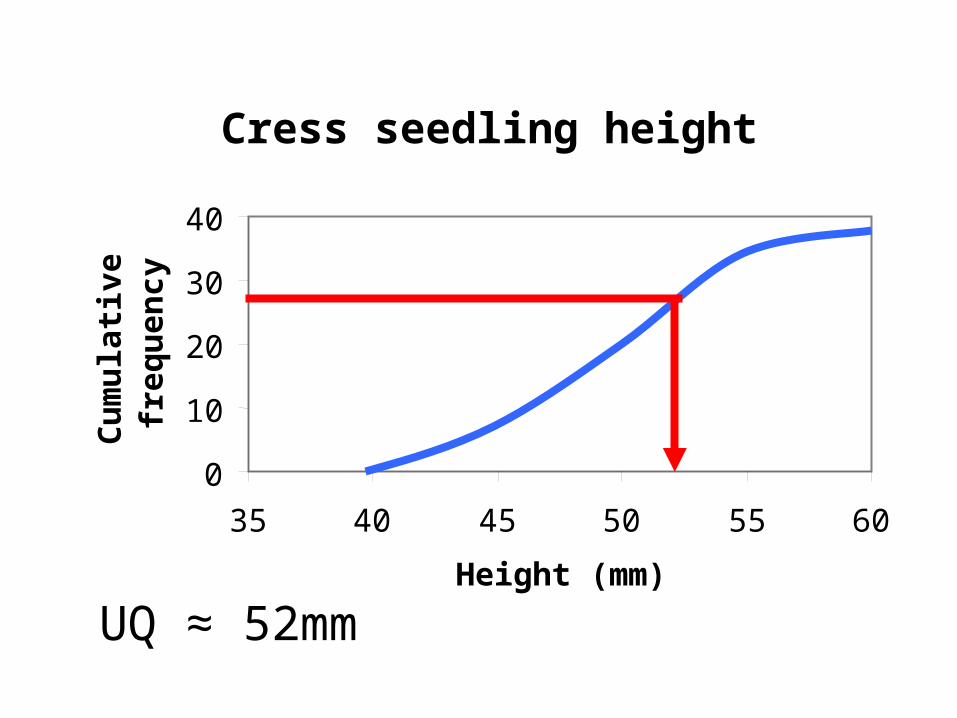
UQ ≈ 52mm
Inter-quartile range
The difference between the upper and lower quartile
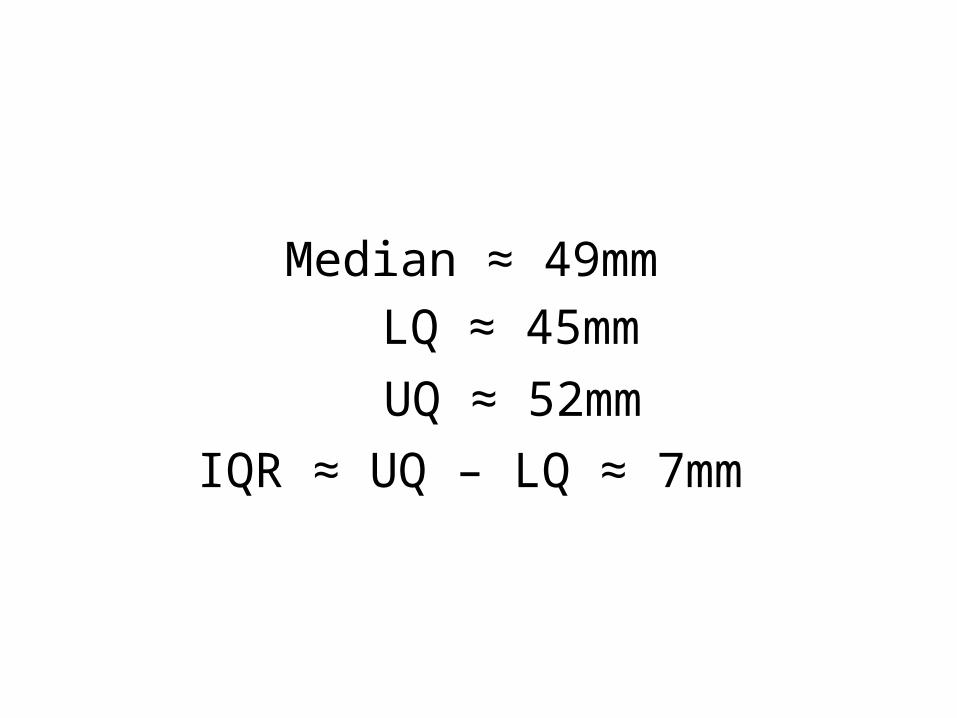
Median ≈ 49mm
LQ ≈ 45mm
UQ ≈ 52mm
IQR ≈ UQ – LQ ≈ 7mm
Tells you the range of values occupied by the middle 50% of
your sample
Summary
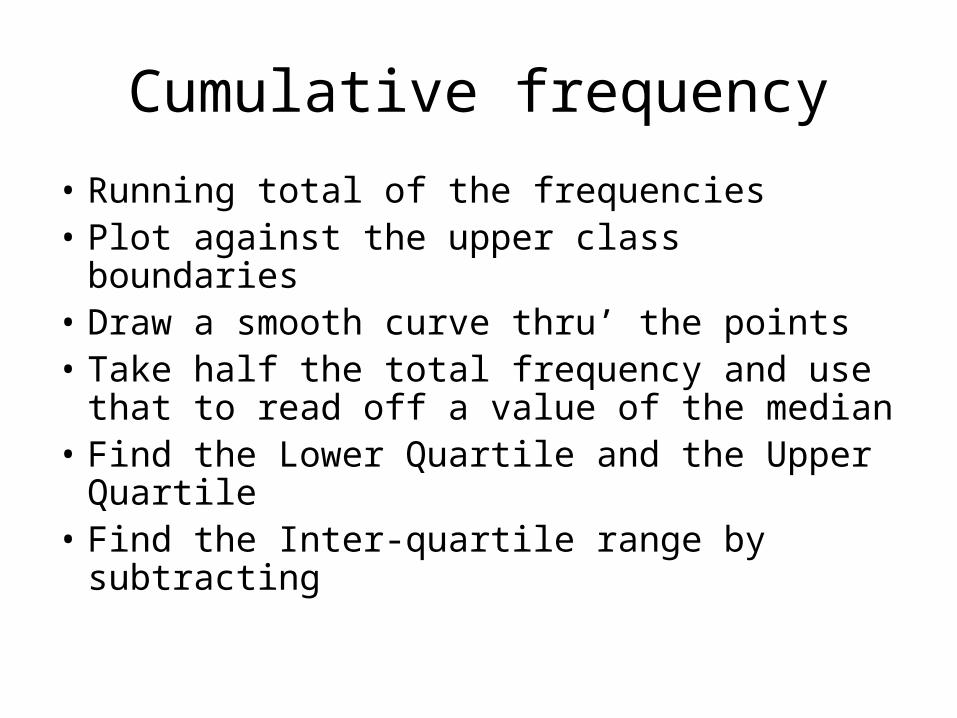
Cumulative frequency
• Running total of the frequencies• Plot against the upper class boundaries• Draw a smooth curve thru’ the points• Take half the total frequency and use
that to read off a value of the median• Find the Lower Quartile and the Upper
Quartile• Find the Inter-quartile range by
subtracting

Your turn