Embed Size (px)
Citation preview

České vysoké učení technické v Praze, Fakulta stavební
Czech Technical University in Prague, Faculty of Civil Engineering
Doc. Ing. Michal Polák, CSc.
Experimentální analýza dynamického chování stavebních konstrukcí
Experimental Analysis of Dynamic Behaviour of Building Structures
2
Summary
Building structures are usually unique. They differ one from another in
dimension, shape, construction systems, used materials or soil properties in bottom of
a footing. Therefore the questions of experimental examination of building structures
are generally based on individual approach to each of the tested structures. Every
structure, especially if the unique supporting system or new building material is used,
may cause unexpected static or dynamic problems during its design, construction or its
operation, which must finally be solved experimentally.
It is important to set every experiment in such a way so that obtained results will
be specific, meaningful and useful and not just purposeless. It is necessary to analyze
the expected static or dynamic behaviour of the structure in the experiment preparation
on the basis of theoretical analysis and practical experience. According to the analysis
results, it is important to identify decisive parameters of investigated structure, which
are suitable and useful to monitor experimentally, to select the appropriate set of
measurement equipment, to determine procedure of data acquisition and results
evaluation. Every experiment is loaded by an error and it is essential to quantify the
uncertainty of measurement results to interpret the data correctly.
A great number of experiments can be understood under the term experimental
analysis of dynamic behaviour of structures. For practical applications in the questions of
structural dynamics the characteristics of natural vibration of building structure (natural
frequencies, natural modes and damping) or parameters of forced vibration (when external
excitation forces affect the building structure) are usually measured. In this publication
several questions of building structures are described in which the dynamic experiments
are important or even essential. The presented dynamic experiments were solved during
the last ten years by the author and they are especially interesting in terms of results,
uniqueness of the tested structures or measurement system.
Prestressing force in suspenders and cables is an important parameter of the load
bearing structure. On the current structure, prestressing forces can be determined most
reliably by an experiment. The frequency method is one of often used experimental
techniques in which the measured natural frequencies are used. This method provides
results accurate enough if the suitable setting of experiment and method of evaluation
are designed. Characteristics of natural vibration of a structure determined by an
experiment describe their immediate dynamic behaviour. Therefore, they can be used
for verification and identification of mathematical models, especially if these models
are used for dynamic computations. Characteristic of natural vibration can be used also
for detection and localization of structural damage. Methods and procedures used for
determination of degradation degree of a structure are suitable to verify on simple
structural elements where the level of their damage is known. The study describes the
experimental analysis in which the influence of the intensive cyclic fatigue loading on
characteristics of natural vibration of the fully prestressed concrete slabs was observed.
The task of dynamic experiment is also important in cases when significant
dynamic loading acts on structure which causes an expressive transient vibration of the
structure and which has random character difficult to describe by analytical relations.
In this publication, questions of forced vibration of structures are documented on three
examples of important footbridges where dynamic experiment eminently contributed
to verification and ensuring their reliability and below it is documented on experiment
focused on long-time monitoring of the road bridge response caused by heavy traffic.
3
Souhrn
Stavební konstrukce jsou obvykle unikátní. Navzájem se liší svými rozměry,
tvary, konstrukčními systémy, použitým materiálem nebo uložením v základové spáře.
Proto je problematika experimentálního vyšetřování stavebních konstrukcí většinou
založena na individuálním přístupu ke každé zkoušené konstrukci. Každá konstrukce,
především pokud je použit originální nosný systém nebo nový materiál, může přinést
v průběhu návrhu, výstavby nebo jejího provozu neočekávané statické a dynamické
problémy, které musí být nakonec řešeny pomocí experimentálního zkoumání.
Je důležité každý experiment uspořádat tak, aby získané výsledky byly konkrétní,
smysluplné a prakticky využitelné a ne pouze samoúčelné. Proto je potřebné při
přípravě experimentu na základě teoretické analýzy a praktických zkušeností provést
rozbor očekávaného statického nebo dynamického chování konstrukce. Podle
výsledků rozboru určit rozhodující parametry vyšetřované konstrukce, které je vhodné
a účelné experimentálně sledovat, vybrat sestavu vhodných měřicích prostředků,
stanovit postup zpracování a hodnocení výsledků. Každý experiment je zatížen
chybou, pro správnou interpretaci získaných údajů je podstatné kvantifikovat nejistotu
výsledků měření.
Pod pojem experimentální analýza dynamického chování stavebních konstrukcí
lze zahrnout celou řadu experimentů. Při praktických aplikacích v úlohách stavební
dynamiky se obvykle zjišťují charakteristiky vlastního kmitání stavební konstrukce
(vlastní frekvence, vlastní tvary a útlum) nebo parametry vynuceného kmitání, při
kterém na stavební konstrukci působí vnější budící síly. V této práci je popsáno
několik problematik stavebních konstrukcí, ve kterých je role dynamických
experimentů důležitá až nezbytná. Uvedené dynamické experimenty byly autorem
řešeny v posledních deseti letech a jsou zajímavé zejména z hlediska získaných
výsledků, výjimečnosti zkoušených konstrukcí nebo originality uspořádání měření.
Předpínací síly v závěsech a kabelech jsou důležitým parametrem nosné
konstrukce stavby. Na stávající konstrukci lze předpínací síly stanovit nejspolehlivěji
pomocí experimentu. Jedním z používaných experimentálních postupů je frekvenční
metoda, ve které jsou využívány změřené vlastní frekvence. Tato metoda při vhodném
uspořádání experimentu a způsobu vyhodnocení poskytuje dostatečně přesné
výsledky. Změřené charakteristiky vlastního kmitání konstrukce popisují její okamžité
dynamické vlastnosti, proto je lze s výhodou využít pro verifikaci a identifikaci
matematických modelů. Zejména tehdy, pokud tyto modely mají být použity
k dynamickým výpočtům. Charakteristiky vlastního kmitání je možné využít také při
detekci a lokalizaci poškození konstrukce. Metody a postupy, které jsou používány ke
stanovení stupně degradace konstrukce, je vhodné verifikovat na jednoduchých
konstrukčních prvcích, u kterých je známá úroveň jejich poškození. V práci je popsána
experimentální studie, při které byl sledován vliv intenzivního cyklického únavového
namáhání na charakteristiky vlastního kmitání desek z plně předpjatého betonu.
Úloha dynamického experimentu je důležitá také v případech, kdy na stavební
konstrukci působí významné dynamické zatížení, které vyvolává výrazné přechodové
kmitání konstrukce a které má nahodilý charakter obtížně popsatelný analytickými
vztahy. Problematika vynuceného kmitání stavebních konstrukcí je v práci
dokumentována na třech příkladech významných lávek pro pěší, u kterých dynamický
experiment významně přispěl k ověření a zajištění jejich spolehlivosti, a na
experimentu zaměřeném na dlouhodobé monitorování odezvy silničního mostu na
účinky těžké nákladní dopravy.

4
Klíčová slova:
Experimentální analýza, dynamické chování, monitoring, vlastní frekvence, vlastní
tvar, tlumení, vynucené kmitání, stavební konstrukce, lávka pro pěší, most, verifikace
modelu, identifikace modelu, těžká nákladní doprava, únava.
Keywords:
Experimental analysis, dynamic behaviour, monitoring, natural frequency, natural
mode, damping, forced vibration, building structure, footbridge, bridge, model
verification, model identification, heavy traffic, fatigue.
5
CONTENTS
1 Introduction .............................................................................................................. 6
2 The experimental investigation of natural vibrations .............................................. 6
2.1 The identification of cable forces in the roof structure of the Administrative
Centre Amazon Court ....................................................................................... 6
2.1.1 Conclusions ....................................................................................... 10
2.2 The detection of fatigue damage of fully prestressed concrete slabs by using
of experimental modal analysis ...................................................................... 11
2.2.1 Description of the full prestressed slabs and the fatigue loading ...... 11
2.2.2 The natural vibration characteristics evaluation and comparison ..... 14
2.2.3 Conclusions ....................................................................................... 15
2.3 The verification and the identification of the bridge FEM models by using of
experimental modal analysis ........................................................................... 16
2.3.1 Description of the investigated bridge .............................................. 17
2.3.2 The natural vibration characteristics evaluation ............................... 17
2.3.3 The verification and the identification of the bridge FEM
models ............................................................................................... 18
2.3.4 Conclusions ....................................................................................... 20
3 The experimental investigation of the forced vibrations ....................................... 20
3.1 The dynamic behaviour of the steel cable-stayed footbridge ......................... 21
3.1.1 The 1st dynamic load test in situ ........................................................ 22
3.1.2 The 2nd
dynamic load test in situ ....................................................... 25
3.1.3 Conclusions ....................................................................................... 26
3.2 The dynamic behaviour of the footbridge across the „K Baranndovu“ street in
prague .......................................................................................................... 26
3.2.1 Conclusions ....................................................................................... 29
3.3 The dynamic behaviour of the footbridge across the Berounka river in Prague
- Radotín .......................................................................................................... 29
3.4 The long-time monitoring of the slab-on-girder bridge response caused by
heavy traffic .................................................................................................... 31
3.4.1 Conclusions ....................................................................................... 36
4 Final conclusions ................................................................................................... 36
References ..................................................................................................................... 37
6
1 INTRODUCTION
Hand in hand with the great development of computer technology in the last
three decades, the massive development of computational methods and programs
which make possible to solve extensive and complicated engineering problems have
occurred. Nowadays, computations enter into domains in which experiment still has
been dominating recently. The question is: “Has the experiment meaning at present
time?” The answer to above mentioned question is: “Yes, it has!” The experiment
investigates existing reality. Its role is important mainly for determination of material
properties, for investigation of static and dynamic parameters of current structures, for
observing quantity of climatic loading or for assessment of dynamic loading effects
with random character.
In this publication several problems of building structures are described in which
the role of dynamic experiments is important and necessary. Introduced dynamic
experiments were solved by author during the last ten years and they are especially
interesting in terms of results, uniqueness of the tested structures or originality of
measuring arrangement.
2 THE EXPERIMENTAL INVESTIGATION OF NATURAL VIBRATIONS
The characteristics of natural vibrations (natural frequencies, natural modes and
corresponding damping) are the natural properties of an investigated structure.
The experimentally obtained characteristics of natural vibrations of a structural
element or a structure describe its immediate dynamic characters affected only its
immediate stiffness, mass and structural setting.
2.1 THE IDENTIFICATION OF CABLE FORCES IN THE ROOF
STRUCTURE OF THE ADMINISTRATIVE CENTRE AMAZON
COURT
There are a number of building structures in service in Czech Republic at present
time where the main structural element is a cable or a suspender, for example: cable
roofs, cable-stayed bridges and bridges with external prestressing cables. Knowledge
of value of cable tension force is important for appreciation of reliability both during
their construction and their operation.
The three categories of experimental techniques are applied for monitoring of
cable forces in practice. One is the method that directly measures the cable forces by
pre-installed load cell, the second is the magnetoelastic method and the third is the
vibration frequency method that indirectly evaluates the cable tension force using the
measured natural frequencies. The vibration frequency method is often used in practice
(e.g. [9]) because it provides an efficient, cheap and relatively easy way to determine
the cable forces and a standard measuring line for dynamic experiments can be used.
The typical procedures of the vibration frequency methods are as follows. At
first, the excitation of cable vibrations is carried out for example by the help of an
impact hammer or ambient sources such as wind and technical seismicity. Secondly,
the time waveform of cable free vibration is measured. Next, several lowest natural
frequencies are extracted from the measured data by the help of Fast Fourier
Transform (FFT) and various modal analysis techniques. Finally, the cable tension
7
forces are determined by using an appropriate relationship between natural frequencies
and cable tension forces.
The relationship between frequencies and cable tension forces that will be used
during results evaluation of an experiment is dependent on parameters of examined
cables and on theoretical presumption of the bending stiffness and the boundary
conditions of the cable supporting.
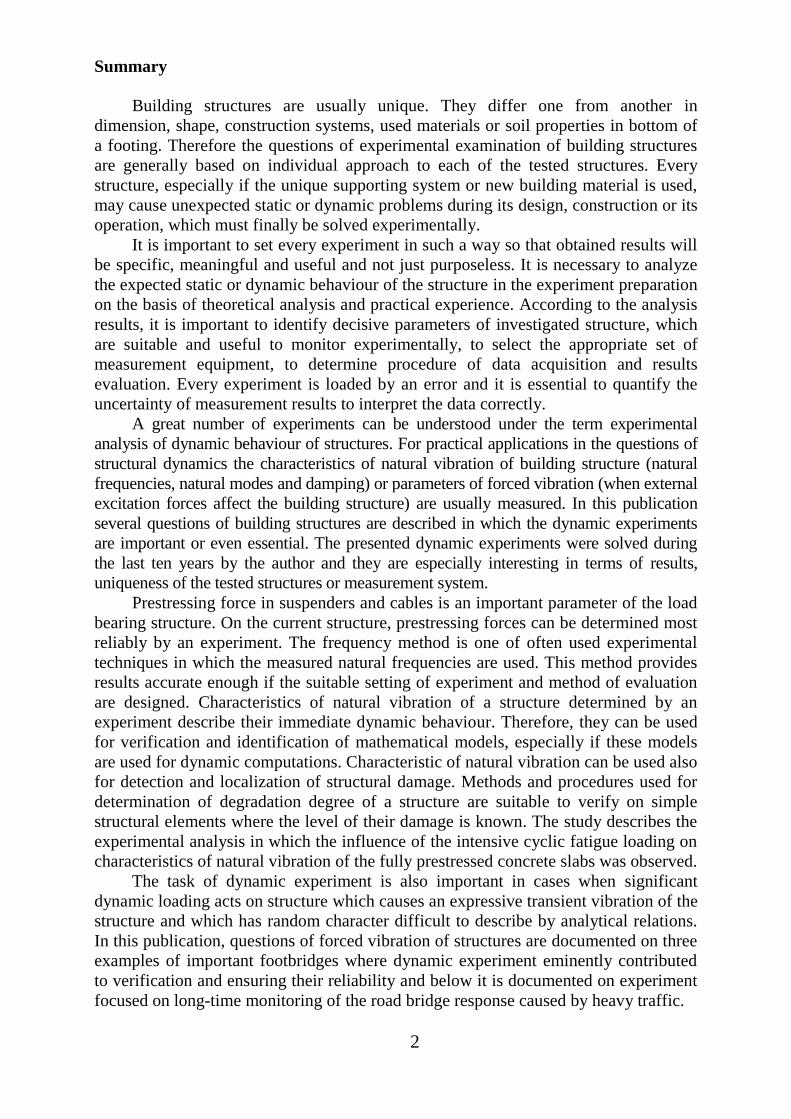
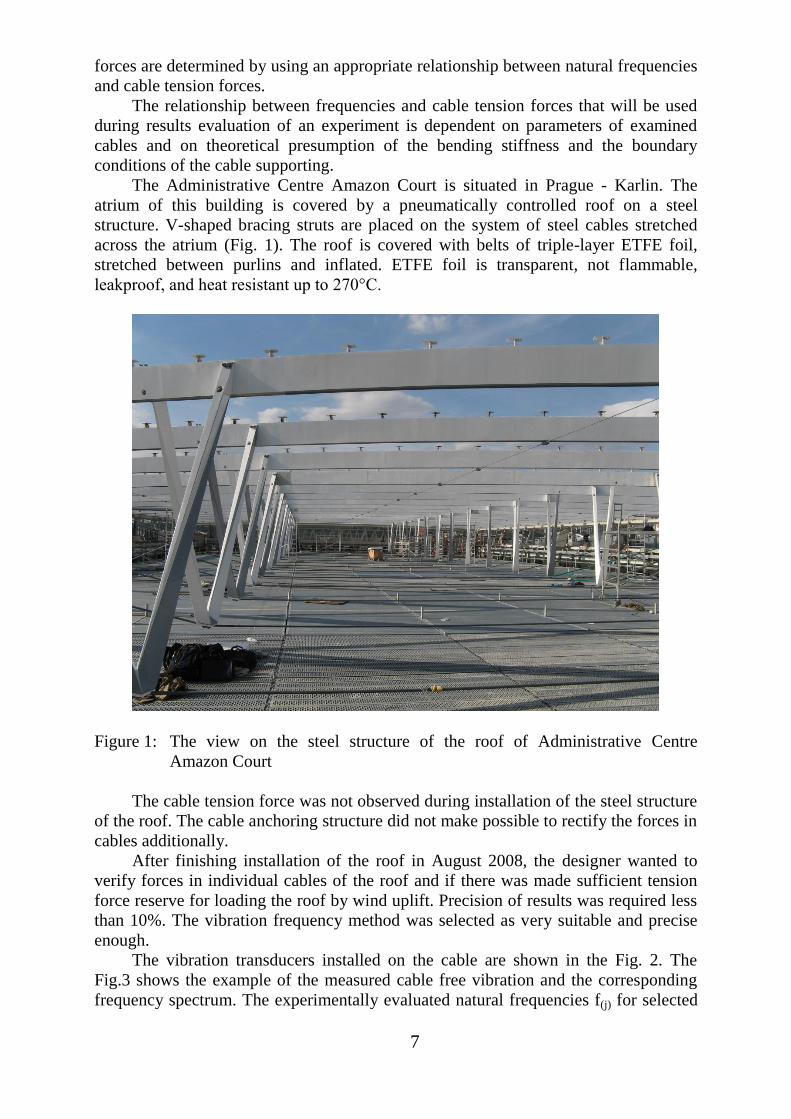
The Administrative Centre Amazon Court is situated in Prague - Karlin. The
atrium of this building is covered by a pneumatically controlled roof on a steel
structure. V-shaped bracing struts are placed on the system of steel cables stretched
across the atrium (Fig. 1). The roof is covered with belts of triple-layer ETFE foil,
stretched between purlins and inflated. ETFE foil is transparent, not flammable,
leakproof, and heat resistant up to 270°C.
Figure 1: The view on the steel structure of the roof of Administrative Centre
Amazon Court
The cable tension force was not observed during installation of the steel structure
of the roof. The cable anchoring structure did not make possible to rectify the forces in
cables additionally.
After finishing installation of the roof in August 2008, the designer wanted to
verify forces in individual cables of the roof and if there was made sufficient tension
force reserve for loading the roof by wind uplift. Precision of results was required less
than 10%. The vibration frequency method was selected as very suitable and precise
enough.
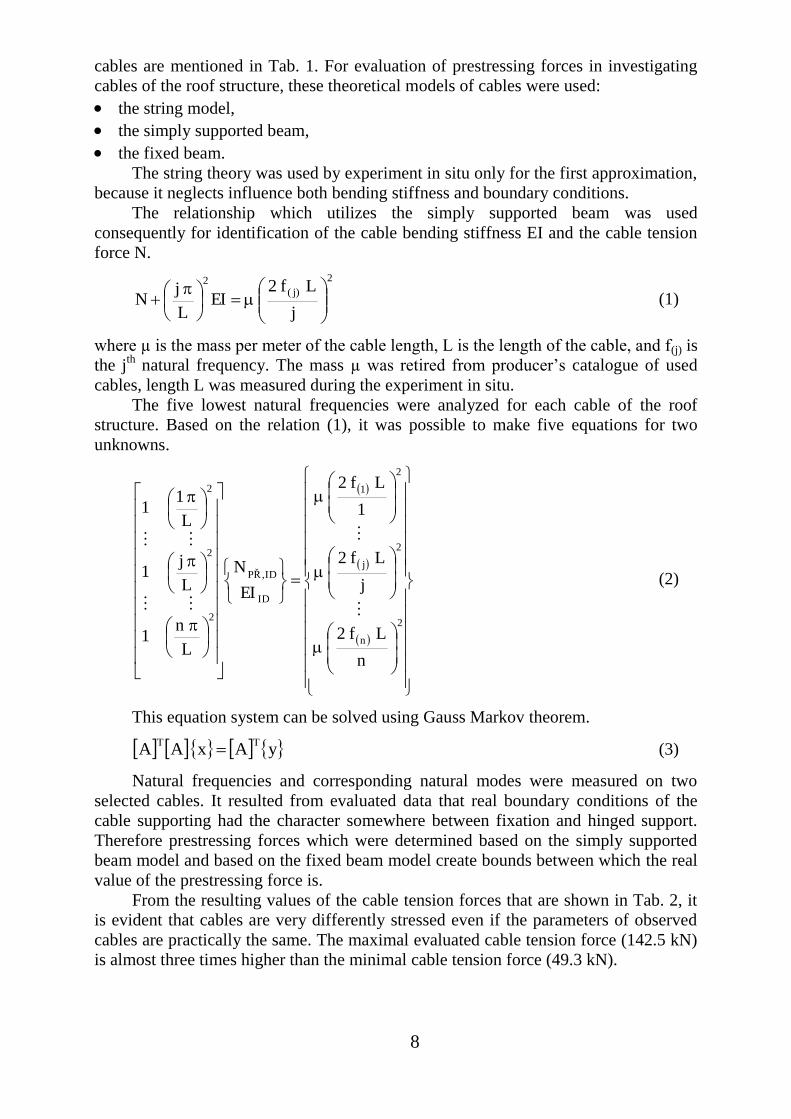
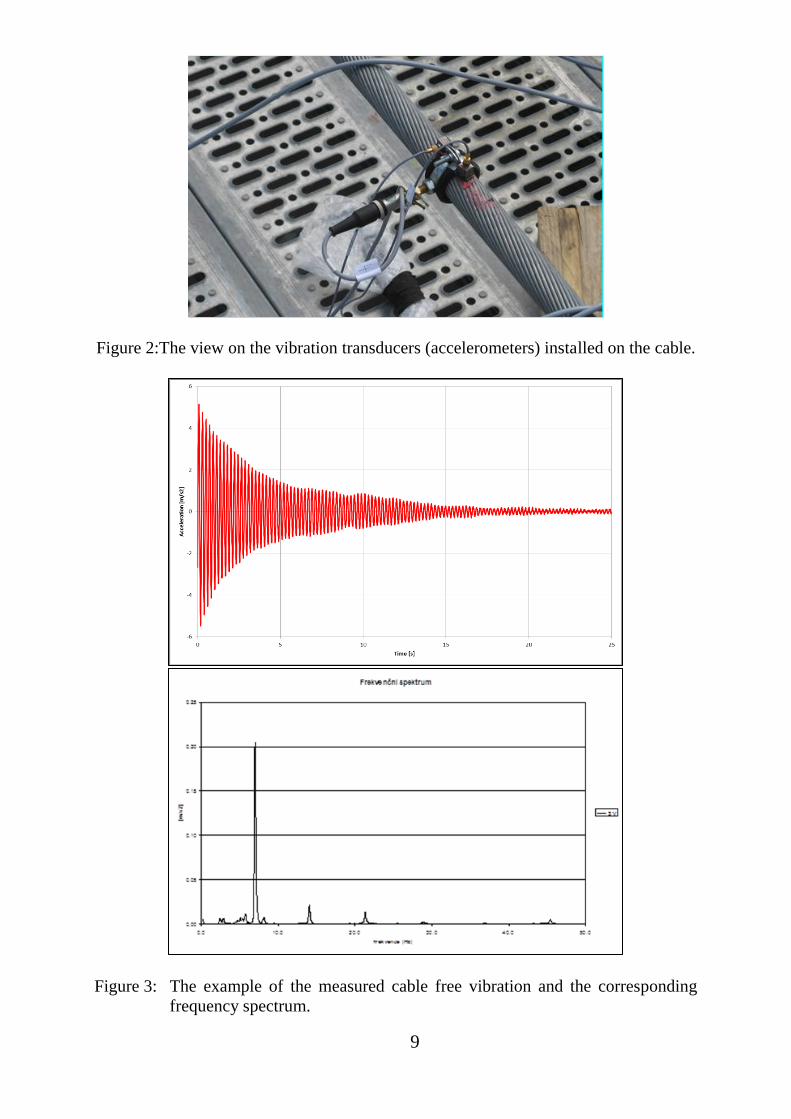
The vibration transducers installed on the cable are shown in the Fig. 2. The
Fig.3 shows the example of the measured cable free vibration and the corresponding
frequency spectrum. The experimentally evaluated natural frequencies f(j) for selected
8
cables are mentioned in Tab. 1. For evaluation of prestressing forces in investigating
cables of the roof structure, these theoretical models of cables were used:
the string model,
the simply supported beam,
the fixed beam.
The string theory was used by experiment in situ only for the first approximation,
because it neglects influence both bending stiffness and boundary conditions.
The relationship which utilizes the simply supported beam was used
consequently for identification of the cable bending stiffness EI and the cable tension
force N.
2
)j(2
j
Lf2EI
L
jN
(1)
where µ is the mass per meter of the cable length, L is the length of the cable, and f(j) is
the jth
natural frequency. The mass µ was retired from producer’s catalogue of used
cables, length L was measured during the experiment in situ.
The five lowest natural frequencies were analyzed for each cable of the roof
structure. Based on the relation (1), it was possible to make five equations for two
unknowns.
2
n
2
j
2
1
ID
ID,PŘ
2
2
2
n
Lf2
j
Lf2
1
Lf2
EI
N
L
n1
L
j1
L
11
(2)
This equation system can be solved using Gauss Markov theorem.
yAxAATT
(3)
Natural frequencies and corresponding natural modes were measured on two
selected cables. It resulted from evaluated data that real boundary conditions of the
cable supporting had the character somewhere between fixation and hinged support.
Therefore prestressing forces which were determined based on the simply supported
beam model and based on the fixed beam model create bounds between which the real
value of the prestressing force is.
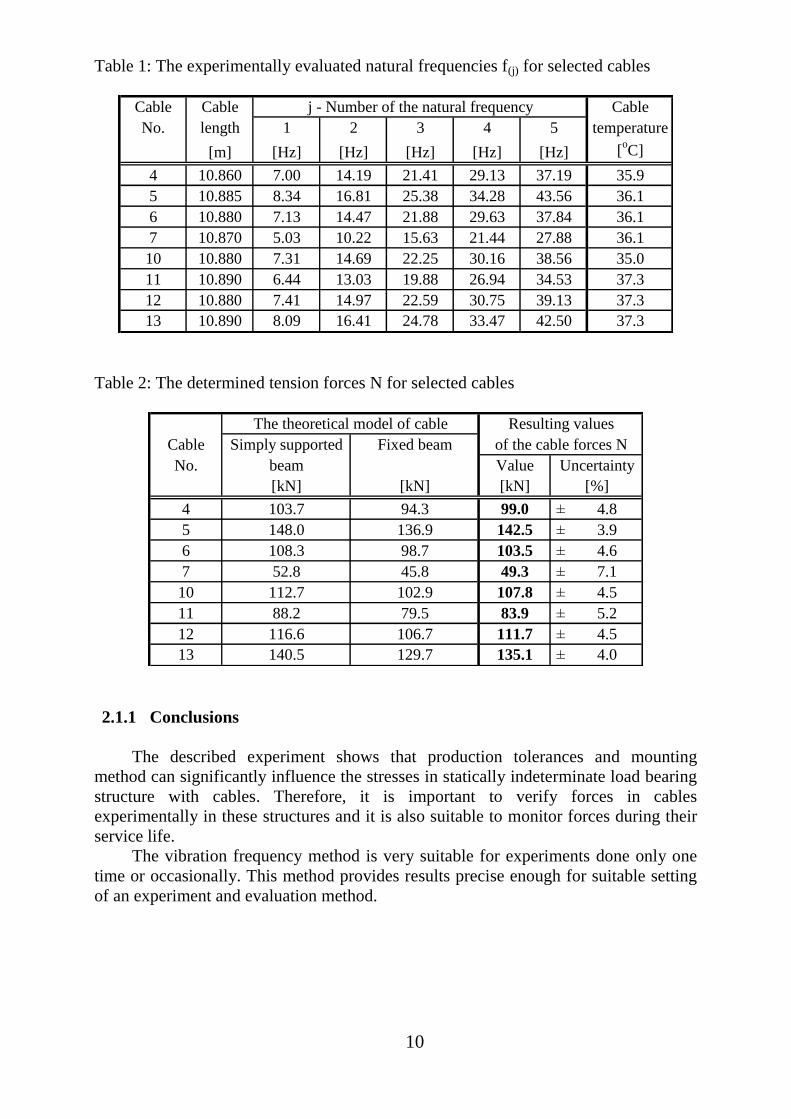
From the resulting values of the cable tension forces that are shown in Tab. 2, it
is evident that cables are very differently stressed even if the parameters of observed
cables are practically the same. The maximal evaluated cable tension force (142.5 kN)
is almost three times higher than the minimal cable tension force (49.3 kN).
9
Figure 2:The view on the vibration transducers (accelerometers) installed on the cable.
Figure 3: The example of the measured cable free vibration and the corresponding
frequency spectrum.
10
Table 1: The experimentally evaluated natural frequencies f(j) for selected cables
Cable Cable Cable
No. length 1 2 3 4 5 temperature
[m] [Hz] [Hz] [Hz] [Hz] [Hz] [oC]
4 10.860 7.00 14.19 21.41 29.13 37.19 35.9
5 10.885 8.34 16.81 25.38 34.28 43.56 36.1
6 10.880 7.13 14.47 21.88 29.63 37.84 36.1
7 10.870 5.03 10.22 15.63 21.44 27.88 36.1
10 10.880 7.31 14.69 22.25 30.16 38.56 35.0
11 10.890 6.44 13.03 19.88 26.94 34.53 37.3
12 10.880 7.41 14.97 22.59 30.75 39.13 37.3
13 10.890 8.09 16.41 24.78 33.47 42.50 37.3
j - Number of the natural frequency
Table 2: The determined tension forces N for selected cables
Cable Simply supported Fixed beam
No. beam Value
[kN] [kN] [kN]
4 103.7 94.3 99.0 ± 4.8
5 148.0 136.9 142.5 ± 3.9
6 108.3 98.7 103.5 ± 4.6
7 52.8 45.8 49.3 ± 7.1
10 112.7 102.9 107.8 ± 4.5
11 88.2 79.5 83.9 ± 5.2
12 116.6 106.7 111.7 ± 4.5
13 140.5 129.7 135.1 ± 4.0
The theoretical model of cable
Uncertainty
[%]
of the cable forces N
Resulting values
2.1.1 Conclusions
The described experiment shows that production tolerances and mounting
method can significantly influence the stresses in statically indeterminate load bearing
structure with cables. Therefore, it is important to verify forces in cables
experimentally in these structures and it is also suitable to monitor forces during their
service life.
The vibration frequency method is very suitable for experiments done only one
time or occasionally. This method provides results precise enough for suitable setting
of an experiment and evaluation method.
11
2.2 THE DETECTION OF FATIGUE DAMAGE OF FULLY
PRESTRESSED CONCRETE SLABS BY USING OF EXPERIMENTAL
MODAL ANALYSIS
During last two decades traffic speed has increased, the number of vehicles has
rapidly increased and they are much heavier. At the same time, new higher strength
building materials are used and new structures are constructed more slender. This is
why dynamic forces and fatigue loads caused problems on bridge structures.
Determining the rate of degradation for existing building structures especially bridges
has become important technical and also economic problem today.
New methods for monitoring of structure conditions and damage detection of a
structure at the earliest possible stage are needed. Characteristics of natural vibration
determined by an experiment (natural frequencies, natural modes and corresponding
damping) describe its dynamic characters during implementation of the experiment.
Therefore they can be used for detection and damage localization of a structure. The
advantage of methods using results of an experimental modal analysis for estimation
of a degradation degree of a structure is that they can be applied to complex structures.
Experimental methods and procedures used for determination of degradation
degree of building structure are suitable to verify on simple structural elements where
their damage state is known (e.g. [1], [4] and [6]).
Experimental study described in this chapter follows two similar long-term
experiments that were focused on fatigue damage detection on reinforced concrete
elements. The first test was carried out on the three reinforced concrete beams with
rectangular cross section and the second test on four reinforced concrete slabs (e.g.
[8]).
The cracks arose on reinforced concrete elements. They clearly influenced
characteristics of natural vibration and they were seen with the naked eye already
during the static loading, which had been considerably less than used dynamic fatigue
load. So for next experiment, elements from fully prestressed concrete in which the
cracks would not arise theoretically were used.
The objective of the experimental study described in this chapter was to
investigate the influence of high intensity fatigue loading on the change of the modal
characteristics of two fully prestressed concrete slabs (e.g. [11]).
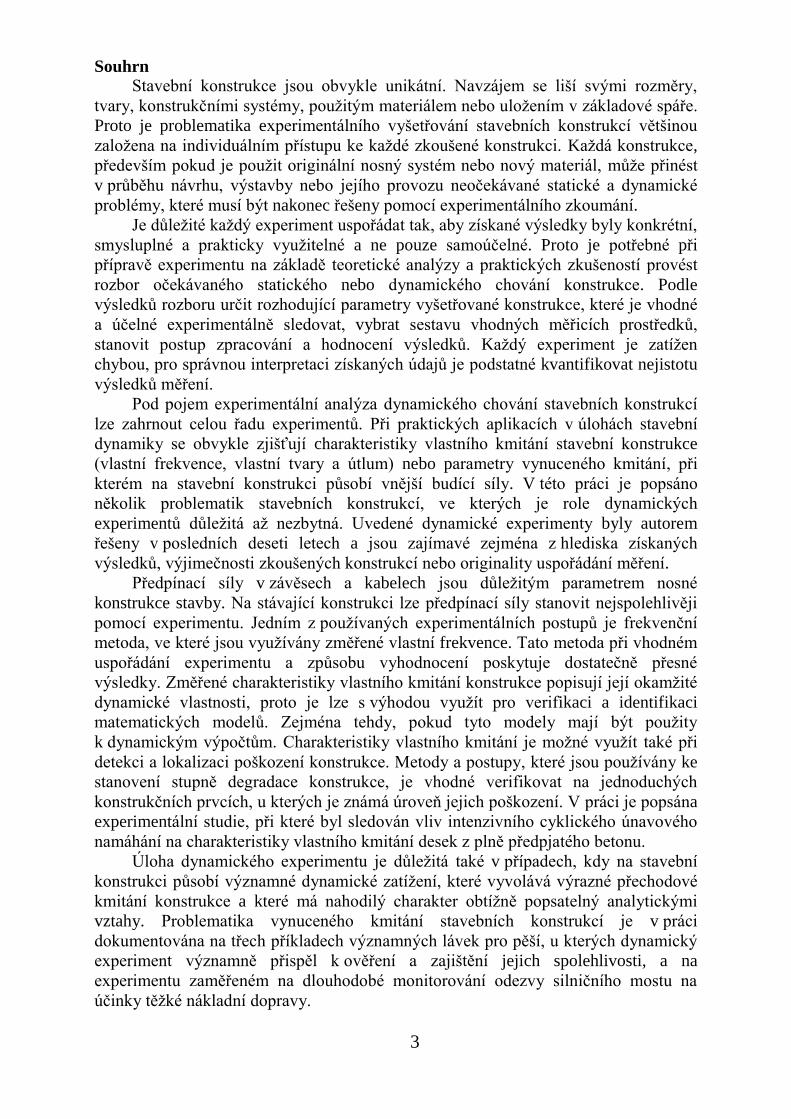
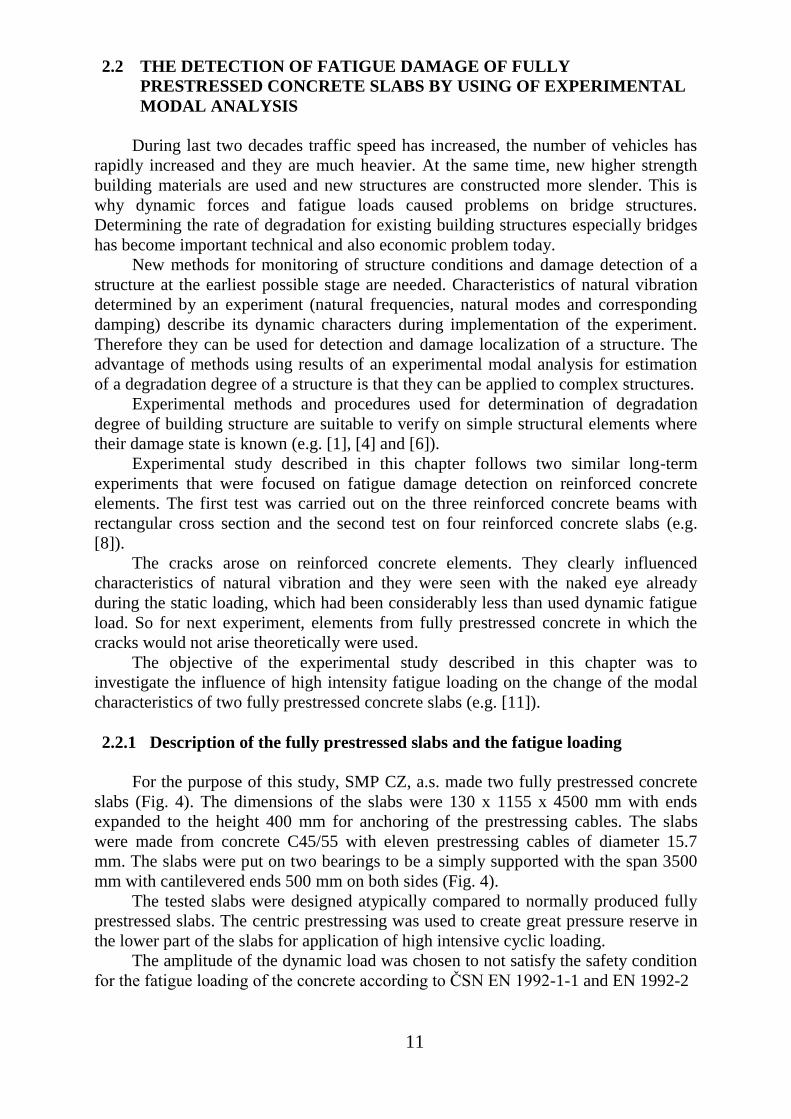
2.2.1 Description of the fully prestressed slabs and the fatigue loading
For the purpose of this study, SMP CZ, a.s. made two fully prestressed concrete
slabs (Fig. 4). The dimensions of the slabs were 130 x 1155 x 4500 mm with ends
expanded to the height 400 mm for anchoring of the prestressing cables. The slabs
were made from concrete C45/55 with eleven prestressing cables of diameter 15.7
mm. The slabs were put on two bearings to be a simply supported with the span 3500
mm with cantilevered ends 500 mm on both sides (Fig. 4).
The tested slabs were designed atypically compared to normally produced fully
prestressed slabs. The centric prestressing was used to create great pressure reserve in
the lower part of the slabs for application of high intensive cyclic loading.
The amplitude of the dynamic load was chosen to not satisfy the safety condition
for the fatigue loading of the concrete according to ČSN EN 1992-1-1 and EN 1992-2
12
Figure 4: The view on the slabs concreting and the position of the slab in the loading
stand.
9.0f
45.05.0f fat,cd
min,c
fat,cd
max,c
(4)
where c,max is the maximal compressive stress, c,max is the minimal compressive
stress and fcd,fat is the design compressive strength of the concrete.
A rate of loading cycles that theoretically causes fatigue failure was determined
by the relation mentioned in EN 1992-2 and [12]
i
imax,,cd
iR1
E114exp10N (5)
13
imax,,cd
imin,,cd
iE
ER ;
fat,cd
imin,,c
imin,,cdf
E
; fat,cd
imax,,c
imax,,cdf
E
(6)
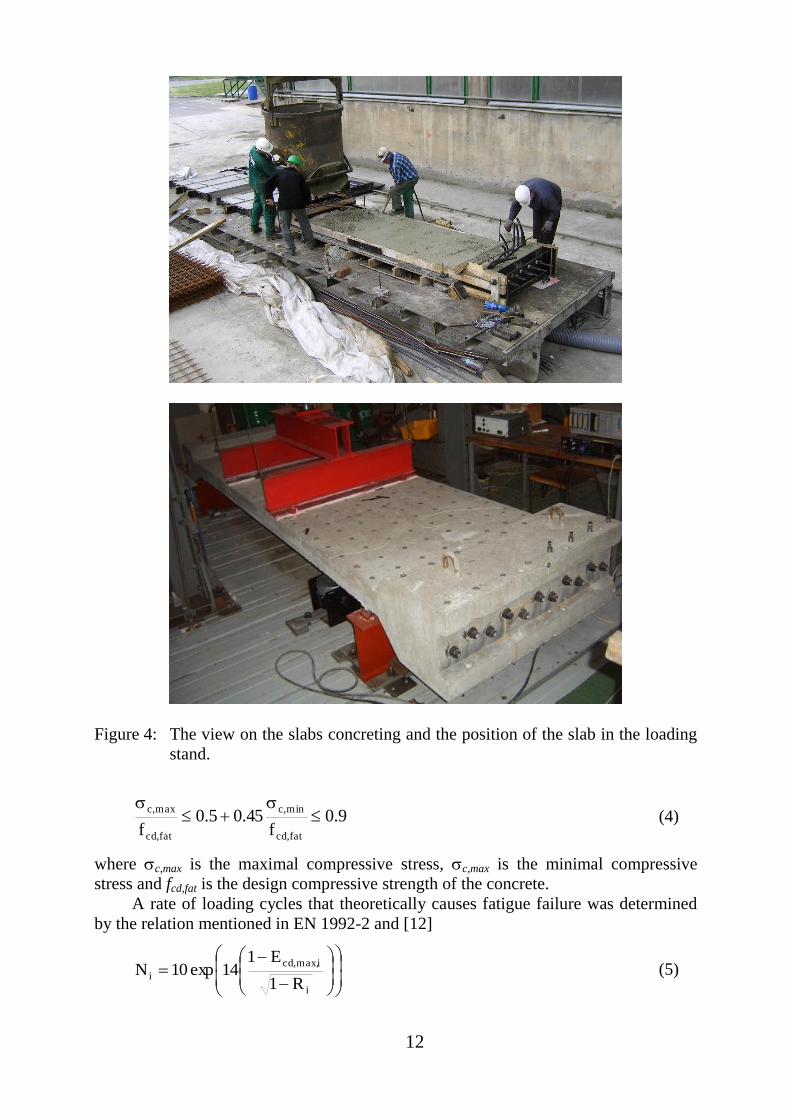
Total number of cycles that cause fatigue failure was theoretically determined to
2 240 000 cycles.
Figure 5: The example of the FRF in the point No.85 in the state of the slab No. 1
after 3 500 000 cycles.
Table 3: The changes of the selected natural frequencies of the slab No. 1
State State description f(1) Δf(1) f(2) [Hz] Δf(1) f(3) [Hz] Δf(1)
[Hz] [%] [%] [%]
A Virgin state 20.06 - 55.24 - 98.07 -
F State after 625 000 cycles 20.06 0.0 55.01 -0.4 97.88 -0.2
Q State after 3 500 000 cycles 19.55 -2.6 55.09 -0.3 98.24 0.2
Figure 6: The 1st, the 2
nd and the 3
rd natural mode shapes of the slab No. 2 (f(1)=19.3
Hz, f(2)=53.9 Hz, f(3)=97.1 Hz) in virgin state.
1 2 3 4 5 6 7 8 9 10 11 12 13 14 15 16 17 18 19 20 21 22 23 24 25 26 27
1
5
-0.1
0
0.1
1 2 3 4 5 6 7 8 9 10 11 12 13 14 15 16 17 18 19 20 21 22 23 24 25 26 27
1
5
-0.1
0
0.1
1 2 3 4 5 6 7 8 9 10 11 12 13 14 15 16 17 18 19 20 21 22 23 24 25 26 27
1
5
-0.1
0
0.1
14
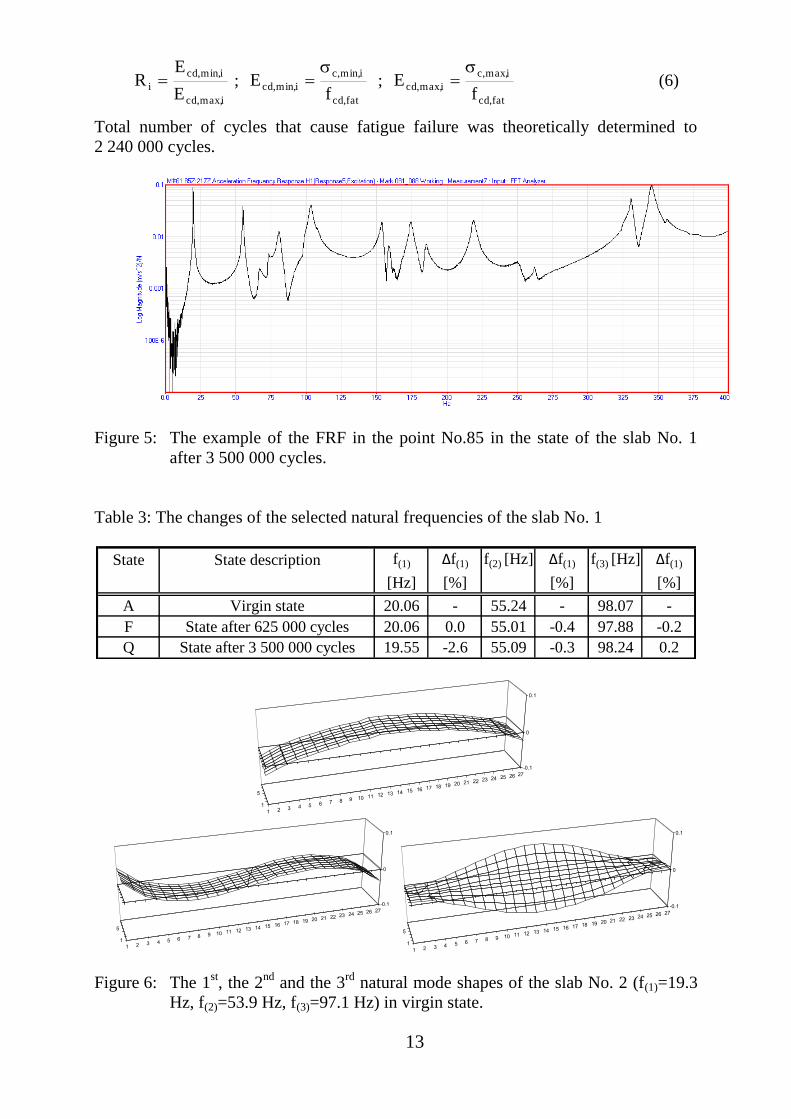
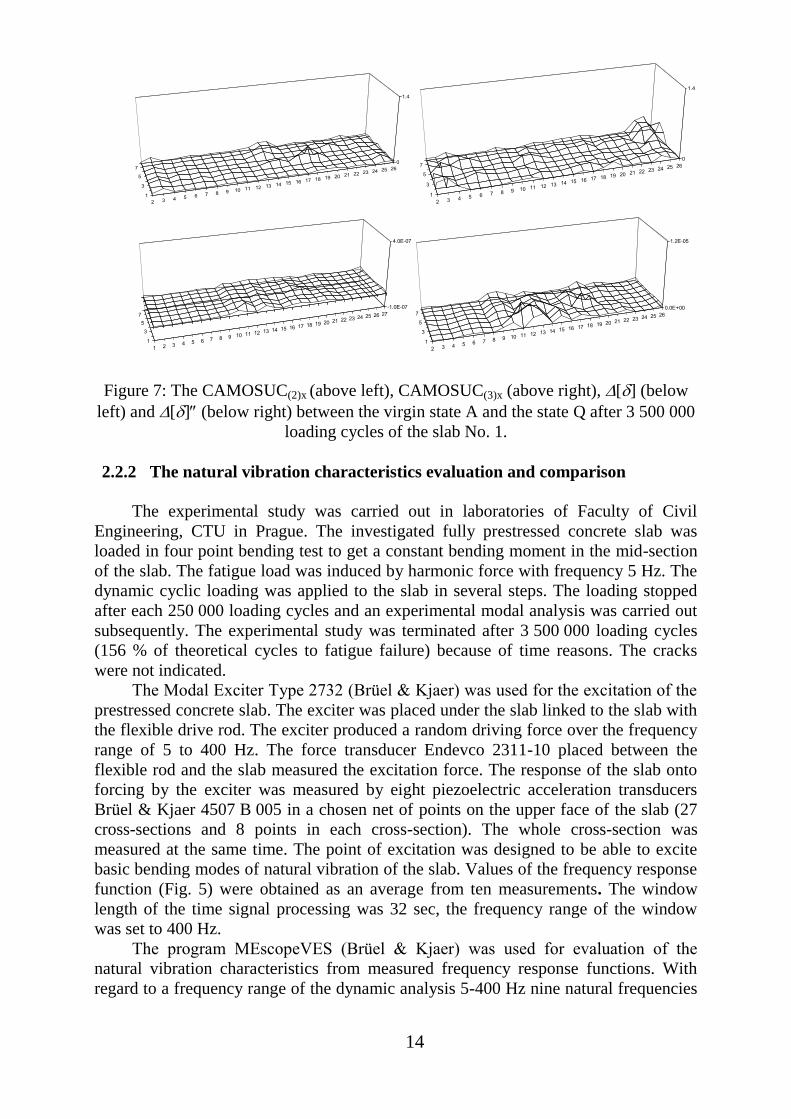
Figure 7: The CAMOSUC(2)x (above left), CAMOSUC(3)x (above right), [] (below
left) and [] (below right) between the virgin state A and the state Q after 3 500 000
loading cycles of the slab No. 1.
2.2.2 The natural vibration characteristics evaluation and comparison
The experimental study was carried out in laboratories of Faculty of Civil
Engineering, CTU in Prague. The investigated fully prestressed concrete slab was
loaded in four point bending test to get a constant bending moment in the mid-section
of the slab. The fatigue load was induced by harmonic force with frequency 5 Hz. The
dynamic cyclic loading was applied to the slab in several steps. The loading stopped
after each 250 000 loading cycles and an experimental modal analysis was carried out
subsequently. The experimental study was terminated after 3 500 000 loading cycles
(156 % of theoretical cycles to fatigue failure) because of time reasons. The cracks
were not indicated.
The Modal Exciter Type 2732 (Brüel & Kjaer) was used for the excitation of the
prestressed concrete slab. The exciter was placed under the slab linked to the slab with
the flexible drive rod. The exciter produced a random driving force over the frequency
range of 5 to 400 Hz. The force transducer Endevco 2311-10 placed between the
flexible rod and the slab measured the excitation force. The response of the slab onto
forcing by the exciter was measured by eight piezoelectric acceleration transducers
Brüel & Kjaer 4507 B 005 in a chosen net of points on the upper face of the slab (27
cross-sections and 8 points in each cross-section). The whole cross-section was
measured at the same time. The point of excitation was designed to be able to excite
basic bending modes of natural vibration of the slab. Values of the frequency response
function (Fig. 5) were obtained as an average from ten measurements. The window
length of the time signal processing was 32 sec, the frequency range of the window
was set to 400 Hz.
The program MEscopeVES (Brüel & Kjaer) was used for evaluation of the
natural vibration characteristics from measured frequency response functions. With
regard to a frequency range of the dynamic analysis 5-400 Hz nine natural frequencies
2 3 4 5 6 7 8 9 10 11 12 13 14 15 16 17 18 19 20 21 22 23 24 25 26
1
3
5
70
1.4
2 3 4 5 6 7 8 9 10 11 12 13 14 15 16 17 18 19 20 21 22 23 24 25 26
1
3
5
70
1.4
1 2 3 4 5 6 7 8 9 10 11 12 13 14 15 16 1718 19 20
21 22 2324 25 26
27
1
3
5
7
-1.0E-07
4.0E-07
2 3 4 5 6 7 8 9 10 11 12 13 14 15 16 17 18 19 20 21 22 23 24 25 26
1
3
5
70.0E+00
1.2E-05
15
and mode shapes were evaluated. Examples of the natural mode shapes evaluated in a
virgin state of the prestressed slab No. 2 are shown in Fig. 6.
Modal characteristics of the slab, which were measured after each load step, were
mutually compared. Changes of the natural frequencies f(j) of the slab were computed
at first. Next three methods (changes of a mode surface curvature CAMOSUC(j),x [4],
changes of a modal flexibility matrix [] and the second derivative of changes of
diagonal members of a modal flexibility matrix []) were used for the comparison of
natural modes.
The changes of a mode surface curvature CAMOSUC(j),x were calculated
according to relation
2
1x,YY)j(x,YY)j(1x,YY)j(
2
1x,XX)j(x,XX)j(1x,XX)j(
(j),xh
rr2r
h
rr2rCAMOSUC
(7)
where r(j),XX,x is the value of the j-th natural mode shape in the x-th measured
point in one damage (or virgin) state XX of the slab, r(j),YY,x is the value of the j-th
natural mode shape in the x-th measured point in another damage state YY of the slab
and h is the dimension of the net of measured points.
The modal flexibility matrix [] was evaluated from equation (e.g. [1], [2])
j2jj R1/ωRδ (8)
where [R(j)] is the modal matrix composed of n measured natural modes and [1/2
(j)] is
the diagonal matrix composed of natural angular frequencies (j) .
The second derivative of changes of diagonal members of a modal flexibility
matrix [] were calculated according to relation
2
1x,rx,r1x,r
rh
2 (9)
where r,x is the change of the diagonal member r of the modal flexibility matrix and
h is the distance of the net of measured points.
The examples of the evaluated changes of the slab No. 1 between virgin state and
state after 3 500 000 cycles are shown in Tab. 3 and Fig. 7, some small changes can be
seen in the middle part of the slab.
2.2.3 Conclusions
The influence of high intensity fatigue loading on the change of the natural
vibration characteristics of two fully prestressed concrete slabs was investigated. The
changes of natural frequencies (Tab.3) and natural modes (Fig. 7) evaluated during the
experimental study were very small. These changes in dynamic behaviour are not
significant even substantially after the end of theoretical fatigue lifetime.
The evaluated levels of changes of the natural vibration characteristics are hardly
detectable on a real building structure from fully prestressed concrete in situ.
16
2.3 THE VERIFICATION AND THE IDENTIFICATION OF THE BRIDGE
FEM MODELS BY USING OF EXPERIMENTAL MODAL ANALYSIS
The designer creates a mathematical model of a building structure on specific
physical and mathematical conditions. So it is possible to create for one specific
structure a number of mathematical models in terms of individual access of the
designer. Mathematical models are possible to verify or identify on the basis of
experimentally obtained results. Acquired experiences can be used consequently for
modelling similar structures.
The term ‘model verification’ means check on appositeness of the mathematical
model in terms of comparing between the calculation and experimental results. The
model identification is determination of mathematical model parameters by using of
results of an experiment so that a maximal consensus between calculated and
measured data was achieved (e.g. [3]).
The experimentally obtained characteristics of natural vibration of a structure
describe their immediate dynamic behaviour. Therefore, they can be used for
verification and identification of mathematical models of new constructed or current
structures especially, if these models are used for dynamic computations.
Several studies of dynamic behaviour of road bridges were done in the Czech
Republic. This chapter describes results of an experimental and theoretical study of
dynamic behaviour of the road bridge (e.g. [10]). An experimental modal analysis was
carried out on this bridge as a basis for verification and for identification of the bridge
FEM models.
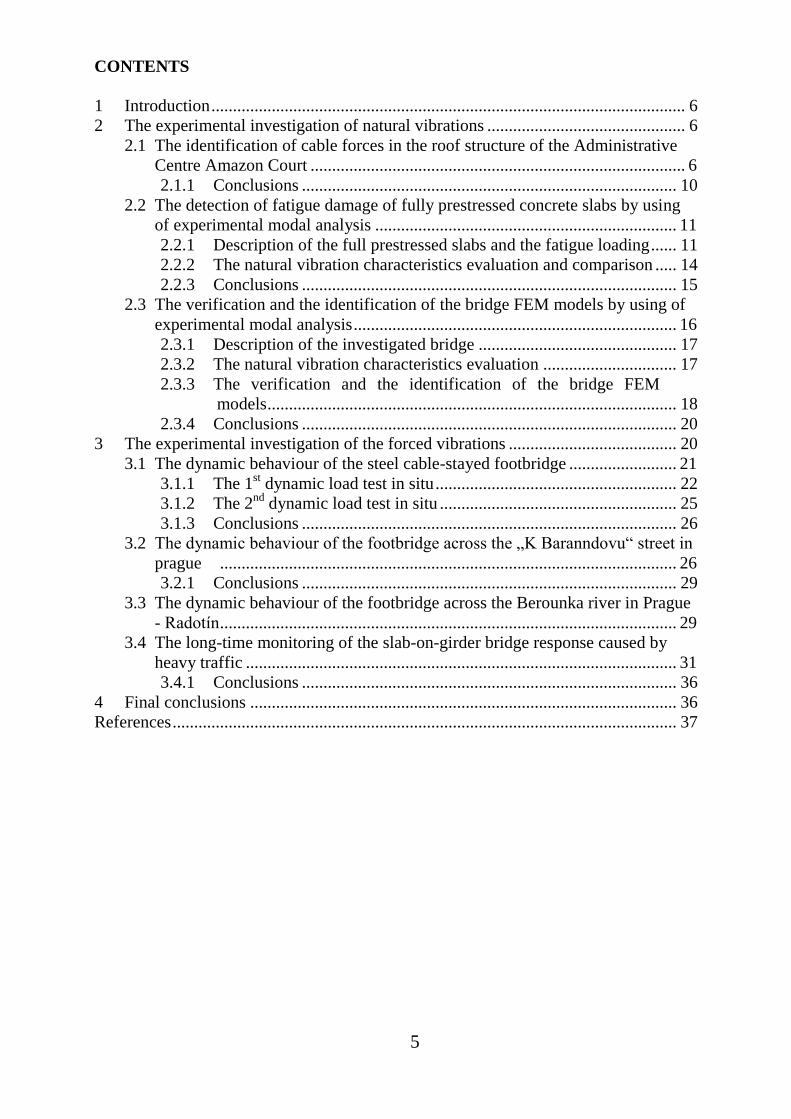
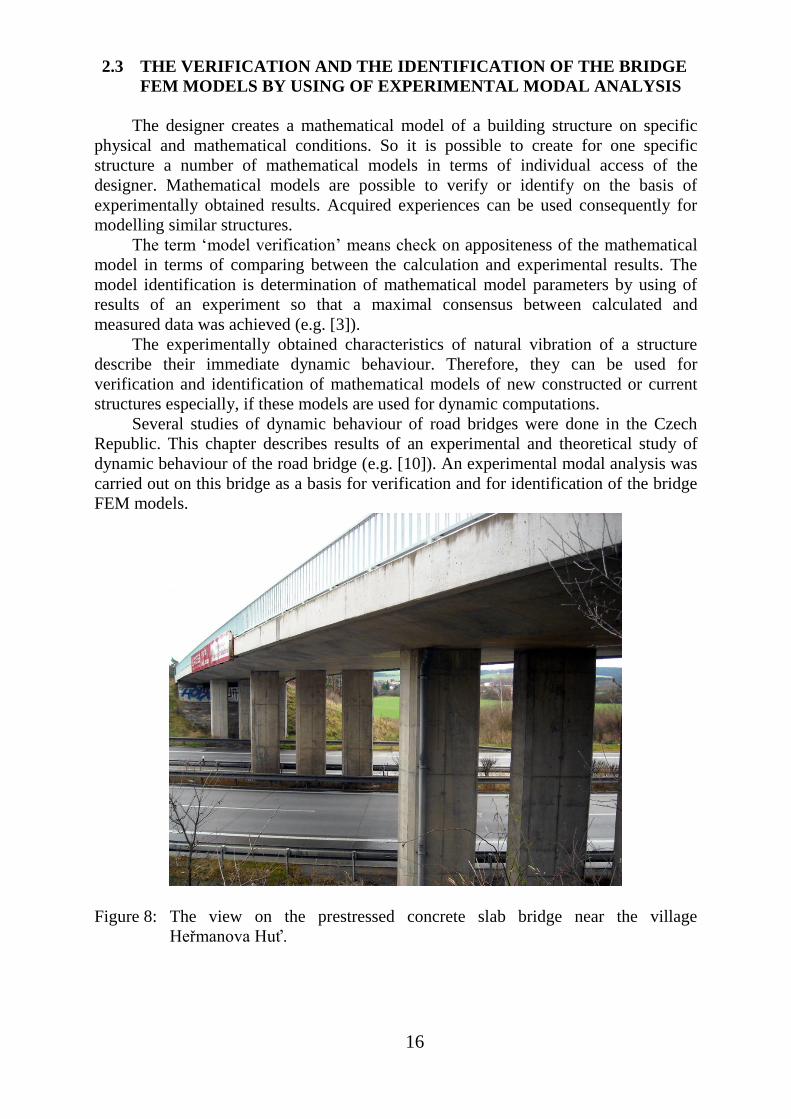
Figure 8: The view on the prestressed concrete slab bridge near the village
Heřmanova Huť.
17
2.3.1 Description of the investigated bridge
The investigated slab bridge (Fig. 8) made of prestressed concrete is situated
across the highway D5 near the village Heřmanova Huť in the Czech Republic. It is a
four span continuous bridge (14.0m + 18.5m + 18.5m +14.0m). The bearing structure
of this bridge is a prestressed concrete slab of the width 9.8 m. The thickness of slab
along the cross-section is 0.825 m in the mid-section 5.9 m long and 0.257 m at the
ends of the cross-section. The change of the thickness is linear. It is a skew bridge with
the angle 60.1963 deg.
2.3.2 The natural vibration characteristics evaluation
Experimental modal analysis (e.g. [2]) was carried out on this bridge. The
electrodynamic shaker TIRAVIB 5140 was used for excitation of the bridge. The
excitation force was measured by three force transducers S-35 LUKAS, which were
interconnected to measure directly the whole driving force. The response of the bridge
was measured by ten inductive accelerometers B12/200 HBM. Vibration control
system 2550B Spectral Dynamics with control computer Sun was used for data
acquisition and data analysis. The bridge was excited by random driving force of white
type noise of the frequency range from 0 to 20 Hz. The driving force was controlled by
signal generator SG 450 ONO SOKKI.
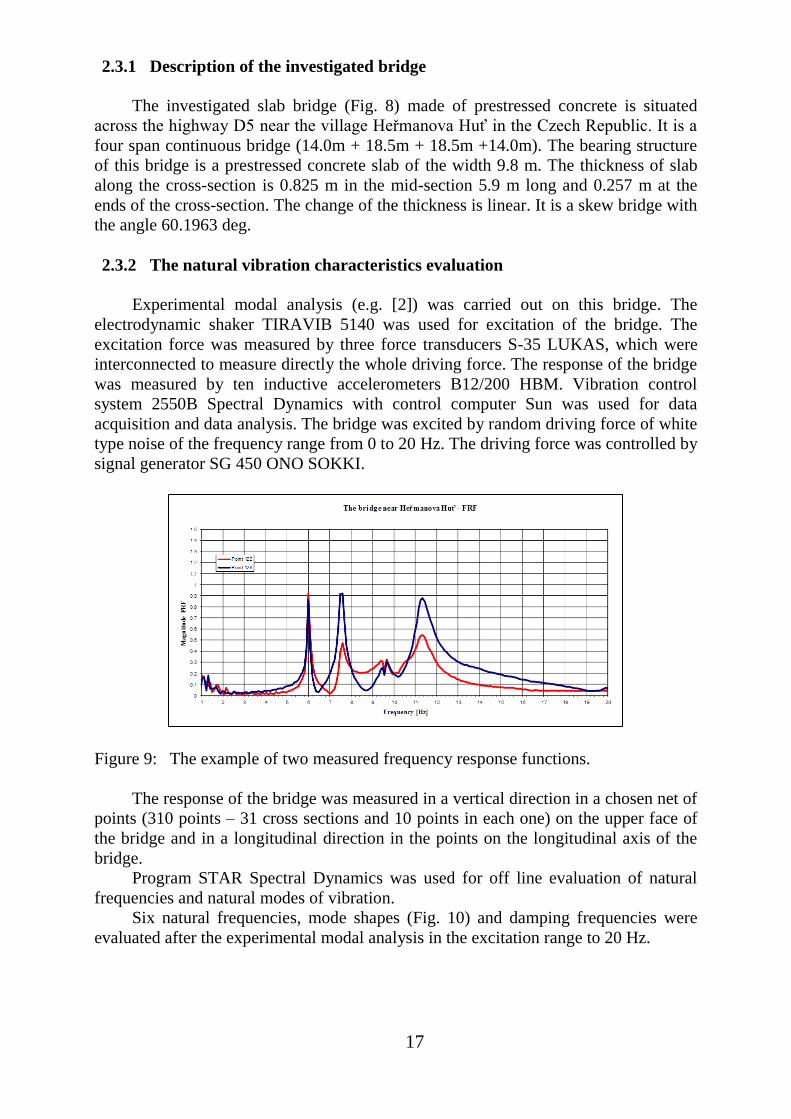
Figure 9: The example of two measured frequency response functions.
The response of the bridge was measured in a vertical direction in a chosen net of
points (310 points – 31 cross sections and 10 points in each one) on the upper face of
the bridge and in a longitudinal direction in the points on the longitudinal axis of the
bridge.
Program STAR Spectral Dynamics was used for off line evaluation of natural
frequencies and natural modes of vibration.
Six natural frequencies, mode shapes (Fig. 10) and damping frequencies were
evaluated after the experimental modal analysis in the excitation range to 20 Hz.
18
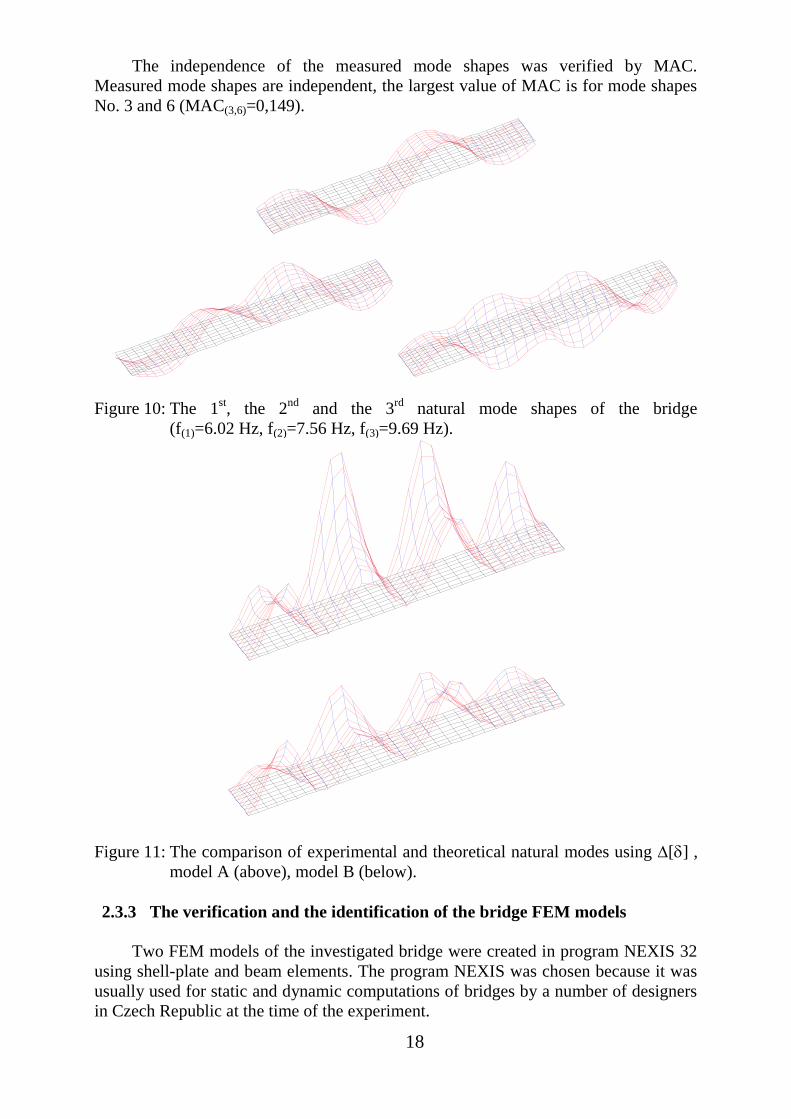
The independence of the measured mode shapes was verified by MAC.
Measured mode shapes are independent, the largest value of MAC is for mode shapes
No. 3 and 6 (MAC(3,6)=0,149).
Figure 10: The 1st, the 2
nd and the 3
rd natural mode shapes of the bridge
(f(1)=6.02 Hz, f(2)=7.56 Hz, f(3)=9.69 Hz).
Figure 11: The comparison of experimental and theoretical natural modes using [] ,
model A (above), model B (below).
2.3.3 The verification and the identification of the bridge FEM models
Two FEM models of the investigated bridge were created in program NEXIS 32
using shell-plate and beam elements. The program NEXIS was chosen because it was
usually used for static and dynamic computations of bridges by a number of designers
in Czech Republic at the time of the experiment.
REALNA SLOZKA ZMER.VL.TV.(SL.W)
SOUBOR A: HERHUT03.MOD f(j)= 6.022 Hz fb(j)= 0.056 Hz lg.dek.= 0.06
REALNA SLOZKA ZMER.VL.TV.(SL.W)
SOUBOR A: HERHUT03.MOD f(j)= 7.558 Hz fb(j)= 0.124 Hz lg.dek.= 0.10
REALNA SLOZKA ZMER.VL.TV.(SL.W)
SOUBOR A: HERHUT03.MOD f(j)= 9.690 Hz fb(j)= 0.266 Hz lg.dek.= 0.17
ZMENA MATICE [D] - REALNA SLOZKA VLASTNICH TVARU (POSUNY W)
POROVNAVANE TVARY: (POCET POR. TVARU: 3 A:HERHUT03.MOD B:HERM_TMA.TXT)
A: 1 2 3
B: 1 3 4
MAX.PORADNICE NA OBR.:2.8899E-09
7.3768E-11%
ZMENA MATICE [D] - REALNA SLOZKA VLASTNICH TVARU (POSUNY W)
POROVNAVANE TVARY: (POCET POR. TVARU: 3 A:HERHUT03.MOD B:HERM_TMB.TXT)
A: 1 2 3
B: 1 3 4
MAX.PORADNICE NA OBR.:1.2967E-09
7.3768E-11%
19
The model A was the initial model and it was created before realization of the
experiment. The results of this model were used for preparing an experiment.
The model A was verified based on evaluated experimental results. The
procedures used for localization of damage (changes of a mode surface curvature
CAMOSUC(j),x, changes of a modal flexibility matrix [] and the second derivative
of changes of diagonal members of a modal flexibility matrix []) were used for
comparison of measured and computed modes. The essential differences were found
out as between measured and computed natural frequencies (Tab.4) and between
measured and computed natural modes (Fig. 11 and 12). Therefore, identification of
bridge model was carried out. The bridge model B was the result of the identification.
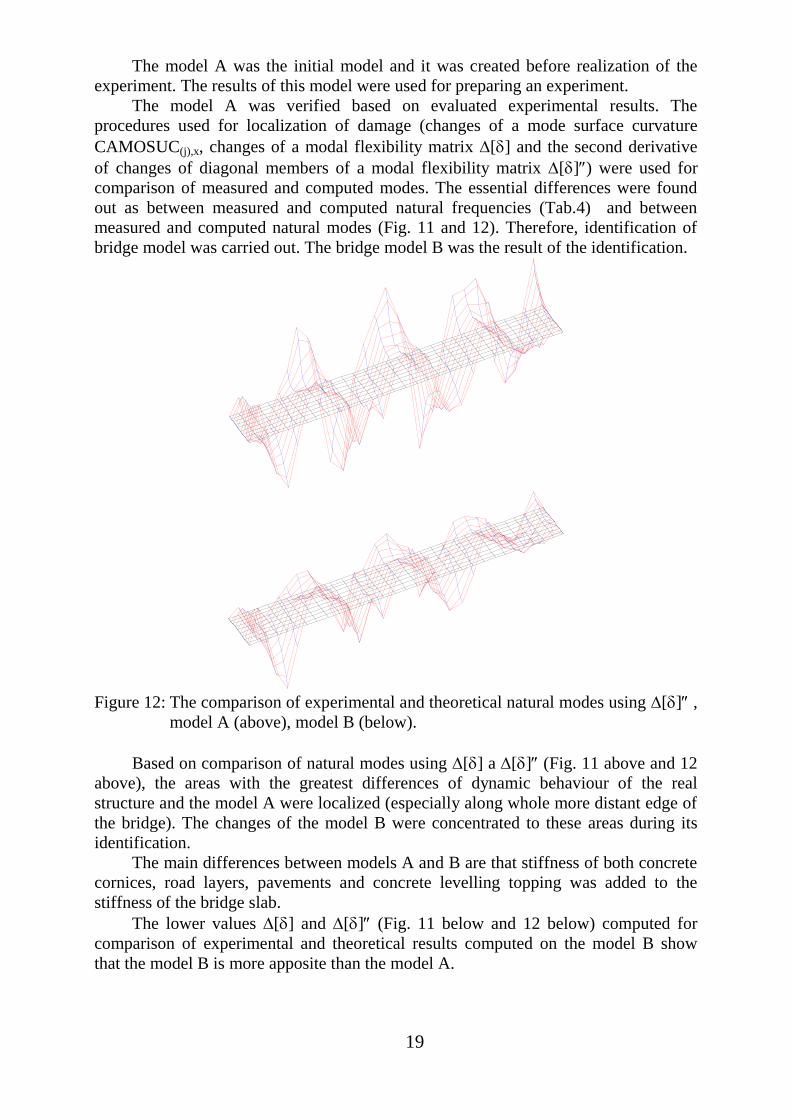
Figure 12: The comparison of experimental and theoretical natural modes using [] ,
model A (above), model B (below).
Based on comparison of natural modes using [] a [] (Fig. 11 above and 12
above), the areas with the greatest differences of dynamic behaviour of the real
structure and the model A were localized (especially along whole more distant edge of
the bridge). The changes of the model B were concentrated to these areas during its
identification.
The main differences between models A and B are that stiffness of both concrete
cornices, road layers, pavements and concrete levelling topping was added to the
stiffness of the bridge slab.
The lower values [] and [] (Fig. 11 below and 12 below) computed for
comparison of experimental and theoretical results computed on the model B show
that the model B is more apposite than the model A.
KRIVOST ZMENY MATICE [D] - REALNA SLOZKA VLASTNICH TVARU (POSUNY W)
POROVNAVANE TVARY: (POCET POR. TVARU: 3 A:HERHUT03.MOD B:HERM_TMA.TXT)
A: 1 2 3
B: 1 3 4
MAX.PORADNICE NA OBR.:2.0285E-10
7.8988%
KRIVOST ZMENY MATICE [D] - REALNA SLOZKA VLASTNICH TVARU (POSUNY W)
POROVNAVANE TVARY: (POCET POR. TVARU: 3 A:HERHUT03.MOD B:HERM_TMB.TXT)
A: 1 2 3
B: 1 3 4
MAX.PORADNICE NA OBR.:1.1633E-10
9.2478%
20
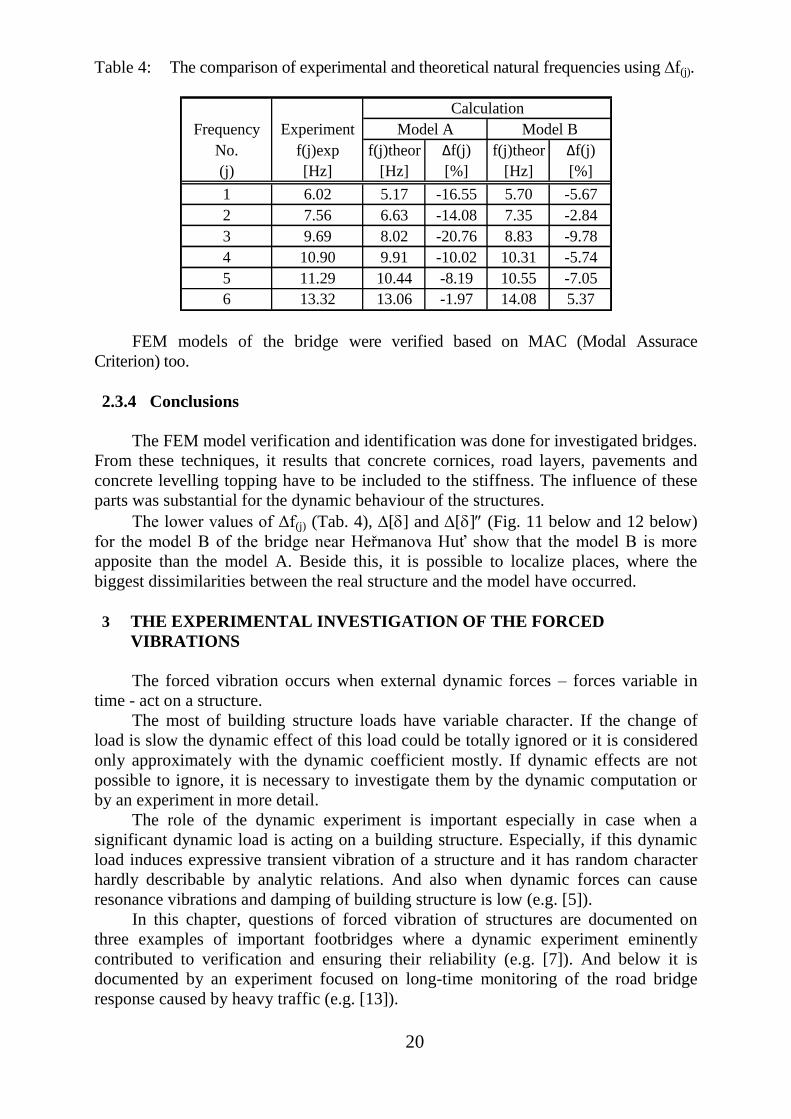
Table 4: The comparison of experimental and theoretical natural frequencies using f(j).
Frequency Experiment
No. f(j)exp f(j)theor Δf(j) f(j)theor Δf(j)
(j) [Hz] [Hz] [%] [Hz] [%]
1 6.02 5.17 -16.55 5.70 -5.67
2 7.56 6.63 -14.08 7.35 -2.84
3 9.69 8.02 -20.76 8.83 -9.78
4 10.90 9.91 -10.02 10.31 -5.74
5 11.29 10.44 -8.19 10.55 -7.05
6 13.32 13.06 -1.97 14.08 5.37
Calculation
Model A Model B
FEM models of the bridge were verified based on MAC (Modal Assurace
Criterion) too.
2.3.4 Conclusions
The FEM model verification and identification was done for investigated bridges.
From these techniques, it results that concrete cornices, road layers, pavements and
concrete levelling topping have to be included to the stiffness. The influence of these
parts was substantial for the dynamic behaviour of the structures.
The lower values of Δf(j) (Tab. 4), [] and [] (Fig. 11 below and 12 below)
for the model B of the bridge near Heřmanova Huť show that the model B is more
apposite than the model A. Beside this, it is possible to localize places, where the
biggest dissimilarities between the real structure and the model have occurred.
3 THE EXPERIMENTAL INVESTIGATION OF THE FORCED
VIBRATIONS
The forced vibration occurs when external dynamic forces – forces variable in
time - act on a structure.
The most of building structure loads have variable character. If the change of
load is slow the dynamic effect of this load could be totally ignored or it is considered
only approximately with the dynamic coefficient mostly. If dynamic effects are not
possible to ignore, it is necessary to investigate them by the dynamic computation or
by an experiment in more detail.
The role of the dynamic experiment is important especially in case when a
significant dynamic load is acting on a building structure. Especially, if this dynamic
load induces expressive transient vibration of a structure and it has random character
hardly describable by analytic relations. And also when dynamic forces can cause
resonance vibrations and damping of building structure is low (e.g. [5]).
In this chapter, questions of forced vibration of structures are documented on
three examples of important footbridges where a dynamic experiment eminently
contributed to verification and ensuring their reliability (e.g. [7]). And below it is
documented by an experiment focused on long-time monitoring of the road bridge
response caused by heavy traffic (e.g. [13]).
21
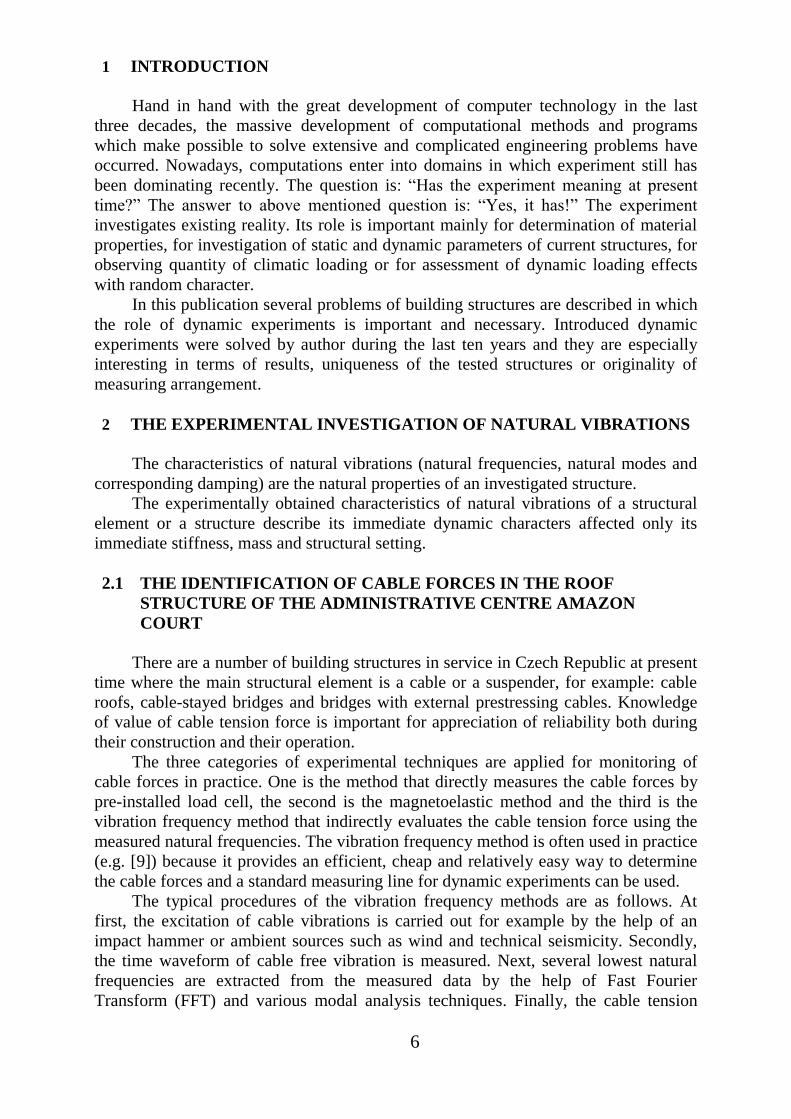
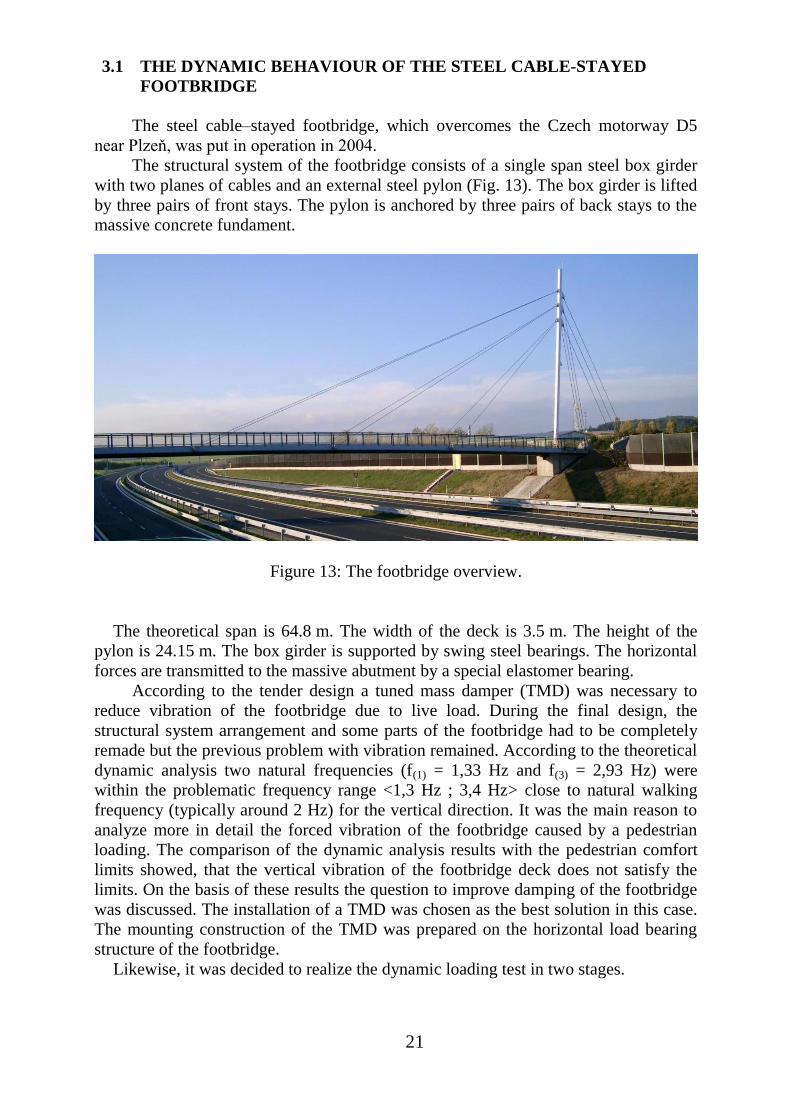
3.1 THE DYNAMIC BEHAVIOUR OF THE STEEL CABLE-STAYED
FOOTBRIDGE
The steel cable–stayed footbridge, which overcomes the Czech motorway D5
near Plzeň, was put in operation in 2004.
The structural system of the footbridge consists of a single span steel box girder
with two planes of cables and an external steel pylon (Fig. 13). The box girder is lifted
by three pairs of front stays. The pylon is anchored by three pairs of back stays to the
massive concrete fundament.
Figure 13: The footbridge overview.
The theoretical span is 64.8 m. The width of the deck is 3.5 m. The height of the
pylon is 24.15 m. The box girder is supported by swing steel bearings. The horizontal
forces are transmitted to the massive abutment by a special elastomer bearing.
According to the tender design a tuned mass damper (TMD) was necessary to
reduce vibration of the footbridge due to live load. During the final design, the
structural system arrangement and some parts of the footbridge had to be completely
remade but the previous problem with vibration remained. According to the theoretical
dynamic analysis two natural frequencies (f(1) = 1,33 Hz and f(3) = 2,93 Hz) were
within the problematic frequency range <1,3 Hz ; 3,4 Hz> close to natural walking
frequency (typically around 2 Hz) for the vertical direction. It was the main reason to
analyze more in detail the forced vibration of the footbridge caused by a pedestrian
loading. The comparison of the dynamic analysis results with the pedestrian comfort
limits showed, that the vertical vibration of the footbridge deck does not satisfy the
limits. On the basis of these results the question to improve damping of the footbridge
was discussed. The installation of a TMD was chosen as the best solution in this case.
The mounting construction of the TMD was prepared on the horizontal load bearing
structure of the footbridge.
Likewise, it was decided to realize the dynamic loading test in two stages.
22
3.1.1 The 1st dynamic load test in situ
After the final construction works had finished, the first dynamic load test in situ
was carried out. The main topics of this experiment were to find out the frequencies
and modes of natural vibration, damping and the response of the real structure to
different sets of pedestrian loads.
The modal analysis with forced vibration technique (which is described in
chapter 2.3.2) was used to find out natural frequencies and natural modes.
The response of the footbridge to shaker excitation was measured in vertical and
transverse horizontal directions in a chosen net of points (84 points – 21 cross sections
and 4 points in each one) on the footbridge deck.
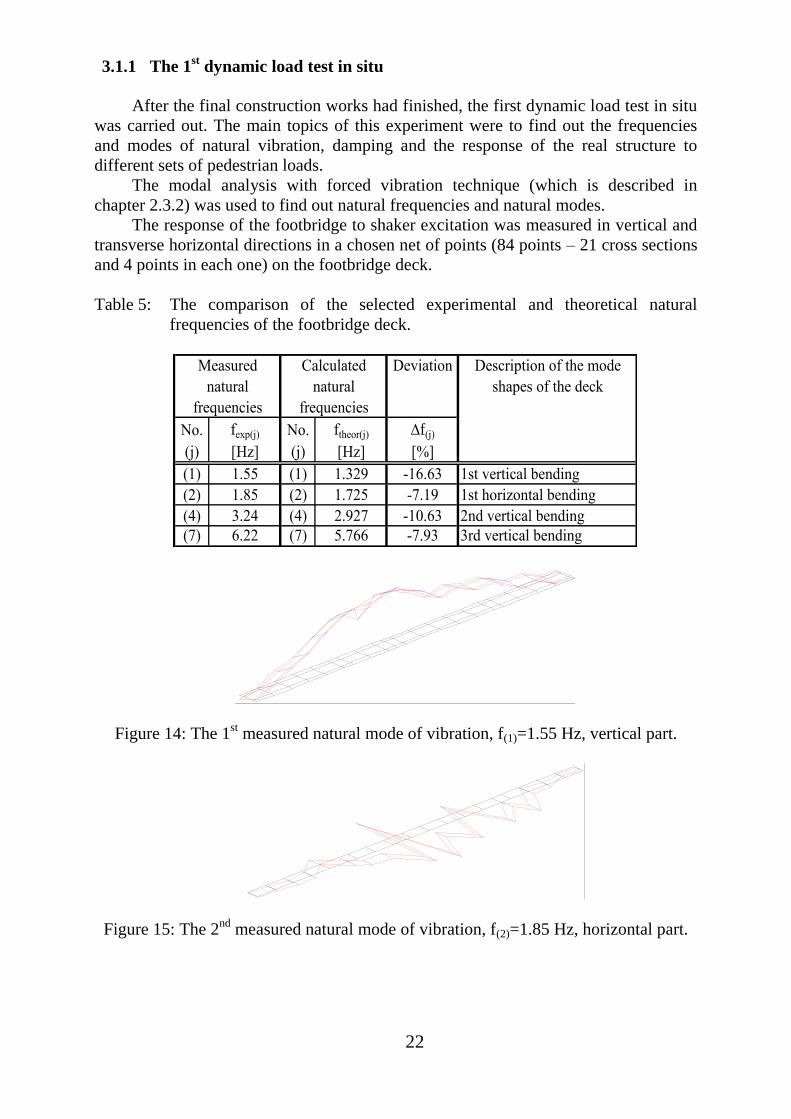
Table 5: The comparison of the selected experimental and theoretical natural
frequencies of the footbridge deck.
Deviation Description of the mode
shapes of the deck
No. fexp(j) No. ftheor(j) f(j)
(j) [Hz] (j) [Hz] [%]
(1) 1.55 (1) 1.329 -16.63 1st vertical bending
(2) 1.85 (2) 1.725 -7.19 1st horizontal bending
(4) 3.24 (4) 2.927 -10.63 2nd vertical bending
(7) 6.22 (7) 5.766 -7.93 3rd vertical bending
frequencies
Calculated
natural
frequencies
Measured
natural
Figure 14: The 1st measured natural mode of vibration, f(1)=1.55 Hz, vertical part.
Figure 15: The 2nd
measured natural mode of vibration, f(2)=1.85 Hz, horizontal part.
REALNA SLOZKA ZMER.VL.TV.(SL.W)
SOUBOR A: CERNI413.MOD f(j)= 1.550 Hz fb(j)= 0.148 Hz lg.dek.= 0.60
REALNA SLOZKA ZMER.VL.TV.(SL.V)
SOUBOR A: CERNI413.MOD f(j)= 1.849 Hz fb(j)= 0.112 Hz lg.dek.= 0.38
23
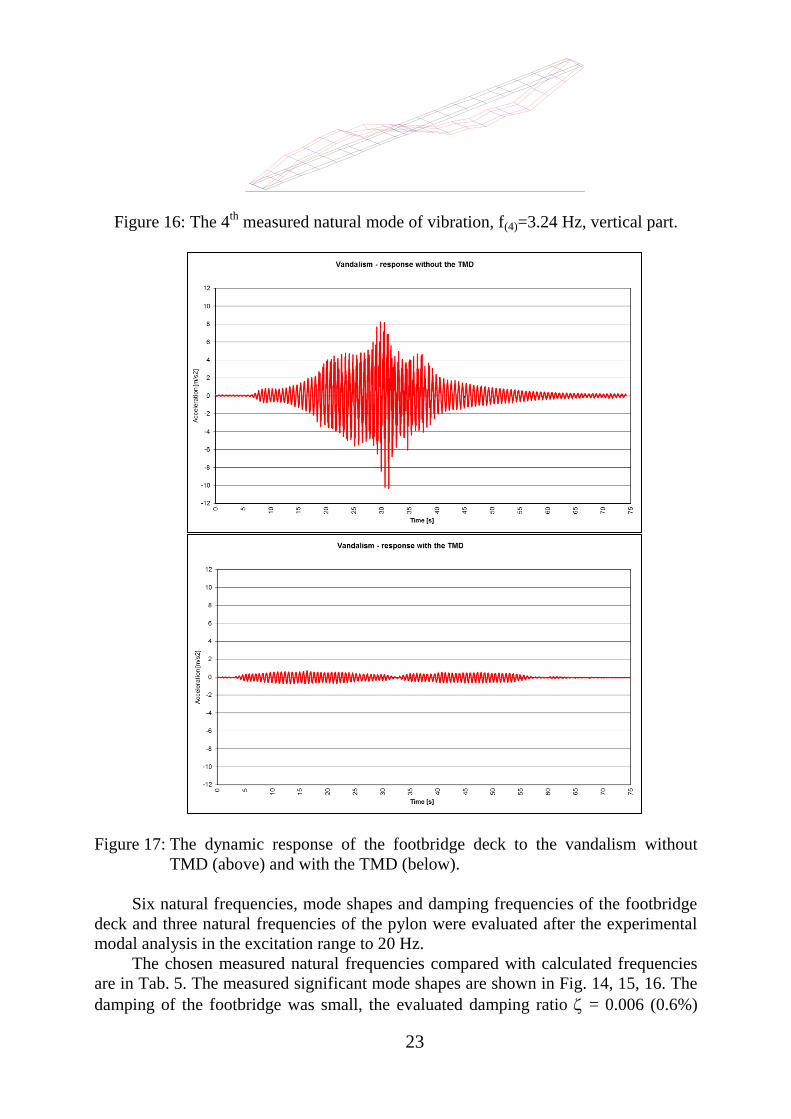
Figure 16: The 4th
measured natural mode of vibration, f(4)=3.24 Hz, vertical part.
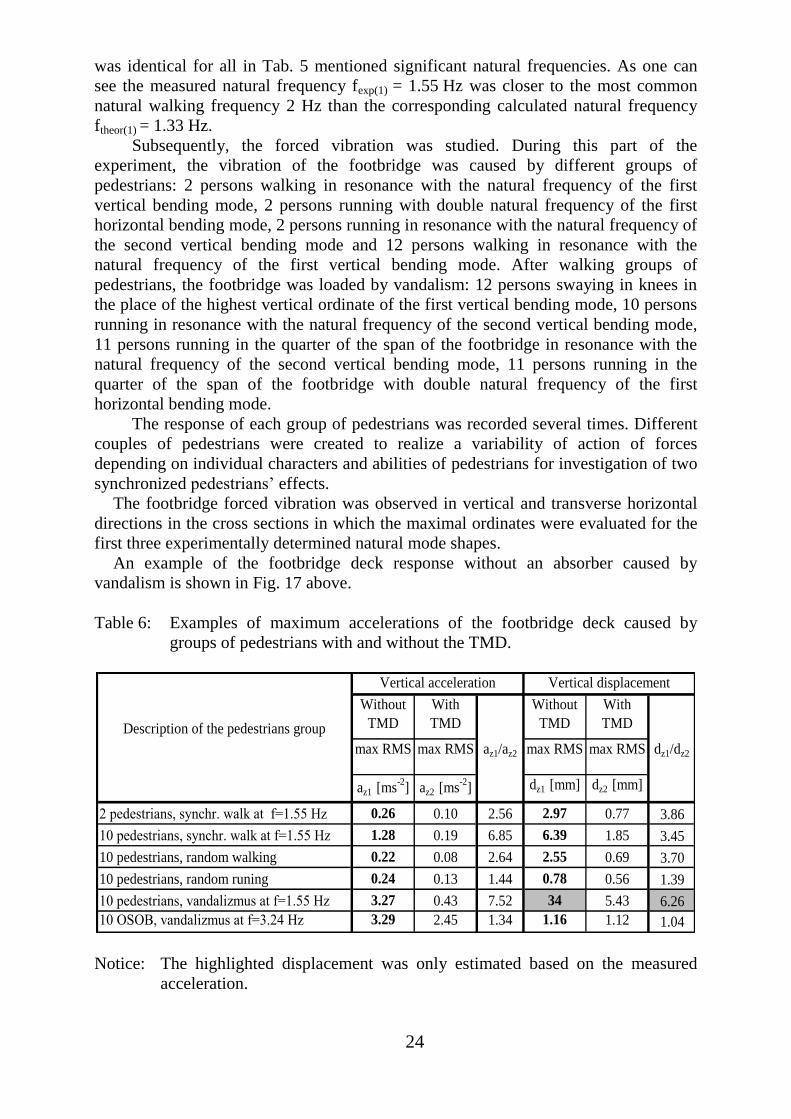
Figure 17: The dynamic response of the footbridge deck to the vandalism without
TMD (above) and with the TMD (below).
Six natural frequencies, mode shapes and damping frequencies of the footbridge
deck and three natural frequencies of the pylon were evaluated after the experimental
modal analysis in the excitation range to 20 Hz.
The chosen measured natural frequencies compared with calculated frequencies
are in Tab. 5. The measured significant mode shapes are shown in Fig. 14, 15, 16. The
damping of the footbridge was small, the evaluated damping ratio = 0.006 (0.6%)
REALNA SLOZKA ZMER.VL.TV.(SL.W)
SOUBOR A: CERNI413.MOD f(j)= 3.238 Hz fb(j)= 0.020 Hz lg.dek.= 0.04
24
was identical for all in Tab. 5 mentioned significant natural frequencies. As one can
see the measured natural frequency fexp(1) = 1.55 Hz was closer to the most common
natural walking frequency 2 Hz than the corresponding calculated natural frequency
ftheor(1) = 1.33 Hz.
Subsequently, the forced vibration was studied. During this part of the
experiment, the vibration of the footbridge was caused by different groups of
pedestrians: 2 persons walking in resonance with the natural frequency of the first
vertical bending mode, 2 persons running with double natural frequency of the first
horizontal bending mode, 2 persons running in resonance with the natural frequency of
the second vertical bending mode and 12 persons walking in resonance with the
natural frequency of the first vertical bending mode. After walking groups of
pedestrians, the footbridge was loaded by vandalism: 12 persons swaying in knees in
the place of the highest vertical ordinate of the first vertical bending mode, 10 persons
running in resonance with the natural frequency of the second vertical bending mode,
11 persons running in the quarter of the span of the footbridge in resonance with the
natural frequency of the second vertical bending mode, 11 persons running in the
quarter of the span of the footbridge with double natural frequency of the first
horizontal bending mode.
The response of each group of pedestrians was recorded several times. Different
couples of pedestrians were created to realize a variability of action of forces
depending on individual characters and abilities of pedestrians for investigation of two
synchronized pedestrians’ effects.
The footbridge forced vibration was observed in vertical and transverse horizontal
directions in the cross sections in which the maximal ordinates were evaluated for the
first three experimentally determined natural mode shapes.
An example of the footbridge deck response without an absorber caused by
vandalism is shown in Fig. 17 above.
Table 6: Examples of maximum accelerations of the footbridge deck caused by
groups of pedestrians with and without the TMD.
Description of the pedestrians group
Without
TMD
With
TMD
Without
TMD
With
TMD
max RMS max RMS az1/az2 max RMS max RMS dz1/dz2
az1 [ms-2
] az2 [ms-2
] dz1 [mm] dz2 [mm]
2 pedestrians, synchr. walk at f=1.55 Hz 0.26 0.10 2.56 2.97 0.77 3.86
10 pedestrians, synchr. walk at f=1.55 Hz 1.28 0.19 6.85 6.39 1.85 3.45
10 pedestrians, random walking 0.22 0.08 2.64 2.55 0.69 3.70
10 pedestrians, random runing 0.24 0.13 1.44 0.78 0.56 1.39
10 pedestrians, vandalizmus at f=1.55 Hz 3.27 0.43 7.52 34 5.43 6.26
10 OSOB, vandalizmus at f=3.24 Hz 3.29 2.45 1.34 1.16 1.12 1.04
Vertical acceleration Vertical displacement
Notice: The highlighted displacement was only estimated based on the measured
acceleration.
25
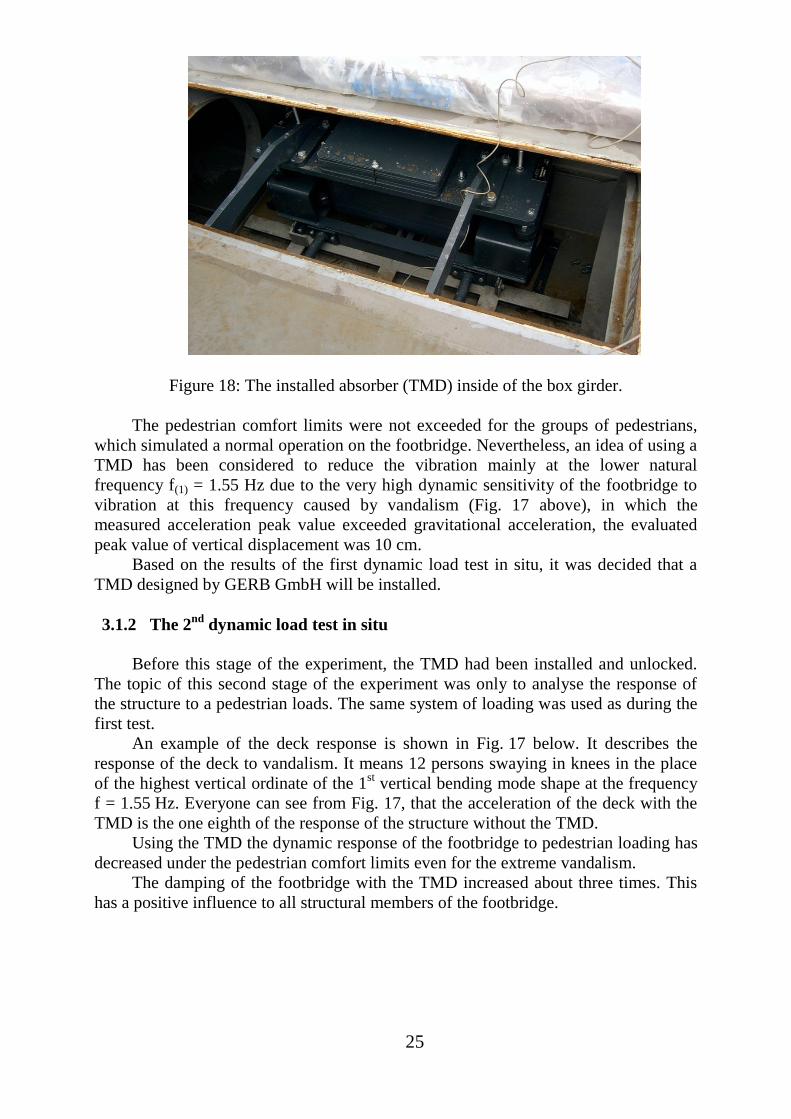
Figure 18: The installed absorber (TMD) inside of the box girder.
The pedestrian comfort limits were not exceeded for the groups of pedestrians,
which simulated a normal operation on the footbridge. Nevertheless, an idea of using a
TMD has been considered to reduce the vibration mainly at the lower natural
frequency f(1) = 1.55 Hz due to the very high dynamic sensitivity of the footbridge to
vibration at this frequency caused by vandalism (Fig. 17 above), in which the
measured acceleration peak value exceeded gravitational acceleration, the evaluated
peak value of vertical displacement was 10 cm.
Based on the results of the first dynamic load test in situ, it was decided that a
TMD designed by GERB GmbH will be installed.
3.1.2 The 2nd
dynamic load test in situ
Before this stage of the experiment, the TMD had been installed and unlocked.
The topic of this second stage of the experiment was only to analyse the response of
the structure to a pedestrian loads. The same system of loading was used as during the
first test.
An example of the deck response is shown in Fig. 17 below. It describes the
response of the deck to vandalism. It means 12 persons swaying in knees in the place
of the highest vertical ordinate of the 1st vertical bending mode shape at the frequency
f = 1.55 Hz. Everyone can see from Fig. 17, that the acceleration of the deck with the
TMD is the one eighth of the response of the structure without the TMD.
Using the TMD the dynamic response of the footbridge to pedestrian loading has
decreased under the pedestrian comfort limits even for the extreme vandalism.
The damping of the footbridge with the TMD increased about three times. This
has a positive influence to all structural members of the footbridge.
26
3.1.3 Conclusions
The described experiment was focused on forced vibration of the investigated
footbridge which was caused by pedestrian loading. The experiment got the significant
results that eminently contributed to ensuring its reliability.
Though the pedestrian comfort limits were not exceeded for the experimental
simulation of the normal operation on the footbridge, the experiment detected the very
high sensitivity of the footbridge to vandalism. The extreme peak to peak
amplitude19 cm of vertical displacement of vibration caused by vandalism was
evaluated. This detected level of vibration was not acceptable for investigated
footbridge.
For potential vandals it was not difficult to find out the resonant frequency from
a footbridge vibration excited by a pedestrians’ passage. Also the synchronization of
the vandals’ movement was easy due to strong footbridge vibration.
After the TMD installation, the excessive vibration of the footbridge was not
possible to excite.
3.2 THE DYNAMIC BEHAVIOUR OF THE FOOTBRIDGE ACROSS THE
„K BARRANDOVU“ STREET IN PRAGUE
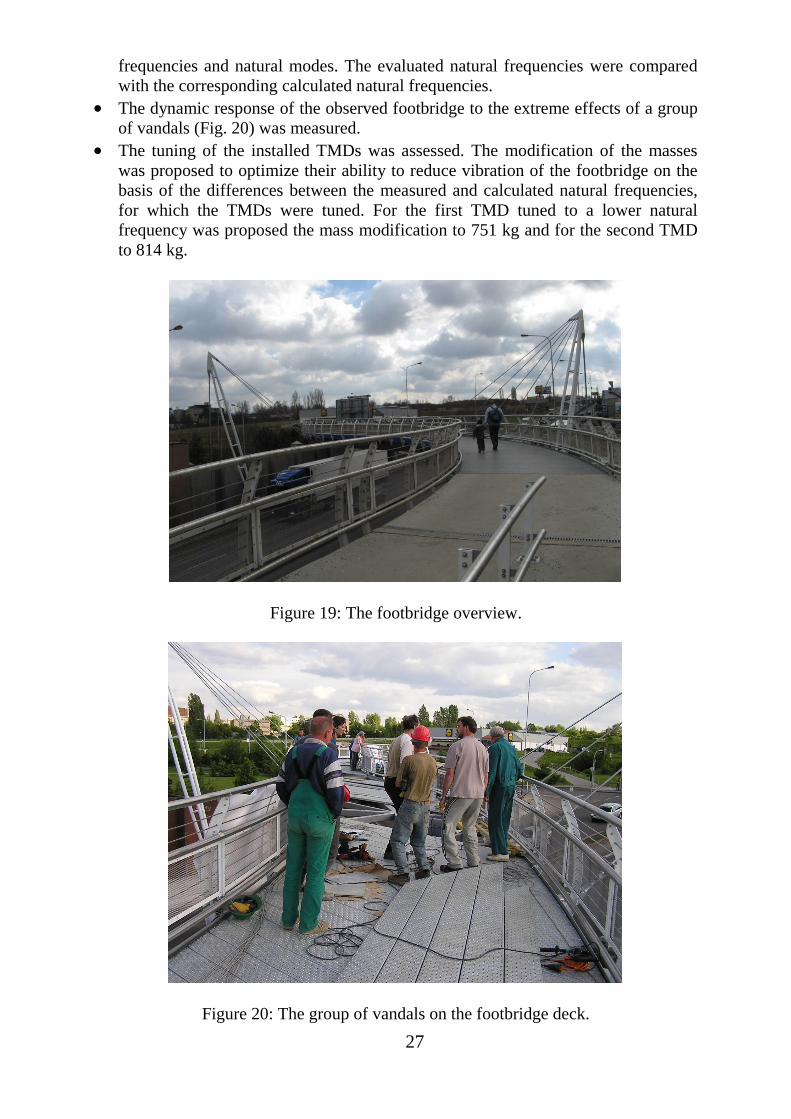
The footbridge in Prague – Barrandov (Fig. 19) was put into operation 1.6. 2006.
This footbridge connects two urban areas, divided by the frequented highway “K
Barrandovu”. The footbridge is formed by the tube main girder with the truss bridge
deck, which is suspended to two skew pylons. Two tuned mass dampers (TMDs) are
used to ensure comfort for pedestrians.
During the design of the footbridge the theoretical dynamic analysis was
performed. In this dynamic analysis two natural frequencies (f(1) = 2.29 Hz,
f(2) = 2.57 Hz) were found out which corresponded to the natural modes of vertical
vibration of the footbridge deck and which were within the problematic frequency
range <1.3 Hz ; 3.4 Hz> close to natural walking frequency (typically around 2 Hz) for
the vertical direction. Due to the low damping and high slenderness of a footbridge the
considerable sensitivity of a footbridge to dynamic excitation by pedestrians was
found out. Therefore, it was necessary to ensure the comfort for pedestrians, the
footbridge load bearing structure was equipped with two tuned mass dampers (TMDs).
Due to the limited time available, it was not possible to carry out the dynamic
load test of the footbridge in two stages. TMDs had been ordered from the company
GERB. Both TMDs were made with a mass of 850 kg with adjustment of the masses
within the range of ± 50 kg. In production the natural frequency of the first TMD was
tuned to 2.18 Hz and of the second TMD to 2.44 Hz, i.e. 95% of the calculated first
and second natural frequencies of the footbridge.
The dynamic load test was carried out on the footbridge after the installation of
TMDs just before the footbridge was put in operation. During the first stage of the test
the TMDs were not functional. The working activity was divided into three steps:
The significant natural frequencies, which corresponded to the global natural
modes of the footbridge deck, were evaluated from the vibration of the footbridge
(fexp(1) = 2.47 Hz, fexp(2) = 2.66 Hz). The modal analysis with the forced vibration
technique (which is described in chapter 2.3.2) was used to find out natural
27
frequencies and natural modes. The evaluated natural frequencies were compared
with the corresponding calculated natural frequencies.
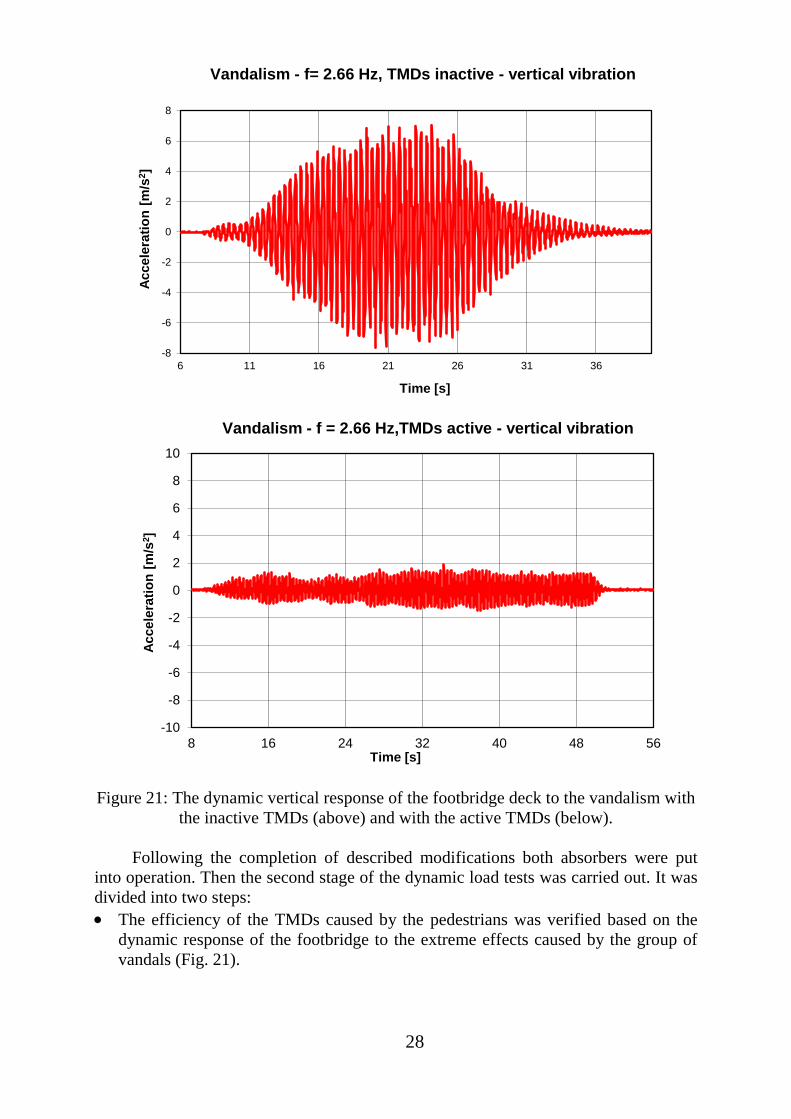
The dynamic response of the observed footbridge to the extreme effects of a group
of vandals (Fig. 20) was measured.
The tuning of the installed TMDs was assessed. The modification of the masses
was proposed to optimize their ability to reduce vibration of the footbridge on the
basis of the differences between the measured and calculated natural frequencies,
for which the TMDs were tuned. For the first TMD tuned to a lower natural
frequency was proposed the mass modification to 751 kg and for the second TMD
to 814 kg.
Figure 19: The footbridge overview.
Figure 20: The group of vandals on the footbridge deck.
28
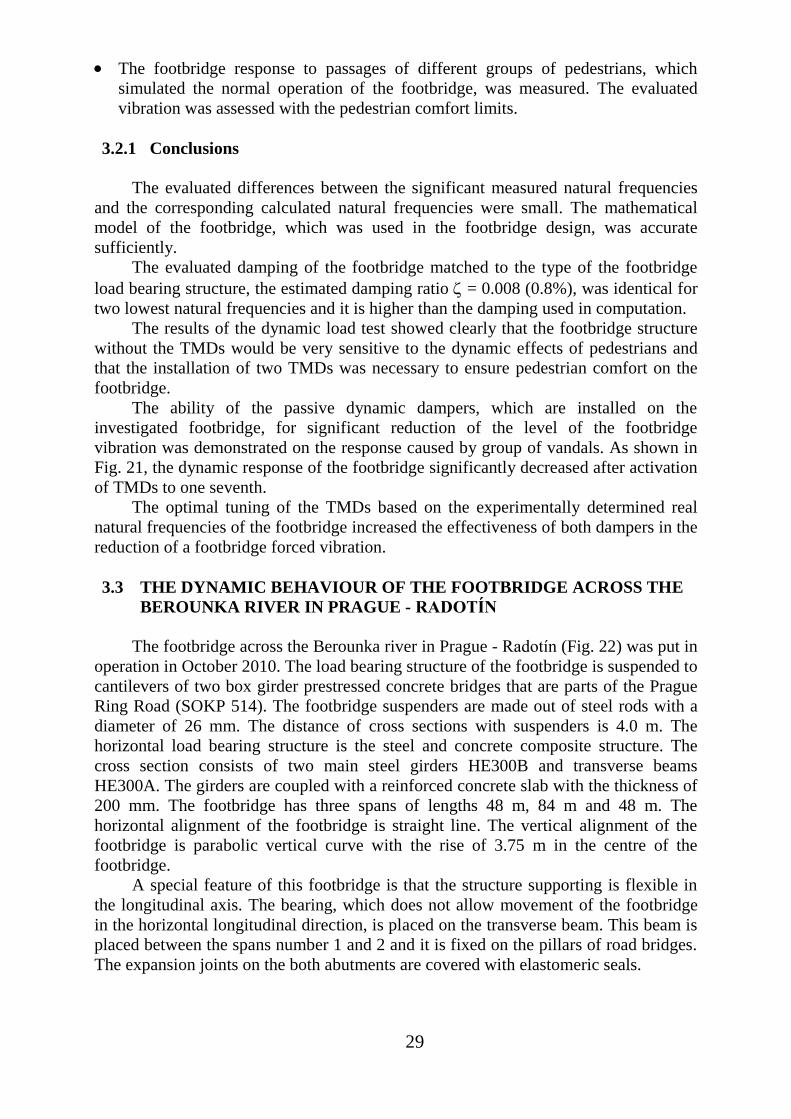
Figure 21: The dynamic vertical response of the footbridge deck to the vandalism with
the inactive TMDs (above) and with the active TMDs (below).
Following the completion of described modifications both absorbers were put
into operation. Then the second stage of the dynamic load tests was carried out. It was
divided into two steps:
The efficiency of the TMDs caused by the pedestrians was verified based on the
dynamic response of the footbridge to the extreme effects caused by the group of
vandals (Fig. 21).
-8
-6
-4
-2
0
2
4
6
8
6 11 16 21 26 31 36
Accele
rati
on
[m
/s2]
Time [s]
Vandalism - f= 2.66 Hz, TMDs inactive - vertical vibration
-10
-8
-6
-4
-2
0
2
4
6
8
10
8 16 24 32 40 48 56
Accele
rati
on
[m
/s2]
Time [s]
Vandalism - f = 2.66 Hz,TMDs active - vertical vibration
29
The footbridge response to passages of different groups of pedestrians, which
simulated the normal operation of the footbridge, was measured. The evaluated
vibration was assessed with the pedestrian comfort limits.
3.2.1 Conclusions
The evaluated differences between the significant measured natural frequencies
and the corresponding calculated natural frequencies were small. The mathematical
model of the footbridge, which was used in the footbridge design, was accurate
sufficiently.
The evaluated damping of the footbridge matched to the type of the footbridge
load bearing structure, the estimated damping ratio = 0.008 (0.8%), was identical for
two lowest natural frequencies and it is higher than the damping used in computation.
The results of the dynamic load test showed clearly that the footbridge structure
without the TMDs would be very sensitive to the dynamic effects of pedestrians and
that the installation of two TMDs was necessary to ensure pedestrian comfort on the
footbridge.
The ability of the passive dynamic dampers, which are installed on the
investigated footbridge, for significant reduction of the level of the footbridge
vibration was demonstrated on the response caused by group of vandals. As shown in
Fig. 21, the dynamic response of the footbridge significantly decreased after activation
of TMDs to one seventh.
The optimal tuning of the TMDs based on the experimentally determined real
natural frequencies of the footbridge increased the effectiveness of both dampers in the
reduction of a footbridge forced vibration.
3.3 THE DYNAMIC BEHAVIOUR OF THE FOOTBRIDGE ACROSS THE
BEROUNKA RIVER IN PRAGUE - RADOTÍN
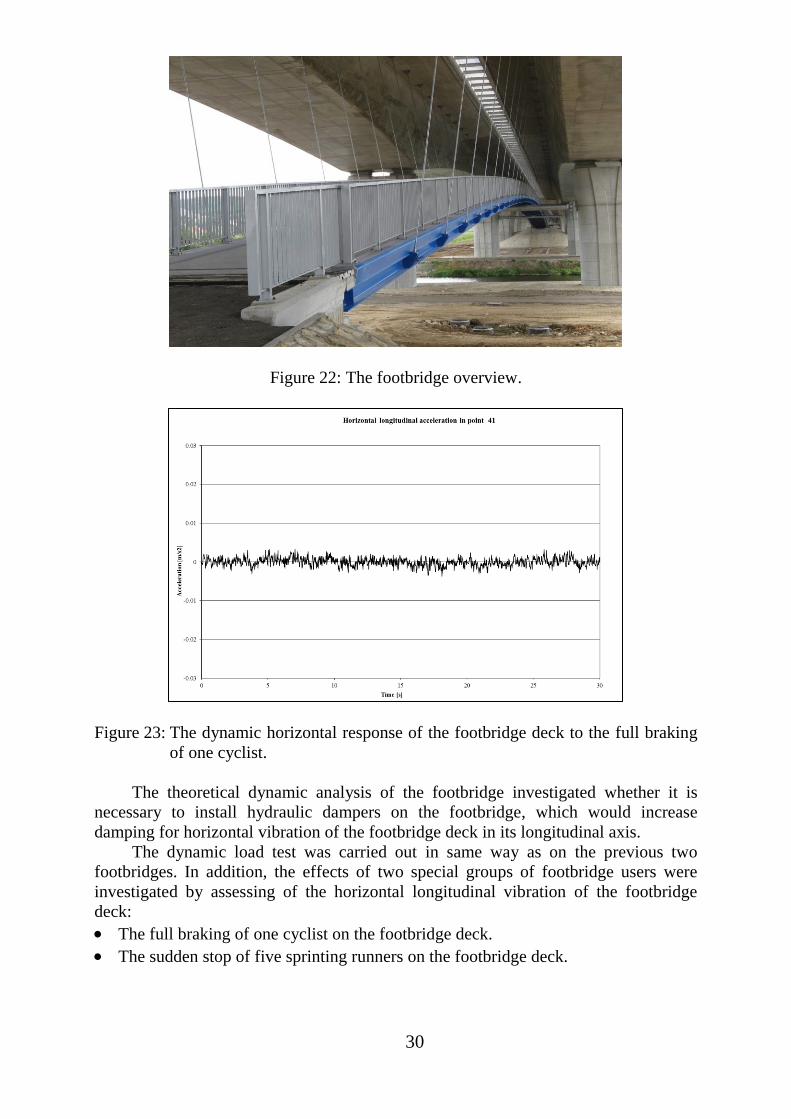
The footbridge across the Berounka river in Prague - Radotín (Fig. 22) was put in
operation in October 2010. The load bearing structure of the footbridge is suspended to
cantilevers of two box girder prestressed concrete bridges that are parts of the Prague
Ring Road (SOKP 514). The footbridge suspenders are made out of steel rods with a
diameter of 26 mm. The distance of cross sections with suspenders is 4.0 m. The
horizontal load bearing structure is the steel and concrete composite structure. The
cross section consists of two main steel girders HE300B and transverse beams
HE300A. The girders are coupled with a reinforced concrete slab with the thickness of
200 mm. The footbridge has three spans of lengths 48 m, 84 m and 48 m. The
horizontal alignment of the footbridge is straight line. The vertical alignment of the
footbridge is parabolic vertical curve with the rise of 3.75 m in the centre of the
footbridge.
A special feature of this footbridge is that the structure supporting is flexible in
the longitudinal axis. The bearing, which does not allow movement of the footbridge
in the horizontal longitudinal direction, is placed on the transverse beam. This beam is
placed between the spans number 1 and 2 and it is fixed on the pillars of road bridges.
The expansion joints on the both abutments are covered with elastomeric seals.
30
Figure 22: The footbridge overview.
Figure 23: The dynamic horizontal response of the footbridge deck to the full braking
of one cyclist.
The theoretical dynamic analysis of the footbridge investigated whether it is
necessary to install hydraulic dampers on the footbridge, which would increase
damping for horizontal vibration of the footbridge deck in its longitudinal axis.
The dynamic load test was carried out in same way as on the previous two
footbridges. In addition, the effects of two special groups of footbridge users were
investigated by assessing of the horizontal longitudinal vibration of the footbridge
deck:
The full braking of one cyclist on the footbridge deck.
The sudden stop of five sprinting runners on the footbridge deck.
31
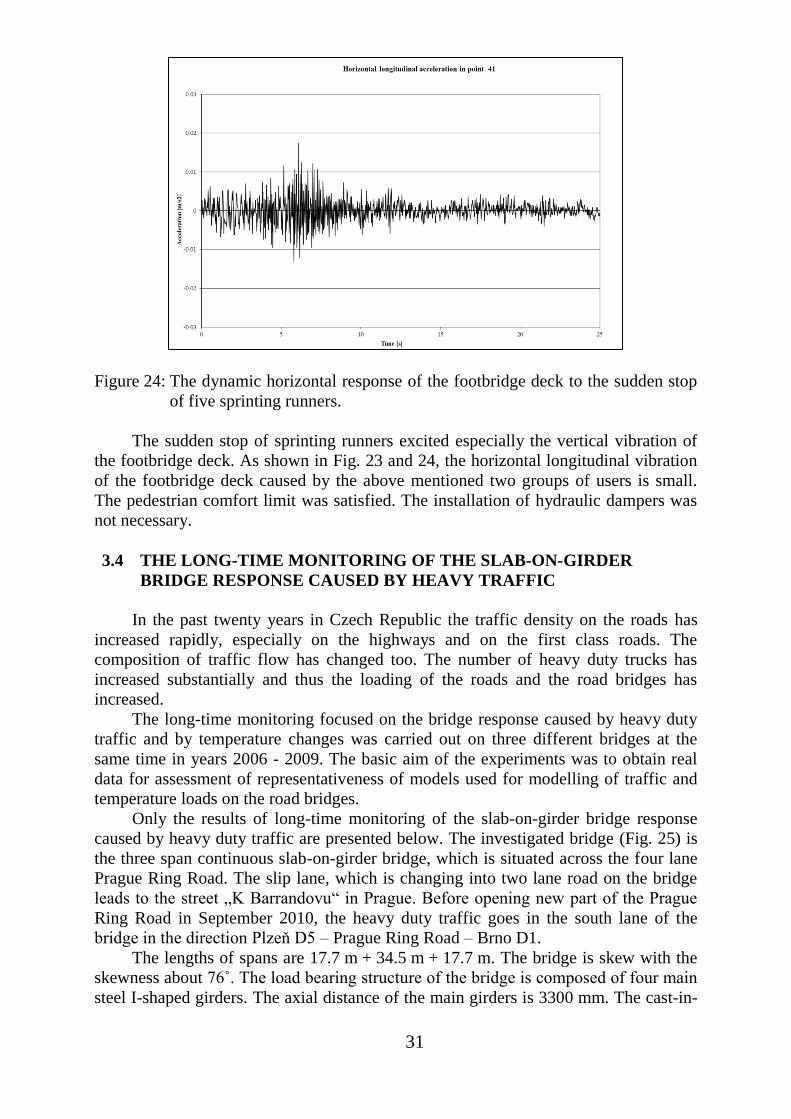
Figure 24: The dynamic horizontal response of the footbridge deck to the sudden stop
of five sprinting runners.
The sudden stop of sprinting runners excited especially the vertical vibration of
the footbridge deck. As shown in Fig. 23 and 24, the horizontal longitudinal vibration
of the footbridge deck caused by the above mentioned two groups of users is small.
The pedestrian comfort limit was satisfied. The installation of hydraulic dampers was
not necessary.
3.4 THE LONG-TIME MONITORING OF THE SLAB-ON-GIRDER
BRIDGE RESPONSE CAUSED BY HEAVY TRAFFIC
In the past twenty years in Czech Republic the traffic density on the roads has
increased rapidly, especially on the highways and on the first class roads. The
composition of traffic flow has changed too. The number of heavy duty trucks has
increased substantially and thus the loading of the roads and the road bridges has
increased.
The long-time monitoring focused on the bridge response caused by heavy duty
traffic and by temperature changes was carried out on three different bridges at the
same time in years 2006 - 2009. The basic aim of the experiments was to obtain real
data for assessment of representativeness of models used for modelling of traffic and
temperature loads on the road bridges.
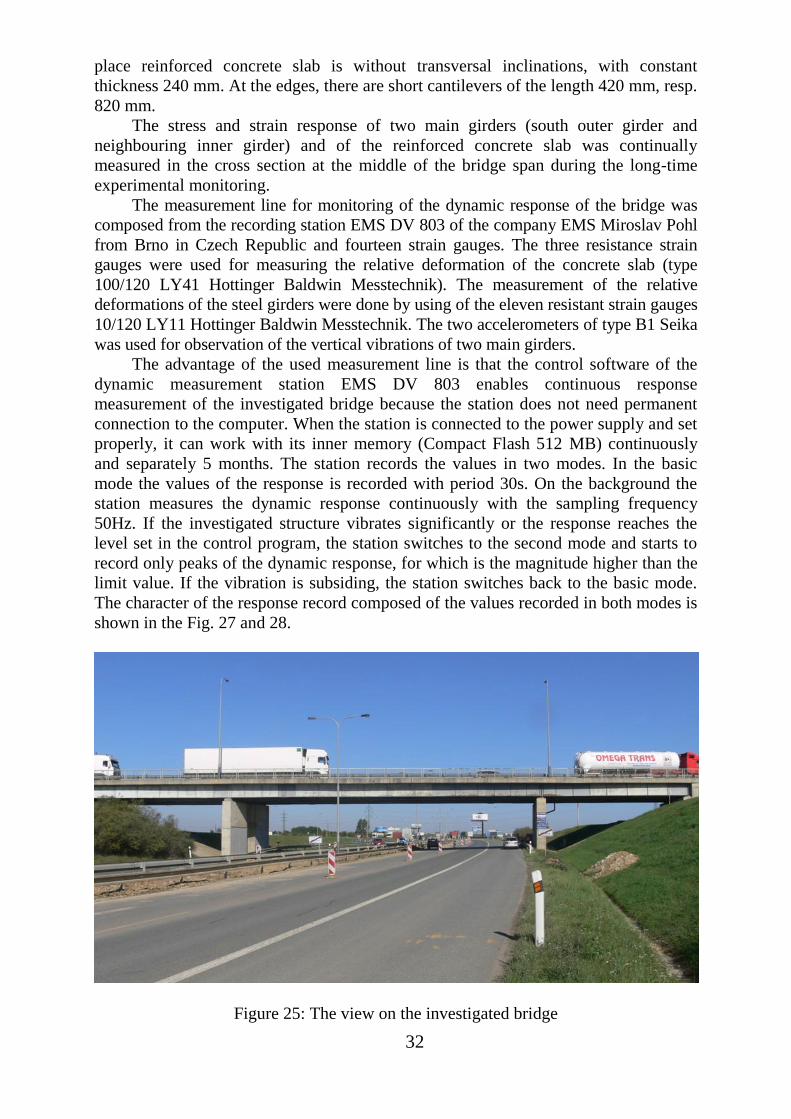
Only the results of long-time monitoring of the slab-on-girder bridge response
caused by heavy duty traffic are presented below. The investigated bridge (Fig. 25) is
the three span continuous slab-on-girder bridge, which is situated across the four lane
Prague Ring Road. The slip lane, which is changing into two lane road on the bridge
leads to the street „K Barrandovu“ in Prague. Before opening new part of the Prague
Ring Road in September 2010, the heavy duty traffic goes in the south lane of the
bridge in the direction Plzeň D5 – Prague Ring Road – Brno D1.
The lengths of spans are 17.7 m + 34.5 m + 17.7 m. The bridge is skew with the
skewness about 76˚. The load bearing structure of the bridge is composed of four main
steel I-shaped girders. The axial distance of the main girders is 3300 mm. The cast-in-
32
place reinforced concrete slab is without transversal inclinations, with constant
thickness 240 mm. At the edges, there are short cantilevers of the length 420 mm, resp.
820 mm.
The stress and strain response of two main girders (south outer girder and
neighbouring inner girder) and of the reinforced concrete slab was continually
measured in the cross section at the middle of the bridge span during the long-time
experimental monitoring.
The measurement line for monitoring of the dynamic response of the bridge was
composed from the recording station EMS DV 803 of the company EMS Miroslav Pohl
from Brno in Czech Republic and fourteen strain gauges. The three resistance strain
gauges were used for measuring the relative deformation of the concrete slab (type
100/120 LY41 Hottinger Baldwin Messtechnik). The measurement of the relative
deformations of the steel girders were done by using of the eleven resistant strain gauges
10/120 LY11 Hottinger Baldwin Messtechnik. The two accelerometers of type B1 Seika
was used for observation of the vertical vibrations of two main girders.
The advantage of the used measurement line is that the control software of the
dynamic measurement station EMS DV 803 enables continuous response
measurement of the investigated bridge because the station does not need permanent
connection to the computer. When the station is connected to the power supply and set
properly, it can work with its inner memory (Compact Flash 512 MB) continuously
and separately 5 months. The station records the values in two modes. In the basic
mode the values of the response is recorded with period 30s. On the background the
station measures the dynamic response continuously with the sampling frequency
50Hz. If the investigated structure vibrates significantly or the response reaches the
level set in the control program, the station switches to the second mode and starts to
record only peaks of the dynamic response, for which is the magnitude higher than the
limit value. If the vibration is subsiding, the station switches back to the basic mode.
The character of the response record composed of the values recorded in both modes is
shown in the Fig. 27 and 28.
Figure 25: The view on the investigated bridge
33
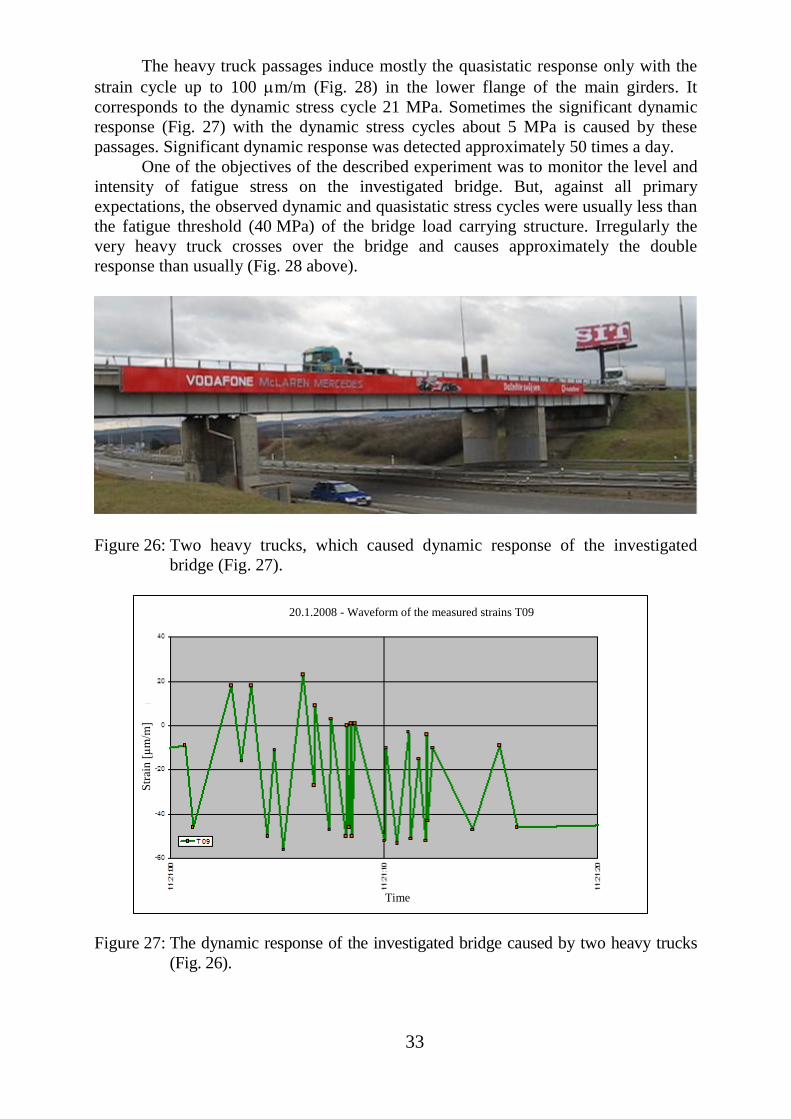
The heavy truck passages induce mostly the quasistatic response only with the
strain cycle up to 100 m/m (Fig. 28) in the lower flange of the main girders. It
corresponds to the dynamic stress cycle 21 MPa. Sometimes the significant dynamic
response (Fig. 27) with the dynamic stress cycles about 5 MPa is caused by these
passages. Significant dynamic response was detected approximately 50 times a day.
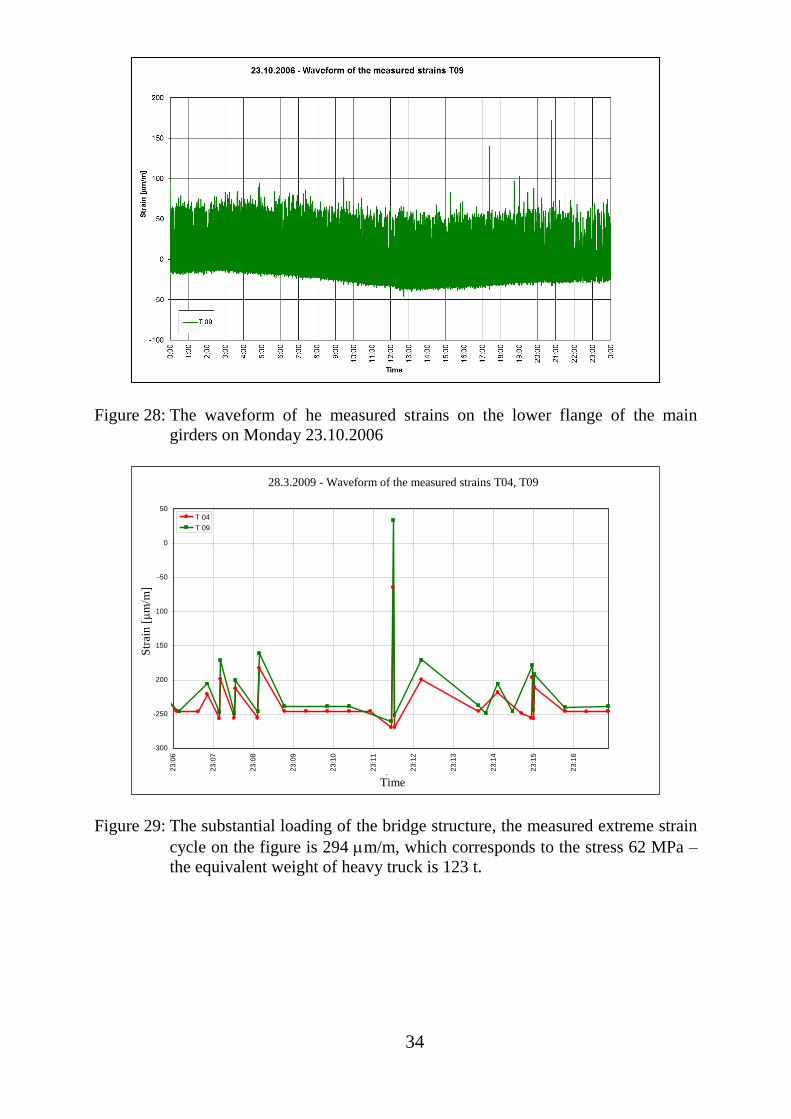
One of the objectives of the described experiment was to monitor the level and
intensity of fatigue stress on the investigated bridge. But, against all primary
expectations, the observed dynamic and quasistatic stress cycles were usually less than
the fatigue threshold (40 MPa) of the bridge load carrying structure. Irregularly the
very heavy truck crosses over the bridge and causes approximately the double
response than usually (Fig. 28 above).
Figure 26: Two heavy trucks, which caused dynamic response of the investigated
bridge (Fig. 27).
Figure 27: The dynamic response of the investigated bridge caused by two heavy trucks
(Fig. 26).
20.1.2008 - Waveform of the measured strains T09
Str
ain
[µ
m/m
]
Time
34
Figure 28: The waveform of he measured strains on the lower flange of the main
girders on Monday 23.10.2006
Figure 29: The substantial loading of the bridge structure, the measured extreme strain
cycle on the figure is 294 m/m, which corresponds to the stress 62 MPa –
the equivalent weight of heavy truck is 123 t.
28.3.2009 - Časový průběh měřených poměrných deformací T04, T09
-300
-250
-200
-150
-100
-50
0
50
23:0
6
23:0
7
23:0
8
23:0
9
23:1
0
23:1
1
23:1
2
23:1
3
23:1
4
23:1
5
23:1
6
Čas
Po
měrn
á d
efo
rmace [
m/m
]
T 04
T 09
28.3.2009 - Waveform of the measured strains T04, T09
Str
ain
[µ
m/m
]
Time
35
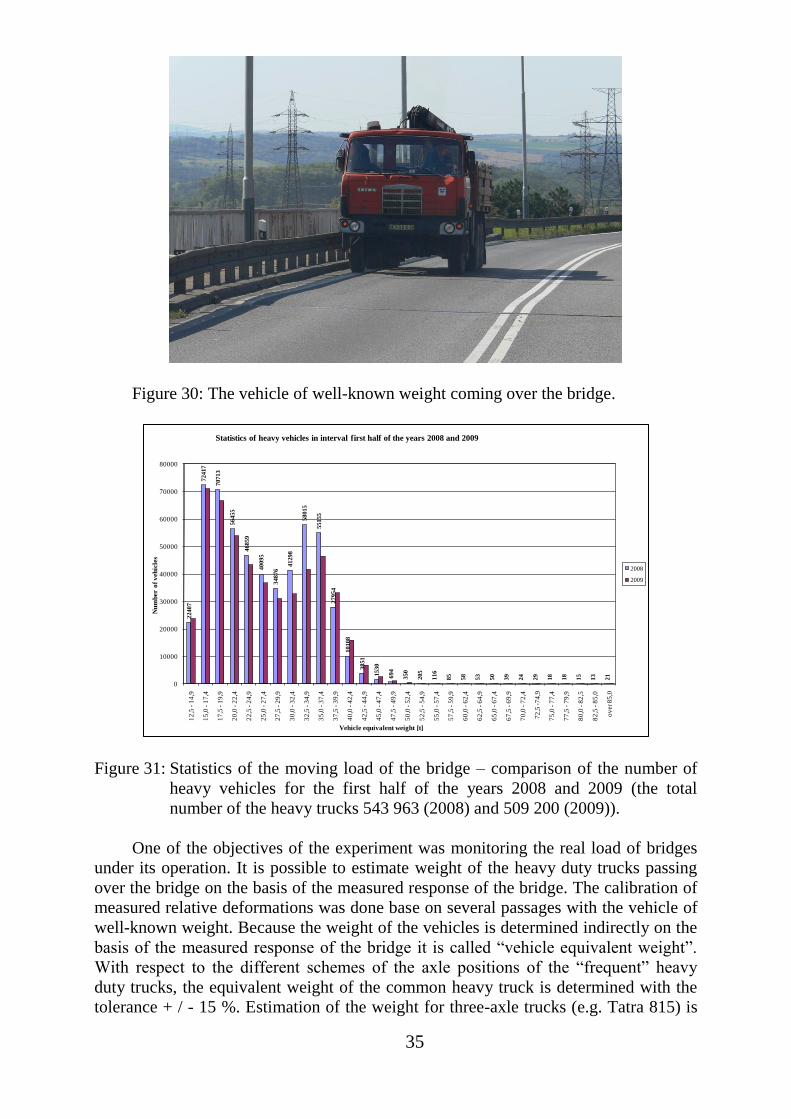
Figure 30: The vehicle of well-known weight coming over the bridge.
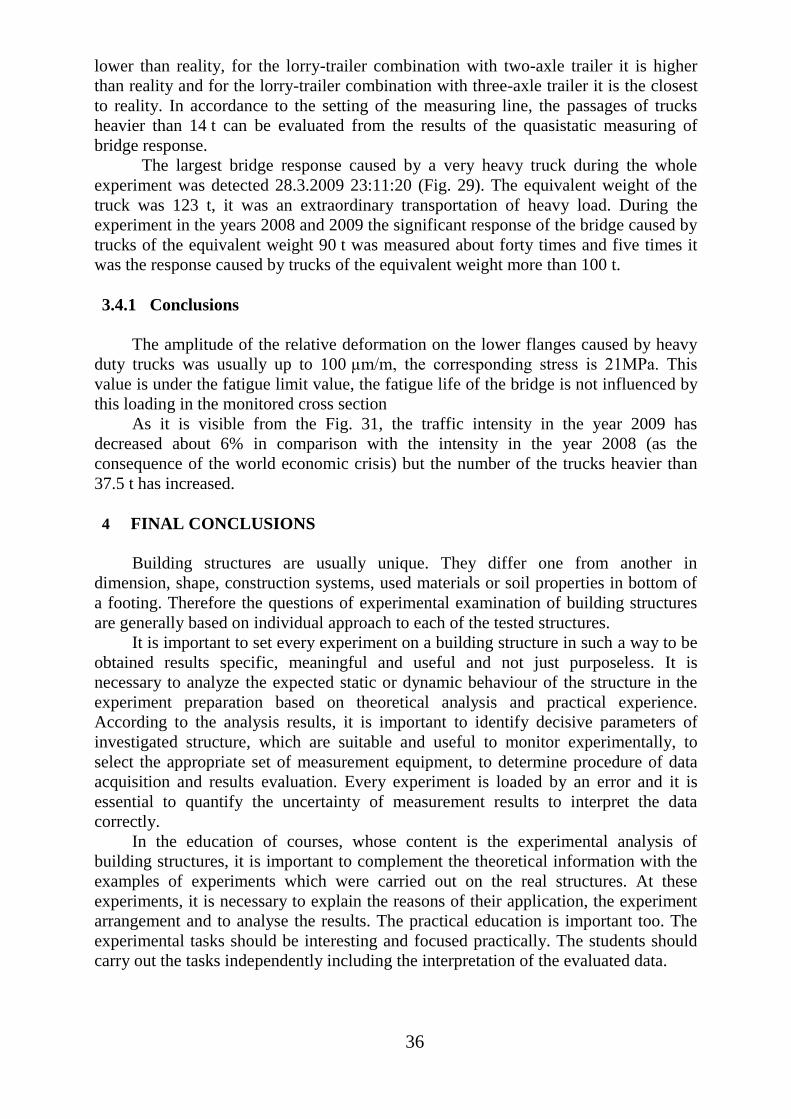
Figure 31: Statistics of the moving load of the bridge – comparison of the number of
heavy vehicles for the first half of the years 2008 and 2009 (the total
number of the heavy trucks 543 963 (2008) and 509 200 (2009)).
One of the objectives of the experiment was monitoring the real load of bridges
under its operation. It is possible to estimate weight of the heavy duty trucks passing
over the bridge on the basis of the measured response of the bridge. The calibration of
measured relative deformations was done base on several passages with the vehicle of
well-known weight. Because the weight of the vehicles is determined indirectly on the
basis of the measured response of the bridge it is called “vehicle equivalent weight”.
With respect to the different schemes of the axle positions of the “frequent” heavy
duty trucks, the equivalent weight of the common heavy truck is determined with the
tolerance + / - 15 %. Estimation of the weight for three-axle trucks (e.g. Tatra 815) is
22
40
7
72417
70
71
3
56
45
5
46
85
9
40
09
5
34876
41298
58015
55
15
5
27
95
4
10
10
8
38
51
1530
694
350
20
5
11
6
85
58
53
50
39
24
29
18
18
15
13
21
0
10000
20000
30000
40000
50000
60000
70000
80000
12
,5 -
14
,9
15
,0 -
17
,4
17
,5 -
19
,9
20
,0 -
22
,4
22
,5 -
24
,9
25
,0 -
27
,4
27
,5 -
29
,9
30
,0 -
32
,4
32
,5 -
34
,9
35
,0 -
37
,4
37
,5 -
39
,9
40
,0 -
42
,4
42
,5 -
44
,9
45
,0 -
47
,4
47
,5 -
49
,9
50
,0 -
52
,4
52
,5 -
54
,9
55
,0 -
57
,4
57
,5 -
59
,9
60
,0 -
62
,4
62
,5 -
64
,9
65
,0 -
67
,4
67
,5 -
69
,9
70
,0 -
72
,4
72
,5 -7
4,9
75
,0 -
77
,4
77
,5 -
79
,9
80
,0 -
82
,5
82
,5 -
85
,0
ov
er 8
5,0
Nu
mb
er o
f v
eh
icle
s
Vehicle equivalent weight [t]
Statistics of heavy vehicles in interval first half of the years 2008 and 2009
2008
2009
36
lower than reality, for the lorry-trailer combination with two-axle trailer it is higher
than reality and for the lorry-trailer combination with three-axle trailer it is the closest
to reality. In accordance to the setting of the measuring line, the passages of trucks
heavier than 14 t can be evaluated from the results of the quasistatic measuring of
bridge response.
The largest bridge response caused by a very heavy truck during the whole
experiment was detected 28.3.2009 23:11:20 (Fig. 29). The equivalent weight of the
truck was 123 t, it was an extraordinary transportation of heavy load. During the
experiment in the years 2008 and 2009 the significant response of the bridge caused by
trucks of the equivalent weight 90 t was measured about forty times and five times it
was the response caused by trucks of the equivalent weight more than 100 t.
3.4.1 Conclusions
The amplitude of the relative deformation on the lower flanges caused by heavy
duty trucks was usually up to 100 µm/m, the corresponding stress is 21MPa. This
value is under the fatigue limit value, the fatigue life of the bridge is not influenced by
this loading in the monitored cross section
As it is visible from the Fig. 31, the traffic intensity in the year 2009 has
decreased about 6% in comparison with the intensity in the year 2008 (as the
consequence of the world economic crisis) but the number of the trucks heavier than
37.5 t has increased.
4 FINAL CONCLUSIONS
Building structures are usually unique. They differ one from another in
dimension, shape, construction systems, used materials or soil properties in bottom of
a footing. Therefore the questions of experimental examination of building structures
are generally based on individual approach to each of the tested structures.
It is important to set every experiment on a building structure in such a way to be
obtained results specific, meaningful and useful and not just purposeless. It is
necessary to analyze the expected static or dynamic behaviour of the structure in the
experiment preparation based on theoretical analysis and practical experience.
According to the analysis results, it is important to identify decisive parameters of
investigated structure, which are suitable and useful to monitor experimentally, to
select the appropriate set of measurement equipment, to determine procedure of data
acquisition and results evaluation. Every experiment is loaded by an error and it is
essential to quantify the uncertainty of measurement results to interpret the data
correctly.
In the education of courses, whose content is the experimental analysis of
building structures, it is important to complement the theoretical information with the
examples of experiments which were carried out on the real structures. At these
experiments, it is necessary to explain the reasons of their application, the experiment
arrangement and to analyse the results. The practical education is important too. The
experimental tasks should be interesting and focused practically. The students should
carry out the tasks independently including the interpretation of the evaluated data.
37
The process of experimental analysis of dynamic behaviour of building structures
was documented in this publication on several practical examples in which the role of
dynamic experiments was important:
the identification of cable forces in the roof structure of the Administrative Centre
Amazon Court,
the detection of fatigue damage of the fully prestressed concrete slabs by using of
experimental modal analysis,
the verification and the identification of the bridge FEM models by using of
experimental modal analysis,
the experimental analysis of dynamic behaviour of three important footbridges (the
steel cable-stayed footbridge, the footbridge across the „K Barrandovu“ street in
Prague and the footbridge across the Berounka river in Prague – Radotín),
the long-time monitoring of the slab-on-girder bridge response caused by heavy
traffic.
The described experiments are especially interesting in terms of results, of
uniqueness of the tested structures or by original arrangement of the measurement
system.
Acknowledgement
Author gratefully acknowledges the support from the Czech Science Foundation (the
project No. GAČR 105/11/1529 ) and the support from the Ministry of Education,
Youth and Sports (the project No. MSM 6840770031).
Special thanks must be extended to my colleagues from the Experimental Center,
the Department of Steel and Timber Structures and the Department of Mechanics
without their help it was not possible to realize the experiments described in this
publication.
REFERENCES
[1] Toksoy, T. ,Aktan, A. E.: Bridge-condition Assessment by Modal Flexibility –
Int. Journal „Experimental Mechanics“, 34 (3), pp. 271 – 278, 1994.
[2] Maya, N.M.M. – Silva, J.M.M. et al.: Theoretical and Experimental Modal
Analysis. Research Studies Press Ltd., 1997.
[3] Plachý, T. – Samoel, J.: Theoretical research of steel railway bridges using
experimental data. Proc. of the 4th Intern. Conf. on Structural Dynamics
Eurodyn 1999, p. 687-692, ISBN: 90-5809-056-6, Millpress Science Publishers,
Rotterdam, 1999.
[4] Frýba, L.-Pirner, M.-Urushadze, S.: Localization of Damages in Concrete Structures -
Proceedings of Computational Methods and Experimental Measurements X, p. 417-
426, 2001.
[5] Dallard, B.P. – Fitzpatrick, T. – Flint, A. – Low, A. – Smith, R. R. – Willford, M.
– Roche, M.: London Millennium Bridge: Pedestrian-Induced Lateral Vibration.
Journal of Bridge Engineering, November/December 2001, p. 412 – 417, 2001.
[6] Feltrin, G., Motavalli, M.: Vibration-based Damage Detection on a Highway
Bridge - Proc. of the 1st Int. Conf. on Bridge Maintenance, Safety and
Management, 2002.
38
[7] Karásek, P. - Plachý, T. - Polák, M. – Němec, P. - Kalný, M. – Studničková, M.:
Dynamic Behaviour of a Steel Cable-stayed Footbridge Damped by TMD.
Proceedings of the 5th International Conference on Structural Dynamics Eurodyn
2005, p. 521 – 526, ISBN 90-5966-033-1, Millpress Science Publishers,
Rotterdam, 2005.
[8] Plachý, T. - Polák, M.: Damage Detection and Localization on Reinforced
Concrete Slabs Based on Modal Analysis. Proc. of 22nd Danubia-Adria
Symposium on Experimental Methods in Solid Mechanics, p. 262 - 263,
University of Parma, Parma, 2005.
[9] Kim, H. B. – Park, T.- Shin, H. Yoon, T. Y: A Comparative Study of the Tension
Estimation Methods for Cable Supported Bridges. Internation Journal of Steel
Structures, No. 7, p. 77 – 84, 2007.
[10] Polák, M. - Plachý, T. - Rotter, T. – Ryjáček, P.: Study of Dynamic Behavior of
Two Road Bridges and their Numerical Models. Proc. of the 5th Intern. Conf. on
Structural Dynamics Eurodyn 2005, p. 1669 – 1674, ISBN 90-5966-033-1,
Millpress Science Publishers, Rotterdam, 2005.
[11] Plachý, T. - Polák, M.: Fatigue Damage Identification on Concrete Structures
Using Modal Analysis. Proc. of the 3rd WSEAS Intern. Conf. on Applied and
Theoretical Mechanics, p. 191 - 196, ISBN 978-960-6766-19-0, World Scientific
and Engineering Academy and Society, Athens, 2007.
[12] Marek Foglar: Strain Development under Cyclic Loading. PhD Thesis, FCE
CTU in Prague, 2008.
[13] Polák, M. – Rotter, T. - Plachý, T.: Long-time Monitoring of Vibration on the
Slab-on-girder Bridge. Metallurgy, Vol. 49, No. 2, p. 470 - 473, ISSN 0543-
5846, Croatian Metalurgical Society, Zagreb, 2010.

39
Curriculum vitae
Name: Michal Polák
Date of birth: 30.11.1963 Prague
Education
2002 doc. (Assoc. Prof.) Czech Technical University in Prague
1995 CSc. (Ph.D.) Czech Technical University in Prague
1988 Ing. (MSc.) Czech Technical University in Prague, Faculty of Civil
Engineering (CTU FCE)
Professional positions
2002 - present Associate Professor, Department of Mechanics, CTU FCE
1990 - 2002 Assistant Professor, Department of Mechanics, CTU FCE
Teaching activities
Structural mechanics, experimental analysis of structures, structural dynamic,
dynamics of traffic structures, diagnostics of structures – bachelor, master and Ph.D.
courses
Research activities
Experimental static and dynamic analysis of structures, structural dynamics, vehicle –
bridge interaction.
Investigator and coinvestigator of 5 contracted research projects of the Czech Science
Foundation, 3 contracted research project of the Ministry of Traffic, 2 contracted
research project of the Ministry of Education, Youth and Sports, author and co-author
of practical applications of experimental and theoretical research work on site (bridges,
footbridges, engineering structures).
Other activities
Czech Society of Mechanics – member
2008 - present Deputy Manager of Quality – Accredited Testing Laboratory CTU
FCE
2008 - present Technical Manager – Specialized Laboratory No. 132, Accredited
Testing Laboratory CTU FCE
2006 - present Council of Higher Education Institutions – member delegated by
CTU FCE
40
Selected publications (2005 - 2011)
Polák, M. - Plachý, T. - Rotter, T. – Ryjáček, P.: Study of Dynamic Behavior of Two
Road Bridges and their Numerical Models. Proc. of the 5th Intern. Conf. on
Structural Dynamics Eurodyn 2005, p. 1669 – 1674, ISBN 90-5966-033-1,
Millpress Science Publishers, Rotterdam, 2005.
Plachý, T. - Polák, M. – Rezek, A.: Monitoring of Modal Characteristic Change of a
Prestressed Concrete Element in Dependence on Dynamic Fatigue Loading. 5th
ICCSM Extended Abstracts of the 5th Intern. Congress of Croatian Society of
Mechanics, p. 107 - 108, ISBN 953-96243-8-X, Croatian Society of Mechanics,
Zagreb, 2006.
Plachý, T. - Polák, M.: Fatigue Damage Identification on Concrete Structures Using
Modal Analysis. Proc. of the 3rd WSEAS Intern. Conf. on Applied and
Theoretical Mechanics, p. 191 - 196, ISBN 978-960-6766-19-0, World Scientific
and Engineering Academy and Society, Athens, 2007.
Polák, M. – Rotter, T. - Plachý, T.: The Monitoring of The Response Caused by Traffic
Load on The Concrete-steel Slab-on-girder Bridge. Book - Contributions to
numerical and experimental investigation of building materials and structures, p.
133 - 137, ISBN 978-80-01-04060-7, CTU in Prague, Prague, 2008.
Plachý, T. – Padevět, P. - Polák, M.: Comparison of Two Experimental Techniques for
Determination of Young's Modulus of Concrete Specimens. Proc. of the 5th
WSEAS Intern. Conf. on Applied and Theoretical Mechanics - RECENT
ADVANCES IN APPLIED AND THEORETICAL MECHANICS, p. 68 - 71,
ISBN 978-960-474-140-3, WSEAS Press, Athens, 2009.
Polák, M. – Plachý, T. – Rotter, T.: Vibration Monitoring of the Bridge Loaded by
Heavy Vehicle Traffic. Proceedings of the 5th WSEAS International Conference
on Applied and Theoretical Mechanics - RECENT ADVANCES IN APPLIED
AND THEORETICAL MECHANICS, p. 120 - 123, ISBN 978-960-474-140-3,
WSEAS Press, Athens, 2009.
Polák, M. – Plachý, T.: Long-Time Monitoring of Thermal Actions on a Prestressed
Concrete Bridge Structure. Proc. of 48th Intern. Conf. Experimental Stress
Analysis 2010, p. 369 - 376, ISBN 978-80-244-2533-7, Univerzita Palackého
Olomouc, Olomouc, 2010.
Plachý, T. – Padevět, P. - Polák, M.: Dynamic Young's Modulus Evaluation of
Concrete Specimens. Metallurgy, Vol. 49, No. 2, p. 461 - 464, ISSN 0543-5846,
Croatian Metalurgical Society, Zagreb, 2010.
Plachý, T. – Tesárek, P. - Padevět, P. - Polák, M.: Comparison of Static and Dynamic
Young's Modulus of Gypsum Blocks. Metallurgy, Vol. 49, No. 2, p. 465 - 469,
ISSN 0543-5846, Croatian Metalurgical Society, Zagreb, 2010.
Polák, M. – Rotter, T. - Plachý, T.: Long-time Monitoring of Vibration on the Slab-on-
girder Bridge. Metallurgy, Vol. 49, No. 2, p. 470 - 473, ISSN 0543-5846,
Croatian Metalurgical Society, Zagreb, 2010.
Máca, J. – Fajman, P. - Polák, M.: Measurements of Forces in Cable Membrane
Structures. Proc. of the Second Intern. Conf. on Soft Computing Technology in
Civil, Structural and Environmental Engineering, ISBN 978-1-905088-50-8, p.
163-164, Civil-Comp Press, Edinburgh, 2011.