Embed Size (px)
Citation preview

Correspondence*: Mondastri Korib Sudaryo, Department of Epidemiology, Faculty of Public Health, Universitas Indonesia, Indonesia, E-mail: [email protected], Phone: +62 8128305236
Das et al. Kesmas: Jurnal Kesehatan Masyarakat Nasional (National Public Health Journal). 2021; 16 (Special Issue 1): 17-22.DOI: 10.21109/kesmas.v0i0.5074
IntroductionSevere acute respiratory syndrome coronavirus 2
(SARS-CoV-2) is the causative agent of the recent COVID-19. In late December 2019, the first infection of SARS-CoV-2 was identified in Wuhan, Hubei Province, China, after the Wuhan Municipal Health Commission reported a cluster of pneumonia-like symptoms cases.1
On January 30, 2020, after an upsurge of COVID-19 cases in countries outside China, the World Health Organization (WHO) declared the SARS-COV-2 outbreak a Public Health Emergency of International Concern (PHEIC). On March 11, 2020, WHO characterized COVID-19 as a global pandemic, opening the gate to the worldwide community and governments working together to fight the disease.2
Southeast Asian countries, namely Thailand, the Philippines, Singapore, Cambodia, Vietnam, and Malaysia, reported index cases in January 2020 and were classified as the first region to be affected by the pandemic.3 Indonesia, as the most populous country in the region, reported its first two cases on March 2, 2020 much
Epidemiological Patterns and Spatial Distribution of COVID-19 Cases in DKI Jakarta (March–December 2020)
Rajesh Kumar Das1,2, Mondastri Korib Sudaryo3*
1Department of Microbiology, Kathmandu College of Science and Technology, Tribhuvan University, Nepal2Magister Study Program of Epidemiology, Department of Epidemiology, Faculty of Public Health, Universitas Indonesia 3Department of Epidemiology, Faculty of Public Health, Universitas Indonesia
Abstract
Severe acute respiratory syndrome coronavirus 2 (SARS-Cov-2) is the causative agent of COVID-19 that began in Wuhan, Hubei Province, China. In Indonesia, the first two cases were reported on March 2, 2020; the first major response to block transmission of the virus was the declaration of large-scale social restrictions (LSSR) or Pembatasan Sosial Berskala Besar (PSBB). This study aimed to identify the epidemiology patterns and spatial distribution of the COVID-19 pandemic in five municipalities of DKI Jakarta. The research design comprised an ecological and case-series study uncovering the epidemiological trends and distribution of COVID-19 in DKI Jakarta based on secondary surveillance data. The results from the data analyzed between March-December 2020 showed an increasing epidemiological trend due to COVID-19, and Central Jakarta was the municipality most affected due to pandemic during this period. The implementation of the first PSBB in DKI Jakarta reduced the average number of daily cases during the first month, although the decrease was not statistically significant. There was a spatial autocorrelation of COVID-19 with the neighboring urban villages. There were fifteen COVID-19 hotspots all over DKI Jakarta based on the data analyzed in December 2020.
Keywords: COVID-19, DKI Jakarta, epidemiological surveillance, pembatasan sosial berskala besar, spatial analysis
later than its neighboring countries. Delayed response and poor contact tracing were cited as reasons for the late reporting of cases.4 As of December 2020, the government had declared 664,930 confirmed cases in all 34 provinces across Indonesia, with 19,880 deaths.5
On April 10, 2020, the provincial government applied large-scale social restrictions (Pembatasan Sosial Berskala Besar or PSBB) in DKI Jakarta, around one month after the first case of COVID-19 was reported in Jakarta. Social distancing, as the first response taken by the government, was the action most preferred by the local government to reduce the spread of COVID-19. The regulation entailed the mandatory closure of schools and public facilities such as malls, reduced capacity at restaurants, a ban on international flights, and restrictions on many other locations where people may congregate.6
The COVID-19 pandemic severely affected the health system in DKI Jakarta,7, as the Provincial Health Authorities fought hard to deal with the growing number
Received : June 8, 2021 Accepted : July 13, 2021 Published : July 31, 2021
Copyright @ 2021, Kesmas: Jurnal Kesehatan Masyarakat Nasional (National Public Health Journal), p-ISSN: 1907-7505, e-ISSN: 2460-0601, SINTA-S1 accredited,http://journal.fkm.ui.ac.id/kesmas, Licensed under Creative Commons Attribution-ShareAlike 4.0 International
Kesmas: Jurnal Kesehatan Masyarakat Nasional(National Public Health Journal)
18
reproduction number, which provided theimplementation method(http://tools.epidemiology.net/EpiEstim.xls).
ResultsThere is an upward trend of COVID-19 in DKI
Jakarta. The minimum age of the patient was below oneyear, and the maximum age was as much as 102 years.The mean age of the infected cases was 37.7 years. Thevariation of data with gender, age, and status of thepatient has been illustrated below.
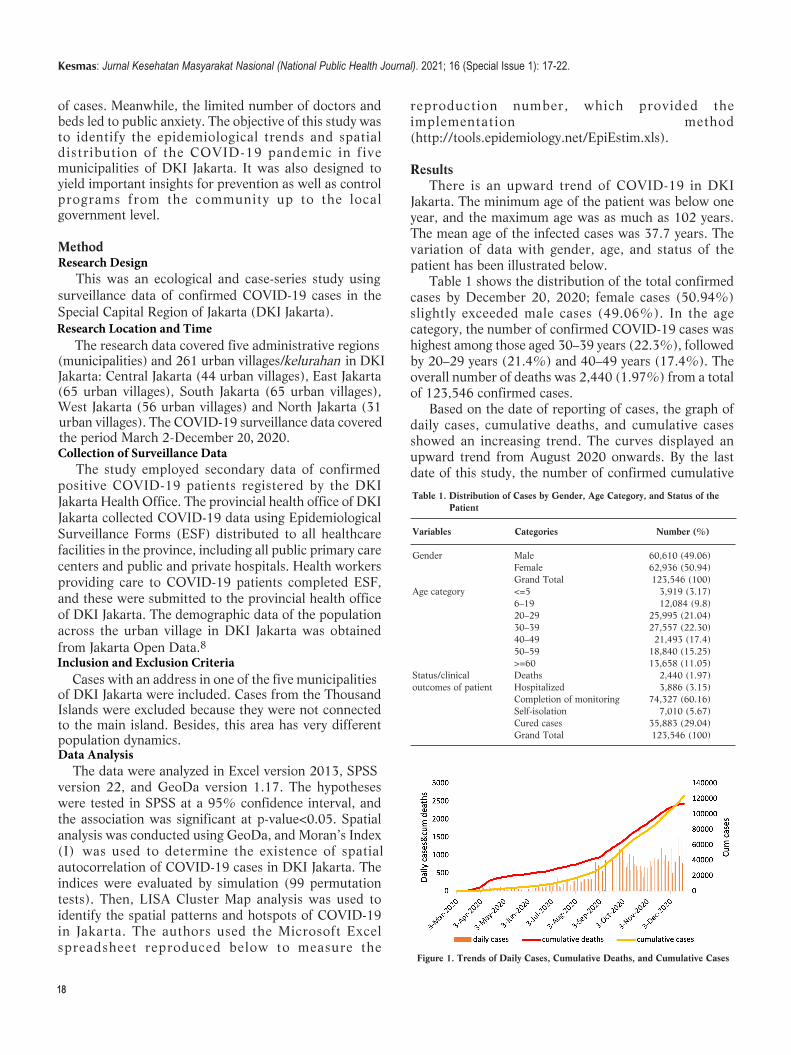
Table 1 shows the distribution of the total confirmedcases by December 20, 2020; female cases (50.94%)slightly exceeded male cases (49.06%). In the agecategory, the number of confirmed COVID-19 cases washighest among those aged 30–39 years (22.3%), followedby 20–29 years (21.4%) and 40–49 years (17.4%). Theoverall number of deaths was 2,440 (1.97%) from a totalof 123,546 confirmed cases.
Based on the date of reporting of cases, the graph ofdaily cases, cumulative deaths, and cumulative casesshowed an increasing trend. The curves displayed anupward trend from August 2020 onwards. By the lastdate of this study, the number of confirmed cumulative
of cases. Meanwhile, the limited number of doctors and beds led to public anxiety. The objective of this study was to identify the epidemiological trends and spatial distribution of the COVID-19 pandemic in five municipalities of DKI Jakarta. It was also designed to yield important insights for prevention as well as control programs from the community up to the local government level.
MethodResearch Design This was an ecological and case-series study using surveillance data of confirmed COVID-19 cases in the Special Capital Region of Jakarta (DKI Jakarta). Research Location and Time The research data covered five administrative regions (municipalities) and 261 urban villages/kelurahan in DKI Jakarta: Central Jakarta (44 urban villages), East Jakarta (65 urban villages), South Jakarta (65 urban villages), West Jakarta (56 urban villages) and North Jakarta (31 urban villages). The COVID-19 surveillance data covered the period March 2-December 20, 2020.Collection of Surveillance Data The study employed secondary data of confirmed positive COVID-19 patients registered by the DKI Jakarta Health Office. The provincial health office of DKI Jakarta collected COVID-19 data using Epidemiological Surveillance Forms (ESF) distributed to all healthcare facilities in the province, including all public primary care centers and public and private hospitals. Health workers providing care to COVID-19 patients completed ESF, and these were submitted to the provincial health office of DKI Jakarta. The demographic data of the population across the urban village in DKI Jakarta was obtained from Jakarta Open Data.8Inclusion and Exclusion Criteria Cases with an address in one of the five municipalities of DKI Jakarta were included. Cases from the Thousand Islands were excluded because they were not connected to the main island. Besides, this area has very different population dynamics.Data Analysis The data were analyzed in Excel version 2013, SPSS version 22, and GeoDa version 1.17. The hypotheses were tested in SPSS at a 95% confidence interval, and the association was significant at p-value<0.05. Spatial analysis was conducted using GeoDa, and Moran’s Index (I) was used to determine the existence of spatialautocorrelation of COVID-19 cases in DKI Jakarta. Theindices were evaluated by simulation (99 permutationtests). Then, LISA Cluster Map analysis was used toidentify the spatial patterns and hotspots of COVID-19in Jakarta. The authors used the Microsoft Excelspreadsheet reproduced below to measure the
Table 1. Distribution of Cases by Gender, Age Category, and Status of the Patient
Variables Categories Number (%)
Gender Male 60,610 (49.06)Female 62,936 (50.94)Grand Total 123,546 (100)
Age category <=5 3,919 (3.17)6–19 12,084 (9.8)20–29 25,995 (21.04)30–39 27,557 (22.30)40–49 21,493 (17.4)50–59 18,840 (15.25)>=60 13,658 (11.05)
Status/clinical Deaths 2,440 (1.97)outcomes of patient Hospitalized 3,886 (3.15)
Completion of monitoring 74,327 (60.16)Self-isolation 7,010 (5.67)Cured cases 35,883 (29.04)Grand Total 123,546 (100)
Figure 1. Trends of Daily Cases, Cumulative Deaths, and Cumulative Cases
Kesmas: Jurnal Kesehatan Masyarakat Nasional (National Public Health Journal). 2021; 16 (Special Issue 1): 17-22.

19
cases in the five municipalities of DKI Jakarta stood at more than 120,000.
The curve for the daily reproduction number or R (given in supplementary Figure 1) displayed a highly fluctuating trend over the study period. During the first ten days, the epidemic curve was characterized by high incidence. Then, R decreased, from an initial median value of 2.2 in the first week to 1.0 in the third week, before fluctuating continuously around 0.8 and 1.2 until the final day. The curve then resumed an upward trend over the closing seven days.
Table 2 shows that Central Jakarta had the highest mean incidence rate (17.66/1000), mean mortality rate, 0.38/1000 (0.038%), and case fatality rate, 23.30/1000 (2.33%). North Jakarta recorded the lowest rates for all indicators and seemed to be relatively less affected by the pandemic. In the normality test, the distribution of the mortality rate, incidence rate, and the case fatality rate was not normal. A nonparametric test using the Mann-Whitney U test was conducted to discern the association between the municipalities regarding their mortality rate, incidence rate, and case fatality rate. Central Jakarta and South Jakarta significantly associated with other municipalities in terms of incidence rate, mortality rate, and case fatality rate (p-value<0.05).
In Jakarta, PSBB was declared on April 10, 2020, resulting in the daily increase in COVID-19 cases pre-
PSBB was assessed from March 2 to April 9, 2020. While the post-PSBB assessment took place from April 10 to May 13, 2020, with an equal duration of 34 days. In the normality test, the distribution of cases before and after PSBB was normal. Therefore, the association was analyzed using an independent samples t-test at a 95%confidence interval.
The average differences in daily cases before and after PSBB were 4.29 and -0.62, respectively. While the negative average value of the difference in daily cases post-PSBB showed a slightly decreasing trend, the statistical test showed no significant association between the difference in daily confirmed COVID-19 cases before
Table 2. Mean Mortality Rate, Incidence Rate, and Case Fatality Rate
Municipalities Population Incidence Deaths Cum. Incidence Mean Mortality CFRcases per 1000 rate per 1000 per 1000
West Jakarta 2,505,315 25,202 537 10.99 0.23 21.31SD 3.87 0.12 9.02Central Jakarta 1,127,593 17,174 386 17.66 0.38 23.30SD 13.25 0.16 7.43South Jakarta 2,309,643 26,772 480 14.34 0.23 17.80SD 9.81 0.14 8.95East Jakarta 3,146,725 33,514 647 11.14 0.21 19.06SD 2.64 0.09 7.40North Jakarta 1,797,871 18,492 354 10.52 0.20 18.65SD 2.72 0.09 6.34Total 10,887,147 121,154 2,404 12.94 0.25 19.95SD 8.07 0.14 8.26Missing Information - *2,392 *463 - - -
Notes: SD = Standard Deviation, Missing information rate = 10.16%
Table 3. Differences in Daily Cases Before and After PSBB
PSBB Independent t-test for Equality of Means
Mean SD Standard Error Mean Std. Error 95% CI p-valueMean Difference Difference
Lower Upper
Difference in daily cases 4.29 24.46 4.2before PSBB 4.91 8.11 -11.35 21.17 0.55Difference in daily cases -0.62 40.48 6.9after PSBB
Notes: SD = Standard Deviation
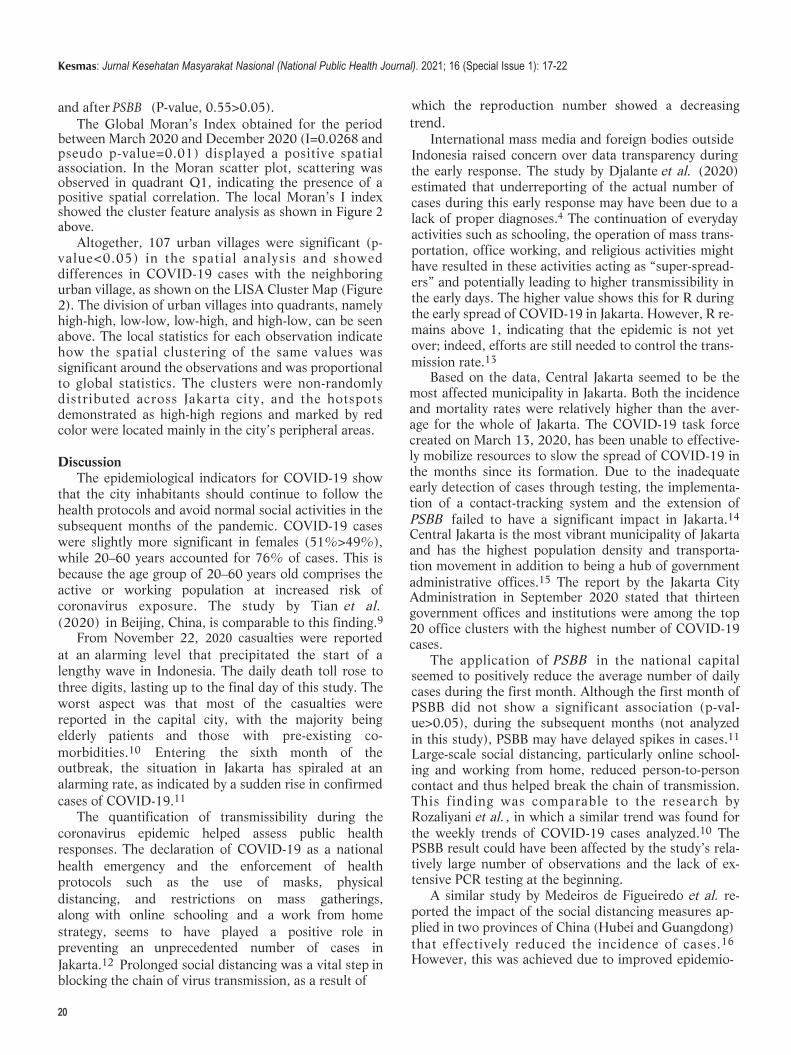
Figure 2. LISA Cluster Map of DKI Jakarta
Das et al., Epidemiological Patterns and Spatial Distribution of COVID-19 Cases in DKI Jakarta (March–December 2020)
20
which the reproduction number showed a decreasing trend.
International mass media and foreign bodies outside Indonesia raised concern over data transparency during the early response. The study by Djalante et al. (2020) estimated that underreporting of the actual number of cases during this early response may have been due to a lack of proper diagnoses.4 The continuation of everyday activities such as schooling, the operation of mass trans-portation, office working, and religious activities might have resulted in these activities acting as “super-spread-ers” and potentially leading to higher transmissibility in the early days. The higher value shows this for R during the early spread of COVID-19 in Jakarta. However, R re-mains above 1, indicating that the epidemic is not yet over; indeed, efforts are still needed to control the trans-mission rate.13
Based on the data, Central Jakarta seemed to be the most affected municipality in Jakarta. Both the incidence and mortality rates were relatively higher than the aver-age for the whole of Jakarta. The COVID-19 task force created on March 13, 2020, has been unable to effective-ly mobilize resources to slow the spread of COVID-19 in the months since its formation. Due to the inadequate early detection of cases through testing, the implementa-tion of a contact-tracking system and the extension of PSBB failed to have a significant impact in Jakarta.14
Central Jakarta is the most vibrant municipality of Jakarta and has the highest population density and transporta-tion movement in addition to being a hub of government administrative offices.15 The report by the Jakarta City Administration in September 2020 stated that thirteen government offices and institutions were among the top 20 office clusters with the highest number of COVID-19 cases.
The application of PSBB in the national capital seemed to positively reduce the average number of daily cases during the first month. Although the first month of PSBB did not show a significant association (p-val-ue>0.05), during the subsequent months (not analyzed in this study), PSBB may have delayed spikes in cases.11
Large-scale social distancing, particularly online school-ing and working from home, reduced person-to-person contact and thus helped break the chain of transmission. This finding was comparable to the research by Rozaliyani et al. , in which a similar trend was found for the weekly trends of COVID-19 cases analyzed.10 The PSBB result could have been affected by the study’s rela-tively large number of observations and the lack of ex-tensive PCR testing at the beginning.
A similar study by Medeiros de Figueiredo et al. re-ported the impact of the social distancing measures ap-plied in two provinces of China (Hubei and Guangdong) that effectively reduced the incidence of cases.16
However, this was achieved due to improved epidemio-
and after PSBB (P-value, 0.55>0.05). The Global Moran’s Index obtained for the period
between March 2020 and December 2020 (I=0.0268 and pseudo p-value=0.01) displayed a positive spatial association. In the Moran scatter plot, scattering was observed in quadrant Q1, indicating the presence of a positive spatial correlation. The local Moran’s I index showed the cluster feature analysis as shown in Figure 2 above.
Altogether, 107 urban villages were significant (p-value<0.05) in the spatial analysis and showed differences in COVID-19 cases with the neighboring urban village, as shown on the LISA Cluster Map (Figure 2). The division of urban villages into quadrants, namely high-high, low-low, low-high, and high-low, can be seen above. The local statistics for each observation indicate how the spatial clustering of the same values was significant around the observations and was proportional to global statistics. The clusters were non-randomly distributed across Jakarta city, and the hotspots demonstrated as high-high regions and marked by red color were located mainly in the city’s peripheral areas.
DiscussionThe epidemiological indicators for COVID-19 show
that the city inhabitants should continue to follow the health protocols and avoid normal social activities in the subsequent months of the pandemic. COVID-19 cases were slightly more significant in females (51%>49%), while 20–60 years accounted for 76% of cases. This is because the age group of 20–60 years old comprises the active or working population at increased risk of coronavirus exposure. The study by Tian et al. (2020) in Beijing, China, is comparable to this finding.9
From November 22, 2020 casualties were reported at an alarming level that precipitated the start of a lengthy wave in Indonesia. The daily death toll rose to three digits, lasting up to the final day of this study. The worst aspect was that most of the casualties were reported in the capital city, with the majority being elderly patients and those with pre-existing co-morbidities.10 Entering the sixth month of the outbreak, the situation in Jakarta has spiraled at an alarming rate, as indicated by a sudden rise in confirmed cases of COVID-19.11
The quantification of transmissibility during the coronavirus epidemic helped assess public health responses. The declaration of COVID-19 as a national health emergency and the enforcement of health protocols such as the use of masks, physical distancing, and restrictions on mass gatherings, along with online schooling and a work from home strategy, seems to have played a positive role in preventing an unprecedented number of cases in Jakarta.12 Prolonged social distancing was a vital step in blocking the chain of virus transmission, as a result of
Kesmas: Jurnal Kesehatan Masyarakat Nasional (National Public Health Journal). 2021; 16 (Special Issue 1): 17-22
21
logical surveillance and effective social isolation strate-gies, which was contrary to the situation in DKI Jakarta Province. Another study by Oraby et al. revealed that correctly timing lockdowns could help avoid a peak and prevent hospital capacity from being exceeded by the pandemic caseload.17
In June 2020, Indonesia entered a “new normal” peri-od when certain restrictions were lifted. During this time, the COVID-19 burden increased across Indonesia, and community transmission was evident across the six provinces of Java. PSBB was subsequently re-imposed in Jakarta in mid-September for four weeks in response to pressures on healthcare facilities across the city.11
Unfortunately, cases and deaths due to coronavirus-2 continued to rise, and vaccination was considered the long-term solution for fighting the virus. However, un-certainty and limitations arose regarding the efficacy of the vaccine, the length of immunity provided, availability, coverage, vaccine vitality, the cold chain, and coverage at the full dose needed to reach immunity.18 Thus, health protocols, combined with effective quarantine and isola-tion, were the principal and most effective interventions that were followed strictly and continuously in an effort to combat the virus, along with vaccination.
The distribution of COVID-19 cases did not occur randomly but was instead determined by the connected neighboring urban villages. A total of 15 hotspots were identified in Jakarta during the study period of the epi-demic. Interestingly, the five municipalities of DKI Jakarta are densely populated and relatively well connect-ed. Furthermore, several regions of Jakarta are connected to neighboring satellite cities such as Bogor, Depok, Tangerang, and Bekasi. Many of the people who live in these satellite cities work in Jakarta. The big manufactur-ing companies and factories are mostly located in Bekasi and Tangerang, meaning people frequently travel to and from these cities to Jakarta. Eventually, there would be more person-to-person contact, leading to human-to-hu-man transmission.19 Several studies have suggested the common role of family clusters in developing the ongoing epidemic. A recent study in the UK estimated that con-tact within households was responsible for roughly 70%of SARS-CoV-2 transmission when widespread commu-nity control measures were in place.20,21
This study has several limitations. The very high vol-ume of missing data could have led to potential bias. There was a delay in the reporting of data; for example, data were not reported promptly after symptom onset, resulting in inconsistency and unnatural fluctuation of the curve. In terms of evaluating the effectiveness of PS-BB, an assessment of other indicators such as people’s mobility, social activities, the use of face masks, hand washing, and so forth may provide better results. However, data for these indicators were not available.
ConclusionFrom March to December 2020, the incidence,
mortality, and case-fatality rates in DKI Jakarta all showed an increasing trend. Central Jakarta seems to have been more severely affected by COVID-19 compared to other municipalities. The implementation of first PSBB in DKI Jakarta reduced the average number of daily cases during the first month, although the decrease was not statistically significant. Spatial analysis (LISA) revealed that cases did not occur randomly but were rather determined by neighboring urban villages connected, and altogether 15 COVID-19 hotspots were identified in DKI Jakarta.
Implications of the StudyThis research recommends a review of the PSBB mod-
el by the health authority and local government with the aim of making it more effective. The provincial govern-ment can apply specific preventative measures in high-risk zones, including stricter implementation of physical distancing and an extension of online schooling. This study may be helpful to the scientific community in fur-ther research that employs a better study design. This may include cohort studies to view changes in the epi-demiological trend of the disease over time.
RecommendationThe use of complete data or data with less missing in-
formation would produce better results. A consideration of socio-economic factors at the time of the pandemic would further demonstrate the health impacts on the population.
AbbreviationsDKI Jakarta: Daerah Khusus Ibukota Jakarta or Special Capital Region of Jakarta; PCR: Polymerase Chain Reaction; PSBB: Pembatasan Sosial Berskala Besar or large-scale social restrictions; ESF: Epidemiological Surveillance Forms; LISA: Local Indicator Spatial Analysis.
Ethics Approval and Consent to ParticipateThe ethical committee approved the Faculty of Public Health, the
Universitas Indonesia, with the number Ket-50/
UN2.F10.D11/PPM.00.02/2021. The study used secondary data, so no
consent was given required from the participant.
Competing InterestThe authors declare no conflict of interest.
Availability of Data and Materials
The data was provided by Provincial Health Office, DKI Jakarta after submitting an official letter for research obtained from the Department of Epidemiology, University of Indonesia.
Authors’ ContributionRKD and MKS contributed to designing the study and analysis of the data. RK drafted the final manuscript, and MK read and approved it.
Das et al., Epidemiological Patterns and Spatial Distribution of COVID-19 Cases in DKI Jakarta (March–December 2020)

22
AcknowledgmentThe authors thank all the stakeholders who are fighting against theCOVID-19 pandemic. The authors especially thank the DKI JakartaProvincial Health Office and its all in charge officers involved in thesurveillance and control of COVID-19 in Jakarta.
References1. Kang D, Choi H, Kim JH, Choi J. Spatial epidemic dynamics of the
COVID-19 outbreak in China. Int J Infect Dis. 2020;94:96–102.
2. Acter T, et al. Evolution of severe acute respiratory syndrome coronavirus 2 (SARS-CoV-2) as coronavirus disease 2019 (COVID-
19) pandemic: a global health emergency. Sci Total Environ.
2020;730:138996.
3. Center for Strategic & International Studies. Southeast Asia
COVID-19 tracker; 2021.4. Djalante R, et al. Review and analysis of current responses to
COVID-19 in Indonesia: period of January to March 2020. Prog
Disaster Sci. 2020;6:100091.
5. Ministry of Health, Indonesia. COVID Indonesia Health
Ministry.docx.pdf; 2020.
6. Aldila D, Khoshnaw SHA, Safitri E, Rais YA. Mathematical study on the spread of COVID-19 considering social distancing and rapid assessment: the case of Jakarta, Indonesia. Nonlinear Sci
Nonequilibrium Complex Phenom; 2020.
7. Surendra H, et al. Clinical characteristics and mortality associated with COVID-19 in Jakarta, Indonesia: a hospital-based retrospective
cohort study. National Library of Medicine. 2019;53: 1689–1699.
8. Department of Population and Civil Registration. Data jumlah penduduk Provinsi DKI Jakarta berdasarkan kelompok usia dan jenis
kelamin; 2020.
9. Tian S, et al. Characteristics of COVID-19 infection in Beijing. J. Infect. 2020;80: 401–406.
10. Rozaliyani A, et al. Factors associated with death in COVID-19 patients in Jakarta, Indonesia: an epidemiological study. Acta Med
Indones. 2020;52:246–254.
11. Sagala S, et al. COVID-19 in Indonesia: an analysis of DKI Jakarta’s
COVID-19 pandemic response and its governance during the new
normal period. Atlantis Press. 2021;514: 185–191.
12. Shim E, Tariq A, Chowell G. Spatial variability in reproduction
number and doubling time across two waves of the COVID-19
pandemic in South Korea, February to July, 2020. Int J Infect Dis.
2021;102:1–9.
13. Cori A, Ferguson NM, Fraser C, Cauchemez S. A new framework and
software to estimate time-varying reproduction numbers during
epidemics. Am J Epidemiol. 2013;178:1505–1512.
14. Olivia S, Gibson J, Nasrudin R. Indonesia in the time of COVID-19.
Bull Indones Econ Stud. 2020;56:143–174.
15. Putri, RF, Wibirama S, Sukamdi, Giyarsih SR. Population condition
analysis of Jakarta land deformation area. IOP Conf Ser Earth Environ
Sci. 2018;148.
16. Medeiros de Figueiredo A, Daponte Codina A, Moreira Marculino
Figueirredo D, Saez M, Cabrera Leon A. Impact of lockdown on
COVID-19 incidence and mortality in China: an interrupted time
series study. Bull World Heal Organ. 2020:1–18.
17. Oraby T, et al. Modeling the effect of lockdown timing as a COVID-19
control measure in countries with differing social contacts. Sci Rep.
2020;11:1–13.
18. Chen Z, Zhang L. Meet the challenges of mass vaccination against
COVID-19. Explor Res Hypothesis Med. 2021;000:1–3.
19. Eryando T, Sipahutar T, Rahardiantoro S. The risk distribution of
COVID-19 in Indonesia: a spatial analysis. Asia-Pacific J. Public Heal.
2020;32:450–452.
20. Haroon S, Chandan JS, Middleton J, Cheng KK. COVID-19: breaking
the chain of household transmission. BMJ. 2020;370:1–2.
21. Shen M, et al. Assessing the effects of metropolitan-wide quarantine
on the spread of COVID-19 in public space and households. Int J
Infect Dis. 2020;96:503–505.
Kesmas: Jurnal Kesehatan Masyarakat Nasional (National Public Health Journal). 2021; 16 (Special Issue 1): 17-22