Embed Size (px)
Citation preview
Center for Learning & DevelopmentAmerican University of Science & TechnologyBeirut – Ashrafieh – Alfred Naccache Avenue
Phone: 961 1 218716/7 Ext. 333Website: www.aust.edu.lb
In partnership with
Data Science and Big Data
2018 Post Graduate Masters Program
Joint Certificate ProgramData Science Academy
Data Science Academy
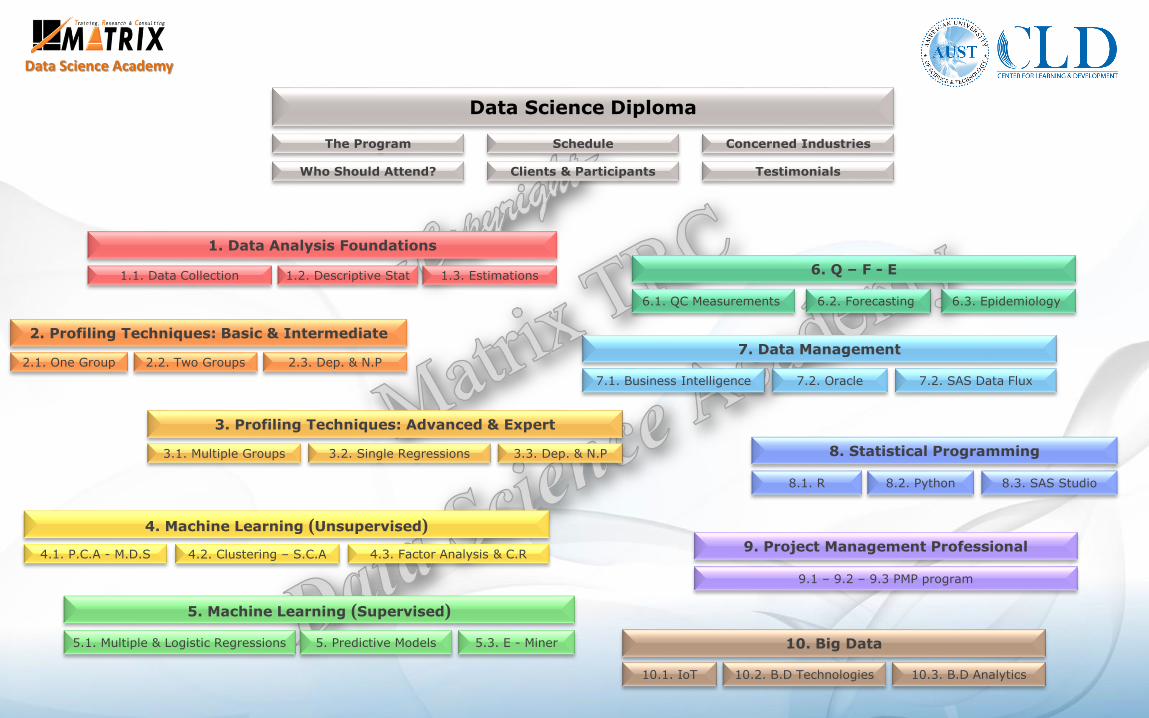
Data Science Diploma
6. Q – F - E
5. Machine Learning (Supervised)
4. Machine Learning (Unsupervised)
1. Data Analysis Foundations
9. Project Management Professional
8. Statistical Programming
2. Profiling Techniques: Basic & Intermediate7. Data Management
10. Big Data
3. Profiling Techniques: Advanced & Expert
1.1. Data Collection 1.2. Descriptive Stat 1.3. Estimations
2.1. One Group 2.2. Two Groups 2.3. Dep. & N.P
3.1. Multiple Groups 3.2. Single Regressions 3.3. Dep. & N.P
4.1. P.C.A - M.D.S 4.2. Clustering – S.C.A
9.1 – 9.2 – 9.3 PMP program
8.1. R 8.2. Python 8.3. SAS Studio
6.1. QC Measurements 6.2. Forecasting 6.3. Epidemiology
10.1. IoT 10.2. B.D Technologies 10.3. B.D Analytics
7.1. Business Intelligence 7.2. Oracle
5.1. Multiple & Logistic Regressions 5. Predictive Models 5.3. E - Miner
4.3. Factor Analysis & C.R
The Program Concerned Industries
Who Should Attend? Clients & Participants Testimonials
Schedule
7.2. SAS Data Flux
Data Science Academy
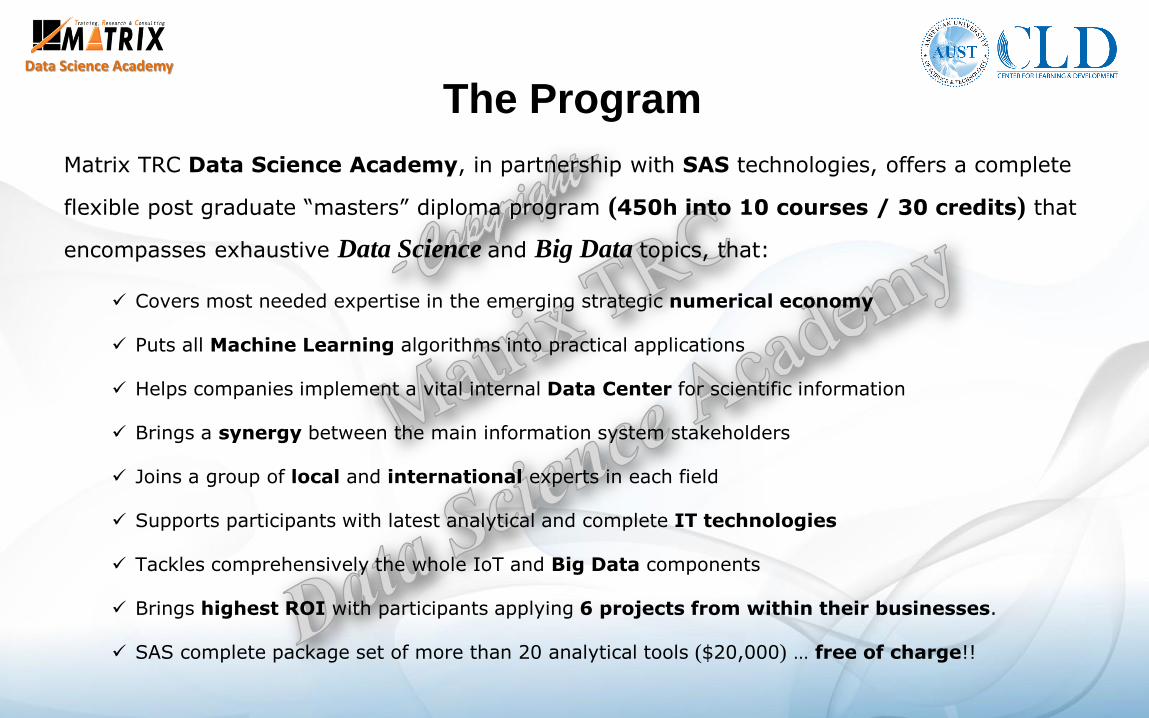
Matrix TRC Data Science Academy, in partnership with SAS technologies, offers a complete
flexible post graduate “masters” diploma program (450h into 10 courses / 30 credits) that
encompasses exhaustive Data Science and Big Data topics, that:
Covers most needed expertise in the emerging strategic numerical economy
Puts all Machine Learning algorithms into practical applications
Helps companies implement a vital internal Data Center for scientific information
Brings a synergy between the main information system stakeholders
Joins a group of local and international experts in each field
Supports participants with latest analytical and complete IT technologies
Tackles comprehensively the whole IoT and Big Data components
Brings highest ROI with participants applying 6 projects from within their businesses.
SAS complete package set of more than 20 analytical tools ($20,000) … free of charge!!
The Program
Data Science Academy
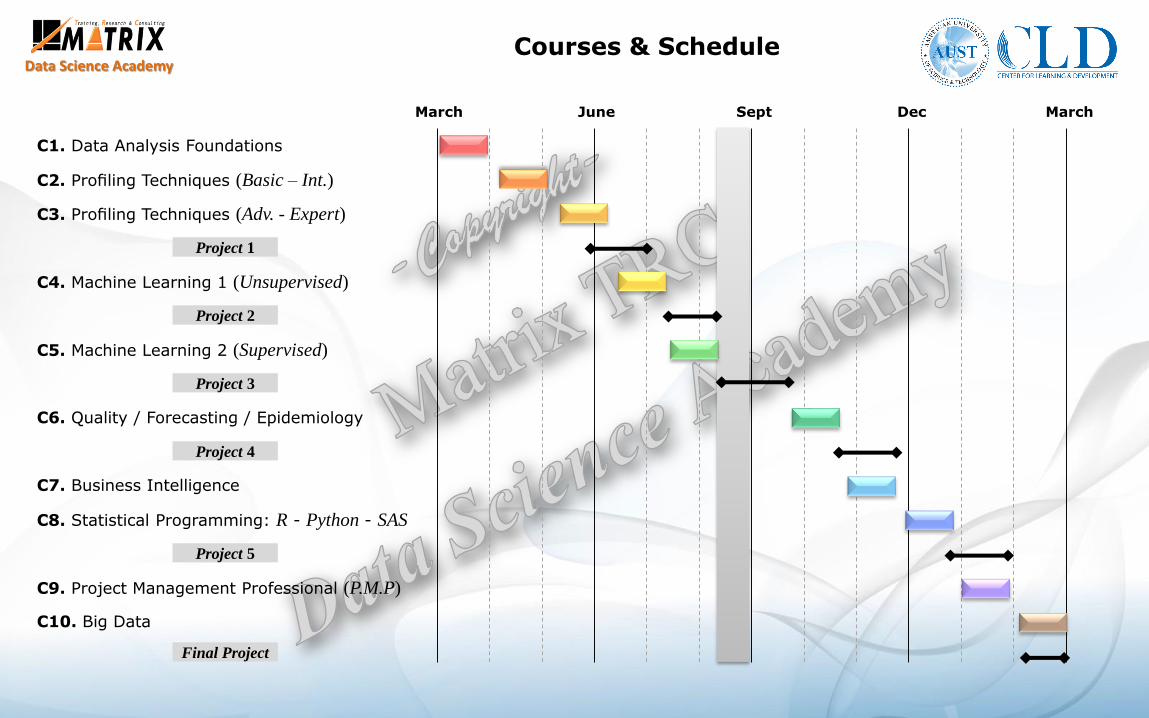
C1. Data Analysis Foundations
C6. Quality / Forecasting / Epidemiology
C2. Profiling Techniques (Basic – Int.)
C3. Profiling Techniques (Adv. - Expert)
C7. Business Intelligence
C5. Machine Learning 2 (Supervised)
C9. Project Management Professional (P.M.P)
C8. Statistical Programming: R - Python - SAS
C10. Big Data
Courses & Schedule
Project 1
Project 5
C4. Machine Learning 1 (Unsupervised)
Project 2
MarchDecSeptJuneMarch
Project 3
Project 4
Final Project
Data Science Academy
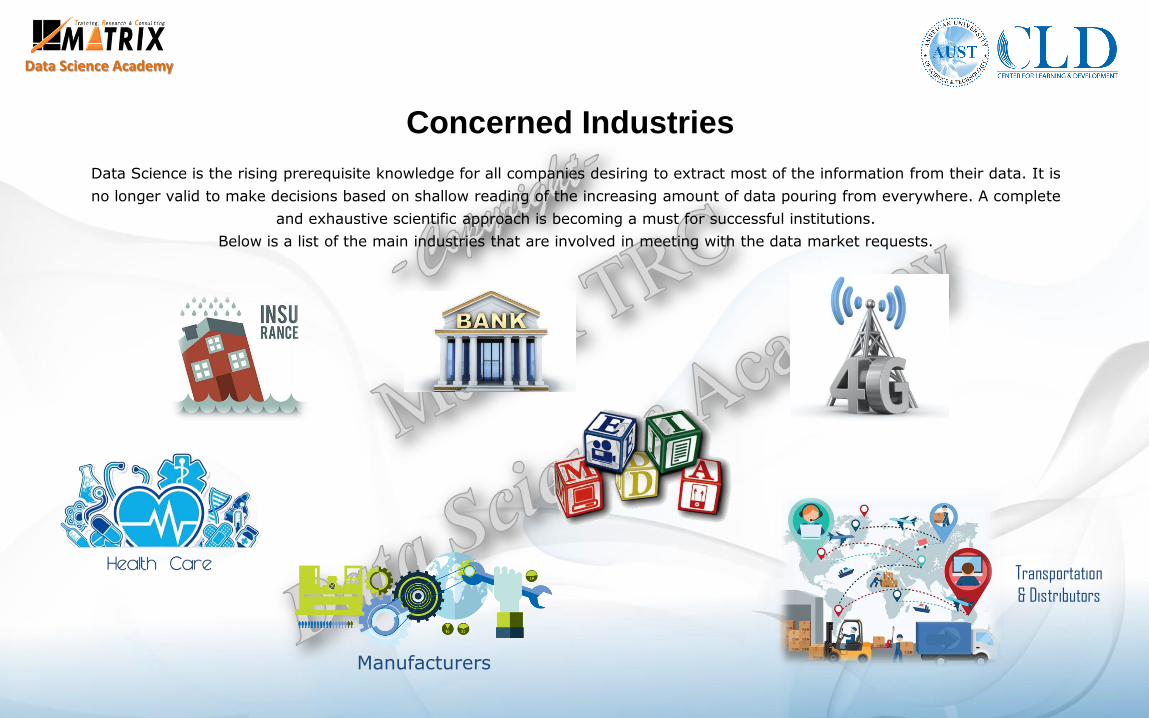
Concerned Industries
Data Science is the rising prerequisite knowledge for all companies desiring to extract most of the information from their data. It is
no longer valid to make decisions based on shallow reading of the increasing amount of data pouring from everywhere. A complete
and exhaustive scientific approach is becoming a must for successful institutions.
Below is a list of the main industries that are involved in meeting with the data market requests.
Manufacturers
Transportation
& Distributors
Data Science Academy
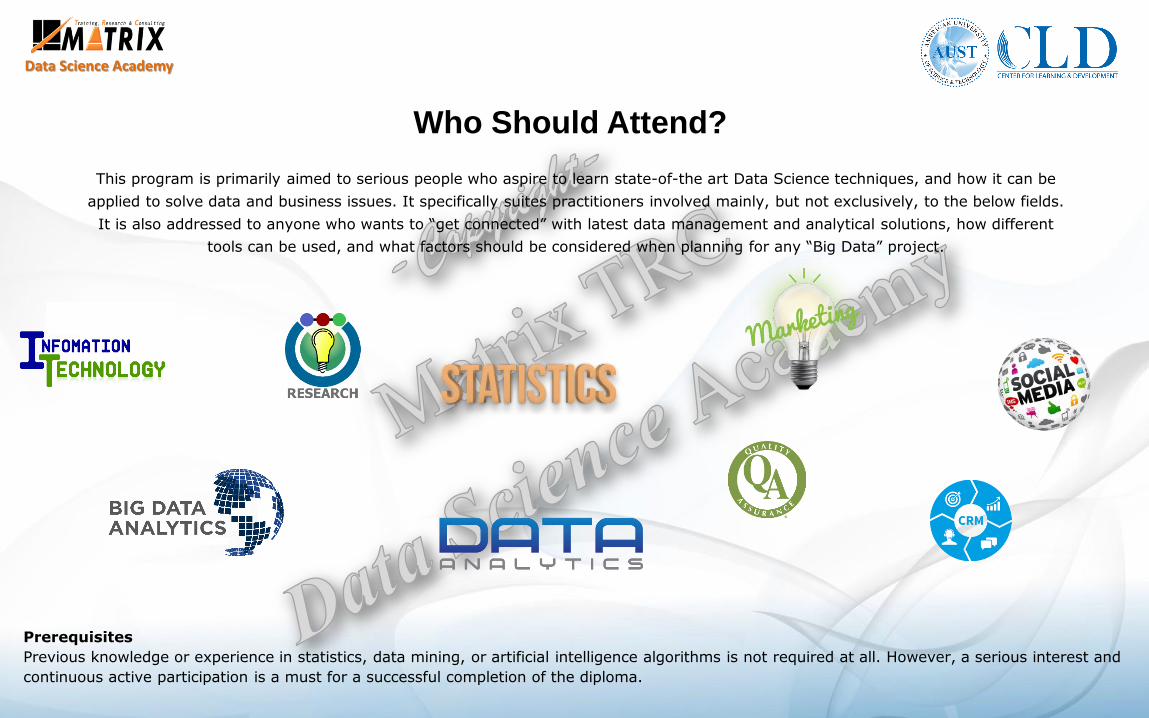
Who Should Attend?
This program is primarily aimed to serious people who aspire to learn state-of-the art Data Science techniques, and how it can be
applied to solve data and business issues. It specifically suites practitioners involved mainly, but not exclusively, to the below fields.
It is also addressed to anyone who wants to “get connected” with latest data management and analytical solutions, how different
tools can be used, and what factors should be considered when planning for any “Big Data” project.
Prerequisites
Previous knowledge or experience in statistics, data mining, or artificial intelligence algorithms is not required at all. However, a serious interest and
continuous active participation is a must for a successful completion of the diploma.
Data Science Academy
Clients and Participants
Data Science Academy
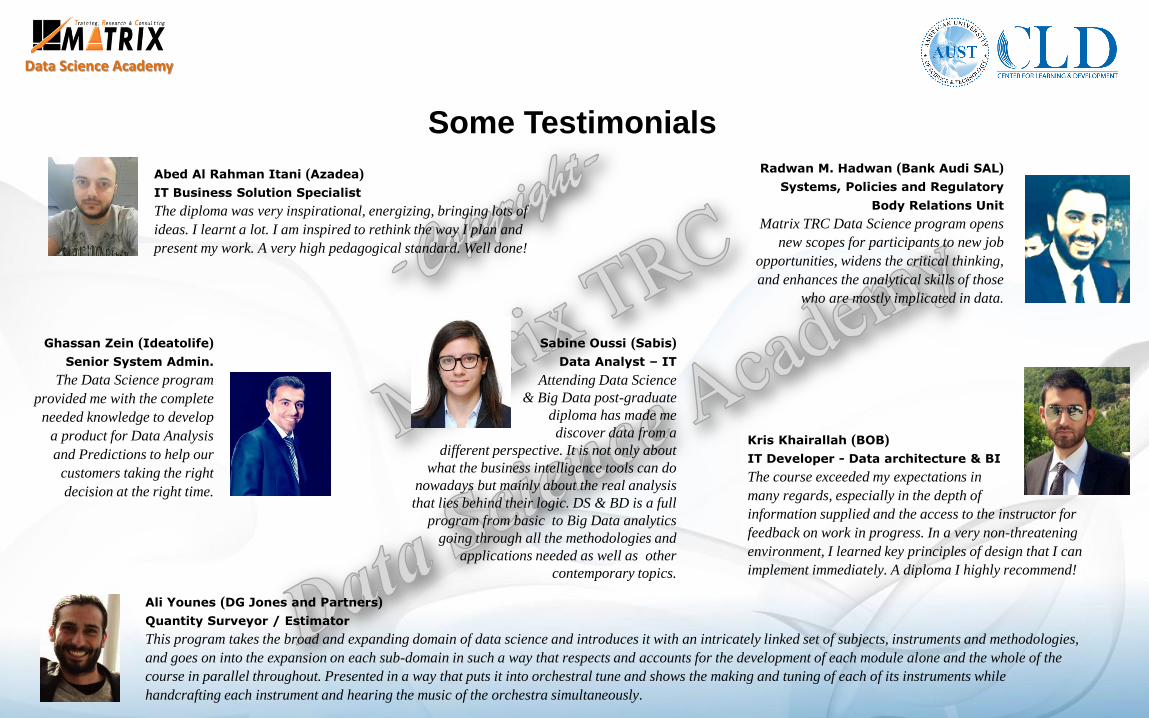
Some Testimonials
Abed Al Rahman Itani (Azadea)
IT Business Solution Specialist
The diploma was very inspirational, energizing, bringing lots of
ideas. I learnt a lot. I am inspired to rethink the way I plan and
present my work. A very high pedagogical standard. Well done!
Ali Younes (DG Jones and Partners)
Quantity Surveyor / Estimator
This program takes the broad and expanding domain of data science and introduces it with an intricately linked set of subjects, instruments and methodologies,
and goes on into the expansion on each sub-domain in such a way that respects and accounts for the development of each module alone and the whole of the
course in parallel throughout. Presented in a way that puts it into orchestral tune and shows the making and tuning of each of its instruments while
handcrafting each instrument and hearing the music of the orchestra simultaneously.
Ghassan Zein (Ideatolife)
Senior System Admin.
The Data Science program
provided me with the complete
needed knowledge to develop
a product for Data Analysis
and Predictions to help our
customers taking the right
decision at the right time.
Kris Khairallah (BOB)
IT Developer - Data architecture & BI
The course exceeded my expectations in
many regards, especially in the depth of
information supplied and the access to the instructor for
feedback on work in progress. In a very non-threatening
environment, I learned key principles of design that I can
implement immediately. A diploma I highly recommend!
Radwan M. Hadwan (Bank Audi SAL)
Systems, Policies and Regulatory
Body Relations Unit
Matrix TRC Data Science program opens
new scopes for participants to new job
opportunities, widens the critical thinking,
and enhances the analytical skills of those
who are mostly implicated in data.
Sabine Oussi (Sabis)
Data Analyst – IT
Attending Data Science
& Big Data post-graduate
diploma has made me
discover data from a
different perspective. It is not only about
what the business intelligence tools can do
nowadays but mainly about the real analysis
that lies behind their logic. DS & BD is a full
program from basic to Big Data analytics
going through all the methodologies and
applications needed as well as other
contemporary topics.
Data Science Academy
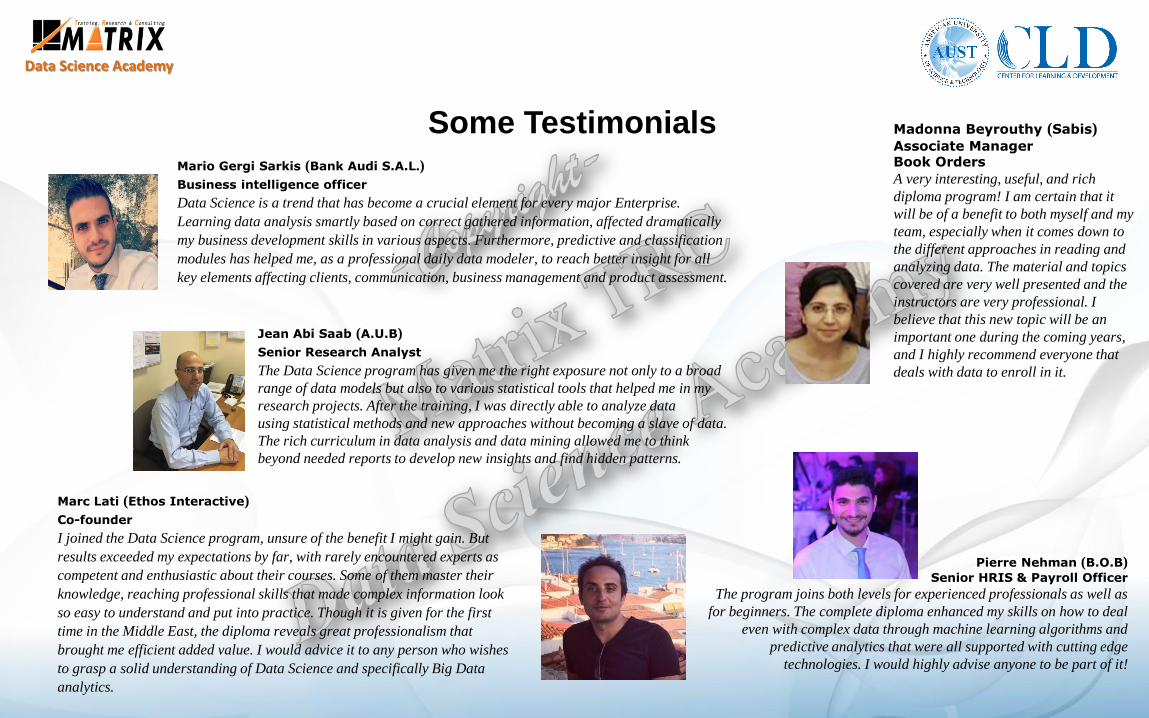
Some Testimonials
Marc Lati (Ethos Interactive)
Co-founder
I joined the Data Science program, unsure of the benefit I might gain. But
results exceeded my expectations by far, with rarely encountered experts as
competent and enthusiastic about their courses. Some of them master their
knowledge, reaching professional skills that made complex information look
so easy to understand and put into practice. Though it is given for the first
time in the Middle East, the diploma reveals great professionalism that
brought me efficient added value. I would advice it to any person who wishes
to grasp a solid understanding of Data Science and specifically Big Data
analytics.
Mario Gergi Sarkis (Bank Audi S.A.L.)
Business intelligence officer
Data Science is a trend that has become a crucial element for every major Enterprise.
Learning data analysis smartly based on correct gathered information, affected dramatically
my business development skills in various aspects. Furthermore, predictive and classification
modules has helped me, as a professional daily data modeler, to reach better insight for all
key elements affecting clients, communication, business management and product assessment.
Jean Abi Saab (A.U.B)
Senior Research Analyst
The Data Science program has given me the right exposure not only to a broad
range of data models but also to various statistical tools that helped me in my
research projects. After the training, I was directly able to analyze data
using statistical methods and new approaches without becoming a slave of data.
The rich curriculum in data analysis and data mining allowed me to think
beyond needed reports to develop new insights and find hidden patterns.
Pierre Nehman (B.O.B)Senior HRIS & Payroll Officer
The program joins both levels for experienced professionals as well as
for beginners. The complete diploma enhanced my skills on how to deal
even with complex data through machine learning algorithms and
predictive analytics that were all supported with cutting edge
technologies. I would highly advise anyone to be part of it!
Madonna Beyrouthy (Sabis)Associate ManagerBook Orders
A very interesting, useful, and rich
diploma program! I am certain that it
will be of a benefit to both myself and my
team, especially when it comes down to
the different approaches in reading and
analyzing data. The material and topics
covered are very well presented and the
instructors are very professional. I
believe that this new topic will be an
important one during the coming years,
and I highly recommend everyone that
deals with data to enroll in it.
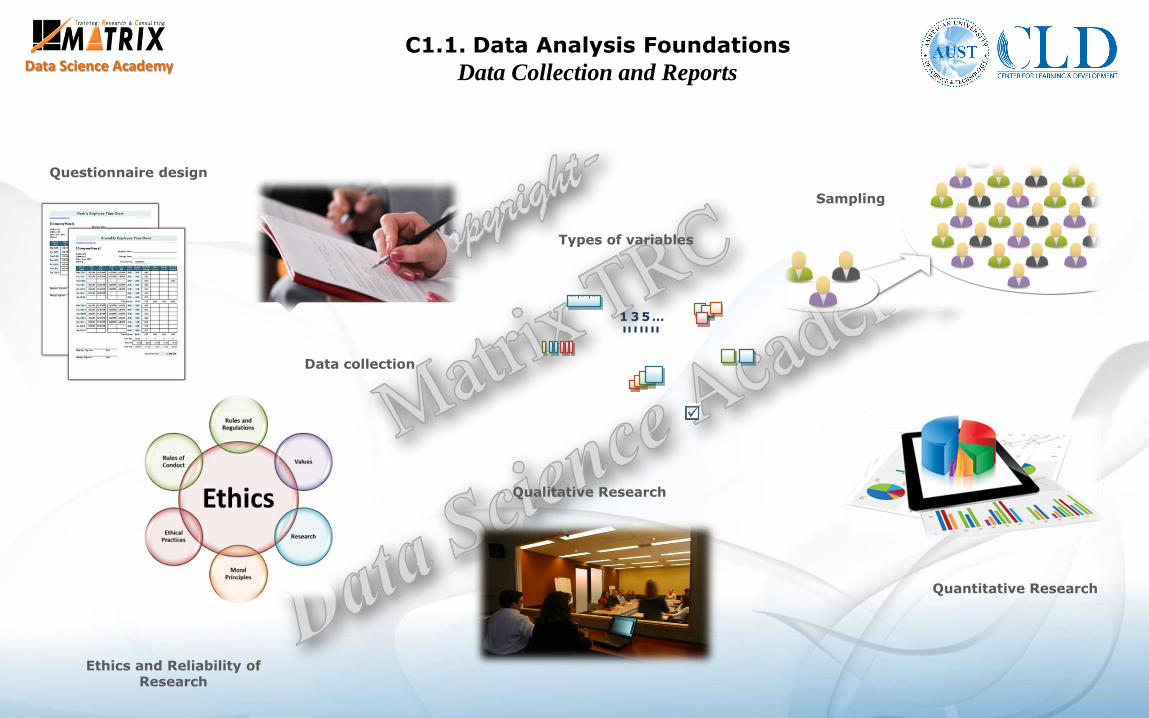
Data Science AcademyC1.1. Data Analysis Foundations
Data Collection and Reports
Qualitative Research
Quantitative Research
Ethics and Reliability of Research
Types of variables
Sampling
Data collection
1 3 5…
Questionnaire design
Data Science Academy
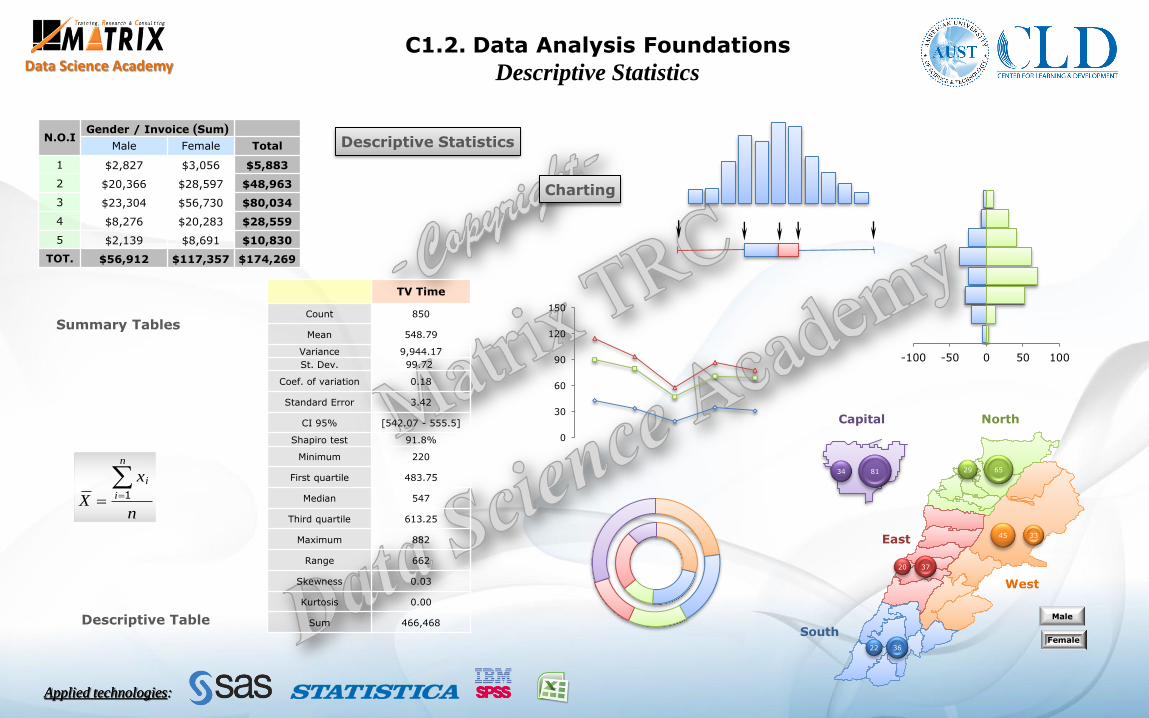
Descriptive Statistics
TV Time
Count 850
Mean 548.79
Variance 9,944.17
St. Dev. 99.72
Coef. of variation 0.18
Standard Error 3.42
CI 95% [542.07 - 555.5]
Shapiro test 91.8%
Minimum 220
First quartile 483.75
Median 547
Third quartile 613.25
Maximum 882
Range 662
Skewness 0.03
Kurtosis 0.00
Sum 466,468
Charting
N.O.IGender / Invoice (Sum)
Male Female Total
1 $2,827 $3,056 $5,883
2 $20,366 $28,597 $48,963
3 $23,304 $56,730 $80,034
4 $8,276 $20,283 $28,559
5 $2,139 $8,691 $10,830
TOT. $56,912 $117,357 $174,269
Descriptive Table
Summary Tables
0
30
60
90
120
150
n
x
X
n
i
i 1
-100 -50 0 50 100
C1.2. Data Analysis Foundations
Descriptive Statistics
West
East
South
NorthCapital
45
20
34
33
37
652981
Male
Female22 36
Applied technologies:Applied technologies:
Data Science Academy
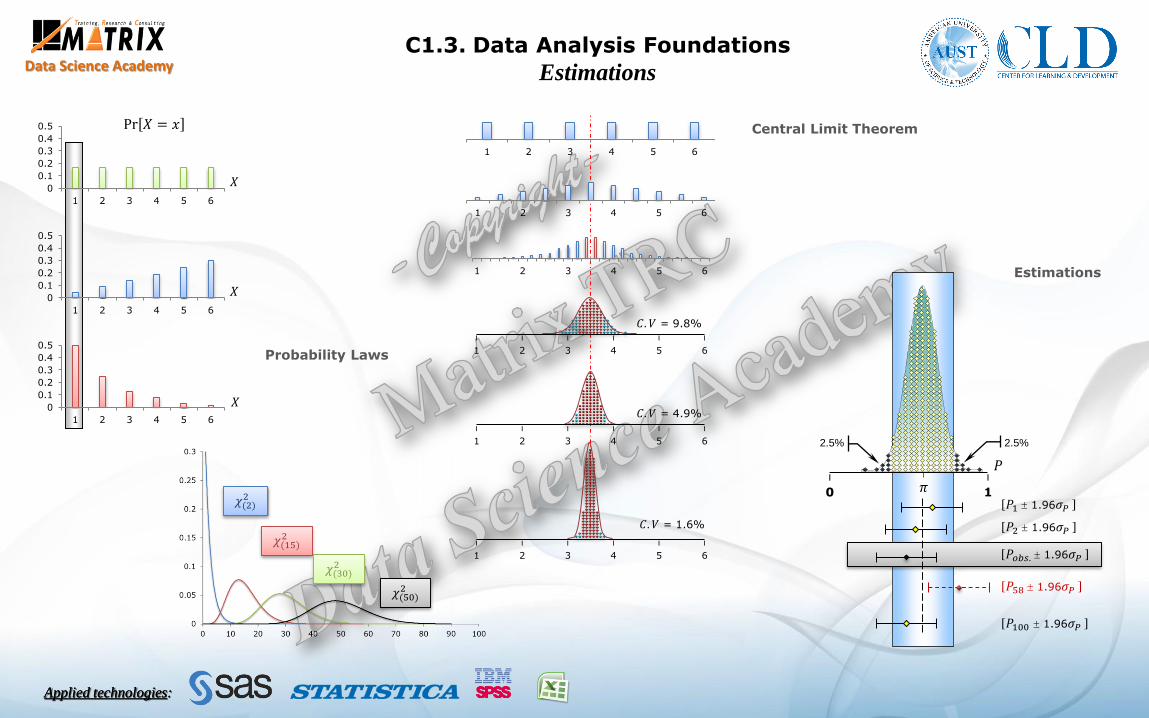
Probability Laws
Central Limit Theorem
Estimations
0
0.1
0.2
0.3
0.4
0.5
1 2 3 4 5 6
0
0.1
0.2
0.3
0.4
0.5
1 2 3 4 5 6
0
0.1
0.2
0.3
0.4
0.5
1 2 3 4 5 6
Pr 𝑋 = 𝑥
𝑋
𝑋
𝑋𝐶. 𝑉 = 4.9%
𝐶. 𝑉 = 9.8%
1 2 3 4 5 6
1 2 3 4 5 6
1 2 3 4 5 6
|
1
|
2
|
3
|
4
|
5
|
6
|
1
|
2
|
3
|
4
|
5
|
6
𝐶. 𝑉 = 1.6%
|
1
|
2
|
3
|
4
|
5
|
6
𝜒(2)2
𝜒(15)2
𝜒(30)2
𝜒(50)2
|
𝜋
2.5% 2.5%
[𝑃1 1.96𝜎𝑃 ]
[𝑃2 1.96𝜎𝑃 ]
[𝑃58 1.96𝜎𝑃 ]
[𝑃100 1.96𝜎𝑃 ]
[𝑃𝑜𝑏𝑠. 1.96𝜎𝑃 ]
𝑃|
0
|
1
C1.3. Data Analysis Foundations
Estimations
Applied technologies:Applied technologies:
Data Science Academy
z
-1.96 = - 𝑧0.025 𝑧0.025 = 1.96
|
-4
|
-3
|
-2
|
-1
|
2
|
3
|
4
|
5
|
0
H1 H1H0
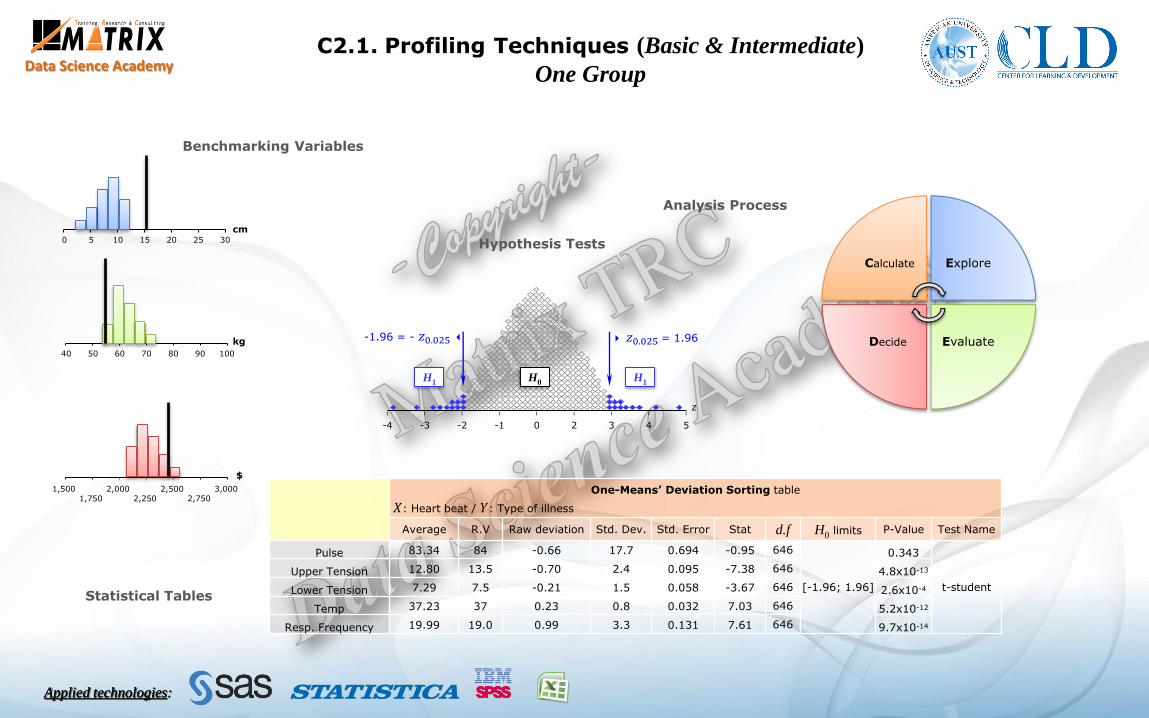
Hypothesis Tests
Benchmarking Variables
Statistical Tables
cm0 5 10 15 20 3025
kg
40 50 60 70 80 10090
$
1,5001,750
2,0002,250
2,500 3,0002,750
One-Means’ Deviation Sorting table
𝑋: Heart beat / 𝑌: Type of illness
Average R.V Raw deviation Std. Dev. Std. Error Stat d.f H0 limits P-Value Test Name
Pulse 83.34 84 -0.66 17.7 0.694 -0.95 646
[-1.96; 1.96]
0.343
t-student
Upper Tension 12.80 13.5 -0.70 2.4 0.095 -7.38 646 4.8x10⁻¹³
Lower Tension 7.29 7.5 -0.21 1.5 0.058 -3.67 646 2.6x10⁻⁴
Temp 37.23 37 0.23 0.8 0.032 7.03 646 5.2x10⁻¹²
Resp. Frequency 19.99 19.0 0.99 3.3 0.131 7.61 646 9.7x10⁻¹⁴
Calculate Explore
EvaluateDecide
Analysis Process
C2.1. Profiling Techniques (Basic & Intermediate)
One Group
Applied technologies:Applied technologies:
Data Science Academy
cm0 5 10 15 20 3025
kg40 50 60 70 80 10090
$
1,5001,750
2,0002,250
2,500 3,0002,750
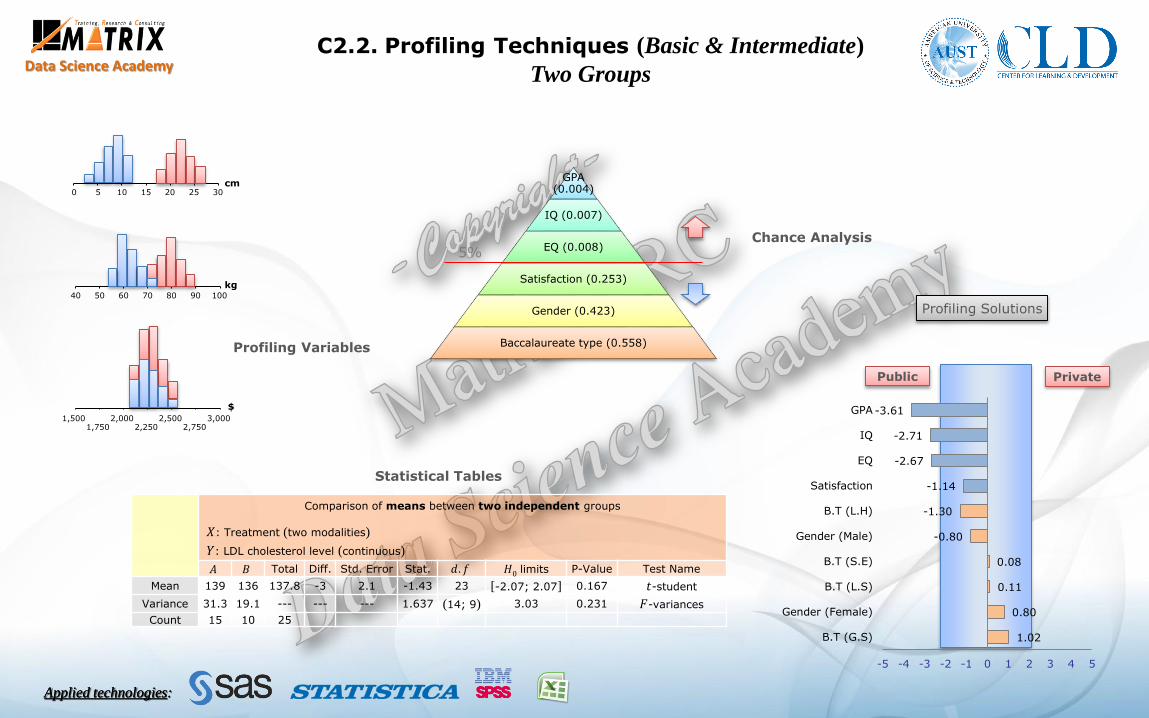
Comparison of means between two independent groups
𝑋: Treatment (two modalities)
𝑌: LDL cholesterol level (continuous)
𝐴 𝐵 Total Diff. Std. Error Stat. 𝑑. 𝑓 𝐻0 limits P-Value Test Name
Mean 139 136 137.8 -3 2.1 -1.43 23 [-2.07; 2.07] 0.167 𝑡-student
Variance 31.3 19.1 --- --- --- 1.637 (14; 9) 3.03 0.231 𝐹-variances
Count 15 10 25
GPA (0.004)
IQ (0.007)
EQ (0.008)
Satisfaction (0.253)
Gender (0.423)
Baccalaureate type (0.558)
5%
Profiling Variables
Statistical Tables
1.02
0.80
0.11
0.08
-0.80
-1.30
-1.14
-2.67
-2.71
-3.61
-5 -4 -3 -2 -1 0 1 2 3 4 5
B.T (G.S)
Gender (Female)
B.T (L.S)
B.T (S.E)
Gender (Male)
B.T (L.H)
Satisfaction
EQ
IQ
GPA
Public Private
Profiling Solutions
Chance Analysis
C2.2. Profiling Techniques (Basic & Intermediate)
Two Groups
Applied technologies:Applied technologies:
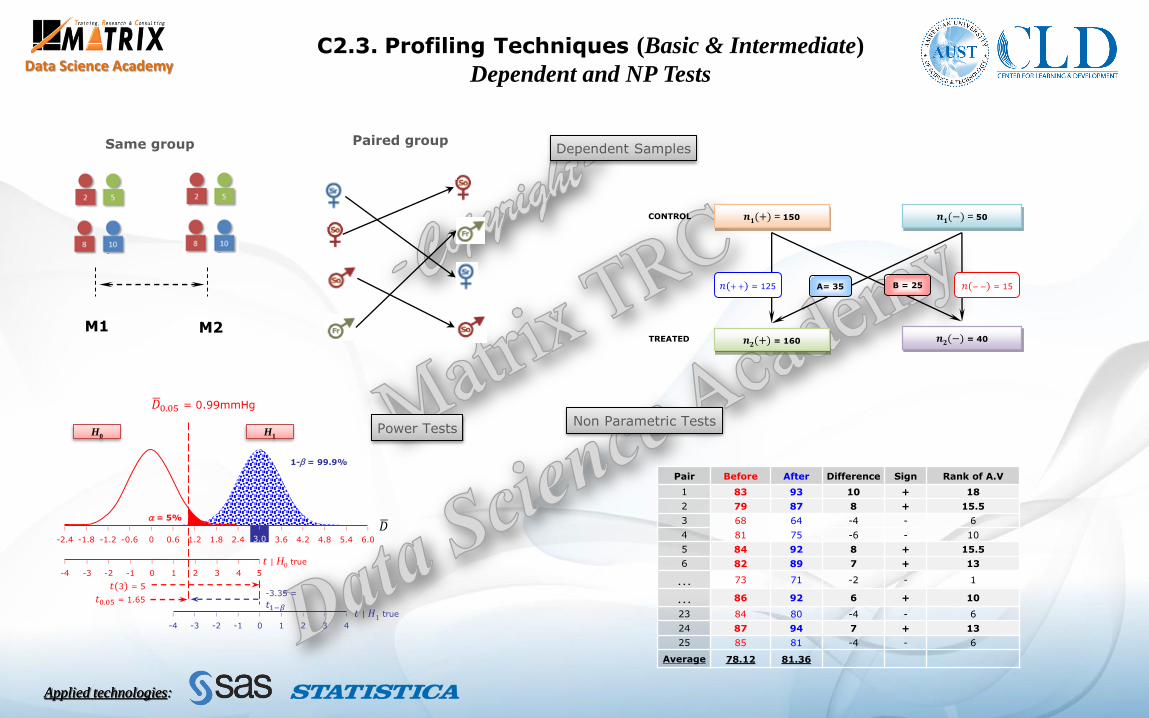
Data Science AcademyC2.3. Profiling Techniques (Basic & Intermediate)
Dependent and NP Tests
Non Parametric Tests
Same group
M1 M2
Paired group
H0 H1
|
-3
|
-2
|
-1
|
0
|
1
|
2
|
3
|
4
1- = 99.9%
= 5%
𝑡0.05 = 1.65-3.35 =
𝑡1−𝛽
𝑡(3) = 5
𝐷
𝐷0.05 = 0.99mmHg
|
-4
|
-3
|
-2
|
-1
|
0
|
1
|
2
|
3
|
4
𝑡 | 𝐻1 true
𝑡 | H0 true|
5
|
-4
|
-1.8
|
-1.2
|
-0.6
|
0
|
0.6
|
1.2
|
1.8
|
2.4
|
3.0
|
3.6
|
4.2
|
4.8
|
5.4
|
6.0
|
-2.4
Power Tests
A= 35 B = 25
CONTROL
TREATED
𝑛(+ +) = 125 𝑛(− −) = 15
𝒏𝟏(−) = 50𝒏𝟏(+) = 150
𝒏𝟐(+) = 160 𝒏𝟐(−) = 40
Pair Before After Difference Sign Rank of A.V
1 83 93 10 + 18
2 79 87 8 + 15.5
3 68 64 -4 - 6
4 81 75 -6 - 10
5 84 92 8 + 15.5
6 82 89 7 + 13
… 73 71 -2 - 1
… 86 92 6 + 10
23 84 80 -4 - 6
24 87 94 7 + 13
25 85 81 -4 - 6
Average 78.12 81.36
Dependent Samples
Applied technologies:Applied technologies:
Data Science Academy
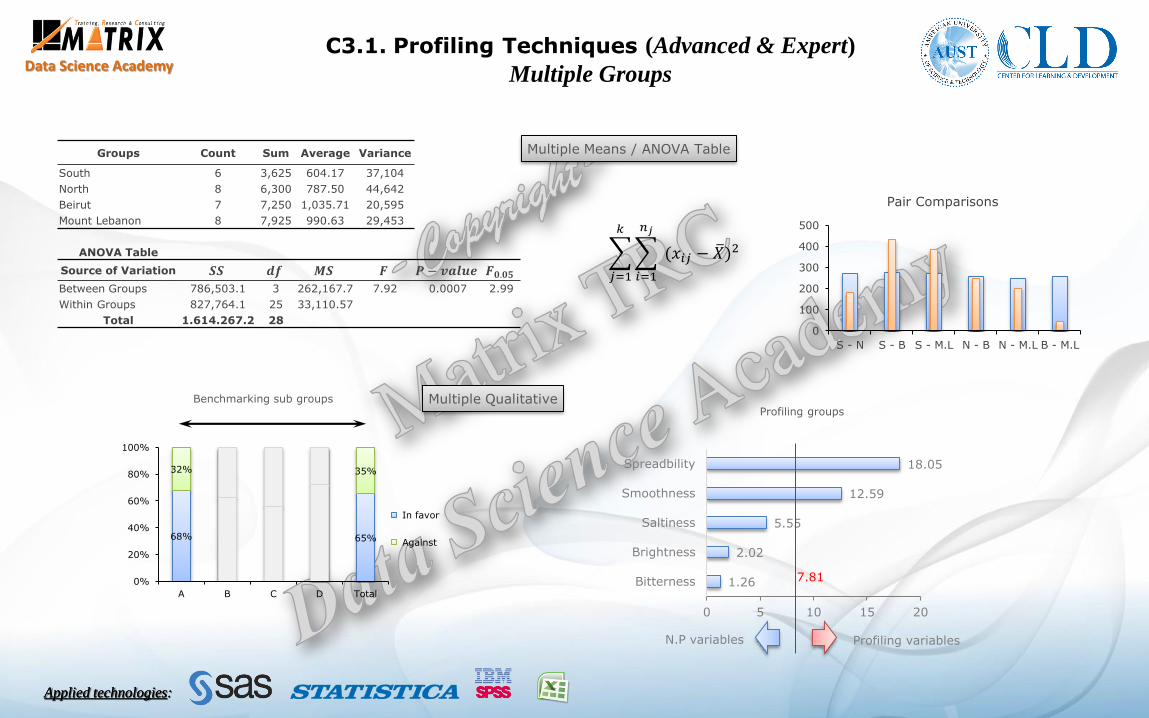
𝑗=1
𝑘
𝑖=1
𝑛𝑗
(𝑥𝑖𝑗 − 𝑋)2
Groups Count Sum Average Variance
South 6 3,625 604.17 37,104
North 8 6,300 787.50 44,642
Beirut 7 7,250 1,035.71 20,595
Mount Lebanon 8 7,925 990.63 29,453
ANOVA Table
Source of Variation 𝑺𝑺 𝒅𝒇 𝑴𝑺 𝑭 𝑷 − 𝒗𝒂𝒍𝒖𝒆 𝑭𝟎.𝟎𝟓
Between Groups 786,503.1 3 262,167.7 7.92 0.0007 2.99
Within Groups 827,764.1 25 33,110.57
Total 1.614.267.2 280
100
200
300
400
500
S - N S - B S - M.L N - B N - M.L B - M.L
Pair Comparisons
Multiple Means / ANOVA Table
Multiple Qualitative
C3.1. Profiling Techniques (Advanced & Expert)
Multiple Groups
68% 65%
32% 35%
0%
20%
40%
60%
80%
100%
A B C D Total
In favor
Against
Benchmarking sub groups
1.26
2.02
5.55
12.59
18.05
0 5 10 15 20
Bitterness
Brightness
Saltiness
Smoothness
Spreadbility
7.81
Profiling variablesN.P variables
Profiling groups
Applied technologies:Applied technologies:
Data Science Academy
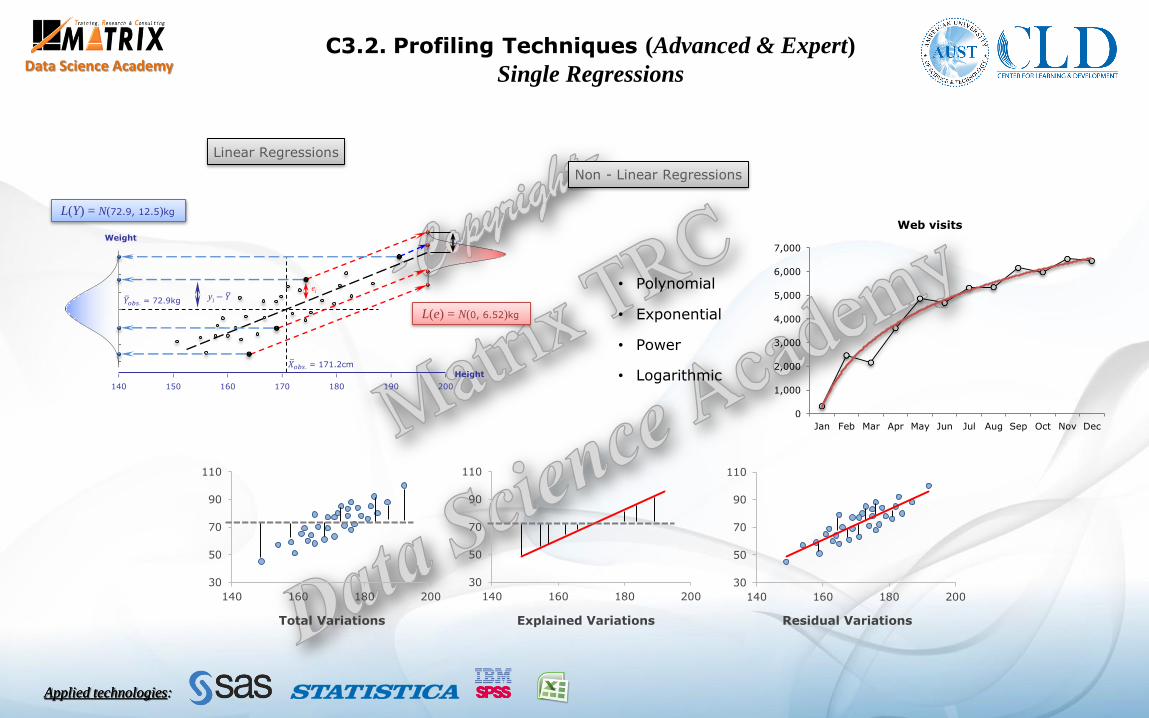
30
50
70
90
110
140 160 180 200
Explained VariationsTotal Variations Residual Variations
30
50
70
90
110
140 160 180 200
30
50
70
90
110
140 160 180 200
Linear Regressions
C3.2. Profiling Techniques (Advanced & Expert)
Single Regressions
𝑋𝑜𝑏𝑠. = 171.2cm
𝑌𝑜𝑏𝑠. = 72.9kg
Weight
Height
ei
ei
yi − 𝑌
|
150
|
160
|
170
|
180
|
190
|
200
|
140
L(Y) = N(72.9, 12.5)kg
L(e) = N(0, 6.52)kg
• Polynomial
• Exponential
• Power
• Logarithmic
Non - Linear Regressions
0
1,000
2,000
3,000
4,000
5,000
6,000
7,000
Jan Feb Mar Apr May Jun Jul Aug Sep Oct Nov Dec
Web visits
Applied technologies:Applied technologies:

Data Science Academy
Dichotomous
Independent Dependent
Nominal / Ordinal
Independent DependentQuantitative
Parametric
Two Means
𝐻0: 𝜇1 = 𝜇2
t test
Two Means
𝐻0: 𝜇1 = 𝜇2
t test-paired
Multiple Means
𝐻0: 𝜇1 = 𝜇2 = 𝜇𝑘
F test – One way ANOVA
Multiple Means
𝐻0: 𝜇1 = 𝜇2 = 𝜇𝑘
F test – rANOVA
Correlation
𝐻0: 𝜌0 = 0
t test
Non
Parametric
Two Means
𝐻0: 𝜇1 = 𝜇2Wilcoxon / Mann Whitney
rank-sum test
Two Means
𝐻0: 𝜇1 = 𝜇2Wilcoxon SR test
Multiple Means
𝐻0: 𝜇1 = 𝜇2 = 𝜇𝑘Kruskal Wallis test
Multiple Means
𝐻0: 𝜇1 = 𝜇2 = 𝜇𝑘Friedman test
Correlation
𝐻0: 𝛽1 0 = 0Spearman rank-
correlation test
C3.3. Profiling Techniques (Advanced & Expert)
Dependent and N.P Tests
111.0
93.3
82.3 82.7
57.7
96.7
77.7 74.0 72.3 73.3
72.0 76.3
71.7
93.3
40
60
80
100
120
1st 2nd 3rd 4th 5th
Pulse by DAY per DRUG.
D1
D2
D3
𝑘=1
5
𝑛𝑘 𝑋.𝑘 − 𝑋
2= 2,196.3
Explained
𝑘=1
5
𝑖=1
9
𝑥𝑖𝑘 − 𝑋2= 11,152.6
𝑛𝑖
𝑖=1
9
𝑋𝑖. − 𝑋2= 2,670.97
𝑘=1
5
𝑖=1
9
𝑥𝑖𝑘 − 𝑋𝒊𝑘
2= 6,285.46
Total
Residual
Non Parametric Tests
Dependent Samples
0
2
4
6
8
10
12
14
16
0 2 4 6 8 10 12 14 16
Spearman Correlation Beirut
Kaftoon
BaabdatBig
cities
Villages
Applied technologies:Applied technologies:

Data Science Academy
QU
ALIT
Y
PR
IC
E
SPORTINESS
LUXURY
Principal Component Analysis
C4.1. Machine Learning (Unsupervised)
P.C.A and M.D.S
Multi Dimensional Scaling
B J B … T
Beirut 0
Jounieh 45 0
Byblos 85 35 0
… … … … 0
Tripoli 95 65 43 … 0
SAIDA
TYR
B.J
RACHAYA
ZAHLE
ALEY
BEIRUT
BYBLOSBCHARRE
BAALBECK
HERMEL
TRIPOLIAKKAR
Introduction to Algebra
𝐴𝑢1 =
𝑎11
………𝑎𝑛1
……𝑎𝑖𝑗
……
𝑎1𝑝
………𝑎𝑛𝑝
𝑢11
…𝑢1𝑗
…𝑢1𝑝
=
……
𝑗=1
𝑝
𝑎𝑖𝑗𝑢1𝑗
……
𝐼𝑛 =
1 0 00 1 00 0 1
Applied technologies:Applied technologies:
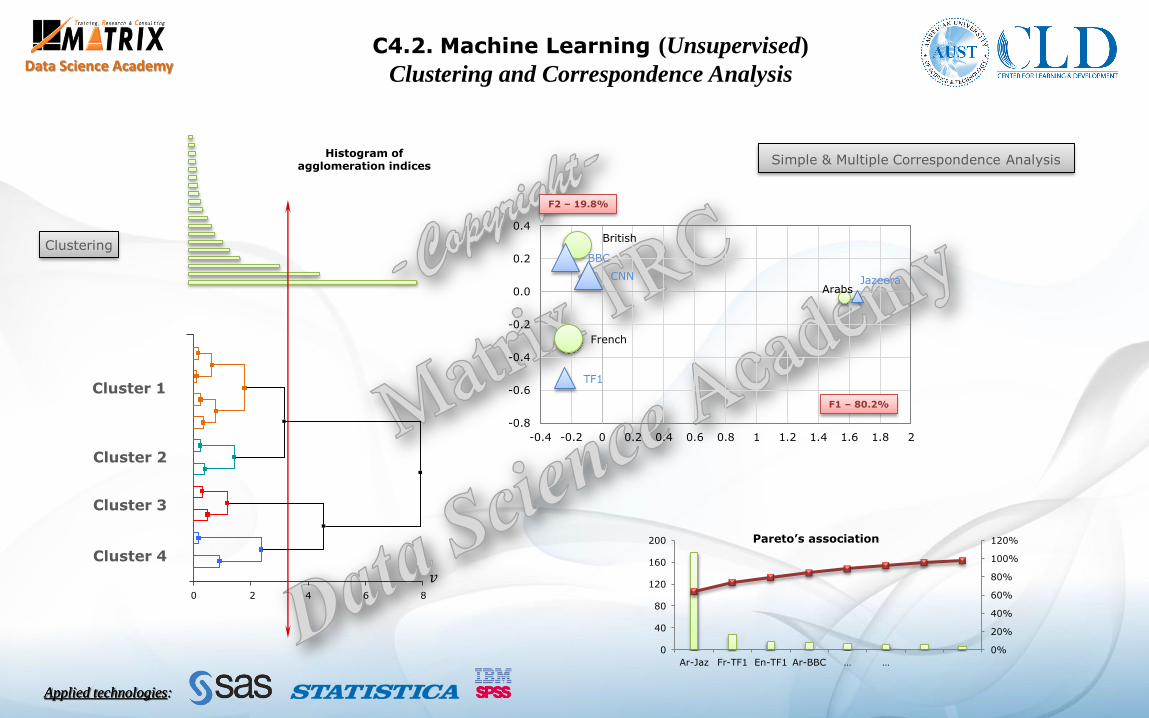
Data Science AcademyC4.2. Machine Learning (Unsupervised)
Clustering and Correspondence Analysis
Clustering
C5
C4
C2
C1
C3
𝑣0 2 64 8
C5
C4
C2
C1
C3
C1
C5
C4
C1
C1
C1
C1
C1
C1
C1
Histogram of agglomeration indices
Cluster 1
Cluster 2
Cluster 3
Cluster 4
Simple & Multiple Correspondence Analysis
British
French
Arabs
CNN
TF1
BBC
Jazeera
-0.8
-0.6
-0.4
-0.2
0.0
0.2
0.4
-0.4 -0.2 0 0.2 0.4 0.6 0.8 1 1.2 1.4 1.6 1.8 2
F2 – 19.8%
F1 – 80.2%
0%
20%
40%
60%
80%
100%
120%
0
40
80
120
160
200
Ar-Jaz Fr-TF1 En-TF1 Ar-BBC … …
Pareto’s association
Applied technologies:Applied technologies:
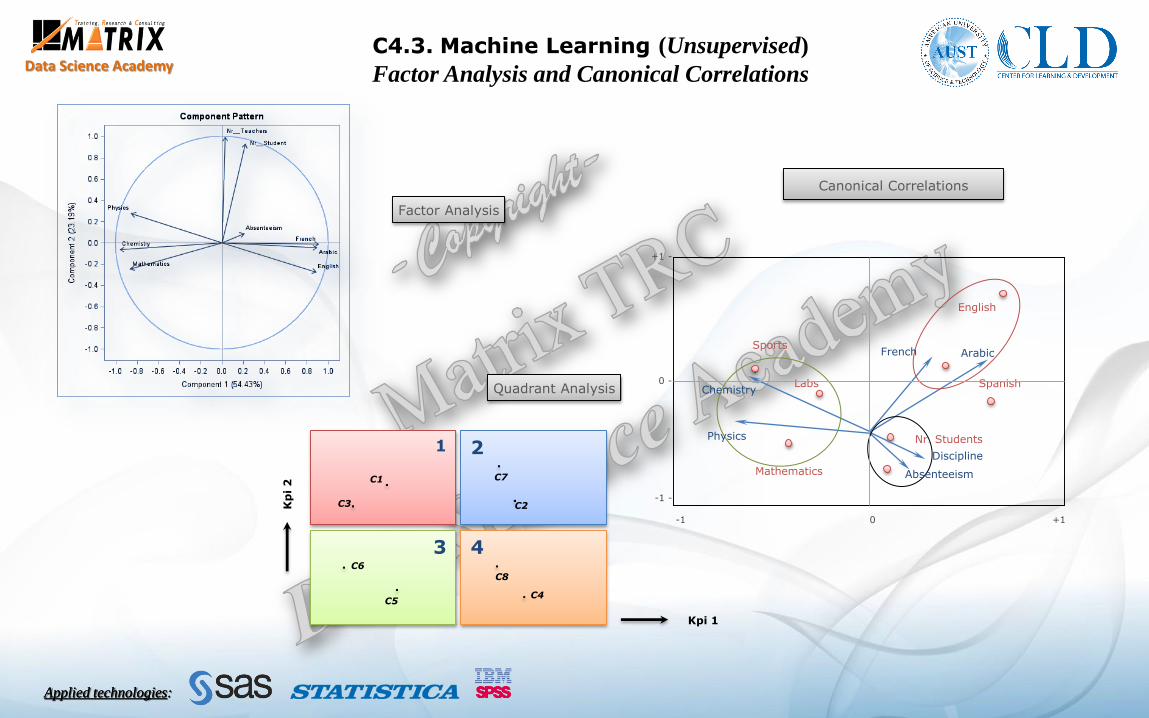
Data Science AcademyC4.3. Machine Learning (Unsupervised)
Factor Analysis and Canonical Correlations
Canonical Correlations
-1 0 +1
-1 -
0 -
+1 -
Discipline
Physics
English
Chemistry
Mathematics
ArabicFrench
Nr. Students
Sports
Labs Spanish
Absenteeism
Factor Analysis
Quadrant Analysis
Kpi 1
Kp
i2
1 2
3 4
C4
C6
C3 C2
C7
C5
C8
C1
Applied technologies:Applied technologies:

Data Science Academy
Y X2
X3
X1
Y X2
X3
X1
X3
X1
Y X2
X3
X1
X3
X1 X1
Y X2
X3
X1
X3
X1 X1
0.0
0.5
1.0
-15 -10 -5 0 5 10 15
𝑃(𝑍) = 1
1 + 𝑒−𝑧
Gradient Descent Algorithms
Multiple
and
Stepwise
Regressions
Logistic Regressions
𝑌
𝑋2
𝑿𝟏
𝑋1
𝑿𝟐
C5.1. Machine Learning (Supervised)
Multiple Regression Models
Applied technologies:Applied technologies:
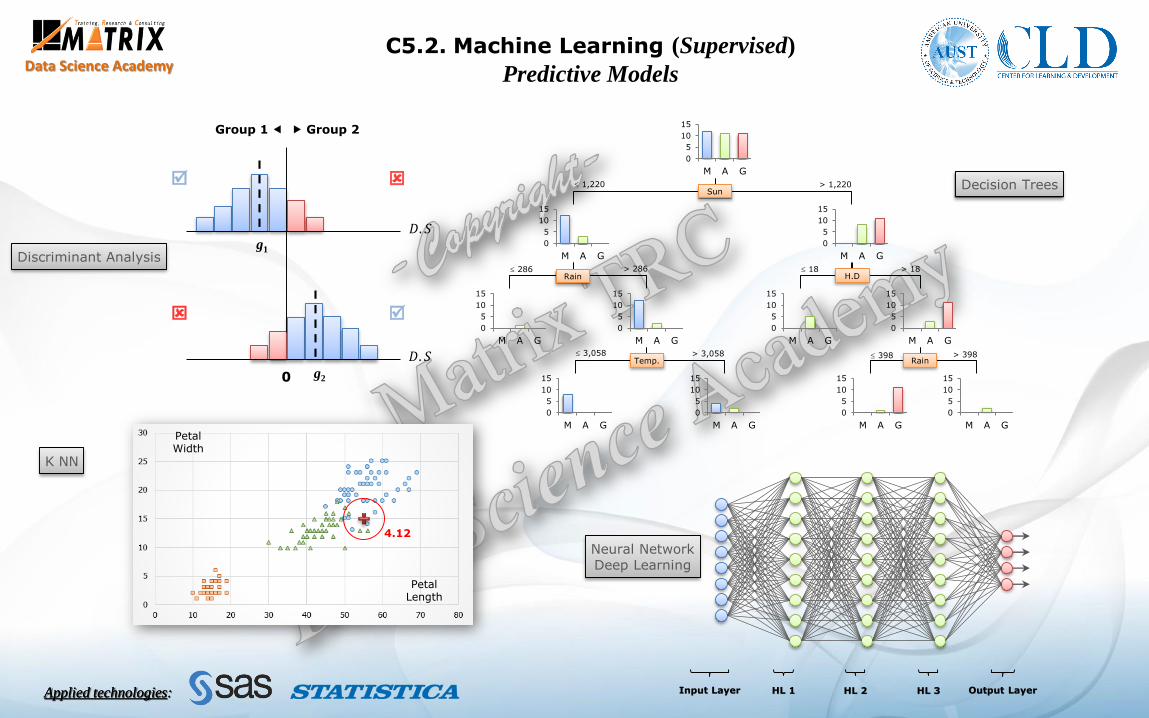
Data Science AcademyC5.2. Machine Learning (Supervised)
Predictive Models
0 g2
𝐷. 𝑆g1
𝐷. 𝑆
Group 1 Group 2
Discriminant Analysis
K NN
4.12
Petal Length
Petal Width
Decision TreesSun
1,220
18 286 > 286
> 1,220
> 18Rain
Temp.
H.D
Rain 3,058 > 3,058 398 > 398
0
5
10
15
M A G
0
5
10
15
M A G
0
5
10
15
M A G
0
5
10
15
M A G
0
5
10
15
M A G
0
5
10
15
M A G
0
5
10
15
M A G
0
5
10
15
M A G
0
5
10
15
M A G
0
5
10
15
M A G
0
5
10
15
M A G
Input Layer Output LayerHL 1 HL 2 HL 3
Neural NetworkDeep Learning
Applied technologies:Applied technologies:

Data Science AcademyC5.3. Machine Learning (Supervised)
SAS – E Miner
Applied technologies:Applied technologies:
Data Science Academy
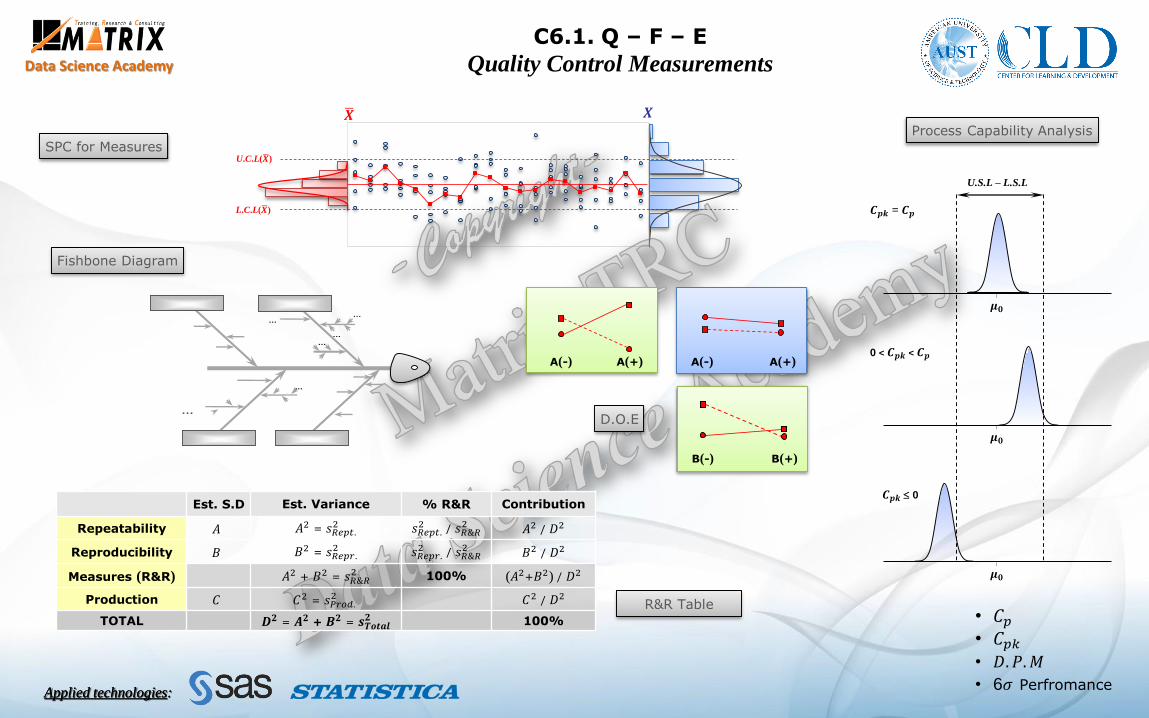
C6.1. Q – F – E
Quality Control Measurements
SPC for Measures
𝑿 𝑿
U.C.L( 𝑿)
L.C.L( 𝑿)
Process Capability Analysis
• 𝐶𝑝
• 𝐶𝑝𝑘
• 𝐷. 𝑃.𝑀
• 6𝜎 Perfromance
U.S.L – L.S.L
𝑪𝒑𝒌 = 𝑪𝒑
0 < 𝑪𝒑𝒌 < 𝑪𝒑
𝑪𝒑𝒌 0
|
𝝁𝟎
|
𝝁𝟎
|
𝝁𝟎
Est. S.D Est. Variance % R&R Contribution
Repeatability 𝐴 𝐴2 = 𝑠𝑅𝑒𝑝𝑡.2 𝑠𝑅𝑒𝑝𝑡.
2 / 𝑠𝑅&𝑅2 𝐴2 / 𝐷2
Reproducibility 𝐵 𝐵2 = 𝑠𝑅𝑒𝑝𝑟.2 𝑠𝑅𝑒𝑝𝑟.
2 / 𝑠𝑅&𝑅2 𝐵2 / 𝐷2
Measures (R&R) 𝐴2 + 𝐵2 = 𝑠𝑅&𝑅2 100% (𝐴2+𝐵2) / 𝐷2
Production 𝐶 𝐶2 = 𝑠𝑃𝑟𝑜𝑑.2 𝐶2 / 𝐷2
TOTAL 𝑫𝟐 = 𝑨𝟐 + 𝑩𝟐 = 𝒔𝑻𝒐𝒕𝒂𝒍𝟐 100%
R&R Table
B(-) B(+)
A(-) A(+) A(-) A(+)
D.O.E
Fishbone Diagram
……
……
…
…
Applied technologies:Applied technologies:
Data Science Academy
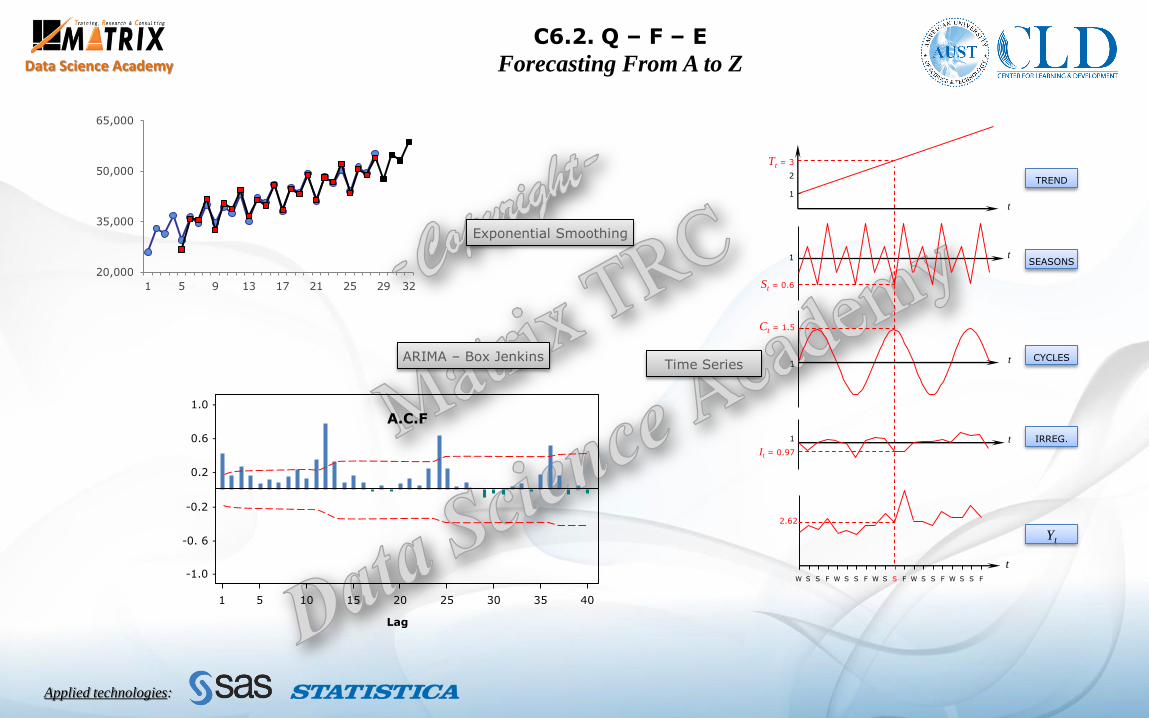
1
2
Tt = 3
t
1
Ct = 1.5
t
1 t
It = 0.97
2.62
t1
St = 0.6
tW SS F W SS F W SS F W SS F W SS F
TREND
SEASONS
CYCLES
IRREG.
Yt
1.0 -
0.6 -
0.2 -
-0.2 -
-0. 6 -
-1.0 -
Lag
A.C.F
1 5 10 15 20 25 30 35 40
20,000
35,000
50,000
65,000
1 5 9 13 17 21 25 29 32
Exponential Smoothing
Time SeriesARIMA – Box Jenkins
C6.2. Q – F – E
Forecasting From A to Z
Applied technologies:
Data Science Academy
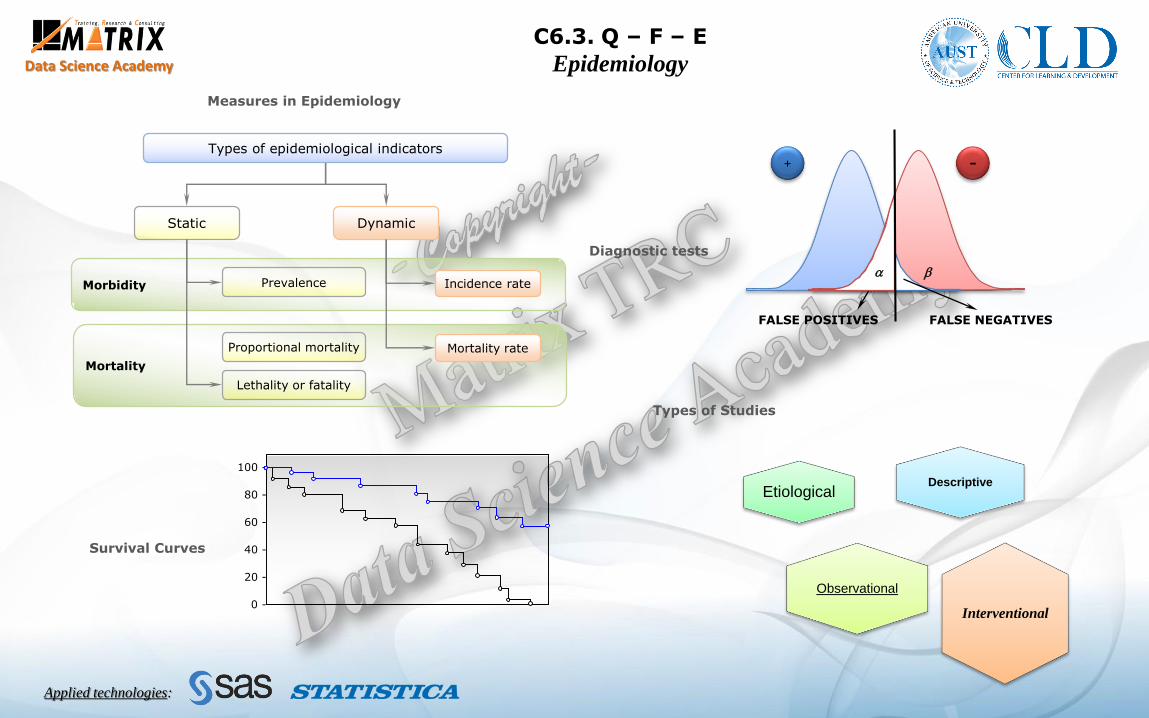
Measures in Epidemiology
Mortality
Morbidity
Static Dynamic
Incidence rate
Mortality rate
Prevalence
Proportional mortality
Lethality or fatality
Types of epidemiological indicators+ -
FALSE NEGATIVESFALSE POSITIVES
Types of Studies
40 -
80 -
20 -
0 -
60 -
100 -
Survival Curves
Diagnostic tests
DescriptiveEtiological
Observational
Interventional
Applied technologies:
C6.3. Q – F – E
Epidemiology
Data Science Academy
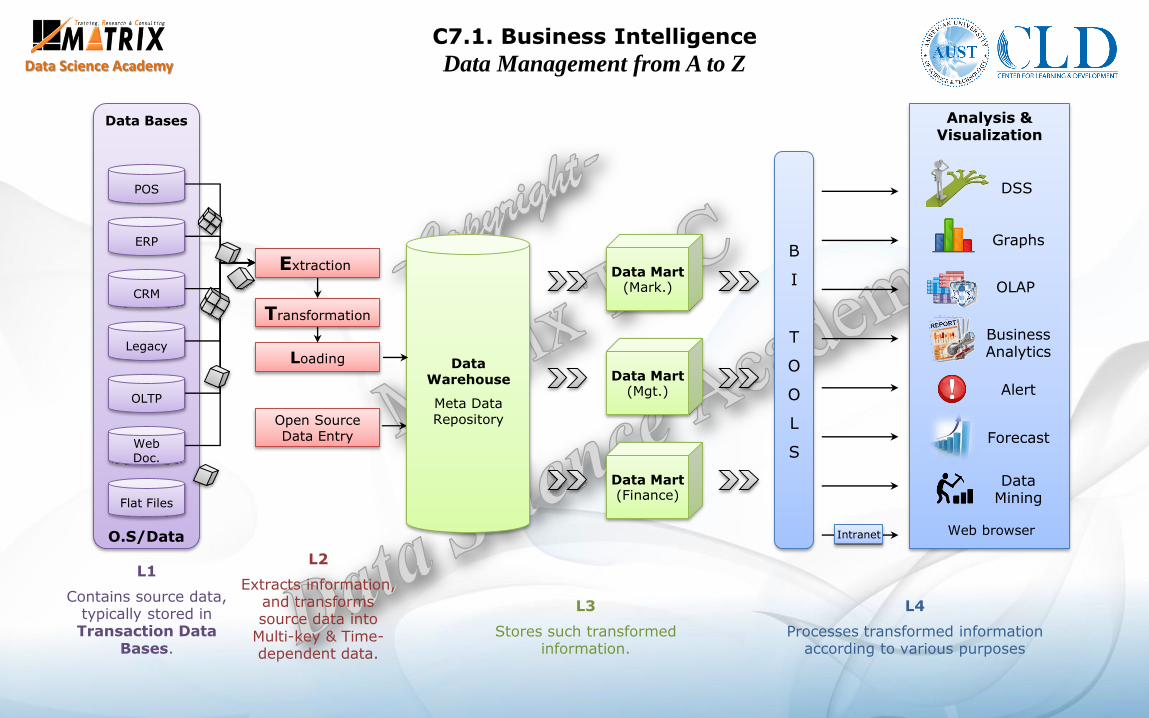
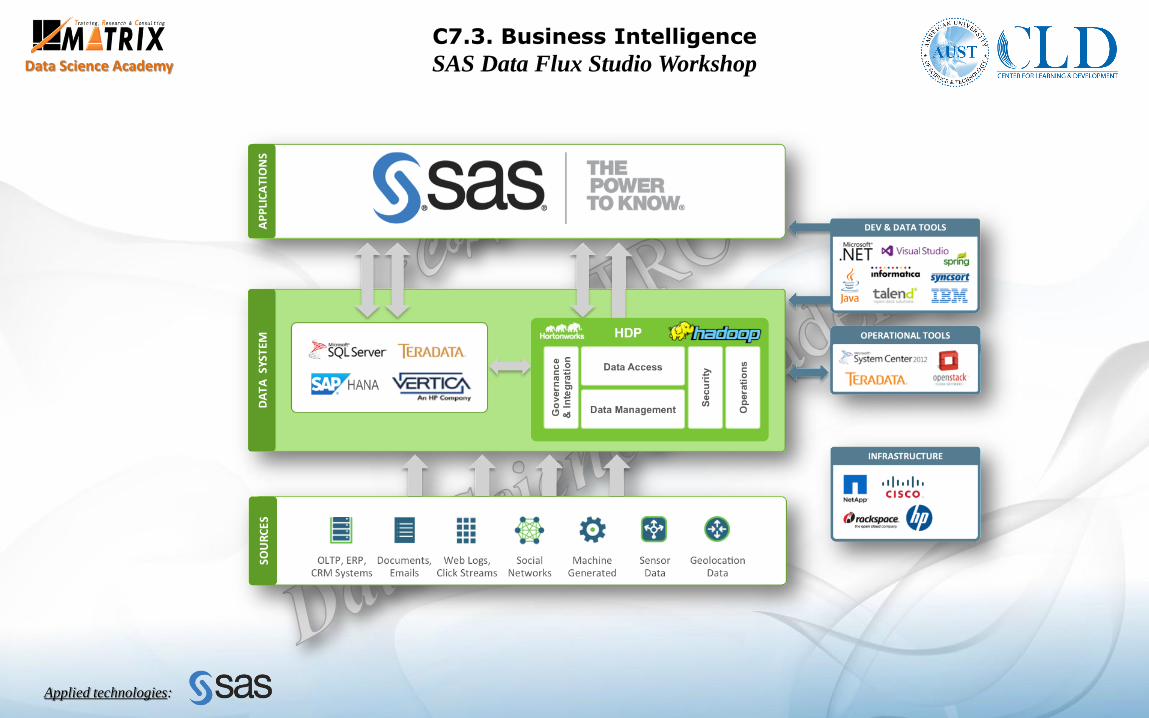
C7.1. Business Intelligence
Data Management from A to Z
Data Bases
O.S/Data
POS
ERP
Legacy
OLTP
Web Doc.
B
I
T
O
O
L
S
DataWarehouse
Meta Data Repository
Intranet
Data Mart(Mark.)
Data Mart(Mgt.)
Data Mart(Finance)
Extraction
Transformation
Loading
Open SourceData Entry
L1
Contains source data, typically stored in Transaction Data
Bases.
L2
Extracts information, and transforms source data into
Multi-key & Time-dependent data.
L3
Stores such transformed information.
L4
Processes transformed information according to various purposes
Analysis & Visualization
Graphs
Business Analytics
Alert
Forecast
Data Mining
Web browser
CRM
Flat Files
OLAP
DSS
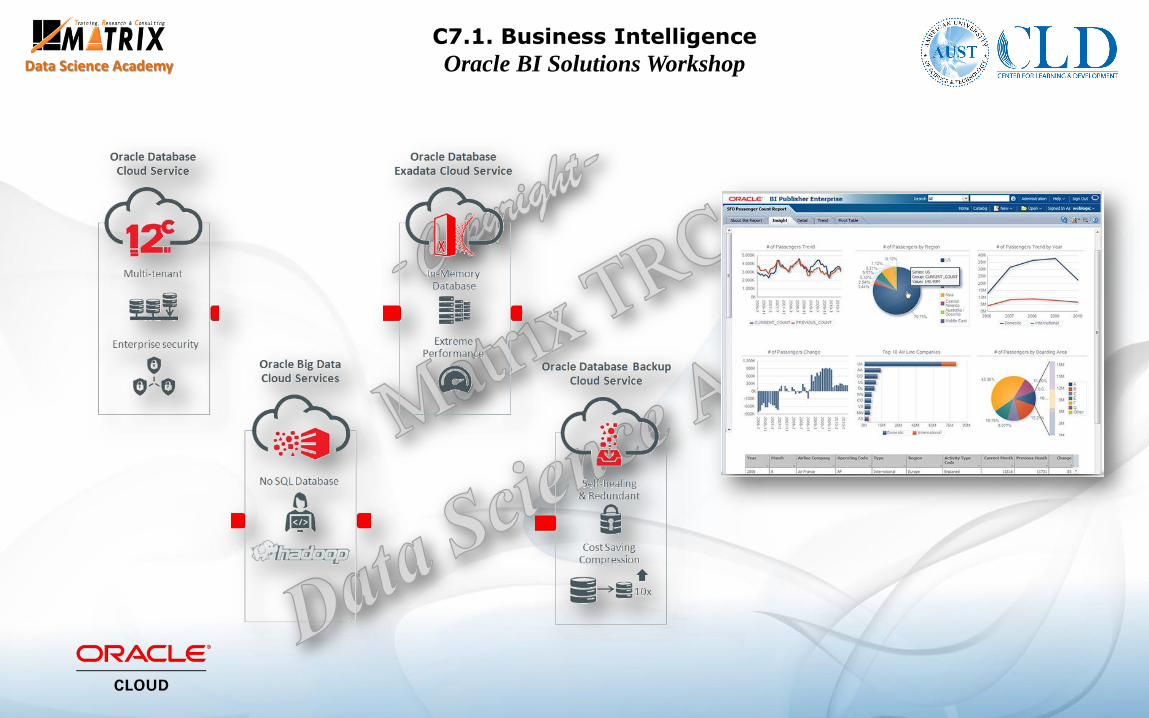
Data Science Academy
C7.1. Business Intelligence
Oracle BI Solutions Workshop
Data Science Academy
C7.3. Business Intelligence
SAS Data Flux Studio Workshop
Applied technologies:

Data Science Academy
2 million users worldwide
40% yearly increase of users
Leading programming
language in data analyticsand data science.
C8.1. Statistical Programming
R
STATVILLE 1
Data Science Academy
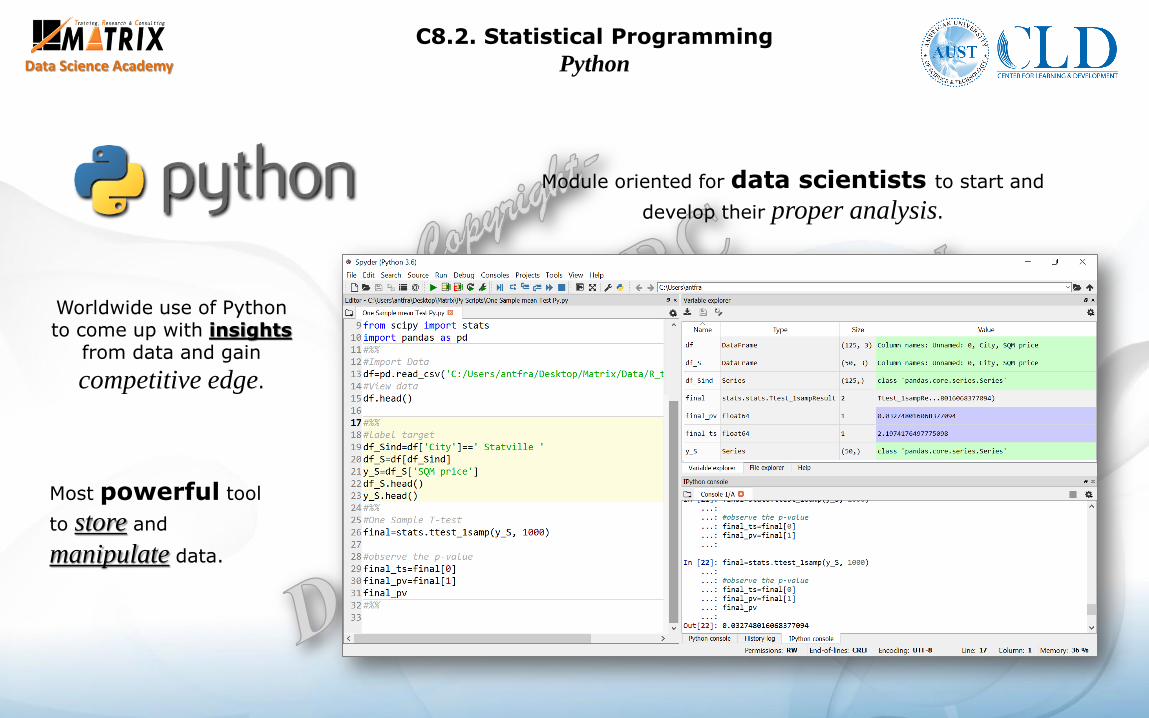
Worldwide use of Python to come up with insights
from data and gain
competitive edge.
Module oriented for data scientists to start and
develop their proper analysis.
Most powerful tool
to store and
manipulate data.
C8.2. Statistical Programming
Python

Data Science Academy
C8.3. Statistical Programming
SAS Studio
Applied technologies:Applied technologies:
Data Science Academy
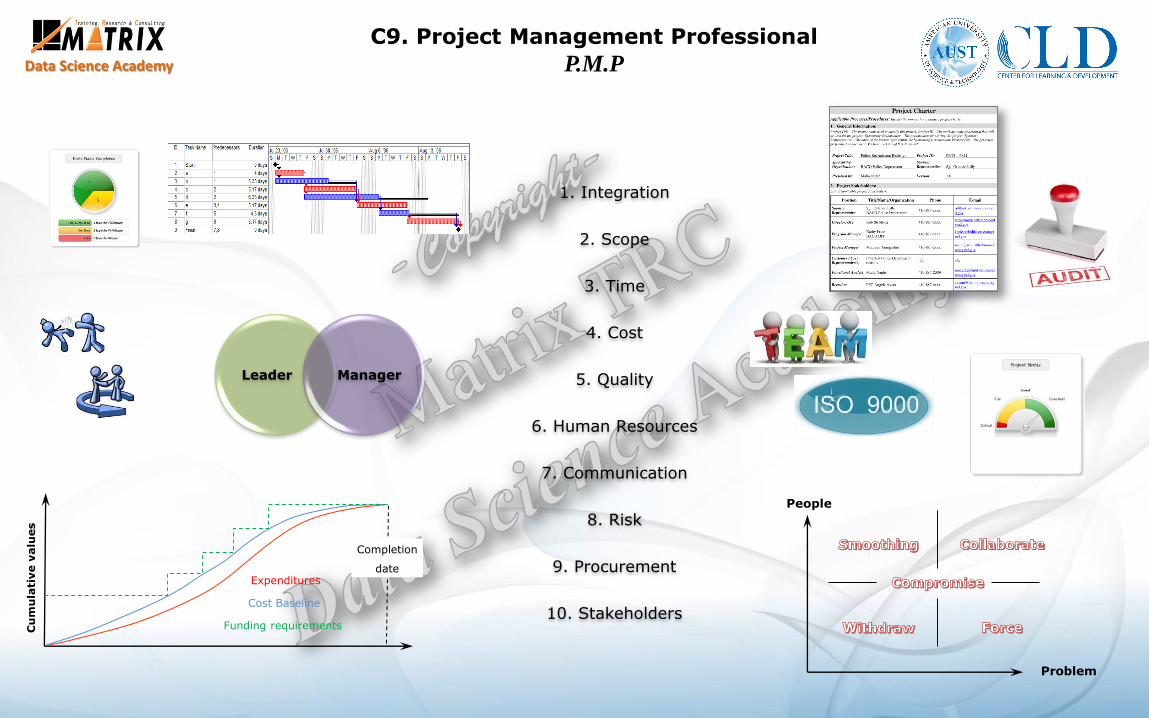
1. Integration
2. Scope
3. Time
4. Cost
6. Human Resources
7. Communication
8. Risk
9. Procurement
5. Quality
10. Stakeholders
Cu
mu
lati
ve v
alu
es
Funding requirements
Expenditures
Completion
date
Cost Baseline
Problem
People
Leader Manager
C9. Project Management Professional
P.M.P

Data Science Academy
IaaS: reducing operational and infrastructure costs
Virtualization and Containerization
Connecting Everything to the Internet
IoT Communication Protocols IoT Architecture IoT market segmentsand value
16%
16%
12%11%
8%
8%
29%
IoT Value Add by 2020 - $1.9 Trillion
Manufacturing
Healthcare
Insurance
Banking & Sec.
Retail & Wh.
Comp. Services
Others
App
Bins/Libs
Guest OS
MySQL
Bins/Libs
Guest OS
MySQL
Bins/Libs
Guest OS
Hypervisor
Host OS
Server
APP
Bins/Libs
MySQL
Bins/Libs
Container Engine
Host OS
Server
APP
MySQL
APP
MySQL
Virtual Machines Containers
C10.1. Big Data
Cloud and IoT
Data Science Academy
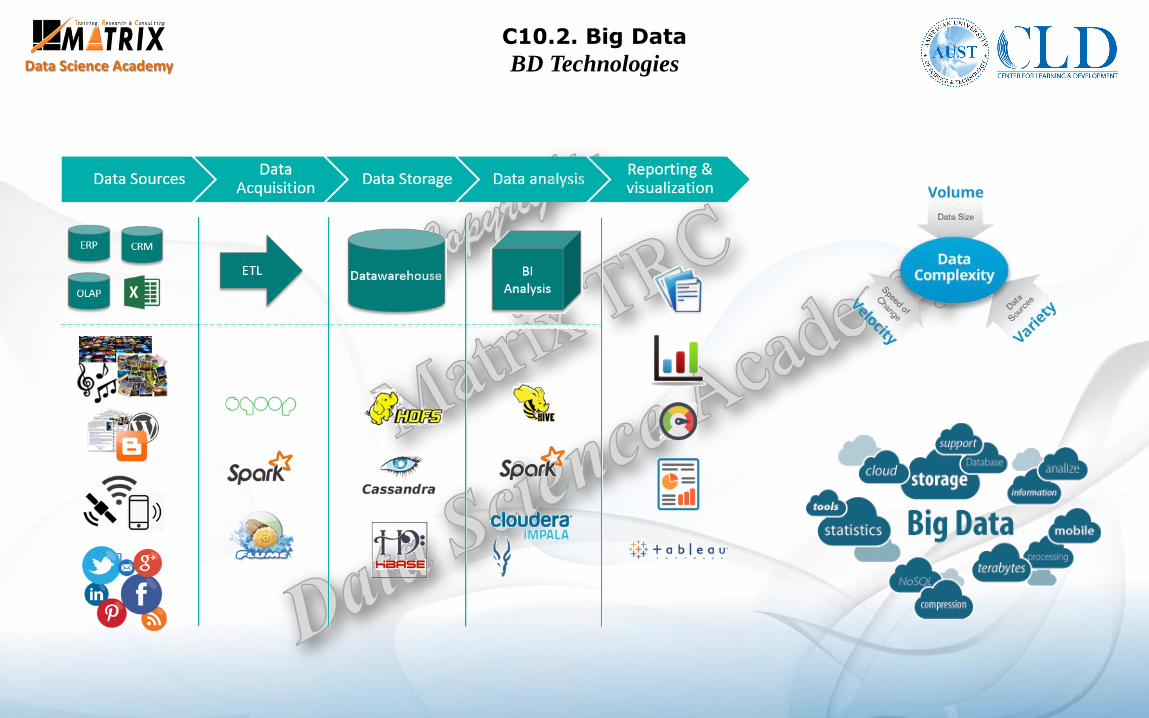
C10.2. Big Data
BD Technologies

Data Science Academy
C10.3. Big Data
BD Analytics with SPARK
Data Science Academy
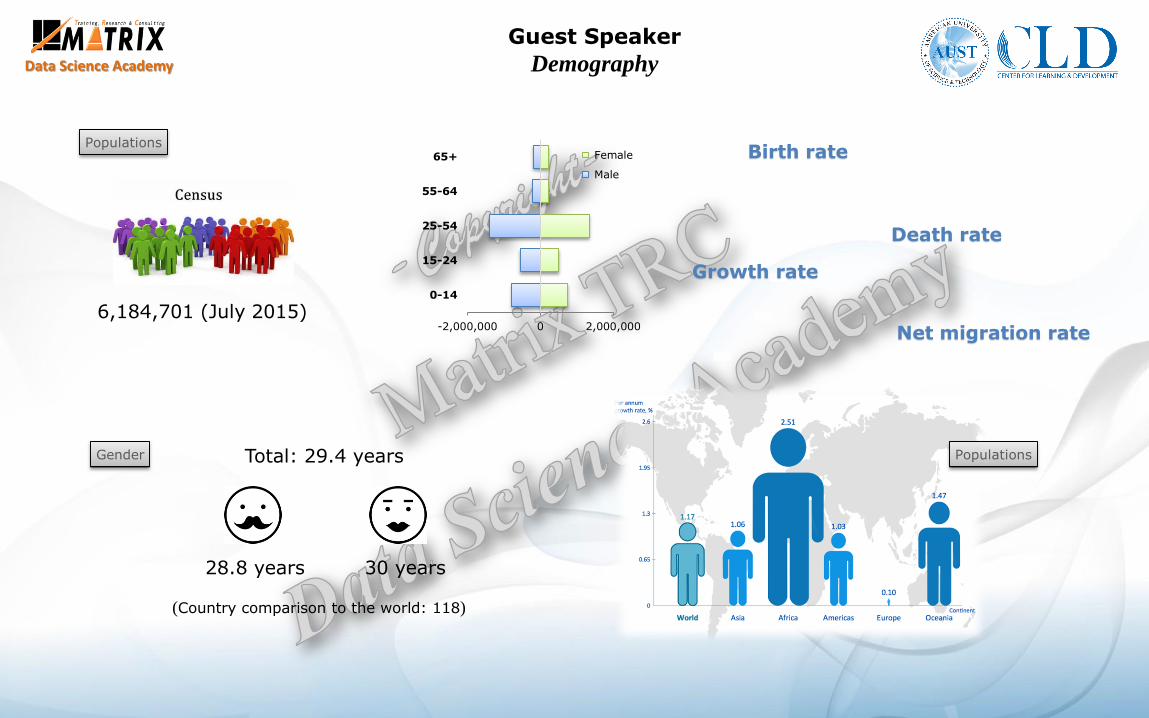
6,184,701 (July 2015)-2,000,000 0 2,000,000
0-14
15-24
25-54
55-64
65+ Female
Male
Guest Speaker
Demography
Populations
Gender
(Country comparison to the world: 118)
28.8 years 30 years
Total: 29.4 years Populations
Growth rate
Birth rate
Death rate
Net migration rate
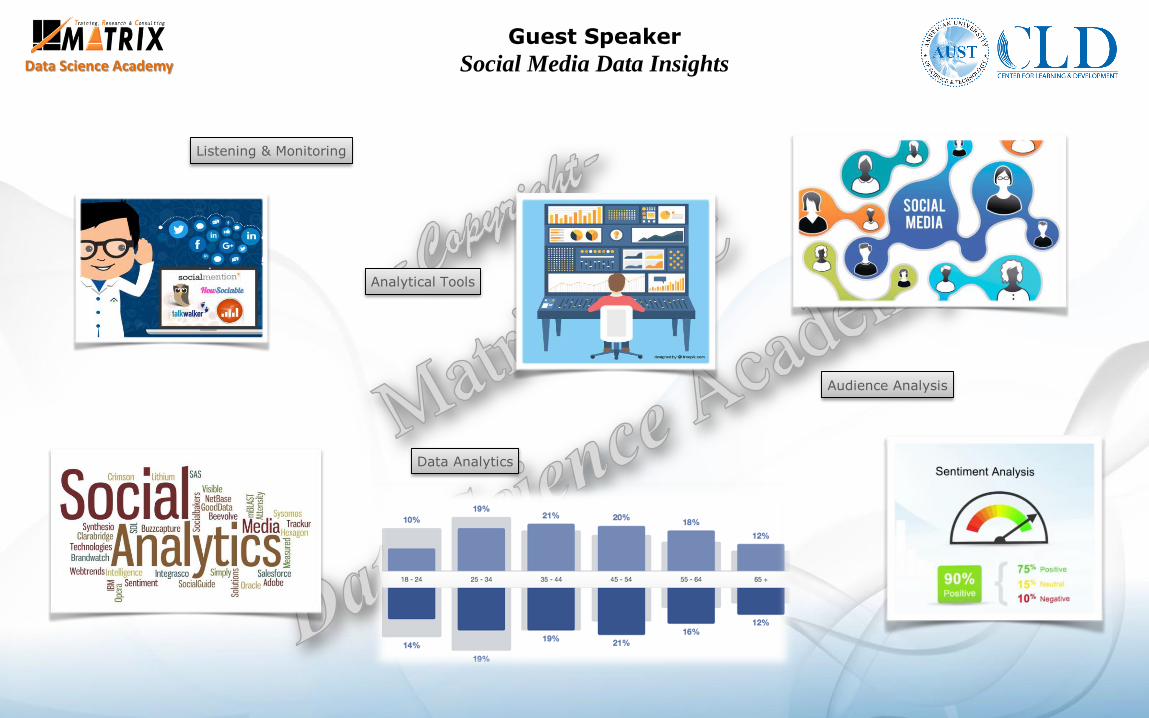
Data Science Academy
Listening & Monitoring
Audience Analysis
Analytical Tools
Data Analytics
Guest Speaker
Social Media Data Insights
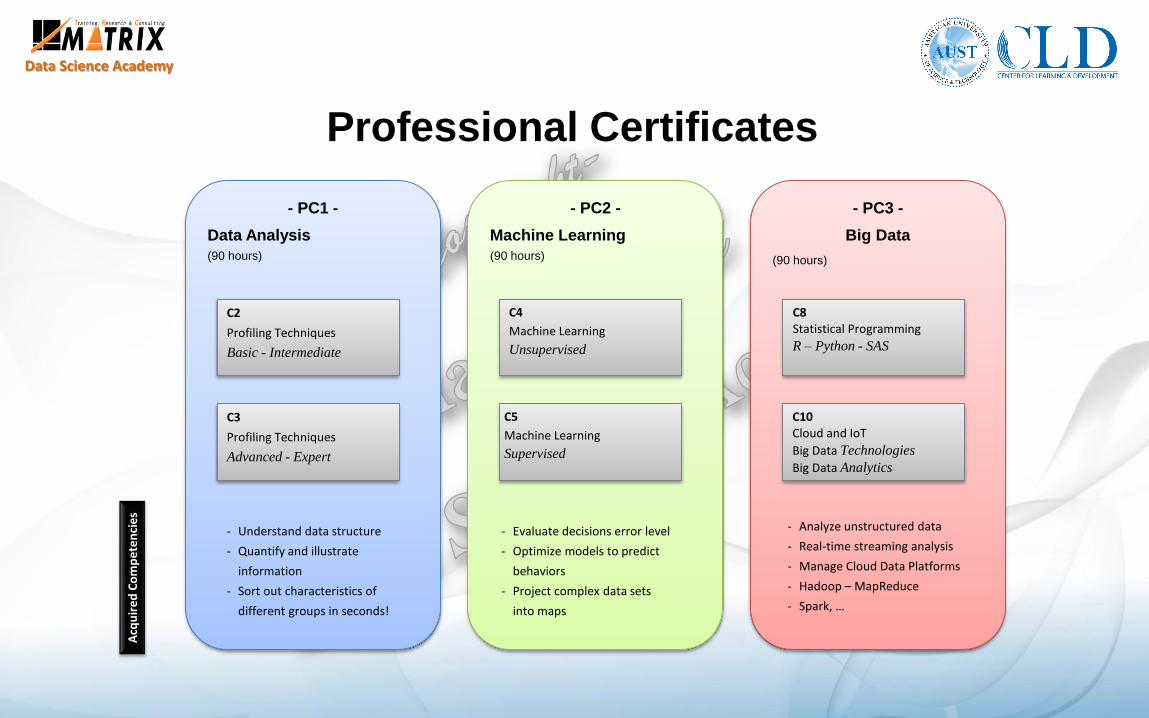
Data Science Academy
- PC1 -
Data Analysis
(90 hours)
- PC2 -
Machine Learning
(90 hours)
- Understand data structure
- Quantify and illustrate
information
- Sort out characteristics of
different groups in seconds!
- Evaluate decisions error level
- Optimize models to predict
behaviors
- Project complex data sets
into maps
- PC3 -
Big Data
(90 hours)
- Analyze unstructured data
- Real-time streaming analysis
- Manage Cloud Data Platforms
- Hadoop – MapReduce
- Spark, …
Professional CertificatesA
cqu
ire
d C
om
pe
ten
cie
s
C4
Machine Learning
Unsupervised
C10Cloud and IoT
Big Data Technologies
Big Data Analytics
C3
Profiling Techniques
Advanced - Expert
C2
Profiling Techniques
Basic - Intermediate
C5
Machine Learning
Supervised
C8Statistical Programming
R – Python - SAS

Data Science Academy
The Specialties and DS Diploma
Data Scientist450 hours
Senior Data Analyst270 hours
Junior Data Analyst135 hours
C1
Data Analysis Foundations
Benefit from the most flexible repayment plan. Settle part of your tuition fees gradually at
0% interest, and the remaining amount over 1 year after a grace period of 6 months.U LOAN
C2
Profiling Techniques (Basic – Intermediate)
C3
Profiling Techniques (Advanced – Expert)
C4
Machine Learning (Unsupervised)
C5
Machine Learning (Supervised)
C6
Quality / Forecasting / Epidemiology
C7
Business Intelligence
C8
Statistical Programming: R - Python & SAS
C9
Project Management Professional (P.M.P)
C10
Big Data
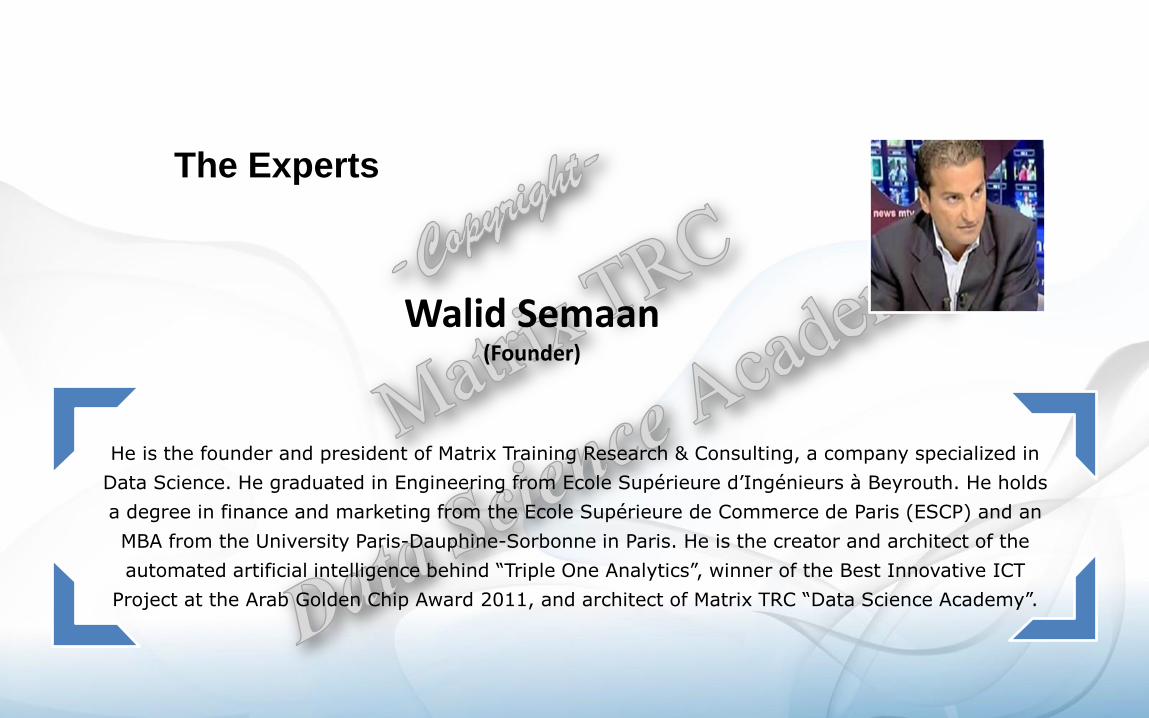
Walid Semaan(Founder)
He is the founder and president of Matrix Training Research & Consulting, a company specialized in
Data Science. He graduated in Engineering from Ecole Supérieure d’Ingénieurs à Beyrouth. He holds
a degree in finance and marketing from the Ecole Supérieure de Commerce de Paris (ESCP) and an
MBA from the University Paris-Dauphine-Sorbonne in Paris. He is the creator and architect of the
automated artificial intelligence behind “Triple One Analytics”, winner of the Best Innovative ICT
Project at the Arab Golden Chip Award 2011, and architect of Matrix TRC “Data Science Academy”.
The Experts
Murray De Villiers(Advisory Board)
The Experts
Murray de Villiers is a Senior Manager for SAS’ Global Education Practice Academic Program. He is responsible
for the establishment and development of undergraduate and post-graduate SAS academic data science and
advanced analytics programs at universities in Southern- and Eastern Europe, Middle East and Africa, as well as
in other emerging economies. This includes the establishment of SAS Academic Flagship Universities, SAS
Academic Thought Leaders and the establishment of various inter-university and industry-university collaboration
programs, empowering academia, students and learners with appropriate skills for lucrative careers. Prior to
taking this position, Murray has held various roles in SAS, including leading Marketing, Education, IT, Sales and
SAS Partner enterprise system sales efforts in South Africa.
Riaan De Jongh(Advisory Board)
Riaan de Jongh is the Director of the Centre for Business Mathematics and Informatics® at the North-West University
(NWU). He has received awards for the best published research in a particular year from the Operational Research
Society of South Africa (ORSSA), the South African Statistical Association (SASA), the Actuarial Society of South Africa
(ASSA) and Risk.net. He is a Past President and Fellow of SASA, received a Thought Leader Award from SASA and a
National Recognition award from ORSSA. He also served on the boards of several local and global associations. He is
the Vice-Chairperson of the NWU Pension Fund and served on various committees for the Global Association of Risk
Professionals, the Professional Risk Managers’ International Association, the International Society for Business and
Industrial Statistics, and the Global Certified Enterprise Risk Actuary (CERA) Review Panel.
The Experts
Anthony Franklin is an expert statistician with experience in many software languages
including open source technologies. Anthony conducted his doctoral studies at North
Carolina State University and completed his graduate assistantship with the NCSU Institute
of Advanced Analytics. Anthony resides in North Carolina and currently is a Sr. Analytics
Architect at SAS Institute with experience in risk management, hospitality and sports
analytics.
The Experts
Anthony Franklin(Advisory Board)
Pierre EL HADDAD is currently a Hubert H. Humphrey Fellow at The Maxwell School for Citizenship and Public
Policy, Syracuse University, New York, US. He is also a consultant, university teacher in management at
University of Balamand-Lebanon, and has twenty years of experience in private business management. His
present concerns relate to the participatory and collaborative institutional development towards sustainable
organizations and communities. In parallel, he is developing a CSR decision-making model, and studying the
role of the private sector in public administration reform.
Pierre has a doctorate in Business Administration from Jean Moulin University-Lyon III as well as a master in
civil engineering from Saint-Joseph University and an MBA in economics and finance from Notre-Dame
University in Lebanon.
The Experts
Pierre EL HADDAD

Helgard Raubenheimer is an Associate Professor and Head of the SAS Lab and BMI professional masters
programmes at the Centre for BMI, North-West University. He received a Ph.D. in Risk Analysis from the North-
West University. His main research interest is in quantitative risk management. He has also supervised several
master degree students on their industry research projects and is involved in research and consultation
projects for financial institutions. He is also co-author of numerous peer-reviewed papers, which have received
national and global awards.
The Experts
Helgard Raubenheimer
Michel Sabbagh comes from a data science background having started his career as Oracle Database
Administrator for Libatel Lebanon and Libatel Jordan and later on for Path Solutions. In 2002 He moved
to SABIS as a project manager for an oracle laboratory where he produced many data projects that
includes international data replication, and data warehouse. He spent 4 years in SABIS educational
services before moving to BSynchro in 2006 as Head of Business intelligence department where he
delivered many business intelligence projects including HAAD the data warehouse and business
intelligence project for ministry of health in UAE. In 2009 he moved to BDL as Project Manager for one
of the biggest and more advanced data warehouse in the ME region.
The Experts
Michel Sabbagh

Christopher Ilmberger is the founder at, Rayet Technologies, Inc. with over 17 years experience in data
management technology, including projects focusing on data quality, data integration, modeling, MDM,
and data governance. Christopher has worked in all verticals implementing data management
practices, data warehousing, providing consulting, support, and pre-sales assistance. Deploying
systems domestically and abroad building scalable solutions.
He earned a bachelor's degree from North Carolina State University and was an early employee of
DataFlux, which was purchased by SAS in 2000. Assisted in the integration of DataFlux into SAS.
The Experts
Chris Ilmberger

Danielle is presently Head of BD at LGB Bank, with previous experience of 7 years at Fransabank, and
10 years at Byblos Bank where she held several senior and managerial positions. Her career evolved
around managing the implementation of several projects and establishment of new departments units.
Besides her banking profession, Danielle is a part time lecturer in strategy, entrepreneurship,
marketing and mainly project management at Saint Joseph University. She holds a Master of Business
Administration (M.B.A.) from Paris Dauphine Unversity (IAE de Paris) and under way to her doctorate in
Business Administration and Management at Paris-Saclay University.
The Experts
Danielle Skaff
Karim earned a PhD degree in Software Engineering and is passionate about Service Oriented
Architecture, Cloud Computing & Software methodology. He has a broad experience working with
leading multi-national companies in Europe. Karim has also a sound academic experience and is
currently assistant professor and coordinator of the business computing degree at St. Joseph
University. He is actual a leading consultant at Element^n, expert in cloud development solutions.
The Experts
Karim Saikali
Elie Zeidan is currently the Head of Cyber Intelligence Unit at Potech Consulting. Mr. Zeidan received his
Engineering Degree in Communication and Computer from the Lebanese University and pursued his
Masters’ Degree in Systems and Networks Security at Saint Joseph University. He has executed
numerous missions in the information security field such as penetration tests, digital forensics, source
code review, database and systems hardening for large networks in several countries such as Lebanon,
France, UK, Cyprus, Jordan, KSA etc. He is currently an instructor at Saint Joseph University in
Information Security, Cybercrime and Ethical hacking. He was part of several public talks such as the
Anti-Cybercrime forum - the Cybercrime Bureau of the Internal Security Forces- Iktissad wal Amal
Group, ICAR'17 – Antonine University, IoT Security – ISACA Lebanon, the Pre-Emptive Cybersecurity
Training - USJ – Berytech.
Elie Zeidan
The Experts
Dr. Maria Saadeh received her dental degree (DDS) from the Lebanese University School of Dentistry, and herpostgraduate residency education in Orthodontics at the American University of Beirut Medical Center. Sheholds a Master of Science in Human Morphology from the American University of Beirut Faculty of Medicine anda Master of Public Health (MPH) from the Faculty of Health Sciences at the same university. In addition, sheearned her PhD degree in Odontological Sciences from the Doctoral School of Science and Technology at theLebanese University in collaboration with the American University of Beirut.Dr. Saadeh is an Instructor in the Department of Orthodontics at Lebanese University, Faculty of DentalMedicine and a Clinical Associate at the Division of Orthodontics and Dentofacial Orthopedics at AUBMC.She is the founder and director of “Charts- Research Design and Biostatistics”, a company that handlesresearch designs and statistical analyses in the biomedical field. She is a current senior editor of theInternational Journal of Oral and Dental Sciences (IJODS). Her scholarly contributions include publications inpeer-reviewed indexed journals and presentations at national and international meetings.
The Experts
Maria Saadeh
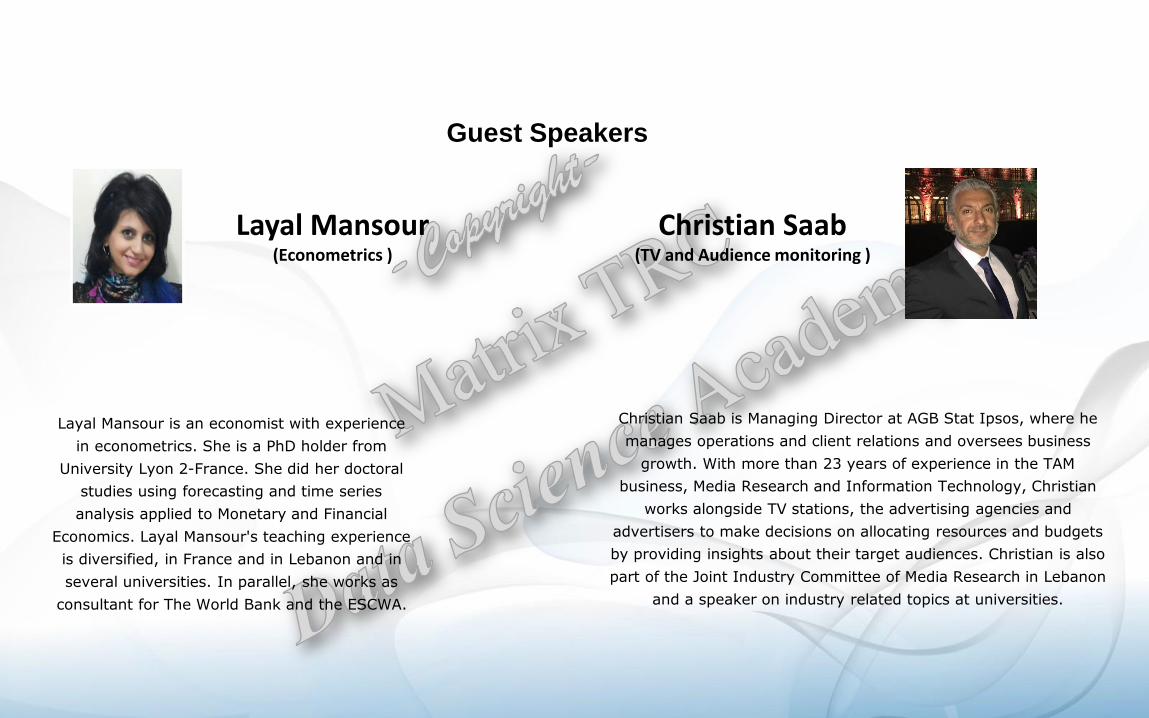
Christian Saab is Managing Director at AGB Stat Ipsos, where he
manages operations and client relations and oversees business
growth. With more than 23 years of experience in the TAM
business, Media Research and Information Technology, Christian
works alongside TV stations, the advertising agencies and
advertisers to make decisions on allocating resources and budgets
by providing insights about their target audiences. Christian is also
part of the Joint Industry Committee of Media Research in Lebanon
and a speaker on industry related topics at universities.
Guest Speakers
Layal Mansour is an economist with experience
in econometrics. She is a PhD holder from
University Lyon 2-France. She did her doctoral
studies using forecasting and time series
analysis applied to Monetary and Financial
Economics. Layal Mansour's teaching experience
is diversified, in France and in Lebanon and in
several universities. In parallel, she works as
consultant for The World Bank and the ESCWA.
Christian Saab(TV and Audience monitoring )
Layal Mansour(Econometrics )
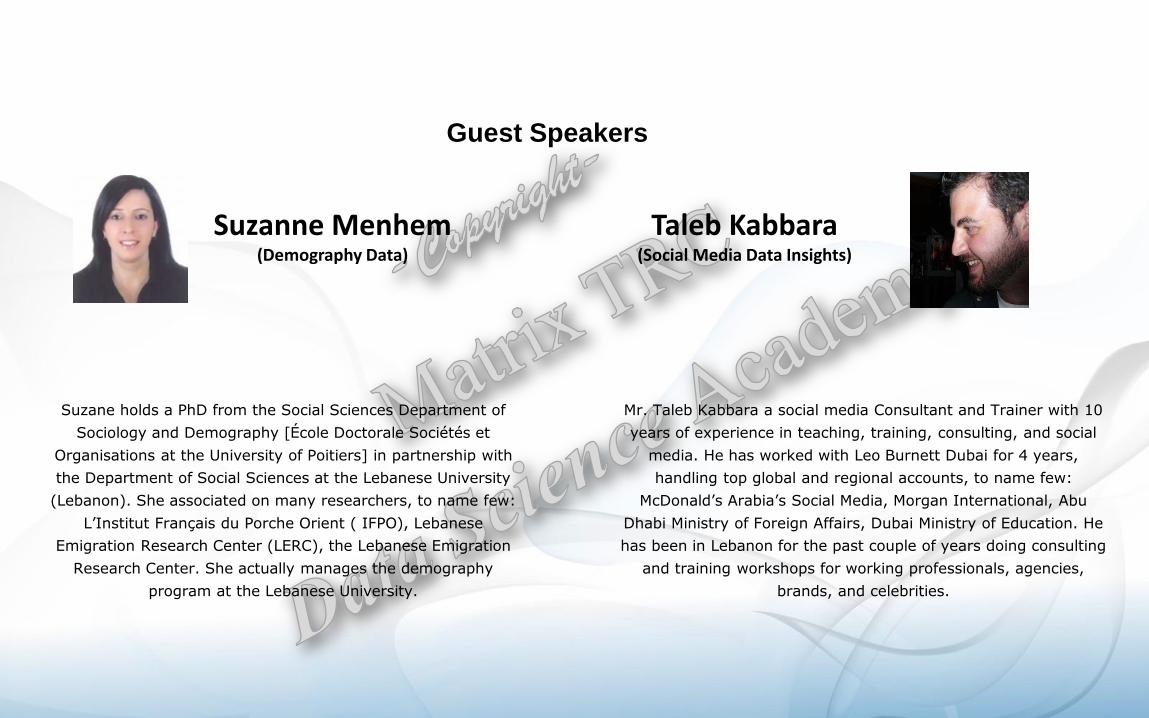
Taleb Kabbara(Social Media Data Insights)
Suzane holds a PhD from the Social Sciences Department of
Sociology and Demography [École Doctorale Sociétés et
Organisations at the University of Poitiers] in partnership with
the Department of Social Sciences at the Lebanese University
(Lebanon). She associated on many researchers, to name few:
L’Institut Français du Porche Orient ( IFPO), Lebanese
Emigration Research Center (LERC), the Lebanese Emigration
Research Center. She actually manages the demography
program at the Lebanese University.
Mr. Taleb Kabbara a social media Consultant and Trainer with 10
years of experience in teaching, training, consulting, and social
media. He has worked with Leo Burnett Dubai for 4 years,
handling top global and regional accounts, to name few:
McDonald’s Arabia’s Social Media, Morgan International, Abu
Dhabi Ministry of Foreign Affairs, Dubai Ministry of Education. He
has been in Lebanon for the past couple of years doing consulting
and training workshops for working professionals, agencies,
brands, and celebrities.
Guest Speakers
Suzanne Menhem(Demography Data)

Data Science Academy
Matrix TRCData Science AcademyMar Roukoz - Berytech Technological PoleWalid Semaan: 961 3 636 208Fax: 961 4 533 040Website: www.matrixtrc.com
Center for Learning & DevelopmentAmerican University of Science & TechnologyBeirut – Ashrafieh – Alfred Naccache AvenuePhone: 961 1 218716/7 Ext. 333Fax: 961 1 339302Website: www.aust.edu.lb