Embed Size (px)
DESCRIPTION
fghnxzfg
Citation preview
INFORMATION SYSTEMS AND DEMAND VOLATILITY IN MANUFACTURING: AN EMPIRICAL ANALYSIS OF ENVIRONMENTAL CONTINGENCIES
TO VALUE CREATION
Terence J. Saldanha Stephen M. Ross School of Business, University of Michigan, Ann Arbor, MI 48109
E-mail: [email protected]
Nigel P. Melville Stephen M. Ross School of Business, University of Michigan, Ann Arbor, MI 48109 E-mail: [email protected]
Ronald Ramirez
Business School, University of Colorado, Denver, CO 80202 E-mail: [email protected]
Vernon J. Richardson Sam M. Walton College of Business, University of Arkansas, Fayetteville, AR 72701 E-mail: [email protected]

1
Abstract
Information systems (IS) have enabled the transformation of supply chains. Prior research suggests that manufacturing plants facing higher demand volatility may benefit from tightly-coupled integration. We examine this thesis by analyzing the extent to which value generated by IS is contingent upon demand volatility. We employ a plant-level dataset comprising manufacturing plants with varying demand volatility to test developed hypotheses. Our first empirical result suggests that when faced with volatile demand, plants employing IS for information partnering with suppliers and customers experience positive and significant benefits to performance, in terms of both labor productivity and inventory turnover. In contrast, results suggest that plants employing IS for transaction efficiency in volatile environments do not experience such benefits. Our second main result indicates that in the context of demand volatility, these distinct applications of IS also have different performance implications within a plant’s value chain. Finally, our third result suggests that beyond internal impacts, demand volatility has differing implications for the value of these applications of IS in terms of competitive performance. Our research represents one of the first empirical analyses concerning the value of inter-organizational IS utilized for information partnering and transactions in manufacturing plants, under conditions of varying demand volatility.
Keywords: Supply chain, Information Sharing, Transaction Processing, Environmental Turbulence, Dynamic Capabilities, Agility, Demand Volatility, IT Business Value, Productivity, Inventory Turnover. Disclaimer: Any opinions and conclusions expressed herein are those of the authors and do not necessarily represent the views of the U.S. Census Bureau. All results have been reviewed to ensure that no confidential information is disclosed. Acknowledgements
We thank the U.S. Census Bureau, Clint Carter, Margaret Levenstein, Arnold Reznek, Cheryl Grim, Ahmad Yusuf, Tammy Riggs, and staff at the Michigan Census Research Data Center (and other Census Data Centers) for access to the datasets and their untiring support. Support for this research at the Michigan RDC from NSF (ITR-0427889) is also gratefully acknowledged. We are grateful to all participants for their inputs at the 2009 Joint U.S.-Canadian Census Research Data Center Conference held at the Cornell Institute for Social and Economic Research, Ithaca, NY, where an earlier version of this article was presented as a poster. We also thank Dennis Severance, M.S. Krishnan, and all participants, faculty and doctoral students at the BIT Seminar Series at the Stephen Ross School of Business for their useful inputs on preliminary versions and presentations based on earlier drafts of this article. Any errors, inaccuracies, oversights and omissions that remain in this article are ours alone.

2
1. INTRODUCTION
Information systems (IS) have fueled the transformation of supply chains. The scope of
strategic options has expanded from transaction-oriented arms-length relationships to strategic,
long-term partnerships. Interfirm relationships generate value for supply chain partners by
enabling information transparency, lowering barriers to bi-directional information flow across
organizational boundaries, facilitating efficient coordination and integration of processes, and
enabling coordinated strategic planning (Bharadwaj et al. 2007; Dehning et al. 2007; Lee et al.
2004; Rai et al. 2006; Subramani 2004; Zhu 2004b). Another central benefit of IS-based supply
chain integration is the enablement of agile supply chains to meet dynamic marketplace
requirements (Saraf et al. 2007).
At Heineken USA, for example, the beer manufacturer introduced a collaborative
forecasting and replenishment system that strengthened its front-end distribution processes. The
system helped tighten linkages between Heineken and its distributor and retail partners,
providing the capability to better match finished-goods product supply with variations in
seasonal and regional demand (Managing Automation 1997). Similarly, Proctor & Gamble
(P&G) created a “consumer driven supply chain network” using information systems to integrate
supply chain partners, enabling P&G to better meet consumer demand requirements. The P&G
network utilized aggregate point-of-sale scanner data sourced from its key accounts to run
manufacturing plants at a 6-8 hour replenishment response time. Via a web portal, the network
also allowed P&G to share consumer demand data and real-time production plans with upstream
supply chain partners (SupplyChainBrain 2006).
Demand volatility, defined as inconsistent, unstable or high-variance demand for a
company’s goods and services, is a particularly important industry dynamic. Volatility results in

3
uncertainty for a firm and can lead to several adverse effects. For example, volatility can degrade
customer service levels, reduce product revenues (Waller et al. 1999), increase stockouts and
lower profit margins (Kulp et al. 2004), and increase risks associated with over-production
capacity and under-production capacity (Tan 2002). It can also result in a bullwhip effect as
demand variability impacts are amplified across the supply chain (Lee et al. 2004).
To mitigate these effects, firms often turn to information systems. When volatility is high,
firms utilize online channels as an efficient means of interacting with customers (Kiang and
Raghu 2000). Firms such as Cisco utilize e-hubs to track inventory and order status of upstream
suppliers (Lee et al. 2004). Inventory management systems are implemented by firms to share
production planning data and customer inventory data with upstream partners and downstream
clients (Waller et al. 1999). These applications promote information transparency, helping firms
coordinate their efforts to match supply with demand.
Anecdotes from practice, case studies, and analytic modeling studies suggest that supply
chains facing higher demand volatility may benefit from tightly coupled integration among
supply chain participants. In such situations, using information technology (IT)1 to enable
strategic information-based partnerships may be more beneficial than simply using IT for
transaction efficiency (e.g., e-sales). However, despite the conceptual and practical basis for IS-
based value creation in volatile demand conditions, we could not identify prior quantitative
empirical studies examining this phenomenon. To address this knowledge gap we examine the
following research question: To what extent is IS-based value creation contingent upon demand
volatility? More specifically, under volatile demand conditions, does the type of application of
information systems (information-partnering oriented IS versus transaction efficiency oriented
IS) used between supply chain partners influence value creation? 1 In this paper, we use the terms “Information Systems” (IS) and “Information Technology” (IT) interchangeably.
4
To examine this research question we focus on manufacturing sector plants. Similar to
prior research, this allows us to eliminate unobserved heterogeneity in production between
manufacturing and services, but allows for sufficient variation in the variables of interest (Banker
et al. 2006; Berndt and Morrison 1995; Dong et al. 2009; Morrison 1997; Zhu and Kraemer
2002). We define two constructs that capture different applications of interorganizational
information systems. First, we define IT for transactions with suppliers and customers (ITT) as
the use of IT for transactional purposes (e.g. online ordering) with suppliers and customers.
Second, we define IT for information partnering with suppliers and customers (ITIP) as the use
of IT for various dimensions of information sharing (e.g., information sharing of production
schedules and design specifications) across the value chain with suppliers and customers. We
analyze a unique dataset containing variables specifying how manufacturing plants employ IS for
various objectives, such as whether a plant uses computer networks for purchasing and selling, or
for sharing information with suppliers and customers. Specifically, our data sample comprises
proprietary plant-level U.S. Census Bureau microdata, with core data on IS use derived from the
Computer Network Use Supplement (CNUS) survey. CNUS data have been used in prior studies
of IT business value (Atrostic and Nguyen 2005). Our estimations of cross-sectional time-series
econometric specifications in the 1999-2001 timeframe yield several new findings.
First, we find that demand volatility is a significant moderator of the link between IS and
manufacturing plant value generation. This finding holds for two factors that contribute to value
generation (labor productivity and inventory performance) and two types of application of IS (IS
used for information partnering and IS used for transaction efficiency). However, we find
different effects, depending on how firms apply interorganizational IS. Specifically, in the
presence of high demand volatility, our findings suggest that plants employing IS for information

5
partnering (ITIP) experience a positive and significant performance benefit. In contrast, results
suggest that in volatile environments, IS used for transaction efficiency (ITT) with supply chain
partners does not improve plant performance.2 As our results suggest, in times of unpredictable
demand, plants must share information with external partners to coordinate and adapt inter-
organizational processes in the supply chain rather than rely upon automated processes that are
inflexible in a variable environment.
Second, under conditions of demand volatility, the nature of the IS-inventory
performance relationship varies across a plant’s value chain. We find that demand volatility
negatively impacts the link between transaction-efficiency oriented IS (ITT) and inventory
performance in the backend (raw materials), in production (work-in-process), and in the frontend
(finished goods) of a plant’s value chain. Consistent with our main results, IS used under volatile
conditions to integrate supply chain participants (ITIP) improves the performance of a plant; in
this case, backend raw materials inventory. Together, these results suggest that information
systems used for different purposes in situations of demand volatility can have differential
effects on internal operational performance. In particular, the integration and coordination of a
manufacturing plant with its suppliers, enabled by IS, may help to improve the management and
performance of the plant’s materials input processes.
Our third area of analysis examines the competitive performance implications of IS
applied in situations of demand volatility. In this context, we find that the use of information
systems to integrate supply chain partners (ITIP) positively contributes to market performance.
This implies that in volatile demand conditions, strategic integration of a manufacturer with its
trading partners may improve the likelihood that products will meet customer demands.
2 Though our unit of analysis in this study is not supply chains, we use the phrase “supply chain” to refer to the context of our study and “supply chain partners” to refer to suppliers and customers.

6
Consistent with earlier results, IS used for transaction efficiency (ITT) does not appear to be a
performance-enhancing investment when a manufacturer is faced with volatile market demand.
In sum, our paper contributes to the IS and operations literatures by shedding new light
on IS value creation in manufacturing under varying conditions of demand volatility, using
multiple measures of performance. To improve performance, our results suggest that in situations
of demand volatility, manufacturers should pursue integration with supply chain partners through
investment in information technology. The pursuit of transaction efficiency through technology
may be a better fit in situations where routine processes are accomplished to meet predictive, less
variant demand. In addition, when operating in volatile environmental conditions, it may be
possible for manufacturers to target specific internal operational improvements through targeted
IT investment.
The remainder of the paper is organized as follows. In Section 2, we review related
literature. Theoretical background and hypotheses are presented in Section 3. Section 4 describes
the research design and methodology. In Section 5, we present results of our empirical analysis.
In Section 6, we discuss the implications and limitations of the study, how these limitations
might be overcome in future research, and directions for future research.
2. LITERATURE REVIEW
2.1 Demand Volatility
Demand volatility is a major contributor to overall environmental uncertainty and has
been identified as an important factor influencing supply chains (Fine 2000; Germain et al.
2008). Demand volatility can have many negative effects on firms, degrading customer service
levels, reducing product revenues and overall operational and financial performance (Waller et
al. 1999; Germain et al. 2008; Gattorna 1998; Kulp et al. 2004). Many of these effects occur due
7
to the distortion in production information that occurs as demand data is passed upward in the
supply chain. Ultimately, volatility may engender a “bullwhip effect” as firms build safety stocks
to buffer the wide variations in customer demand that occur due to economic shocks,
promotions, and other factors influencing product purchases (Lee et al. 2004).
Mitigating Negative Effects of Demand Volatility
Analytic studies related to the value created through information sharing partnerships
under varying demand conditions yield mixed conclusions. Cachon and Fisher (2000) showed
that there is an upper bound on the value of information sharing within the context of a stationary
demand supply chain – accelerating the physical flow of goods through a supply chain is
significantly more valuable than expanding the flow of information. Raghunathan (2001) found
that information sharing is of limited value when the parameters of the non-stationary demand
process are known to both parties because manufacturers can reasonably forecast demand
without the information given by the retailer. Gosain et al. (2005) examined supply chain
partnerships and found that the breadth of information sharing was negatively associated with
partnering and supply chain flexibility. Flexibility was defined and assessed as the ability of the
organization to phase out new products, respond to change, and replace business partners.
While demand volatility is likely to be a major factor affecting the value of information-
based partnerships, it can have different influences on the value of information sharing (Li et al.
2005). In a theoretical model, Lee et al. (2000) posit that the value of information sharing is
higher when demand variance is higher. In contrast, Chen (1998) finds that the value of
information sharing is mitigated in a volatile environment. Other analytical models have found
the value of information sharing to be higher when there is less variance in demand (Gavirneni et
al. 1999; Schouten et al. 1994) or when demand is more correlated across time periods

8
(Ragunathan 2003). In an experimental study, Steckel et al. (2004) concluded that sharing end-
customer sales data was harming supply chain performance, when demand was assumed to be
changing continuously. In that situation, the sales data were distracting the distributor from other
information. Comparatively, reducing lead times was highly beneficial for decision making in
their experiment. A similar result was obtained by Treville et al. (2004), suggesting that the
benefits from lead-time reduction are greater than the benefits from improving transfer of
demand information.
In sum, there is broad agreement on potential underlying mechanisms and empirical
presence of negative impacts of demand volatility on supply chain efficiency. However, there is
not as much agreement regarding the role of information sharing in mitigating such negative
impacts, exacerbated by the scarcity of quantitative empirical analyses to inform understanding.
2.2 Value Creation via Information Sharing in the Supply Chain Context
In the context of supply chains, the value of information systems has been examined in
terms of e-business transactions and their impact on sales and internal operations (Amit and Zott
2001; Zhu 2004a; Zhu and Kraemer 2005). IT for transactions is an enabler of performance.
However, the mere use of technology is not a robust indicator of collaborative value creation in
the supply chain (Sabath and Fontanella 2002; Sanders 2007).
Beyond use of technology for transactions (e.g., online sales), information sharing (e.g.,
sharing information about production schedules) represents a higher level of strategic partnership
in the supply chain (Sabath and Fontanella 2002). The role of information sharing in the supply
chain is a topic of great managerial importance and has been a focus of much research in the IS
and operations management literatures (Barua et al. 2004; Cachon and Fisher 2000; Clemons and

9
Row 1993; Devaraj et al. 2007; Mukhopadhyay et al. 1995; Sahin and Robinson 2002).3
Information is widely recognized as an important driver of supply chain performance by
enabling firms to substitute inventory for information (Milgrom and Roberts 1988). The types of
information shared typically include information related to inventory, sales, order status, sales
forecast, and production schedules (Lee and Whang 2000; Lee et al. 1999). Cachon and Fisher
(2000) modeled information sharing in the supply chain and found that information sharing
reduces supply chain costs. At the plant level, Mukhopadhyay et al. (1995) found that
information exchanges between Chrysler plants and their suppliers resulted in significant
operational benefits for Chrysler through improved inventory management and labor savings.
Information sharing may also enable innovation in the context of supply chains (Dong 2010).
Efficiency gains through information exchanges may be even more pronounced in the
current era of open Internet standards. As noted by Frohlich and Westbrook (2001, pp. 196),
“one consequence for supply chain integration of this cheaper, easier Internet communication
may be to extend the types of information exchanged.” IT-enabled supply chain flow integration
including information flow integration can positively influence firm performance (Rai et al.
2006). Examining partnerships as a unit of analysis, Malhotra et al. (2007) found that the use of
standard electronic business interchanges was associated with higher adaptation and knowledge
creation in the supply chain and this effect was mediated through information exchange. In an
empirical study of information sharing between manufacturers and retailers in the food and
consumer packaged goods industry, Kulp et al. (2004, pp. 443) found that information sharing
concerning store inventory information was beneficial, while sharing other types of information
was “not significantly associated with either [perceptual] profit margins or intermediate
measures [of stockouts and price]”. Devaraj et al. (2007) found that information integration with 3 See Chen(2003) for a more detailed survey on information sharing in a supply chain context.
10
suppliers was associated with (perceptual) performance measures while customer integration was
not.
Related to demand volatility, IS research has examined how turbulent conditions may
impact the value from IT. For instance, the marginal product of IT capital at the firm level has
been found to be higher in more dynamic environmental conditions (Melville et al. 2007). In the
context of new product development, it has been found that environmental turbulence negatively
affects the impact of IT functional competencies on competitive advantage (Pavlou and Sawy
2006). However, despite prior research that has informed understanding of the role of
information sharing in supply chains, we could not identify any quantitative empirical studies
that examine IS for information sharing as an enabler of value employing objective measures of
value under varying demand conditions. As noted by Rai et al. (2006, pp. 226), “empirical
research related to the digitally integrated supply chain integration phenomenon has been limited
and piecemeal.” Prior IS literature has also called for research that collects accounting data (such
as inventory turn) to measure performance in a supply chain context (Dong et al. 2009, pp. 30).
Our study is a step towards addressing these knowledge gaps.
3. THEORY AND HYPOTHESIS DEVELOPMENT
As discussed in the previous section, prior research suggests that supply chains facing
higher demand volatility may benefit from tightly coupled integration. We examine several
aspects of this basic thesis. First, we examine how information technology used for transactions
(ITT) and for information partnering (ITIP) with suppliers and customers generate value without
accounting for different demand volatility conditions. Second, we examine the role of both types
of information systems (ITT and ITIP) in the presence of demand volatility. Third, we examine
11
what we might expect when disaggregating inventory. Finally, we shift from operational to
competitive dimensions of value.
3.1 Value of IT for Transactions and IT for Information Partnering
Information technology used for transactions targets the automation of structured and
routine processes. Such applications utilize IT as a substitute for repetitive human effort,
improving the timeliness of each transaction and reducing associated errors (Zuboff 1988). In an
interorganizational setting, these types of technologies help reduce the costs of transactions
between buyers and sellers (Gurbaxani and Whang 1991), as well as associated operational costs
within each participating organization (e.g., shipping costs, Srinivasan et al. 1994). Empirical
work examining the use of technologies like electronic data interchange (EDI) by manufacturers
has demonstrated a contribution to firm savings, in for instance, the purchasing of maintenance,
repair, and operations (MRO) and raw product parts (Mukhopadhyay et al. 1995). Dehning et al.
(2007) find that IT-based supply chain systems increase gross margin, inventory turnover
(particularly raw materials and finished goods inventory turnover), market share, return on sales,
and reduce selling, general, and administrative expenses. Web-based procurement can even go
further in performance improvement by helping to reduce search related costs in purchasing
activities (Subramaniam and Shaw 2002) as well as improve sales and internal operational
efficiencies (Zhu 2004a, Zhu and Kraemer 2005). We thus hypothesize:
H1a: The use of IT for transactions with suppliers and customers (ITT) is positively
associated with value as measured by labor productivity.
H1b: The use of IT for transactions with suppliers and customers (ITT) is positively
associated with value as measured by inventory turnover.
As discussed, information partnering through information sharing can lead to benefits for
supply chain members and forms the core foundation on which supply chain collaboration is

12
based (Lee and Whang 2000). Information-based partnerships enable supply chain members to
informate and transform key business processes (Zuboff 1988). Information partnering also
provides the ability to improve forecasts and coordinate inventory and production decisions
through a shared understanding of performance issues (Rai et al. 2006). Thus, we hypothesize:
H2a: The use of IT for information partnering with suppliers and customers (ITIP) is
positively associated with value as measured by labor productivity.
H2b: The use of IT for information partnering with suppliers and customers (ITIP) is
positively associated with value as measured by inventory turnover.
3.2 Value of IT in Presence of Demand Volatility
Resources that are valuable, rare, inimitable and non-substitutable can yield competitive
advantages (Barney 1991). However, the value of such resources depends on the competitive
environment and can change rapidly as the environment evolves (Katila and Shane 2005; Miller
and Shamsie 1996). Hence, in the case of IT resources, managers must view the value of IT in
conjunction with the firm’s environment (Melville et al. 2004). As such, in our study, we
consider the contingent role of the environmental factor, demand volatility.
When assessing the value of IT used in the supply chain context, we must also consider
the non-homogenous nature of IT resources (Weill 1992).4 According to Weill’s (1992, pp. 313)
classification, “transactional IT” are those IT investments that are implemented to automate the
firm’s transactions, whereas “informational IT” investments are implemented to “provide the
information infrastructure” to enable business tasks. We draw on this theoretical framework to
explicate how the value created from the use of non-homogenous IT components with supply
chain partners (ITT and ITIP) is different under different conditions of demand volatility. As
research has suggested, turbulent environments, as opposed to stable environments, require
4 Weill’s (1992) central tenet of IT as a non-homogeneous construct has often been used to explain mixed research findings on the impact of IT investments (e.g., Lind and Zmud 1995).
13
different IT capabilities for superior performance (Eisenhardt and Martin 2000; Mooney and
Ganley 2007; Overby et al. 2006; Wade and Hulland 2004; Weill et al. 2002).
Information Technology for Transactions (ITT)
IT for Transactions (ITT) is a first stage of integration for the creation of value. Its focus
is on automation of the transaction process and improvement of efficiency. The transition from
transactional IT to collaborative IT requires levels of trust and commitment that are beyond those
typically found in transactional IT relationships. For instance, firms can use IT for EDI and JIT
(Just-In-Time) without achieving the next level of integration where design and long-term
strategic data are shared (Spekman et al. 1998). In a supply chain context, Dong et al. (2009)
argue that the value of commodity-like IT resources that “do not meet the [Resource-based
View] RBV criteria” diminishes under competition.
ITT is an example of a commodity-like resource that will be less valuable in highly
volatile environments. ITT can facilitate integration of transactions but not other elements (such
as strategic planning) that are required to tide over volatile demand conditions. Transactional
technology implementations are thus “inside-out” in nature and their value is likely to be
stronger in stable rather than in turbulent business environments (Wade and Hulland 2004, pp.
126). Since ITT typically does not involve cross-organizational long-term planning (Spekman et
al. 1998), changes in demand can have detrimental effects on the value of IT when used for
purely transactional purposes. For example, orders are the result of “conjectures by the buyer”
and can “distort the true dynamics of the marketplace” (Lee and Whang 2000, pp. 4) and
exacerbate the bullwhip effect. ITT may therefore set forth a chain reaction of ordering for the
firm and to the extent that it automatically does so, ITT may have a negative impact on value in
the presence of demand volatility.
14
Additionally, although the use of ITT may improve the efficiency of organizations, it is
less likely to enable the focal firm to build strategic partnerships with trading partners (Crowe
1992). While ITT helps performance by improving accuracy, eliminating paperwork and
reducing costs, it has negligible impact on planning and scheduling, and does little to help reduce
the uncertainty faced by trading partners in determining future demand. Hence, we hypothesize
that the ability of ITT to add value through increased productivity and inventory turnover will be
mitigated under highly volatile demand conditions. Thus:
H3a: Demand volatility negatively moderates the association between IT for transactions
(ITT) and value as measured by labor productivity.
H3b: Demand volatility negatively moderates the association between IT for transactions
(ITT) and value as measured by inventory turnover.
Information Technology for Information Partnering (ITIP)
As our review of the literature suggests, value created via information-based integrated
partnerships in the presence of turbulent demand conditions has yet to be analyzed empirically. It
is possible that in a changing, volatile environment, information shared may be inaccurate,
unavailable or obsolete (Bourgeois and Eisenhardt 1988). Prior analytic modeling research also
suggests that in situations of larger demand variance, the value of information sharing may be
limited (Chen 1998).
In contrast, we argue that IT for information partnering can help mitigate the negative
impacts of demand volatility. Drawing on the theory of dynamic capabilities (Eisenhardt and
Martin 2000; Teece et al. 1997), information-based partnerships through IT can help the firm
reconfigure its resources in the face of changing business environments (Gosain et al. 2005).
Indeed, analytic modeling research suggests that information sharing across the supply chain is

15
more valuable when parameters of the demand process are unknown (Raghunathan 2001) or
when demand volatility is high (Bourland et al. 1996; Lee et al. 2000).
In more volatile environments, information partnering through IT (ITIP) can potentially
provide new information to managers and improve co-ordination through the reduction of
uncertainty (Clemons and Row 1993). For example, through the electronic sharing of inventory
and order information with its component suppliers, Cisco has developed an agile supply chain
to cope with changing demand (Dong et al. 2009). These information-based partnerships have
significantly improved Cisco’s ability to rapidly respond to demand changes in the supply chain.
Through the sharing of information with suppliers and customers, firms such as Dell and
Whirlpool are better able to match supply with customer demand and to anticipate changes in the
marketplace (Li et al. 2006). Herlitz, a Europe-based manufacturer of office supplies, used J.D.
Edwards Planning Solution to share real-time information with customers and suppliers and to
analyze customer demand fluctuations, thereby achieving lower inventory levels (Business Week
2009). The collaboration between firms based on information partnering can also help the
supply chain participants respond to changes in end-customer demand through improved
scheduling and inventory management techniques (Kulp et al. 2004). For example, integrated
information-based partnerships with suppliers can help the firm plan production schedules with
greater flexibility in manufacturing changeovers so as to adjust to frequent changes in customer
demand and build an agile supply chain by using real-time information (Setia et al. 2008). Thus,
information-based integrated partnerships enabled by IT provide business agility in environments
with “greater clock speeds” (Overby et al. 2006; Setia et al. 2008, pp. 18).
In sum, ITIP can play an important role in supporting the growth of a flexible value
network for a firm, enabling it to transfer real-time information and operate in a high-clockspeed

16
environment (Dedrick and Kraemer 2005). The use of IT to share rich information across
organizational boundaries can help managers overcome problems caused by demand volatility
(Daft and Lengel 1986; Moenart and Souder 1996), reduce information asymmetry and mitigate
the negative effects of variability in demand. Conversely, in stable environments, when IT is
implemented to share information such as demand projections, the IT may not provide any new
information and hence, be of lesser incremental value (Lee et al. 2000; Melville et al. 2007). We
thus hypothesize that the ability of IT to create value through information partnering will be
reinforced in more volatile demand environments. Hence:
H4a: Demand volatility positively moderates the association between IT for information
partnering (ITIP) and value as measured by labor productivity.
H4b: Demand volatility positively moderates the association between IT for information
partnering (ITIP) and value as measured by inventory turnover.
3.3 Disaggregation of Inventory: Backend, In-Production, and Frontend
Recent supply chain value creation research suggests that one or more inventory-related
operational improvements may be driving overall performance. For example, recent research has
considered how the adoption of supply chain management systems differentially affects raw
materials inventory (RMINV), work-in-process inventory (WIPINV) and finished goods
inventory (FGINV) (Dehning et al. 2007). The authors find that supply chain implementations
most directly affect levels of RMINV and FGINV, but not WIPINV, i.e., inventory at the back
and front end of a firm’s value chain, but not inventory in production. Capkun et al. (2009) find
that improvement to inventory in the backend (RMINV) is the most important driver of firm
performance as measured by earnings (EBIT) and gross profit margins. Lieberman et al. (1999)
also document the antecedents of RMINV, WIPINV and FGINV in the automobile industry and
find that each type of inventory is driven by very different factors. Cachon and Olivares (2010)

17
and Claycomb et al. (1999) focus on the analysis of the drivers of certain types of inventories,
such as FGINV only.
Collectively, prior research provides motivation to consider the effect of demand
volatility on IT value creation across disaggregated measures of inventory. Such analysis would
provide indications of where investment in information systems may be more applicable during
situations of volatile demand. Dehning et al. (2007) find the statistically significant effects of
supply chain implementations on the outward interfaces with suppliers (RMINV) and with
customers (FGINV), but no statistically significant effects on its own work-in-process
(WIPINV). These outward interfaces with supply chain partners would most likely be
dramatically affected by changes in demand volatility. We therefore hypothesize:
H5a: Demand volatility negatively moderates the association between IT for transactions
(ITT) and value as measured by RMINV turnover and FGINV turnover.
H5b: Demand volatility positively moderates the association between IT for information
partnering (ITIP) and value as measured by RMINV turnover and FGINV turnover.
3.4 Market-based Performance
Previous hypotheses posit an association between different applications of IS and internal
operational metrics of performance, such as inventory turnover and labor productivity, under
varying levels of demand volatility. At the same time, prior research suggests that IS impacts
other dimensions of organizational performance. For example, Mukhopadhyay and Kekre (2002)
examine buyer-supplier relationships in electronic integration for online procurement, finding
that the supplier derives significant strategic benefits when the customer initiates the system and
the supplier enhances its capabilities. Research has also identified external performance benefits
to IT investment, including improvements in firm market value (Bharadwaj et a. 1999;

18
Brynjolfsson et al. 2002; Dos Santos et al. 1993) and market share (Dehning et al. 2007);
however, these studies do not examine demand volatility. Piccoli and Ives (2005) develop a
theoretical framework that includes the competitive environment as a moderator between barriers
to erosion and sustained competitive advantage (not empirically tested).
While also not controlling for demand volatility, prior research indicates that improved
operational performance generated by IT investment may not result in external competitive
impacts. For example, improvements in productivity may not result in profitability as
productivity impacts can be competed away (Hitt and Brynjolfsson 1996). In a study of a major
Canadian retailer, Subramani (2004) found no evidence of external competitive benefit (e.g.,
market share) from the use of an IT-based supply chain management system by over 130
supplying firms in the retail supply chain. This lack of evidence, “…deserves further
examination” (Subramani 2004, pp. 66).
In sum, we could not identify any existing research that examines measures of external
competitive impacts from IT investments in the supply chain context, while simultaneously
controlling for the effects of demand volatility. Even then, conflicting evidence exists regarding
competitive impacts of IT investment. We help narrow this gap by examining the relationship
between using IT with supply chain partners and market-based performance, in the context of
demand volatility. As proposed but not tested in earlier research, tighter electronic linkages
between supply chain partners by using IT for information partnering may enhance a
manufacturer’s ability to raise its market performance through the development of better fitting
products or customer service. This may occur due to a number of reasons, including better
visibility into new market opportunities, better understanding of customer needs, and better
ability to adjust to changing customer demands (Mithas et al. 2005; Sambamurthy et al. 2003,
19
Zhu 2004). In contrast, in volatile demand conditions, while transactional IT could improve
efficiency through automation, it would not provide differential market performance in the long
run. Thus, we posit:
H6a: Demand volatility negatively moderates the association between IT for transactions
(ITT) and market-based performance.
H6b: Demand volatility positively moderates the association between IT for information
partnering (ITIP) and market-based performance.
4. RESEARCH METHODOLOGY
4.1 Data Sources
Our empirical setting consists of manufacturing plants in the United States. We utilize
micro-data primarily from four U.S. Census Bureau (USCB) surveys (datasets), which have been
used in prior academic studies (Atrostic and Nguyen 2005; Black and Lynch 2001; Dunne 1994).
First, we use data from the 1997 Census of Manufactures (CM) which is conducted by the USCB
in years ending with 2 and 7. Second, the Annual Survey of Manufactures (ASM) is an annual
survey (except for years ending with 2 and 7) conducted by the USCB at the establishment level.
The sampling frame of the ASM reflects the USCB’s desire to select a representative sample.5
The ASM sampling frame during the 1999 timeframe covered approximately 52,000
establishments each year selected from approximately 366,000 manufacturing establishments in
the 1997 Census (USCB 2001). Of these, about 16,600 establishments were selected with
certainty each year based on size (defined by value of shipments and number of employees) and
importance in industry, and the remaining (approximately 35,400) establishments were selected
with probability proportional to a composite measure of establishment size and importance in 5 More details on how the ASM data are collected are provided later. A new ASM sampling frame is introduced at every second year subsequent to each Census year. Since 1999 (which incidentally coincides with the beginning of the time period of our study) was the second year following the 1997 Census, a new sampling frame was selected in 1999 based on the 1997 Census.
20
industry (USCB 2001; 2010a). Responses to the ASM and CM are required by law. Third, we
draw our IT variables and measures from the Computer Network Use Supplement (CNUS)
which was conducted in the form of a mailed survey by the USCB as a supplement to the 1999
ASM and relates to electronic business practices adopted by establishments. The response rate to
the CNUS survey was “approximately 83%” (Atrostic and Nguyen 2005, pp. 497). Fourth, we
use data from the Annual Survey of Plant Capacity Utilization (SPCU). This survey was
conducted annually by the USCB from 1997 to 2006 on approximately 17,000 manufacturing
establishments (with 5 or more paid employees), which were selected with probabilities
proportionate to their value of shipments within each industry (USCB 2010b).
4.2 Dataset Construction
For our study, the CNUS dataset provides data related to the usage of IT for transactions
(ITT) and IT for information partnering (ITIP). The performance variables are drawn from the
ASM and control variables are drawn from the ASM, CM and SPCU.
Manufacturing plants (establishments) can be expected to differ from each other on
various unmeasured characteristics. A cross-sectional ordinary least squares (OLS) estimation
approach would not permit us to account for such heterogeneity, that is, the possibility that
observationally equivalent plants may differ on unmeasured characteristics. For instance, plants
may enter the sample with inherently different inventory management or performance
capabilities. Such unobserved plant-level characteristics (e.g. managerial competencies), which
are correlated with both performance and with our included covariates will bias OLS estimates.
Cross-sectional data analysis can “neither identify nor control” for unobservable individual
effects that “may be correlated with other included variables in the specification of an economic
relationship” (Hausman and Taylor 1981, pp. 1). Panel (cross-section time-series) estimation
21
models are better equipped to control for such unobserved plant-level variables (heterogeneity)
and their correlation with included variables (Greene 2003). Prior IS research has also
underscored the need to control for unobserved heterogeneity in empirical analysis of IS business
value by using longitudinal rather than cross-sectional research designs (Banker et al. 2006;
Bharadwaj et al. 2007; Devaraj and Kohli 2003; Duan et al. 2008; Melville et al. 2004; Mishra et
al. 2007; Srinivasan et al. 1994). We therefore adopt such longitudinal approaches in our study.
An important consideration in the construction of our panel (longitudinal) dataset
concerns the availability of data across years. Whereas the ASM and SPCU are annual surveys,
the CNUS was a one-time survey conducted in 1999. Consistent with prior research in
economics and IS (Black and Lynch 2001; Bresnahan et al. 2002; Brynjofsson et al. 2002;
Ramirez et al. 2010), we extend the CNUS data by assuming that manufacturing plant IT usage
measured in the 1999 CNUS is the same in 2000 and 2001. By doing so, we are able to create a
three-year time-series cross-sectional dataset that allows us to control for unobservable variables
that could influence the relationships under consideration, consistent with recommendations in
prior IS literature to control for unobserved heterogeneity.
This data construction method is reasonable for several reasons. First, e-business systems
and their implementations are important IT investments that require considerable time for
planning and implementation. Consistent with the assumptions of Bresnahan et al. 2002 (pp.
351), while we do not know whether each plant had the same level of technology throughout the
1999-2001 time period, our 1999 measures reflect the technology that was being used during the
study time frame.
Second, each of the IT variables in our study (ITT and ITIP) is composed of multiple
measures; 9 measures for ITT and 12 measures for ITIP. It is very unlikely that over the relative
22
short span of extension (2000 and 2001), a plant’s use or non-use of IT would change drastically
over all or a large portion of the ITT and ITIP component measures. Moreover, as we describe
later, our findings are robust to the inclusion and non-inclusion of some sub-component
measures of the ITT and ITIP variables. Hence, even in the unlikely event that use or non-use of
some sub-component measures of ITT and ITIP did drastically change during 2000 and 2001, it
would not significantly impact our results. Third, beyond any quantity usage change in
technology, no significant quality change in e-business technology took place during 1999-2001.
Certainly it is possible that disruptive innovations could have taken place during this time frame.
However, it is also highly unlikely that a large set of firms, even early adopters, were able to
invest in, learn about, and implement such new technologies in the short time period.
Fourth, as mentioned above, our extension of one-time survey data across subsequent
years is not without precedent in prior literature (Black and Lynch 2001; Bresnahan et al. 2000;
Brynjolfsson et al. 2002; Ramirez et al. 2010). These papers illustrate the extension of
organizational data involved with a system of IT and organizational change taking place in firms.
These studies demonstrate that the IT and organizational factors involved in the system of
change are complements, and the system factors as a whole evolve simultaneously over time.
Indeed, research has indicated that the impact from such systems evolves over a 5- to 7-year time
frame (Brynjolfsson and Hitt 2003; Brynjolfsson et al. 2002). Hence, while our extension of the
Census e-business technology measures over 2000 and 2001 does not give us exact point
estimates of technology use in these years, we can conservatively argue that our assumed
measures are related to the actual measures in those years. Moreover, we can conservatively
argue that at a high level, our estimated signs and significances (regardless of effect size) will be
23
robust to our data extension given the lack of observed systematic factors driving significant
changes in the study time period.6
4.3 Variable Definitions
Dependent Variables
We use several performance measures to test our theoretical propositions. First, we use
two alternative performance measures which are commonly used in IT value and operational
performance research: labor productivity (Atrostic and Nguyen 2005; Melville et al. 2007) and
total inventory turnover (Bharadwaj et al. 2007; David et al. 2002; Eroglu and Hofer 2010; Lee
et al. 1999; Zhu and Kraemer 2002). While the former is a widely used metric in the literature,
the latter is less used and is specific to the manufacturing context. Each addresses a different
aspect of efficiency: overall output per input versus an inventory turnover metric. In this way, we
can both triangulate results across the measures as well as potentially gain more granular insight
across the two performance dimensions.
Plant-level labor productivity (LABPROD) is defined as log of gross output per worker.
We use total value of shipments as a measure of gross output and total number of employees in
the plant as our measure of labor (Atrostic and Nguyen 2005; McGuckin and Nguyen 1995).
Total inventory (TOTINV) is defined as the logged ratio of the sum of raw-materials inventory,
work-in-process inventory and finished-goods inventory to total value of shipments. This total
inventory metric is frequently used as a performance measure to assess the effectiveness of both
lean production practices (Levy 1997) and supply chains (Gunasekaran et al. 2001) and is
6 Our study time period was around the Y2K and dotcom bubble burst. However, none of those phenomena would have a significant impact on our findings or on the validity of extension of the 1999 CNUS data into 2000 and 2001, for several reasons. First, pertaining to Y2K, the technology we measure (ITT and ITIP) does not relate to Y2K type of spending which was primarily about old mainframe and legacy applications. Second, the bubble burst would have primarily affected new adoption of IT and not the use or the payback of existing ITT and ITIP that we measure. Third, to the extent possible, our empirical analysis (described later) controls for external time shocks by including year dummy control variables. Finally, our use of panel data models (described later) controls for unobserved plant-level heterogeneity (e.g. managerial decisions) related to these phenomena.
24
consistent with how inventory is measured in prior studies (Lieberman et al. 1999). We
analogously define the dependent variables of ‘Raw-materials inventory’ (RMINV), ‘work-in-
process inventory’ (WIPINV) and ‘finished-goods inventory’ (FGINV) as the log of the ratio of
the respective inventory component to total value of shipments. Finally, consistent with prior
research (Dehning et al. 2007; McElheran 2008; McElheran 2010), we define ‘market-based
performance’ (MKTPERF) as the log of the ratio of the total value of shipments of the focal
plant, in a given year, to the sum of total value of shipments of all plants in the ASM in the same
industry as the focal plant, in the same year. Intuitively, this measure captures the performance of
the plant relative to other plants in the same industry. Given the USCB’s probability sampling
strategy, this measure is a reasonable proxy for a plant’s actual market share.7 A detailed
description of our dependent variables is included in Appendix C (Table C2).
Independent and Control Variables
The measures of ‘IT for Transactions’ (ITT) and ‘IT for Information Partnering’ (ITIP)
are count-based composite measures. Count-based and summative measures have been used in
7 Though our market-based performance measure does not capture the market share of plants precisely, there is likely to be significantly high positive correlation between our measure and the actual value for several reasons. First, the ASM sample is weighted towards larger plants, and includes larger single-location plants and all plants of multi-plant firms in the sample each year with certainty based on their size (in terms of value of shipments and number of employees) and importance in industry (USCB 2010c; 2001). Plants not included with certainty are assigned an initial finite probability ranging from 0.02 to 1 (USCB 2001, pp. B-1) of inclusion in the sample “consistent with their relative importance in the industry or other key aggregations” (USCB 2010c) and as a function of a composite measure of size (USCB 2001). This sampling technique “reduces the likelihood of selecting non-representative samples” and “is motivated by our [USCB’s] primary desire to produce reliable estimates” (USCB 2001, pp. B-1). For example, in the 1999 ASM, plants that were selected with certainty account for roughly 62% of the total value of shipments in the 1997 Economic Census - Manufacturing (USCB 2001). We can thus conservatively infer that when plants not included with certainty are also added, the coverage figure (of 62 percent, in the case of 1999) would rise significantly. Second, the USCB also adopts sampling strategies to ensure that the coverage of ASM is well representative of industries, further supporting our measure of market-based performance as a proxy for market share (USCB 2010c). Third, many of the establishments excluded from ASM are “non-employers” (no paid employees), “administrative offices, warehouses, garages and other administrative units that service manufacturing establishments of the same company” (USCB 2010c). These types of establishments would, in any case, be ideally excluded from any market-share calculation of manufacturing plants. Finally, as noted by USCB (2001, pp. B-2), the establishments not eligible to be included in the 1999 ASM mail survey sampling frame numbered approximately 202,000 (including roughly 166,000 small single-establishment companies) but “accounted for only 2% of the total value of shipments at the total manufacturing sector”.

25
prior IT and supply chain research (Banker et al. 2006; Doms et al. 1997; Kulp et al. 2004). As
noted earlier in our definitions, ITT consists of the use of IT by the plant for transactional
purposes with suppliers and customers while ITIP consists of various dimensions of information
sharing by the plant with suppliers and customers. We count the number of IT for transaction
measures (ITT) and IT for information sharing measures (ITIP) used by the plant as reported in
the CNUS. A detailed description of the binary measures included in the ITT and ITIP variables
is provided in Appendix C (Table C1). As shown in Table C1, our ITT variable consists of 9
measures, such as using IT for ordering from vendors or by customers. The measures are
primarily transactional in nature between the focal plant and its customers and suppliers. On the
other hand, our ITIP variable is composed of 12 measures, such as online information sharing of
design specifications and production schedules. The measures are more strategic than
transactional in nature and are suggestive of a more tightly coupled IT-enabled integration
between the focal plant and its customers and suppliers than mere transactional IT use (Sabath
and Fontanella 2002).
The ITT and ITIP indices are, intuitively, formative because use of any particular
measure of ITT or ITIP does not necessarily imply use of every measure forming the index. For
example, a plant may share information on some areas of its operation but not on all areas
(Gosain et al. 2005), and so a formative (composite) index is more appropriate. Since the index is
formative, it need not be subject to the usual tests of internal consistency of reflective constructs
(Diamantopoulos and Winklhofer 2001) and its indicators (composite measures) are not required
to co-vary with each other (Jarvis et al. 2003).
Volatility in demand (Volatility) for a plant in a given year is measured as the standard
deviation of (the log of) plant output (total value of shipments) over the five years prior to the
26
year of interest. This measure represents an annualized percentage standard deviation and is
consistent with previous IT-based research involving volatility (Dewan et al. 2007; Kobelsky et
al. 2008a).
Collectively, we use an extensive set of control variables that include plant-specific
factors which have been found or argued to affect our dependent variables in prior studies. These
controls include capital, materials, energy, plant size, plant capacity utilization (Gunasekaran et
al. 2001), share of exports (Wagner 2002), age of the plant (Dunne 1994) and skill mix of (non-
production to production) workers (Berman et al.1994). For plant size, we follow prior research
(Atrostic and Nguyen 2005) and use log of total employees. Plant age can have a dual effect on
productivity. New plants enter with higher productivity (due to newer technology) than earlier
entrants did, whereas surviving plants show productivity increases as they age (Jensen et al.
2001). We also control for industry concentration (Bharadwaj et al.1999),8 industry dummy
variables (at the 3-digit NAICS level),9 and whether or not the plant is part of a multi-unit firm
(Atrostic and Nguyen 2005). We follow previous studies (Atrostic and Nguyen 2005; Greenan
and Mairesse 2001; McGuckin and Stiroh 1998) and use book values of capital as a proxy for
capital. We use the standard perpetual inventory management (PIM) method (Bansak et al. 2007;
Black and Lynch 2001) to compute capital for the years in which capital is unavailable.10,11 A
summary description of the computation of variables is provided in Appendix C (Table C2).
8 Our measure of industry concentration (definition provided in Appendix C) is analogous to the commonly used four-firm concentration ratio in firm-level studies (Bharadwaj et al. 1999; Scherer 1980). For the same reasons as described earlier, our measure of concentration obtained from ASM, though not exact, is a very reliable proxy. 9 NAICS is the commonly used acronym for “North American Industry Classification System”. 10 For example, capital K at end of 2000 = K at end of 2001 – (Total Capital Expenditures in 2001 – Retirements in 2001). Total capital expenditure in 2001 is available in the 2001 ASM. As retirements in 2001 are not available, we compute K at end of 2000 by the above formula using retirements in 2002 rolled backward. This is a reasonable approximation, as retirements exhibit less variability due to accounting rules than do new capital expenditures. An alternative method of constructing capital is to roll expenditures forward in a perpetual inventory method, which gave qualitatively similar results.

27
4.4 Empirical Modeling
Our conceptual model capturing all hypotheses appears in Figure 1.
Figure 1: Conceptual Research Model
Productivity and Market-based Performance Models
Tests of hypotheses related to labor productivity are conducted by estimating the
following regression model: LABPRODit = β0 + β1 ITTi + β2 ITIPi + β3 Volatilityit + β4 (ITT x
Volatility)it + β5 (ITIP x Volatility)it + βc Xcit + εit , where Xc is the vector of control variables.
Tests of hypotheses related to market-based performance are conducted by estimating the
following related regression model: MKTPERFit = β0 + β1 ITTi + β2 ITIPi + β3 Volatilityit + β4
(ITT x Volatility)it + β5 (ITIP x Volatility)it + βc Xcit + εit . In accordance with prior research, for
these models, we control for capital, material, energy, plant size, plant capacity utilization, plant
age, skill mix, share of exports, whether the plant is part of a multi-unit firm, industry
concentration, industry dummy controls and time (year) dummies.
Inventory Models
Tests of hypotheses related to inventory are conducted by estimating the following
regression model: TOTINVit = β0 + β1 ITTi + β2 ITIPi + β3 Volatilityit + β4 (ITT x Volatility)it + β5
(ITIP x Volatility)it + βc Xcit + εit . Note that since the dependent variable is expressed as the (log) 11 The correlation between capital values based on the PIM method and the book-value series has been found to be above .90 (Luque 2002, pp. 556; Doms 1996). Therefore, since physical capital is not available for all years in our sample, the values we use based on the PIM method should be a reasonable proxy for the physical capital stock.
28
ratio of inventory to sales, H3b hypothesizes a positive sign on β4, while H4b hypothesizes a
negative sign on β5. To test hypotheses H5a and H5b, we estimate the following equation: INVit
= β0 + β1 ITTi + β2 ITIPi + β3 Volatilityit + β4 (ITT x Volatility)it + β5 (ITIP x Volatility)it + βc Xcit
+ εit , where INV is alternatively RMINV, WIPINV and FGINV, the log of the ratio of the
respective inventory component to total value of shipments. In line with prior research, for these
models, we control for plant size, plant capacity utilization, capital, materials, energy, whether
the plant is part of a multi-unit firm, plant age, industry concentration, industry dummy controls
and time dummies.
4.5 Estimation Approach
We first consider pooling our observations across years. However, pooling implies a
constant intercept for all plants which is unlikely, since plants differ in their innate performance
capabilities. Indeed, the Breusch-Pagan Lagrange Multiplier test (Breusch and Pagan 1980)
indicates that the individual effects are significant and so OLS on the pooled data would be
inappropriate. That is, because the null of no heterogeneity is rejected, the test suggests that
individual-level heterogeneity must be accounted for; therefore, we estimate fixed-effects (FE)
and random-effects models. The random-effects model however makes a strong assumption that
unobserved individual effects that are correlated with performance are uncorrelated with the
variables in the model (Greene 2003). In our study, it means that we need to assume that there is
no correlation between variables in the model and unobserved individual plant characteristics
that are also related to performance. This may not be a valid assumption in our context. For
example, several unmeasured characteristics (such as capabilities of plant managers) that relate
to performance might also be correlated with a plant’s use of IT. As expected, the Hausman
specification test (Hausman 1978) for the random-effects model rejects the null (p < 0.01). This
29
indicates that the random-effects estimator is inconsistent whereas the fixed-effects estimator,
though inefficient, is consistent (Greene 2003; Hausman 1978).
The fixed-effects model overcomes the issue of potential correlation between the
variables in the model and time-invariant unobserved variables by within-transforming the
variables (Greene 2003). In our context, the fixed-effects estimator accounts for time-invariant
unobserved plant-level features that may be correlated with explanatory variables. In view of
these empirical considerations, we consider the fixed-effects estimator as most appropriate for
our analysis.12 We use a fixed-effects model with White’s correction to account for any
heteroskedascticity (White 1980). We include year dummy variables to eliminate year-specific
heterogeneity. Thus, our models control for both plant-specific and time-specific effects.
The time-invariance of ITT and ITIP do not permit estimation of their coefficients by the
fixed-effects approach (Greene 2003).13 We use an alternative econometric specification, the
Hausman-Taylor (HT) model (Hausman and Taylor 1981), to estimate the coefficient of ITT and
ITIP. The HT model permits consistent estimation of coefficients of time-invariant variables,
without imposing the strong assumption (of the random-effects model) that all variables should
be uncorrelated with the individual specific effects (Greene 2003). A second advantage of the
HT model is that, unlike the cross-sectional case where one needs to use external instruments,
instruments in the HT model are constructed from inside the model, based partly on time-variant
variables which are considered exogenous to (uncorrelated with) unobserved plant-level fixed
individual effects, and partly on deviation from group means of time-variant variables that may
be correlated with unobserved individual effects (Greene 2003; Hausman and Taylor 1981) (see
12 In interest of space, random effects model estimations are not reported here and are available on request. 13 Note that even though the estimates of ITT and ITIP are not produced by the FE model because of their time-invariance, the interaction of ITT and ITIP with (time-variant) Volatility can be included in and consistently estimated by the FE model. As noted by Wooldridge (2009, pp. 484), “Although time-constant variables cannot be included by themselves in a fixed effects model, they can be interacted with variables that change over time”.
30
below discussion of exogenous variable choices). The consistency of the HT model, validity of
instruments and theory-based choice of exogenous variables can be empirically tested by the
Hausman specification test (Greene 2003). Third, the HT model, when consistent, is also more
efficient than the FE model, which is consistent though less efficient (Hausman and Taylor
1981). In sum, the HT model enables us to test hypotheses H1 and H2, while also providing us a
robustness check with FE results for testing our interaction hypotheses.
For identification purposes, the HT model requires that the number of exogenous time-
variant variables in the model be at least equal to the number of endogenous time-invariant
variables (Greene 2003). In our study, because we have two endogenous time-invariant variables
(ITT and ITIP),14 we need (at least) two time-variant exogenous variables. Of all the variables
included in our models, the two most likely variables that can be considered exogenous to
unobserved plant-level individual effects are industry concentration and plant age. The
motivation for these choices is as follows.
First, industry concentration is likely to be determined by a myriad of external factors
such as suppliers, customers, regulators and industry factors and so is unlikely to be correlated
with unobserved plant-level effects. This is consistent with firm-level research that considers
market characteristics as exogenous to unobserved firm-level effects in HT specifications
(Pfaffermayr 1999). Second, as plants age, time-invariant unobserved effects, by definition, do
not change. Moreover, given that the average age of plants in our samples is about 25 years and
that the ASM sampling strategy of the USCB is weighted towards size and importance in
industry (USCB 2010a; 2010c), survival is not a key issue for most plants in our sample. This
14 As noted earlier, the potential correlation of ITT and ITIP with unobserved plant-level effects can be argued on theoretical grounds that use of IT may be correlated with unobserved plant-level characteristics such as managerial capabilities. This is also supported in our sensitivity analyses (not reported here) where the Hausman specification test (Hausman 1978; Hausman and Taylor 1981) for the HT model is rejected (p < 0.05) when ITT and ITIP are considered exogenous to unobserved plant-level effects.

31
combined with the fact that unobserved plant-level effects cannot alter the course of time makes
feedback from unobserved effects to age very unlikely. Thus, plant age is unlikely to be
correlated with unobserved plant-level time-invariant factors that affect performance. Therefore,
consistent with prior research that considers organization age or firm age as exogenous to
unobserved organizational factors in HT specifications, we consider plant age to be exogenous to
unobserved plant effects (Dixit and Pal 2010; Engberg et al. 2004; Frakes 2007; Renaud 2007).
Nevertheless, we acknowledge the challenge and difficulty of identifying exogenous
variables on purely theoretical grounds. Hence, consistent with Greene (2003) and Hausman and
Taylor (1981), we estimate the HT models and empirically test the validity of instruments
resulting from the use of particular variables as exogenous. The appropriateness of the
instruments used in the model and the choice of whether a variable is treated as doubly
exogenous (exogenous to both the individual effects and idiosyncratic error term) or singly
exogenous (exogenous to only the idiosyncratic error term) can be tested by the Hausman
specification test (Greene 2003; Hausman 1978; Hausman and Taylor 1981). This test compares
the HT model estimates to the fixed-effects model estimates, which are consistent though
inefficient. If the test statistic is insignificant, the HT model is consistent and more efficient than
the corresponding fixed effects model (Hausman and Taylor 1981). As reported in the tables, the
Hausman specification tests indicate that the instruments used in our estimations are valid,
further supporting our theoretical arguments of exogeneity of age and industry concentration.15
Since the time-dummies for the years 2000 and 2001 in our model are also exogenous
and time-variant by definition, we have more time-variant exogenous variables than required.
15 We also considered using Plant Capacity Utilization (PCU) as an alternate (third-best) potential candidate for exogeneity to unobserved effects on the, albeit less strong, theoretical grounds that PCU is, at least in part, determined by factors external to the plant and by the economics of the industry. When PCU is considered exogenous, the results are qualitatively similar to those reported.

32
Therefore, we also use the Sargan test of over-identifying restrictions to check the validity of
instruments (Sargan 1958). This test is based on the null hypothesis that the instruments used are
valid. The insignificant Sargan test statistics (reported in the tables of results) further suggest that
the HT estimators use valid instruments and confirm the appropriateness of the HT model
specifications.
To summarize, our estimation approach consists of employing fixed-effects (FE) and
Hausman-Taylor (HT) models to estimate developed models and test related hypotheses (with
the exception of H1 and H2, which can only be tested via the HT model). For each model, the
tables first report the model without interaction terms and then the model with interaction terms.
4.6 Sample Description
Table 1: Descriptive Statistics and Correlation Matrix for Productivity Model
After merging the ASM, SPCU and CNUS datasets, we obtain unbalanced time-series
cross-sectional estimation samples consisting of 3795 plants (9217 plant-year observations) for
the productivity model and 3895 plants (10264 plant-year observations) for the inventory model.
The descriptive statistics and correlations for the productivity model are provided in Table 1.16
Appendix A illustrates how the proportion of plants in our samples in each industry compares
16 The descriptive statistics and correlations for the Inventory model are provided in Appendix B, which do not differ markedly from these.

33
with the proportion of plants in the population as per the “Statistical Abstract of the United
States: 2003” (U.S. Census Bureau 2003) for the year 2000.
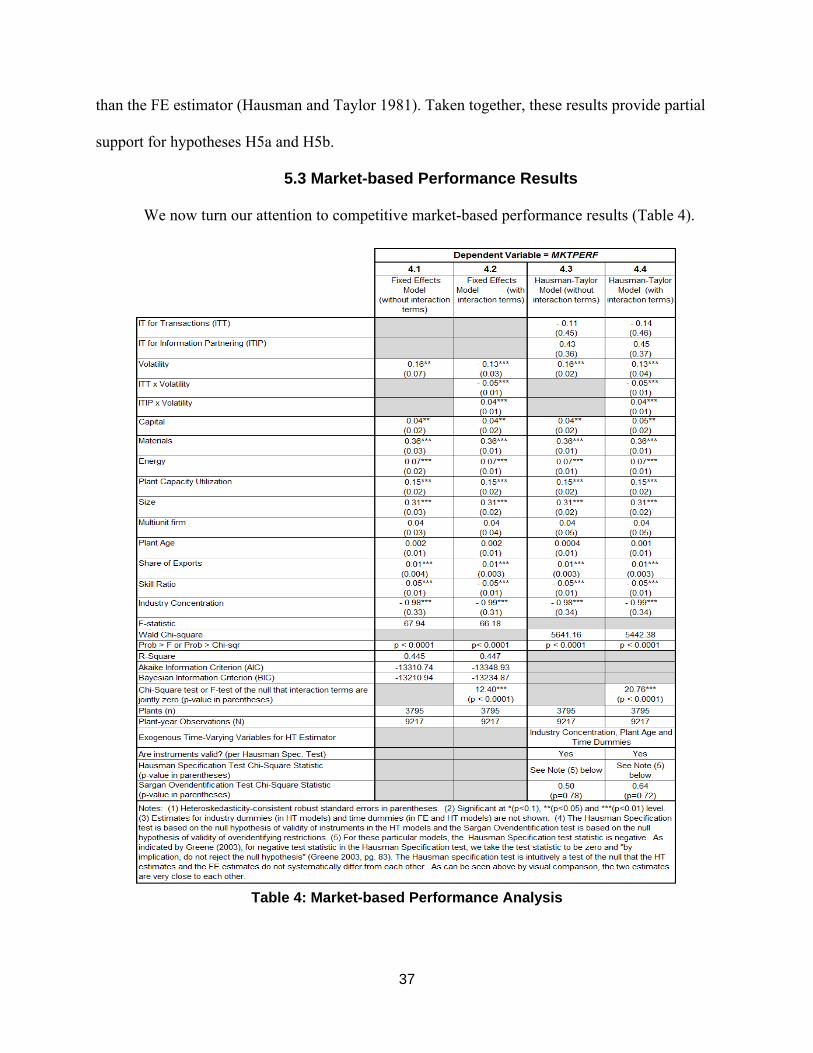
5. RESULTS
5.1 Value of ITT and ITIP Under Volatile Demand Conditions
Estimation results for the productivity regression model are provided in Table 2, columns
2.1 to 2.4. Column 2.1 reports the fixed-effects (FE) model without interaction terms, while
column 2.2 reports the FE model with interaction terms added. Similarly, columns 2.3 and 2.4
contain the Hausman-Taylor (HT) estimation results with and without interaction terms,
respectively. As displayed in Column 2.3, coefficients of ITT and ITIP are statistically
insignificant, providing no support for H1a and H2a. In contrast, consistent with hypothesis H3a,
in the fully specified model we find that the interaction term of ITT and Volatility is negative and
statistically significant (β4 = -0.04, p < 0.01).17 Conversely, the interaction term of ITIP and
Volatility is positive and significant, rendering support for hypothesis H4a (β5 = 0.03, p < 0.01).
Moreover, an F-test (Chi-square test) in the FE (HT) model of the joint significance of the
interaction terms is rejected at the p< 0.01 (p < 0.01) level of significance, indicating that we can
reject the null that the interaction terms are jointly zero. Finally, consistent with prior research
(Childerhouse et al. 2008), demand Volatility has a negative and statistically significant
coefficient.18 The results are consistent across the FE and HT model specifications.
17 In all estimations, the coefficients of the interaction terms are substantively similar in the corresponding FE and HT models. For the main effect coefficients of time-invariant ITT and ITIP, we specifically need to interpret the HT models because the FE models do not estimate these coefficients. 18 The signs of coefficients of the other control variables are also, in general, in expected directions. Capital, material and energy have positive and significant coefficients while coefficient on Size is negative. This negative coefficient is expected since, like in prior plant-level research (Atrostic and Nguyen 2005) we also have Labor in the denominator of the dependent variable in the productivity specification. The effective (net) coefficient of (log) Labor on gross (log) total value of shipments is (1-0.69) = 0.31.

34
Table 2: Primary Results
Estimation results for the total inventory model are provided in Table 2, columns 2.5 to
2.8. In our estimations of total inventory, we see a qualitatively similar pattern of results which is
substantively consistent with our primary thesis. The coefficients of ITT and ITIP are
insignificant; thus H1b and H2b are not supported. However, consistent with hypothesis H3b, we

35
find that the interaction term of ITT and Volatility on inventory is positive and statistically
significant (β4 = 0.12, p < 0.05). Additionally, the interaction term of ITIP and Volatility is
negative and significant (β5 = -0.07, p < 0.05), rendering support for hypothesis H4b. The results
are consistent across the FE and HT model specifications. Again, an F-test (Chi-Square test) in
the FE (HT) model of the joint significance of the interaction terms is rejected at the p<0.05 (p <
0.01) level of significance, indicating that we can reject the null that the interaction terms are
jointly zero.
Taken together, we find strong support for H3 and H4, whereas H1 and H2 are not
supported. Finally, as before, demand Volatility has a positive and statistically significant
coefficient in line with our argument that plants facing high volatility in demand tend to have
higher levels of inventory to buffer against the effects of that volatility.
As per our estimates, in high-volatile demand conditions, a plant high on ITIP
experiences, on average, a reduction of approximately 0.16 in TOTINV, i.e. a reduction in the
total inventory to sales ratio of 1/exp(0.16) or approximately 15% compared to a plant low on
ITIP. Similar interpretation of the productivity estimation suggests that plants high in ITIP enjoy,
on average, an 8-10% increase in productivity in high volatile demand conditions. This suggests
that the moderating role of demand volatility is economically significant in addition to being
statistically significant. Similar interpretations of the ITT interaction terms show that Volatility
negatively moderates the ITT-performance relationship.
5.2 Value Chain Analysis Results
We find partial support for hypotheses H5a and H5b. Table 3 contains estimation results
for RMINV, WIPINV and FGINV impacts analysis in columns 3.1 to 3.4, 3.5 to 3.8, and 3.9 to
3.12 respectively. As shown, the interaction of ITT and Volatility is positive and significant for

36
RMINV (β4 = 0.15, p < 0.01), WIPINV (β4 = 0.11, p < 0.1) and FGINV (β4 = 0.11, p < 0.1),
whereas the interaction of ITIP and Volatility is negative and significant only for RMINV
(β4 = -0.10, p < 0.01).
Table 3: Value Chain Analysis
F-tests of the null of joint significance of the interaction terms further refine these
findings. The F-tests are insignificant for FE model for WIPINV and FGINV, whereas, they are
significant (p<.01) for RMINV. This implies that though the interaction of ITT and Volatility is
significant in the WIPINV and FGINV estimations, the joint significance of both interaction
terms is not statistically significantly different from zero. The Chi-square tests for joint
significance in the HT-models are significant in RMINV (p < 0.01), WIPINV (p < 0.05) and
FGINV (p < 0.01) estimations. This is to be expected since the HT estimator is more efficient
37
than the FE estimator (Hausman and Taylor 1981). Taken together, these results provide partial
support for hypotheses H5a and H5b.
5.3 Market-based Performance Results
We now turn our attention to competitive market-based performance results (Table 4).
Table 4: Market-based Performance Analysis
38
Consistent with hypotheses H6a and H6b, we find a negative and significant coefficient
for the interaction of ITT and Volatility (β4 = - 0.05, p < 0.01), whereas, a positive and significant
coefficient for the interaction of ITIP and Volatility (β5 = 0.04, p < 0.01). An F-test (Chi-square
test) in the FE (HT) model of the joint significance of the interaction terms is rejected at the p<
0.01 (p < 0.01) level of significance, indicating that we can reject the null that the interaction
terms are jointly zero.
5.4 Robustness Checks
We take several steps to assess the robustness of our findings. First, given the unbalanced
nature of our sample and the use of fixed-effects models, sample bias is a potential concern. To
address this issue and test the robustness of the sample, we follow the method proposed by
Wooldridge (2002). In a fixed-effects model with an unbalanced panel, sample bias is not a
problem if the selection is uncorrelated with the idiosyncratic error term of the model. To test
this assumption, we re-estimate the models by adding a selection indicator variable with a one-
period lag (Nijman and Verbeek 1992; Wooldridge 2002). The variable indicates which years are
missing for each plant and for each year, this variable is a 1 if a plant is included in the
estimation and 0 otherwise.19 Thus, the selection indicator models the presence or absence of
plants in each year. In the estimations, the selection indicator is not statistically significant,
indicating that imbalance in the sample did not lead to bias (Wooldridge 2002).
Second, a potential concern pertains to our relatively large sample size because very large
samples increase the likelihood of obtaining statistically significant coefficients. We take two
19 As suggested by Wooldridge (2002) and Nijman and Verbeek (1992), we first estimated the 1999-2001 sample and identified the plants which were not included in the estimation, coding the selection indicator variable for them as 0 (and 1 for plants that were included in the estimation). Then, the estimation was re-run by including the lagged selection indicator in the model. The selection indicator was statistically insignificant and results were qualitatively unchanged.

39
steps to address this concern.20 We re-estimate our models using smaller subsamples; for
example, a subsample of 159 plants (365 plant-year observations) in the productivity model and
a subsample of 171 plants (441 plant-year observations) in the inventory model. These
subsamples are drawn randomly in the same proportion as the proportion of plants in each
industry of the Statistical Abstract of the US for the year 2000 (USCB 2003). In results not
reported here, our findings remain unchanged. We also conduct out-of-sample comparison tests
on multiple subsamples. Regressions are first run on a particular subsample and the estimates are
used to predict the dependent variable for another subsample. T-tests of difference of means of
the predicted dependent variable versus the actual dependent variable indicate no statistically
significant differences at conventional levels.
Third, we estimate the fixed-effects models and allow for the possibility of serial
correlation by using the fixed-effects first-order autoregressive (AR1) model. The Baltagi-Wu
locally best invariant (LBI) test statistics are very close to 2, suggesting that serial correlation is
not a serious problem in the data (Baltagi and Wu 1999). Using the AR1 specification, the results
(not reported here) are qualitatively unchanged.
Fourth, we conduct several sensitivity analyses on the independent and dependent
variables.21 To assess how sensitive our ITT and ITIP variables are to the inclusion or exclusion
of particular measures, we experiment by dropping some measures and re-doing the analysis.
This experimentation of dropping measures indicates that the results are robust to the inclusion
and exclusion of measures; in other words, a small number of measures are not driving our
results. Also, even though we treat the ITT and ITIP as formative and therefore not subject to
tests of internal consistency (Jarvis et al. 2003), we examine the Cronbach alpha reliability
20 We thank an anonymous reviewer for pointing this concern and suggesting the robustness check steps to us. 21 We thank an anonymous reviewer for all these suggestions.
40
coefficients of ITT and ITIP. Both these reliability coefficients are above the standard threshold
of 0.7 (Nunally 1967). We also analyze the results after separately standardizing and demeaning
the measures that comprise the ITT and ITIP variables. The findings are again consistent with
those shown earlier. We also repeat the analysis after calculating Volatility over the previous 3
years rather than the previous 5 years as in our core analysis. These new results are generally
consistent with those reported earlier. We believe, however, that a 5-year period for calculating
Volatility better captures variability in demand. Qualitatively similar results are also obtained
when the analysis is performed using standard deviation of the change in (log) demand as the
measure of volatility. Another potential concern is that IT may only be accessed by a part of the
workforce in a plant. In the absence of a direct measure of workers with access to IT with
suppliers and customers, we re-estimate our productivity model separately after calculating
productivity by considering two proxies for the proportion (or number) of workers with access to
ITT and ITIP. The first proxy, obtained from the CNUS, is the percent of employees in the plant
with access to any kind of internet. The second proxy is the number of non-production workers,
obtained from the ASM. The results of both robustness checks are similar to reported findings.
Fifth, a positive correlation between the output of plants belonging to the same firm
would add support to the demand volatility thesis; whereas, a negative correlation may suggest
redistribution within the firm.22 Thus, as another robustness check, we examine the correlation
in change in total value of shipments, from 1997 to 1998, for the 3 largest plants of all firms in
the sample. We choose 1997 to 1998 as these years are among the years included in the
calculation of Volatility for every year. The estimated correlation is positive and significant,
further supporting our primary thesis (coefficient = 0.11, p< 0.05 for the 2 largest plants;
22 We thank an anonymous reviewer for this robustness suggestion.
41
coefficient = 0.20, p< 0.05 for first and third largest plants; coefficient = 0.12, p< 0.05 for second
largest and third largest plants).
Lastly, we also test for multicollinearity using variance inflation factors which are within
acceptable limits (Greene 2003). This indicates that multicollinearity is not a serious problem in
the data. Also, common method bias is not a significant concern in our study as our independent
variables, dependent variables, and control variables are obtained from different data sources
(CNUS, ASM, SPCU and CM). Therefore, additional statistical remedies are not necessary
(Podsakoff et al. 2003, pp. 897). Moreover, as our performance variables are accounting data, not
perceptual measures, and our independent IT variables are generally unambiguous (‘use’ versus
‘do not use’), the possibility of common-method bias is further minimized (Malhotra et al. 2006).
6. DISCUSSION
6.1 Summary, Discussion and Implications
Our main finding, consistent across a variety of estimation approaches and performance
metrics, is that demand volatility is a significant moderator of business value in the context of
electronically integrated supply chains. Consistent with our primary hypotheses (Table 5), the
IT-business value link is moderated by demand volatility dependent upon whether IT is
employed for information partnering or for transaction purposes. Our core thesis that value from
IT for Transactions and IT for Information Partnering will be respectively negatively and
positively moderated by demand volatility is supported in terms of labor productivity,
operational (total inventory) performance, and market-based performance. The moderating role
of demand volatility on inventory is also different, based on where value is measured in the value
chain of the plant. The lack of a significant direct effect of ITIP (information sharing) on
business value, while unexpected, is not without precedence in the literature. For example, in a

42
study of divisions of manufacturing companies in the food and consumer packaged goods
industry in 1998, Kulp et al. (2004, pp. 443) did not find a direct significant and positive
association between information sharing and subjective performance measures, barring the
sharing of store inventory information. Similarly, the insignificant main effect coefficient of ITT,
though unsupportive of H1, is consistent with a study of firms in the automotive, computers and
electronics industry. In that study (Devaraj et al. 2007, pp. 1212), “findings indicated that e-
business capabilities, by themselves, do not directly impact operational performance.”
Table 5: Summary of Findings
A potential interpretation of the insignificant main effect and negative interaction of ITT
and Volatility is that in highly volatile conditions, using rather than not using ITT leads to worse
performance. However, our results can be explained by a number of alternate plausible theories.
For example, the plants in our study may not have developed the other organizational, social and
human resource capabilities that complement ITT and contribute to maximum ITT investment
returns (Melville et al. 2004). To achieve adaptability and flexibility in complex environments,
43
this includes developing organizational capabilities for business process flexibility and dynamic
reconfiguration of human resource talent (Prahalad and Krishnan 2008).23
Our results are new to the literature and yield several implications. Inter-organizational
processes and supply chain partnerships are occurring more widely across industries. For
example, Apple Computer now focuses on iPhone design while its overseas partners focus on
iPhone manufacturing. In several industries, innovation networks are beginning to take hold as
firms move from a more internally focused innovation creation process to a more open,
partnership model (Prahalad and Krishnan 2008). Our research sheds light on IT’s role in these
evolving supply chains, in particular, by identifying the purposes of application of IT that are
more appropriate when demand volatility is present. Our results also suggest that raw materials
inventory is the area of greatest benefit from IT investment when demand volatility is present,
suggesting that future research examine upstream coupling between manufacturing plants and
suppliers more extensively to identify underlying casual mechanisms.
Moreover, our analysis suggests how manufacturing plants can maximize the returns to
their IT investments. Failure to take into account a firm’s environment, including demand
volatility, can lead to unrealizable expectations for IT’s impact at the plant level. This may help
company executives obtain a better understanding of the impact of different types of IT
applications, given the firm’s industry and marketplace contexts. In sum, these results add to the
comprehensive picture of the internal and external contingent factors that firms must consider
when deciding upon and implementing future IT investments (Kobelsky et al. 2008b).
23 It is also possible that plants were still on the learning and experience curve and had not yet reached a level of IT infrastructure sophistication to benefit from ITT in volatile conditions (Weill et al. 2002; Zhu and Kraemer 2002). For example, if the ERP systems, inventory management systems or other business process IT systems of plants were inflexible and not sufficiently developed to leverage on ITT functionalities, then volatility would have an even more severe impact on the value of ITT. Finally, ITT may trigger automatic ordering to the extent that, in highly volatile conditions, such excess automation may hinder performance. In sum, although ITT provides efficiency benefits, other theory when applied in the context of high volatility says otherwise, motivating further research into this issue. We thank an anonymous reviewer for motivating this discussion.

44
6.2 Limitations and Future Research
The findings of our study should be viewed, in light of its limitations, as a starting point
for future research. First, since the ASM is weighted towards larger plants and because we use
data only from respondents to the CNUS survey without adjusting for non-respondents, the
results of this study may not generalize to plants that did not respond to the CNUS, plants of all
sizes or plants that were excluded during our process of merging multiple Census datasets.
However, prior research using CNUS have noted that CNUS respondents are likely to “account
for a substantial share of the U.S. manufacturing employment and output (about 50% and 60%)
represented in the ASM” (Atrostic and Nguyen 2005, pp. 498). Second, though we believe our 3-
year data panel based on the 1999 CNUS survey is reasonable and consistent with similar
approaches in prior studies (Black and Lynch 2001; Bresnahan et al. 2002; Brynjofsson et al.
2002; Ramirez et al. 2010), future research should look to replicate our analysis using a longer
time series dataset on plant-level information sharing and transactional IT use. Third, our binary
measures of IT are based on usage, a benefit over measures that merely capture the presence of
IT. However, this may also be viewed as a potential limitation as we do not have more granular
metrics for the extent of IT usage (Devaraj and Kohli 2003). At the same time, our binary
metrics of usage could be viewed as a reliable proxy for such a measure. Although many prior IT
value studies have employed binary measures of IT usage (e.g., Kulp et al. 2004; Srinivasan et
al. 1994), future research could use more refined measures of usage of transactional and
information sharing technologies. Fourth, our measure of volatility is on an annual basis. Future
studies will benefit by employing a more fine-grained measure based on a timeframe customized
for an industry’s competitive context. Fifth, our analysis focuses on the demand volatility-IT-
performance relationship within the focal plant. Future research should focus on the analysis of
45
value at the partnership level to better understand the value created within the partnership itself.
The identification and inclusion of partnership-level control variables should also be identified
and used in this analysis. Sixth, our market-based performance analysis, though supplementary
in nature, has a limitation; although we use a reasonable proxy, we do not measure the exact
market share of the plant. Future research can employ more precise market-based performance
measures. Finally, demand volatility may partially be a result of internal firm decisions, actions
and process efficiency rather than changes in customer demand preferences. Nonetheless,
volatility of demand remains an important and influential environmental factor that influences
value chain design (Fine 2000; Lee et al. 2004).
There are several useful directions for further research. First, the underlying mechanisms
driving the moderating role of demand volatility on ITIP and ITT need to be examined. Future
research can look at more complex interrelations and can use alternative methods (structural
equation modeling, case studies, etc.) to examine the driving factors behind the differential
impact of variation in strategic use of IT under volatile demand conditions. Second, though this
paper studied the value of different uses of IT under volatile demand conditions, future research
can investigate the value of IT under conditions of supply volatility (Rai et al. 2006). Future
research can also study the contextual impact of information partnering on other critical areas of
firm performance such as innovation creation (Kleis et al. forthcoming). Finally, our study
context is limited to the U.S. manufacturing sector. Although this enhances the internal validity
of the analysis, it may limit the generalizability of our findings. Extending this study to other
settings and examining whether the results hold in service industries and other national
environments, particularly in less developed countries, would be an interesting line of inquiry.

46
REFERENCES
Amit, R., and C. Zott. "Value Creation in E-Business," Strategic Management Journal (22:6), 2001, pp. 493.
Atrostic, B. K., and S. V. Nguyen. "IT and Productivity in U.S. Manufacturing: Do Computer Networks Matter?" Economic Inquiry (43:3), 2005, pp. 493.
Baltagi, B., and P. Wu. "Unequally Spaced Panel Data Regressions with AR(1) Disturbances," Econometric Theory (15:6), 1999, pp. 814.
Banker, R., I. Bardhan, H. Chang, and S. Lin. "Plant Information Systems, Manufacturing Capabilities, and Plant Performance," MIS Quarterly (30:2), 2006, pp. 315.
Bansak, C., N. Morin, and M. Starr. "Technology, Capital Spending, and Capacity Utilization," Economic Inquiry (45:3), 2007, pp. 631.
Barney, J. "Firm Resources and Sustained Competitive Advantage." Journal of Management (17:1), 1991, pp. 99-120.
Barua, A., P. Konana, A. Whinston, and F. Yin. "An Empirical Investigation of Net-Enabled Business Value," MIS Quarterly (28:4), 2004, pp. 585.
Berman, E., J. Bound, and Z. Griliches. The Quarterly Journal of Economics (109:1994, pp. 367. Berndt, E., and C. Morrison. "High-Tech Capital Formation and Economic Performance in U.S.
Manufacturing Industries: An Exploratory Analysis." Journal of Econometrics (65:1), 1995, pp. 9.
Bharadwaj, A., S. Bharadwaj, and B. Konsynski. "Information Technology Effects on Firm Performance as Measured by Tobin's q," Management Science (45:7), 1999, pp. 1008-1024.
Bharadwaj, S., A. Bharadwaj, and E. Bendoly. "The Performance Effects of Complementarities between Information Systems, Marketing, Manufacturing, and Supply Chain Processes," Information Systems Research (18:4), 2007, pp. 437.
Bischoff, C. W., and E. C. Kokkelenberg. "Capacity Utilization and Depreciation-in-use," Applied Economics (19:8), 1987, pp. 995-1007.
Black, S., and L. Lynch. "How to Compete: The Impact of Workplace Practices and Information Technology on Productivity," The Review of Economics and Statistics (83:3), 2001, pp. 434.
Bourgeois, L. J., and K. M. Eisenhardt. "Strategic Decision-Processes in High-Velocity Environments - 4 Cases in the Microcomputer Industry," Management Science (34:7), 1988, pp. 816.
Bourland, K. E., S. G. Powell, and D. F. Pyke. "Exploiting Timely Demand Information to Reduce Inventories," European Journal of Operational Research (92:2), 1996, pp. 239.
Bresnahan, T., E. Brynjolfsson, and L. Hitt. "Information Technology, Workplace Organization, and the Demand for Skilled Labor: Firm-Level Evidence," The Quarterly Journal of Economics (117:1), 2002, pp. 339-376.
Breusch, T. S., and A. R. Pagan. "The Lagrange Multiplier Test and its Applications to Model-Specification in Econometrics," The Review of Economic Studies (47:1), 1980, pp. 239.
Brynjolfsson, E., L. Hitt, and S. Yang. "Intangible Assets: Computers and Organizational Capital," Brookings Papers on Economic Activity (2002:1), 2002, pp. 137-198.
Business Week. "J.D. Edwards Frees Up Herlitz's Shelf Space," http://www.businessweek.com/adsections/chain/2.1/jdedwards.html, 2009.
Cachon, G. P., and M. Fisher. "Supply Chain Inventory Management and the Value of Shared Information," Management Science (46:8), 2000, pp. 1032.

47
Cachon, G., and M. Olivares. "Drivers of Finished-Goods Inventory in the U.S. Automobile Industry," Management Science (56:1), 2010, pp. 202.
Capkun, V., A. Hameri, and L. Weiss. "On the Relationship between Inventory and Financial Performance in Manufacturing Companies," International Journal of Operations Production Management (29:8), 2009, pp. 789-806.
Chen, F. "Information Sharing and Supply Chain Coordination," Handbooks in Operations Research and Management Science (11:C), 2003, pp. 341-421.
Chen, F. "Echelon Reorder Points, Installation Reorder Points, and the Value of Centralized Demand Information," Management Science (44:12), 1998, pp. 221.
Childerhouse, P., S. Disney, and D. Towill. "On the Impact of Order Volatility in the European Automotive Sector," International Journal of Production Economics (114:1), 2008, pp. 2.
Claycomb, C., C. Dröge, and R. Germain. "The Effect of just-in-Time with Customers on Organizational Design and Performance," International Journal of Logistics Management (10:1), 1999, pp. 37-58.
Clemons, E. K., and Row. "Limits to Interfirm Coordination through Information Technology: Results of a Field Study in Consumer Packaged Goods Distribution." Journal of Management Information Systems (10:1), 1993, pp. 73.
Crowe, T. "Integration is Not Synonymous with Flexibility," International Journal of Operations Production Management (12:10), 1992, pp. 26.
Daft, R. H., and R. L. Lengel. Organizational Information Requirements, Media Richness and Structural Design1986.
David, J., Y. Hwang, B. Pei, and J. Reneau. "The Performance Effects of Congruence between Product Competitive Strategies and Purchasing Management Design," Management Science (48:7), 2002, pp. 866.
Dedrick, J., and K. Kraemer. "The Impacts of IT on Firm and Industry Structure: The Personal Computer Industry," California Management Review (47:3), 2005, pp. 122.
Dehning, B., V. Richardson, and R. Zmud. "The Financial Performance Effects of IT-Based Supply Chain Management Systems in Manufacturing Firms," Journal of Operations Management (25:4), 2007, pp. 806-824.
Devaraj, S., and R. Kohli. "Performance Impacts of Information Technology: Is Actual Usage the Missing Link?" Management Science (49:3), 2003, pp. 273.
Devaraj, S., L. Krajewski, and J. Wei. "Impact of eBusiness Technologies on Operational Performance: The Role of Production Information Integration in the Supply Chain," Journal of Operations Management (25:6), 2007, pp. 1199.
Dewan, S., C. Shi, and V. Gurbaxani. "Investigating the Risk-Return Relationship of Information Technology Investment: Firm-Level Empirical Analysis," Management Science (53:12), 2007, pp. 1829.
Diamantopoulos, A., and H. Winklhofer. "Index Construction with Formative Indicators: An Alternative to Scale Development," J. Marketing Res. (38:2), 2001, pp. 269.
Dixit, K., and R. Pal. "The Impact of Group Incentives on Performance of Small Firms: Hausman-Taylor Estimates." Managerial and Decision Economics (31:6), 2010, pp. 403.
Doms, M., T. Dunne, and K. Troske. "Workers, Wages, and Technology," The Quarterly Journal of Economics (112:1), 1997, .
Doms, M. E. "Estimating Capital Efficiency Schedules within Production Functions," Economic Inquiry (34:1), 1996, pp. 78.
48
Dong, J. Q. "How does Information Technology Enable Innovation in Supply Chains," ICIS 2010 Proceedings2010, pp. 1-17.
Dong, S., S. Xu, and K. Zhu. "Information Technology in Supply Chains: The Value of IT-Enabled Resources Under Competition," Information Systems Research (20:1), 2009, pp. 18.
Dos Santos, B. L., K. Peffers, and D. Mauer. "The Impact of Information Technology Investment Announcements on the Market Value of the Firm," Information Systems Research (4:1), 1993, pp. 1.
Duan, W., B. Gu, and A. Whinston. "Do Online Reviews Matter? - an Empirical Investigation of Panel Data," Decision Support Systems (45:4), 2008, pp. 1007.
Dunne, T. "Plant Age and Technology use in U.S. Manufacturing Industries." The Rand Journal of Economics (25:3), 1994, pp. 488.
Eisenhardt, K. M., and J. A. Martin. "Dynamic Capabilities: What are they?" Strategic Management Journal (21:10), 2000, pp. 1105.
Engberg, J., D. Wholey, R. Feldman, and J. Christianson. "The Effect of Mergers on Firms' Costs: Evidence from the HMO Industry," The Quarterly Review of Economics and Finance (44:4), 2004, pp. 574.
Eroglu, C., and C. Hofer. "Lean, Leaner, Too Lean? the Inventory-Performance Link Revisited," Journal of Operations Management, Articles in Press 2010.
Fine, C. "Clockspeed-Based Strategies for Supply Chain Design," Production and Operations Management (9:3), 2000, pp. 213.
Frakes, M. "Classified Boards and Firm Value." Delaware Journal of Corporate Law (32:1), 2007, pp. 113.
Frohlich, M., and R. Westbrook. "Arcs of Integration: An International Study of Supply Chain Strategies," Journal of Operations Management (19:2), 2001, pp. 185.
Gattorna, J. Strategic Supply Chain Alignment, Gower, Aldershot, Hampshire, England, 1998. Gavirneni, S., R. Kapuscinski, and S. Tayur. "Value of Information in Capacitated Supply
Chains," Management Science (45:1), 1999, pp. 16-24. Germain, R., C. Claycomb, and D. Cornelia. "Supply Chain Variability, Organizational
Structure, and Performance: The Moderating Effect of Demand Unpredictability," Journal of Operations Management (26:5), 2008, pp. 557.
Gosain, S., A. Malhotra, and O. Sawy. "Coordinating for Flexibility in e-Business Supply Chains," Journal of Management Information Systems (21:3), 2005, pp. 7.
Greenan, N., and J. Mairesse. "Information Technology and Research and Development Impacts on Productivity and Skills: Looking for Correlations on French Firm Level Data," NBER Working Paper Series 8075), 2001.
Greene, W. H. Econometric Analysis, Prentice Hall (5th Edition), Upper Saddle River, NJ, 2003. Gunasekaran, A., C. Patel, and E. Tirtiroglu. "Performance Measures and Metrics in a Supply
Chain Environment," International Journal of Operations Production Management (21:1/2), 2001, pp. 71-87.
Gurbaxani, V., and S. Whang. "The Impact of Information Systems on Organizations and Markets." Communications of the ACM (34:1), 1991, pp. 59.
Hausman, J., and W. Taylor. "Panel Data and Unobservable Individual Effects," Econometrica (49:6), 1981, pp. 1377.
Hausman, J. A. "Specification Tests in Econometrics," Econometrica (46:6), 1978, pp. 1251-1271.
49
Hitt, L., and E. Brynjolfsson. ""Productivity, Business Profitability, and Consumer Surplus: Three Different Measures of Information Technology Value"," MIS Quarterly (20:2), 1996, pp. 121.
Jarvis, C., S. MacKenzie, and P. Podsakoff. "A Critical Review of Construct Indicators and Measurement Model Misspecification in Marketing and Consumer Research," Journal of Consumer Research (30:2), 2003, pp. 199.
Jensen, J., R. McGuckin, and K. Stiroh. "The Impact of Vintage and Survival on Productivity: Evidence from Cohorts of U.S. Manufacturing Plants," The Review of Economics and Statistics (83:2), 2001, pp. 323.
Katila, R., and S. Shane. "When does Lack of Resources make New Firms Innovate?" Academy of Management Journal (48:5), 2005, pp. 814.
Kiang, M., and T. S. Raghu. "Marketing on the Internet--Who can Benefit from an Online Marketing Approach?" Decision Support Systems (27:4), 2000, .
Kleis, L., P. Chwelos, R. Ramirez, and I. Cockburn. "Information Technology and Intangible Output: The Impact of IT Investment on Innovation Productivity," Information Systems Research, forthcoming .
Kobelsky, K., S. Hunter, and V. J. Richardson. "Information Technology, Contextual Factors and the Volatility of Firm Performance," International Journal of Accounting Information Systems (9:3), 2008a, pp. 154-174.
Kobelsky, K., V. Richardson, R. Smith, and R. Zmud. "Determinants and Consequences of Firm Information Technology Budgets." The Accounting Review (83:4), 2008b, pp. 957.
Kulp, S., H. Lee, and E. Ofek. "Manufacturer Benefits from Information Integration with Retail Customers," Management Science (50:4), 2004, pp. 431.
Lee, H. L., K. So, and C. Tang. "The Value of Information Sharing in a Two-Level Supply Chain," Management Science (46:5), 2000, pp. 626.
Lee, H., P. V, and W. S. "Information Distortion in a Supply Chain: The Bullwhip Effect," Management Science (43:4), 1997, pp. 546.
Lee, H., and S. Whang. "Information Sharing in a Supply Chain," International Journal of Technology Management (20:3), 2000, .
Lee, H., T. Clark, and K. Tam. "Research Report. can EDI Benefit Adopters?" Information Systems Research (10:2), 1999, pp. 186.
Levy, D. "Lean Production in an International Supply Chain," Sloan Management Review (38:2), 1997, pp. 94.
Li, G., H. Yan, S. Wang, and Y. Xia. "Comparative Analysis on Value of Information Sharing in Supply Chains," Supply Chain Management (10:1), 2005, pp. 34.
Li, J., R. Sikora, M. Shaw, and G. Tan. "A Strategic Analysis of Inter Organizational Information Sharing," Decision Support Systems (42:1), 2006, pp. 251.
Lieberman, M., S. Helper, and L. Demeester. "The Empirical Determinants of Inventory Levels in High-Volume Manufacturing," Production and Operations Management (8:1), 1999, pp. 44-55.
Lind, M., and R. Zmud. "Improving Interorganizational Effectiveness through Voice Mail Facilitation of Peer-to Peer Relationships," Organization Science (6:4), 1995, pp. 445.
Luque, A. "An Option-Value Approach to Technology Adoption in U.S. Manufacturing: Evidence from Microdata," Economics of Innovation and New Technology (11:6), 2002, pp. 543.

50
Malhotra, A., S. Gosain, and O. Sawy. "Leveraging Standard Electronic Business Interfaces to Enable Adaptive Supply Chain Partnerships," Information Systems Research (18:3), 2007, pp. 260.
Malhotra, N., S. Kim, and A. Patil. "Common Method Variance in IS Research: A Comparison of Alternative Approaches and a Reanalysis of Past Research," Management Science (52:12), 2006, pp. 1865.
Managing Automation. "Logistics Plus Agility Equals "Logility"," Http://www.Managingautomation.com/maonline/news/read/Logistics_Plus_Agility_Equals_quotLogilityquot_15320, 1997, .
McElheran, K. S. "The Effect of Market Leadership in Business Process Innovation: The Case(s) of E-Business Adoption," Harvard Business School Working Paper (10:104), 2010, .
McElheran, K. S. "Market Leadership and Strategic Investments in Innovation: The Adoption of E-Business Capabilities," Academy of Management Best Paper Proceedings, 2008, .
McGuckin, R., and S. Nguyen. "On Productivity and Plant Ownership Change: New Evidence from the Longitudinal Research Database," The Rand Journal of Economics (26:2), 1995, pp. 257.
McGuckin, R. H., and K. Stiroh. "Computers can Accelerate Productivity Growth," Issues in Science and Technology (14:4), 1998, pp. 41.
Melville, N., V. Gurbaxani, and K. Kraemer. "The Productivity Impact of Information Technology Across Competitive Regimes: The Role of Industry Concentration and Dynamism," Decision Support Systems (43:1), 2007, pp. 229.
Melville, N., K. Kraemer, and V. Gurbaxani. "Review: Information Technology and Organizational Performance: An Integrative Model of IT Business Value," MIS Quarterly (28:2), 2004, pp. 283.
Milgrom, P., and J. Roberts. "Communication and Inventory as Substitutes in Organizing Production," The Scandinavian Journal of Economics (90:3), 1988, pp. 275.
Miller, D., and J. Shamsie. "The Resource-Based View of the Firm in Two Enviroments: The Hollywood Film Studios from 1936 to 1965," Academy of Management Journal (39:3), 1996, pp. 519.
Mishra, A., P. Konana, and A. Barua. "Antecedents and Consequences of Internet use in Procurement: An Empirical Investigation of U.S. Manufacturing Firms," Information Systems Research (18:1), 2007, pp. 103.
Mithas, S., M. S. Krishnan, and C. Fornell. "Why do Customer Relationship Management Applications Affect Customer Satisfaction?" Journal of Marketing (69:4), 2005, pp. 201-209.
Moenaert, R. K., and W. E. Souder. "Context and Antecedents of Information Utility at the R D/Marketing Interface," Management Science (42:11), 1996, pp. 1592.
Mooney, J. G., and D. Ganley. "Enabling Agility through Agile Information Systems: The Roles of Loose Coupling and Web Services Oriented Architecture," Agile Information Systems: Conceptualization, Construction and Management, K. Desouza (ed.), Butterworth-Heinemann, 2007, .
Morrison, C. J. "Assessing the Productivity of Information Technology Equipment in U.S. Manufacturing Industries," The Review of Economics and Statistics (79:3), 1997, pp. 471.
Mukhopadhyay, T., S. Kekre, and S. Kalathur. ""Business Value of Information Technology: A Study of Electronic Data Interchange"," MIS Quarterly (19:2), 1995, pp. 137.
51
Mukhopadhyay, T., and S. Kekre. "Strategic and Operational Benefits of Electronic Integration in B2B Procurement Processes," Management Science (48:10), 2002, pp. 1301.
Nadiri, M. I., and I. Prucha. "Estimation of the Depreciation Rate of Physical and R D Capital in the U.S. Total Manufacturing Sector," Economic Inquiry (34:1), 1996, pp. 43.
Nijman, T., and M. Verbeek. "Nonresponse in Panel Data: The Impact on Estimates of a Life Cycle Consumption Function," Journal of Applied Econometrics (7:3), 1992, pp. 243.
Nunnally, J. Psychometric Theory, McGraw-Hill, New York, 1967. Overby, E., A. Bharadwaj, and V. Sambamurthy. "Enterprise Agility and the Enabling Role of
Information Technology," European Journal of Information Systems (15:2), 2006, pp. 120-131.
Pavlou, P., and O. Sawy. "From IT Leveraging Competence to Competitive Advantage in Turbulent Environments: The Case of New Product Development," Information Systems Research (17:3), 2006, pp. 198.
Pfaffermayr, M. "Ownership Advantages, Foreign Production and Productivity: Evidence from Austrian Manufacturing Firms," Review of Industrial Organization (15:4), 1999, pp. 379.
Piccoli, G., and B. Ives. "Review: It-Dependent Strategic Initiatives and Sustained Competitive Advantage: A Review and Synthesis of the Literature," MIS Quarterly (29:4), 2005, pp. 747-776.
Podsakoff, P., S. MacKenzie, J. Lee, and N. Podsakoff. "Common Method Biases in Behavioral Research: A Critical Review of the Literature and Recommended Remedies," Journal of Applied Psychology (88:5), 2003, pp. 879.
Prahalad, C. K., and M. S. Krishnan. The New Age of Innovation- Driving Co-Created Value through Global Networks, McGraw-Hill, New York, 2008.
Raghunathan, S. "Impact of Demand Correlation on the Value of and Incentives for Information Sharing in a Supply Chain," European Journal of Operational Research (146:3), 2003, pp. 634.
Raghunathan, S. "Information Sharing in a Supply Chain: A Note on its Value when Demand is Nonstationary," Management Science (47:4), 2001, pp. 605.
Rai, A., R. Patnayakuni, and N. Seth. "Firm Performance Impacts of Digitally Enabled Supply Chain Integration Capabilities," MIS Quarterly (30:2), 2006, pp. 225.
Ramirez, R., N. Melville, and E. Lawler. "Information Technology Infrastructure, Organizational Process Redesign, and Business Value: An Empirical Analysis," Decision Support Systems (49:4), 2010, pp. 417-429.
Renaud, S. "Dynamic Efficiency of Supervisory Board Codetermination in Germany," Labour (21:4-5), 2007, pp. 689-5.
Sabath, R. E., and J. Fontanella. "The Unfulfilled Promise of Supply Chain Collaboration." Supply Chain Management Review (6:4), 2002, pp. 24.
Sahin, F., and E. Robinson. "Flow Coordination and Information Sharing in Supply Chains: Review, Implications, and Directions for Future Research," Decision Sciences (33:4), 2002, pp. 505.
Sambamurthy, V., A. Bharadwaj, and V. Grover. "Shaping Agility through Digital Options: Reconceptualizing the Role of Information Technology in Contemporary Firms ," MIS Quarterly (27:2), 2003, pp. 237.
Sanders, N. R. "The Benefits of using E-Business Technology: The Supplier Perspective," Journal of Business Logistics (28:2), 2007, pp. 177.

52
Saraf, N., C. Schlueter, and S. Gosain. "IS Application Capabilities and Relational Value in Interfirm Partnerships," Information Systems Research (18:3), 2007, pp. 320.
Sargan, J. D. "The Estimation of Economic Relationships using Instrumental Variables ," Econometrica (26:3), 1958, pp. 393.
Scherer, F. Industrial Market Structure and Economic Performance, Rand McNally College Pub. Co., Chicago, 1980.
Schouten, F., M. Eijs, and R. Heuts. "The Value of Supplier Information to Improve Management of a Retailer's Inventory," Decision Sciences (25:1), 1994, pp. 1.
Setia, P., V. Sambamurthy, and D. Closs. "Realizing Business Value of Agile IT Applications: Antecedents in the Supply Chain Networks," Information Technology and Management (9:1), 2008, pp. 5.
Spekman, R., J. Kamauff, and N. Myhr. "An Empirical Investigation into Supply Chain Management A Perspective on Partnerships," International Journal of Physical Distribution Logistics Management (28:8), 1998, pp. 630.
Srinivasan, K., S. Kekre, and T. Mukhopahdyay. "Impact of Electronic Data Interchange Technology on JIT Shipments," Management Science (40:10), 1994, pp. 1291-1304.
Steckel, J., S. Gupta, and A. Banerji. "Supply Chain Decision Making: Will Shorter Cycle Times and Shared Point-of-Sale Information Necessarily Help?" Management Science (50:4), 2004, pp. 458.
Subramani, M. "How do Suppliers Benefit from Information Technology use in Supply Chain Relationships?" MIS Quarterly (28:1), 2004, pp. 45.
Subramaniam, C., and M. Shaw. "A Study of the Value and Impact of B2B E-Commerce: The Case of Web-Based Procurement," International Journal of Electronic Commerce (6:4), 2002, pp. 19-40.
SupplyChainBrain. "Procter & Gamble use Consumer Demand Info to Drive Supply Network," http://www.supplychainbrain.com/content/industry-verticals/cpg/single-article-page/article/procter-gamble-uses-consumer-demand-info-to-drive-supply-network/ (2009:10/10), 2006, .
Tan, B. "Managing Manufacturing Risks by using Capacity Options," Journal of the Operational Research Society (53:2), 2002, pp. 232-242.
Teece, D., G. Pisano, and A. Shuen. "Dynamic Capabilities and Strategic Management," Strategic Management Journal (18:7), 1997, pp. 509.
Treville, S., R. Shapiro, and A. Hameri. "From Supply Chain to Demand Chain: The Role of Lead Time Reduction in Improving Demand Chain Performance," Journal of Operations Management (21:6), 2004, pp. 613.
U.S. Census Bureau. "Annual Survey of Manufactures," Http://www.Census.gov/econ/overview/ma0300.Html,2010a.
U.S. Census Bureau. "Annual Survey of Manufactures: How the Data are Collected," Http://www.Census.gov/manufacturing/asm/how_the_data_are_collected/index.Html,2010c.
U.S. Census Bureau. "Annual Survey of Plant Capacity Utilization (PCU)," Http://www.Census.gov/econ/overview/ma0500.Html,2010b.
U.S. Census Bureau. Geographic Area Statistics: 2001, 2001. U.S. Census Bureau. Statistical Abstract of the United States: 2003,2003. Wade, M., and J. Hulland. "Review: The Resource-Based View and Information Systems
Research: Review, Extension, and Suggestions for Future Research," MIS Quarterly (28:1), 2004, pp. 107.

53
Wagner, J. "The Causal Effects of Exports on Firm Size and Labor Productivity: First Evidence from a Matching Approach," Economics Letters (77:2), 10, 2002, pp. 287-292.
Waller, M., E. Johnson, and T. Davis. "Vendor-Managed Inventory in the Retail Supply Chain," Journal of Business Logistics (20:1), 1999, pp. 183.
Weill, P. "The Relationship between Investment in Information Technology and Firm Performance : A Study of the Valve Manufacturing Sector," Information Systems Research1992, .
Weill, P., M. Subramani, and M. Broadbent. "Building IT Infrastructure for Strategic Agility," MIT Sloan Management Review (44:1), 2002, pp. 57-65.
White, H. "A Heteroskedasticity-Consistent Covariance Matrix Estimator and a Direct Test for Heteroskedasticity," Econometrica (48:4), 1980, pp. 817.
Wooldridge, J. M. Econometric Analysis of Cross Section and Panel Data, MIT Press, Cambridge, MA, 2002.
Wooldridge, J. M. Introductory Econometrics: A Modern Approach, South-Western Cengage Learning, Mason, OH, 2009.
Zhu, K. "The Complementarity of Information Technology Infrastructure and E-Commerce Capability: A Resource-Based Assessment of their Business Value," Journal of Management Information Systems (21:1), 2004a, pp. 167.
Zhu, K. "Information Transparency of Business-to-Business Electronic Markets: A Game-Theoretic Analysis," Management Science (50:5), 2004b, pp. 670.
Zhu, K., and K. Kraemer. "Post-Adoption Variations in Usage and Value of E-Business by Organizations: Cross-Country Evidence from the Retail Industry," Information Systems Research (16:1), 2005, pp. 61-84.
Zhu, K., and K. Kraemer. "E-Commerce Metrics for Net-Enhanced Organizations: Assessing the Value of e-Commerce to Firm Performance in the Manufacturing Sector," Information Systems Research (13:3), 2002, pp. 275.
Zuboff, S. "Automate / Informate: The Two Faces of Intelligent Technology," Organizational Dynamics (14:2), 1985, pp. 5-18.

1
APPENDICES
Appendix A: Distribution of Plants in Sample by Industry
Table A1: Distribution of Manufacturing Plants in Samples by NAICS code Appendix B: Sample statistics for Inventory Model
Table B1: Descriptive Statistics and Correlations for Inventory Model

2
Appendix C: Detailed Variable Description
Table C1: Computation of IT variables
Table C2: Computation of non-IT variables