Embed Size (px)
Citation preview
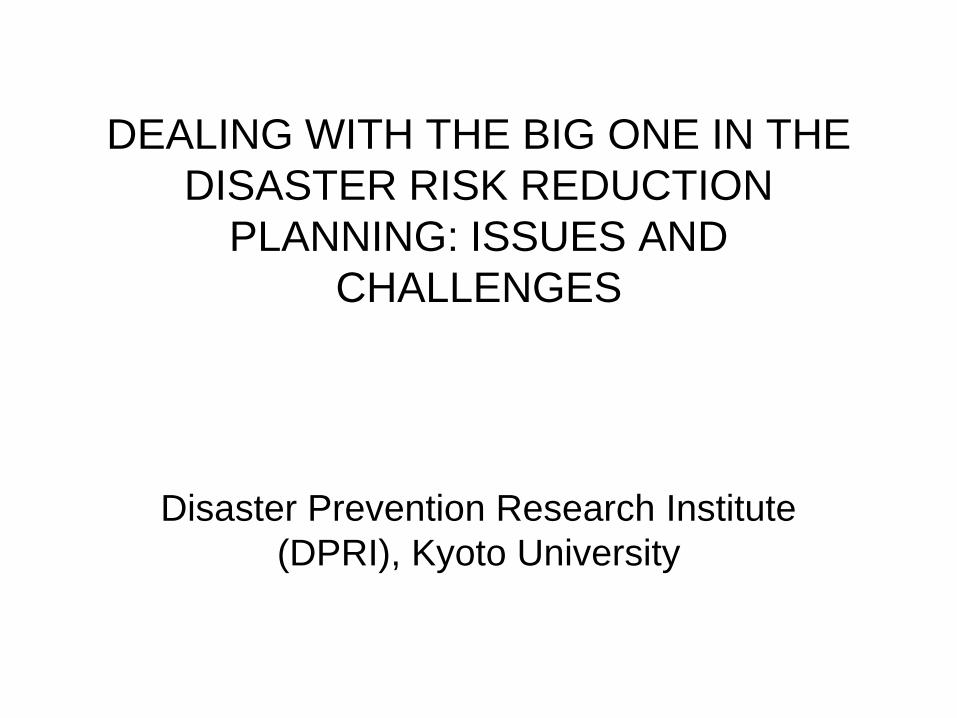
DEALING WITH THE BIG ONE IN THE
DISASTER RISK REDUCTION
PLANNING: ISSUES AND
CHALLENGES
Disaster Prevention Research Institute
(DPRI), Kyoto University
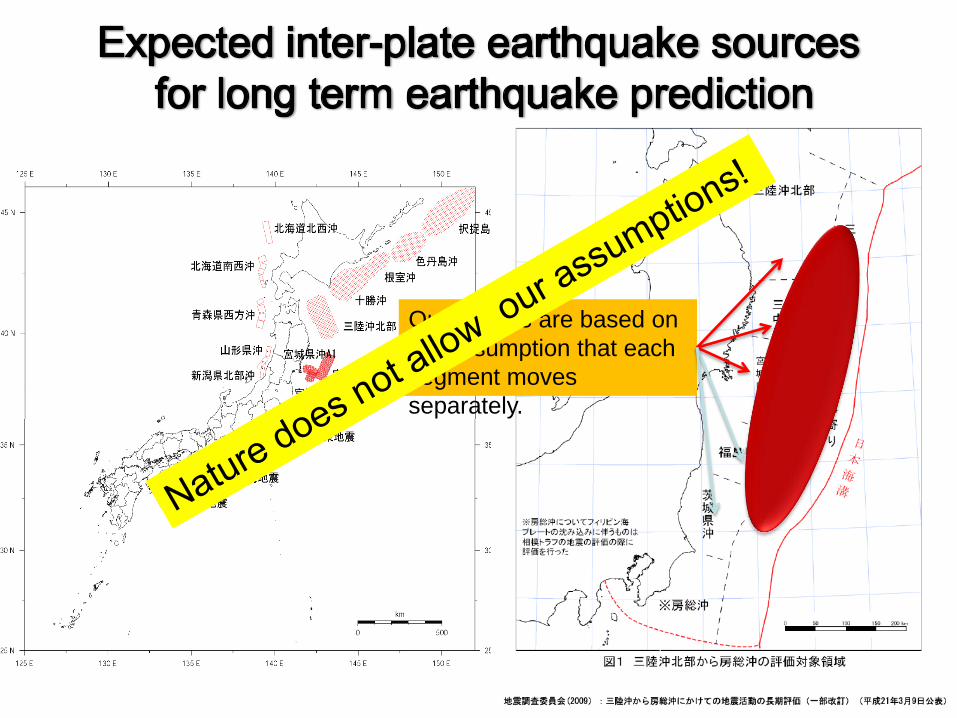
Our models are based on
the assumption that each
segment moves
separately.
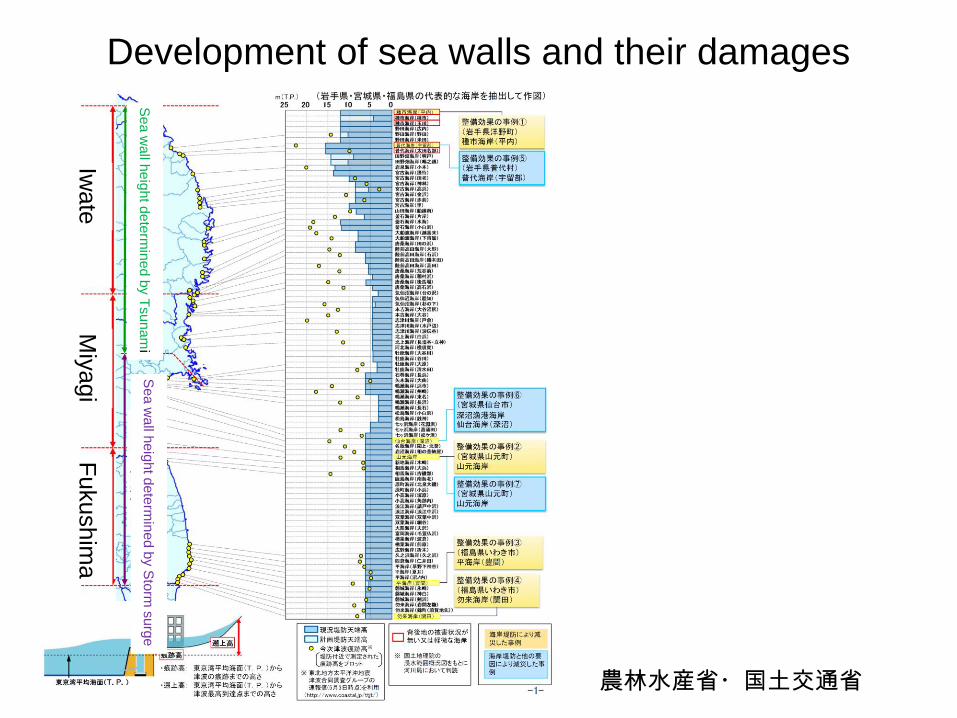
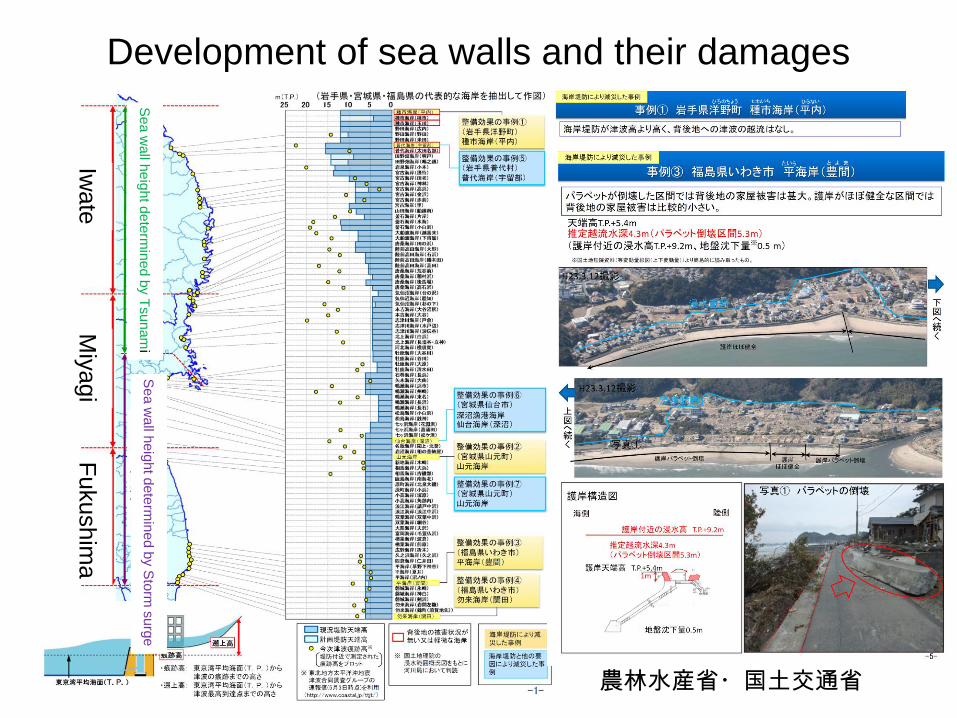
Development of sea walls and their damages
農林水産省・国土交通省
Iwate
M
iyagi
Fukushim
a
Se
a w
all h
eig
ht d
ete
rmin
ed
by T
su
na
mi
Se
a w
all h
eig
ht d
ete
rmin
ed
by S
torm
su
rge
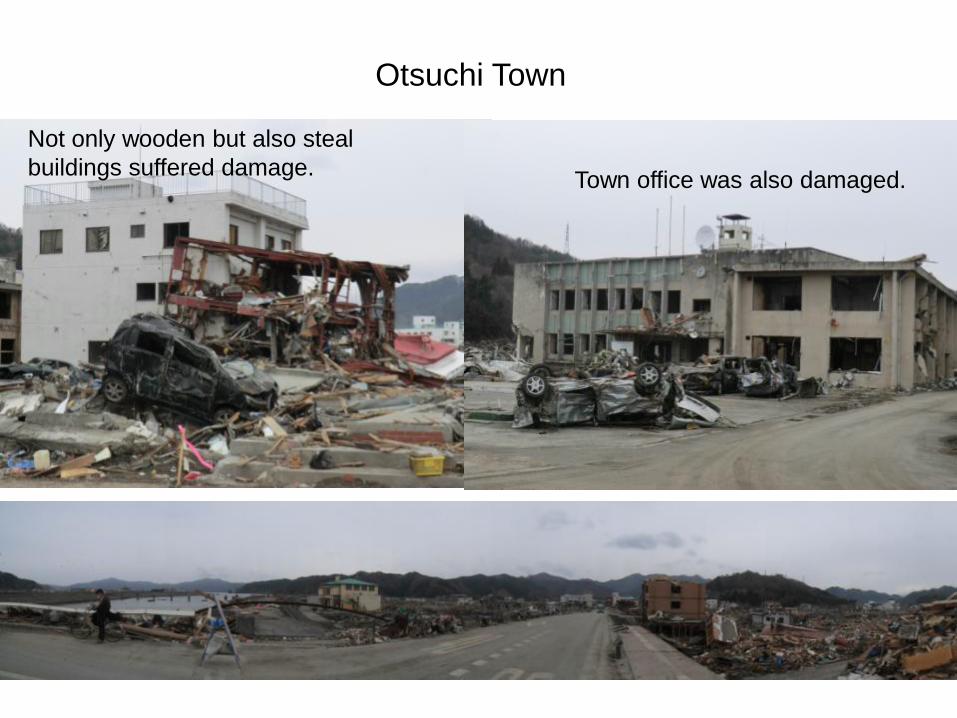
Town office was also damaged.
Not only wooden but also steal
buildings suffered damage.
Otsuchi Town

Distribution of SI and Location of affected Firms
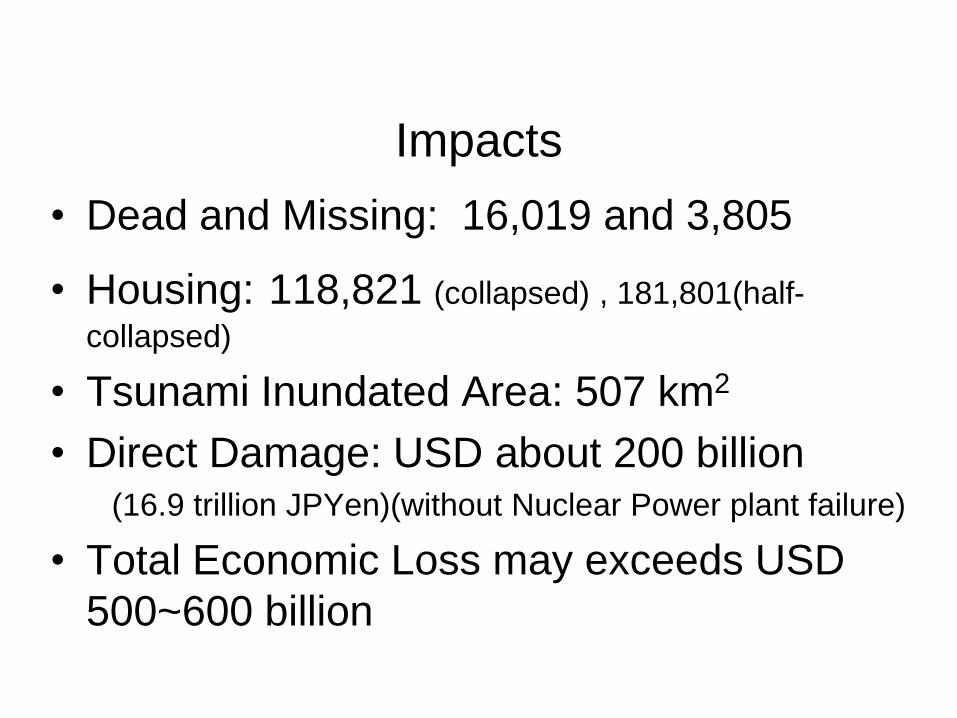
Impacts
• Dead and Missing: 16,019 and 3,805
• Housing: 118,821 (collapsed) , 181,801(half-
collapsed)
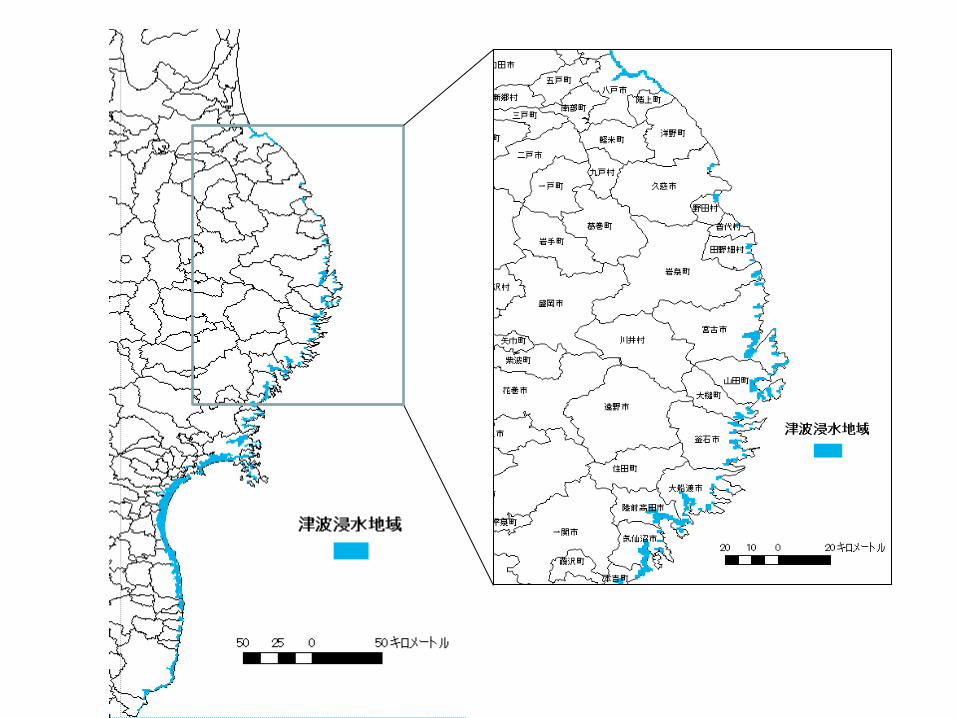
• Tsunami Inundated Area: 507 km2
• Direct Damage: USD about 200 billion (16.9 trillion JPYen)(without Nuclear Power plant failure)
• Total Economic Loss may exceeds USD
500~600 billion
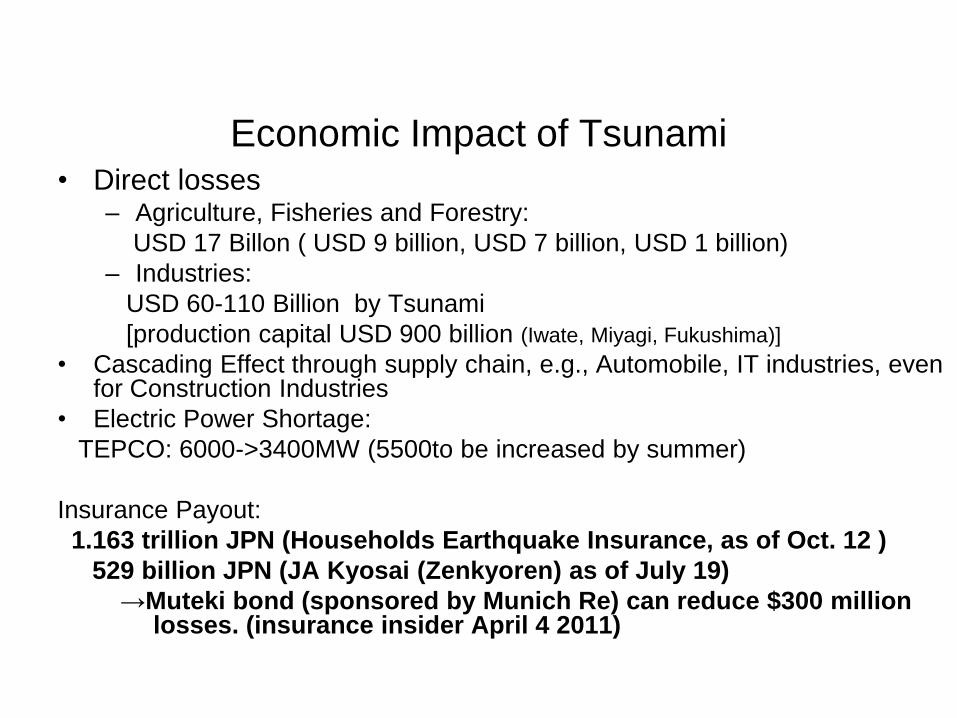
Economic Impact of Tsunami • Direct losses
– Agriculture, Fisheries and Forestry:
USD 17 Billon ( USD 9 billion, USD 7 billion, USD 1 billion)
– Industries:
USD 60-110 Billion by Tsunami
[production capital USD 900 billion (Iwate, Miyagi, Fukushima)]
• Cascading Effect through supply chain, e.g., Automobile, IT industries, even for Construction Industries
• Electric Power Shortage:
TEPCO: 6000->3400MW (5500to be increased by summer)
Insurance Payout:
1.163 trillion JPN (Households Earthquake Insurance, as of Oct. 12 )
529 billion JPN (JA Kyosai (Zenkyoren) as of July 19)
→Muteki bond (sponsored by Munich Re) can reduce $300 million losses. (insurance insider April 4 2011)
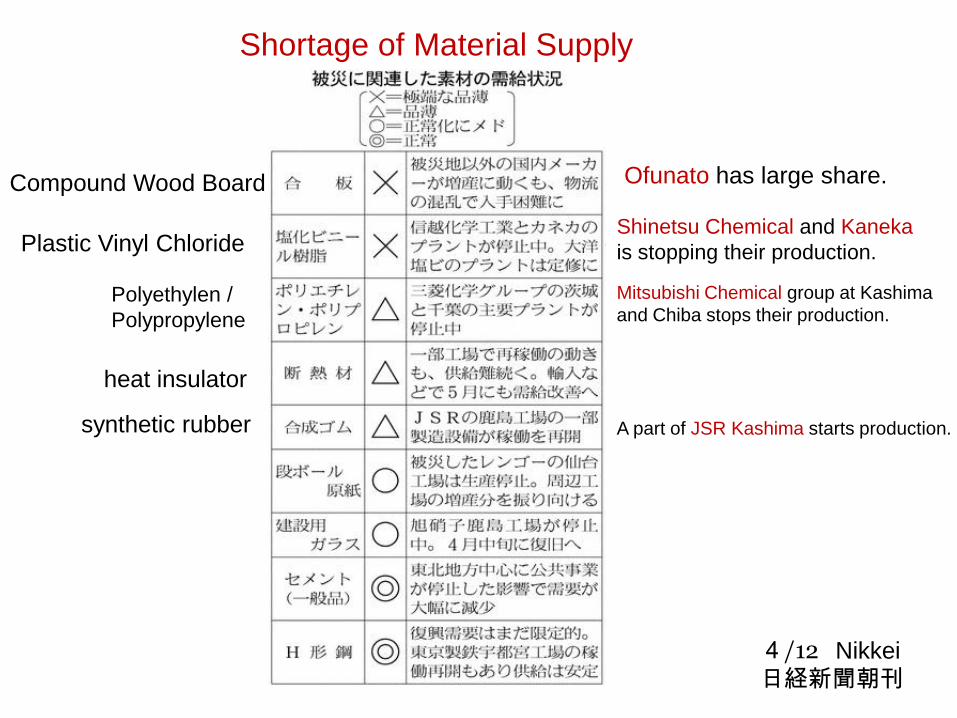
4/12 日経新聞朝刊
Nikkei
Compound Wood Board
Plastic Vinyl Chloride
Polyethylen /
Polypropylene
Shortage of Material Supply
heat insulator
synthetic rubber
Ofunato has large share.
Shinetsu Chemical and Kaneka
is stopping their production.
Mitsubishi Chemical group at Kashima
and Chiba stops their production.
A part of JSR Kashima starts production.

Port Kashima
Apr, 26

提供:国交省港湾局
Chemical industry A
Petro refinery
Co. A
Co. B Co. C
Co. D
Co. C Co. E
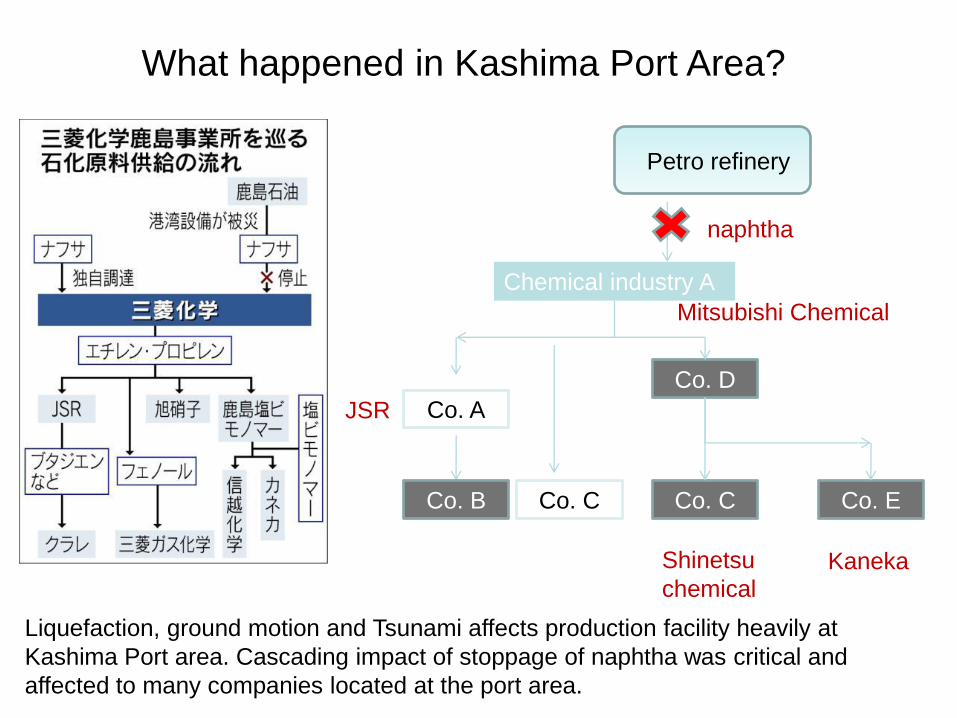
What happened in Kashima Port Area?
Mitsubishi Chemical
Shinetsu
chemical Kaneka
naphtha
JSR
Liquefaction, ground motion and Tsunami affects production facility heavily at
Kashima Port area. Cascading impact of stoppage of naphtha was critical and
affected to many companies located at the port area.
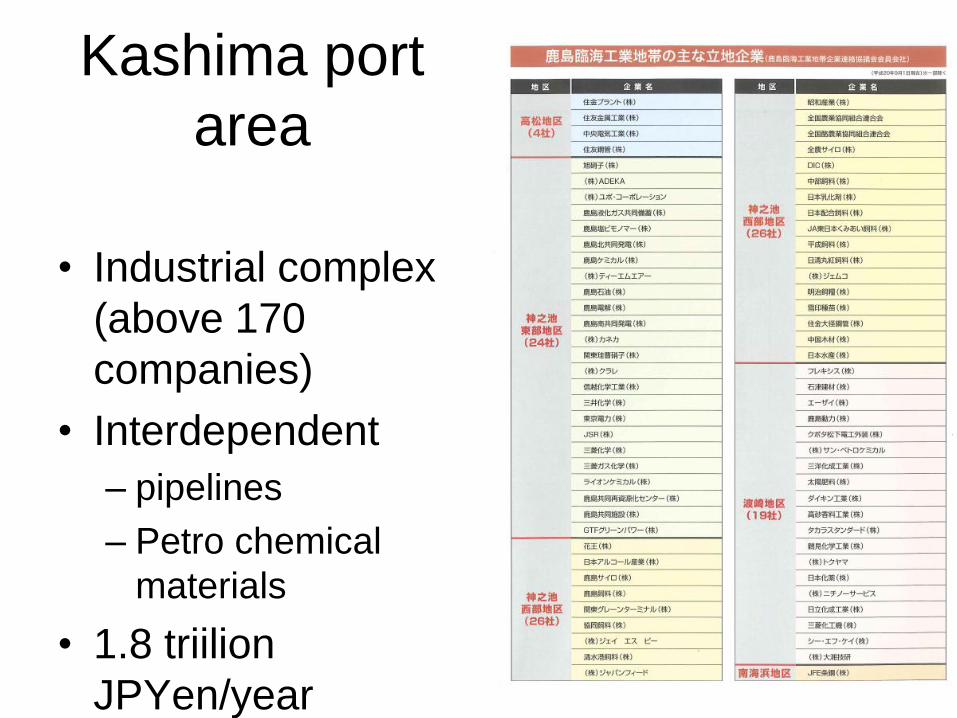
Kashima port
area
• Industrial complex
(above 170
companies)
• Interdependent
– pipelines
– Petro chemical
materials
• 1.8 triilion
JPYen/year
(production)
Supply Chains are affected.
• Micro Computer tips, critical parts
production are affected.
• An automobile uses 30-100 micro-
computer tips.
• Large share occupied by a Japanese Firm
in the affected area.
• Automobile production dropped to 50% for
two months.
Preliminary Summary
• Structural Damage by the strong ground motion is small (??).
• Tsunami impact is remarkably large: – Senario, exposure and fragility should be
reconsidered
• Affected Area: enormous – Recovery of logistic system
• Economic Impact: – Cascading effect: Resilient Supply Chain
Major Lessons : Planning and
Management Aspect
• Reduce “expected surprise,” by taking account of all the possible consequences for designing DRM Plans and contingency plans.
• Integrated Disaster Risk Management is needed: – Structural + Nonstructural Measures taking account of
“Excess Design Forces.”
– Eg. Tsunami protection walls reduced impact when they are not destroyed even Tsunami exceeds
• Implementation of IDRM is a big challenge: – Governance Issues: multiple authorities,
governments, NGOs, Citizens • Eg. Raising elevation of highways: who covers the cost, who
decide the elevation of the road.
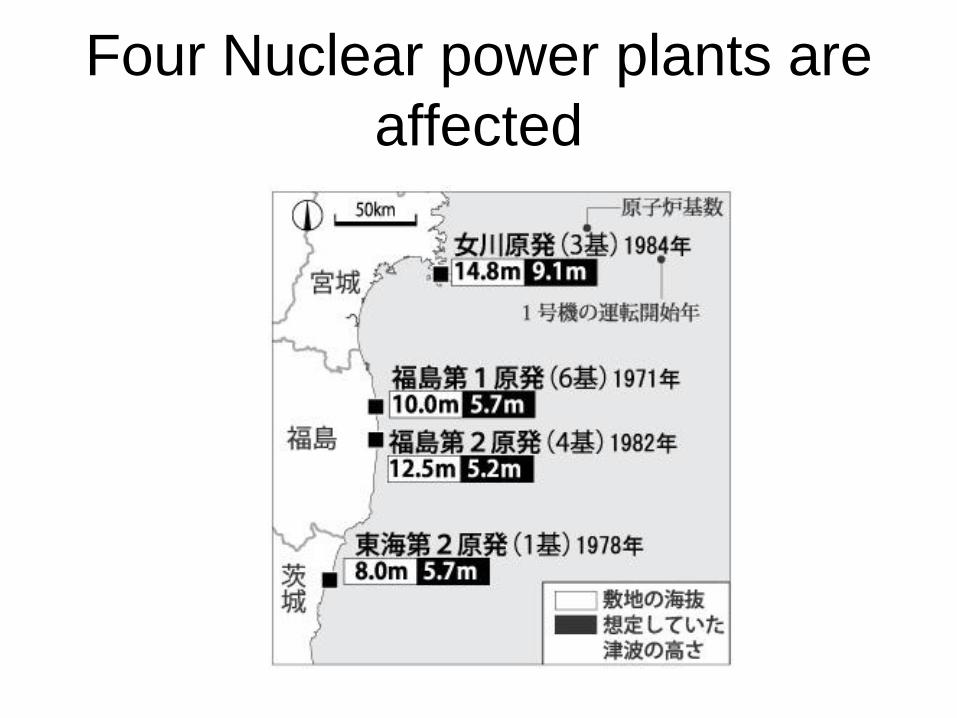
Four Nuclear power plants are
affected
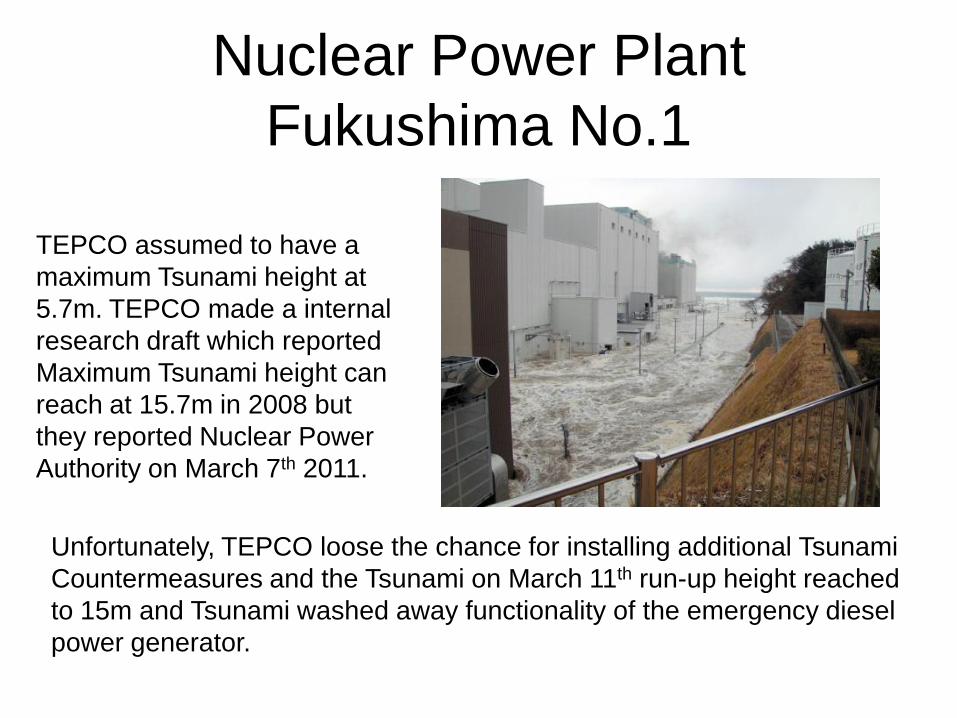
Nuclear Power Plant
Fukushima No.1
TEPCO assumed to have a
maximum Tsunami height at
5.7m. TEPCO made a internal
research draft which reported
Maximum Tsunami height can
reach at 15.7m in 2008 but
they reported Nuclear Power
Authority on March 7th 2011.
Unfortunately, TEPCO loose the chance for installing additional Tsunami
Countermeasures and the Tsunami on March 11th run-up height reached
to 15m and Tsunami washed away functionality of the emergency diesel
power generator.
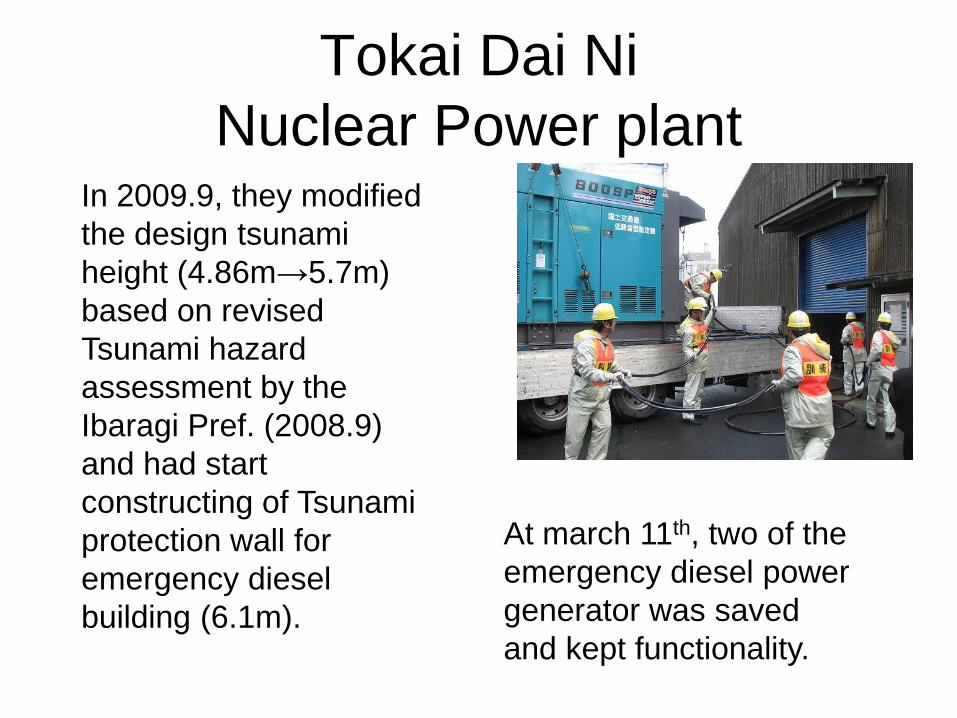
Tokai Dai Ni
Nuclear Power plant In 2009.9, they modified
the design tsunami
height (4.86m→5.7m)
based on revised
Tsunami hazard
assessment by the
Ibaragi Pref. (2008.9)
and had start
constructing of Tsunami
protection wall for
emergency diesel
building (6.1m).
At march 11th, two of the
emergency diesel power
generator was saved
and kept functionality.
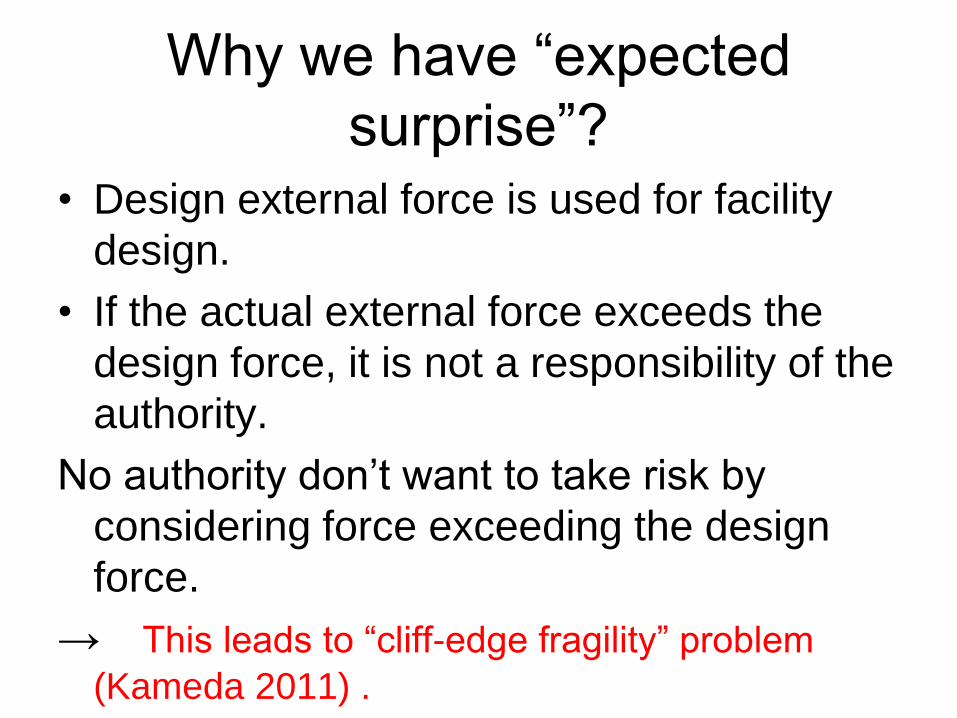
Why we have “expected
surprise”? • Design external force is used for facility
design.
• If the actual external force exceeds the
design force, it is not a responsibility of the
authority.
No authority don’t want to take risk by
considering force exceeding the design
force.
→ This leads to “cliff-edge fragility” problem
(Kameda 2011) .
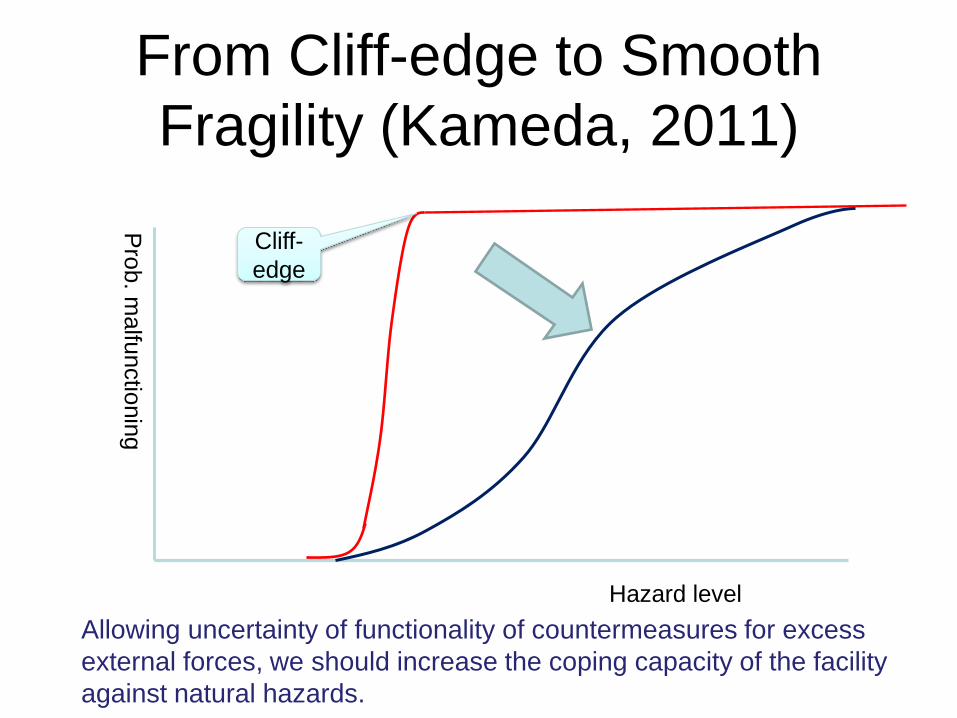
From Cliff-edge to Smooth
Fragility (Kameda, 2011)
Pro
b. m
alfu
nctio
nin
g
Hazard level
Cliff-
edge
Allowing uncertainty of functionality of countermeasures for excess
external forces, we should increase the coping capacity of the facility
against natural hazards.
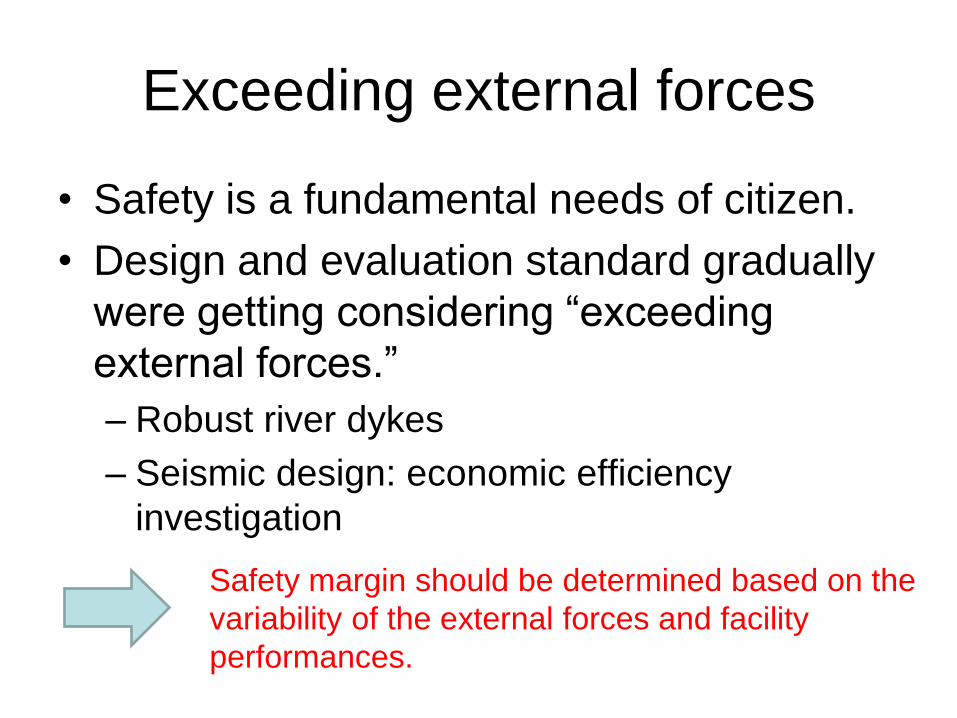
Exceeding external forces
• Safety is a fundamental needs of citizen.
• Design and evaluation standard gradually
were getting considering “exceeding
external forces.”
– Robust river dykes
– Seismic design: economic efficiency
investigation
Safety margin should be determined based on the
variability of the external forces and facility
performances.
Development of sea walls and their damages
農林水産省・国土交通省
Iwate
M
iyagi
Fukushim
a
Se
a w
all h
eig
ht d
ete
rmin
ed
by T
su
na
mi
Se
a w
all h
eig
ht d
ete
rmin
ed
by S
torm
su
rge
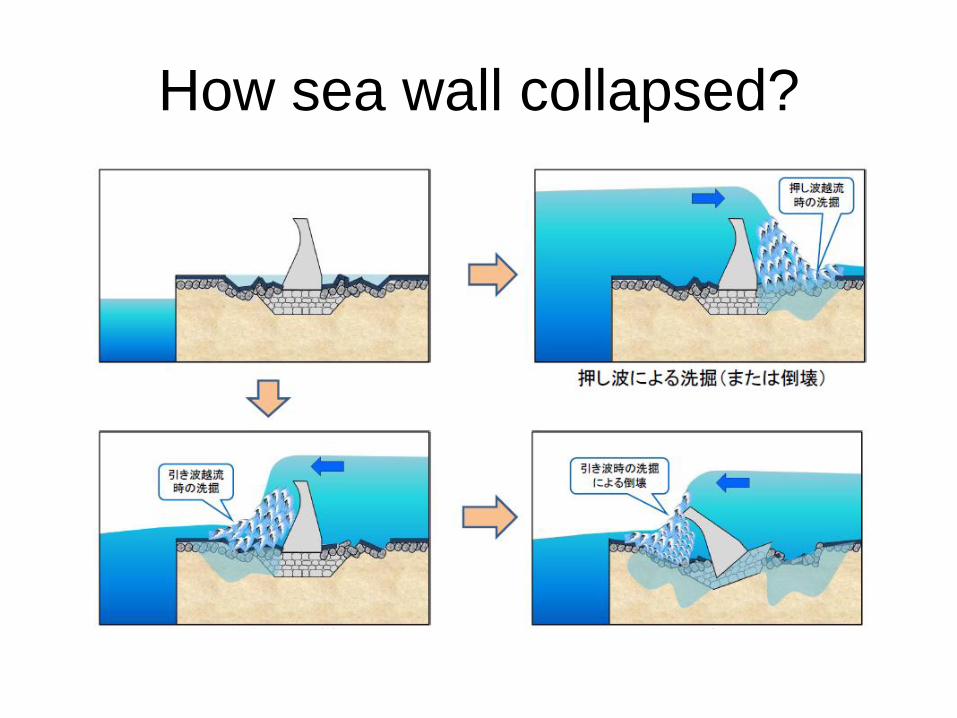
How sea wall collapsed?

Improvement of sea walls’
resiliency
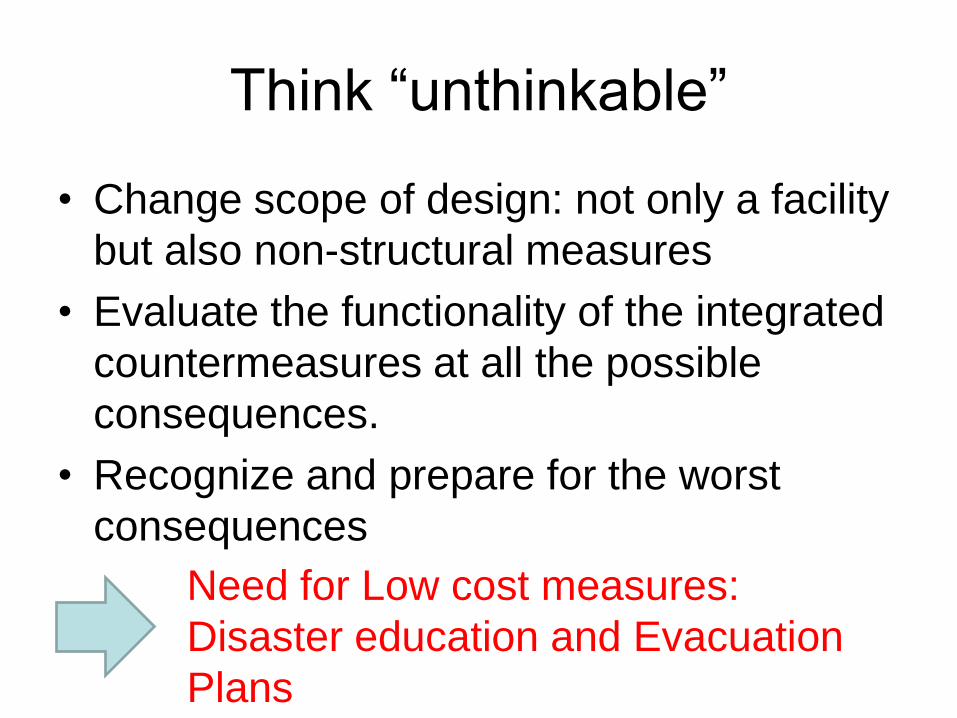
Think “unthinkable”
• Change scope of design: not only a facility
but also non-structural measures
• Evaluate the functionality of the integrated
countermeasures at all the possible
consequences.
• Recognize and prepare for the worst
consequences
Need for Low cost measures:
Disaster education and Evacuation
Plans
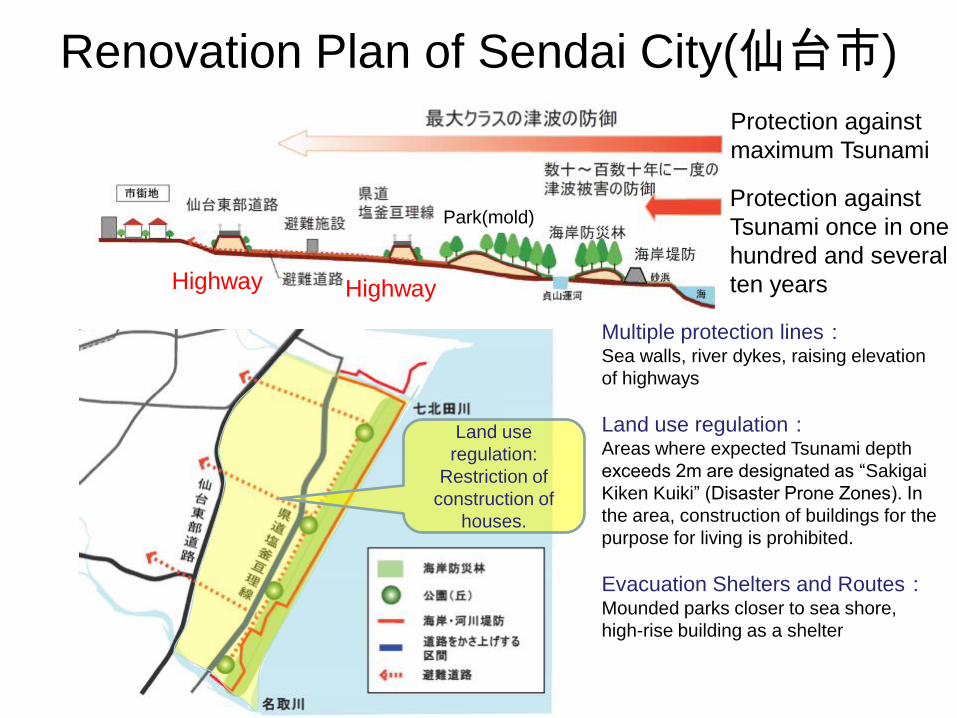
Renovation Plan of Sendai City(仙台市)
Multiple protection lines: Sea walls, river dykes, raising elevation
of highways
Land use regulation: Areas where expected Tsunami depth
exceeds 2m are designated as “Sakigai
Kiken Kuiki” (Disaster Prone Zones). In
the area, construction of buildings for the
purpose for living is prohibited.
Evacuation Shelters and Routes: Mounded parks closer to sea shore,
high-rise building as a shelter
Highway Highway
Park(mold)
Protection against
maximum Tsunami
Protection against
Tsunami once in one
hundred and several
ten years
Land use
regulation:
Restriction of
construction of
houses.
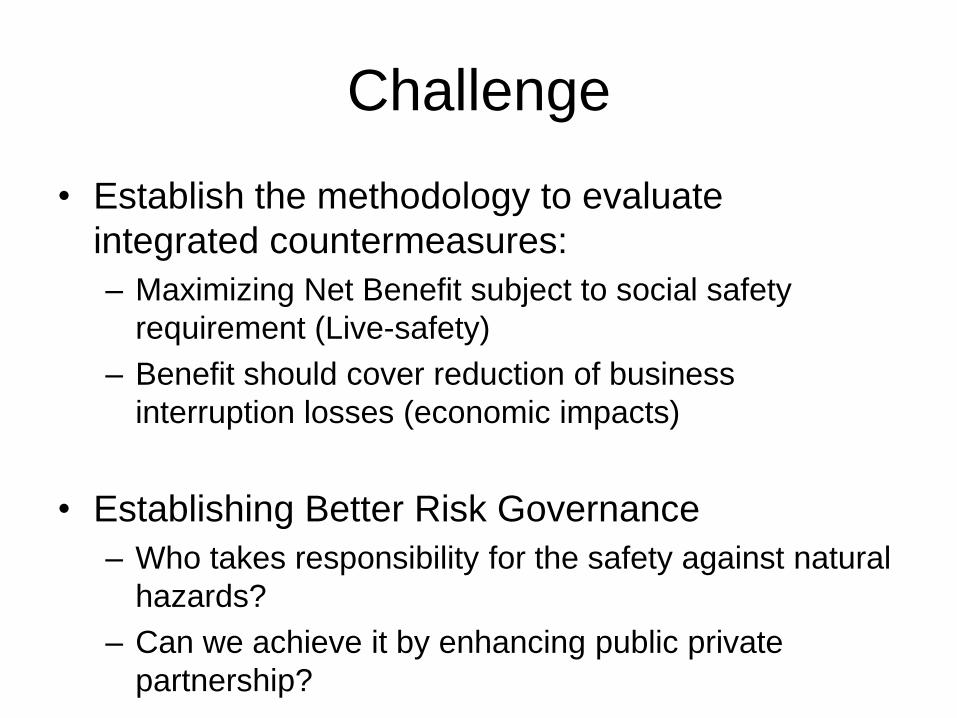
Challenge
• Establish the methodology to evaluate
integrated countermeasures:
– Maximizing Net Benefit subject to social safety
requirement (Live-safety)
– Benefit should cover reduction of business
interruption losses (economic impacts)
• Establishing Better Risk Governance
– Who takes responsibility for the safety against natural
hazards?
– Can we achieve it by enhancing public private
partnership?
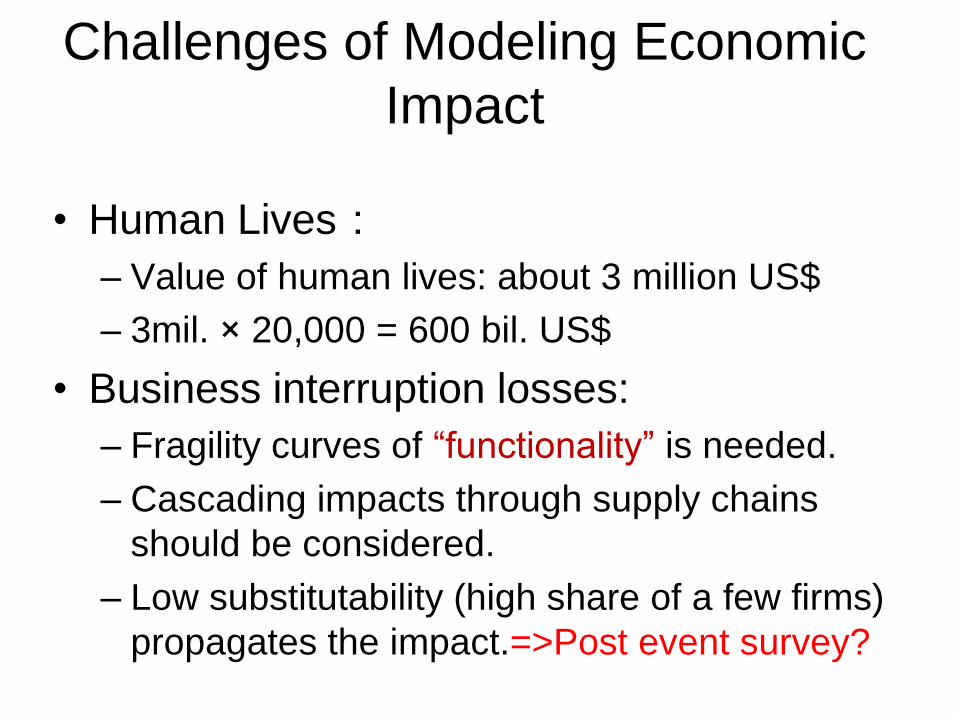
Challenges of Modeling Economic
Impact
• Human Lives:
– Value of human lives: about 3 million US$
– 3mil. × 20,000 = 600 bil. US$
• Business interruption losses:
– Fragility curves of “functionality” is needed.
– Cascading impacts through supply chains
should be considered.
– Low substitutability (high share of a few firms)
propagates the impact.=>Post event survey?
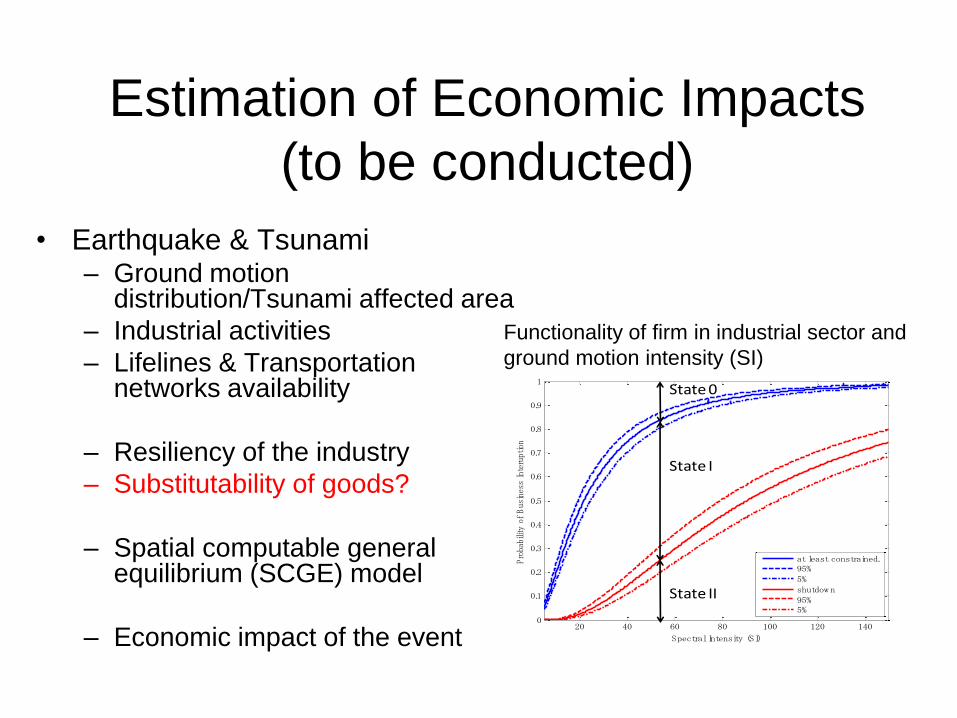
Estimation of Economic Impacts
(to be conducted)
• Earthquake & Tsunami – Ground motion
distribution/Tsunami affected area
– Industrial activities
– Lifelines & Transportation networks availability
– Resiliency of the industry
– Substitutability of goods?
– Spatial computable general equilibrium (SCGE) model
– Economic impact of the event
20 40 60 80 100 120 1400
0.1
0.2
0.3
0.4
0.5
0.6
0.7
0.8
0.9
1
Spectral Intensity (SI)
Probability of Bus
iness Interuption
at least constrained.95%5%shutdow n95%5%
State I
State 0
State II
Functionality of firm in industrial sector and
ground motion intensity (SI)
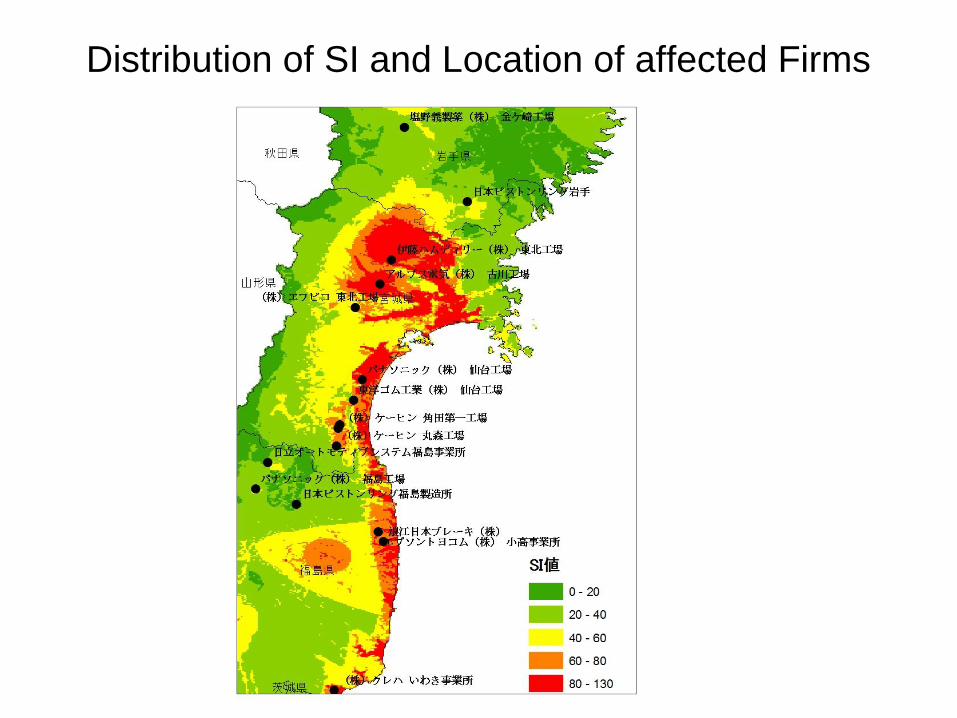
Distribution of SI and Location of affected Firms
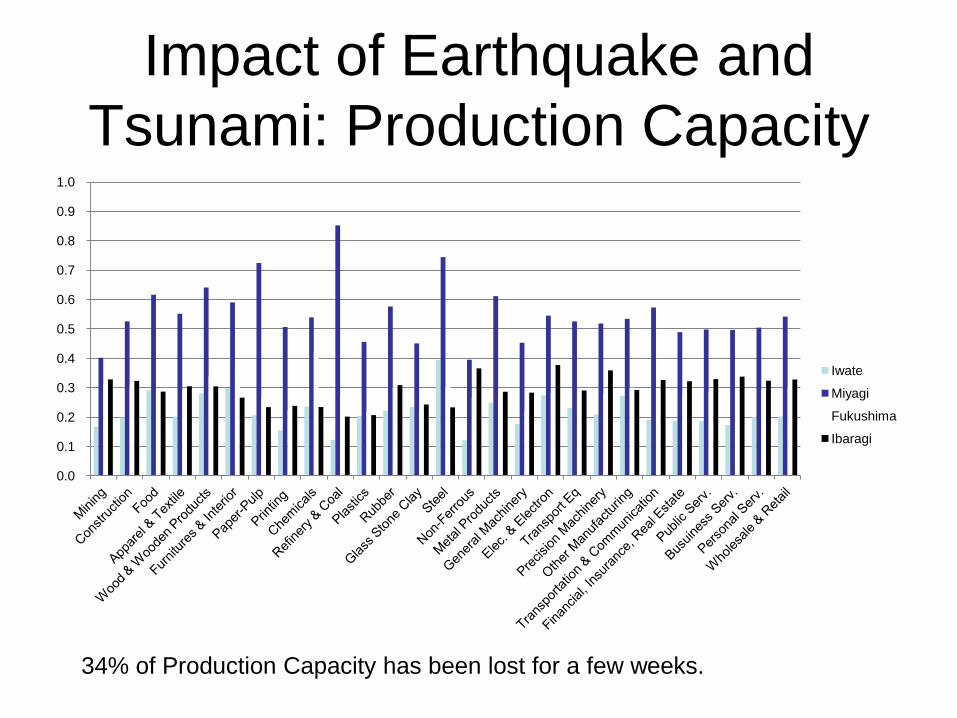
Impact of Earthquake and
Tsunami: Production Capacity
0.0
0.1
0.2
0.3
0.4
0.5
0.6
0.7
0.8
0.9
1.0
Iwate
Miyagi
Fukushima
Ibaragi
34% of Production Capacity has been lost for a few weeks.
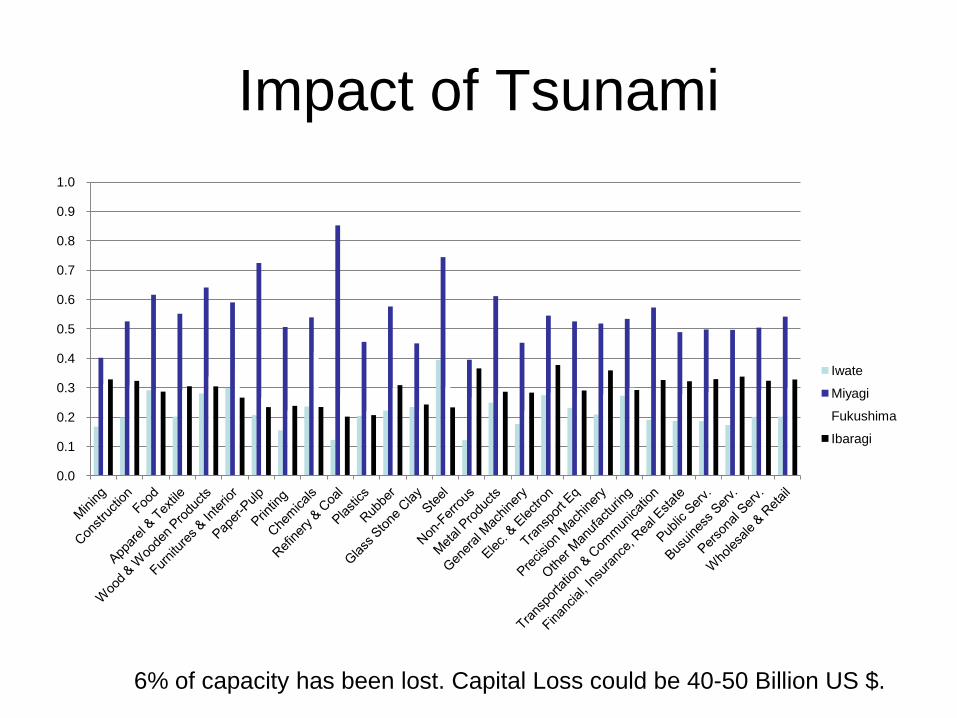
Impact of Tsunami
0.0
0.1
0.2
0.3
0.4
0.5
0.6
0.7
0.8
0.9
1.0
Iwate
Miyagi
Fukushima
Ibaragi
6% of capacity has been lost. Capital Loss could be 40-50 Billion US $.
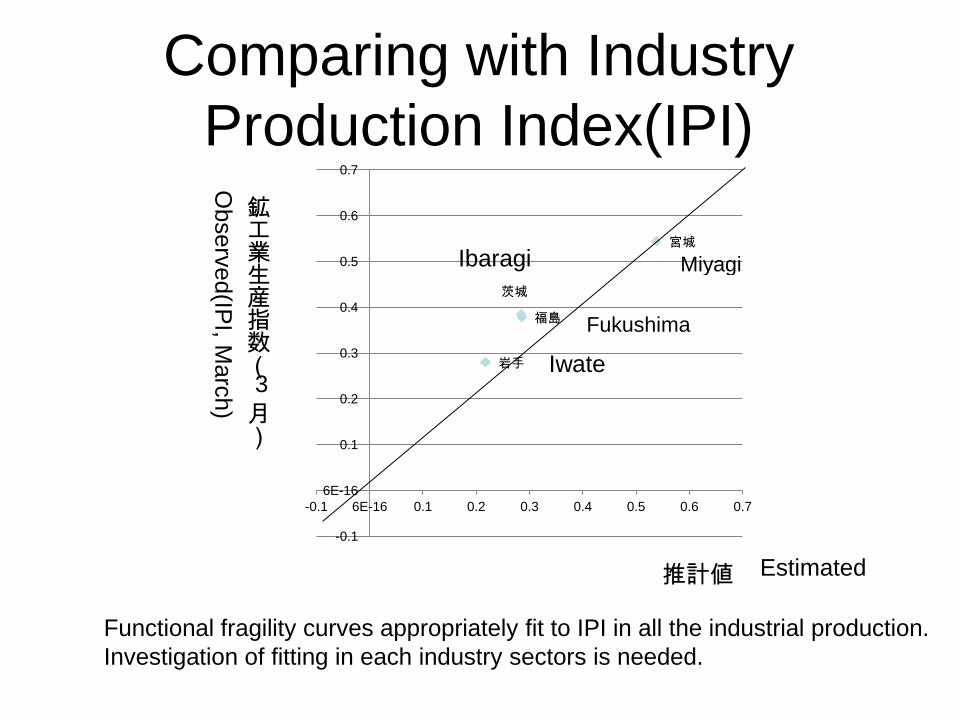
Comparing with Industry
Production Index(IPI)
岩手
宮城
福島
茨城
-0.1
6E-16
0.1
0.2
0.3
0.4
0.5
0.6
0.7
-0.1 6E-16 0.1 0.2 0.3 0.4 0.5 0.6 0.7
Miyagi
鉱工業生産指数(3
月)
推計値
Observ
ed(IP
I, Marc
h)
Estimated
Iwate
Ibaragi
Fukushima
Functional fragility curves appropriately fit to IPI in all the industrial production.
Investigation of fitting in each industry sectors is needed.
0
1000000
2000000
3000000
4000000
5000000
6000000
7000000
8000000
9000000
3/1
1
3/1
3
3/1
5
3/1
7
3/1
9
3/2
1
3/2
3
3/2
5
3/2
7
3/2
9
3/3
1
4/2
4/4
4/6
4/8
4/1
0
4/1
2
4/1
4
4/1
6
4/1
8
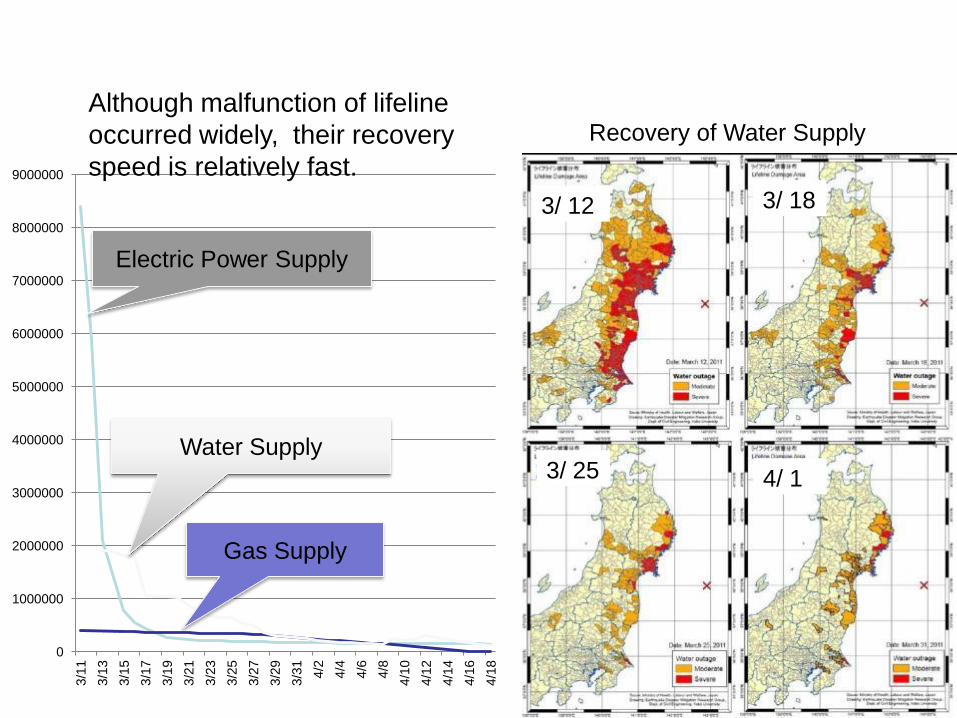
3/ 12 3/ 18
3/ 25 4/ 1
Recovery of Water Supply
Water Supply
Electric Power Supply
Gas Supply
Although malfunction of lifeline
occurred widely, their recovery
speed is relatively fast.
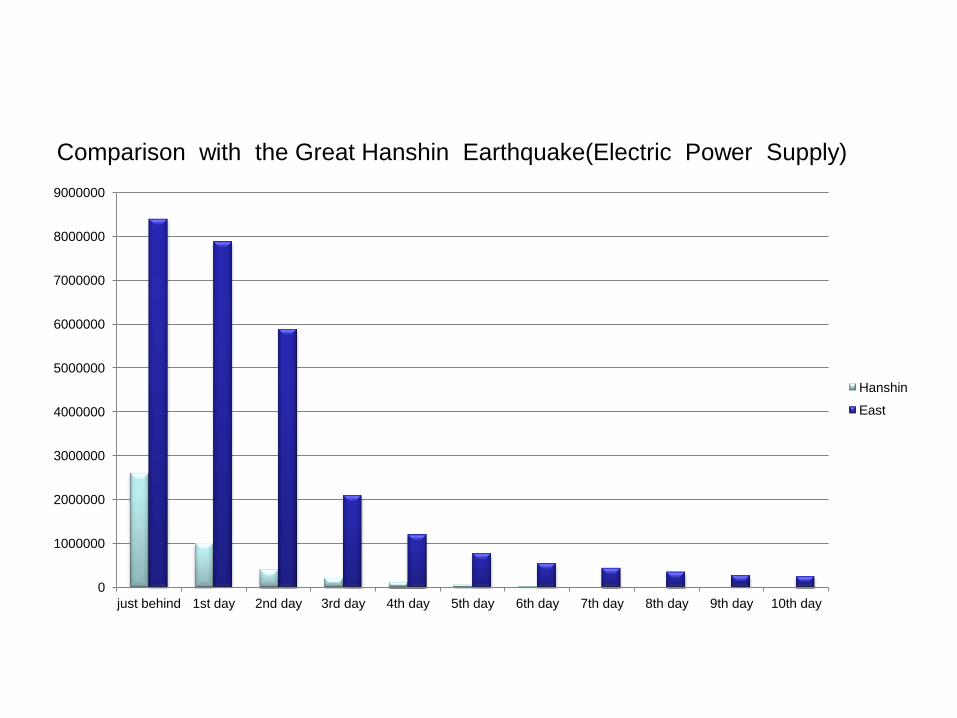
Comparison with the Great Hanshin Earthquake(Electric Power Supply)
0
1000000
2000000
3000000
4000000
5000000
6000000
7000000
8000000
9000000
just behind 1st day 2nd day 3rd day 4th day 5th day 6th day 7th day 8th day 9th day 10th day
Hanshin
East
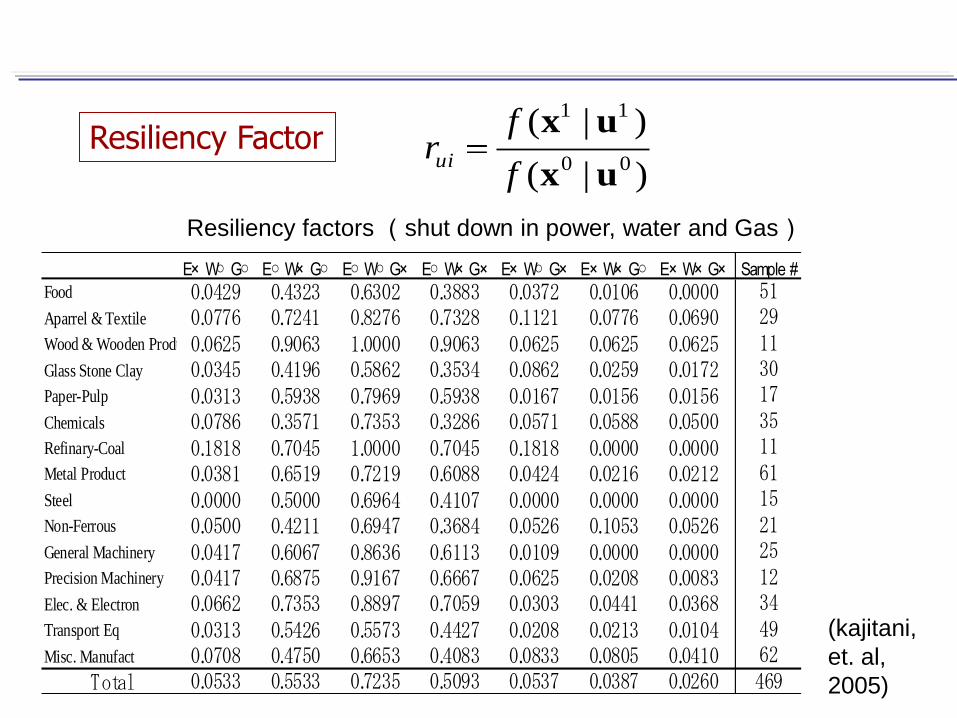
Resiliency Factor )|(
)|(00
11
ux
ux
f
frui
Resiliency factors (shut down in power, water and Gas)
(kajitani,
et. al,
2005)
E× W○ G○ E○ W× G○ E○ W○ G× E○ W× G× E× W○ G× E× W× G○ E× W× G× Sample #
Food 0.0429 0.4323 0.6302 0.3883 0.0372 0.0106 0.0000 51Aparrel & Textile 0.0776 0.7241 0.8276 0.7328 0.1121 0.0776 0.0690 29Wood & Wooden Product0.0625 0.9063 1.0000 0.9063 0.0625 0.0625 0.0625 11Glass Stone Clay 0.0345 0.4196 0.5862 0.3534 0.0862 0.0259 0.0172 30Paper-Pulp 0.0313 0.5938 0.7969 0.5938 0.0167 0.0156 0.0156 17Chemicals 0.0786 0.3571 0.7353 0.3286 0.0571 0.0588 0.0500 35Refinary-Coal 0.1818 0.7045 1.0000 0.7045 0.1818 0.0000 0.0000 11Metal Product 0.0381 0.6519 0.7219 0.6088 0.0424 0.0216 0.0212 61Steel 0.0000 0.5000 0.6964 0.4107 0.0000 0.0000 0.0000 15Non-Ferrous 0.0500 0.4211 0.6947 0.3684 0.0526 0.1053 0.0526 21General Machinery 0.0417 0.6067 0.8636 0.6113 0.0109 0.0000 0.0000 25Precision Machinery 0.0417 0.6875 0.9167 0.6667 0.0625 0.0208 0.0083 12Elec. & Electron 0.0662 0.7353 0.8897 0.7059 0.0303 0.0441 0.0368 34Transport Eq 0.0313 0.5426 0.5573 0.4427 0.0208 0.0213 0.0104 49Misc. Manufact 0.0708 0.4750 0.6653 0.4083 0.0833 0.0805 0.0410 62
Total 0.0533 0.5533 0.7235 0.5093 0.0537 0.0387 0.0260 469
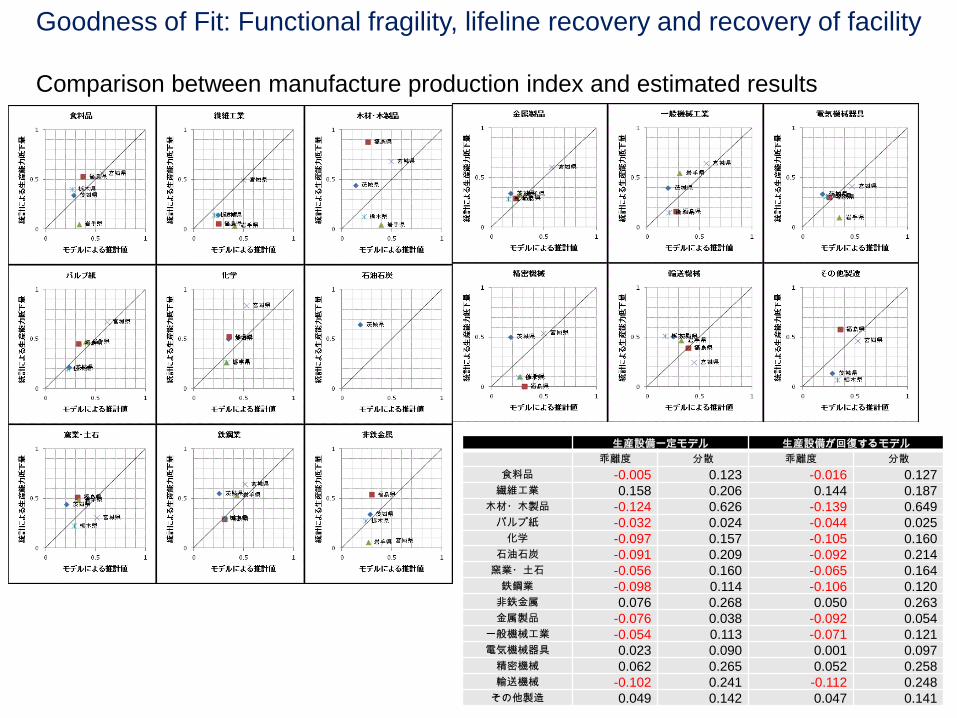
生産設備一定モデル 生産設備が回復するモデル
乖離度 分散 乖離度 分散
食料品 -0.005 0.123 -0.016 0.127 繊維工業 0.158 0.206 0.144 0.187
木材・木製品 -0.124 0.626 -0.139 0.649 パルプ紙 -0.032 0.024 -0.044 0.025
化学 -0.097 0.157 -0.105 0.160 石油石炭 -0.091 0.209 -0.092 0.214
窯業・土石 -0.056 0.160 -0.065 0.164 鉄鋼業 -0.098 0.114 -0.106 0.120
非鉄金属 0.076 0.268 0.050 0.263 金属製品 -0.076 0.038 -0.092 0.054
一般機械工業 -0.054 0.113 -0.071 0.121 電気機械器具 0.023 0.090 0.001 0.097
精密機械 0.062 0.265 0.052 0.258 輸送機械 -0.102 0.241 -0.112 0.248
その他製造 0.049 0.142 0.047 0.141
Goodness of Fit: Functional fragility, lifeline recovery and recovery of facility
Comparison between manufacture production index and estimated results
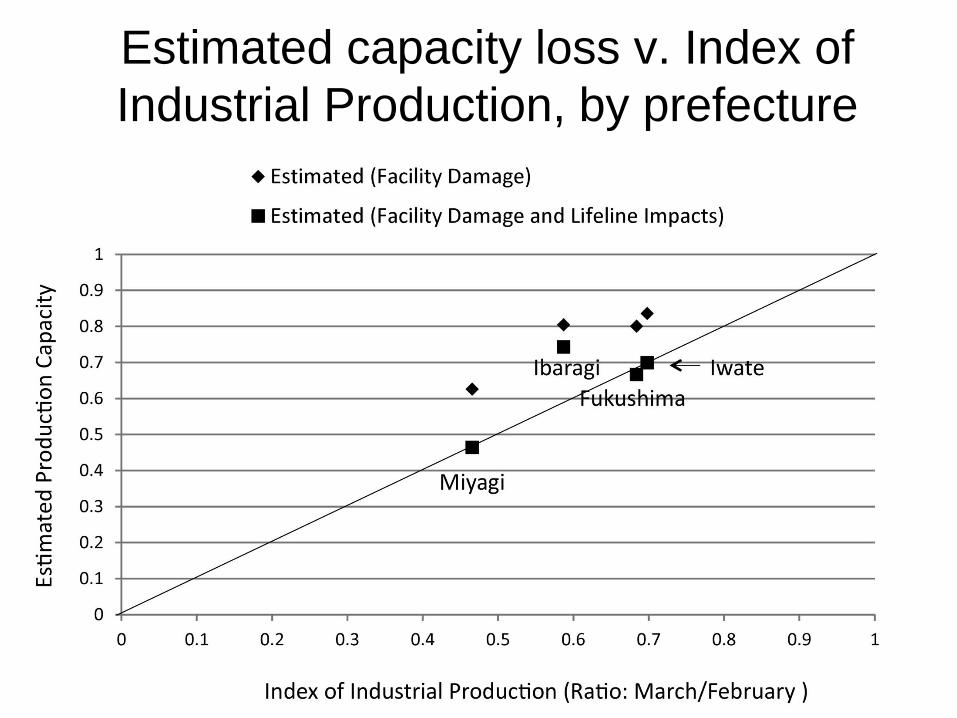
Estimated capacity loss v. Index of
Industrial Production, by prefecture
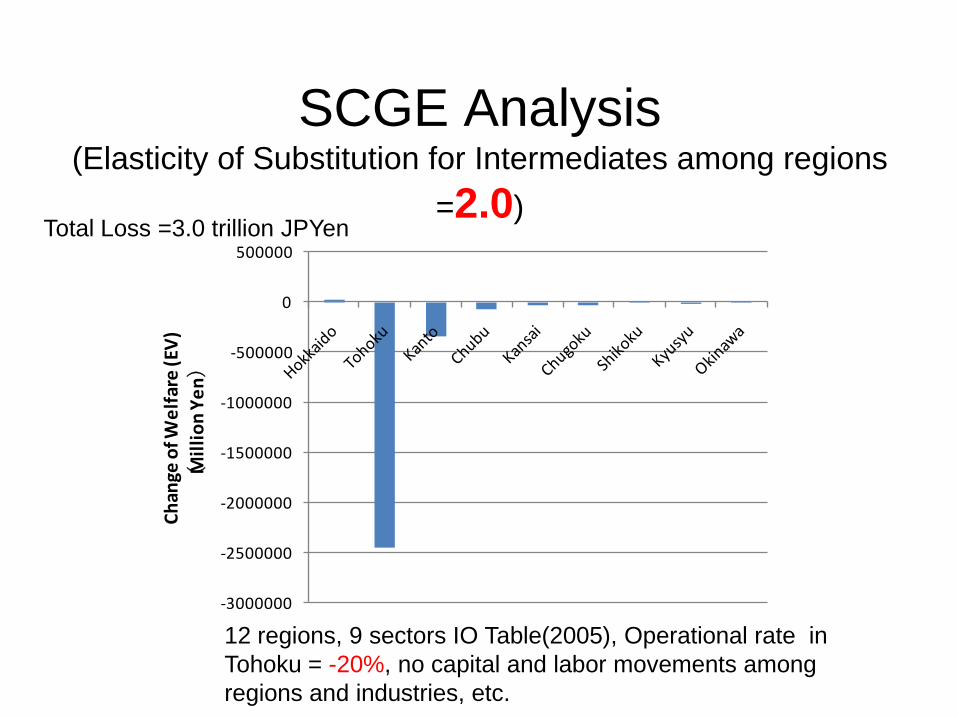
SCGE Analysis (Elasticity of Substitution for Intermediates among regions
=2.0)
12 regions, 9 sectors IO Table(2005), Operational rate in
Tohoku = -20%, no capital and labor movements among
regions and industries, etc.
-3000000
-2500000
-2000000
-1500000
-1000000
-500000
0
500000
Ch
ange
of W
elf
are
(EV
)
(M
illi
on
Ye
n)
Total Loss =3.0 trillion JPYen
-2500000
-2000000
-1500000
-1000000
-500000
0
Ch
ange
of W
elfa
re (E
V)
(M
illio
n Y
en)
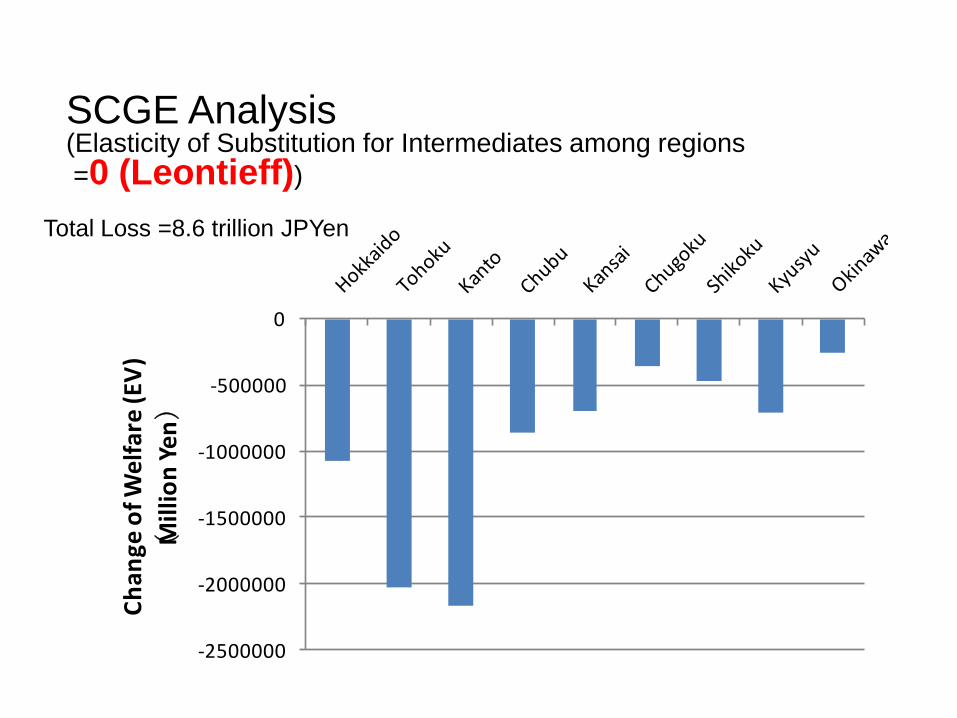
SCGE Analysis (Elasticity of Substitution for Intermediates among regions
=0 (Leontieff))
Total Loss =8.6 trillion JPYen
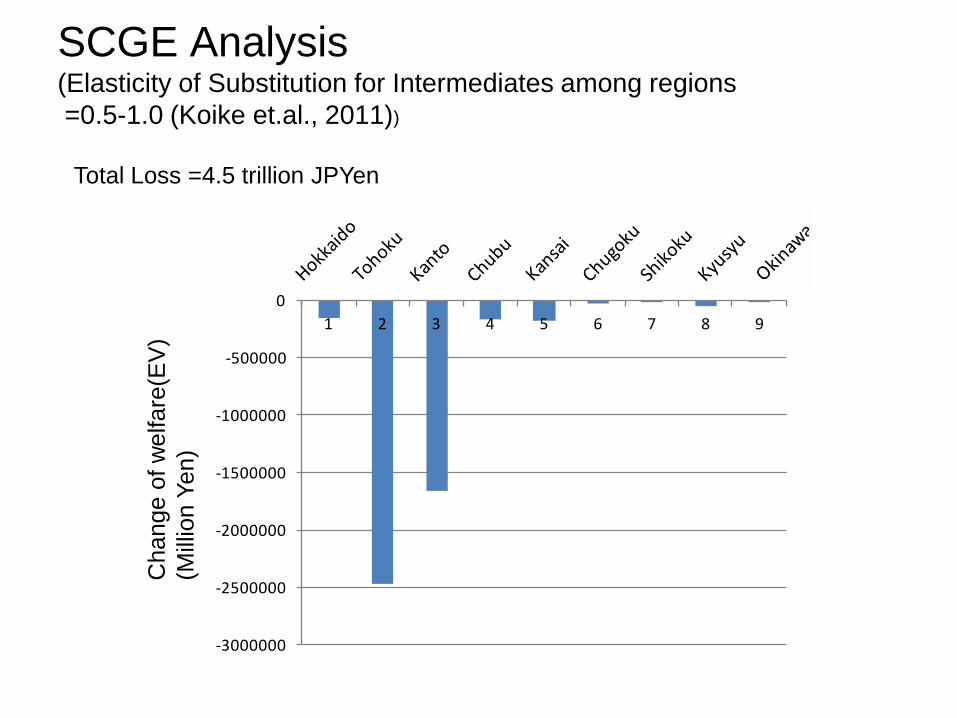
SCGE Analysis (Elasticity of Substitution for Intermediates among regions
=0.5-1.0 (Koike et.al., 2011))
-3000000
-2500000
-2000000
-1500000
-1000000
-500000
0
1 2 3 4 5 6 7 8 9
被害
額合
計(百
万円
)
Change o
f w
elfare
(EV
)
(Mill
ion Y
en)
Total Loss =4.5 trillion JPYen
Final comments
• To evaluate the functionality of the integrated countermeasures at all the possible consequences, we need to develop more sophisticated tools for loss estimation and cost-benefit analysis.
• Based on such understanding, we should built up a robust and flexible system of countermeasures to cope with these events.