Embed Size (px)
Citation preview

TECHNISCHE UNIVERSITÄT MÜNCHEN
Lehrstuhl für Volkswirtschaftslehre – Umweltökonomie und Agrarpolitik
Univ.-Prof. Dr. Klaus Salhofer
Demand Reactions in Food Retailing
Andreas Widenhorn
Vollständiger Abdruck der von der Fakultät für Wirtschaftswissenschaften
der Technischen Universität München zur Erlangung des akademischen
Grades eines
Doktors der Wirtschaftswissenschaften (Dr. rer. pol.)
genehmigten Dissertation.
Vorsitzender: Univ.-Prof. Dr. Martin Moog
Prüfer der Dissertation: 1. Univ.-Prof. Dr. Klaus Salhofer
2. Univ.-Prof. Dr. Jutta Roosen
Die Dissertation wurde am 25.07.2014 bei der Technischen Universität München
eingereicht und durch die Fakultät für Wirtschaftswissenschaften am 15.10.2014
angenommen.

Danksagung II
Danksagung
Ich möchte mich an dieser Stelle bei all denjenigen bedanken, die mich mitunter
Zeit meines Lebens, zumindest aber während meiner Zeit als Doktorand unterstützt
haben.
Mein größter Dank gilt meinem Doktorvater Klaus Salhofer. Neben seiner
hervorragenden fachlichen Beratung schätze ich ihn als Person und war immer stolz, bei
einem kompetenten und zugleich humorvollen Professor arbeiten zu dürfen. Auch für
die Ermutigung zu Vorträgen und Fortbildungen im Ausland möchte ich ihm hiermit ein
besonderes Dankeschön aussprechen. Hierbei gilt mein Dank auch der TUM Graduate
School und der Leonhard Lorenz-Stiftung für die finanzielle Unterstützung. Überdies
möchte ich Jutta Roosen für die Zweitbegutachtung und Martin Moog für den Vorsitz
der Prüfungskommission danken.
Für mich von unschätzbarem Wert war mein gesamtes Umfeld am Lehrstuhl.
Insbesondere meine beiden Doktorandenkollegen Paul Feichtinger und Magnus
Kellermann haben mein Wohlbefinden Tag für Tag signifikant gesteigert. Im Laufe der
Jahre hat sich mit ihnen eine Freundschaft entwickelt, die uns auch nach der
gemeinsamen Zeit am Lehrstuhl verbinden wird. Ebenso angenehm waren die zahl- und
hilfreichen Unterhaltungen mit Thilo Glebe, der mich fachlich und menschlich immer
bestens beraten hat. Mein Dank gilt außerdem der guten Seele des Lehrstuhls, Roswitha
Weinbrunn, für die große Fürsorge und Zuverlässigkeit bei allen organisatorischen
Fragen. Ebenfalls hervorzuheben ist die großartige technische Unterstützung durch
Gisela Rosemeyer, die mir bei allen Hard- und Softwareproblemen immer zu helfen
wusste.
Weitere Kollegen und Freunde, auf deren Rat ich mich immer verlassen konnte,
waren Matthias Zehetmayer, Joachim Kolker, Ludwig Niebler, Max Stegschuster,
Davorin Zustra, Christoph Möller, Lukas Jäger, Johan Mühlman, Richard Hammarsten,
Chris Lundqvist und Martin Stensman.
Für das ausgezeichnete Verhältnis zu meinen Eltern und zu meinem Bruder
Stefan bin ich ebenso dankbar wie für deren uneingeschränkte Unterstützung in allen
Lebenslagen. Eine gesonderte Erwähnung gebührt meiner Frau Leilla, deren großes

Danksagung III
Herz, ihre Lebensfreude und ihr Humor mich immer wieder aufgeheitert und mir zu
einem besseren Leben verholfen haben. Euch ist diese Arbeit gewidmet, als Ausdruck
meiner Dankbarkeit.
Table of Contents
Danksagung ............................................................................................................................... II
List of tables .............................................................................................................................VI
List of figures .......................................................................................................................... VII
List of Abbreviations ............................................................................................................ VIII
Publication and submission record .........................................................................................IX
Zusammenfassung ..................................................................................................................... X
Abstract .................................................................................................................................. XII
1. Demand Reactions in Food Retailing – An overview ........................................................... 1
1.1. Background .............................................................................................................. 1
1.2. Aim of this study ...................................................................................................... 6
1.3. Procedure and Structure ........................................................................................... 7
2. Background on demand theory ......................................................................................... 9
2.1 Theoretical approaches to model consumer demand ................................................ 9
2.2 The Generalized Ordinary Differenced Demand System (GODDS) ..................... 12
2.3 Restrictions derived from demand theory ............................................................... 14
2.4 Problems with household-level data: truncation, sample selection and censoring .. 15
2.4.i Truncation and sample selection ............................................................................ 16
2.4.ii Heckman models for cases of sample selection ...................................................... 16
2.4.iii Censoring ............................................................................................................... 18
2.4.iv Shonkwiler and Yen’s (1999) method for cases of censoring ................................ 19
3. Using a Generalized Ordinary Differenced Demand System to Estimate Price and
Expenditure Elasticities for Milk and Meat in Austria (E1) .......................................... 21
3.1 Extended abstract .......................................................................................................... 21
3.2 The candidate’s contribution to E1 ................................................................................ 22
3.3 Publication .................................................................................................................... 23
4. Price Sensitivity Within and Across Retail Formats (E2) .............................................. 24
4.1 Extended abstract .......................................................................................................... 24
4.2 The candidate’s contribution to E2 ................................................................................ 25
4.3 Publication .................................................................................................................... 25
5. Differentiation in Demand with Different Food Retail Formats (E3) ........................... 26
5.1 Extended abstract .......................................................................................................... 26
5.2 The candidate’s contribution to E3 ................................................................................ 27
5.3 Publication .................................................................................................................... 27

6. Conclusions and discussion............................................................................................... 28
7. References .......................................................................................................................... 31

List of tables VI
List of tables
Table 1: Sub-models of the GODDS and corresponding parameter restrictions
Table 2: Price and expenditure elasticity for all potential models of the GODDS

List of figures VII
List of figures
Figure 1: Market shares of discounters in Europe
Figure 2: Market shares of discounters in Europe in 2010, by country

List of abbreviations VIII
List of abbreviations
(IT)3SLS (Iterative) Three-Stage Least Squares
AIDS Almost Ideal Demand System
CBS Central Bureau of Statistics demand system
ESL Extended shelf life
FD(L)AIDS First Differenced (Linear) Almost Ideal Demand System
GODDS Generalized Ordinary Differenced Demand System
LES Linear Expenditure System
NBR National Bureau of Research demand system
(IT)SUR (Iterative) Seemingly Unrelated Regression
TL Translog model
UHT Ultra-high treatment
UV Unit value
Publication and submission record IX
Publication and submission record
The present work is submitted as a cumulative thesis, based on three publications:
1. Widenhorn, A. and Salhofer, K. (2014a). Using a Generalized Ordinary Differenced
Demand System to Estimate Price and Expenditure Elasticities for Milk and Meat in
Austria. German Journal of Agricultural Economics 63: 109-124.
2. Widenhorn, A. and Salhofer, K. (2014b). Price Sensitivity Within and Across Retail
Formats. Agribusiness 30: 184–194.
3. Widenhorn, A. and Salhofer, K. (2014c). Differentiation in Demand with Different
Food Retail Formats. Selected Paper for the 2014 EAAE Congress in Ljubljana,
Slovenia, 26-29 August.

Zusammenfassung X
Zusammenfassung
Das Hauptziel der vorliegenden Arbeit ist die Schätzung von
Nachfragereaktionen im Lebensmitteleinzelhandel. Hierbei stehen Preis- und
Einkommenselastizitäten im Vordergrund. Diese werden für verschiedene
Produktgruppen geschätzt und zwischen unterschiedlichen Formaten des Lebensmittel-
einzelhandels verglichen. Darüber hinaus werden Konsumentenentscheidungen hin-
sichtlich des Einkaufs in unterschiedlichen Formaten des Lebensmitteleinzelhandels
(Discounter gegenüber Supermärkten) modelliert. Die Ergebnisse liefern wertvolle
Einsichten für den Lebensmittelmitteleinzelhandel, die Politik und modellbasierte
Politikberatung. Den Kern dieser publikationsbasierten Dissertation bilden drei Artikel.
Der erste Artikel „Using a Generalized Differenced Demand Model to Estimate
Price and Expenditure Elasticities for Milk and Meat in Austria” basiert auf einem sehr
allgemeinen und flexiblen Nachfragemodell, welches bekannte Modelle wie das Almost
Ideal Demand System (AIDS), das Rotterdam Modell, das Central Bureau of Statistics
(CBS) Modell und das National Bureau of Research (NBR) Modell beinhaltet. Dieses
allgemeine Modell wird auf verschiedene Produktgruppen und Budgetierungsansätze
angewandt. Als Ergebnis zeigen sich hierbei für höhere Produktaggregationsstufen
erwartungsgemäß schwächere Reaktionen auf Preisänderungen. Die Schätzungen
verdeutlichen außerdem die Bedeutung unterschiedlicher Budgetierungsansätze. Es wird
insbesondere gezeigt, dass sich Unterschiede in den Ergebnissen zwischen
Nachfragestudien deutlich verringern können, wenn unterschiedliche
Budgetierungsstrukturen berücksichtigt werden.
Im zweiten Artikel „Price Sensitivity Within and Across Retail Formats“ werden
Konsumentenreaktionen in den beiden wichtigsten Formaten des Lebens-
mitteleinzelhandels, in Supermärkten und Discountern, gegenübergestellt. Diese
Fragestellung wurde bisher kaum erforscht. Insbesondere gehe ich der Frage nach, ob
Preisreaktionen bei Milchprodukten zwischen Kunden von Discountern und
Supermärkten statistisch signifikante Unterschiede aufweisen. Überdies wird die
Wechselwirkung von Preisänderungen zwischen den beiden Formaten untersucht. Die
Ergebnisse deuten darauf hin, dass zwischen Discounter- und Supermarktkunden in der
Tat signifikante Unterschiede in den Reaktionen auf Preisänderungen bestehen. Dies

Zusammenfassung XI
gilt sowohl für Preisänderungen innerhalb eines Einzelhandelsformates, als auch für
Preisänderungen zwischen den Formaten. Für Preisänderungen bei Trinkmilch ergeben
sich signifikante Nachfragereaktionen zwischen den Formaten, was die mögliche Rolle
dieses Produkts als Lockartikel unterstreicht.
Im dritten Artikel „Differentiation in Demand with Different Food Retail
Formats“ werden potenzielle Unterschiede in den Verhaltensmustern der Kunden von
Discountern und Supermärkten auf zwei wesentliche Aspekte hin untersucht. Einerseits
wird erörtert, welche Haushaltscharakteristika die Wahrscheinlichkeit erhöhen, dass
beim Einkauf ein Discounter einem Supermarkt vorgezogen wird. Andererseits werden
für neun verschiedene Produktgruppen, jeweils in Discountern und Supermärkten und
unter Berücksichtigung von Kaufwahrscheinlichkeiten, Preiselastizitäten geschätzt. Die
Ergebnisse liefern weitere Hinweise auf signifikante Unterschiede in den
Preiselastizitäten für verschiedene Formate. Zusätzlich deuten die Resultate darauf hin,
dass die Nachfrage in Supermärkten signifikant stärker auf Preisänderungen innerhalb
der Supermärkte reagiert als dies für die Nachfrage in Discountern bei Discounter-
Preisänderungen der Fall ist. Andererseits jedoch fallen Nachfragereaktionen in
Discountern auf Preisänderungen in Supermärkten tendenziell stärker aus als jene in
Supermärkten bei Preisänderungen in Discountern. Es wird außerdem ersichtlich, dass
einkommens- und bildungsschwächere Haushalte eine höhere Präferenz für Discounter
aufweisen, während jüngere Konsumenten zwar eine hohe Präferenz für Discounter
besitzen, jedoch einen kleineren Anteil ihres Budgets dort ausgeben.
Insgesamt lassen sich zwei wesentliche Punkte festhalten. Zum einen wird in
dieser Dissertation gezeigt, dass Vergleiche zwischen Nachfrageuntersuchungen stets
die methodische Sensibilität der empirischen Ergebnisse beachten sollten, insbesondere
hinsichtlich des Budgetierungsansatzes. Andererseits belegt diese Arbeit auch, dass eine
getrennte Betrachtung verschiedener Einzelhandelsformate eminent wichtig für die
präzise Schätzung von Nachfragereaktionen sein kann.
Abstract XII
Abstract
The main purpose of this study is to estimate consumers’ demand reactions in
food retailing. To this end, price and income elasticities are of primary interest. These
elasticities are estimated for various product groups and compared between different
food retail formats. In addition, consumers’ choices are modeled in regard to food retail
formats (supermarkets versus discounters). The results provide valuable decision
support for food retailing, policymakers and policy modellers. This cumulative,
publication-based dissertation refers to three of the candidate’s publications.
The first essay „Using a Generalized Differenced Demand Model to Estimate
Price and Expenditure Elasticities for Milk and Meat in Austria” is based on a very
general and flexible demand model, which nests several well-known models including
the Almost Ideal Demand System (AIDS), the Rotterdam model, the Central Bureau of
Statistics (CBS) and the National Bureau of Research (NBR) model. This general model
is applied to different product groups and different budgeting structures. Estimation
results indicate that demand reactions, as expected, turn less strong the more aggregated
the product groups are. Beyond this, the estimation results stress the importance of the
underlying budgeting structure in demand models. It is shown that differences in the
estimated elasticities of demand between studies may downsize remarkably once the
same budgeting structures are considered.
In the second essay „Price Sensitivity Within and Across Retail Formats“,
consumer demand reactions are compared between the two most important food retail
formats, “conventional” supermarkets and discounters. This question has been largely
neglected in literature so far. In particular, I investigate whether consumer responses to
milk price changes are statistically different for discounters and supermarkets. Beyond
this, price reactions across formats are considered as well, i.e. demand reactions in
discounters to price changes in supermarkets and vice versa. Results indicate that
significant differences between price reactions in supermarkets and those in discounters
do exist. This holds true for both, inner-format reactions to price changes and responses
to price changes across retailing formats. With regard to demand reactions to price
changes for drinking milk, significant responses across formats illustrate the potential of
drinking milk as a loss-leader product.
Abstract XIII
As far as the third essay „Differentiation in Demand with Different Food Retail
Formats“ is concerned, potential differences in consumer behaviour for different food
retail formats are analyzed regarding two main aspects. On the one hand, I analyze the
factors which influence a household’s likeliness to prefer shopping at a discounter to
shopping at a supermarket. On the other hand, price elasticities of demand are estimated
for nine different product groups in discounters and supermarkets, applying a method
which includes the individual purchase probabilities.
Results provide further indications for significantly different price elasticities
between different retail formats. Beyond, supermarket demand is found to be more
responsive to inner-format price changes than demand in discounters. However, demand
reactions in discounters related to price changes in supermarkets are stronger than those
in supermarkets when discounter prices are changed. Apart from this, results show that
households with low levels of income and education are more likely to visit discounters,
whereas younger people have a high preference for discounters despite spending less of
their budget in discounters.
Altogether, two main results can be emphasized. First, comparisons of demand
studies must keep in mind the potential for any study’s sensitivity to model and budget
structure specification. Second, this study strongly points at the necessity to estimate
demand reactions for each food retail format separately, whenever data availability
allows for it.
Demand Reactions in Food Retailing – An overview 1
1. Demand Reactions in Food Retailing – An overview
1.1. Background
Today, most empirical studies on consumer price and income responsiveness are
based on econometric estimates of demand and income elasticities, a concept introduced
by Alfred Marshall in 1890. One of this concept’s most appealing features is its
independence from underlying currencies or scaling units of any form. Possibly due to
this handiness, studies in food retailing have made extensive use of elasticities of
demand ever since they were initiated more than one hundred years ago. Noticeably, the
popularity of elasticity estimates in food retailing has anything but diminished over the
course of time, despite all structural changes and methodological innovations.
Altogether, knowledge of elasticities of demand for food products is important in many
respects (Okrent and Alston 2011).
As an example, elasticities of demand have been estimated for several purposes
of taxation, such as the taxation of food types associated with type 2 diabetes and
obesity. Here, elasticities of demand are highly valuable in view of many health sectors’
massive potential for cost savings (Malik et al. 2006, Vartanian et al. 2007), and hence
important for many countries worldwide. Denmark’s temporarily introduced “fat tax” in
2011, Hungary’s “junk food tax” of the same year or France’s so-called “Nutella tax” in
2012 are just a few further examples of cases in which governments have tried to
anticipate changes in consumer demand following price changes of particular products
(Washington Post 2012).
Accordingly, a multitude of studies have estimated elasticities of demand for
sugared, sweetened or other high-fructose products. In an attempt to summarize these
elasticity estimates for the U.S., Powell et al. (2013) find that price elasticities of
demand may vary considerably for different types of healthy and unhealthy products.
Particularly, demand for fast food products in the U.S. is not very responsive to price
changes, while this is also true for fruits and vegetables. At the same time however,
U.S. consumers tend to adjust their demand more strongly for price changes of sugared
beverages.
Demand Reactions in Food Retailing – An overview 2
The importance of elasticities of demand is further reflected in a variety of
studies on product attributes such as organic vs. non-organic products (e.g. Choi and
Wohlgenant 2012, Monier et al. 2009, Dhar and Foltz 2005, Glaser and Thompson
2000). With this respect, empirical evidence usually suggests that price elasticities for
organic products are significantly higher. According to Ritson and Brennan (2008),
price elasticities for organic products are commonly about double the size of those of
the corresponding non-organic products.
Another issue for which elasticities of demand are of crucial importance is the
evolution of private labels as opposed to national brands (e.g. Bezawada and Pauwels
2013, Jonas and Roosen 2008, Bontemps et al. 2008, Akbay et al. 2005). Reviewing 73
articles on private labels, Hyman et al. (2010) find that price elasticities are generally
not the same for national brand products and private label products. On top of this, they
state that households with different income constraints are characterized by different
price elasticities for private label- and national brand products, a finding also paralleled
by Akbay et al. (2000).
Relating to this, when looking at elasticities of demand from an international
viewpoint, one also finds different elasticities of demand for countries with different
levels of per-capita income (Muhammad et al. 2011). With gradually developing per-
capita income levels, it hence seems that elasticities of demand may change over time,
even when the same sample of people is considered. For instance, Andreyeva et al.
(2010) provide an overview on U.S. studies estimating price elasticities of demand for
various product groups over a period of about seventy years. Interestingly, quite some
variation in the results of the included 160 studies can be found, while Andreyeva et al.
(2010) state that parts of this variation could be attributed to the choice of demand
models. However, for some product groups, the methodological choice is not found to
have a significant impact on the estimates, suggesting that other factors such as
heterogeneous consumer behavior might play an important role as well. In fact, Grunert
(2003) points out that consumer reactions in food retailing are subject to a complex set
of dynamic individual and cultural factors.
Owing to the diversity of consumer preferences, food retailers have established
several food retail formats to target different types of consumers (Ahlert et al. 2005).
Demand Reactions in Food Retailing – An overview 3
This important development however, has so far not been thoroughly analyzed as to
potential differences in elasticities of demand for different food retail formats. In other
words, while distinct elasticities of demand have been found for products with different
attributes, very little is known about the relationship between elasticities of demand and
different retail formats.
In terms of food retail formats today, various formats have become popular in
different regions of the world. Possibly the most noticeable trend in Europe occurred for
discount stores over the last decades. An example of a typical European discounter,
sometimes also referred to as hard discounter, is ALDI. Discounters usually offer a
limited sales area and a smaller variety in assortment as compared to supermarkets
(Berman and Evan 2006). As part of their strategy, most hard discounters also offer a
comparably high percentage of private-label products (Bustillo and Timothy 2010). The
two main hard-discounters worldwide, ALDI and Lidl, are now active on more than 20
European markets, and belong to the top 25 retailers of the world (Nielsen 2007).
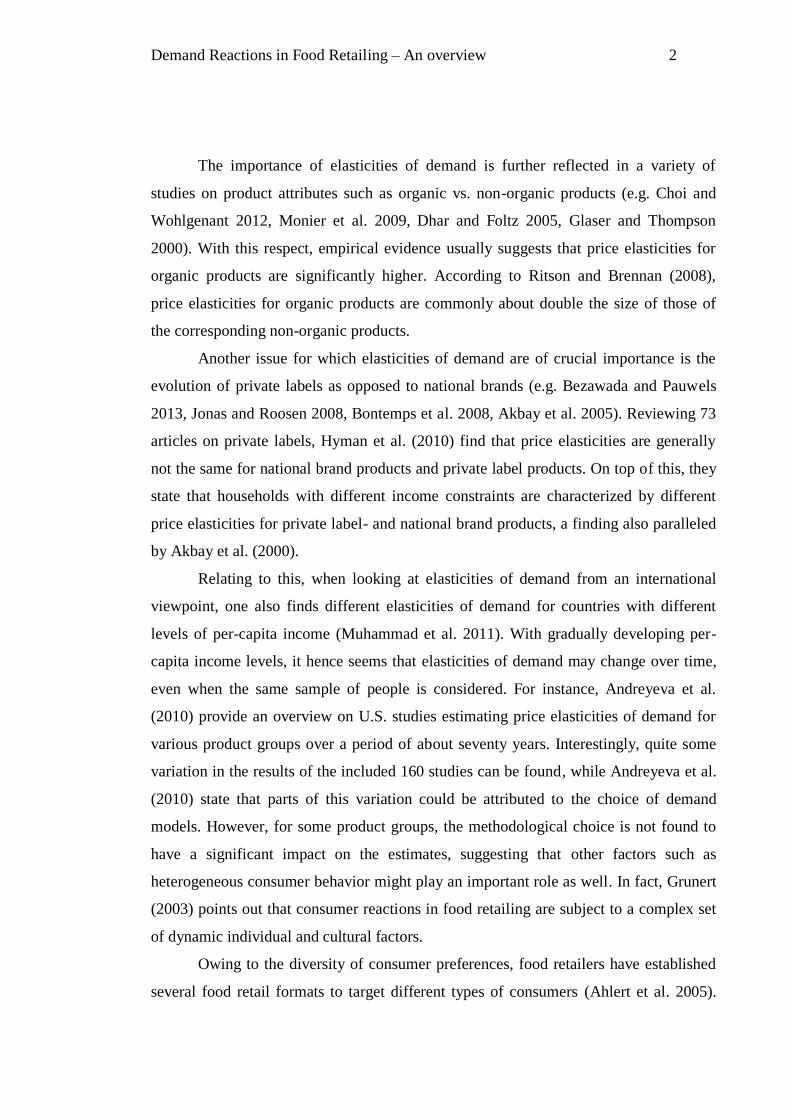
Looking at the 20 main food retail markets of Europe, discounters have increased their
overall market shares (Nielsen Grocery Universe 2012), as depicted in Figure 1.
Figure 1: Overall market shares of discounters in Europe, between 1994 and 2010
Source: Nielsen Grocery Universe 2012
0
2
4
6
8
10
12
14
16
18
20
1994 1998 2002 2006 2010
Mar
ket
shar
e in
%
Year
Demand Reactions in Food Retailing – An overview 4
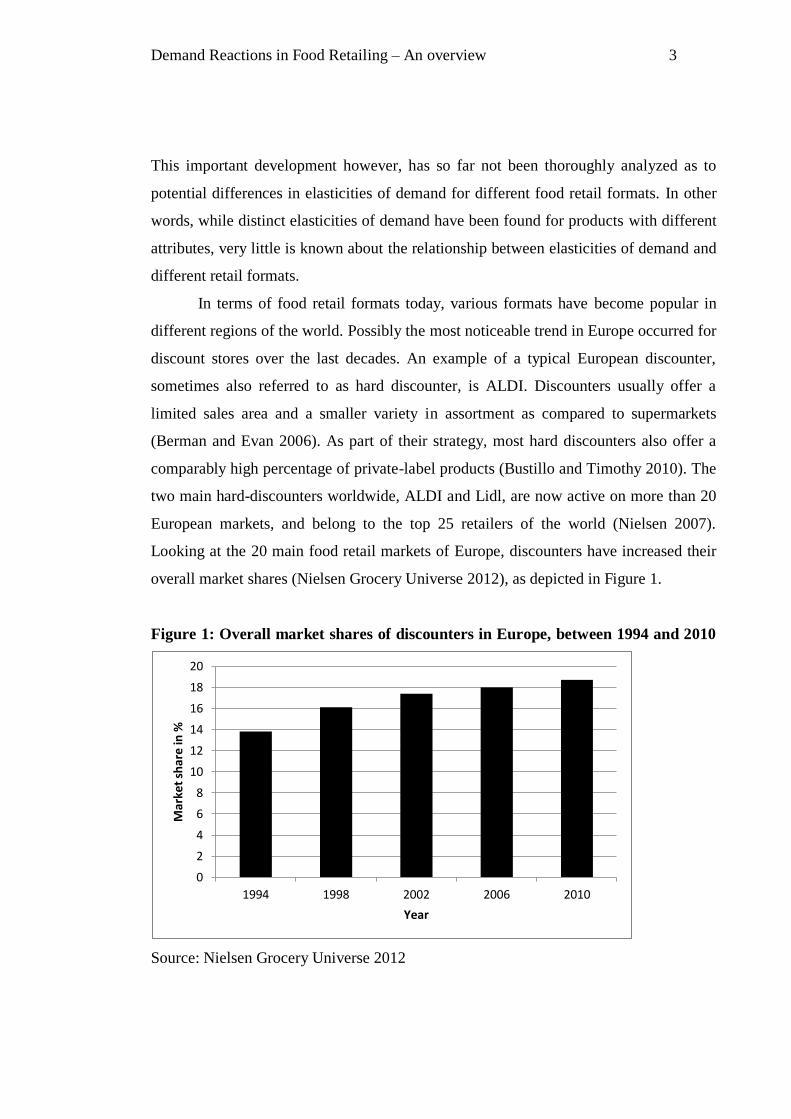
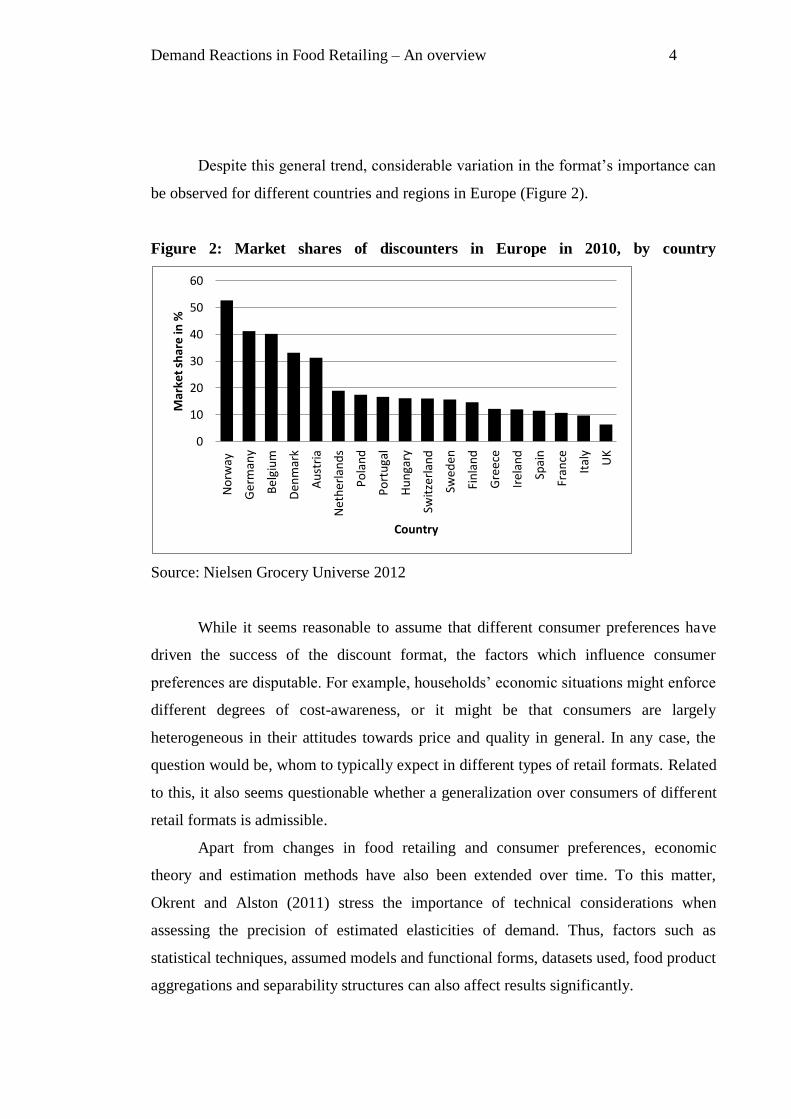
Despite this general trend, considerable variation in the format’s importance can
be observed for different countries and regions in Europe (Figure 2).
Figure 2: Market shares of discounters in Europe in 2010, by country
Source: Nielsen Grocery Universe 2012
While it seems reasonable to assume that different consumer preferences have
driven the success of the discount format, the factors which influence consumer
preferences are disputable. For example, households’ economic situations might enforce
different degrees of cost-awareness, or it might be that consumers are largely
heterogeneous in their attitudes towards price and quality in general. In any case, the
question would be, whom to typically expect in different types of retail formats. Related
to this, it also seems questionable whether a generalization over consumers of different
retail formats is admissible.
Apart from changes in food retailing and consumer preferences, economic
theory and estimation methods have also been extended over time. To this matter,
Okrent and Alston (2011) stress the importance of technical considerations when
assessing the precision of estimated elasticities of demand. Thus, factors such as
statistical techniques, assumed models and functional forms, datasets used, food product
aggregations and separability structures can also affect results significantly.
0
10
20
30
40
50
60
No
rway
Ge
rman
y
Bel
giu
m
Den
mar
k
Au
stri
a
Net
her
lan
ds
Po
lan
d
Po
rtu
gal
Hu
nga
ry
Swit
zerl
and
Swed
en
Fin
lan
d
Gre
ece
Irel
and
Spai
n
Fran
ce
Ital
y
UK
Mar
ket
shar
e in
%
Country
Demand Reactions in Food Retailing – An overview 5
Considering the models to estimate elasticities of demand, the Almost Ideal
Demand System (AIDS) by Deaton and Muellbauer (1980), the Rotterdam model by
Theil (1965), the linear expenditure system (LES) by Stone (1954) and the translog
(TL) model by Christensen et al. (1975) are among the most popular ones (Barnett and
Kalonda-Kalyama 2012, Clements and Selvanathan 1988). Aside from these, several
others have been developed, such as the Quadratic AIDS model (Banks et al., 1997),
models that allow imposing curvature restrictions (Ryan and Wales 1998) or dynamic
models (Anderson and Blundell 1983). The availability of various models has lead to
several comparative studies (e.g. Barnett and Seck 2008, Meyer et al. 2011). Overall,
there seems to be no single model which can generally be considered optimal, and the
suitability of a model seems to depend rather on data than on universal criteria (Matsuda
2005).
Furthermore, most empirical studies on food demand would not be feasible
without a certain degree of separability, due to data limitations. Generally, separability
of goods implies that consumers first allocate their budget for broad product groups and
afterwards turn to the budget allocation for less aggregated sub-groups. While various
forms of separability assumptions exist, the most commonly applied one is weak
separability, also because strong separability cannot be expected to hold in most
empirical applications (Okrent and Alston 2011). Any group or subgroup of goods is
weakly separable from the rest of groups, if the utility from consumption of this groups
solely depends on characteristics within the group, not on characteristics observed in
other groups. Under this assumption, the number of parameters to be estimated is
reduced, since demand for any group can be estimated in isolation. However, the
resulting estimates for any sub-group are conditional on the budget allocated to product
groups at higher levels of aggregation. Hence, the assumed budgeting structure is
closely related to the assumptions in terms of separability of goods. If single budgeting
stages are considered, or higher stages of budgeting are excluded, e.g. if one excludes
the choice of how much to spend on food or on meat, milk etc. in general, there are
implicit assumptions on the relationships between elasticities of demand at different
budgeting stages. For example, it is implicitly ignored that price changes of sub-
categories to some extent change the price level of the category as a whole (Edgerton
Demand Reactions in Food Retailing – An overview 6
1997). As an alternative to ignoring these kinds of indirect effects, multiple budgeting
stages can be combined after estimation, as proposed by Edgerton (1997) and
Carpentier and Guyomard (2001). In addition to an improvement in precision, the
inclusion and combination of all stages of budgeting allows for assessing the impacts of
changes in macroeconomic factors such as changes in GDP or taxation (Bouamra-
Mechemache et al. 2008). However, possibly depending on e.g. budget shares of
considered sub-categories, available data or on the focus on either policy or corporate
decisions, estimates from different budgeting structures are presented in the literature
(e.g. Glaser and Thompson 2000, Yu and Abler 2009), implying different formulas
underlying the estimates for elasticities of demand.
1.2. Aim of this study
The main purpose of this study is to analyze elasticities of demand as to their
validity when different food retail formats and different estimation approaches are
considered. As a crucial part, the need for differentiation will be studied in terms of
discount stores on the one side and more traditional retail formats, such as
supermarkets, on the other. Alongside, consumer heterogeneity is also investigated in
terms of factors influencing a household’s preference for the discount format and
overall spending in discounters. Estimation is carried out applying different demand
models and different assumptions on the structure of budgeting. By this, factors causing
variation in results shall be examined, both in terms of modeling and in terms of data
aggregation.
Estimations refer to the Austrian food retail market, whereas some comparisons
to Germany and other European markets are also presented. In summation, three main
objectives are pursued in this study:
1) To estimate demand reactions for different food retail formats, with a focus on
differences between discounters on the one hand and more traditional retailers
such as supermarkets on the other.

Demand Reactions in Food Retailing – An overview 7
2) To analyze factors of format choice, aggregate format spending and format-
switching potential.
3) To evaluate the sensitivity of estimates with regard to assumptions on budgeting
structures.
1.3. Procedure and Structure
All key questions of this study are addressed through three empirical essays. The
first essay, Widenhorn and Salhofer (2014a), is referred to as E1 in the sequel, whereas
the second essay, Widenhorn and Salhofer (2014b) will be called E2, and Widenhorn
and Salhofer (2014c) is equivalent to the third essay, E3. In E1, a rather aggregated
viewpoint on elasticities of demand in Austria is taken. In this regard, the focus is put
on general modeling issues, different models included in one nesting model and the
impact of alternations in the assumed budgeting structure. Thereafter, in E2, consumer
demand is separated by discount stores on the one hand and more traditional formats
such as supermarkets on the other. Both inner-and cross-format reactions are estimated,
and their statistical dissimilarity is tested for in the process.
Next, in E3, differences in demand reactions across retail formats are further
investigated, with the extension to a number of nine product groups in each formats and
the inclusion of sociodemographic factors in the estimation. At this point, a different
modeling approach is used, tailored for household panel data and issues of censoring
and selection mechanisms. As far as household sociodemographics are concerned,
format choice factors will be given particular attention. Here, overall budget portions
allocated to discounters on the one hand and supermarkets on the other are also
analyzed.
The structure of this study is as follows: At first, an overview on foundations of
demand theory is provided, in Chapter 2. More precisely, Chapter 2.1 elaborates on
some theoretical underpinnings when estimating elasticities of demand, whereas
Chapter 2.2 describes a nesting model, which is applied in E1 and E2. Alongside with
the estimation of demand reactions, some theoretical restrictions can be imposed in the
Demand Reactions in Food Retailing – An overview 8
course of the estimation. These restrictions are explained in Chapter 2.3. In Chapter
2.4.ii, a selection model is characterized, which serves to filter out determinants of store
format choice and aggregate spending in E3. Beyond, Chapter 2.4.iv includes a
censoring model used to check for dissimilarity of demand reactions for a wider array of
product groups in E3. Chapter 3 then gives a summary of E1. In Chapter 4, a summary
of E2 is provided, and Chapter 5 contains a summary of E3. Chapter 6 summarizes and
highlights the main findings of all the three essays.
Background on demand theory 9
2. Background on demand theory
2.1 Theoretical approaches to model consumer demand
Analyzing consumer demand implies the aim of capturing the behavior of a
representative consumer or household as accurately as possible. Microeconomic theory
offers two related concepts to accomplish this task: Utility maximization and
expenditure minimization (Barten 1993). In any case, the consumer is assumed to
comply with a set of preference axioms. These axioms need to be satisfied in order to
allow for defining and making mathematical use of utility functions and portraying
rational behavior (Autor 2010). Most importantly, it is required that a consumer’s
preferences are complete, transitive and continuous. Completeness refers to consumers
being able to establish a preference ordering, while transitiveness requires consumers to
be consistent in their choices. Continuity is satisfied if a consumer has a smooth
preference order, i.e. a preference order without any “kinks” (Kirman 1992). Beyond,
for utility-based models to yield reliable information, preferences are assumed to be
stable over time. In addition, consumers need to have complete information on their
available choices at all times.
This being said, two additional axioms are accepted if a utility function is meant
to serve as the basis for a demand function (Okrent and Alston 2011). Mainly, consumer
preferences need to be non-satiated, meaning that consumers would generally prefer
possessing higher quantities of any good. Second, consumer preferences should be
strictly convex, which entails strictly quasiconcave utility functions. The latter are
necessary in order to obtain a maximum when solving the utility optimization problem.
The above axioms provided, a straightforward way to model consumer demand
is to establish a utility-maximizing framework. In doing so, it is assumed that
consumers seek to maximize their level of satisfaction through consumption of goods,
while their choices are constrained by a limited budget (Mas-Colell et al. 1995). Each
consumer solves the following maximization problem:
(1)
Background on demand theory 10
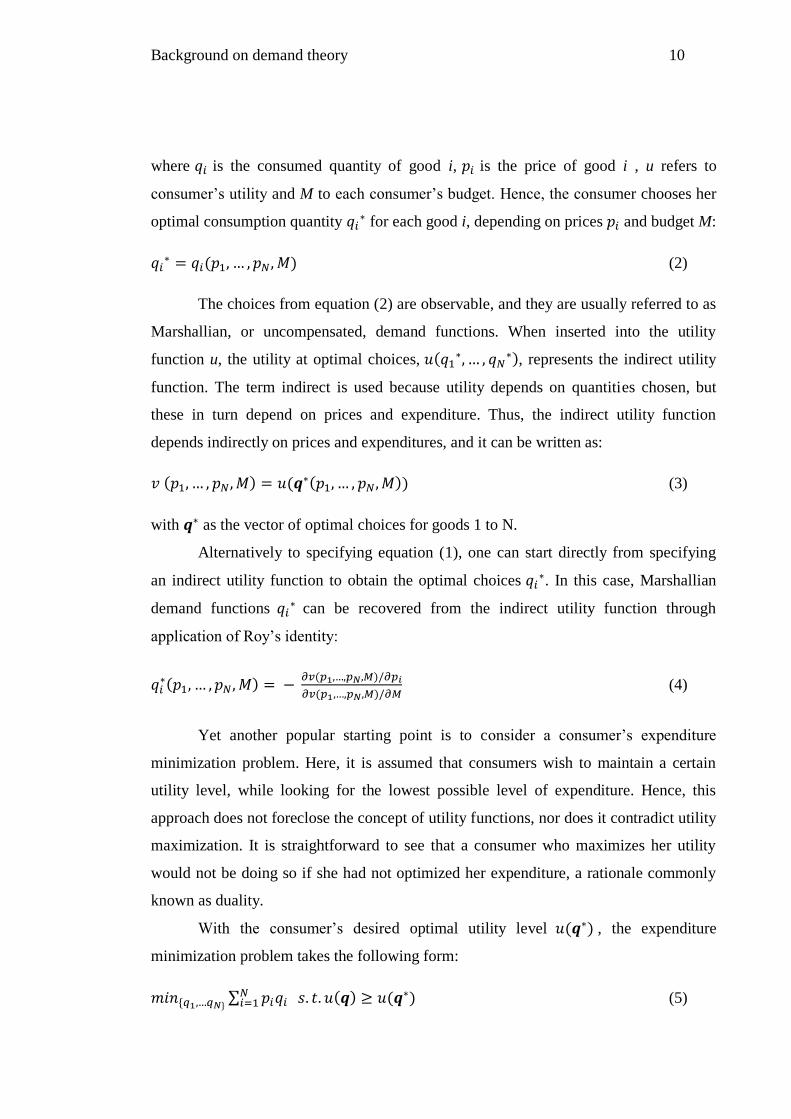
where is the consumed quantity of good i, is the price of good i , u refers to
consumer’s utility and M to each consumer’s budget. Hence, the consumer chooses her
optimal consumption quantity for each good i, depending on prices and budget M:
(2)
The choices from equation (2) are observable, and they are usually referred to as
Marshallian, or uncompensated, demand functions. When inserted into the utility
function u, the utility at optimal choices,
, represents the indirect utility
function. The term indirect is used because utility depends on quantities chosen, but
these in turn depend on prices and expenditure. Thus, the indirect utility function
depends indirectly on prices and expenditures, and it can be written as:
(3)
with as the vector of optimal choices for goods 1 to N.
Alternatively to specifying equation (1), one can start directly from specifying
an indirect utility function to obtain the optimal choices . In this case, Marshallian
demand functions can be recovered from the indirect utility function through
application of Roy’s identity:
(4)
Yet another popular starting point is to consider a consumer’s expenditure
minimization problem. Here, it is assumed that consumers wish to maintain a certain
utility level, while looking for the lowest possible level of expenditure. Hence, this
approach does not foreclose the concept of utility functions, nor does it contradict utility
maximization. It is straightforward to see that a consumer who maximizes her utility
would not be doing so if she had not optimized her expenditure, a rationale commonly
known as duality.
With the consumer’s desired optimal utility level , the expenditure
minimization problem takes the following form:
(5)
Background on demand theory 11
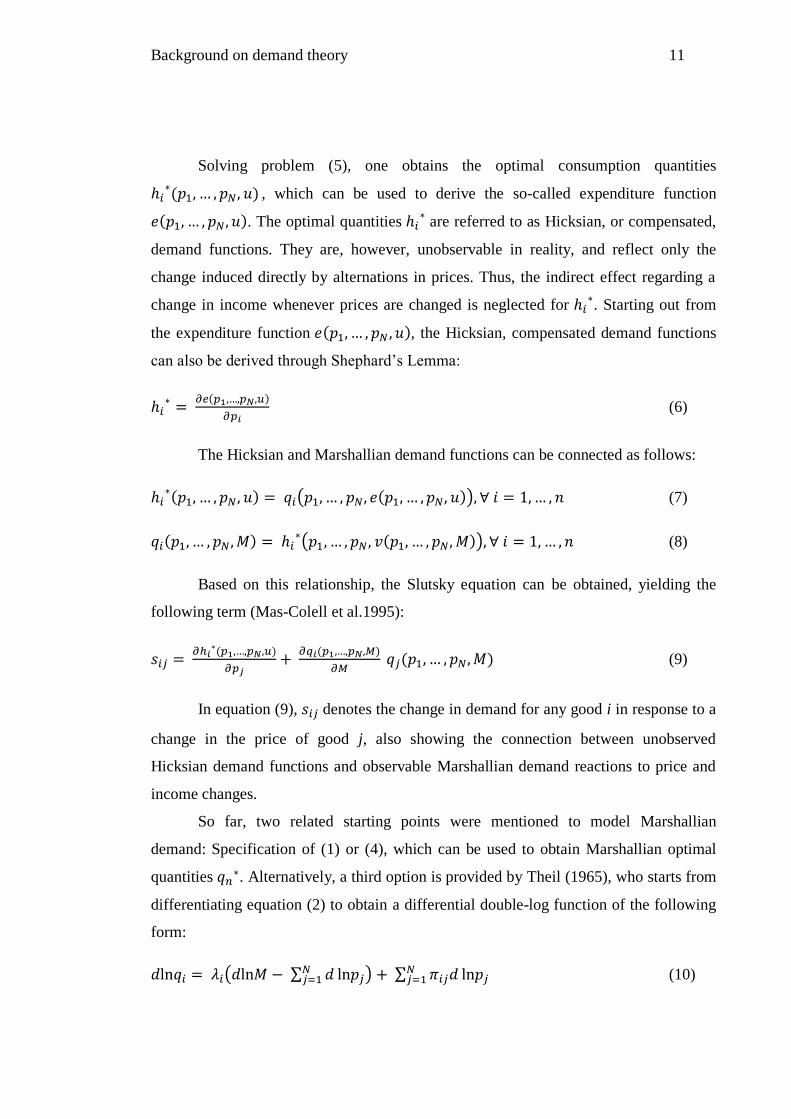
Solving problem (5), one obtains the optimal consumption quantities
, which can be used to derive the so-called expenditure function
. The optimal quantities are referred to as Hicksian, or compensated,
demand functions. They are, however, unobservable in reality, and reflect only the
change induced directly by alternations in prices. Thus, the indirect effect regarding a
change in income whenever prices are changed is neglected for . Starting out from
the expenditure function , the Hicksian, compensated demand functions
can also be derived through Shephard’s Lemma:
(6)
The Hicksian and Marshallian demand functions can be connected as follows:
(7)
(8)
Based on this relationship, the Slutsky equation can be obtained, yielding the
following term (Mas-Colell et al.1995):
(9)
In equation (9), denotes the change in demand for any good i in response to a
change in the price of good j, also showing the connection between unobserved
Hicksian demand functions and observable Marshallian demand reactions to price and
income changes.
So far, two related starting points were mentioned to model Marshallian
demand: Specification of (1) or (4), which can be used to obtain Marshallian optimal
quantities . Alternatively, a third option is provided by Theil (1965), who starts from
differentiating equation (2) to obtain a differential double-log function of the following
form:
(10)
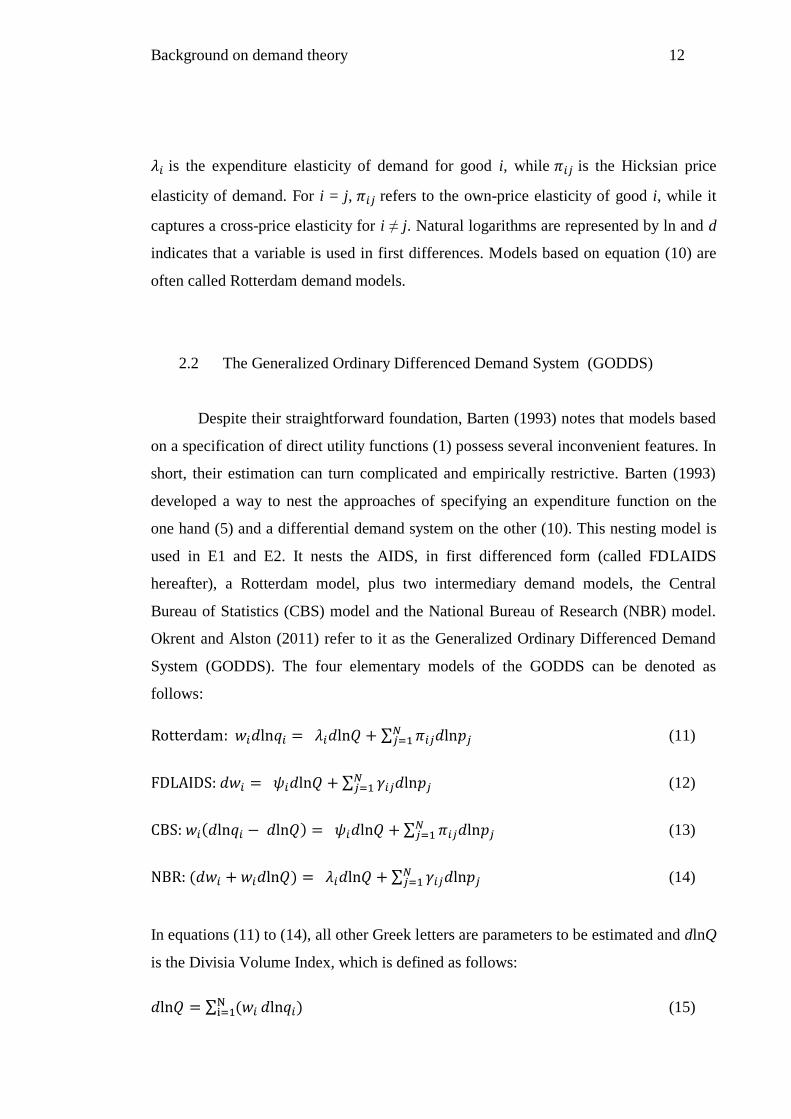
Background on demand theory 12
is the expenditure elasticity of demand for good i, while is the Hicksian price
elasticity of demand. For i = j, refers to the own-price elasticity of good i, while it
captures a cross-price elasticity for i ≠ j. Natural logarithms are represented by ln and d
indicates that a variable is used in first differences. Models based on equation (10) are
often called Rotterdam demand models.
2.2 The Generalized Ordinary Differenced Demand System (GODDS)
Despite their straightforward foundation, Barten (1993) notes that models based
on a specification of direct utility functions (1) possess several inconvenient features. In
short, their estimation can turn complicated and empirically restrictive. Barten (1993)
developed a way to nest the approaches of specifying an expenditure function on the
one hand (5) and a differential demand system on the other (10). This nesting model is
used in E1 and E2. It nests the AIDS, in first differenced form (called FDLAIDS
hereafter), a Rotterdam model, plus two intermediary demand models, the Central
Bureau of Statistics (CBS) model and the National Bureau of Research (NBR) model.
Okrent and Alston (2011) refer to it as the Generalized Ordinary Differenced Demand
System (GODDS). The four elementary models of the GODDS can be denoted as
follows:
(11)
(12)
(13)
(14)
In equations (11) to (14), all other Greek letters are parameters to be estimated and dlnQ
is the Divisia Volume Index, which is defined as follows:
(15)
Background on demand theory 13
According to Barten (1993) and Eales et al. (1997), the four basic models in
equations (11) to (14) are nested as follows:
(16)
The parameters to be estimated are the constant price coefficient , the expenditure
coefficient , and the model’s nesting parameters and , whereas represents the
Kronecker Delta ( = 1 for i = j, 0 otherwise). While the price coefficient is
composed of , the expenditure coefficient is given as
(Okrent and Alston 2011).
All of the four nested models are used in differenced form, where Gao and
Shonkwiler (1993) note that difference models are preferable in the sense that
spuriously desisting from differencing induces more severe falsifications than the use of
differencing in cases in which it would not have been necessary.
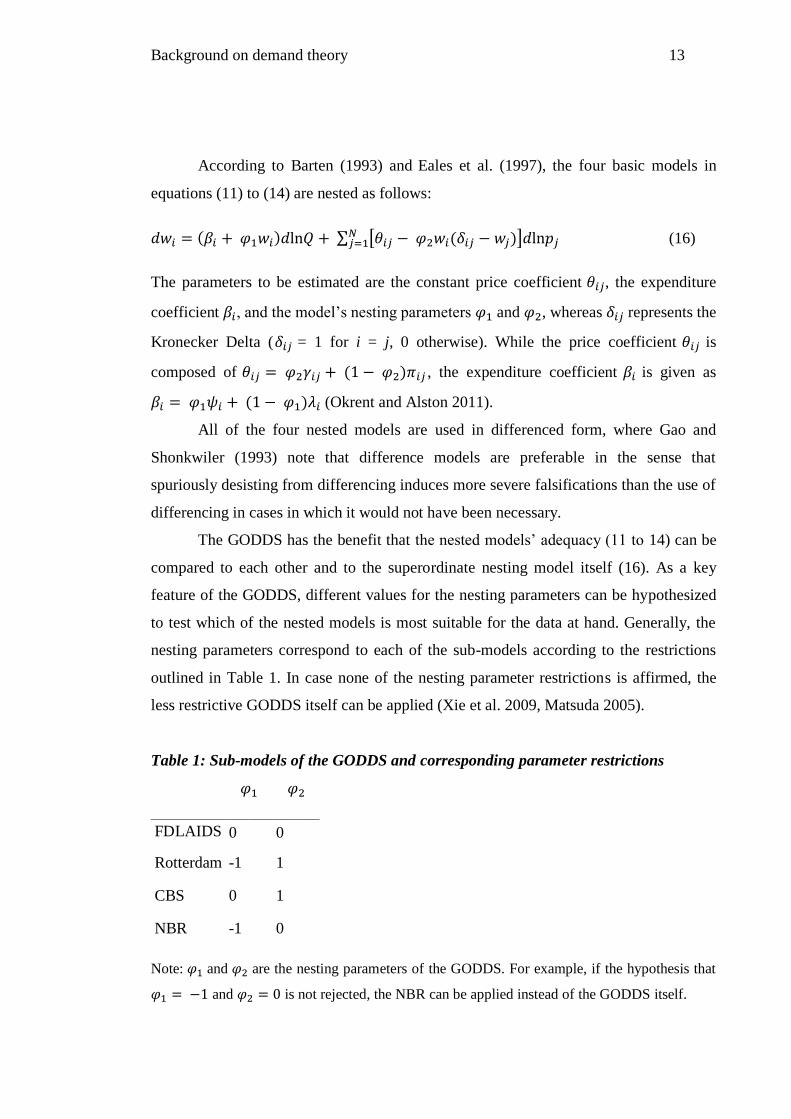
The GODDS has the benefit that the nested models’ adequacy (11 to 14) can be
compared to each other and to the superordinate nesting model itself (16). As a key
feature of the GODDS, different values for the nesting parameters can be hypothesized
to test which of the nested models is most suitable for the data at hand. Generally, the
nesting parameters correspond to each of the sub-models according to the restrictions
outlined in Table 1. In case none of the nesting parameter restrictions is affirmed, the
less restrictive GODDS itself can be applied (Xie et al. 2009, Matsuda 2005).
Table 1: Sub-models of the GODDS and corresponding parameter restrictions
FDLAIDS 0 0
Rotterdam -1 1
CBS 0 1
NBR -1 0
Note: and are the nesting parameters of the GODDS. For example, if the hypothesis that
and is not rejected, the NBR can be applied instead of the GODDS itself.
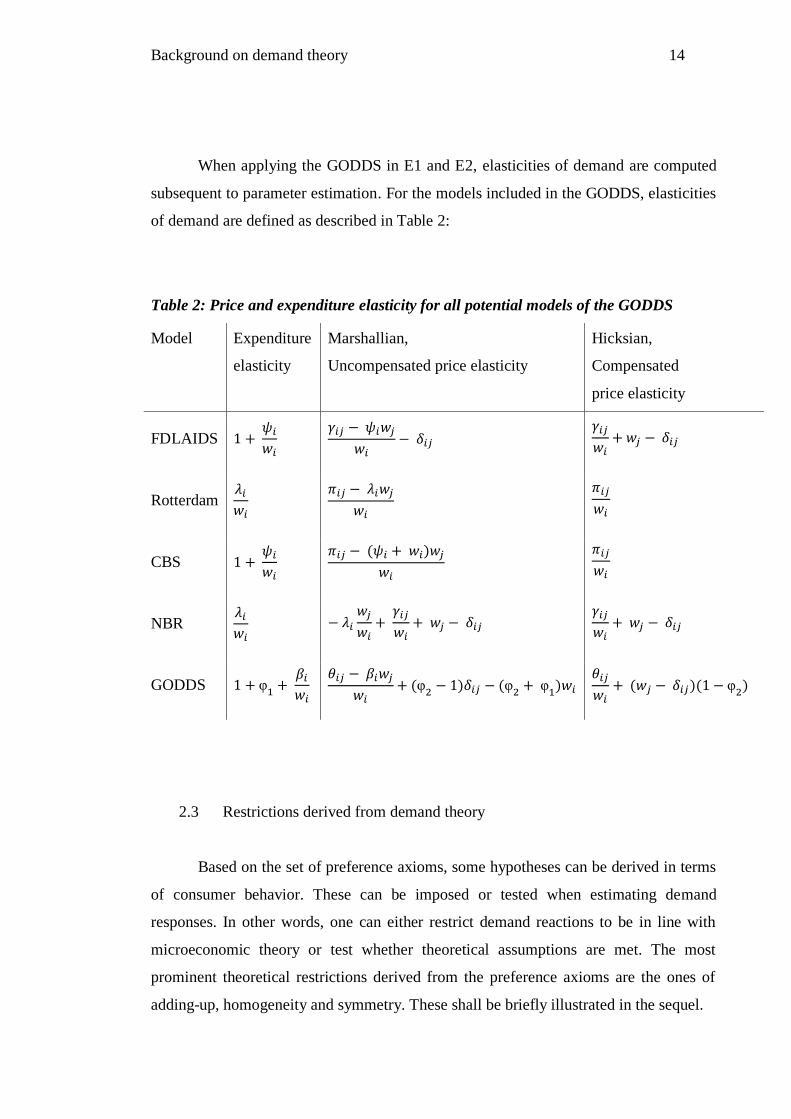
Background on demand theory 14
When applying the GODDS in E1 and E2, elasticities of demand are computed
subsequent to parameter estimation. For the models included in the GODDS, elasticities
of demand are defined as described in Table 2:
Table 2: Price and expenditure elasticity for all potential models of the GODDS
Model Expenditure
elasticity
Marshallian,
Uncompensated price elasticity
Hicksian,
Compensated
price elasticity
FDLAIDS
Rotterdam
CBS
NBR
GODDS
2.3 Restrictions derived from demand theory
Based on the set of preference axioms, some hypotheses can be derived in terms
of consumer behavior. These can be imposed or tested when estimating demand
responses. In other words, one can either restrict demand reactions to be in line with
microeconomic theory or test whether theoretical assumptions are met. The most
prominent theoretical restrictions derived from the preference axioms are the ones of
adding-up, homogeneity and symmetry. These shall be briefly illustrated in the sequel.
Background on demand theory 15
Adding-up follows from the non-saturated preferences of consumers. In essence,
adding-up ensures that the budget constraint is satisfied, so that all products’ budget
shares sum up to 1, and the equation holds. Related to this, consumers
are considered to have homogeneous demand functions if an increase in all prices and
expenditure by the same factor does not alter the demanded quantities of any good. This
homogeneity property can be written as
. (17)
Symmetry is an empirically important feature, requiring that demand reactions
for one good i related to a price change in good j are equivalent to demand reactions for
good j when prices for i are changed:
(18)
When estimating a system of demand for several goods, the above restrictions
can easily be integrated by restricting the respective parameters in the system directly.
Beyond, some other theoretical foundations are often implicitly assumed to be met
(Barten 1993), such as the negativity constraint, which requires the matrix of own- and
cross-price effects in Hicksian demands to be symmetric and negative semidefinite.
However, while the properties of symmetry, adding-up and homogeneity can usually be
implemented rather smoothly, including the negativity condition can turn out more
complicated.
2.4 Problems with household-level data: truncation, sample selection and
censoring
Microdata, such as information on sociodemographic characteristics of
individuals and households, have become increasingly important in recent times (Yen
and Lin 2006). This type of data is used in E3. Alongside with additional insights, there
can also be additional problems when microdata are used. Mainly, these problems may
occur in the form of truncation, sample selection or censoring. All of these refer to cases
Background on demand theory 16
in which values of dependent variables are limited in some sense. While censoring
eventually refers to a non-normal distribution of the dependent variable, the general
concern with truncation and sample selection is that missing values on the dependent
variable do not occur randomly. In this case, using only the information available from
a subpopulation may not allow for inferences regarding the total population of interest.
2.4.i Truncation and sample selection
With truncation, values of the independent variables are observed only if the
dependent variable is observed (Judge et al. 1988). Sample selection, in a sense related
to truncation and hence sometimes also termed incidental truncation, poses yet another
very important case of missing data. The fundamental concern with sample selection is
that those units for which the dependent variable is not observed may represent a
subpopulation which differs from those for whom the dependent variable is observed. In
contrast to truncation however, independent variables are observed even when the
dependent variable is unobserved.
2.4.ii Heckman models for cases of sample selection
Heckman (1978) pointed out the potential for selection within a sample, and
offered a correction which has been used extensively in applied studies of various fields.
In his approach, Heckman suggests a selection equation to be estimated prior to
estimation of the main equation. Applied to the context of demand analyses with
different retail formats, the selection equation in the Heckman model can deal with the
problem that not all retail formats are visited by all consumers.
In mathematical terms, the Heckman selection approach starts out by defining a
main equation:
, (19)
Background on demand theory 17
with as the continuous dependent variable, as the vector of explanatory variables,
as a vector of parameters and as the error term. Since may not be observed for
the full sample, another equation is introduced, which captures the selection process:
(20)
The dependent variable is defined to be binary, equaling zero if data on is
missing, and 1 otherwise. Explanatory factors are subsumed in the vector with
associated parameters , while refers to the error term.
Problems with regard to selection mainly arise if the error terms and in (19)
and (20) are not independent, which would imply that the missing data on equation (19)
was generated non-randomly (Heckman 1978). Allowing for the correlation between
and to be nonzero, and assuming that they both follow a bivariate normal distribution
with zero means, the expected value of in equation (19) can be written in the
following way (Greene 2011):
(21)
with as the correlation between and , as the standard deviation of ,
and
Hence, omitting , a term sometimes referred to as the inverse Mills ratio,
leads to biased estimates in equation (19) when and are correlated. As a remedy,
Heckman (1978) proposed a general procedure to allow for the correction of this
potential bias:
1.) Estimate the parameters of equation (20) for the full sample with a probit model
2.) From these estimates, obtain
and
. Calculate from these.
3.) Add as an additional regressor to equation (19), and estimate equation
(19) for .
Background on demand theory 18
4.) Calculate or bootstrap the correct standard errors for in equation (19)
Among others, Wooldridge (1995, 2002) extended this method to panel data models.
The panel data model by Wooldridge (1995, 2002) is used in E3, where a probit model
(20) for each time period is estimated to obtain . The basic rationale proposed by
Heckman (1978), however, remains unchanged in this approach.
2.4.iii Censoring
Opposed to the case of sample selection, censoring refers to situations in which
individuals with missing data on the dependent variable are not considered a distinct
subgroup of the sample. Instead, censoring typically occurs in a situation with a set of
interdependent equations, with missing values for only some of the dependent variables.
For demand analyses based on household panel data, this is a usual case. Typically, the
main equations of interest refer to a system of product groups, denoted in the following
general form:
, (22)
with as the dependent variable for product group i at time t, as explanatory
variables and as parameters associated with the explanatory factors.
Considering a range of products , some may not be bought at all periods of
time by all households. At this point, a distinction is typically made between the
observed variable , and the created variable , with the following relationship
between the two: = 0 if ≤ 0; =
if ≥ 0. Hence, the dependent variable y is
not normally distributed, but rather shows a left-hand side concentration of values at
zero. In other words, the sample data distribution is a mixture of continuous and discrete
distributions (Greene 2011). For the probability distribution is
, while for
> 0,
Background on demand theory 19
has the density of . As a consequence, it cannot be assumed that the values of
follow a regular continuous distribution. Instead, the observed values should be scaled
in some way, to account for the discrete part of the distribution. Several ways exist to do
so, such as the two-step method by Shonkwiler and Yen (1999), the generalized method
of moments approach by Perali and Chavas (2000), the Amemiya-Tobin approach used
by Dong et al. (2004b), quasi-maximum likelihood methods for panel data
(Meyerhoefer et al. 2005), or one-step quasi and simulated-likelihood (ML) methods
(Yen 2003, 2006).
2.4.iv Shonkwiler and Yen’s (1999) method for cases of censoring
The two-step method by Shonkwiler and Yen (1999), called SY in what follows,
shall be briefly described, as it is used in E3. The basic idea in the SY method is to
include the probabilities of a positive outcome, P[ > 0], in the process. To do so, a
binary variable, dit, is created at first, taking on the value of one if > 0, and zero
otherwise. Thus, in cases of missing data on , values of dit are also replaced by values
of zero. Accordingly, for any product i, there is a true underlying decision model
, with as the vector of explanatory variables, as the
corresponding parameter vector and as the error term, but replaces the
underlying latent choice in the estimation. As opposed to the Heckman procedure,
the first step in the SY model can be considered a decision equation rather than a self-
selection one, since individuals with are not separated when estimating the main
equations. In other words, the SY method addresses the problem of missing data on
individual product groups, while people in this case are not deemed to belong to a
particular subgroup of the sample just for not buying all available product groups.
In terms of the afore-mentioned scaling of , SY show that the expectational
values of in the main equations can be derived as
Background on demand theory 20
(23)
The SY procedure is fairly easily implemented. At first, a maximum likelihood
(ML) probit model is estimated for each good in the system. From these, and
can be calculated, which are then inserted in the system of equations referred
to by equation (23). Equations in (23) in turn can be estimated using Seemingly
Unrelated Regression (SUR) or ML.
In the context of demand systems, the main assumption in the SY model is that
the error terms in each good’s binary selection equation and the respective demand
equation are joint-normally distributed. In this case, the SY method yields consistent
and unbiased estimates (Sam and Zheng 2010). As any model hinges on a number of
requirements and assumptions, selecting a model includes choosing a set of assumptions
which is deemed to be least troublesome. In this context, Akbay et al. (2008) state that
there is no single perfect solution to incorporate a censoring mechanism into estimation
of demand systems for household data. For example, the method developed by Yen
(2005) is more efficient than the SY method. However, a multitude of probability
integrals need to be evaluated with simulated ML when censoring occurs in various
equations. In these cases the SY method avoids the computational burden of such
methods and represents a useful alternative (Yen and Lin 2006).
Essay 1 (E1) 21
3. Using a Generalized Ordinary Differenced Demand System to Estimate Price
and Expenditure Elasticities for Milk and Meat in Austria (E1)
3.1 Extended abstract
The aim of this article is to estimate current price and expenditure elasticities in
the Austrian food retail market. For this purpose, a nesting model is applied, in order to
choose between different demand models. The model is sometimes referred to as the
Generalized Ordinary Differenced Demand System (GODDS), with the main benefit
that it allows for a statistical comparison between nested models, to identify the most
suitable one for the data at hand. When applying the GODDS, potential endogeneity
problems are taken into account by performing a Hausman-Wu test. Depending on the
outcome of the Hausman-Wu test, estimations are either carried out using the method of
Iterative Seemingly Unrelated Regression (ITSUR) or Iterative Three-Stage Least
Squares (IT3SLS).
Beyond, the concept of multi-stage budgeting is incorporated, where the
sensitivity of estimations with regard to different budgeting assumptions is also
analyzed. Budget allocation in our case contains three stages, where the first one is
constituted by the choice between food and non-food products. For the second stage,
five broad groups of products are considered, namely milk, butter, fruits, meat and
vegetables. The third and last stage includes milk and meat products on a more
disaggregated level, e.g. pork, cheese etc.
The dataset used consists of monthly data on expenditures and quantities
purchased during the time period 1997 to 2009. It is derived from the Austrian
household panel RollAMA, whereas all purchase and expenditure data are aggregated
on a monthly basis. Purchase information is included for several milk products, butter,
fruits, vegetables, pork, poultry, and beef. Annual data from 1977 till 2010 on overall
household expenditures and purchased quantities of food and non-food in Austria,
which were obtained from the OECD, complement the data basis.
In terms of our estimation results, the strongest reactions to the disaggregated
meat price changes at the third stage were found for pork and beef, while both drinking
milk and cheese demand were also estimated to be highly elastic at the third stage. On
Essay 1 (E1) 22
the more aggregate second stage, demand for butter turns out to be most elastic, whereas
most other price elasticities end up with absolute values less or equal to one. Income
elasticities at the second stage range from 0.30 (oils and fats) to 0.49 (meat). Thus, a
ceteris paribus increase in real income of e.g. 20 percent, i.e. an increase in the order of
magnitude as experienced by the average Austrian over the last 15 years (according to
OECD statistics), would increase the consumption of meat in Austria by about 10
percent.
As compared to a study for Germany (Thiele 2008), differences in outcomes
occur for the three types of meat at the third stage, where price reactions for Austria are
throughout higher. In addition, while the propensity to substitute between different
types of meat is not detected for Germany, the opposite is the case for Austria. In view
of the significant positive cross-price elasticities for meat types at the disaggregate
level, it seems likely that substitution of pork, poultry and beef is responsible for the
slightly lower own-price elasticity of meat in Austria at the aggregate level. Looking at
the disaggregated stage with regard to milk products, our results are quite in line with
the ranges found in Bouamra-Mechemache (2008), who review 16 European studies on
drinking milk and cheese. However, price reactions for milk and cheese in Austria are at
the upper limit in absolute value.
In addition, our results indicate the importance of modeling a comprehensive
budgeting process rather than isolated levels of product aggregation when deriving both
price and expenditure elasticities of demand. With this regard, it is shown that
differences across studies may vanish once the budgeting structures are brought in line.
3.2 The candidate’s contribution to E1
The candidate is the main author of the paper.

Essay 1 (E1) 23
3.3 Publication
Widenhorn, A. and Salhofer, K. (2014a). Using a Generalized Ordinary
Differenced Demand System to Estimate Price and Expenditure Elasticities for Milk
and Meat in Austria. German Journal of Agricultural Economics 63: 109-124.
Essay 2 (E2) 24
4. Price Sensitivity Within and Across Retail Formats (E2)
4.1 Extended abstract
In this study, demand reactions of consumers are estimated and statistically
compared for two different food retail formats, discount stores on the one hand, and
conventional supermarkets on the other. In particular, elasticities of demand are
analyzed for two scenarios. First, demand reactions are estimated for a scenario in
which consumers only frequent either discounters or supermarkets, followed by an
investigation of potential cross-format effects when consumers visit both types of
stores.
As far as the underlying model is concerned, the Generalized Ordinary
Differenced Demand System (GODDS) nesting model is applied, which allows for
comparing several models’ adequacy. In order to apply the correct estimation technique,
Hausman-Wu tests are run to check for potential problems of endogeneity, leading to
the use of either Seemingly Unrelated Regression (SUR) or Three-Stage Least Squares
(3SLS). Following the estimation of parameters and the calculation of elasticities of
demand, Welch tests, as well as Kolmogorov-Smirnov- and Wald tests are applied to
check for statistical differences between elasticities of demand for both formats.
Monthly data on quantities and expenses for milk products in Austria, covering
the time period between 1997 and 2009, serve as the basis for estimations. The dataset
is part of the Austrian household panel RollAMA, containing information on
consumption in 12 different retail chains in Austria. These retail chains are separated
according to the RollAMA classification included in the dataset, into 4 discounters and
8 supermarkets. Milk products contain three categories, namely drinking milk, cheese
and residual milk products.
Estimation results indicate that price elasticities in discount stores are higher for
drinking milk and cheese, while for residual milk products the results vary depending
on either isolated estimations for each format or conjoined estimation for both formats.
Statistical tests for format-specific demand reactions largely support the hypothesis that
consumers in discount stores and those in supermarkets respond differently to price
changes. By tendency, discount store consumers seem to be more responsive to inner-
Essay 2 (E2) 25
format milk price changes. Beyond this, demand reactions in supermarkets with respect
to price changes in discounters also differ from the reverse case, i.e., from demand
reactions in discounters when supermarket prices are changed. This is particularly true
for the case of drinking milk, which confirms the strategic potential of drinking milk as
a loss leader product.
4.2 The candidate’s contribution to E2
The candidate is the main author of the paper.
4.3 Publication
Widenhorn, A. and Salhofer, K. (2014b). Price Sensitivity Within and Across
Retail Formats. Agribusiness 30: 184–194.
Conclusions and discussion 26
5. Differentiation in Demand with Different Food Retail Formats (E3)
5.1 Extended abstract
In essence, this study investigates and compares various aspects of consumer
behavior relating to discounters on the one side and supermarkets on the other. More
precisely, the distinctiveness of discount consumers is analyzed both on an aggregate
format- and on a disaggregate product level. On the format level, households’
propensities to visit a discount store and overall portions of spending in discounters are
analyzed. With regard to the product level, price and expenditure elasticities of demand
for nine product groups in discounters and supermarkets are estimated and statistically
compared.
As far as the format-level is concerned, a dynamic probit model by Wooldridge
(2002) accounting for unobserved time-invariant heterogeneity of consumers and the
initial bias is applied to identify determinants of consumers’ choice of visiting a
discounter or not. Hereafter, the factors influencing a household’s budget portion spent
in discounters are estimated applying a Heckman-type selection model, which takes into
account that not all households have opted for visiting a discounter in all time periods.
For the product level, the method developed by Shonkwiler and Yen (1999) is applied,
which pays regard to the fact that not all households have consistently bought all the
goods available in either format.
In terms of data, a RollAMA household-level panel dataset containing
information on about 6500 households in Austria is used, including purchases for the
time period between 2003 and 2007. Monthly quantities and overall expenditure on nine
broad product groups (white milk, mixed milk, oils and fats, cheese, meat, sausages,
fruits, vegetables, other products) are provided in this dataset, complemented by a
number of household characteristics. With regard to different food retail formats, there
are 40 food retail chains in the dataset, where 6 of these are defined as discount stores
according to RollAMA classifications.
Results in terms of format choice indicate that income constraints represent a
driving force behind households’ decisions of visiting a discounter or not. Furthermore,
differences in overall price levels in discounters and supermarkets also seem to play a
Conclusions and discussion 27
major role when consumers choose between the formats. As the price gap between
supermarkets and discounters widens, such that discounter products as a whole turn
relatively cheaper, more people opt for discounters. In addition, people also spend a
bigger portion of their budget on discount store products in the latter case. In terms of
price elasticities of demand on the product level, results indicate that significant
differences between price reactions in discounters and supermarkets exist. These
differences are found for both inner- and cross-format price reactions. Interestingly, the
results indicate that demand in supermarkets adjusts more strongly to inner-format price
changes. However, this does not hold true for cross-format responses to price changes,
where discount store demand turns out significantly more sensitive. In other words,
while demand in supermarkets changes quite considerably when prices in supermarkets
are changed, supermarket consumers are comparably less responsive to price changes in
discounters.
5.2 The candidate’s contribution to E3
The candidate is the main author of the paper.
5.3 Publication
Widenhorn, A. and Salhofer, K. (2014c). Differentiation in Demand with
Different Food Retail Formats. Selected Paper for the 2014 EAAE Congress in
Ljubljana, Slovenia, 26-29 August
Conclusions and discussion 28
6. Conclusions and discussion
Consumer reactions to price changes in food retailing were estimated in three
different contexts. In the first essay (E1), which is based on a dataset with no separation
by retail formats, general demand reactions for five broad product groups (milk, butter,
fruits, meat and vegetables) were estimated, followed by an estimation of elasticities for
sub-groups of milk (drinking milk, cheese and other milk products) and meat (beef,
pork and poultry). As the results in this essay indicate, reactions to price and
expenditure changes in Austria are fairly in conformity with the findings for
neighboring markets, while price changes in some more disaggregated meat and milk
types trigger a comparably strong reaction in Austrian consumers’ demand. Further, I
obtained that the premise of assumed budgeting stages can have a considerable impact
on the results.
While estimates from this first part seem primarily useful for local policymakers,
a topic of particular interest for retailers was raised in essay 2. More precisely, the
question of differences in demand reactions across retail formats was addressed. Here, a
more disaggregate viewpoint was adopted, separating food retailing by different formats
and comparing reactions with regard to types of milk products in discounters on the one
hand and more traditional retail types on the other. Many of the price elasticities were
found to differ significantly across formats, implying that elasticities of demand in one
single retail format do not necessarily apply to other formats. Hence, food retailers
cannot expect aggregate demand estimates to be applicable for their particular type of
store format. The results also suggest that discount store consumers tend to be more
responsive to price changes of milk products. Beyond, there seems to be potential for
drinking milk as a loss-leader product, since cross-format price elasticities for drinking
milk are found to be significantly positive.
In the third essay, differences between consumers of discounters and
supermarkets were further investigated. The essay is based on a household dataset
including sociodemographic factors. Here, format and product choice determinants were
considered. Furthermore, factors influencing the overall portion of budget spent on
discounter products were analyzed, in addition to the estimation of elasticities of
demand for nine product groups (white milk, mixed milk, oils and fats, cheese, meat,
Conclusions and discussion 29
sausages, fruits, vegetables, other products). For empirical implementation, methods
paying regard to the problems of censoring and sample selection were applied. In
conformity with the previous indications in E2, E3 also concludes that demand reactions
do differ significantly across formats. However, while results in E2 pointed at discount
store consumers being rather more sensitive to inner-format price changes, the results in
E3 indicate that supermarket consumers are more sensitive to inner-format price
changes than discount store consumers. Hence, one may infer that the underlying data
and method have the potential to alter the estimation results noticeably.
Differences in price responses for demand reactions across discounters and
supermarkets, i.e. demand responses to price changes in another retail format, were also
found in E3. These reactions are particularly interesting in terms of the strategic
potential for enticement of customers from other formats. To this end, considering the
results in E3 and E2, it seems that demand in discount stores responds more strongly to
changes in supermarket prices than vice versa. Beyond, as far as format preferences are
concerned, it appears that certain household factors such as low income and low
education increase the probability that discount stores are chosen. However, further
research is necessary to monitor the general validity of these results.
Looking at the overall findings of format-specific demand reactions, it has been
shown that aggregate datasets are likely to represent averages of potentially diverse sets
of consumers. As with studies of the type presented in E1, which are possibly most
interesting for policymakers, an undistinguished viewpoint might suffice. However,
considering the magnitude of product and format innovations in food retail markets
worldwide, general validity of aggregate demand reactions for all interest groups seems
questionable. Hence, the analyses presented in E2 and E3 should give food for thoughts
for the numerous studies which observe different retail types or different store
assortments in general.
Still, further investigations are necessary to identify the reasons behind the
dissimilar demand reactions across formats. With this regard, data on consumer
knowledge and expectations on quality would be desirable. It would also be interesting
to know how consumers evaluate different format-product combinations, e.g. which
level of quality consumers expect from organic product types in discounters, and how

Conclusions and discussion 30
this affects their reactions to price changes. Altogether, it seems likely that
developments on the food retail market will continue to raise questions on the
homogeneity of demand responses, entailing a vast potential for future research.
References 31
7. References
Ahlert, D., Blut, M. and Evanschitzky, H. (2005). Current Status and Future Evolution of
Retail Formats. In: Krafft, K., Mantrala, M.: Retailing in the 21st century, Springer,
Berlin et al., 289-308.
Akbay, C. (2000). An Empirical Analysis of Consumption Patterns for Socioeconomic
Groups: An Application of Almost Ideal Demand System. Unpublished Ph.D.
Dissertation, Ohio State University.
Akbay, C. and Jones, E. (2005). Food Consumption Behavior of Socioeconomic Groups for
Private Labels and National Brands. Food Quality and Preference 16: 621–631.
Akbay, C., Boz, I. and Chern, W. S. (2008). Household Food Consumption in Turkey:
A Reply. European Review of Agricultural Economics 35: 99-102.
Anderson,G. and Blundell, R. (1983). Testing Restrictions in a Flexible Dynamic Demand
System: An Application to Consumers Expenditure in Canada. Review of Economic
Studies 50: 397-410.
Andreyeva T., Long, M.W. and Brownell, K.D. (2010). The Impact of Food Prices on
Consumption: A Systematic Review of Research on Price Elasticity of Demand for
Food. American Journal of Public Health 100: 216-22.
Autor, D. (2010). Axioms of Consumer Preference and the Theory of Choice. Lectures on
Microeconomic Theory and Public Policy, MIT Department of Economics.
Banks, J., Blundell, R. and Lewbel, A. (1997). Quadratic Engel Curves and Consumer
Demand. Review of Economics and Statistics 79: 527-539.
Barnett, W. A. and Seck, O. (2008). Rotterdam Model versus Almost Ideal Demand System:
Will the Best Specification please stand up? Journal of Applied Econometrics 23:
795–824.
References 32
Barnett, W.A. and Kalonda-Kanyama, I. (2012). Time-Varying Parameters in the Almost
Ideal Demand System and the Rotterdam Model: Will the Best Specification please
stand up? Applied Economics 45: 4169-4183.
Barten, A.P. (1993). Consumer Allocation Models: Choice of Functional Form. Empirical
Economics 18: 129-158.
Berman, B. and Evans, J.R. (2006). Retail Management: A Strategic Approach
10th
edition. Prentice Hall, Upper Saddle River, New Jersey.
Bezawada, R. and Pauwels, K. (2013). What is Special About Marketing Organic Products?
How Organic Assortment, Price, and Promotions Drive Retailer Performance. Journal
of Marketing 77: 31-51.
Bontemps C., Orozco V. and Requillart V. (2008). Private Labels, National Brands and Food
Prices. Review of Industrial Organization 33: 1‐22.
Bouamra-Mechemache, Z., Réquilart, V., Soregaroli, C. and Trévisiol, A. (2008). Demand
For Dairy Products in the EU. Food Policy 33: 644-656.
Bustillo, M. and Timothy W. M. (2010). Walmart Thinks Smaller. The Wall Street Journal,
April 22. Available online: http://online.wsj.com
Carpentier, A. and Guyomard, H. (2001). Elasticities in Two-Stage Systems: An Approximate
Solution. American Journal of Agricultural Economics 83: 222–229.
Choi, H.J. and Wohlgenant, M.K. (2012). Demand Analysis of Fluid Milk with Different
Attributes. Selected Paper prepared for presentation at the Agricultural & Applied
Economics Association’s 2012 AAEA Annual Meeting, Seattle, Washington, August
12-14, 2012.
Christensen, L.R., Jorgensen, D.W. and Lau, L.J. (1975). Transcendental Logarithmic Utility
Function. American Economic Review 65: 367-383.
Clements, K.W. and Salvanathan, E.A. (1988). The Rotterdam Demand Model and its
Application in Marketing. Marketing Science 7: 60-75.
References 33
Deaton, A. and Muellbauer, J. (1980). An Almost Ideal Demand System. American Economic
Review 70: 312-326.
Dhar, T. and Foltz, J.D. (2005). Milk by Any Other Name… Consumer Benefits from
Labeled Milk. American Journal of Agricultural Economics 87: 214-218.
Dong, D., Gould, B.W. and Kaiser, H.M. (2004). Food Demand in Mexico: An Application of
the Amemiya-Tobin Approach to the Estimation of a Censored Food System.
American Journal of Agricultural Economics 86: 1094–1107.
Eales, J., Durham, C. and Wessells, C.R. (1997). Generalized Models of Japanese Demand for
Fish. American Journal of Agricultural Economics 79:1153–1163.
Edgerton, D.L. (1997): Weak Separability and the Estimation of Elasticities in Multistage
Demand Systems. American Journal of Agricultural Economics 79: 62-79.
Gao, X.M. and Shonkwiler, J.S. (1993). Characterizing Taste Change in a Model of US Meat
Demand: Correcting for Spurious Regression and Measurement Errors. Review of
Agricultural Economics 15: 313–324.
Glaser, L. K. and Thompson, G. (2000). The Demand for Organic and Conventional Milk.
Presented at the Western Agricultural Economics Association meeting, Vancouver,
British Columbia, June 29 – July 1, 2000.
Greene, W. H. (2011). Econometric Analyses 7th
edition, Prentice Hall.
Grunert, K., Fruensgaard, J., Risom, L., Jespersen, K. and Sonne, A. (2005). Market
Orientation of Value Chains; A Conceptual Framework Based on Four Case Studies
from the Food Industry. European Journal of Marketing 39: 429-455.
Heckman, J.J. (1978). Sample Selection Bias as a Specification Error. Econometrica 47: 153-
161.
Hyman M.R., Kopf, D.A. and Lee, D. (2010). Review of Literature – Future Research
Suggestions: Private Label Brands: Benefits, Success Factors and Future Research.
Journal of Brand Management 17: 368‐389.
References 34
Jonas, A. and Roosen, J. (2008). Demand for Milk Labels in Germany: Organic Milk,
Conventional Brands and Retail Labels. Agribusiness 24: 192–206.
Judge, G.G., Hill, R.C., William, E.G., Lutkepohl, H. and Lee, T.-C. (1988). Introduction to
the Theory and Practice of Econometrics. John Wiley and Sons, New York.
Kirman, A.P. (1992). Whom or What Does the Representative Individual Represent? The
Journal of Economic Perspectives 6: 117-136.
Lin, B.-H., Yen, S.T., Huang, C.L. and Smith, T.A. (2009). U.S. Demand for Organic and
Conventional Fresh Fruits: The Roles of Income and Price. Sustainability 1: 464-478.
Malik, V.S., Schulze, M.B. and Hu, F.B. (2006). Intake of Sugar-sweetened Beverages and
Weight Gain: A Systematic Review. American Journal of Clinical Nutrition 84: 274–
288.
Mas-Colell, A., Whinston, M.D. and Green, J. (1995). Microeconomic Theory. Oxford
University Press, New York.
Matsuda, T. (2005). Differential Demand Systems: A Further Look at Barten's Synthesis.
Southern Economic Journal 71: 607-619.
Meyer, S., Yu, X. and Abler, D. (2011). Comparison of Several Demand Systems. Selected
Paper prepared for presentation at the Agricultural & Applied Economics
Association’s 2011 AAEA & NAREA Joint Annual Meeting, Pittsburgh,
Pennsylvania, July 24-26, 2011.
Meyerhoefer, C.D., Ranney, C.K. and Sahn, D.E. (2005). Consistent Estimation of Censored
Demand Systems Using Panel Data. American Journal of Agricultural Economics 87:
660–672.
Monier, S., Hassan, D., Nichèle, V. and Simioni, M. (2009). Organic Food Consumption
Patterns. Journal of Agricultural & Food Industrial Organization 7: 1–23.
Muhammad, A., Seale Jr., J.L., Meade, B. and Regmi, A. (2011). International Evidence on
Food Consumption Patterns: An Update Using 2005 International Comparison
References 35
Program Data. TB-1929. U.S. Department of Agriculture, Economic Research
Service.
Nielsen Press Release: Emerging Markets: Retail and ShopperTrends (2007).
http://at.nielsen.com/trends/documents/RetailandShopperTrendsEmergingMarkets_00
0.pdf.
Nielsen Grocery Universe (2012). The Nielsen Company Belgium,
http://be.nl.nielsen.com/trends/documents/GroceryUniverse2012.pdf
Okrent, A.M. and Alston, J.M. (2011a). Demand for Food in the United States. Technical
report, RMI-CWE Working Paper number 1002.
Okrent, A.M. and Alston, J.M. (2011b). The Demand for Disaggregated Food-Away-from-
Home Products. Selected paper for presentation at the Agricultural & Applied
Economics Association 2011, AAEA & NAREA Joint Annual Meeting, Pittsburgh,
Pennsylvania, July 24–26, 2011.
Perali, F. and Chavas, J.-P. (2000). Estimation of Censored Demand Equations from Large
Cross-Section Data. American Journal of Agricultural Economics 82: 1022–1037.
Powell, L.M., Chriqui, J.F., Khan, T., Wada, R. and Chaloupka, F.J. (2013). Assessing the
Potential Effectiveness of Food and Beverage Taxes and Subsidies for Improving
Public Health: A Systematic Review of Prices, Demand and Body Weight Outcomes.
Obesity Reviews 14: 110-128.
Ritson, C. and Brennan, M. (2008). What Does Consumer Science Tell Us About Organic
Foods? In: Givens, D., Baxter, S., Minihane, A. and Shaw, E.: Health Benefits of
Organic Food: Effects of the Environment: 190–206. CABI, Wallingford, UK.
Ryan, D.L. and Wales, T.J. (1998). A Simple Method for Imposing Local Curvature in some
Flexible Consumer-Demand Systems. Journal of Business and Economic Statistics 16:
331-338.
Sam, A.G. and Zheng, Y. (2010). Semiparametric Estimation of Consumer Demand Systems
with Micro Data. American Journal of Agricultural Economics 92: 246–257.
References 36
Shonkwiler, J.S. and Yen, S.T. (1999). Two-step Estimation of a Censored System of
Equations. American Journal of Agricultural Economics 81: 972–982.
Stone, R. (1954). Linear Expenditure Systems and Demand Analysis: An Application to the
Pattern of British Demand. The Economic Journal 64: 511-527.
Theil, H. (1965). The Information Approach to Demand Analysis. Econometrica 33: 67-87.
Thiele, S. (2008). Elastizitäten der Nachfrage privater Haushalte nach Nahrungsmitteln
–Schätzung eines AIDS auf Basis der Einkommens- und Verbrauchsstichprobe 2003.
Agrarwirtschaft 57: 258-268.
Vartanian, L.R., Schwartz, M.B. and Brownell, K.D. (2007). Effects of Soft Drink
Consumption on Nutrition and Health: A Systematic Review and Meta-Analysis.
American Journal of Public Health 97: 667–675.
Washington Post online (2012).
http://www.washingtonpost.com/blogs/worldviews/wp/2012/11/11/what-the-world-
can-learn-from-denmarks-failed-fat-tax/
Wooldridge, J.M. (1995). Selection Correction for Panel Data Models under Conditional
Mean Independence Assumptions. Journal of Econometrics 68: 115-132.
Wooldridge, J.M. (2002). Econometric Analysis of Cross Section and Panel Data. MIT Press.
Xie, J., Kinnucan, H.W. and Myrland, Ø. (2009). Demand Elasticities for Farmed Salmon in
World Trade. European Review of Agricultural Economics 36: 425–445.
Yen, S. T., Lin, B.-H. and Smallwood, D. (2003). Quasi- and Simulated-likelihood
Approaches to Censored Demand Systems: Food Consumption by Food Stamp
Recipients in the United States. American Journal of Agricultural Economics 85: 458–
478.
Yen, S. T. and Lin, B.-H. (2006). A Sample Selection Approach to Censored Demand
Systems. American Journal of Agricultural Economics 88: 742–749.

References 37
Yu, X. and Abler, D. (2009). The Demand for Food Quality in Rural China. American Journal
of Agricultural Economics 91: 57–69.