Embed Size (px)
Citation preview

Accelerated Stress Testing and Reliability Conference
Design and Analysis of Accelerated Life Tests
Rong Pan
Arizona State University
ASTR 2016, Sep 28 - 30, Pensacola, FL January-4-17 1

Accelerated Stress Testing and Reliability Conference
Agenda
• Characteristics of lifetime data – Lifetime distributions
– Analysis of censored lifetime data
• Experimental designs – Factorial designs
– Critical issues in planning ALTs
• ALT data analysis – Weibull regression
– Data analysis using Software
– Optimal ALT planning
ASTR 2016, Pan 2

Accelerated Stress Testing and Reliability Conference
Session Topic
Introduction
Part I Characteristics of lifetime data
• Lifetime distributions
• Analysis of censored lifetime data
ASTR 2016, Pan 3

Accelerated Stress Testing and Reliability Conference
Features of Lifetime Distribution
Failure data from electrical appliance test (Lawless, p.7. Attr. Nelson (1970))
Variable: cycles to failure
• Nonnegative
• Right (positively) skewed
• Some long life observations
Normal distribution is not a good idea!
ASTR 2016, Pan 4

Accelerated Stress Testing and Reliability Conference
Exponential Distribution
• The simplest lifetime distribution – One parameter
or
• Constant failure rate (constant mean-time-to-failure, MTTF)
• Memoryless property – Regardless of past experience, the chance of failure
in future is the same.
• Closure property – System’s failure time is still exponential, if its
components’ failure times are exponential and they are in a series configuration.
)exp()|( ttf )exp(1
)|(
t
tf
ASTR 2016, Pan 5

Accelerated Stress Testing and Reliability Conference
Understanding Hazard Function
• Define a hazard function
• Instantaneous failure
• Is a function of time
– For the exponential distribution,
t
tTttTtth t
)|Pr(lim)( 0
)(th
)(
)()(
tR
tfth
ASTR 2016, Pan 6

Accelerated Stress Testing and Reliability Conference
Bathtub Curve
• Empirical hazard function
• Three stages
– Infant mortality
– Mature
– Wear-out
• Any distribution good at representing any or all of these stages?
Time
Failure rate
ASTR 2016, Pan 7

Accelerated Stress Testing and Reliability Conference
Weibull Distribution
1
)(
tth
tttf exp)(
1
ttR exp)(
ASTR 2016, Pan 8
• When hazard function is a power function of time
• Two parameter
– Characteristic life, scale parameter
– Shape parameter
• Relationship with exponential distribution
– When the shape parameter is 1

Accelerated Stress Testing and Reliability Conference
RAMS 2016, Ridgon & Pan 9

Accelerated Stress Testing and Reliability Conference
Lognormal Distribution
• From normal to lognormal and vice versa
– If T has a lognormal distribution, then log(T) has a normal distribution
– If X has a normal distribution, then exp(X) has a lognormal distribution
• Median failure time
– Log(t50) is a robust estimate of the location parameter of lognormal distribution
ASTR 2016, Pan 10

Accelerated Stress Testing and Reliability Conference
Reliability Data
• Failure time censoring
– Right censoring
– Left censoring
– Interval censoring
• Data from reliability tests
– Type-I censoring (time censoring)
– Type-II censoring (failure censoring)
– Read-outs (multiple censoring)
ASTR 2016, Pan 11

Accelerated Stress Testing and Reliability Conference
Example
Low-cycle fatigue test of nickel super alloy (Meeker & Escobar (1998), p. 638, attr. Nelson (1990), p. 272)
kCycles Cens
211.626 1
200.027 1
57.923 0
155 1
13.949 1
112.968 0
152.68 1
156.725 1
138.114 0
56.723 1
121.075 1
122.372 0
112.002 1
43.331 1
12.076 1
13.181 1
18.067 1
21.3 1
15.616 1
13.03 1
8.489 1
12.434 1
9.75 1
11.865 1
6.705 1
5.733 1 ASTR 2016, Pan 12
Accelerated Stress Testing and Reliability Conference
Parametric Distribution Models
• Likelihood function – Exact failure time
• Failure density function
– Right censoring time • Reliability function
– Left censoring time • Failure function
– Interval censoring time • Difference of failure functions
• Maximizing likelihood function – Exponential distribution
)(tf
)(tR
)(tF
)()( 1 ii tFtF
r
TTTMTTF
RAMS 2016, Ridgon & Pan 13
Accelerated Stress Testing and Reliability Conference
Parametric Distribution Models
• Choose a distribution model
– Fit multiple distribution models
– Criteria (smaller the better) • Negative log-likelihood values
• AIC (Akaike’s information criterion)
• BIC (Bayesian information criterion)
ASTR 2016, Pan 14

Accelerated Stress Testing and Reliability Conference
Model Selection using JMP
ASTR 2016, Pan 15

Accelerated Stress Testing and Reliability Conference
Summary
• Three important Lifetime distributions
– Exponential
– Weibull
– Lognormal
• Failure time censoring
– Unavoidable in life tests
– Affects likelihood function
ASTR 2016, Pan 16

Accelerated Stress Testing and Reliability Conference
Session Topic
Part II Experimental designs
• Factorial designs
• Critical issues in planning ALTs
ASTR 2016, Pan 17
Accelerated Stress Testing and Reliability Conference
Design of Experiments
• Design of experiments have been used for reliability problems
– More than one accelerating factor
– An accelerating factor as well as process variables
– Robust design (noise factors)
ASTR 2016, Pan 18

Accelerated Stress Testing and Reliability Conference
Design of Experiments
All experiments are designed
– some are not very good
A well-designed experiment:
• Efficient use of resources
• Identify/estimate
• important main effects (x1, x2, …)
• Interactions among factors (x1x2, x1x3, …)
• Higher-order terms (i.e., x2 )
ASTR 2016, Pan 19

Accelerated Stress Testing and Reliability Conference
Design of Experiments
• Experiment developed to study the effect of two factors on the time to failure of glass capacitors (adapted from Zelen (1959))
• Two factors of interest:
– Temperature (degrees C)
• Range of 170 to 180
– Applied Voltage (volts) • Range of 200 to 350
ASTR 2016, Pan 20

Accelerated Stress Testing and Reliability Conference
Design of Experiments
What we could do:
• Select several levels of both factors :
– Voltage: 200, 225, 250, 275, 300, 325, 350
• (Range of 200 to 350 volts)
– Temperature: 170, 175, 180 • (Range of 170 to 180 degrees C)
ASTR 2016, Pan 21

Accelerated Stress Testing and Reliability Conference
Design of Experiments
ASTR 2016, Pan
Voltage: 200
Temperature: 170 175 180
Suppose 180ᵒ provided the best response.
Temperature: 180
Voltage 200 225 250 275 300 325 350
Suppose we find:
• Temperature:
180
• Voltage: 225
What could be wrong with this? Experimenting one factor at a time is generally a bad idea. - Too many runs - Missing interaction
effects - May not find the
true optimal 22

Accelerated Stress Testing and Reliability Conference
If the true responses were …
Voltage
TEMP
170 175 180
200 850 865 1250
225 706 782 943
250 645 803 835
275 843 940 997
300 1450 1350 1102
ASTR 2016, Pan 23

Accelerated Stress Testing and Reliability Conference
A Better Way…
ASTR 2016, Pan
This time, instead of five or six levels, let’s designate a “low” value and a “high” value (based on the ranges we are interested in investigating).
Temp voltage
Actual Coded Actual Coded
Low 170 -1 200 -1
High 180 1 350 1
24

Accelerated Stress Testing and Reliability Conference
A Better Way…
ASTR 2016, Pan
• Temp = Temperature, V = Voltage, y = life of the glass capacitor.
• Objective: Determine if temperature is significant; if voltage is significant; if there is a significant interaction.
• Goal: maximize the response, life of the capacitor.
Factors Replicate
Temp V I II Total
-1 -1 520 900 1420
-1 1 267 347 614
1 -1 1065 1087 1152
1 1 250 435 685
This is a
22
factorial
design
with two
replicates.
25

Accelerated Stress Testing and Reliability Conference
Design of Experiments
ASTR 2016, Pan
Main Effects
Plot for
Temperature
and Voltage
(response is
Average Life)
26

Accelerated Stress Testing and Reliability Conference
Design of Experiments
ASTR 2016, Pan
Interaction
Plot for
Temperature
and Voltage
(response is
Average Life)
27

Accelerated Stress Testing and Reliability Conference
Design of Experiments
ASTR 2016, Pan
Contour
Plot for
Average
Life
28

Accelerated Stress Testing and Reliability Conference
23 Factorial Design
ASTR 2016, Pan
• Response: Lifetime of rolling ball bearings
• Three factors, each at two levels
– Inner Ring Heat Treatment
– Outer Ring Osculation
– Cage Design
29

Accelerated Stress Testing and Reliability Conference
General 2k Factorial Design
ASTR 2016, Pan
• As the number of factors (k) increases, the size of the design gets quite large. • 26 = 64 runs • 210 = 1024 runs • 215 = 32768 runs
• Situations with 10 or more factors are not that
uncommon. • But rarely are all the factors significant. • We need smaller alternatives to the full factorial design.
• Implement fractions of the full factorials (fractional factorials).
30

Accelerated Stress Testing and Reliability Conference
What about Design?
ASTR 2016, Pan
• Factorial, fractional factorial, Plackett-Burman designs, combined array designs etc. can be very useful for any of the problems we encounter in reliability testing.
• Constrained or unusual design region? – Use optimal designs based on some criteria (D-
optimality, or optimality at some use condition). – Current studies have shown that optimal designs can
be small, efficient, and cover the design region of interest.
31

Accelerated Stress Testing and Reliability Conference
Optimal Designs?
ASTR 2016, Pan
• Design optimality – Original work by Kiefer (1950s, 1960s) – Variance oriented criteria – Last 30 years - development of computer algorithms
for design construction
• Often called “Alphabetic Optimality” ‒ D-optimal, A-optimal, G-optimal ‒ Determine points in the experimental design that
will minimize variances/covariances associated with regression coefficients for a model of interest.
‒ Measured by “efficiencies”; D-efficiency, A-efficiency…
32

Accelerated Stress Testing and Reliability Conference
Accelerated Life Test
ASTR 2016, Pan
• Unacceptable cost of life testing • Too long testing time • Too few or no failure at normal operating conditions
• Units are tested at severer-than-normal stress conditions, the failure mechanisms are accelerated and more failures occur • For studying failures and failure mechanisms • For predicting product reliability
33

Accelerated Stress Testing and Reliability Conference
Challenges
ASTR 2016, Pan
• Failure time data are often censored
• Right censoring
• Interval censoring
• Failure time distribution is typically not normal distribution
• Exponential/Weibull
• Lognormal
• Extrapolating results
• Use condition is outside of the region of test conditions
• Model-based extrapolation is needed
34

Accelerated Stress Testing and Reliability Conference
Suggestions for ALT Planning
ASTR 2016, Pan
• Understand the purpose of an ALT experiment
• Anticipate the impact of data censoring
• Assess the robustness of a test plan to assumptions
• Be aware of the danger of model extrapolation
• Plan for the uncertainty of use condition
• Incorporate practical engineering/management constraints into the plan
35
Accelerated Stress Testing and Reliability Conference
What about Statistical Analysis?
ASTR 2016, Pan
• In DOE, Typically assume the responses are normally distributed
• Carry out standard t-tests and analysis of variance to identify important factors and interactions – then build a model.
• Interest is on the mean response
• In life testing: – Response is often skewed, can consist of censored
data
– Interest is on percentiles
– Standard analysis techniques often do not apply.
36

Accelerated Stress Testing and Reliability Conference
What about Statistical Analysis?
ASTR 2016, Pan
• One approach to deal with skewed or nonnormal responses: – Transform the data, make it normal (quasi-normal)
• Transformations don’t work on censored data!
• Nonnormal responses? – Weibull regression
– Use generalized linear models to fit the response. • Can handle censored data
• Can handle count or binomial data
37

Accelerated Stress Testing and Reliability Conference
Session Topic
Part III ALT data analysis
• Weibull regression
• Data analysis using Software
• Optimal ALT planning
Questions
ASTR 2016, Pan 38

Accelerated Stress Testing and Reliability Conference
Log-Location-Scale Distribution
• Both Weibull distribution and lognormal distribution belong to the log-location-scale distribution families – Log (Weibull variable) ~ Smallest Extreme Value (SEV)
distribution
– Log (lognormal variable) ~ Normal distribution
• The location parameter is modeled by a linear model – Log(characteristic life)
– Log(median life)
• To estimate regression coefficients, the maximum likelihood method is used
kk xx ...log 110
ASTR 2016, Pan 39

Accelerated Stress Testing and Reliability Conference
Weibull Regression
• SEV distribution
• The linear model
• Other type of parameterization,
• Maximum likelihood method – Complete data
– Censored data
( ) 1 exp exp( ) ,Z
F z z z
loglog
TZ
/1
kxxk
*
1
** ...log10
0 1 1log
k kx x
),( Weibull
jj *
where
and
and
ASTR 2016, Pan 40
( ) 1 exp exp( ) ,Z
F z z z

Accelerated Stress Testing and Reliability Conference
Physical Acceleration Model
• Arrhenius model
– Thermal stress
• Inverse power model
– Voltage, current, pressure, humidity, etc.
• Erying model
– Thermal stress with another stress factor
• Coffin-Mason model
– Thermal cycling
• Log-linear relationship
– Natural stress variables,
/50
aE KTt Ae
VAt
150
/50
aE KTt Ae V
)(max
50 TeAftKT
Ea
KTs
11 Vs log2
2211050log sst
ASTR 2016, Pan 41

Accelerated Stress Testing and Reliability Conference
Statistical Acceleration Model
• Increase environmental stresses to fail the product earlier – Stress factors: temperature, voltage, current, pressure,
humidity, radiation, loading cycle, etc.
• To quantify effects of these factors, a regression model is needed – Log-location-scale regression model is common
– Proportional hazard model is another alternative
• With the regression model, the failure distribution under the use stress condition can be inferred
• Check model assumptions
ASTR 2016, Pan 42

Accelerated Stress Testing and Reliability Conference
Example: Rolling Ball Bearings
ASTR 2016, Pan

Accelerated Stress Testing and Reliability Conference
Example: Rolling Ball Bearings
• Cage design seems to have no effect on the lifetime.
• The 2x2 design with replicates is shown at right.
• There seems to be an interaction between Inner Ring Heat Treatment and Outer Ring Osculation
ASTR 2016, Pan

Accelerated Stress Testing and Reliability Conference
ASTR 2016, Pan
R Output of Exponential Regression for Rolling Ball Bearings
Value Std. Error z p
(Intercept) 3.4924 0.354 9.878 5.19e-23
IHRT 0.4217 0.374 1.127 2.60e-01
ORO 0.4648 0.375 1.239 2.15e-01
Cage.Design 0.0316 0.355 0.089 9.29e-01
Scale fixed at 1
Exponential distribution
Loglik(model)= -35.9 Loglik(intercept only)= -37.9
Chisq= 3.97 on 3 degrees of freedom, p= 0.26
Number of Newton-Raphson Iterations: 3

Accelerated Stress Testing and Reliability Conference
Value Std. Error z p
(Intercept) 3.4924 0.354 9.878 5.19e-23
IHRT 0.4217 0.374 1.127 2.60e-01
ORO 0.4648 0.375 1.239 2.15e-01
Cage.Design 0.0316 0.355 0.089 9.29e-01
Parameter Estimates
Standard Error of the Estimates

Accelerated Stress Testing and Reliability Conference
Value Std. Error z p
(Intercept) 3.4924 0.354 9.878 5.19e-23
IHRT 0.4217 0.374 1.127 2.60e-01=0.260
ORO 0.4648 0.375 1.239 2.15e-01=0.215
Cage.Design 0.0316 0.355 0.089 9.29e-01=0.929
Scale fixed at 1
Exponential distribution
Loglik(model)= -35.9 Loglik(intercept only)= -37.9
Chisq= 3.97 on 3 degrees of freedom, p= 0.26
Number of Newton-Raphson Iterations: 3
ASTR 2016, Pan
R Output of Exponential Regression for Rolling Ball Bearings
Nothing is significant!
• Either none of the factors are significant, or the exponential distribution is a bad fit.
• With no significant main effects, there is no reason to fit a model with interaction.

Accelerated Stress Testing and Reliability Conference
R Output for Weibull Regression Analysis of Rolling Ball Bearings
Value Std. Error z p
(Intercept) 3.6080 0.113 31.981 2.03e-224
IHRT 0.4412 0.164 2.695 7.03e-03
ORO 0.4454 0.165 2.701 6.92e-03
Cage.Design 0.0995 0.111 0.893 3.72e-01
Log(scale) -1.1924 0.300 -3.979 6.91e-05
Scale= 0.303
ASTR 2016, Pan
Now, IHRT and ORO are significant and Cage.Design is not.

Accelerated Stress Testing and Reliability Conference
Using JMP for ALT Data Analysis
• One regressor Analyze ->
Reliability and Survival ->
Fit Life by X
• More than one regressor Analyze ->
Reliability and Survival ->
Fit Parametric Survival
ASTR 2016,Pan 49

Accelerated Stress Testing and Reliability Conference
Using JMP for ALT Data Analysis (cont.)
• Fit parametric regression – Survival distribution
parameterized by a general linear model
– Censoring can be handled
– Both location parameter and scale parameter could be modeled
ASTR 2016, Pan 50

Accelerated Stress Testing and Reliability Conference
Another Example
Nickel-base superalloy (Meeker and Escobar, 1998, Table C.12)
• Curvilinear relationship between pseudostress and lifetime
• Non-constant variance
ASTR 2016, Pan 51

Accelerated Stress Testing and Reliability Conference
1st order model
ASTR 2016, Pan 52

Accelerated Stress Testing and Reliability Conference 2nd order model
ASTR 2016, Pan 53

Accelerated Stress Testing and Reliability Conference
With a scale parameter model
ASTR 2016, Pan 54
Accelerated Stress Testing and Reliability Conference
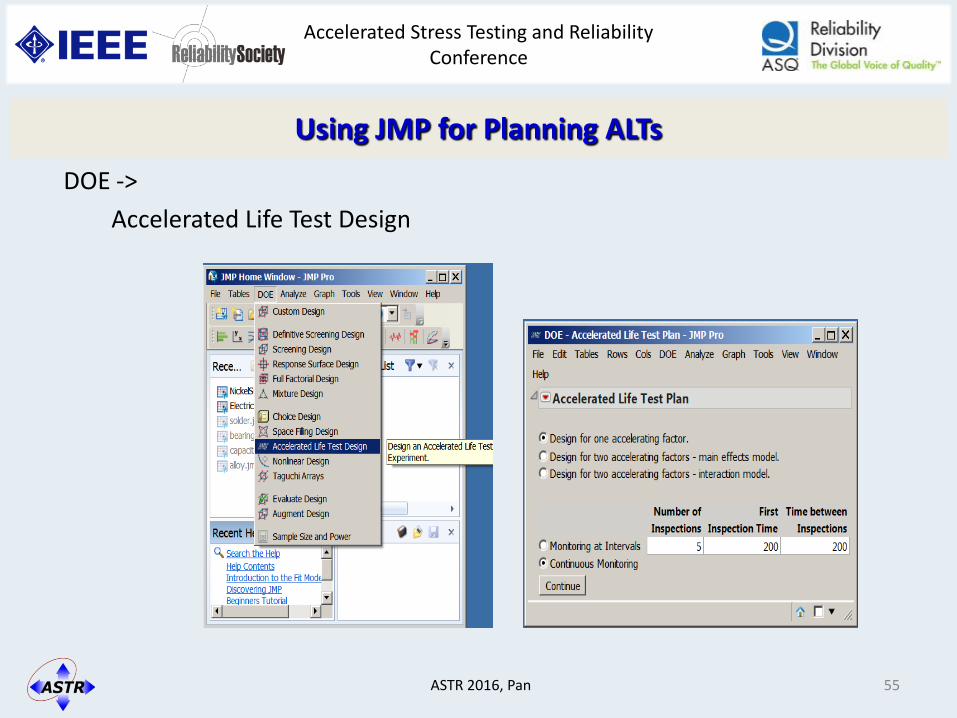
Using JMP for Planning ALTs
DOE ->
Accelerated Life Test Design
ASTR 2016, Pan 55

Accelerated Stress Testing and Reliability Conference
Introducing an R Package
ASTR 2016, Pan
• What you see when you start R
• Install and run R packages
– Select a CRAN mirror
– Install the package you need
– Load the package
56

Accelerated Stress Testing and Reliability Conference
ALTopt Package
ASTR 2016, Pan
• Create D-, U- and I-optimal designs for accelerated life testing with right censoring or interval censoring – altopt.ic(): Create optimal test plans with interval
censoring – altopt.rc(): Create optimal test plans with right censoring
• Evaluate a given test plan
– alteval.ic(): Evaluate a test plan with interval censoring – alteval.rc(): Evaluate a test plan with right censoring
• Provides several graphing functions, including
contour plot, Fraction of Use Space (FUS) plot and Variance Dispersion of Use Space (VDUS) plot
57

Accelerated Stress Testing and Reliability Conference
ALTopt Demo
ASTR 2016, Pan
• Example: – Design <- altopt.ic("U", 100, 30, 5, 2, 1, formula = ~ x1 + x2 +
x1:x2, coef = c(0, -4.086, -1.476, 0.01), useCond = c(1.758, 3.159))
– pv.contour.ic(Design$opt.design.rounded, x1, x2, 30, 5, 2, 1, formula = ~ x1 + x2 + x1:x2, coef = c(0, -4.086, -1.476, 0.01), useCond = c(1.758, 3.159))
58

Accelerated Stress Testing and Reliability Conference
References
• Wayne B. Nelson (2005a). A bibliography of accelerated test plans, IEEE Transactions on Reliability, vol. 54, pp. 194-197.
• Wayne B. Nelson (2005b). A bibliography of accelerated test plans part II-references, IEEE Transactions on Reliability, vol. 54, pp. 370-373.
• Wayne B. Nelson (2015). An updated bibliography of accelerated life tests, Proceedings of the Reliability and Maintainability Symposium, pp. 177-182.
• William Q. Meeker and Luis A. Escobar (1998). Pitfalls of accelerated testing, IEEE Transactions on Reliability, vol. 47, no. 2, pp. 114-118.
• William Q. Meeker, Georgios Sarakakis, and Atheanasios Gerokostopoulos (2013). More pitfalls of accelerated tests, Journal of Quality Technology, vol. 45, pp. 1-11.
• William Q. Meeker and Luis A. Escobar (1998). Statistical Methods for Reliability Data. Wiley.
• Steven E. Rigdon, Brandon R. Englert, Issac A. Lawson, Connie M. Borror, Douglas C. Montgomery and Rong Pan (2012). Experiments for reliability achievement, Quality Engineering, vol. 25, no. 1, pp. 54-72.
• Eric M. Monroe and Rong Pan (2008). Experimental design considerations for accelerated life tests for nonlinear constraints and censoring, Journal of Quality Technology, vol. 40, no. 4, pp. 355-367.
ASTR 2016, Pan

Accelerated Stress Testing and Reliability Conference
Q&A
Thank You!
ASTR 2016, Pan 60