Embed Size (px)
Citation preview
Det Kgl . Danske Videnskabernes Selskab .
Mathematisk-fysiske Meddelelser . XIV, 3 .
STUDIES ON HALOGEN-CYANIDES II .
THE DISTRIBUTION OF IODINE CYANIDE AN D
CYANOGEN BROMIDE BETWEEN BENZENE AN D
WATER, AND BETWEEN BENZENE AND SOM E
AQUEOUS SALT SOLUTIONS . THE SYNTHESIS
AND THE MOLECULAR WEIGHT OF IODINE
CYANIDE
BY
MAX MØLLE R
KØBENHAVNLKVIN & MUNKSGAARll
EJNAR MUN[fSGAAR D
1936

Printed in Denmark .Bianco Lunos Bogtrykkeri A/S .
1 . Introduction .
In an investigation of the equilibrium :
ICN+I- +H+ I 2, +HCN ,
KOVACH 1 attempted to calculate the equilibrium constant .
But the value which was obtained from the conductivit y
measurements and the potentiometric estimations cannot
be correct, such as it was realized already by KOVACH ,
since the value of the iodine-iodide ion potential, calculate d
by means of the equilibrium constant, is not in agreemen t
with the accepted value .
This disagreement may be due to, either that the acti-
vity of iodine cyanide is strongly effected by salts in general ,
or that iodine cyanide reacts with iodide ions and cyanid e
ions to form complex compounds, or to both of these effects .
The following research was started to investigate th e
salting out effect on iodine cyanide and cyanogen bromide ,
and to investigate if these substances actually are able t o
unite with halogen ions to form complex ions, similar to
the tri-iodide ion, I .
When this investigation was in progress YOST & STONE 2
published a paper dealing with the complexformation of
iodine cyanide with iodide and cyanide ions .
1 Z . phys . Chem. 80 (1912) 107 .2
Jour . Amer. Chem. Soc. 55 (1933) 1889 .
1*
4
Nr. 3 . MAX MØLLER :
From the distribution of iodine cyanide between car -
bon tetrachloride and aqueous solutions of potassium iod-
ide and potassium cyanide, these authors have estimate d
two quantities, which should be the complexity constant s
of the ions ICNI and ICNCN . In the calculation the y
have assumed, that the activity of the iodine cyanide, fo r
the same concentration of iodine cyanide, is the same i n
water and in an aqueous salt solution . This, however, i s
not permissible, since a considerable salting out effect i s
observed, such as it will be seen in the following . If the
authors had used sodium iodide and sodium cyanide, i n
place of the potassium salts, the computed complexit y
constants would have been different, but equally wrong .
In the following investigation of the distribution o f
iodine cyanide and cyanogen bromide between benzene
and aqueous salt solutions the effect of iodide ions ha s
not been dealt with, as it appeared to require special pre -
cautions . Even a minute quantity of carbon dioxide in the
solutions produces a formation of free iodine, which change s
the distribution ratio (estimated by thiosulphate litrations )
considerably . In solutions of potassium cyanide the hydroxyl
ions produce a slow hydrolysis of iodine cyanide and a
rapid hydrolysis of cyanogen bromide, probably accom-
panied by other reactions, and the cyanide solutions, there -
fore, have not been dealt with in this paper .
2. The Synthesis of Cyanogen Bromide and
Iodine Cyanide.
The cyanogen bromide was prepared as mentioned i n
a previous paper' and was perfectly pure .
1 Det Kgl. Danske Vid . Selskab . Math .-fys . Medd . XII, 17 (1934).

Studies on Halogen-cyanides II .
5
According to SERULLAS 1 and SEUBERT & POLLARD S
iodine cyanide may be prepared from mercuric cyanide an d
iodine, either by sublimation of the stoechiometric mixture ,
or by adding the iodine in the form of an ethereal solu-
tion to the mercuric cyanide, evaporate to dryness, an d
extract the iodine cyanide, which is formed, by means o f
ether 3 .
None of these methods, however, are practical for th e
production of larger quantities of iodine cyanide, and it i s
difficult to obtain a perfect separation from free iodine an d
the mercuric salts .
Another method; therefore, was applied, similar t o
ScaoLL's cyanogen bromide synthesis, and a similar metho d
has been employed by YOST & STONE (1 . C .) .
21.1 grams of pure sodium cyanide (98-99 °/o) wer e
dissolved in 80 ccs. of water in a bottle with a wide neck .
The solution was placed in ice and stirred by means of
a glass rod fitted to an electric stirrer . To the ice-cold solut-
ion 100 grams of iodine were added in small portion s
(2-3 grams at the time), and the next portion first adde d
when the previous had reacted . When all the iodine i s
added, the solution, which still contains a slight excess of
cyanide ions, is extracted trice with ether in a separatory
funnel. The first time with 90 ccs., then with 70 ccs . an d
finally with about 50 ccs . of ether .
The ethereal solution is now evaporated at ordinary
temperature in a hood with good ventilation, until all ethe r
has disappeared . The crystalline mass is dissolved in alcohol ,
just enough to effect a complete dissolution . After a filtra -
' Ann . Clam . Phys . (2) 27 (1824) 188 .
' B . 23 (1890) 1062 .3
Linnemann : Lieb . Ann . 120 (1861) 36 .

6
Nr . 3 . MAX MOLLER :
tion water is added to the alcoholic solution, until a sligh t
precipitation occurs, which does not disappear on stirring .
After 24 hours the major part of the iodine cyanide ha s
crystallized out . It is filtered by suction, washed with
water, and dried over calcium chloride (which has bee n
treated with carbon dioxide to remove any alkaline com-
ponents). The yield is about 45 to 47 grams of a slightl y
brownish substance (theory 60 .3 grams) .
To effect a further purification the iodine cyanide i s
sublimed. This has been done in two ways . The first method
is to place the brownish iodine cyanide in the bottom o f
an ordinary filter pump suction flask, cover it with a
piece of filter paper, and in the neck of the flask fix a
wide test tube filled with carbon dioxide snow and ether .
On evacuation of the flask the iodine cyanide sublime s
and deposites on the test tube in needleshaped crystals .
The sublimation may also be effected by placing the impure
iodine cyanide in the bottom of a wide glass tubing, cove r
it with a piece of filter paper, close the tube with a rubber
stopper fitted with a glass stopcock, evacuate and place the
tube on the top of a radiator for heating the room .
The products obtained by these sublimations are per-
fectly pure, i . e . they give the theoretical quantity of iodin e
on addition to a solution of potassium iodide acidifye d
with acetic acid .
For instance 0 .9212 gram of iodine cyanide was dissolve d
with water in a measuring flask, and the volume made
up to 500 .2 ccs. The solution thus is 0 .01204 molar. 10 .01
ccs. of this solution were added to a solution of 2 gram s
of potassium iodide in 25 ccs . of 5 °/o acetic acid, and th e
liberated iodine titrated with a 0 .01017 N. solution of sodiu m
thiosulphate . In 6 estimations the consumption of iodine
Studies on Halogen-cyanides II .
7
was : 23.72, 23.71, 23.69, 23.71, 23.69, 23.69 ces ., or on
the average 23.70 ces . From this result the molarity of th e
iodine cyanide solution is calculated to 0.01204, which is
in complete agreement with the result above .
3. The Analytical Estimation of Cyanogen Bromideand Iodine Cyanide.
Cyanogen bromide and iodine cyanide have in the follow-
ing been estimated, as already mentioned, by an iodome-
trie titration with thiosulphate . It should only be mentione d
that special precautions are necessary when 0 .01 N . solu-
tions of sodium thiosulphate are standardized, such as i t
has been stated in a previous paper . '
4. The Molecular Weight of Iodine Cyanide in Aqueou sSolutions and in Benzene .
To be certain that no polymerization occurs in benzen e
solutions of iodine cyanide, the molecular weight wa s
determined by the freezing point method . The applied benzene
was of a pure brand for molecular weight estimations .
It was dried over metallic sodium and distilled. After thi s
it had the correct freezing point .
In a series of estimations it was found, within a n
experimental error of about 2 3 °/o, that the molecula r
weight of iodine cyanide is the same in benzene and aqueou s
solutions and equal to the theoretical value .
The molecular weight of cyanogen bromide has bee n
investigated in a previous paper' and has the theoretica l
value both in water and benzene .
' MAx MØr.LEn : Z . analyt. Chem . 99 (1934) 353 .2
1 . c .
8
Nr.3 . MAX MOLLER :
5 . The Distribution of Iodine Cyanid eand Cyanogen Bromide between Water and Benzen e
at 25° . The Estimation of d° .
The experiments were made by weighing out a certain
quantity of the halogen cyanide in a small phial with glas s
stopper, dissolving the content in water saturated wit h
benzene at 25° and making the solution up to the desire d
volume. This solution was then titrated by the usual iodo-
metric method. Then a certain volume of the halogen cyan -
ide solution (50 or 100 ces .) was taken out by means
of a pipette and runned to the equal volume of benzene
(saturated with water at 25°) in a glass stoppered bottle .
After securing the stopper with a rubber cap, the bottl e
was rotated in a water thermostate at 25° ± 0 .02°. The
equilibrium is attained in less than half an hour . Samples
of the benzene solution and the aqueous solution wer e
pipetted into solutions of potassiun iodide in 5°/o acetic acid
and titrated with an 0 .01 N . solution of sodium thiosulphate .
The results of the distribution experiments for iodin e
cyanide between water and benzene are given in the table I .
Here the column ICN, H BO is the molar concentration
of iodine cyanide in the aqueous layer and the colum n
ICN, C 6 H 6 the molar concentration in the benzene layer .
d is the distribution ratio, i . e . the ratio of the iodine cyan -
ide concentration in the benzene layer to the concentration
in the aqueous layer .
It may be seen from the table, that the value of d i s
the same for the three lowest iodine cyanide concentrations .
We may accept, therefore, for the distribution ratio a t
infinite dilution, d° , the value :
d° = 1 .421 .

Studies on Halogen-cyanides II .
9
Assuming that the activity of the iodine cyanide in th e
benzene solution is equal to the concentration for the entir e
range of concentrations in the table, the activity coefficien t
of the iodine cyanide in the aqueous solution is given by :
The values of f together with the value of log f are give n
in the table .
Table I .
The distribution of iodine cyanide between water and
benzene at 25° .
ICN, H 2 O
Molarity
ICN, Co He
Molarityd f log f
0 .0005411 0.000 7690 1 .421 l0 .001077 0 .001532 1 .422 } 1 .000 0 .000 00 .002163 0 .003075 1 .421 J0 .003217 0.00 4578 1 .423
}1 .002 0 .00090 .003235 0 .004607 1 .42 4
0 .00-1759 0 .006781 1 .425 1 .003 0 .001 30 .006423 0.009177 1 .429 1 .006 0 .00260 .009644 0.01383 1 .434 1 .009 0 .003 90 .01278 0 .01841 1 .441 1 .014 0 .006 00 .01600 0.02310 1 .444 1 .016 0 .006 9
Table II .
The distribution of iodine cyanide between water and carbon
tetrachloride at 25 ° . YOST & STONE ' S experiments recalculate d
with d o = 0.1755 .
ICN, H 2 OMolarity
ICN, CCI 4
Molarity
log f
Y . & S .
log f
recalculate d
0 .02480 0 .004460 0 .0066 0 .01050 .02596 0 .004673 0 .0071 0.011 00 .03312 0 .006007 0.0104 0 .01430 .05144 0 .009441 0 .0154 0.01930 .06697 0 .01239 0 .0190 0 .02290 .07173 0.01330 0 .0199 0 .02380 .07960 0.01482 0 .0218 0 .0257

10
Nr . 3 . Max MOLLER :
In fig. 1 the curve (ICN) gives the values of log f
plotted against the iodine cyanide concentration in th e
aqueous layer .
YOST & STONE (1 . C .) have estimated the distributio n
of iodine cyanide between water and carbon tetrachlorid e
for iodine cyanide concentrations higher than the here applied ,
0020 1oq 'f
o.ol o
cool
0
0.01
0 .02
0 .03
0.04
0 .05-' c
~JCN, :rJCN .Yost&Stone .Originalvalues, oJCN.Yost&Stone .Recalculatedvalues,
BrC N
Fig. 1 .
and have by a graphic method extrapolated to the value
of do, the distribution ratio at infinitive dilution. If the
activity coefficient of the iodine cyanide in the aqueou s
solution is calculated from YOST & STONE 'S experiments
and their value for do (table II column log f, Y & S), th e
results do not fit in with thei experiments in table I . How-
ever, it appears that the curve for YOST & STONE'S values
of log f, plotted against the iodine cyanide concentration ,
is not directed toward the zeropoint at infinitive dilution .
When the distribution ratios are plotted against the concen-
Studies on Halogen-cyanides II .
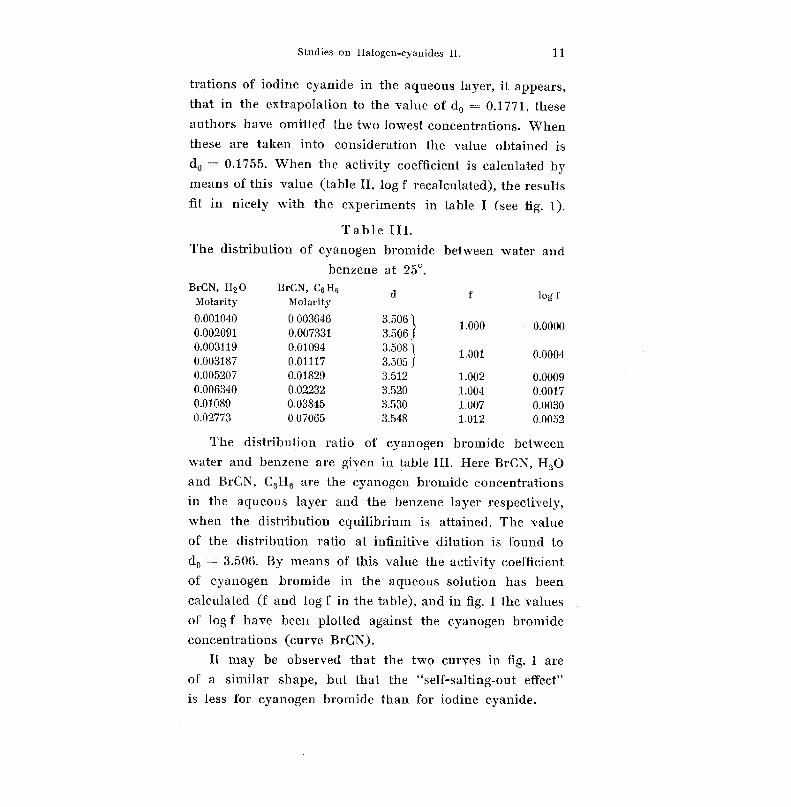
1 1
trations of iodine cyanide in the aqueous layer, it appears ,
that in the extrapolation to the value of d o = 0.17 71, thes e
authors have omitted the two lowest concentrations . When
these are taken into consideration the value obtained i s
do = 0.1755. When the activity coefficient is calculated b y
means of this value (table II, log f recalculated), the result s
fit in nicely with the experiments in table I (see fig . 1) .
Table III .
The distribution of cyanogen bromide between water an d
benzene at 25° .BrCN, H 2 O
Molarity
BrCN, C 6 H 6
Molarityd f log e
0.001040 0 .003646 3 .506}
1 .000 0 .00000 .002091 0 .00 7331 3 .5060.003119 0 .01094 3 .5081
1 .001 0 .00040 .003187 0 .01117 3 .505 f0 .005207 0 .01829 3 .512 1 .002 0 .000 90 .006340 0 .02232 3 .520 1 .004 0 .001 70 .01089 0 .03845 3.530 1 .007 0 .003 00 .02773 0 .07065 3.548 1 .012 0 .0052
The distribution ratio of cyanogen bromide betwee n
water and benzene are given in table III . Here BrCN, H 2 O
and BrCN, C 6 H 6 are the cyanogen bromide concentration s
in the aqueous layer and the benzene layer respectively ,
when the distribution equilibrium is attained . The value
of the distribution ratio at infinitive dilution is found t o
dp = 3 .506. By means of this value the activity coefficient
of cyanogen bromide in the aqueous solution has been
calculated (f and log f in the table), and in fig. 1 the value s
of log f have been plotted against the cyanogen bromide
concentrations (curve BrCN) .
It may be observed that the two curves in fig . 1 are
of a similar shape, but that the "self-salting-out effect"
is less for cyanogen bromide than for iodine cyanide .
12
Nr . 3 . MAX MOLLER :
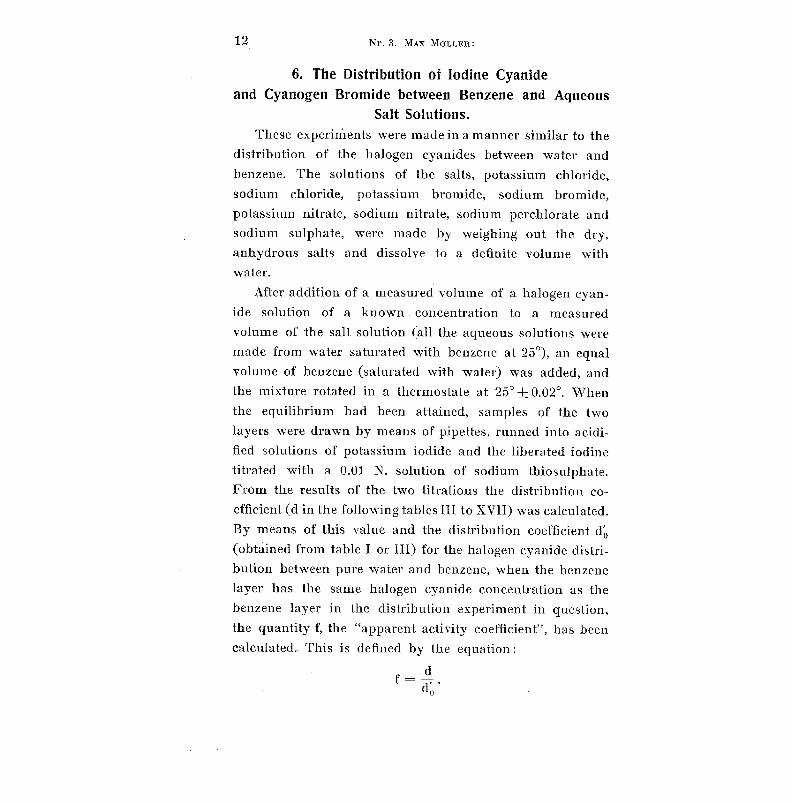
6. The Distribution of Iodine Cyanideand Cyanogen Bromide between Benzene and Aqueou s
Salt Solutions .These experiments were made in a manner similar to th e
distribution of the halogen cyanides between water an d
benzene. The solutions of the salts, potassium chloride ,
sodium chloride, potassium bromide, sodium bromide,
potassium nitrate, sodium nitrate, sodium perchlorate and
sodium sulphate, were made by weighing out the dry ,
anhydrous salts and dissolve to a definite volume with
water .
After addition of a measured volume of a halogen cyan -
ide solution of a known concentration to a measure d
volume of the salt solution (all the aqueous solutions wer e
made from water saturated with benzene at 25°), an equa l
volume of benzene (saturated with water) was added, an d
the mixture rotated in a thermostate at 25 0 +0.02°. When
the equilibrium had been attained, samples of the tw o
layers were drawn by means of pipettes, runned into acidi-
fied solutions of potassium iodide and the liberated iodin e
titrated with a 0.01 N. solution of sodium Lhiosulphate .
From the results of the two titrations the distribution co -
efficient (d in the following tables III to XVII) was calculated .
By means of this value and the distribution coefficient d ',
(obtained from table I or III) for the halogen cyanide distri-
bution between pure water and benzene, when the benzen e
layer has the same halogen cyanide concentration as th e
benzene layer in the distribution experiment in question ,
the quantity f, the "apparent activity coefficient", has bee n
calculated . This is defined by the equation :
f - a0
Studies on Halogen-cyanides II .
1 3
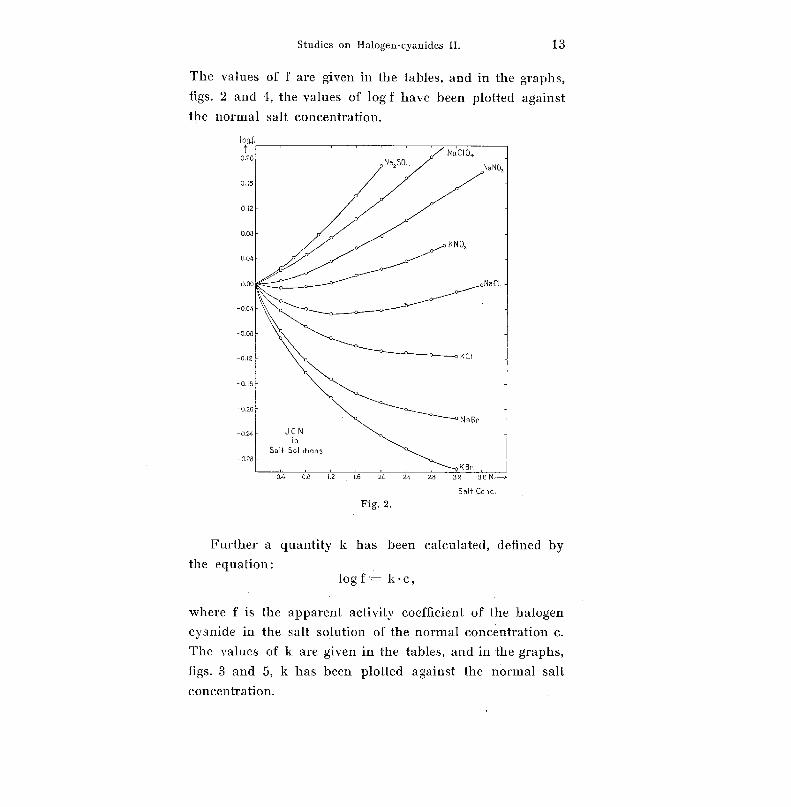
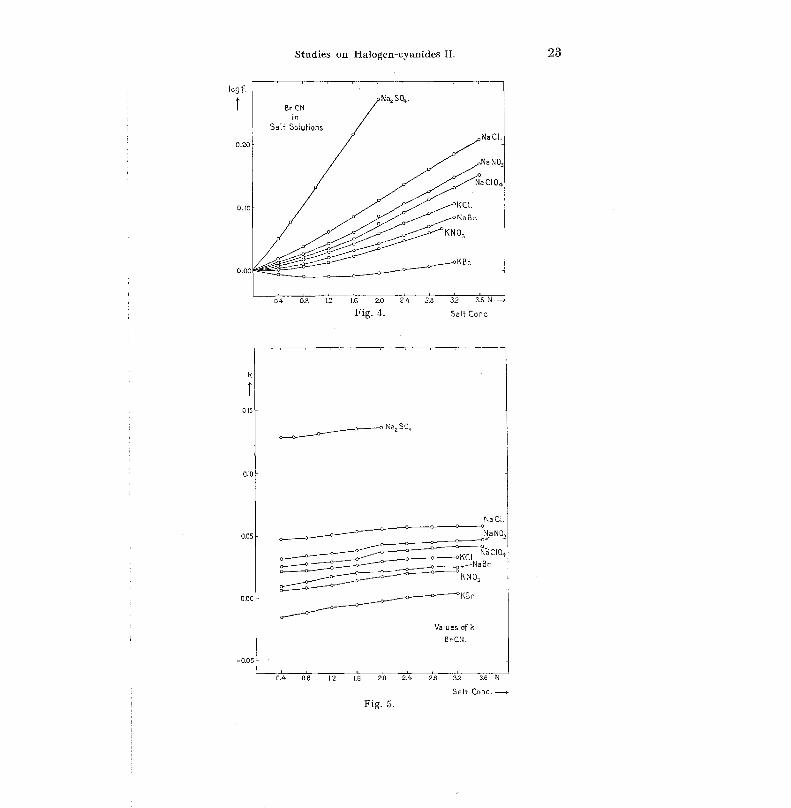
The values of f are given in the tables, and in the graphs ,
figs . 2 and 4, the values of log f have been plotted agains t
the normal salt concentration .
Fig. 2 .
Further a quantity k has been calculated, defined b y
the equation :log f= k•c ,
where f is the apparent activity coefficient of the haloge n
cyanide in the salt solution of the normal concentration c .
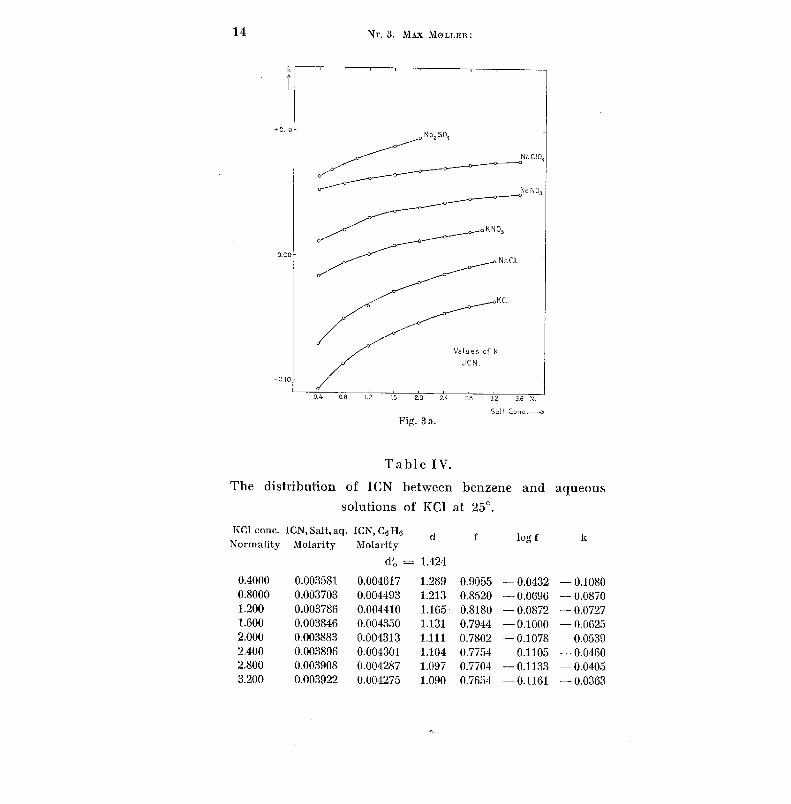
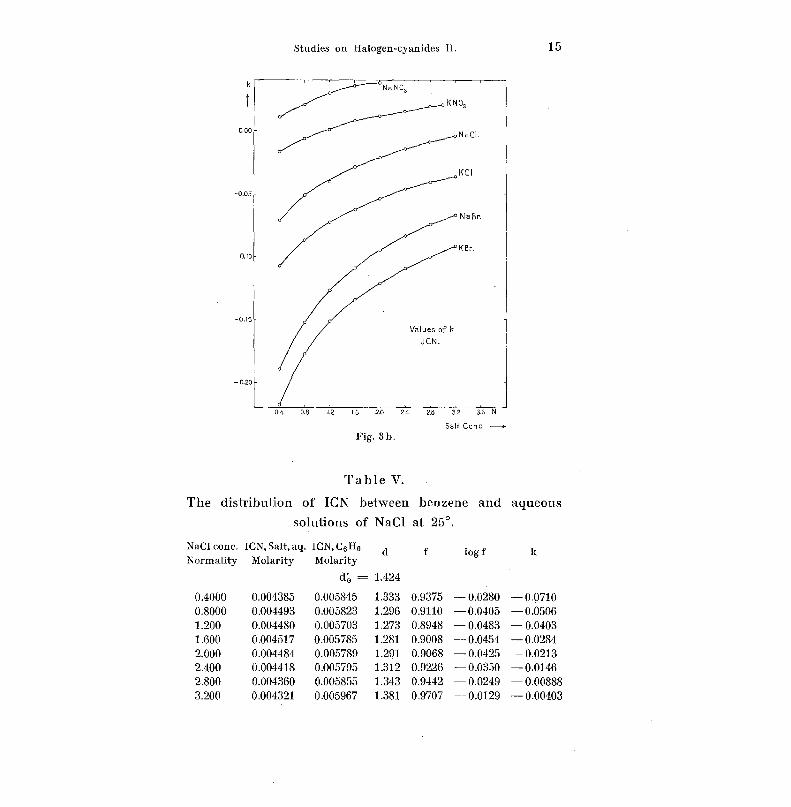
The values of k are given in the tables, and in the graphs ,
figs . 3 and 5, k has been plotted against the normal salt
concentration .
lo9 .f:
0 .20 -
0 .16 -
0 .12 -
14
+O .ro
a.o o
-0.lo
Nr . 3 . MAX MØLLE ß :
2.0
2 .4
2 .8
3 .2
3 .6 N .
Salf Conc->
Fig . 3 a .
Table IV .
The distribution of ICN between benzene and aqueous
solutions of KC1 at 25°.
KC1 conc. ICN, Salt, aq .
Normality
Molarity
ICN, C 6 H 6
Molarityd f log f k
d', = 1 .42 4
0.4000 0 .003581 0 .004617 1 .289 0.9055 - 0 .0432 - 0.108 00 .8000 0 .003703 0 .004493 1 .213 0.8520 - 0 .0696 - 0.087 01 .200 0 .003786 0.004410 1 .165 0.8180 - 0 .0872 - 0.072 71 .600 0 .003846 0 .004350 1 .131 0.7944 - 0 .1000 - 0.062 52 .000 0 .003883 0 .004313 1 .111 0 .7802 - 0 .1078 - 0.053 92 .400 0 .003896 0 .004301 1 .104 0 .7754 - 0 .1105 - 0.046 02 .800 0 .003908 0 .004287 1 .097 0 .7704 - 0 .1133 - 0.040 53 .200 0 .003922 0 .004275 1 .090 0 .7654 - 0 .1161 - 0.0363
Na 2 SO4
Na CI .
KC I
o 1 .2
Studies on Halogen-cyanides II .
1 5
0.00 -
-0 .05 -
-0 .15 -
- 0 .20 -
k
Na N O3
0.4 0.8 1.2 1 .6 2.0 2.4 2.8
3.2
3 .6 N .
Salt Conc.
Fig . 3 b .
Table V.
The distribution of ICN between benzene and aqueou s
solutions of NaCl at 25° .
NaCl conc . ICN, Salt, aq. ICN, Cs H6
d
f
log f
kNormality Molarity
Molarit y
d'o = 1 .424
0 .4000 0 .004385 0 .005845 1 .333 0.9375 -0.0280 -0.071 00 .8000 0 .004493 0 .005823 1 .296 0 .9110 -0 .0405 -0.05061 .200 0 .004480 0 .005703 1 .273 0 .8948 -0.0483 -0.04031 .600 0 .004517 0 .005785 1 .281 0 .9008 -0.0454 -0.02842 .000 0 .004484 0 .005789 1 .291 0 .9068 -0.0425 -0.021 32 .400 0 .004418 0 .005795 1 .312 0 .9226 -0.0350 -0.01462 .800 0 .004360 0 .005855 1 .343 0 .9442 -0.0249 -0.008883 .200 0 .004321 0 .005967 1 .381 0 .9707 -0.0129 -0 .00403

16
Nr. 3 . MAX MØLLER :
Table VI .
The distribution of ICN between benzene and aqueou s
solutions of KBr at 25° .
KBr conc . ICN, Salt, aq. ICN, Co HG
d
f
log f
kNormality Molarity
Molarit y
dô = 1.42 5
0 .4000 0 .005332 0 .006208 1 .164 0 .8180 - 0.0872 - 0.21800 .8000 0 .005689 0 .005843 1 .027 0 .7208 - 0.1422 - 0.17781 .200 0 .005963 0 .005577 0 .9357 0 .6577 - 0 .1820 -- 0 .151 71 .600 0 .006175 0 .005354 0 .8670 0 .6084 0 .2158 0 .134 42 .000 0 .006353 0.005176 0 .8146 0.5717 - 02428 - 0.121 42 .400 0 .006484 0 .005045 0 .7779 0 .5459 - 0 .2629 - 0.109 52.800 0 .006743 0 .005029 0 .7459 0 .5234 0 .2812 - 0 .100 43.200 0 .006700 0.004840 0 .7225 0 .5077 - 0 .2944 - 0 .092 0
Table VII .
The distribution of ICN between benzene and aqueous
solutions of NaBr at 25° .
d
f
log f
0 .4000 0 .004765 0 .005694 1 .195 0 .8392 - 0.0761 - 0.19020 .8000 0 .005038 0 .005410 1 .074 0 .7541 0 .1225 - 0.153 11 .200 0 .005224 0.005235 1 .002 0 .7037 - 0.1526 - 0.127 11 .600 0 .005345 0 .005088 0 .9520 0 .6685 - 0 .1749 - 0.109 32.000 0 .005435 0 .001998 0 .9196 0 .6460 - 0.1899 - 0.094952 .400 0 .005480 0 .004913 0 .8966 0 .6300 - 0.2009 - 0.083702 .800 0 .004586 0 .004830 0 .8802 0 .6182 - 0 .2089 - 0.074 63 .200 0 .005541 0 .004816 0 .8690 0 .6103 - 0.2145 - 0.0670
NaBr conc . ICN, Salt, aq . ICN, C6 H 6
Normality Molarity
Molarity
db = 1 .42 4

Studies on Halogen-cyanides IL
1 7
Table VIII .
The distribution of ICN between benzene and aqueous
solutions of NaC1O4 at 25° .
NaC10 4 cone . ICN, Salt, aq . ICN, C 6 H 6Normality
Molarity
Molarity
d
f
log f
k
d'o = 1.42 4
0 .4000 0 .004006 0 .005987 1 .494 1 .049 0 .0209 0 .052 30 .8000 0 .003871 0 .006127 1 .583 1 .112 0 .0460 0 .057 51 .200 0 .003708 0 .006253 1 .686 1 .184 0 .0734 0 .061 51 .600 0 .003568 0 .006448 1 .807 1 .269 0 .1035 0 .064 72 .000 0 .003397 0 .006607 1 .945 1 .366 0 .1354 0 .067 72 .400 0 .003233 0 .006778 2 .097 1 .472 0 .1680 0 .070 02 .800 0 .003068 0 .006971 2 .272 1 .596 0 .2029 0 .072 53 .200 0 .002906 0 .00 7185 2 .472 1 .736 0 .2396 0 .074 93 .600 0 .002730 0.007293 2 .671 1 .876 0 .2732 0 .075 9
Table IX .
The distribution of ICN between benzene and aqueou s
solutions of KNO B at 25° . Conc. of ICN in benzene laye r
before distribution 0 .009914 molar .
KNOB cone. ICN, Saft, aq. ICN, C 6 H6d
f
logf
kNormality Molarity
Molarit y
d'o = 1 .42 4
0 .4000 0 .004127 0 .005787 1 .402 0 .9845 -0.0068 -0.01700 .8000 0 .004118 0.005796 1 .408 0 .9888 -0.0049 -0.006 11 .200 0 .004085 0 .005829 1 .427 1 .002 0 .0009 0 .00081 .600 0 .004021 0 .005893 1 .466 1 .030 0 .0126 0 .00792 .000 0 .003964 0 .005950 1 .502 1 .055 0 .0232 0 .0116 02 .400 0.003894 0 .006020 1 .547 1 .087 0 .0360 0 .0150 02 .800 0 .003802 0 .006112 1 .608 1 .129 0 .0528 0 .0188 63 .000 0 .003737 0 .006134 1 .642 1 .153 0 .0619 0 .0206 3
Vidensk. Selsk . Math .-fys . Medd. XIV, B . '2

18 Nr. 3 . MAX MOLLER :
Table X .
The distribution of ICN between benzene and aqueou s
solutions of NaNO 3 at 25°. Conc. of ICN in benzene laye r
before distribution 0 .009964 molar .
NaNO 3 conc. ICN, Salt, aq . ICN, CsHsd f log f k
Normality Molarity Molarity
d'o = 1 .42 4
0 .4000 0 .004089 0 .005875 1Ä37 1 .0093 0 .0040 .0.011 00 .8000 0 .004022 0 .005942 1 .478 1 .038 0 .0162 0 .02031 .200 0 .003915 0 .006049 1 .546 1 .086 0 .0357 0 .02981 .600 0 .003797 0 .006167 1 .624 1 .141 0 .0571 0 .0357
2 .000 0 .003697 0 .006267 1 .696 1 .191 0 .0759 0 .03802 .400 0 .003563 0 .006401 1 .797 1 .262 0 .1010 0 .042 12 .800 0 .003424 0 .006540 1 .911 1 .342 0 .1278 0 .0456
3 .200 0 .003303 0 .006661 2 .017 1 .417 0 .1513 0 .04723 .600 0 .003171 0 .006793 2.143 1 .506 0 .1778 0 .049 3
Table XI.
The distribution of ICN between benzene and aqueou s
solutions of Na 2 SO 4 at 25°.
NatSO 4 conc .Normality ICN, Salt, aq . ICN, Cr ;H6
d
f
log f
k
(2 • Molarity)Molarity Molarity
do = 1 .422
0 .4000 0 .002551 0.003842 1 .506 1 .059 0 .0249 0 .06230 .6000 0 .002498 0.003901 1 .562 1 .099 0 .0408 0 .06801.000 0 .002366 0.004020 1 .700 1 .195 0 .0775 0 .07751 .600 0 .002161 0.004241 1 .962 1 .380 0 .1398 0 .08742 .000 0 .002008 0.004401 2 .192 1 .541 0 .1879 0 .0940
Studies on Halogen-cyanides II .
1 9
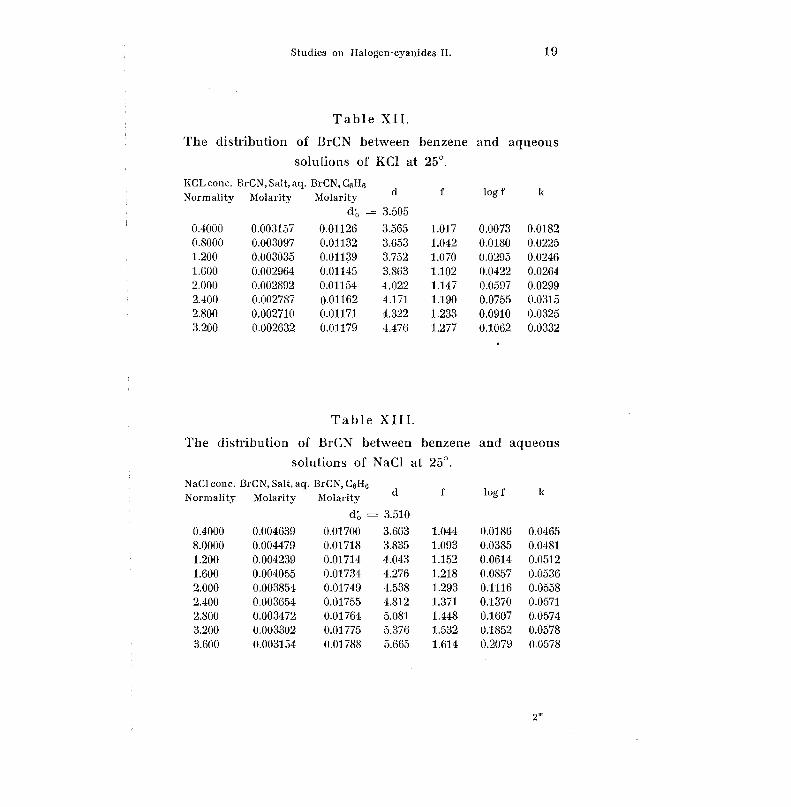
Table XII .
The distribution of BrCN between benzene and aqueou s
solutions of KC1 at 25° .
KCL conc . BrCN, Salt, aq. BrCN, C6 H 6d f log f kNormality Molarity Molarit y
d'o = 3 .50 5
0 .4000 0 .003157 0 .01126 3 .565 1 .017 0 .0073 0 .018 20 .8000 0 .003097 0 .01132 3 .653 1 .042 0 .0180 0 .022 51 .200 0 .003035 0 .01139 3 .752 1 .070 0 .0295 0 .024 61 .600 0 .002964 0 .01145 3 .863 1 .102 0 .0422 0 .026 42 .000 0 .002892 0 .01154 4 .022 1 .147 0 .0597 0 .029 92 .400 0 .002787 0.01162 4 .171 1 .190 0 .0755 0 .031 52 .800 0.002710 0 .01171 4 .322 1 .233 0 .0910 0 .032 53 .200 0 .002632 0 .01179 4 .476 1 .277 0 .1062 0 .0332
Table XIII .The distribution of BrCN between benzene and aqueous
solutions of NaCl at 25° .
NaCl conc . BrCN, Salt, aq . BrCN, C 6 1-1 6f log f k
Normality Molarity Molarity
d
d'o - 3 .51 0
0 .4000 0 .004639 0 .01700 3 .663 1 .044 0 .0186 0 .04658.0000 0 .004479 0 .01718 3 .835 1 .093 0.0385 0 .048 11 .200 0 .004239 0 .01714 4 .043 1 .152 0 .0614 0 .051 21 .600 0 .004055 0 .01734 4 .276 1 .218 0 .0857 0 .053 62 .000 0 .003854 0 .01749 4 .538 1 .293 0 .1116 0 .055 82 .400 0.003654 0 .01755 4 .812 1 .371 0.1370 0 .057 12 .800 0 .003472 0 .01764 5 .081 1 .448 0 .1607 0 .057 43 .200 0 .003302 0 .01775 5 .376 1 .532 0 .1852 0 .057 83 .600 0 .003154 0 .01788 5 .665 1 .614 0 .2079 0 .057 8
2 *

20 Nr . 3 . MAX MØLLER :
Table XIV .
The distribution of BrCN between benzene and aqueou s
solutions of KBr at 25° .
1iBr conc. BrCN, Salt, aq . BrCN, C6H 6
Normality Molarity
Molarity
d
do = 3.50 5
0 .4000 0 .003231 0 .01118 3.460 0 .9872 -0.0056 -0.014 00 .8000 0 .003243 0 .01115 3 .436 0.9804 -0.0086 -0.010 8
1 .200 0 .003247 0 .01116 3 .438 0 .9808 -0 .0084 0 .007 0
1 .600 0 .003238 0.01115 3 .444 0 .9826 0 .0076 -0.00472 .000 0 .003219 0.01119 3 .477 0 .9920 -0.0035 -0.001 8
2 .400 0.003184 0.01123 3 .527 1 .006 . 0 .0027 0 .001 1
2 .800 0 .003156 0.01126 3 .566 1 .017 0 .0075 0 .00263 .200 0.003120 0.01129 3 .618 1 .032 0 .0138 0'0043
Table XV.
The distribution of BrCN between benzene and aqueou s
solutions of NaBr at 25° .
NaBrconc. BrCN,Salt,aq. BrCN,C 6 H 6
d
3 .505
f log f kNormality Molarity Molarity
d'o =
0 .4000 0 .003133 0 .01109 3 .538 1 .009 0 .0041 0 .010 2
0 .8000 0 .003085 0 .01109 3 .596 1 .026 0 .0111 0 .0139
1 .200 0 .003020 0 .01112 3 .680 1 .050 0 .0211 0 .0176
1 .600 0 .002955 0 .01118 3 .782 1 .079 0 .0330 0 .020 6
2 .000 0 .002885 0 .01117 3 .870 1 .104 0 .0430 0 .021 5
2 .400 0 .002793 0 .01115 3 .990 1 .139 0 .0563 0 .023 42 .800 0 .002712 0 .01120 4 .126 1 .177 0 .0709 0 .025 3
3 .200 0 .002625 0 .01119 4 .260 1 .215 0 .0847 0 .026 5
f
log f
k
Studies on Halogen-cyanides II .
2 1
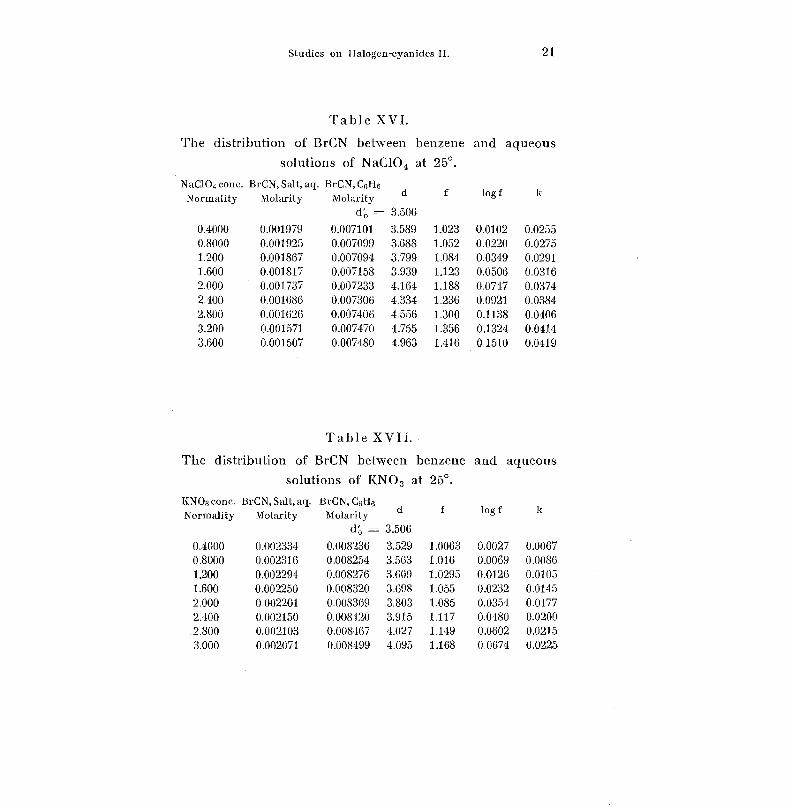
Table XVI .
The distribution of BrCN between benzene and aqueou s
solutions of NaC1O 4 at 25° .
NaC10 4 conc . BrCN, Salt, aq . BrCN, C6H6f log f k
Normality Molarity Molarity
d
d~ = 3 .50 6
0 .4000 0 .001979 0 .007101 3 .589 1 .023 0.0102 0 .025 50 .8000 0 .001925 0 .007099 3 .688 1 .052 0 .0220 0 .027 51 .200 0 .001867 0 .007094 3 .799 1 .084 0 .0349 0 .029 11 .600 0 .001817 0.007158 3 .939 1 .123 0 .0506 0 .031 62 .000 0 .001737 0.007233 4.164 1 .188 0 .0747 0 .037 42 .400 0 .001686 0.00 7306 4 .334 1 .236 0 .0921 0 .038 42 .800 0 .001626 0.007406 4 .556 1 .300 0 .1138 0 .040 63 .200 0 .001571 0 .007470 4 .755 1 .356 0 .1324 0.041 43 .600 0 .001507 0 .007480 4 .963 1 .416 0 .1510 0 .041 9
Table XVII .
The distribution of BrCN between benzene and aqueou s
solutions of KNO 3 at 25° .
KNOB conc . BrCN, Salt, aq. BrCN, CsH B
0.4000 0 .002334 0 .008236 3 .529 1 .0063 0 .0027 0 .00670 .8000 0 .002316 0 .008254 3 .563 1 .016 0 .0069 0 .00861 .200 0.002294 0 .008276 3 .609 1 .0295 0 .0126 0 .01051 .600 0 .002250 0 .008320 3 .698 1 .055 0 .0232 0 .014 52 .000 0 002201 0 .008369 3 .803 1 .085 0 .0354 0 .017 72 .400 0 .002150 0 .008420 3 .915 1 .117 0 .0480 0 .020 02 .800 0 .002103 0.008467 4 .027 1 .149 0 .0602 0 .021 53 .000 0 .002071 0 .008499 4 .095 1 .168 0 .0674 0 .0225
Normality
Molarity
Molarit y
d = 3.50 6
d
f
l og f
k
22 N r . 3 . MAX MOLLER :
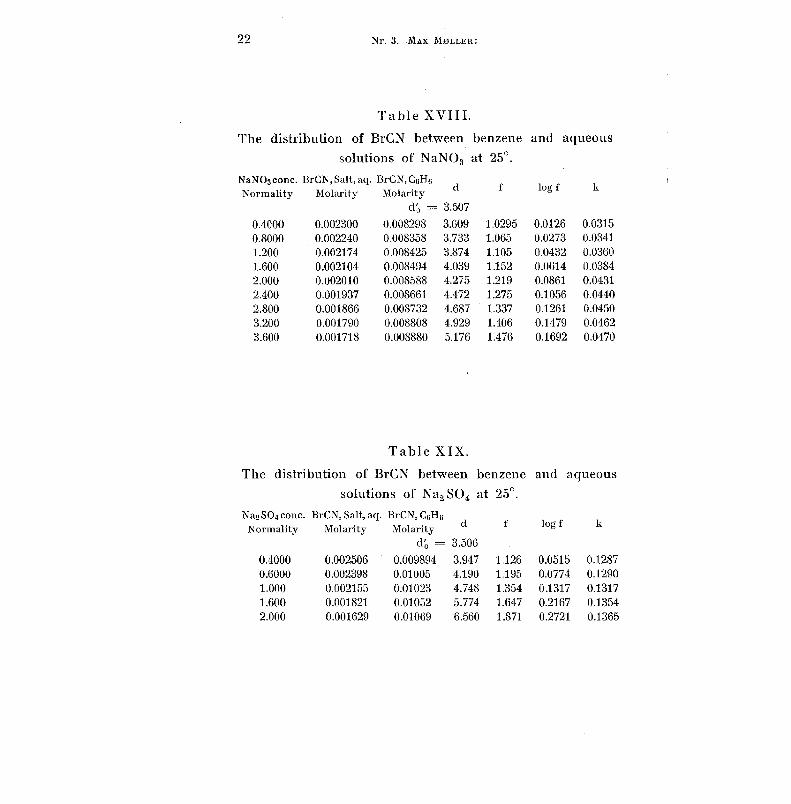
Table XVIII .
The distribution of BrCN between benzene and aqueous
solutions of NaNO 3 at 25° .
NaNO3conc . BrCN, Salt, aq . BrCN, C6H 6
0 .4000 0 .002300 0 .008298 3.609 1 .0295 0 .0126 0 .031 50 .8000 0 .002240 0 .008358 3 .733 1 .065 0 .0273 0 .03411 .200 0 .002174 0 .008425 3 .874 1 .105 0 .0432 0 .03601 .600 0 .002104 0 .008494 4 .039 1 .152 0 .0614 0 .03842 .000 0 .002010 0 .008588 4 .275 1 .219 0 .0861 0 .043 12 .400 0 .001937 0 .008661 4 .472 1 .275 0 .1056 0 .04402 .800 0 .001866 0 .008732 4 .687 1 .337 0 .1261 0 .045 0
3 .200 0 .001790 0 .008808 4 .929 1 .406 0 .1479 0.046 23 .600 0.001718 0 .008880 5 .176 1 .476 0 .1692 0.047 0
Table XIX .
The distribution of BrCN between benzene and aqueou s
solutions of Nat SO4 at 25° .
Na2 SO4 conc . BrCN, Salt, aq . BrCN, C6 H 6Normality
Molarity
Molarityd f log f k
do-3.50 6
0 .4000 0 .002506 0.009894 3 .947 1 .126 0 .0515 0 .1287
0 .6000 0 .002398 0 .01005 4 .190 1 .195 0.0774 0 .12901 .000 0 .002155 0.01023 4.748 1 .354 0 .1317 0 .131 71 .600 0 .001821 0 .01052 5.774 1 .647 0 .2167 0 .135 42 .000 0 .001629 0 .01069 6 .560 1 .871 0 .2721 0 .1365
Normality
Molarity
Molarity
d'o = 3.507
d
f
l f
kg
Studies on Halogen-cyanides II .
2 3
log f.
r
0.2 0
0 .1 0
0 .00
04
0.8
1 .2
1.6
2.0
24
2.6
3.2
3.6 N-->
Fig . 4 .
Salt Conc .
01 5
0.10 -
0 .0 0
0 .05
Values of k
BrCN .
-0 .05
O14
0~8
12
1 :6
2 .0
2 .4
28
3.2
3 .6 N
Salt Conc . -a
Fig . 5 .

24 Nr . 3 . MAX MOLLER :
7. Discussion of the Distribution Experiments .
a . Introduction .
Observing the plots of log f against the salt concentratio n
(figs . 2 and 4) one is struck immediately by the differenc e
in the appearance of the curves for iodine cyanide an d
cyanogen bromide. While the iodine cyanide curves are
wide apart and show a curvature in the entire range o f
salt solutions investigated, the cyanogen bromide curves ar e
much closer together, and from a salt concentration of
about 1 .2 or 1 .6 N . the curves are straight lines (exceptin g
the curves for NaBr and KBr).
It may also be observed that the sodium chloride and
the sodium nitrate curves of cyanogen bromide are place d
above the sodium perchlorate curve, while the opposite i s
the case for iodine cyanide . Further, for cyanogen bromid e
the sodium chloride curve is above the sodium nitrate curv e
and the potassium chloride curve above the potassiu m
nitrate curve, while the opposite is the case for iodin e
cyanide. Similar differences may be observed also in othe r
cases .
Still more striking is the difference in the appearanc e
of the curves which have been obtained by plotting the value s
of k against the salt concentrations (figs . 3a, 3b and 5) .
The iodine cyanide curves are wide apart and, in th e
majority of cases, have a strong curvature . The curves
of two salts with a common anion are parallel and the
distance between the curves for a sodium salt and a potas-
sium salt is almost the same in all cases independent o f
the anion. But the curves of such salts which have a corn -
mon cation are not parallel .
Studies on Halogen-cyanides II .
25
In the case of cyanogen bromide all of the k-curves ar e
practically parallel (with the exception of the curves for th e
bromides which differ slightly) and at higher salt concentra-
tions almost straight lines .
Among the k-curves of iodine cyanide the only on e
of the same shape as the k-curves of cyanogen bromide
is the sodium perchlorate curve. The perchlorate ion, how -
ever, is a perfectly "saturated" ion, which has no or at
least only a very minute tendency to form complex ions .
The shape of the sodium perchlorate k-curve of cyanogen
bromide, therefore, must be due entirely to the "saltin g
out effect" of the sodium and the perchlorate ions and no t
to complex formation . Since the other k-curves for cyanogen
bromide have the same shape (the curves for the bromides
differ slightly), it may be concluded that cyanogen bromid e
does not form complex ions with the sulphate, the nitrat e
and the chloride ion. Since the curves for sodium and
potassium bromide differ, if only slightly, from the other ,
it is likely that this is due to a complex formation . This ,
however, must be very slight .
As the sodium perchlorate-k-curve of iodine cyanid e
is practically of the same shape as the k-curves of cyanogen
bromide, it may further be concluded that iodine cyanid e
does not form complex ions with the perchlorate ion. That
the other iodine cyanide-k-curves have a different appear-
ence must be due to a complex formation with the anion s
of the salts . From the shape and the relative position o f
the curves one might expect that iodine cyanide form s
complex ions more readily with bromide ions than wit h
cloride ions, and more readily with these than with nitrat e
and sulphate ions .

26 Nr . 3 . MAX MOLLER :
b . Salting out Effect and Complex Formation .
The value of the salting out effect of a certain salt
solution with a certain non-electrolyte cannot, in general ,
be predicted with any degree of certainty' .
It is impossible, therefore, to apply directly any universa l
formula for the salting out coefficient, similar to the formul a
for the activity coefficient of an ion in a dilute solutio n
of an electrolyte, when the salting out effect has to b e
separated from the effect due to a complex formation .
The quantity f, the "apparent activity coefficient", i n
the previous tables includes simultaneously the change i n
the activity due to the salting out effect and the change
in the concentration of the free halogen cyanide due t o
the complex formation .
Let it be assumed, however, that the distribution ratio ,
entirely due to the salting out effect, is d ' , defined by the
equation :
d ' = Ju ,Jf
where Jb is the concentration of the halogen cyanide i n
the benzene layer, and J f is the concentration of free, no t
complex bound halogen cyanide in a certain salt solution
of a certain concentration . The actual salting out coefficien t
is then defined by the equation :
(1)
(2)
where d', is the distribution ratio of the halogen cyanid e
between benzene and water as previously discussed .
' See for instance RANDALL & FAIRRANRS FATLY : Chem . Rev . 4 (1927 )
285 ; ÅKERLOF : J . Amer. Chem. Soc . 51 (1929) 984 .
Studies on Halogen-cyanides II .
2 7
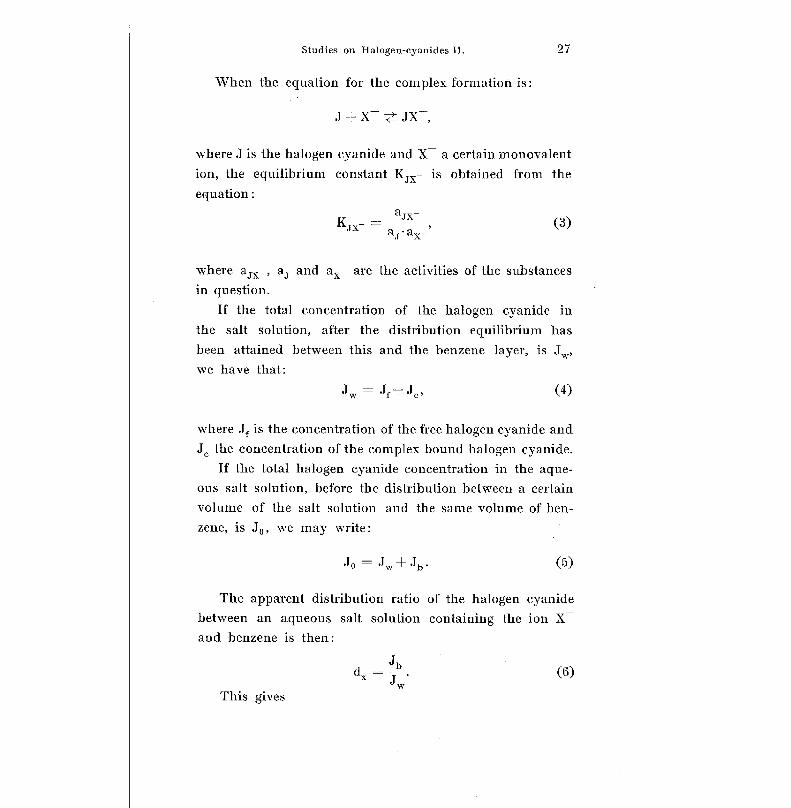
When the equation for the complex formation is :
J + X ~JX ,
where J is the halogen cyanide and X a certain monovalen t
ion, the equilibrium constant K jx- is obtained from th e
equation :
aJYK.rx a r aX ,
where a jx , aJ and ax- are the activities of the substance s
in question .
If the total concentration of the halogen cyanide i n
the salt solution, after the distribution equilibrium ha s
been attained between this and the benzene layer, is J w ,
we have that :
Jw = Jf -I-- Je ,
where Jf is the concentration of the free halogen cyanide an d
Je the concentration of the complex bound halogen cyanide .
If the total halogen cyanide concentration in the aque-
ous salt solution, before the distribution between a certai n
volume of the salt solution and the saine volume of ben-
zene, is Jo, we may write :
Jo = Jw + Jb .
(5 )
The apparent distribution ratio of the halogen cyanid e
between an aqueous salt solution containing the ion X
and benzene is then :
Jbdx = T .
wThis gives
(3)
(4)
(6 )

28 Nr . 3 .
MAX MOLLER :
Jo= J w (1+dY )
JR,=1
JOor
+ d ' (7)
andx
Jo - daJb = Jo - J = (8)W
l
d ;
The actual distribution ratio, however, is :
Jb
Jf 'which gives :
Jb
Jo'dzJf (9 )
dX
(1 + d X ) dX"
Introducing these values in (4) we get :
(10)J -Jo ( d - d,
° (1 + dh)
Introducing these values of the concentrations in th e
equation for the equilibrium constant we have :
Je a e
f [X ] ax
Here ae is the activity coefficient of the complex io n
JX , [X ] the concentration and a X the activity of the X ions ,
and finally afthe activity coefficient of the free halogen cyanide .
As the halogen cyanide concentration in the previou s
experiments is very small compared to the salt concen-
tration, the concentration of the free X ions may be put
equal to the total salt concentration c . Further, accordin g
to previous considerations, we have that af = fX, and the
equation for the complexity constant may be written ,
therefore :
Studies on Halogen-cyanides 11 .
2 9
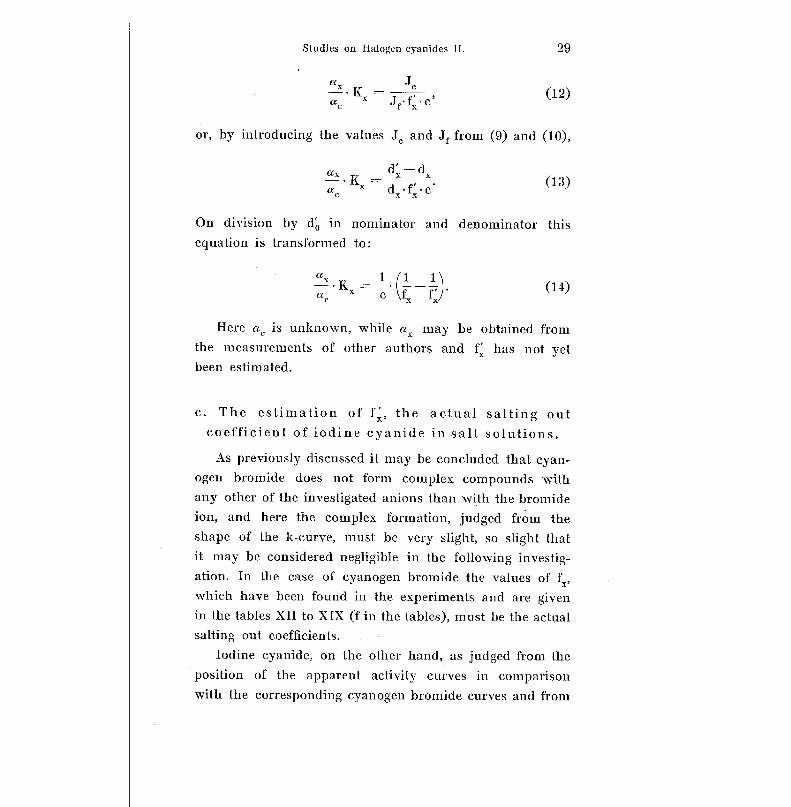
ax K-
Je
«~
x
Jf •fx c ,
or, by introducing the values J, and J f from (9) and (10) ,
ax
d ' - d xac Kx
d x •f~•c .
On division by d ', in nominator and denominator thi s
equation is transformed to :
ax K =---1
i1\
ac
x
c I. fx/
(14)
Here a c is unknown, while ce may be obtained from
the measurements of other authors and x has not yet
been estimated .
c . The estimation of Ç, the actual salting ou t
coefficient of iodine cyanide in salt solutions .
As previously discussed it may be concluded that cyan-
ogen bromide does not form complex compounds wit h
any other of the investigated anions than with the bromide
ion, and here the complex formation, judged from the
shape of the k-curve, must be very slight, so slight tha t
it may be considered negligible in the following investig-
ation. In the case of cyanogen bromide the values of f,which have been found in the experiments and are give n
in the tables XII to XIX (f in the tables), must be the actua l
salting out coefficients .
Iodine cyanide, on the other hand, as judged from the
position of the apparent activity curves in comparison
with the corresponding cyanogen bromide curves and from
(12)
(13)

30 Nr . 3 . MAX MØL LrR :
the shape of the k-curves, forms complex ions, to differen t
extent, with the bromide, the chloride and the nitrate ions ,
but not with the perchlorate ion . The k-curves for iodin e
cyanide and cyanogen bromide in sodium perchlorat e
solutions are parallel .
In table XX the value d/ = kIGN, Na C10, kBrCN, NaC10, at
different salt concentrations has been calculated, and i t
may be observed that it is fairly constant within the
experimental error, as an error in the estimation of f o f
about 0 .2 per cent . may cause deviations from the averag e
value of 3, which are very closely equal to the deviation s
observed in table XX .
Table XX .
NaC1O4conc .
Normality
k
ICN, NaC1O4
k
BrCN, NaC1O 4J
0 .400 0 .0523 0 .0255 0 .026 80 .800 0 .0575 0 .0275 0 .030 01 .200 0 .0615 0.0291 0 .03241 .600 0 .0647 0 .0316 0 .033 12 .000 0 .0677 0.0374 0 .030 32 .400 0 .0700 0 .0384 0 .031 62 .800 0 .0725 0 .0406 0 .031 93 .200 0 .0749 0 .0414 0 .03353 .600 0 .0759 0 .0419 0.034 0
Mean . . . 0 .0315
It has now been assumed, since cyanogen bromide an d
iodine cyanide are closely related and differ in structur e
probably only by a displacement of a pair of shared elec-
trons, that the actual salting out effect on iodine cyanid e
by a sodium salt of a monovalent ion X may be expresse d
by the same equation, i . e .
= k IGN, NaX - kBrCN, NaXor :
l; ICN, NaX - kBrCN, NaX +

Studies on Halogen-cyanides II .
31
Here kzcN, NaX is the k-value which corresponds to the
actual salting out coefficient, fiCN, NaX, of iodine cyanide in
solutions of the salt NaX, and these two naturally ar e
connected by the equation :
log fiCN, NaX - C • kICN, NaX
where c as usual is the concentration of the salt, NaX,
in the solution. The values of kBrcN, NaX are the k-values
in the tables XIII, XV and XVIII .
By means of the value of i obtained in the table XX
the values of the logarithm of the actual salting out co -
efficient of iodine cyanide, log f', in solutions of sodiu m
bromide, sodium chloride and sodium nitrate have been
calculated in the table XI, XII and XIII respectively .
By introducing these computed values of f ' and the
previously estimated values of f (the apparent activity co -
efficient) in the equation (14), the values of the quantit y
• K x have been calculated for the various salts at variou s
salt concentrations and are given in the tables and in th e
graph fig . 6 .
Table XXI.
Estimation of the complexity constant of the complex ion ICNBr - .
z/ = 0 .0315 .
Naar conc .k
BrCN, NaBr
k '
ICN, NaBr
log f'
ICN, NaBr
log f
IC N, NaBr
" Br
I;B' CBr a~
0 .0000 Extrapolated graphically 0 .65 00.4000 0 .0102 0.0417 0 .0167 - 0.0761 0 .575 0.71 0 .810.8000 0 .0139 0.0454 0 .0363 -0.1225 0.508 0.69 0 .881 .200 0 .0176 0.0491 0 .0589 -.0 .1526 0 .457 0 .69 1 .0 11 .600 0 .0206 0.0521 0 .0834 -0.1749 0 .419 0 .69 1 .1 02 .000 0 .0215 0.0530 0 .1060 -0.1899 0 .382 0 .73 1 .2 42 .400 0 .0234 0 .0549 0 .1318 -0.2009 0 .354 0 .76 1 .3 92 .800 0 .0253 0 .0568 0 .1590 - 0.2089 0 .330 0 .80 1 .5 83 .200 0 .0265 0.0580 0 .1856 -0.2145 0 .308 0 .85 1 .79
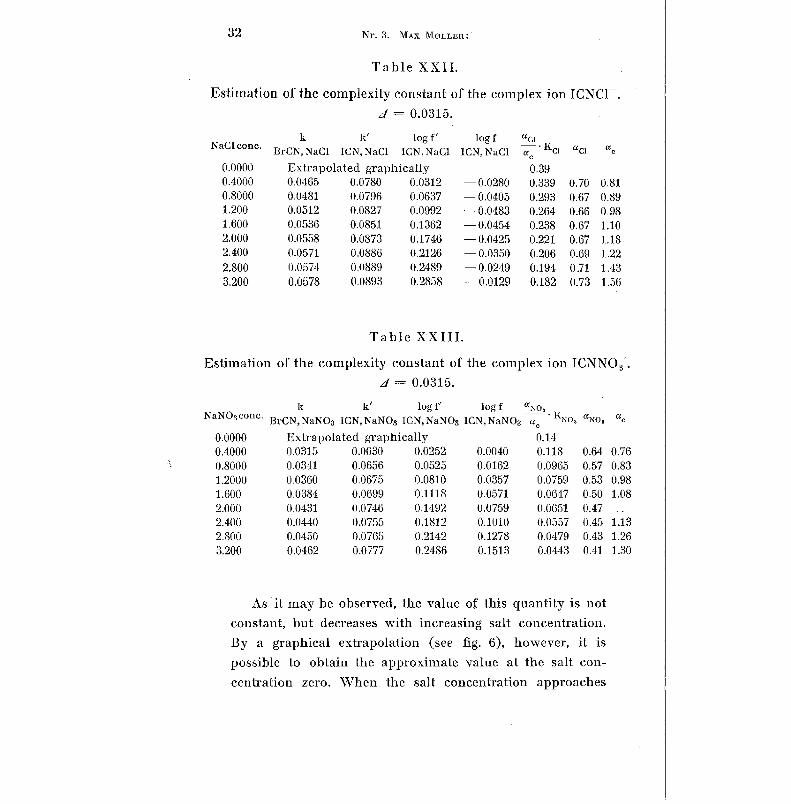
32 Nr . 3 . MAX MØLLER :
Table XXII .
Estimation of the complexity constant of the complex ion ICNCI .
3 = 0.0315 .
NaClconc .k
BrCN,NaC1
k 'ICN,NaCl
log f '
ICN,NaC1
log f
ICN,NaCl
ac ta~
K ct a ct ac
0 .0000 Extrapolated graphically 0 .3 90 .4000 0 .0465 0 .0780 0.0312 -0.0280 0.339 0.70 0 .810 .8000 0 .0481 0 .0796 0 .0637 - 0.0405 0.293 0 .67 0 .891 .200 0 .0512 0 .0827 0.0992 -0.0483 0.264 0.66 0 .981 .600 0 .0536 0 .0851 0 .1362 -0.0454 0.238 0.67 1 .1 02 .000 0 .0558 0 .0873 0 .1746 - 0.0425 0 .221 0.67 1 .1 82 .400 0 .0571 0 .0886 0 .2126 -0.0350 0 .206 0 .69 1 .222 .800 0 .0574 0 .0889 0 .2489 -0.0249 0 .194 0 .71 1 .433 .200 0 .0578 0 .0893 0 .2858 -0.0129 0 .182 0 .73 1 .56
Table XXIII .
Estimation of the complexity constant of the complex ion ICNNO3 .
J = 0.0315 .
k
k '
log f' log f aNo sNaN03con e
0 .0000 Extrapolated graphically 0.1 40 .4000 0 .0315 0 .0630 0 .0252 0 .0040 0 .118 0 .64 0 .7 60 .8000 0 .0341 0 .0656 0 .0525 0 .0162 0 .0965 0 .57 0 .831 .2000 0 .0360 0 .0675 0 .0810 0 .0357 0 .0759 0 .53 0 .981 .600 0 .0384 0 .0699 0 .1118 0 .0571 0 .0647 0 .50 1 .082 .000 0 .0431 0 .0746 0 .1492 0 .0759 0 .0651 0 .4 72 .400 0 .0440 0 .0755 0 .1812 0 .1010 0 .0557 0 .45 1 .1 32 .800 0 .0450 0 .0765 0 .2142 0 .1278 0.0479 0 .43 1 .263 .200 0 .0462 0 .0777 0 .2486 0 .1513 0 .0443 0 .41 1 .30
As it may be observed, the value of this quantity is no t
constant, but decreases with increasing salt concentration .
By a graphical extrapolation (see fig. 6), however, it is
possible to obtain the approximate value at the salt con -
centration zero . When the salt concentration approache s
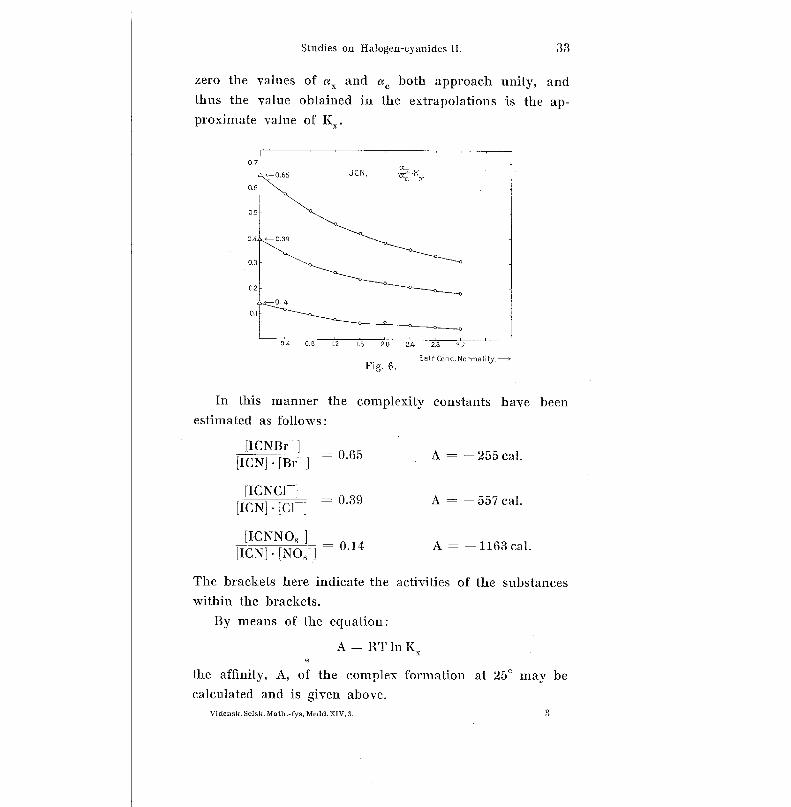
Studies on Halogen-cyanides II .
33
zero the values of ax and ae both approach unity, and
thus the value obtained in the extrapolations is the ap-
proximate value of K .
Fig . 6 .
5a If Conc . Norma lity. -.
In this manner the complexity constants have bee n
estimated as follows :
[1CNBr ]= 0 .65 A = - 255 cal .' ][ICN] • [Br
[ICNCI ]
= 0 .39 A = - 557 cal .-j[ICN] • [C l
[ICNNO3 ]0.14 A = -1163 cal .
[ICN] • [NO8 1
The brackets here indicate the activities of the substance s
within the brackets .
By means of the equation :
A= ßT1n K ~
the affinity, A, of the complex formation at 25° may b e
calculated and is given above .
Videask. Selsk . Math .-fys.Medd. SIV, 3.
3
0.7
0 .0 L2 2 .0
34
Nr. 3. MAx MØLLER :
The values of aBr , au and aNO, in the tables XXI, XXII
and XXIII respectively have been taken from the tables o f
activity coefficients in LANDOLT BÖRNSTEINS tables (II Erg .
Bd . 1931). By means of these, the value of Kx obtained in
the extrapolation, and the values of
• Kam , the values of ac
have been calculated and are given in the tables XXI to XIII .The increase in the value of the complex-ion activity
coefficients with increasing salt concentration is unusua l
hut not improbable high .
d) . Reflections on the structure of cyanoge n
bromide and iodine cyanide .
From an investigation of the Raman spectrum of cyan-
ogen chloride' the conclusion has been drawn that thi s
molecule is Cl-C-N, and that, similar to hydrogen cyanide ,
H-C-N, it probably is linear' .
Since the three substances cyanogen chloride, cyanogen
bromide and iodine cyanide show the same type of absorp-
tion spectre 3 , it may he concluded that all three substances
have the general structure X-CEN (X is a halogen atom) ,
and that their molecules are linear .
Cyanogen bromide and iodine cyanide in aqueous so -
lutions (and in several other solvents) are non-electrolytes ¢ ,
and even if they may behave abnormally in certain solvents ,
this is probably due to a chemical reaction with the sol -
vent molecules' . The bromine and the iodine in cyanoge n
' WEST & FARNSWORTH : Jour. Chem . Phys . 1 (1933) 402 .a BADGER & BENDER : Phys . Rev. 37 (1931) 800 .
BADGER & Sno-CHOW Wo : Jour . Amer . Chem. Soc . 53 (1933) 2572 .
MAX MOLLER : Det Kgl . Danske Vid . Selskabs Math .-fysiske Medd .
XII, 17 . WALDEN : Z. phys . Chem. 43 (1903) 401 .
AUDRIETH & BIRR : Jour . Amer . Chem . Soc . 55 (1933) 672 .

Studies on Halogen-cyanides II .
35
bromide and iodine cyanide respectively, therefore, ar e
bound to the carbon atom of the cyanide group with a
homopolar bond .
However, in the alkaline hydrolysis of cyanogen bromid e
and iodine cyanide (and in several other reactions') a grea t
difference in their behaviour is observed . With silver hy-
droxide, for instance, cyanogen bromide gives silver bromide
and silver cyanate, while iodine cyanide gives silver iodide ,
silver iodate and silver cyanide . This seems to indicat e
that these halogen cyanides form polar molecules, an d
while bromine in the cyanogen bromide seems to be th e
electronegative part of the molecule, iodine in cyanoge n
iodide seems to be the electropositive part .
As far as it can be seen this, however, may mee n
nothing more than the pair of shared electrons in cyanogen
bromide is pulled fairly close to the bromine atom, whil e
in iodine cyanide they are pulled close to the cyanide group ,
(or that in cyanogen bromide the probability of thei r
occurance is greater close to the bromine atom than to
the cyanide group, and naturally the opposite for iodin e
cyanide.) The greater ability of iodine cyanide to form
complex ions with cations may be due just to this displace -
ment of the electronic bond .
Since the actual salting out coefficient is greater fo r
iodine cyanide than for cyanogen bromide, it might be ex-
pected that the dipole momentum of iodine cyanide i s
smaller than the dipole momentum of cyanogen bromide ,
but this will be taken up for an experimental investigatio n
in a following paper .
1 See for instance CHATTAWAY & WADMOIIE : Jour . Chem. Soc. 8 1
(1902) 197 .
3*

36 Nr . 3 . MAX MØLLER :
8. Summary.
The molecular weight of iodine cyanide has been de-
termined in water and benzene .
The distribution between water and benzene of iodin e
cyanide and cyanogen bromide has been investigated an d
the activities in very dilute aqueous solutions estimated .
The distribution of iodine cyanide and cyanogen bromide
between benzene and aqueous solutions of the bromides,
the chlorides, the nitrates, the sulphates and the perchlor-
ates (of sodium only) of sodium and potassium has been
investigated. .
In the case of cyanogen bromide these experiment s
permit a direct calculation of the salting out effect, as
cyanogen bromide does not form complex ions with any
of the anions mentioned above, probably with the exceptio n
of the bromide ion . But here the complex formation i s
exceedingly slight and may be disregarded in this connection .
In the case of iodine cyanide the salting out effect i s
complicated by a simultaneous complex formation, to a differ -
ent extent, with the bromide, the chloride, the sulphate
and the nitrate ion. But no complex formation is observe d
with the perchlorate ion . By application of this fact, an d
by means of the salting out effect on cyanogen bromide it
has been possible to separate, at least with a certain approx -
imation, the effect due to the complex formation of iodine
cyanide with the anion in question and the salting out effect .
The following complexity constants have been estimated :
[ICNBr] - 0.65
-
'
[ICNC1] -0 - 39,
[ICNNO ;i ]
- 0.14 .[ICN] • [Br-] [IGN] • [Cr] [ICN] • [NO3-]
Here the brackets indicate the activity of the substances .

Studies on Halogen-cyanides H .
37
Finally the structure of the cyanogen bromide and th e
iodine cyanide molecules has been discussed .
A part of this work has been made in the Jones Chemical
Laboratory of Chicago University, and it is a dear duty to
express my thanks to the Head of the Department, Professor ,
Dr. J . STIEGLITZ, for his interest and the readiness wit h
which all I needed was placed to my disposal .
The other part of this work has been made in the De-
partment of Chemistry for Chemical Engineers of the Roya l
Polytechnic Institute, Copenhagen . I wish to thank the Head
of the Department Professor, Dr. J. A . CHRISTIANSEN fo r
his kind interest.
The author is also much indebted to the Carlsber g
Foundation for a grant, which made it possible to continu e
the investigation .May 1935 .
F erdig fra Trykkeriet den 8 . Oktober 1936 .