Embed Size (px)
Citation preview
Int. Journal of Economics and Management 11 (S3) : 847 – 869 (2017)
IJEMInternational Journal of Economics and Management
Journal homepage: http://www.econ.upm.edu.my/ijem
847
*Corresponding author: [email protected]
MAZIAR GHASEMIa AND NAZRUL HISYAM AB RAZAKb*
aPutra business School, Universiti Putra Malaysia, 43400 UPM, Serdang, Selangor, Malaysia.
bDepartment of Accounting and Finance, Faculty of Economics and Management, Universiti Putra Malaysia, 43400 UPM, Serdang, Selangor, Malaysia.
ABSTRACT
This study examines factors affecting a firm’s profitability, such as liquidity, firm size, lagged profitability, growth, debt, and lagged debt, among firms listed in the ACE market of Bursa Malaysia. The sample in this study comprises 60 listed companies for the period 2009-2013. Two proxies for profitability, namely ROA and ROE, were examined using static and dynamic panel model estimators. The findings of the static panel models revealed that liquidity and size have positive significant effects on ROA, while the effects of growth and debt were negatively significant. Also, firm size and sales growth had significant effects on ROE. The findings obtained from the System Generalized Method of Moments system (GMM-SYS) indicated that sales growth and leverage had negative and significant effects on ROA and ROE, while firm size was significantly and positively related to profitability. The lagged leverage factor had an insignificant relationship with profitability. However, liquidity had a significant negative influence on ROA, but the effect of liquidity on ROE was insignificant. Finally, persistent profitability was observed over time for both proxies. The findings of this study provided consideration for the capital market investors to monitor the factors related to profitability in the firms listed on the ACE market.
Keywords: ACE market, profitability, persistent profitability, lagged leverage, static panel model, system generalized method of moments
JEL Classification: F65, G32, O16
Determinants of Profitability in ACE Market Bursa Malaysia: Evidence from Panel Models
International Journal of Economics and Management
848
INTRODUCTION
According to Lu and Beamish (2001), performance itself is rather a “black box”, given its various goals and motivations. The difficulty of performance framework is also stated by Lumpkin and Dess (1996), who argue that performance is multidimensional in character, and as such, various measures of performance should be considered. Thus, the level of performance a company reaches is a function of the effectiveness and efficiency of the proceedings it undertakes (Neely et al., 2005). Firm profitability is generally regarded as an important precondition for long-term firm survival and success (Yazdanfar, 2013). The issue of which factors determine a firm’s profitability is one of the central subjects of interest among practitioners and researchers, counting investors, managers, and debt holders. In spite of the increasing body of research focusing on the factors related to company profitability, this issue remains an open question in the empirical literature. The current study focuses on the profitability of access, certainty, and efficiency (ACE) market firms in Bursa Malaysia. In August 2009, MESDAQ (under Bursa Malaysia) was relaunched as the ACE market, which consisted of firms operating in telecommunications, advanced electronics, automation manufacturing systems, information technology, healthcare, biotechnology and genetic engineering, energy, aerospace, advanced material, and other fields of emerging technologies (Mohd Saleh et al., 2009). The objective of the reorganization is to facilitate efficient access to investments and capital as well as to transform Bursa Malaysia into an extra absorbing platform for foreign and Malaysian firms (Mohd Saleh et al., 2009). While the main market includes established firms with a strong case history, the ACE market facilitates the registering of rising firms that have excellent growth potential (Council, 2015). No minimum prerequisite is set for the track record, size, and operating history of firms as well as on the issue of the price. However, the ACE market (under Bursa Malaysia) has not demonstrate fine performance for an extended period in terms of the number of listed firms and market capitalization (Shinozaki, 2014). In addition, the listed firms on the ACE market are more involved with financial fraud activities and civil suits compared to other listed firms on the main market (Sulong et al., 2013). However, there are some reasonable grounds explained to defend the firms’ weak performances in the ACE market related to the nature of this market, in which the firms’ nature of the ACE market is enumerated to be high in risk and too speculative; for instance, a biotechnology firm may have long gestation periods. If it can produce something, the approval process of regulation can cause a long delay in the goods coming to the market. Therefore, in some cases, short-time financial difficulties do not mean that the firm is not a good potential nominee for investment.
Since the ACE market is officially the most important market that allows medium-and small-sized companies and entrepreneurs to try and inject more capital into their companies, resulting in development and hence encouraging more innovative products, development, and growth in the economy, this market provides better transparency in the market for investors. Therefore, studying the factors which are determinants of profitability in the ACE market can provide market participants better insight into the companies which are listed in this market.
Most empirical studies have investigated firm profitability in the main market of Bursa Malaysia based on financial factors. However, the study of financial determinants of profitability among ACE firms in particular has been somewhat neglected. Considering the nature of the ACE
Determinants of Profitability in ACE Market panel Models
849
market, performance and the determinant factors of profitability might differ from the listed firms under the main market. Therefore, the present study particularly explores the financial factors that influence the profitability of listed firms in the ACE market. To the best of our knowledge, this is the first study that investigates the financial determinants of profitability in the ACE market of Bursa Malaysia. Also, this study is the first one that investigates the persistence of performance in the ACE market. Methodologically, in estimating the relationship between the firms’ profitability in the ACE market and its determinants, dynamic and static panel estimators are used. This study focuses on the determinants that are prominent based on the existing theories and subjects of previous empirical studies, such as liquidity, firm size, sales growth, leverage, and lagged leverage. Also, this study investigates persistent profitability in the ACE market. Results of the static and dynamic models indicated that all of the variables have significant effects on profitability, except for lagged leverage. The rest of this study is arranged as follows: Section II presents findings from the determinant literature and their dynamics according to theoretical and empirical studies of profitability. Section III explains the data, research methodology, and estimation methods applied to analyze and evaluate the factors of profitability. Section IV provides the empirical results and analysis, and Section V concludes the findings of this study.
HYPOTHESIS DEVELOPMENT:
This section presents the possible relationships between the most important financial explanatory variables and the profitability of the ACE market of Bursa Malaysia.
Current and lagged leverage
The capital structure theory and its relation to companies’ performance has been a puzzling matter in the corporate finance literature. According to the trade-off theory, optimal capital structure can be determined by balancing the different benefits and costs associated with debt financing. High leverage can also enhance a firm’s performance by mitigating conflicts between shareholders and managers concerning the free cash flow (Jensen, 1986), optimal investment strategy (Myers, 1977), and the amount of risk to be undertaken (Jensen and Meckling, 1976). A number of studies have provided empirical evidence supporting this positive relationship between debt level and firm performance (Berger and Bonaccorsi di Patti, 2006; Gleason et al., 2000; Hadlock and James, 2002; Roden and Lewellen, 1995; Taub, 1975). Moreover, by using multiple regression in the manufacturing industry of the Indonesian Stock market, Martani and Mulyono (2009) identified that the debt-to-equity ratio has a positive correlation with stock return, but it is not statistically significant. The second theory of capital structure is the pecking-order theory (POT), developed by Myers (1984). Managers prefer financing new investments through internal sources (i.e. retained earnings) at first, and if this resource is not sufficient, the managers then search for external sources from debt secondly and equity last. Thus, according to the POT, a company that is profitable and thus generates more earnings to be retained has more probability to apply less debt in its capital structure compared to a company that does not generate high earnings, since it can finance its investment opportunities
International Journal of Economics and Management
850
with its retained earnings. Therefore, managers who expect a high level of profitability have fewer tendencies to put the company in debt. Consequently, a negative relationship can be expected between the level of debt and the company’s performance. A number of studies have provided empirical evidence supporting this negative relationship between debt level and firm performance (Booth et al., 2001; Fama and French, 2002; Friend and Lang, 1988; Hung et al., 2002; Kester, 1986; Rajan and Zingales, 1995; Titman and Wessels, 1988; Wald, 1999; Yu et al., 2007). In addition, Zeitun and Tian (2007) examined the relationship between the capital structure and performance of Jordanian firms, showing that debt level is negatively related to performance (both the accounting and market measures). Abor (2007) also investigated the relationship between debt policy and the performance of medium- and small-sized companies in South African countries and reported that capital structure, particularly long-term and total debt level, is negatively associated with firm performance (both the accounting and market measures). Furthermore, Mahmood and Zakaria (2007) examined the profitability and capital structure among property developers and constructors in emerging markets in Malaysia. Using the sample of 25 property companies and 20 construction companies for a period of eight years, their results from the regression analysis indicated that capital gearing was negatively related to net profit margins and price earnings ratio for both property and construction sectors. Cheng (2009) investigated the relative impacts of equity and debt financing on the operating performance. The findings of his study indicated that, in addition to high cash flow company, debt finance had a significantly negative outcome for operating performance. Similarly, Krivogorsky et al. (2009) found a negative association between debt to equity and performance. This finding was also consistent with that of Ebaid (2009), who found that short-term and total debt had negatively affected companies’ performance as measured by ROA. Al-Matari et al. (2012) also mentioned that the effect of leverage on company performance was negative and significant at different levels of performance among the non-financial listed firms in the Kuwaiti stock market. Moreover, Sulong et al. (2013) investigated the relationship between some corporate governance mechanisms with performance during 2006 to 2008 in the MESDAQ market (origin of ACE market). They also showed a negative relationship between leverage and Tobin’s q.
To reduce the probability of reverse causality between company profitability and leverage, leverage can also be evaluated through a prior lagged value (Liargovas and Skandalis, 2009). This lagged value is considered a signal of the effect from present leverage to future profit. Moreover, reliance on debt finance might reduce the investment opportunities available for firms. Thus, there should exist a negative relationship between the use of debt financing as a funding source and the profitability of the future investment projects. For example, Fu et al. (2002) reported a negative effect of lagged debt on profitability. Alternatively, it can be argued that a company with relatively less debt represents lesser financial risks to stakeholders than a company with more borrowed capital. A higher leveraged company bears greater bankruptcy hazard and needs to compensate equity holders with higher profit. The results of the study by Liargovas and Skandalis (2009) in the Athens stock exchange and those of Stierwald (2009) among Australian firms are consistent with the positive influence of lagged debt on profitability.
The main aim of this study is to enable firms registered in the ACE market to reach better financing sources. This means that these firms have suitable potential for growth if they can
Determinants of Profitability in ACE Market panel Models
851
prepare the required capital for investing in new projects. Moreover, reaching achievement upon investing in new and high-tech products requires a long period of time, but these companies usually must pay back some parts of their loans before they can gain the benefits from these projects. It can be supposed that current debt and past debt have different effects on the firm profitability in this market. Therefore, the following two hypotheses can be developed.
Hypothesis 1: In the ACE markets, current leverage has a significant negative effect on firm profitability.
Hypothesis 2: In the ACE markets, past leverage has a significant positive effect on firm profitability.
Firm Size
Firm size had a significant impact on performance; large firms have greater visibility and attract more attention from stakeholders, which leads to greater control over resources, promotional opportunities resulting in the attraction and retention of better employees, net economies of scale, better production, buying new technology (Porter, 2010), and so forth.
There is a positive relationship between the average company size and productivity growth or growth of company performance (Pagano and Schivardi, 2003; Rajan and Zingales, 1995). Zeitun and Tian (2007) also argued that company size has a positive effect on a company’s performance, as large companies face small bankruptcy costs. Moreover, Kajola (2008) and Onaolapo and Kajola (2010) discovered a positive relationship between size and firm performance. According to the results of the study by Babalola (2013), the size of the firm, in terms of both total assets and total sales, positively impacts the profitability of manufacturing firms over the period of 2000-2009 in Nigeria. On the other hand, according to Forbes (2002), larger companies usually have poorer performance compared to smaller companies. The result of a study by Beck et al. (2005) showed that small firms get the most benefit from improvements in firm performance. The results of the study by Jermias (2008) were consistent with the aforementioned negative relation. Company size may also influence the process and time for a creative idea generated by the employee to be received and gain attention by the managers. As a company increases in size scale, consequently, managerial attention gets spread across more groups of employees (Kahneman, 1973). A large company also has more competing demand and complex operations, and these additional constraints reduce the managerial attention value that is available for distinguishing the creative ideas (Ocasio, 1997). For instance, Gong et al. (2013) investigated the 148 high-technology firms in China. They suggested that firm size negatively moderates the relation between creativity and company performance. However, Ammar et al. (2003) found that, for an electrical contractor business, the profitability of a firm went down as it increased to more than $50 million in sales. This means that there is an optimal size of the firm linked to maximum performance. Furthermore, Maffini Gomes et al. (2009) stated that the differences were not significant regarding performance between large and small firms.
Commonly firms that are listed in the ACE market have new ideas and advanced products, hence they have suitable potential for growth if they can enlarge enough to reach the economical scale, and then they generate more and more profits. As such, our third hypothesis is formulated thus:
International Journal of Economics and Management
852
Hypothesis 3: In ACE markets, firm size has a significant positive effect on firm profitability.
Sales Growth
There is a widespread presumption about a close linkage between company growth and performance. However, most of the past studies on company profitability and enlargement have been performed without mutual relations. Agency theorists disserted that sales growth does not always lead to increased returns to shareholders. The leveraged buyout studies made these arguments more conflicted (Jensen, 1993). They depended on three premises (Jensen, 1986). First, the manager tries to maximize his own benefits relatively more than the stockholders’ interests. This follows the regular economic supposition under which persons attempt to maximize their utility. Second, company sales growth contributes to managerial wealth. Jensen (1986) argued that the firm manager has the incentive to cause his firm to grow further than its optimal size. Growth raises the manager’s power by raising the resources under his or her control. Sales growth is also related to increases in managers’ remuneration, because changes in remuneration are positively associated with growth in sales (Murphy, 1985). Third, two corporate situations verify whether managers can pursue sales growth at the expense of shareholders’ wealth. Cowling (2004) found evidence that growth has a positive impact on profitability. Park and Jang (2010) investigated panel unit root tests on firm growth and profitability separately and then made appropriate models using dynamic panel system GMM estimators. Through analyzing these models, they found that the current year and past year of growth rate had a negative effect on the current year’s profitability.
In the case of the listed firms in the ACE market, since previous studies presented no acceptable performance among most of the firms (Shinozaki, 2014) and also more fraud cases are presented among ACE firms compared to the firms in the main market (Sulong et al., 2013), it may be possible that sales growth has no beneficial effect on firm profitability. The following hypothesis is thus offered:
Hypothesis 4: In the ACE markets, sales growth has a significant negative effect on firm profitability.
Liquidity
It is claimed that greater liquidity results in higher networking capital investment in the firms; that is, on the one hand, a higher level of capital causes greater cost, but on the other hand, it lowers the ROE (Smith, 1980). In a situation like this, by monitoring the performance of the company, high liquidity could be interpreted as a negative signal/indicator by investors. Conversely, when there is greater liquidity, higher flexibility is observed in the productions and sales of the company, which results in additional income for the business (company). Otherwise, a liquid company is flexible; it can meet its commitments and offer long-term payments. In addition, the company is more competitive and does not squeeze its payables, receivables, or other current assets (Bolek and Wolski, 2012). The relationship between liquidity and profitability in Saudi companies was empirically examined by Eljelly (2004), who found a significant relationship between the profitability of the firm and its level of liquidity by
Determinants of Profitability in ACE Market panel Models
853
performing correlation and regression analyses. Furthermore, the relation between profitability and liquidity in Pakistani firms over a period of 6 years was investigated by Raheman and Nasr (2007), and the results showed the inverse relationship between the two variables. Zainudin (2006) reported a moderate and positive association/relation between profitability and liquidity. Saleem and Rehman (2011) also found a positive influence of the liquid ratio on ROA, while the relationship was not significant between ROI and ROE; the results also indicated that ROE was not significantly affected by the three ratios (i.e., quick ratio, liquid ratio and current ration), whereas ROI was greatly influenced by quick ratios, liquid ratios, and current ratios in Pakistan. The results of a study by Ben-Caleb et al. (2013) revealed that the liquid ratio and current ratio were positively related to profitability, while in Nigeria, profitability of manufacturing companies was negatively associated with cash conversion period. In addition, 31 manufacturing firms in Sri Lanka were studied by Niresh (2012), and the results showed no significant relationship between profitability and liquidity. The findings of a study done by Ongore and Kusa (2013) showed that liquidity was an insignificant factor for profitability among commercial banks in Kenya.
By considering the capital investment necessity among firms in the ACE market, the increasing liquidity can be interfering as a bad strategy for firms, because they use their financial capacity in the current asset instead of using them in the long-term investment. Therefore, the following hypothesis can be presented:
Hypothesis 5: In the ACE markets, liquidity has a significant negative impact on firm profitability.
Past performance
Current and lagged profitability are somehow associated, because the lagged profitability shows, for example, more resources in the market share and expanded access to liquidity. Hence, it is expected that the lagged profitability will have a positive influence on the current profitability. The competitive dynamics of the market affects the durability of company profitability. Mueller (1986) concluded that durability in company profitability is observed over time. In a study of Turkish firms, Yurtoglu (2004) analyzed profit persistence and its determinants. He used a first-order autoregressive model to estimate the persistence coefficient of the firm’s profits, and then used a simple regression to analyze the determinants of long-term profit differences in different firms. He found that industry growth and industry exporting intensity had a marginal influence on the persistence of profits. Tarziján and Eyleerts (2010) econometrically determined the persistence of the profitability for 5 Latin American countries and also the USA. Their results indicated that most of the developing countries of Latin America had a persistent coefficient lower than that of the only developed country in the sample (the United States). Suarez et al. (2013) investigated prepackaged software products from listed firms over the period of 1990-2006. Lagged operating margin and lagged ROE had a significant and positive effect on the operating margin and ROE, respectively. However, the findings did not indicate a significant relationship between ROA and lagged ROA. Pattitoni et al. (2014) compiled a sample of all private companies from the EU-15 region during 2004 to 2011. The results showed that the Lagged ROA was highly significant in all dynamic estimators; therefore, profitability tended
International Journal of Economics and Management
854
to persist from year to year. Moreover, because of the significant effect of the second lag of profitability, it can be inferred that the competition level among listed firms in EU-15 countries was still not tight enough to decrease the additional profits in a small period of time. Many other papers have reported a significant relationship between lagged and current profitability throughout different countries (Ioanni Schiniotakis, 2012; Margaretha and Supartika, 2016; McDonald, 1999; Nunes et al., 2009; Stierwald, 2009; Yazdanfar, 2013).
Considering the activities of the firms in the ACE market, most companies are high-tech firms that need a huge amount of long-term investment and are operating in new areas of production and services in which their outputs are mostly new and unique. If these pioneer companies can be achieved, they can continue profit generation because of the presence of fewer competitors. Therefore, the following hypothesis can be assumed:
Hypothesis 6: In the ACE markets, past profitability has a significant positive effect on the present firm profitability.
DATA AND METHODOLOGY
Data and sample
The sample data consisted of the firms listed on the ACE market of Bursa Malaysia. The sample used in this study covered a five-year period (from 2009 to 2013). Because the establishing year of ACE market was 2009 and in light of the capital market recovery from the financial crisis of 2008, the year of 2009 was chosen as the first year. The data sources for the investigation were from DATASTREAM and OSIRIS databases. Excluded from the sample were all firms that ceased to be quoted in the stock market prior to 2013 and those that were listed in the stock market after 2009. A total of 109 companies were listed on the ACE market in 2013. Only 60 firms were qualified for inclusion in the sample based on the continuity and accessibility of published financial statements from 2009 to 2013. Variables used for the analysis included profitability, leverage, liquidity, growth, firm size, lagged leverage, and lagged profitability. Table 1 displays the variable descriptions and measurements. The ROA and ROE are the profitability ratios in accounting statements that reflect the shareholders’ possessions. The cause of preference of the ROE ratio was the ability of this ratio to indicate the profitability of one industry to the other and was comparable between one firm to the other (Helfert, 2001). In addition, ROE is one of the most accepted proxies in the international business research and can reflect the productivity of the capital employed (Morsy and Rwegasira, 2010). According to Cornett et al. (2008), ROA is the greatest measure for the current performance, while ROE is more suitable to measure the executives’ ability. Furthermore, the ROA measure is widely accepted in management research and is not affected by financing decisions (e.g., return on equity) (Gomez-Mejia and Wiseman, 1997). ROA also measures the efficiency with which a company produces its output and is therefore particularly well suited for the examinations of synergies and the actual performance in business operations (Chan Kim et al., 1989).
Determinants of Profitability in ACE Market panel Models
855
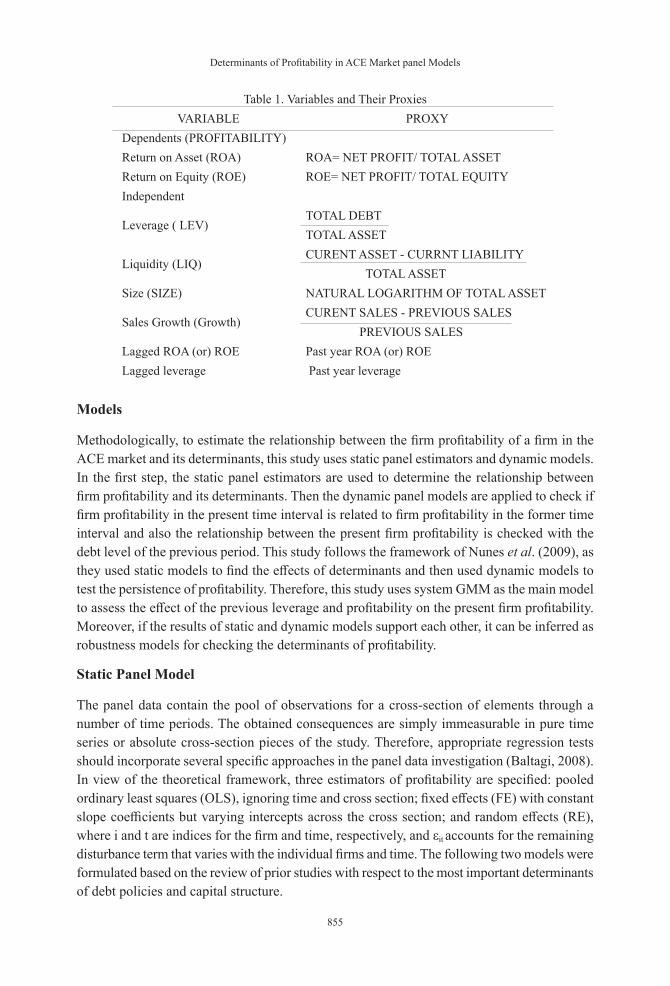
Table 1. Variables and Their ProxiesVARIABLE PROXY
Dependents (PROFITABILITY)Return on Asset (ROA) ROA= NET PROFIT/ TOTAL ASSETReturn on Equity (ROE) ROE= NET PROFIT/ TOTAL EQUITYIndependent
Leverage ( LEV)TOTAL DEBTTOTAL ASSET
Liquidity (LIQ)CURENT ASSET - CURRNT LIABILITY TOTAL ASSET
Size (SIZE) NATURAL LOGARITHM OF TOTAL ASSET
Sales Growth (Growth)CURENT SALES - PREVIOUS SALES PREVIOUS SALES
Lagged ROA (or) ROE Past year ROA (or) ROELagged leverage Past year leverage
Models
Methodologically, to estimate the relationship between the firm profitability of a firm in the ACE market and its determinants, this study uses static panel estimators and dynamic models. In the first step, the static panel estimators are used to determine the relationship between firm profitability and its determinants. Then the dynamic panel models are applied to check if firm profitability in the present time interval is related to firm profitability in the former time interval and also the relationship between the present firm profitability is checked with the debt level of the previous period. This study follows the framework of Nunes et al. (2009), as they used static models to find the effects of determinants and then used dynamic models to test the persistence of profitability. Therefore, this study uses system GMM as the main model to assess the effect of the previous leverage and profitability on the present firm profitability. Moreover, if the results of static and dynamic models support each other, it can be inferred as robustness models for checking the determinants of profitability.
Static Panel Model
The panel data contain the pool of observations for a cross-section of elements through a number of time periods. The obtained consequences are simply immeasurable in pure time series or absolute cross-section pieces of the study. Therefore, appropriate regression tests should incorporate several specific approaches in the panel data investigation (Baltagi, 2008). In view of the theoretical framework, three estimators of profitability are specified: pooled ordinary least squares (OLS), ignoring time and cross section; fixed effects (FE) with constant slope coefficients but varying intercepts across the cross section; and random effects (RE), where i and t are indices for the firm and time, respectively, and εit accounts for the remaining disturbance term that varies with the individual firms and time. The following two models were formulated based on the review of prior studies with respect to the most important determinants of debt policies and capital structure.
International Journal of Economics and Management
856
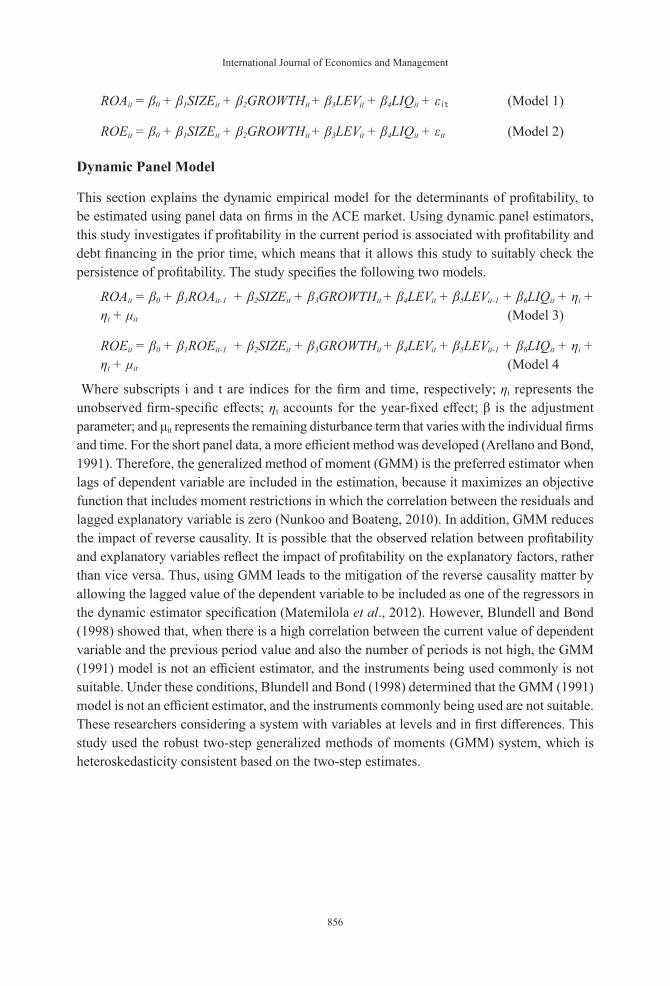
ROAit = β0 + β1SIZEit + β2GROWTHit + β3LEVit + β4LIQit + εit (Model 1)
ROEit = β0 + β1SIZEit + β2GROWTHit + β3LEVit + β4LIQit + εit (Model 2)
Dynamic Panel Model
This section explains the dynamic empirical model for the determinants of profitability, to be estimated using panel data on firms in the ACE market. Using dynamic panel estimators, this study investigates if profitability in the current period is associated with profitability and debt financing in the prior time, which means that it allows this study to suitably check the persistence of profitability. The study specifies the following two models.
ROAit = β0 + β1ROAit-1 + β2SIZEit + β3GROWTHit + β4LEVit + β5LEVit-1 + β6LIQit + ηi + ηt + μit (Model 3)
ROEit = β0 + β1ROEit-1 + β2SIZEit + β3GROWTHit + β4LEVit + β5LEVit-1 + β6LIQit + ηi + ηt + μit (Model 4
Where subscripts i and t are indices for the firm and time, respectively; ηi represents the unobserved firm-specific effects; ηt accounts for the year-fixed effect; β is the adjustment parameter; and μit represents the remaining disturbance term that varies with the individual firms and time. For the short panel data, a more efficient method was developed (Arellano and Bond, 1991). Therefore, the generalized method of moment (GMM) is the preferred estimator when lags of dependent variable are included in the estimation, because it maximizes an objective function that includes moment restrictions in which the correlation between the residuals and lagged explanatory variable is zero (Nunkoo and Boateng, 2010). In addition, GMM reduces the impact of reverse causality. It is possible that the observed relation between profitability and explanatory variables reflect the impact of profitability on the explanatory factors, rather than vice versa. Thus, using GMM leads to the mitigation of the reverse causality matter by allowing the lagged value of the dependent variable to be included as one of the regressors in the dynamic estimator specification (Matemilola et al., 2012). However, Blundell and Bond (1998) showed that, when there is a high correlation between the current value of dependent variable and the previous period value and also the number of periods is not high, the GMM (1991) model is not an efficient estimator, and the instruments being used commonly is not suitable. Under these conditions, Blundell and Bond (1998) determined that the GMM (1991) model is not an efficient estimator, and the instruments commonly being used are not suitable. These researchers considering a system with variables at levels and in first differences. This study used the robust two-step generalized methods of moments (GMM) system, which is heteroskedasticity consistent based on the two-step estimates.
Determinants of Profitability in ACE Market panel Models
857
EMPIRICAL RESULTS
Descriptive Statistics
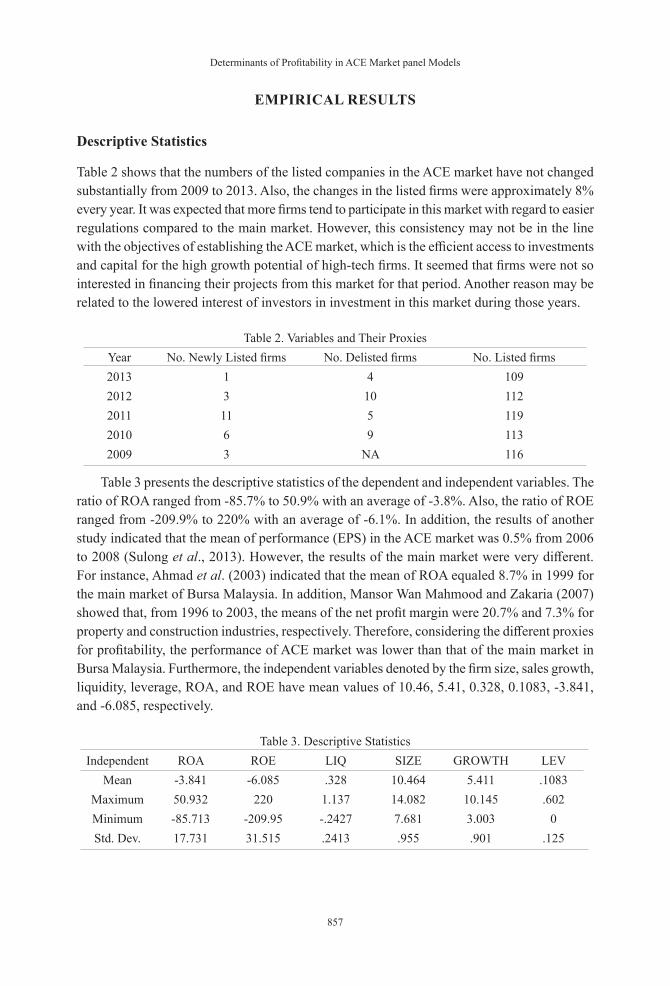
Table 2 shows that the numbers of the listed companies in the ACE market have not changed substantially from 2009 to 2013. Also, the changes in the listed firms were approximately 8% every year. It was expected that more firms tend to participate in this market with regard to easier regulations compared to the main market. However, this consistency may not be in the line with the objectives of establishing the ACE market, which is the efficient access to investments and capital for the high growth potential of high-tech firms. It seemed that firms were not so interested in financing their projects from this market for that period. Another reason may be related to the lowered interest of investors in investment in this market during those years.
Table 2. Variables and Their ProxiesYear No. Newly Listed firms No. Delisted firms No. Listed firms2013 1 4 1092012 3 10 1122011 11 5 1192010 6 9 1132009 3 NA 116
Table 3 presents the descriptive statistics of the dependent and independent variables. The ratio of ROA ranged from -85.7% to 50.9% with an average of -3.8%. Also, the ratio of ROE ranged from -209.9% to 220% with an average of -6.1%. In addition, the results of another study indicated that the mean of performance (EPS) in the ACE market was 0.5% from 2006 to 2008 (Sulong et al., 2013). However, the results of the main market were very different. For instance, Ahmad et al. (2003) indicated that the mean of ROA equaled 8.7% in 1999 for the main market of Bursa Malaysia. In addition, Mansor Wan Mahmood and Zakaria (2007) showed that, from 1996 to 2003, the means of the net profit margin were 20.7% and 7.3% for property and construction industries, respectively. Therefore, considering the different proxies for profitability, the performance of ACE market was lower than that of the main market in Bursa Malaysia. Furthermore, the independent variables denoted by the firm size, sales growth, liquidity, leverage, ROA, and ROE have mean values of 10.46, 5.41, 0.328, 0.1083, -3.841, and -6.085, respectively.
Table 3. Descriptive StatisticsIndependent ROA ROE LIQ SIZE GROWTH LEV
Mean -3.841 -6.085 .328 10.464 5.411 .1083Maximum 50.932 220 1.137 14.082 10.145 .602Minimum -85.713 -209.95 -.2427 7.681 3.003 0Std. Dev. 17.731 31.515 .2413 .955 .901 .125
International Journal of Economics and Management
858
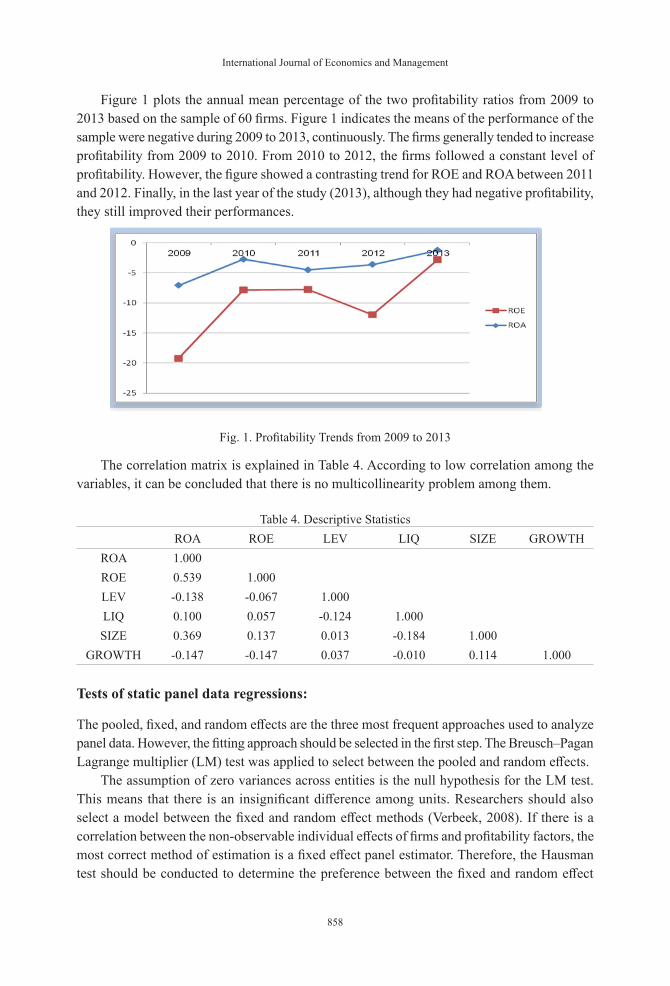
Figure 1 plots the annual mean percentage of the two profitability ratios from 2009 to 2013 based on the sample of 60 firms. Figure 1 indicates the means of the performance of the sample were negative during 2009 to 2013, continuously. The firms generally tended to increase profitability from 2009 to 2010. From 2010 to 2012, the firms followed a constant level of profitability. However, the figure showed a contrasting trend for ROE and ROA between 2011 and 2012. Finally, in the last year of the study (2013), although they had negative profitability, they still improved their performances.
Fig. 1. Profitability Trends from 2009 to 2013
The correlation matrix is explained in Table 4. According to low correlation among the variables, it can be concluded that there is no multicollinearity problem among them.
Table 4. Descriptive StatisticsROA ROE LEV LIQ SIZE GROWTH
ROA 1.000ROE 0.539 1.000LEV -0.138 -0.067 1.000LIQ 0.100 0.057 -0.124 1.000SIZE 0.369 0.137 0.013 -0.184 1.000
GROWTH -0.147 -0.147 0.037 -0.010 0.114 1.000
Tests of static panel data regressions:
The pooled, fixed, and random effects are the three most frequent approaches used to analyze panel data. However, the fitting approach should be selected in the first step. The Breusch–Pagan Lagrange multiplier (LM) test was applied to select between the pooled and random effects.
The assumption of zero variances across entities is the null hypothesis for the LM test. This means that there is an insignificant difference among units. Researchers should also select a model between the fixed and random effect methods (Verbeek, 2008). If there is a correlation between the non-observable individual effects of firms and profitability factors, the most correct method of estimation is a fixed effect panel estimator. Therefore, the Hausman test should be conducted to determine the preference between the fixed and random effect
Determinants of Profitability in ACE Market panel Models
859
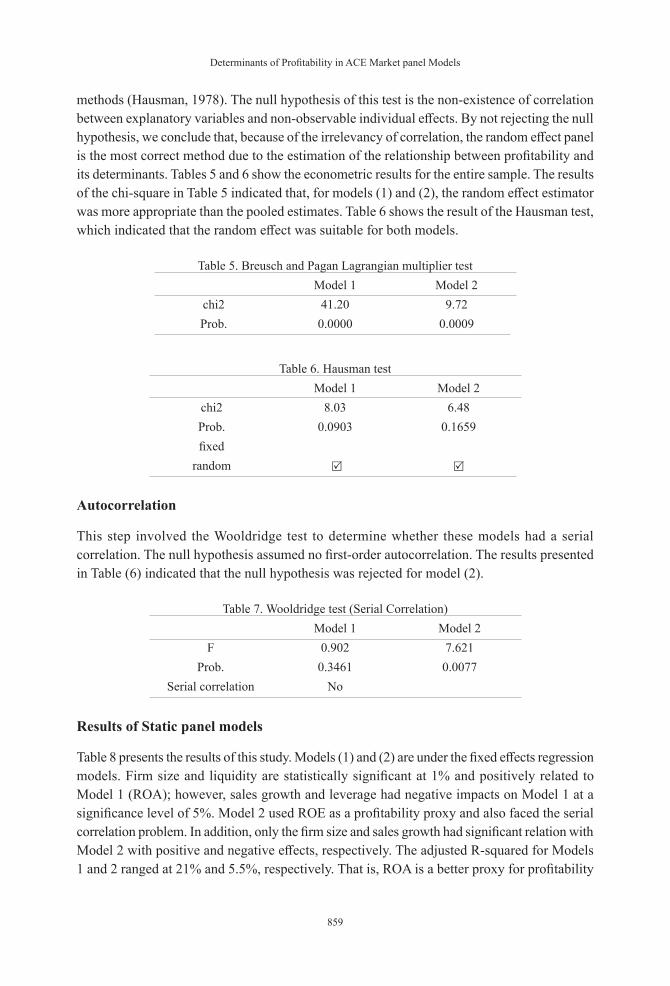
methods (Hausman, 1978). The null hypothesis of this test is the non-existence of correlation between explanatory variables and non-observable individual effects. By not rejecting the null hypothesis, we conclude that, because of the irrelevancy of correlation, the random effect panel is the most correct method due to the estimation of the relationship between profitability and its determinants. Tables 5 and 6 show the econometric results for the entire sample. The results of the chi-square in Table 5 indicated that, for models (1) and (2), the random effect estimator was more appropriate than the pooled estimates. Table 6 shows the result of the Hausman test, which indicated that the random effect was suitable for both models.
Table 5. Breusch and Pagan Lagrangian multiplier testModel 1 Model 2
chi2 41.20 9.72Prob. 0.0000 0.0009
Table 6. Hausman testModel 1 Model 2
chi2 8.03 6.48Prob. 0.0903 0.1659fixed
random
Autocorrelation
This step involved the Wooldridge test to determine whether these models had a serial correlation. The null hypothesis assumed no first-order autocorrelation. The results presented in Table (6) indicated that the null hypothesis was rejected for model (2).
Table 7. Wooldridge test (Serial Correlation)Model 1 Model 2
F 0.902 7.621Prob. 0.3461 0.0077
Serial correlation No
Results of Static panel models
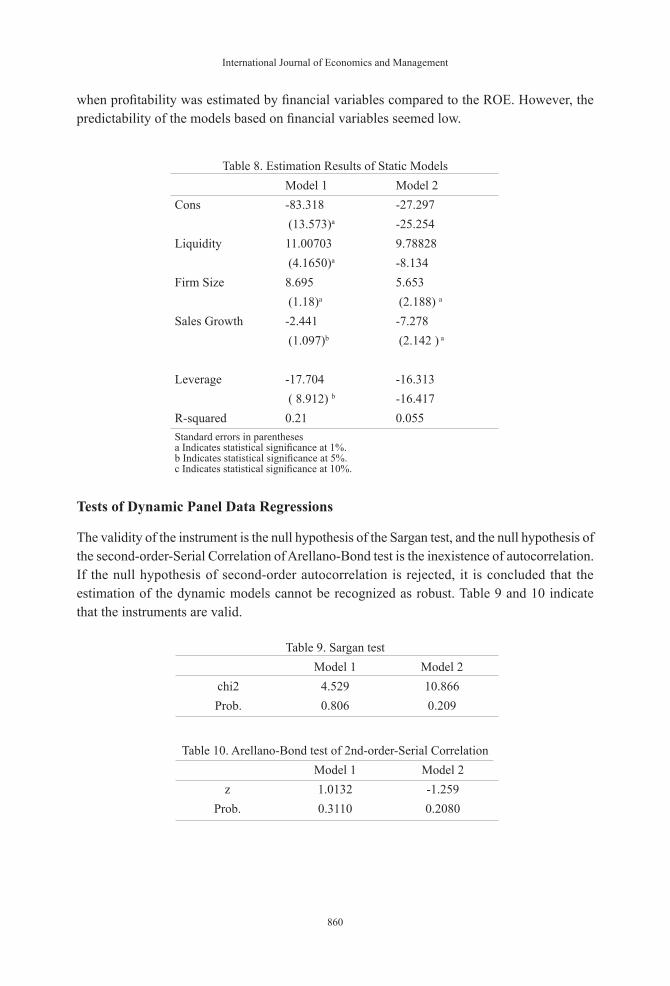
Table 8 presents the results of this study. Models (1) and (2) are under the fixed effects regression models. Firm size and liquidity are statistically significant at 1% and positively related to Model 1 (ROA); however, sales growth and leverage had negative impacts on Model 1 at a significance level of 5%. Model 2 used ROE as a profitability proxy and also faced the serial correlation problem. In addition, only the firm size and sales growth had significant relation with Model 2 with positive and negative effects, respectively. The adjusted R-squared for Models 1 and 2 ranged at 21% and 5.5%, respectively. That is, ROA is a better proxy for profitability
International Journal of Economics and Management
860
when profitability was estimated by financial variables compared to the ROE. However, the predictability of the models based on financial variables seemed low.
Table 8. Estimation Results of Static ModelsModel 1 Model 2
Cons -83.318 -27.297 (13.573)a -25.254
Liquidity 11.00703 9.78828 (4.1650)a -8.134
Firm Size 8.695 5.653 (1.18)a (2.188) a
Sales Growth -2.441 -7.278 (1.097)b (2.142 ) a
Leverage -17.704 -16.313 ( 8.912) b -16.417
R-squared 0.21 0.055Standard errors in parentheses a Indicates statistical significance at 1%. b Indicates statistical significance at 5%. c Indicates statistical significance at 10%.
Tests of Dynamic Panel Data Regressions
The validity of the instrument is the null hypothesis of the Sargan test, and the null hypothesis of the second-order-Serial Correlation of Arellano-Bond test is the inexistence of autocorrelation. If the null hypothesis of second-order autocorrelation is rejected, it is concluded that the estimation of the dynamic models cannot be recognized as robust. Table 9 and 10 indicate that the instruments are valid.
Table 9. Sargan test Model 1 Model 2
chi2 4.529 10.866Prob. 0.806 0.209
Table 10. Arellano-Bond test of 2nd-order-Serial CorrelationModel 1 Model 2
z 1.0132 -1.259Prob. 0.3110 0.2080
Determinants of Profitability in ACE Market panel Models
861
Results of Dynamic Panel Models
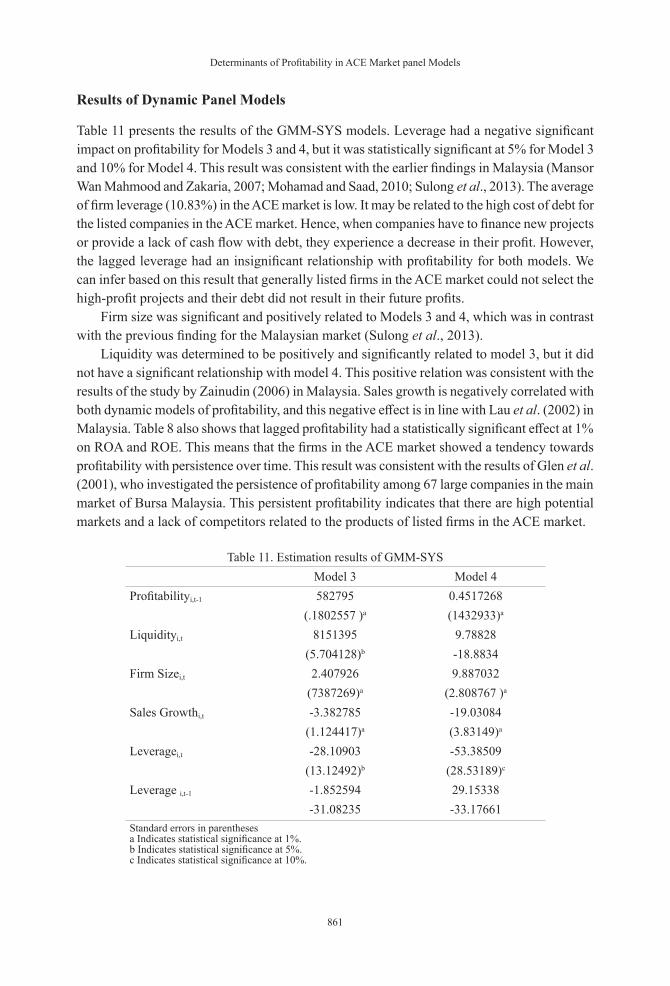
Table 11 presents the results of the GMM-SYS models. Leverage had a negative significant impact on profitability for Models 3 and 4, but it was statistically significant at 5% for Model 3 and 10% for Model 4. This result was consistent with the earlier findings in Malaysia (Mansor Wan Mahmood and Zakaria, 2007; Mohamad and Saad, 2010; Sulong et al., 2013). The average of firm leverage (10.83%) in the ACE market is low. It may be related to the high cost of debt for the listed companies in the ACE market. Hence, when companies have to finance new projects or provide a lack of cash flow with debt, they experience a decrease in their profit. However, the lagged leverage had an insignificant relationship with profitability for both models. We can infer based on this result that generally listed firms in the ACE market could not select the high-profit projects and their debt did not result in their future profits.
Firm size was significant and positively related to Models 3 and 4, which was in contrast with the previous finding for the Malaysian market (Sulong et al., 2013).
Liquidity was determined to be positively and significantly related to model 3, but it did not have a significant relationship with model 4. This positive relation was consistent with the results of the study by Zainudin (2006) in Malaysia. Sales growth is negatively correlated with both dynamic models of profitability, and this negative effect is in line with Lau et al. (2002) in Malaysia. Table 8 also shows that lagged profitability had a statistically significant effect at 1% on ROA and ROE. This means that the firms in the ACE market showed a tendency towards profitability with persistence over time. This result was consistent with the results of Glen et al. (2001), who investigated the persistence of profitability among 67 large companies in the main market of Bursa Malaysia. This persistent profitability indicates that there are high potential markets and a lack of competitors related to the products of listed firms in the ACE market.
Table 11. Estimation results of GMM-SYSModel 3 Model 4
Profitabilityi,t-1 582795 0.4517268(.1802557 )a (1432933)a
Liquidityi,t 8151395 9.78828(5.704128)b -18.8834
Firm Sizei,t 2.407926 9.887032(7387269)a (2.808767 )a
Sales Growthi,t -3.382785 -19.03084(1.124417)a (3.83149)a
Leveragei,t -28.10903 -53.38509(13.12492)b (28.53189)c
Leverage i,t-1 -1.852594 29.15338-31.08235 -33.17661
Standard errors in parentheses a Indicates statistical significance at 1%. b Indicates statistical significance at 5%. c Indicates statistical significance at 10%.
International Journal of Economics and Management
862
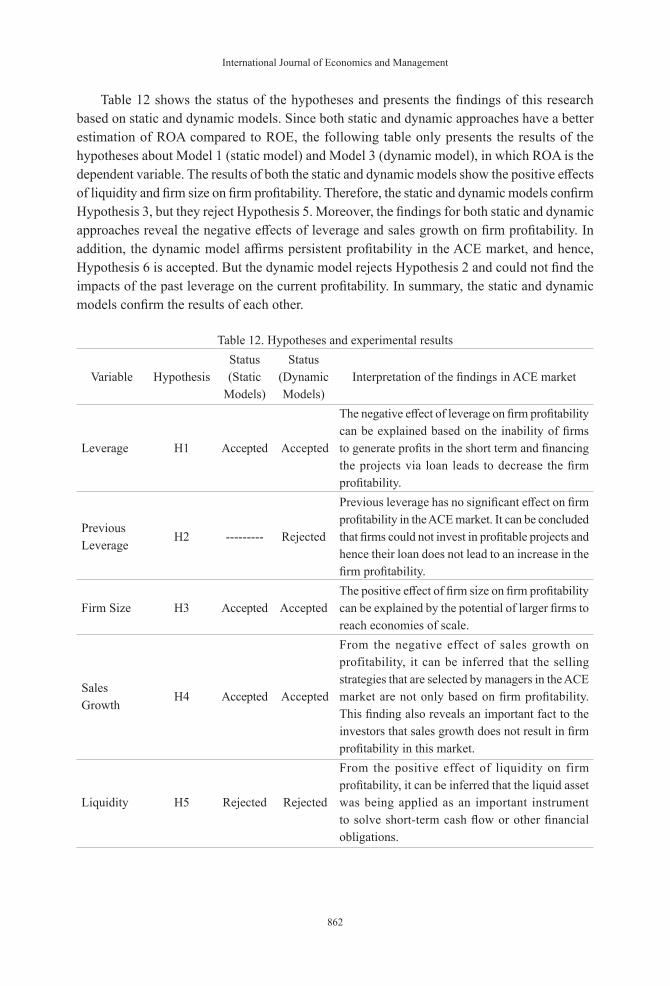
Table 12 shows the status of the hypotheses and presents the findings of this research based on static and dynamic models. Since both static and dynamic approaches have a better estimation of ROA compared to ROE, the following table only presents the results of the hypotheses about Model 1 (static model) and Model 3 (dynamic model), in which ROA is the dependent variable. The results of both the static and dynamic models show the positive effects of liquidity and firm size on firm profitability. Therefore, the static and dynamic models confirm Hypothesis 3, but they reject Hypothesis 5. Moreover, the findings for both static and dynamic approaches reveal the negative effects of leverage and sales growth on firm profitability. In addition, the dynamic model affirms persistent profitability in the ACE market, and hence, Hypothesis 6 is accepted. But the dynamic model rejects Hypothesis 2 and could not find the impacts of the past leverage on the current profitability. In summary, the static and dynamic models confirm the results of each other.
Table 12. Hypotheses and experimental results
Variable HypothesisStatus (Static
Models)
Status (Dynamic Models)
Interpretation of the findings in ACE market
Leverage H1 Accepted Accepted
The negative effect of leverage on firm profitability can be explained based on the inability of firms to generate profits in the short term and financing the projects via loan leads to decrease the firm profitability.
Previous Leverage
H2 --------- Rejected
Previous leverage has no significant effect on firm profitability in the ACE market. It can be concluded that firms could not invest in profitable projects and hence their loan does not lead to an increase in the firm profitability.
Firm Size H3 Accepted AcceptedThe positive effect of firm size on firm profitability can be explained by the potential of larger firms to reach economies of scale.
Sales Growth
H4 Accepted Accepted
From the negative effect of sales growth on profitability, it can be inferred that the selling strategies that are selected by managers in the ACE market are not only based on firm profitability. This finding also reveals an important fact to the investors that sales growth does not result in firm profitability in this market.
Liquidity H5 Rejected Rejected
From the positive effect of liquidity on firm profitability, it can be inferred that the liquid asset was being applied as an important instrument to solve short-term cash flow or other financial obligations.
Determinants of Profitability in ACE Market panel Models
863
Previous Profitability
H6 -------- Accepted
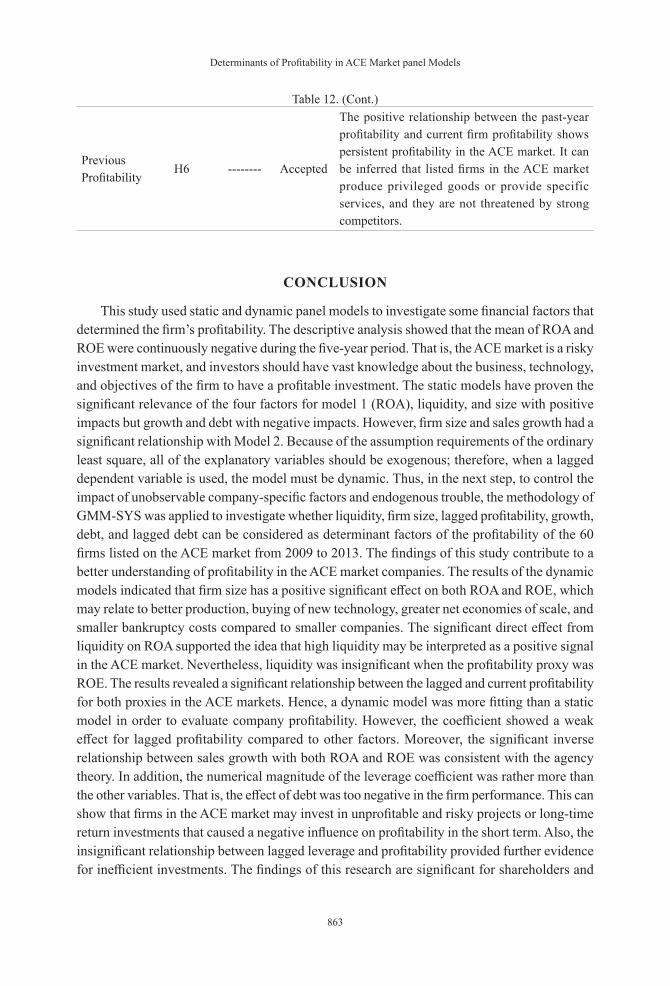
The positive relationship between the past-year profitability and current firm profitability shows persistent profitability in the ACE market. It can be inferred that listed firms in the ACE market produce privileged goods or provide specific services, and they are not threatened by strong competitors.
CONCLUSION
This study used static and dynamic panel models to investigate some financial factors that determined the firm’s profitability. The descriptive analysis showed that the mean of ROA and ROE were continuously negative during the five-year period. That is, the ACE market is a risky investment market, and investors should have vast knowledge about the business, technology, and objectives of the firm to have a profitable investment. The static models have proven the significant relevance of the four factors for model 1 (ROA), liquidity, and size with positive impacts but growth and debt with negative impacts. However, firm size and sales growth had a significant relationship with Model 2. Because of the assumption requirements of the ordinary least square, all of the explanatory variables should be exogenous; therefore, when a lagged dependent variable is used, the model must be dynamic. Thus, in the next step, to control the impact of unobservable company-specific factors and endogenous trouble, the methodology of GMM-SYS was applied to investigate whether liquidity, firm size, lagged profitability, growth, debt, and lagged debt can be considered as determinant factors of the profitability of the 60 firms listed on the ACE market from 2009 to 2013. The findings of this study contribute to a better understanding of profitability in the ACE market companies. The results of the dynamic models indicated that firm size has a positive significant effect on both ROA and ROE, which may relate to better production, buying of new technology, greater net economies of scale, and smaller bankruptcy costs compared to smaller companies. The significant direct effect from liquidity on ROA supported the idea that high liquidity may be interpreted as a positive signal in the ACE market. Nevertheless, liquidity was insignificant when the profitability proxy was ROE. The results revealed a significant relationship between the lagged and current profitability for both proxies in the ACE markets. Hence, a dynamic model was more fitting than a static model in order to evaluate company profitability. However, the coefficient showed a weak effect for lagged profitability compared to other factors. Moreover, the significant inverse relationship between sales growth with both ROA and ROE was consistent with the agency theory. In addition, the numerical magnitude of the leverage coefficient was rather more than the other variables. That is, the effect of debt was too negative in the firm performance. This can show that firms in the ACE market may invest in unprofitable and risky projects or long-time return investments that caused a negative influence on profitability in the short term. Also, the insignificant relationship between lagged leverage and profitability provided further evidence for inefficient investments. The findings of this research are significant for shareholders and
Table 12. (Cont.)
International Journal of Economics and Management
864
market participants. First of all, since this study investigated more than half of the listed firms and estimated the effect of most important financial factors in the firm profitability, it can thus provide reliable market insight into the financial factors of profitability in the ACE market. The positive/negative effect of liquidity/leverage on firm profitability reveals that asset liquidity is one of the most important and positive factors for firm profitability; however, increasing the debt in the capital structure leads to decreasing firm profitability. Therefore, investors should consider the debt and liquidity due to good investments. In addition, market participants should be informed about the probability of the negative aspects of sales growth in some listed firms and survey their sales strategies. In addition, the findings also show that firms which generate high profits in the previous financial period significantly achieve the task of continuing their gains in the present year. This study only investigated the influence of some financial factors on profitability in the ACE market; further studies can be conducted to investigate the other proxies for performance from qualitative and strategic points of view. It is suggested that a separate study clarify the factor considered to be the causal interrelation with profitability, such as the capital structure and liquidity to reach the optimum point of performance from a financial perspective. Conducting investigations on the effects of competition and innovation on the profitability can be another suggestion for the ACE market firms. Finally, this study suggests a qualitative survey that gathers the view of firms and investors about the performance of firms and the barriers and limitations to a better investment in the ACE market.
REFERENCES
Abor, J. (2007). Debt policy and performance of SMEs: evidence from Ghanaian and South African firms. Journal of Risk Finance, The, 8(4), 364-379.
Ahmad, Z., Hassan, S., and Mohammad, J. (2003). Determinants of environmental reporting in Malaysia. International Journal of Business Studies, 11(1), 69.
Al-Matari, E. M., Al-Swidi, A. K., Fadzil, F. H., and Al-Matari, Y. A. (2012). The Impact of board characteristics on Firm Performance: Evidence from Nonfinancial Listed Companies in Kuwaiti Stock Exchange. International Journal of Accounting and Financial Reporting, 2(2), Pages 310-332.
Ammar, A., Hanna, A. S., Nordheim, E. V., and Russell, J. S. (2003). Indicator variables model of firm’s size-profitability relationship of electrical contractors using financial and economic data. Journal of Construction Engineering and Management, 129(2), 192-197.
Arellano, M., and Bond, S. (1991). Some tests of specification for panel data: Monte Carlo evidence and an application to employment equations. The review of economic studies, 58(2), 277-297.
Babalola, Y. A. (2013). The Effect of Firm Size on Firms Profitability in Nigeria. Journal of Economics and Sustainable Development, 4(5), 90-94.
Baltagi, B. (2008). Econometric analysis of panel data (Vol. 1): John Wiley & Sons.
Beck, T., Demirgüç‐Kunt, A., and Maksimovic, V. (2005). Financial and legal constraints to growth: does firm size matter? The Journal of Finance, 60(1), 137-177.
Ben Caleb, E., Olubukunola, U., and Uwuigbe, U. (2013). Liquidity management and Profitability of manufacturing companies in Nigeria. Journal of Business and Management, 9(1), 13-21.
Determinants of Profitability in ACE Market panel Models
865
Berger, A. N., and Bonaccorsi di Patti, E. (2006). Capital structure and firm performance: A new approach to testing agency theory and an application to the banking industry. Journal of Banking & Finance, 30(4), 1065-1102.
Blundell, R., and Bond, S. (1998). Initial conditions and moment restrictions in dynamic panel data models. Journal of econometrics, 87(1), 115-143.
Bolek, M., and Wolski, R. (2012). Profitability or Liquidity: Influencing the Market Value-The Case of Poland. International Journal of Economics and Finance, 4(9), 182-190.
Booth, L., Aivazian, V., Demirguc‐Kunt, A., and Maksimovic, V. (2001). Capital structures in developing countries. The Journal of Finance, 56(1), 87-130.
Chan Kim, W., Hwang, P., and Burgers, W. P. (1989). Global diversification strategy and corporate profit performance. Strategic management journal, 10(1), 45-57.
Cheng, M.-T. (2009). Relative Effects of Debt and Equity on Corporate Operating Performance: A Quantile Regression Study. International Journal of Management, 26(1).
Cornett, M. M., Marcus, A. J., and Tehranian, H. (2008). Corporate governance and pay-for-performance: The impact of earnings management. Journal of Financial Economics, 87(2), 357-373.
Council, C. M. P. (2015). Capital Markets Malaysia Financing The Future. Retrieved. from file:///C:/Users/Administrator/Downloads/CapitalMarketsMalaysia(Facts%20&%20Figures).pdf.
Cowling, M. (2004). The growth–profit nexus. Small Business Economics, 22(1), 1-9.
Ebaid, I. E.-S. (2009). The impact of capital-structure choice on firm performance: empirical evidence from Egypt. Journal of Risk Finance, The, 10(5), 477-487.
Eljelly, A. M. (2004). Liquidity-profitability tradeoff: an empirical investigation in an emerging market. International Journal of Commerce and Management, 14(2), 48-61.
Fama, E. F., and French, K. R. (2002). Testing trade‐off and pecking order predictions about dividends and debt. Review of financial studies, 15(1), 1-33.
Forbes, K. J. (2002). How do large depreciations affect firm performance? : National Bureau of Economic Researcho. Document Number)
Friend, I., and Lang, L. H. (1988). An Empirical Test of the Impact of Managerial Self‐interest on Corporate Capital Structure. The Journal of Finance, 43(2), 271-281.
Fu, T.-W., Ke, M.-C., and Huang, Y.-S. (2002). Capital growth, financing source and profitability of small businesses: evidence from Taiwan small enterprises. Small Business Economics, 18(4), 257-267.
Gleason, K. C., Mathur, L. K., and Mathur, I. (2000). The interrelationship between culture, capital structure, and performance: evidence from European retailers. Journal of Business Research, 50(2), 185-191.
Glen, J., Lee, K., and Singh, A. (2001). Persistence of profitability and competition in emerging markets. Economics Letters, 72(2), 247-253.
Gomez-Mejia, L., and Wiseman, R. M. (1997). Reframing Execufive Compensation: An Assessment and Outlook. Journal of Management, 23(3), 291-374.
Gong, Y., Zhou, J., and Chang, S. (2013). Core knowledge employee creativity and firm performance: The moderating role of riskiness orientation, firm size, and realized absorptive capacity. Personnel Psychology, 66(2), 443-482.
International Journal of Economics and Management
866
Hadlock, C. J., and James, C. M. (2002). Do banks provide financial slack? the Journal of Finance, 57(3), 1383-1419.
Hausman, J. A. (1978). Specification tests in econometrics. Econometrica: Journal of the Econometric Society, 1251-1271.
Helfert, E. A. (2001). Financial analysis: tools and techniques: a guide for managers: McGraw-Hill New York.
Hung, C. Y., Albert, C. P. C., and Eddie, H. C. M. (2002). Capital structure and profitability of the property and construction sectors in Hong Kong. Journal of Property Investment & Finance, 20(6), 434-453.
Ioanni Schiniotakis, N. (2012). Profitability factors and efficiency of Greek banks. EuroMed Journal of Business, 7(2), 185-200.
Jensen, M. C. (1986). Agency costs of free cash flow, corporate finance, and takeovers. The American economic review, 323-329.
Jensen, M. C. (1993). The modern industrial revolution, exit, and the failure of internal control systems. the Journal of Finance, 48(3), 831-880.
Jensen, M. C., and Meckling, W. H. (1976). Theory of the firm: managerial behavior, agency costs, and ownership structure. Journal of Financial Economics, 3(4), 78-79,305.
Jermias, J. (2008). The relative influence of competitive intensity and business strategy on the relationship between financial leverage and performance. The British Accounting Review, 40(1), 71-86.
Kahneman, D. (1973). Attention and effort: Citeseer.
Kajola, S. O. (2008). Corporate governance and firm performance: The case of Nigerian listed firms. European Journal of Economics, Finance and Administrative Sciences, 14(14), 16-28.
Kester, W. C. (1986). Capital and ownership structure: A comparison of United States and Japanese manufacturing corporations. Financial management, 5-16.
Krivogorsky, V., Grudnitski, G., and Dick, W. (2009). Bank Debt and Performance of Continental European Firms. Available at SSRN 1209022.
Lau, S. T., Lee, C. T., and McInish, T. H. (2002). Stock returns and beta, firms size, E/P, CF/P, book-to-market, and sales growth: evidence from Singapore and Malaysia. Journal of multinational financial management, 12(3), 207-222.
Liargovas, P., and Skandalis, K. (2009). The impact of leverage and other key variables on firm’s performance: evidence from Greece o. Document Number)
Lu, J. W., and Beamish, P. W. (2001). The internationalization and performance of SMEs. Strategic management journal, 22(6‐7), 565-586.
Lumpkin, G. T., and Dess, G. G. (1996). Clarifying the entrepreneurial orientation construct and linking it to performance. Academy of management Review, 21(1), 135-172.
Maffini Gomes, C., Kruglianskas, I., and Scherer, F. L. (2009). Company size effect in innovative performance. Journal of technology management & innovation, 4(4), 14-31.
Mahmood, W., and Zakaria, R. (2007). Profitability and capital structure of the property and construction sectors in Malaysia. Pacific Rim Property Research Journal, 13(1), 92-105.
Determinants of Profitability in ACE Market panel Models
867
Mansor Wan Mahmood, W., and Zakaria, R. (2007). Profitability and capital structure of the property and construction sectors in Malaysia. Pacific Rim Property Research Journal, 13(1), 92-105.
Margaretha, F., and Supartika, N. (2016). Factors Affecting Profitability of Small Medium Enterprises (SMEs) Firm Listed in Indonesia Stock Exchange. Journal of Economics, Business and Management, 4(2), 132-137.
Martani, D., and Mulyono, R. K. (2009). The effect of financial ratios, firm size, and cash flow from operating activities in the interim report to the stock return. Chinese Business Review, 8(6), 44-55.
Matemilola, B., Bany-Ariffin, A., and Azman-Saini, W. (2012). Financial leverage and shareholder’s required returns: evidence from South Africa corporate sector. Transition Studies Review, 18(3), 601-612.
McDonald, J. T. (1999). The determinants of firm profitability in Australian manufacturing. Economic Record, 75(2), 115-126.
Mohamad, N. E. A. B., and Saad, N. B. M. (2010). Working capital management: The effect of market valuation and profitability in Malaysia. International Journal of Business and Management, 5(11), p140.
Mohd Saleh, N., Rahman, C. A., and Ridhuan, M. (2009). Ownership structure and intellectual capital performance in Malaysia. Asian Academy of Management Journal of Accounting and Finance, 5(1), 1-29.
Morsy, A., and Rwegasira, K. (2010). Does Demutualization Matter to the Financial Performance of Stock Exchanges? An Investigation of Demutualized Member of the Stock Exchanges of the World Federation Exchanges. International Research Journal of Finance and Economics(40).
Mueller, D. C. (1986). Profits in the long run: Cambridge University Press.
Murphy, K. J. (1985). Corporate performance and managerial remuneration: An empirical analysis. Journal of accounting and economics, 7(1), 11-42.
Myers, S. C. (1977). Determinants of corporate borrowing. Journal of financial economics, 5(2), 147-175.
Myers, S. C. (1984). The capital structure puzzle. The journal of finance, 39(3), 574-592.
Neely, A., Gregory, M., and Platts, K. (2005). Performance measurement system design: a literature review and research agenda. International Journal of Operations & Production Management, 25(12), 1228-1263.
Niresh, J. A. (2012). Trade-Off between Liquidity & Profitability: A Study of Selected Manufacturing Firms in Srilanka. International Refereed Research Journal, 3(4), 34-40.
Nunes, P. J. M., Serrasqueiro, Z. M., and Sequeira, T. N. (2009). Profitability in Portuguese service industries: a panel data approach. The Service Industries Journal, 29(5), 693-707.
Nunkoo, P. K., and Boateng, A. (2010). The empirical determinants of target capital structure and adjustment to long-run target: evidence from Canadian firms. Applied Economics Letters, 17(10), 983-990.
Ocasio, W. (1997). Towards and attention-based view of the firm William Ocasio. Psychology, 1, 403-404.
Onaolapo, A. A., and Kajola, S. O. (2010). Capital structure and firm performance: evidence from Nigeria. European Journal of Economics, Finance and Administrative Sciences, 25, 70-82.
International Journal of Economics and Management
868
Ongore, V. O., and Kusa, G. B. (2013). Determinants of financial performance of commercial banks in Kenya. International Journal of Economics and Financial Issues, 3(1), 237-252.
Pagano, P., and Schivardi, F. (2003). Firm Size Distribution and Growth*. The Scandinavian Journal of Economics, 105(2), 255-274.
Park, K., and Jang, S. S. (2010). Insider ownership and firm performance: An examination of restaurant firms. International Journal of Hospitality Management, 29(3), 448-458.
Pattitoni, P., Petracci, B., and Spisni, M. (2014). Determinants of profitability in the EU-15 area. Applied Financial Economics, 24(11), 763-775.
Porter, R. L. (2010). Competitive Actions of New Technology Firms: The Red Queen Effect and New Firm Performance. University of Central Florida Orlando, Florida.
Raheman, A., and Nasr, M. (2007). Working capital management and profitability–case of Pakistani firms. International review of business research papers, 3(1), 279-300.
Rajan, R. G., and Zingales, L. (1995). What do we know about capital structure? Some evidence from international data. The journal of Finance, 50(5), 1421-1460.
Roden, D. M., and Lewellen, W. G. (1995). Corporate capital structure decisions: evidence from leveraged buyouts. Financial Management, 76-87.
Saleem, Q., and Rehman, R. U. (2011). Impacts of liquidity ratios on profitability. Interdisciplinary Journal of Research in Business, 1(7), 95-98.
Shinozaki, S. (2014). Capital Market Financing for SMEs: A Growing Need in Emerging Asia. Manila: Asian Development Bank. ADB Working Paper Series on Regional Economic Integrationo. Document Number)
Smith, K. (1980). Profitability versus liquidity tradeoffs in working capital management. Readings on the management of working capital, 549-562.
Stierwald, A. (2009). Determinants of Firm Profitability-The Effect of Productivity and its Persistence. Melbourne Institute of Applied Economic and Social Research.
Suarez, F. F., Cusumano, M. A., and Kahl, S. J. (2013). Services and the business models of product firms: An empirical analysis of the software industry. Management Science, 59(2), 420-435.
Sulong, Z., Gardner, J. C., Hussin, A. H., Mohd Sanusi, Z., and McGowan, C. B. (2013). Managerial Ownership, Leverage and Audit Quality Impact on Firm Performance: Evidence from the Malaysian ACE Market. Accounting & Taxation, 5(1), 59-70.
Tarziján, J., and Eyleerts, I. (2010). Persistence of profitability in Latin America: Explaining the differences among countries, industries and firms. Academia, Revista Latinoamericana de Administración, 44(1), 99-114.
Taub, A. J. (1975). Determinants of the firm’s capital structure. The review of economics and statistics, 410-416.
Titman, S., and Wessels, R. (1988). The determinants of capital structure choice. The Journal of finance, 43(1), 1-19.
Verbeek, M. (2008). A guide to modern econometrics: John Wiley & Sons.
Wald, J. K. (1999). How firm characteristics affect capital structure: an international comparison. Journal of Financial research, 22(2), 161-187.

Determinants of Profitability in ACE Market panel Models
869
Yazdanfar, D. (2013). Profitability determinants among micro firms: evidence from Swedish data. International Journal of Managerial Finance, 9(2), 151-160.
Yu, H.-C., Pennathur, A. K., and Hsieh, D.-T. (2007). How Does Public Debt Compliment the Interrelationships Between Banking Relationships and Firm Profitability? International Research Journal of Finance and Economics, 12, 36-55.
Yurtoglu, B. B. (2004). Persistence of firm-level profitability in Turkey. Applied Economics, 36(6), 615-625.
Zainudin, N. (2006). Liquidity-profitability trade-off: is it evident among Malaysian SMEs? International Journal of Management Studies 13(2), 107-118.
Zeitun, R., and Tian, G. G. (2007). Capital structure and corporate performance: evidence from Jordan. Australasian Accounting Business and Finance Journal, 1(4), 3.