Embed Size (px)
Citation preview

Journal of Physics Conference Series
OPEN ACCESS
Determination of the optical bandgap and disorderenergies of thin amorphous SiC and AlN filmsproduced by radio frequency magnetron sputteringTo cite this article J A Guerra et al 2011 J Phys Conf Ser 274 012113
View the article online for updates and enhancements
You may also likeInflunce of exposure with Xe radiation onheterojunction solar cell a-SiCc-Si studiedby impedance spectroscopyM Pernyacute V Šaacutely J Packa et al
-
Effect of thermal annealing treatments onthe optical activation of Tb3+ -dopedamorphous SiCH thin filmsJ A Guerra F De Zela K Tucto et al
-
Microstructure evolution and energy bandalignment at the interface of a Si-richamorphous silicon carbidec-SiheterostructureXixing Wen Xiangbin Zeng Wugang Liaoet al
-
Recent citationsSingle composite target magnetron sputterdeposition of crystalline and amorphousSiC thin filmsPoreddy Chaitanya Akshara et al
-
The Urbach focus and optical properties ofamorphous hydrogenated SiC thin filmsJ A Guerra et al
-
This content was downloaded from IP address 58153239121 on 16102021 at 1114
Determination of the optical bandgap and disorder energies of
thin amorphous SiC and AlN films produced by radio
frequency magnetron sputtering
J A Guerra1 L Montantildeez
1 O Erlenbach
2 G Galvez
1 F De Zela
1 A Winnacker
2
R Weingaumlrtner12
1Departamento de Ciencias Seccioacuten Fiacutesica Pontificia Universidad Catoacutelica del Peruacute
2Department of Material Science 6 University of Erlangen-Nuumlrnberg Germany
E-mail guerrajorgeapucpedupe
Abstract Amorphous aluminum nitrite and silicon carbide (a-AlN and a-SiC) thin films were
prepared by radio frequency magnetron sputtering Due to the deposition method and
production conditions the deposited films grown in amorphous state We systematically
measure the optical bandgap through optical transmission spectroscopy and its change with a
cumulative thermal annealing The results show a linear relation between the Tauc-gap and the
Tauc-slope for both AlN and SiC films which can be explained analytically from the existence
of an Urbach focus and therefore can be used to determine the Urbach focus or to ensure the
correct usage of the bandgap determination methods
1 Introduction
Amorphous and crystalline thin films of the wide bandgap materials AlN or SiC are of increasing
interest in research and development [1-4] not only because properties like their higher breakdown
voltage and thermal conductivity in contrast to usual semiconductors like GaAs and Si [5] but due to
their potential applications in optics eg amorphous SiC thin films have been used as coatings for
extreme UV optics due to its high reflectivity in the UV region [3] Also amorphous AlN doped with
rare earths has applications for micro wave guides and lasers [4] In summary there are plenty of
potential applications to develop for these materials and therefore a good understanding of their
optical properties is necessary
In the last decades different methods andor representations of the absorption coefficient have been
used to determine the optical bandgap of a-AlN thin films and therefore several values of the optical
bandgap have been given [6-10] The differences on these values were attributed to the different
structures of the material since the films are amorphous and to the deposition methods We attribute
those differences not only to the process conditions or structure but to the misusage of the bandgap
1 Av Universitaria 1801 Apartado Postal 1761 Lima 32 Peruacute
2 Martensstrasse 7 91058 Erlangen Germany
XVII Reunioacuten Iberoamericana de Oacuteptica amp X Encuentro de Oacuteptica Laacuteseres y Aplicaciones IOP PublishingJournal of Physics Conference Series 274 (2011) 012113 doi1010881742-65962741012113
Published under licence by IOP Publishing Ltd 1
determination methods since different regions of the absorption coefficient were used to determine the
optical bandgap assuming them as the fundamental absorption We propose a simple criteria to ensure
the correct measure of the optical bandgap from the fundamental absorption
We present the variation of the absorption coefficient of a-AlN and a-SiC thin films versus annealing
temperatures measured by means of optical transmission measurements (fig 1) From which by using
a proper representation of the absorption coefficient the optical bandgap can be obtained commonly by
the intercept of a linear extrapolation with the photon energy axis Also we measure structural
parameters like the Tauc-slope and Urbach-slope (also known as Urbach parameter) and relate them to
the corresponding optical bandgap The Urbach-focus of the a-AlN is found to be at 6002 plusmn 0015 eV
in excellent agreement with the value of the optical bandgap of crystalline AlN (c-AlN) [11] The
Urbach focus of the a-SiC is found to be at 3164 plusmn 0063 eV
2 Experimental details The studied films were grown on quartz and CaF2 substrates by radio frequency magnetron sputtering
from highly pure SiC and AlN targets of 51 mm diameter in an argon and nitrogen process atmosphere
respectively The dominating impurities are nitrogen with a concentration below 10 ppm wt for the
SiC target and oxygen (90 ppm wt) for the AlN target The substrates where hold down at 10degC with a
constant water flux by a cooling system to ensure an amorphous lattice in the film
The annealing treatments took place in a quartz tube inside an oven tube with three heating stages
which can be heated up to 1200 degC The quartz tube was evacuated down to 4times10-5 mbar and then a
constant argon flux raises the pressure up to ~4times10-4
mbar After the operating temperature was
reached the quartz tube with the samples under treatment was moved rapidly inside the oven (shock
tempering) The annealing time for each annealing step was 15 minutes and the same samples were
used for the next annealing steps (isochronical annealing)
The a-SiC and a-AlN films were studied by optical transmission spectroscopy at room temperature
using a double beam photo-spectrometer model Lambda 2 UVVISNIR of Perkin Elmer in the range
of 190-1100 nm with a spectral resolution of 1 nm Absorption coefficients up to 15times104 cm
-1 were
recorded The substrates were also measured to be taken into account for further calculations
3 Results and Discussion
The calculation of the absorption coefficient from the transmission spectrum was performed using a
modified Swanepoelrsquos method [9][10][12][13] which consist in a fit using the transmission spectra
without interference fringes Tα and the measured transmission spectrum itself T The Tα curve is
calculated from the envelopes that are constructed using the extremes from the T curve Also the
refractive index of the substrates and their change with the annealing treatments were considered This
method gives the thickness refractive index and absorption coefficient with a good accuracy and can
be applied to transmission spectrums with a low interference pattern typical of films with a thickness
around 450 nm in our case [9][10][12][14] According to this method the films had a thickness around
350 nm and a small variation was noted after the films were annealed The optical bandgap can be
obtained from the Tauc-plot analysis commonly used in similar studies
XVII Reunioacuten Iberoamericana de Oacuteptica amp X Encuentro de Oacuteptica Laacuteseres y Aplicaciones IOP PublishingJournal of Physics Conference Series 274 (2011) 012113 doi1010881742-65962741012113
2
1 2 3 4 5 6 7
0
3
6
9
12
15
2 = 09919
0 = 9321202 plusmn 179712 cm
-1eV
-1
E0 = 6002 plusmn 0015 eV
UF
CU
AG
200
300
400
500
600
700
1
04 (
cm
-1)
Photon Energy (eV)
AG 200 400 600 800
6
7
8
9
10
1
x
10
-1 (
eV
)
Annealing Temperature
Figure 1 Absorption coefficient of pure a-AlN at different annealing
temperatures (degC) The green dashed lines are a fit using the Cauchy-
Urbach model The point denoted by a green star is the Urbach focus
The inset graph shows the change of the Urbach-slope with the
annealing treatment AG stands for as-grown
12 16 20 24 28 32 36
00
05
10
15
20
AG
50
100
150
200
250
300
350
400
450
1
04 (
cm
-1)
Energy (eV)
AG 100 200 300 400
55
60
65
70
1
x
10
-1 (
eV
)
Annealing Temperature
Figure 2 Absorption coefficient of pure a-SiC at different annealing
temperatures In this case no Urbach focus was observed directly
Inset graph shows the change of the Urbach-slope with the annealing
treatment
XVII Reunioacuten Iberoamericana de Oacuteptica amp X Encuentro de Oacuteptica Laacuteseres y Aplicaciones IOP PublishingJournal of Physics Conference Series 274 (2011) 012113 doi1010881742-65962741012113
3
It is easily shown from the Urbach-rule (eq 1) that the Urbach-focus value corresponds to the
parameter Ef = E0 and the corresponding ordinate value is αf = α0 by assuming that only a change in β
occurs when a sample is annealed or a change in the structure occurs by other means
00
( )exp[ ]E E (1)
Motivated by the Urbach-rule another commonly used model in similar and ellipsometric studies [7]
give in the same way a definition of Urbach-focus (eq 2) This model is known as Cauchy-Urbach
model and following the above notation the corresponding Urbach focus is defined by Ef = E0 and
αf = α0E0 Both models denote the same focus
00( )exp[ ]E EE (2)
It is well establish that the optical bandgap is broadened by the structural and vibrational disorder on
the lattice Then it seems reasonable to calculate the optical bandgap of an amorphous material by
subtracting the energy broadening by the disorder from the energy gap between the mobility edges
[15-18] In principle the energy gap between the mobility edges or the bandgap in the absence of static
disorder should match the one of the material in the crystalline case However we do not intend to
enforce this constant but to obtain it directly from the experimental results of the studied amorphous
materials
Our election of the Urbach-focus as the bandgap in absence of static disorder is suggested by the
experimental results in the case of AlN and SiC samples as we will show in the next paragraphs The
Urbach-focus value can be obtained in two different ways First it can be determined directly from the
absorption coefficient data through a proper fit using the Cauchy-Urbach model or the Urbach rule It
is important to note that in order to determine the three parameters α0 E0 and β a global fit sharing the
parameters α0 and E0 must be performed in the case of annealed samples This implies that the
parameter E0 is a constant that does not depend on the structure change due to the annealing treatment
Second the Urbach-focus can be also determined from a less direct but still proper linear regression
which will be shown also in the next paragraphs
To make the fit first note that in the Urbach rule written in logarithm scale we have a linear equation
(see eq 4) whose intercept is describe by ln(α0) - βE0 and slope by β Thus from a single measurement
of the absorption coefficient the Urbach slope is well defined but the rest of parameters are not in the
sense that they can have any value satisfying the intercept relation The same happens with the
Cauchy-Urbach model
0 0ln( ) ln( ) E E (4)
Therefore from several measurements of the absorption coefficient of a material but with different
disorder degrees a change in the slope is expected and the Urbach-focus is defined by the intersection
XVII Reunioacuten Iberoamericana de Oacuteptica amp X Encuentro de Oacuteptica Laacuteseres y Aplicaciones IOP PublishingJournal of Physics Conference Series 274 (2011) 012113 doi1010881742-65962741012113
4
of the curves This effect is observed in the figure 1 for a-AlN films annealed at different
temperatures In the case of the a-SiC shown in the figure 2 it seems that there is a not well defined
Urbach-focus
The other way to obtain the Urbach-focus is trough the fundamental absorption representation Let us
generalize it through the equation 5 shown below Where for r = 2 we have the Taucs representation
and for r = 12 we have the (αE)2 representation
( )r
rB E EE (5)
Then by taking into account the Urbach-focus in the equation 5 and solving for the bandgap Er we
obtain the equation 6 It is important to note that this equation works for any exponent r and that the
Urbach-focus can be determined form its intercept The equation 6 is also giving energy units to
another well known parameter that represents the disorder in the lattice the Tauc slope [16] ie for
r = 2
0
1 1( ) 1
r f
r r
fE E E B (6)
Therefore in order to determine the Urbach-focus it is necessary to plot the Tauc-gap versus the Tauc-
slope and fit the equation 6 see figure 3 In this way if the Tauc-gap is being determined from the
fundamental absorption it must follow the equation 6 ie the region of the absorption coefficient
where the Tauc-slope is increasing with the reduction of the disorder [16]
16 20 24 28
40
44
48
52
40 48 56 6420
22
24
26
Slope = -55418
Intercept = 5927 eV
a)
ET
au
c (
eV
)
1mTauc
10-3 (cm
12eV
12)
Slope = -14687
Intercept = 3164 eV
b)
Figure 3 Tauc-gap versus the inverse of the Tauc-slope for a-AlN (a)
and a-SiC (b) showing a well defined linear relation corresponding to
the equation 6
This result clears all doubt of which region of the absorption coefficient should be used to determine
the optical bandgap through the selected representation if the material shows an Urbach-focus and is a
XVII Reunioacuten Iberoamericana de Oacuteptica amp X Encuentro de Oacuteptica Laacuteseres y Aplicaciones IOP PublishingJournal of Physics Conference Series 274 (2011) 012113 doi1010881742-65962741012113
5
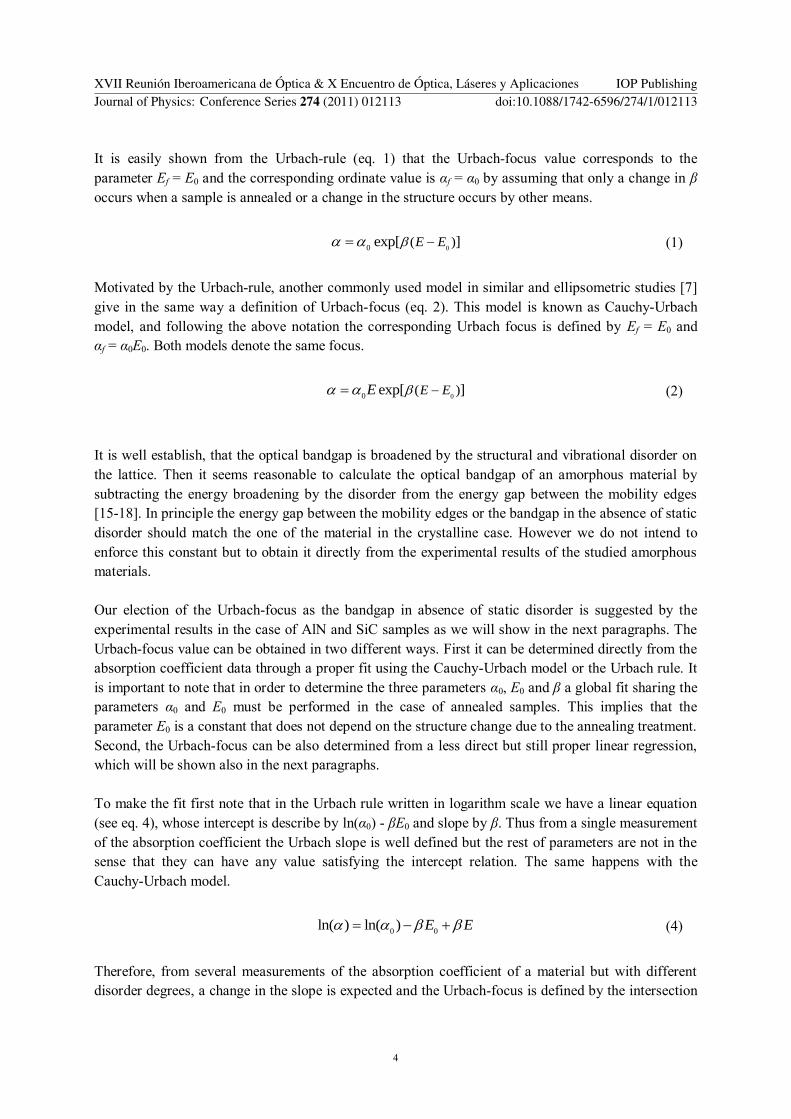
constant under structural changes on the lattice This is not the case for the SiC that in amorphous state
may show different pseudo hybridization states that change the bandgap and the structure and
therefore the Urbach-focus varies with the annealing treatments see figure 2 For the case of a-SiC the
only way to obtain an average value of the Urbach focus would be through the equation 6 see figure
3 even if no apparent focus is observed in the figure 2 since it is changing for different annealing
temperatures
AG 200 300 400 500 600 700
40
45
50
55
60
65
AG 100 200 300 400 500
22
23
24
25
26
27
a-AlN
E( E)
2
ECU
ETauc
a-SiC
Ba
nd
ga
p (
eV
)
Annealing Temperature (degC)
Figure 4 Tauc-gap (blue triangles) for the a-AlN (above) and a-SiC
(below) The (αE)2-gap is shown for comparison in the AlN case Also
the difference between the Urbach focus and the Urbach-slope is
shown (red circles) for each sample
XVII Reunioacuten Iberoamericana de Oacuteptica amp X Encuentro de Oacuteptica Laacuteseres y Aplicaciones IOP PublishingJournal of Physics Conference Series 274 (2011) 012113 doi1010881742-65962741012113
6
4 Conclusions
Another method besides a fit using the Urbach rule or the Cauchy-Urbach models to determine the
Urbach-focus of a material using the Tauc-gap and the Tauc-slope was presented The experimental
results show that the Urbach-focus of amorphous AlN and SiC materials can be used as a constant that
represents the gap between the mobility band edges Also it can be seen that the chosen representation
of the fundamental absorption changes the representation of the energy loss by the disorder through
the equation 6 In this sense the search for a proper representation of the fundamental absorption to
determine the optical bandgap should look into a proper representation of the topological disorder and
its influence on the fundamental absorption of a material A candidate to fit as a parameter that
represents the topological disorder could be the Urbach-slope [12] since the difference between the
Urbach-focus and the Urbach-slope give a value closer to the bandgap and carries the behavior of the
disorder reduction see figure 4
Acknowledgements
This research is funded by the Deutsche Forschungsgemeinschaft (DFG) and the Bundesministerium
fuumlr Zusammenarbeit und Entwicklung (BMZ) under contract number WI393-20-12 WI39321-123
and is supported by the German Academic Exchange Service (DAAD) under contract number D08-
09227
References
[1] Roucka R et al 2003 Appl Surf Sci 212-13 872-78 [2] Kim K H et al 2004 Appl Phys Lett 85 4777-79
[3] Kortright J B and Windt D L 1988 Appl Opt 27 2841-46
[4] Maqbool M Wilson E Clark J Ahmad I and Kayani A 2010 Appl Opt 49 653-57 [5] Shur M Rumyantsev S L and Levinshtein M E S 2001 SiC Materials and Devices (Singapore
World Scientific Publishing Company)
[6] Gurumurgan K Hong Chen and Harp G R 1999 Appl Phys Lett 74 3008-10
[7] Khoshman J M and Kordesch M E 2005 J Of Non-Cryst Sol 351 3334-40 [8] Zanatta A R 2009 J of Phys D 42 025109-7
[9] Guerra J A et al 2010 Mat Sci For 645-48 263-66
[10] Weingaumlrtner R et al 2010 Mat Sci and Eng B 174 114-8 [11] Bickerman M et al 2009 Phys Stat Sol C 7 21-4
[12] Guerra J A 2010 Determination of the Optical Bandgap of thin amorphous (SiC)1-x(AlN)x films
(Lima Thesis Pontificia Universidad Catoacutelica del Peruacute)
[13] Swanepoel R 1983 J of Phys E 16 1215-22 [14] Galvez G et al 2010 Mat Sci For 645-48 1199-202
[15] Dunstan D J 1983 J of Phys C 16 L567-71
[16] Morigaki K 1999 Physics of amorphous semiconductors (London World Scientific Publishing Company)
[17] Sadao A 1999 Optical properties of crystalline and amorphous semiconductors
(Boston Kluwer Academic Publishers) [18] Cody G D 2005 Mater Res Soc Symp Proc 862 A131- 3
XVII Reunioacuten Iberoamericana de Oacuteptica amp X Encuentro de Oacuteptica Laacuteseres y Aplicaciones IOP PublishingJournal of Physics Conference Series 274 (2011) 012113 doi1010881742-65962741012113
7

Determination of the optical bandgap and disorder energies of
thin amorphous SiC and AlN films produced by radio
frequency magnetron sputtering
J A Guerra1 L Montantildeez
1 O Erlenbach
2 G Galvez
1 F De Zela
1 A Winnacker
2
R Weingaumlrtner12
1Departamento de Ciencias Seccioacuten Fiacutesica Pontificia Universidad Catoacutelica del Peruacute
2Department of Material Science 6 University of Erlangen-Nuumlrnberg Germany
E-mail guerrajorgeapucpedupe
Abstract Amorphous aluminum nitrite and silicon carbide (a-AlN and a-SiC) thin films were
prepared by radio frequency magnetron sputtering Due to the deposition method and
production conditions the deposited films grown in amorphous state We systematically
measure the optical bandgap through optical transmission spectroscopy and its change with a
cumulative thermal annealing The results show a linear relation between the Tauc-gap and the
Tauc-slope for both AlN and SiC films which can be explained analytically from the existence
of an Urbach focus and therefore can be used to determine the Urbach focus or to ensure the
correct usage of the bandgap determination methods
1 Introduction
Amorphous and crystalline thin films of the wide bandgap materials AlN or SiC are of increasing
interest in research and development [1-4] not only because properties like their higher breakdown
voltage and thermal conductivity in contrast to usual semiconductors like GaAs and Si [5] but due to
their potential applications in optics eg amorphous SiC thin films have been used as coatings for
extreme UV optics due to its high reflectivity in the UV region [3] Also amorphous AlN doped with
rare earths has applications for micro wave guides and lasers [4] In summary there are plenty of
potential applications to develop for these materials and therefore a good understanding of their
optical properties is necessary
In the last decades different methods andor representations of the absorption coefficient have been
used to determine the optical bandgap of a-AlN thin films and therefore several values of the optical
bandgap have been given [6-10] The differences on these values were attributed to the different
structures of the material since the films are amorphous and to the deposition methods We attribute
those differences not only to the process conditions or structure but to the misusage of the bandgap
1 Av Universitaria 1801 Apartado Postal 1761 Lima 32 Peruacute
2 Martensstrasse 7 91058 Erlangen Germany
XVII Reunioacuten Iberoamericana de Oacuteptica amp X Encuentro de Oacuteptica Laacuteseres y Aplicaciones IOP PublishingJournal of Physics Conference Series 274 (2011) 012113 doi1010881742-65962741012113
Published under licence by IOP Publishing Ltd 1
determination methods since different regions of the absorption coefficient were used to determine the
optical bandgap assuming them as the fundamental absorption We propose a simple criteria to ensure
the correct measure of the optical bandgap from the fundamental absorption
We present the variation of the absorption coefficient of a-AlN and a-SiC thin films versus annealing
temperatures measured by means of optical transmission measurements (fig 1) From which by using
a proper representation of the absorption coefficient the optical bandgap can be obtained commonly by
the intercept of a linear extrapolation with the photon energy axis Also we measure structural
parameters like the Tauc-slope and Urbach-slope (also known as Urbach parameter) and relate them to
the corresponding optical bandgap The Urbach-focus of the a-AlN is found to be at 6002 plusmn 0015 eV
in excellent agreement with the value of the optical bandgap of crystalline AlN (c-AlN) [11] The
Urbach focus of the a-SiC is found to be at 3164 plusmn 0063 eV
2 Experimental details The studied films were grown on quartz and CaF2 substrates by radio frequency magnetron sputtering
from highly pure SiC and AlN targets of 51 mm diameter in an argon and nitrogen process atmosphere
respectively The dominating impurities are nitrogen with a concentration below 10 ppm wt for the
SiC target and oxygen (90 ppm wt) for the AlN target The substrates where hold down at 10degC with a
constant water flux by a cooling system to ensure an amorphous lattice in the film
The annealing treatments took place in a quartz tube inside an oven tube with three heating stages
which can be heated up to 1200 degC The quartz tube was evacuated down to 4times10-5 mbar and then a
constant argon flux raises the pressure up to ~4times10-4
mbar After the operating temperature was
reached the quartz tube with the samples under treatment was moved rapidly inside the oven (shock
tempering) The annealing time for each annealing step was 15 minutes and the same samples were
used for the next annealing steps (isochronical annealing)
The a-SiC and a-AlN films were studied by optical transmission spectroscopy at room temperature
using a double beam photo-spectrometer model Lambda 2 UVVISNIR of Perkin Elmer in the range
of 190-1100 nm with a spectral resolution of 1 nm Absorption coefficients up to 15times104 cm
-1 were
recorded The substrates were also measured to be taken into account for further calculations
3 Results and Discussion
The calculation of the absorption coefficient from the transmission spectrum was performed using a
modified Swanepoelrsquos method [9][10][12][13] which consist in a fit using the transmission spectra
without interference fringes Tα and the measured transmission spectrum itself T The Tα curve is
calculated from the envelopes that are constructed using the extremes from the T curve Also the
refractive index of the substrates and their change with the annealing treatments were considered This
method gives the thickness refractive index and absorption coefficient with a good accuracy and can
be applied to transmission spectrums with a low interference pattern typical of films with a thickness
around 450 nm in our case [9][10][12][14] According to this method the films had a thickness around
350 nm and a small variation was noted after the films were annealed The optical bandgap can be
obtained from the Tauc-plot analysis commonly used in similar studies
XVII Reunioacuten Iberoamericana de Oacuteptica amp X Encuentro de Oacuteptica Laacuteseres y Aplicaciones IOP PublishingJournal of Physics Conference Series 274 (2011) 012113 doi1010881742-65962741012113
2
1 2 3 4 5 6 7
0
3
6
9
12
15
2 = 09919
0 = 9321202 plusmn 179712 cm
-1eV
-1
E0 = 6002 plusmn 0015 eV
UF
CU
AG
200
300
400
500
600
700
1
04 (
cm
-1)
Photon Energy (eV)
AG 200 400 600 800
6
7
8
9
10
1
x
10
-1 (
eV
)
Annealing Temperature
Figure 1 Absorption coefficient of pure a-AlN at different annealing
temperatures (degC) The green dashed lines are a fit using the Cauchy-
Urbach model The point denoted by a green star is the Urbach focus
The inset graph shows the change of the Urbach-slope with the
annealing treatment AG stands for as-grown
12 16 20 24 28 32 36
00
05
10
15
20
AG
50
100
150
200
250
300
350
400
450
1
04 (
cm
-1)
Energy (eV)
AG 100 200 300 400
55
60
65
70
1
x
10
-1 (
eV
)
Annealing Temperature
Figure 2 Absorption coefficient of pure a-SiC at different annealing
temperatures In this case no Urbach focus was observed directly
Inset graph shows the change of the Urbach-slope with the annealing
treatment
XVII Reunioacuten Iberoamericana de Oacuteptica amp X Encuentro de Oacuteptica Laacuteseres y Aplicaciones IOP PublishingJournal of Physics Conference Series 274 (2011) 012113 doi1010881742-65962741012113
3
It is easily shown from the Urbach-rule (eq 1) that the Urbach-focus value corresponds to the
parameter Ef = E0 and the corresponding ordinate value is αf = α0 by assuming that only a change in β
occurs when a sample is annealed or a change in the structure occurs by other means
00
( )exp[ ]E E (1)
Motivated by the Urbach-rule another commonly used model in similar and ellipsometric studies [7]
give in the same way a definition of Urbach-focus (eq 2) This model is known as Cauchy-Urbach
model and following the above notation the corresponding Urbach focus is defined by Ef = E0 and
αf = α0E0 Both models denote the same focus
00( )exp[ ]E EE (2)
It is well establish that the optical bandgap is broadened by the structural and vibrational disorder on
the lattice Then it seems reasonable to calculate the optical bandgap of an amorphous material by
subtracting the energy broadening by the disorder from the energy gap between the mobility edges
[15-18] In principle the energy gap between the mobility edges or the bandgap in the absence of static
disorder should match the one of the material in the crystalline case However we do not intend to
enforce this constant but to obtain it directly from the experimental results of the studied amorphous
materials
Our election of the Urbach-focus as the bandgap in absence of static disorder is suggested by the
experimental results in the case of AlN and SiC samples as we will show in the next paragraphs The
Urbach-focus value can be obtained in two different ways First it can be determined directly from the
absorption coefficient data through a proper fit using the Cauchy-Urbach model or the Urbach rule It
is important to note that in order to determine the three parameters α0 E0 and β a global fit sharing the
parameters α0 and E0 must be performed in the case of annealed samples This implies that the
parameter E0 is a constant that does not depend on the structure change due to the annealing treatment
Second the Urbach-focus can be also determined from a less direct but still proper linear regression
which will be shown also in the next paragraphs
To make the fit first note that in the Urbach rule written in logarithm scale we have a linear equation
(see eq 4) whose intercept is describe by ln(α0) - βE0 and slope by β Thus from a single measurement
of the absorption coefficient the Urbach slope is well defined but the rest of parameters are not in the
sense that they can have any value satisfying the intercept relation The same happens with the
Cauchy-Urbach model
0 0ln( ) ln( ) E E (4)
Therefore from several measurements of the absorption coefficient of a material but with different
disorder degrees a change in the slope is expected and the Urbach-focus is defined by the intersection
XVII Reunioacuten Iberoamericana de Oacuteptica amp X Encuentro de Oacuteptica Laacuteseres y Aplicaciones IOP PublishingJournal of Physics Conference Series 274 (2011) 012113 doi1010881742-65962741012113
4
of the curves This effect is observed in the figure 1 for a-AlN films annealed at different
temperatures In the case of the a-SiC shown in the figure 2 it seems that there is a not well defined
Urbach-focus
The other way to obtain the Urbach-focus is trough the fundamental absorption representation Let us
generalize it through the equation 5 shown below Where for r = 2 we have the Taucs representation
and for r = 12 we have the (αE)2 representation
( )r
rB E EE (5)
Then by taking into account the Urbach-focus in the equation 5 and solving for the bandgap Er we
obtain the equation 6 It is important to note that this equation works for any exponent r and that the
Urbach-focus can be determined form its intercept The equation 6 is also giving energy units to
another well known parameter that represents the disorder in the lattice the Tauc slope [16] ie for
r = 2
0
1 1( ) 1
r f
r r
fE E E B (6)
Therefore in order to determine the Urbach-focus it is necessary to plot the Tauc-gap versus the Tauc-
slope and fit the equation 6 see figure 3 In this way if the Tauc-gap is being determined from the
fundamental absorption it must follow the equation 6 ie the region of the absorption coefficient
where the Tauc-slope is increasing with the reduction of the disorder [16]
16 20 24 28
40
44
48
52
40 48 56 6420
22
24
26
Slope = -55418
Intercept = 5927 eV
a)
ET
au
c (
eV
)
1mTauc
10-3 (cm
12eV
12)
Slope = -14687
Intercept = 3164 eV
b)
Figure 3 Tauc-gap versus the inverse of the Tauc-slope for a-AlN (a)
and a-SiC (b) showing a well defined linear relation corresponding to
the equation 6
This result clears all doubt of which region of the absorption coefficient should be used to determine
the optical bandgap through the selected representation if the material shows an Urbach-focus and is a
XVII Reunioacuten Iberoamericana de Oacuteptica amp X Encuentro de Oacuteptica Laacuteseres y Aplicaciones IOP PublishingJournal of Physics Conference Series 274 (2011) 012113 doi1010881742-65962741012113
5
constant under structural changes on the lattice This is not the case for the SiC that in amorphous state
may show different pseudo hybridization states that change the bandgap and the structure and
therefore the Urbach-focus varies with the annealing treatments see figure 2 For the case of a-SiC the
only way to obtain an average value of the Urbach focus would be through the equation 6 see figure
3 even if no apparent focus is observed in the figure 2 since it is changing for different annealing
temperatures
AG 200 300 400 500 600 700
40
45
50
55
60
65
AG 100 200 300 400 500
22
23
24
25
26
27
a-AlN
E( E)
2
ECU
ETauc
a-SiC
Ba
nd
ga
p (
eV
)
Annealing Temperature (degC)
Figure 4 Tauc-gap (blue triangles) for the a-AlN (above) and a-SiC
(below) The (αE)2-gap is shown for comparison in the AlN case Also
the difference between the Urbach focus and the Urbach-slope is
shown (red circles) for each sample
XVII Reunioacuten Iberoamericana de Oacuteptica amp X Encuentro de Oacuteptica Laacuteseres y Aplicaciones IOP PublishingJournal of Physics Conference Series 274 (2011) 012113 doi1010881742-65962741012113
6
4 Conclusions
Another method besides a fit using the Urbach rule or the Cauchy-Urbach models to determine the
Urbach-focus of a material using the Tauc-gap and the Tauc-slope was presented The experimental
results show that the Urbach-focus of amorphous AlN and SiC materials can be used as a constant that
represents the gap between the mobility band edges Also it can be seen that the chosen representation
of the fundamental absorption changes the representation of the energy loss by the disorder through
the equation 6 In this sense the search for a proper representation of the fundamental absorption to
determine the optical bandgap should look into a proper representation of the topological disorder and
its influence on the fundamental absorption of a material A candidate to fit as a parameter that
represents the topological disorder could be the Urbach-slope [12] since the difference between the
Urbach-focus and the Urbach-slope give a value closer to the bandgap and carries the behavior of the
disorder reduction see figure 4
Acknowledgements
This research is funded by the Deutsche Forschungsgemeinschaft (DFG) and the Bundesministerium
fuumlr Zusammenarbeit und Entwicklung (BMZ) under contract number WI393-20-12 WI39321-123
and is supported by the German Academic Exchange Service (DAAD) under contract number D08-
09227
References
[1] Roucka R et al 2003 Appl Surf Sci 212-13 872-78 [2] Kim K H et al 2004 Appl Phys Lett 85 4777-79
[3] Kortright J B and Windt D L 1988 Appl Opt 27 2841-46
[4] Maqbool M Wilson E Clark J Ahmad I and Kayani A 2010 Appl Opt 49 653-57 [5] Shur M Rumyantsev S L and Levinshtein M E S 2001 SiC Materials and Devices (Singapore
World Scientific Publishing Company)
[6] Gurumurgan K Hong Chen and Harp G R 1999 Appl Phys Lett 74 3008-10
[7] Khoshman J M and Kordesch M E 2005 J Of Non-Cryst Sol 351 3334-40 [8] Zanatta A R 2009 J of Phys D 42 025109-7
[9] Guerra J A et al 2010 Mat Sci For 645-48 263-66
[10] Weingaumlrtner R et al 2010 Mat Sci and Eng B 174 114-8 [11] Bickerman M et al 2009 Phys Stat Sol C 7 21-4
[12] Guerra J A 2010 Determination of the Optical Bandgap of thin amorphous (SiC)1-x(AlN)x films
(Lima Thesis Pontificia Universidad Catoacutelica del Peruacute)
[13] Swanepoel R 1983 J of Phys E 16 1215-22 [14] Galvez G et al 2010 Mat Sci For 645-48 1199-202
[15] Dunstan D J 1983 J of Phys C 16 L567-71
[16] Morigaki K 1999 Physics of amorphous semiconductors (London World Scientific Publishing Company)
[17] Sadao A 1999 Optical properties of crystalline and amorphous semiconductors
(Boston Kluwer Academic Publishers) [18] Cody G D 2005 Mater Res Soc Symp Proc 862 A131- 3
XVII Reunioacuten Iberoamericana de Oacuteptica amp X Encuentro de Oacuteptica Laacuteseres y Aplicaciones IOP PublishingJournal of Physics Conference Series 274 (2011) 012113 doi1010881742-65962741012113
7