Embed Size (px)
Citation preview

Faculté de Génie
Département de génie chimique
DÉVELOPPEMENT ET UTILISATION DE SYSTÈMES DE CULTURE POUR LA
MODULATION DE RÉPONSES CELLULAIRES SPÉCIFIQUES
________________________________
DEVELOPMENT AND USE OF CULTURE SYSTEMS TO MODULATE SPECIFIC
CELL RESPONSES
Thèse doctorale ès sciences appliquées
Spécialité : génie chimique
__________________
YVES MARTIN
Sherbrooke (Québec), Canada Août 2007
I
RÉSUMÉ
Des surfaces de culture pouvant induire des réponses cellulaires localisées et spécifiques
sont nécessaires pour permettre la croissance cellulaire dans des environnements
tridimensionnels (3D) de façon comparable aux tissus, et pour développer des techniques
diagnostiques performantes basées sur des cellules. Ainsi, le Chapitre 1 de cette thèse est
consacré à une revue de littérature des interactions cellules-matériau en 3D. Des systèmes
de culture 3D plus adaptés devront être développés pour imiter plusieurs caractéristiques des
environnements in vivo, incluant le développement de systèmes qui réduisent les interactions
cellules-matériau non spécifiques et présentent des signaux biochimiques de façon locale.
Cette thèse est basée sur l’hypothèse que des traitements de surface étudiés et optimisés
permettront d’obtenir une diminution des interactions cellules-matériau non spécifiques et de
permettre des modifications chimiques locales en vue d’obtenir des interactions localisées et
spécifiques. De cette façon, le Chapitre 2 et le Chapitre 3 de cette thèse présentent le
développement de traitements de surface par polymérisation par plasma et l’immobilisation
locale d’un polymère antiadhésif, le poly(éthylène glycol) (PEG). Ces traitements ont été
caractérisés par un grand nombre de techniques incluant la microscopie à force atomique, la
spectroscopie à rayons X et la résonance de plasmons de surface. Le paramètre déterminant
de la polymérisation par plasma relativement à la teneur des surfaces en azote est la
puissance de la décharge, alors que la puissance et le temps contrôlent l’épaisseur des
couches. Les propriétés physicochimiques et mécaniques des couches de PEG immobilisées
de façon covalente sur les surfaces traitées au plasma sont dépendantes des méthodes de
fabrication. La concentration du PEG en solution est un indicateur important des propriétés
finales des couches, et l’utilisation d’un solvant thêta provoque des phénomènes
d’agrégation complexes provoquant des disparités importantes entre les diverses conditions.
Les couches de PEG montrent des sites disponibles pour les modifications chimiques, ce qui
pave la voie à l’immobilisation de molécules bioactives de façon locale sur les surfaces.
Une application des surfaces antiadhésives modifiées localement est donnée au Chapitre 4
par le développement d’une surface diagnostique pour l’évaluation de l’activation plaquettaire
qui est extrêmement difficile à accomplir en clinique puisque les plaquettes s’activent
rapidement par les manipulations in vitro. Des résultats significatifs obtenus avec des
donneurs indiquent que cet instrument diagnostique a le potentiel de permettre l’évaluation
rapide de l’activation des plaquettes dans le sang complet.
II
SUMMARY
Culture surfaces that induce specific localized cell responses are required to achieve tissue-
like cell growth in three-dimensional (3D) environments, as well as to develop more efficient
cell-based diagnostic techniques, noticeably when working with fragile cells such as stem
cells or platelets. As such, Chapter 1 of this thesis work is devoted to the review of 3D cell-
material interactions in vitro and the corresponding existing culture systems available to
achieve in vivo-like cell responses. More adequate 3D culture systems will need to be
developed to mimic several characteristics of in vivo environments, including lowered non-
specific cell-material interactions and localized biochemical signaling.
The experimental work in this thesis is based on the hypothesis that well-studied and
optimized surface treatments will be able to lower non-specific cell-material interactions and
allow local chemical modification in order to achieve specific localized cell-material
interactions for different applications. As such, in Chapter 2 and Chapter 3 of this thesis,
surface treatments were developed using plasma polymerization and covalent immobilization
of a low-fouling polymer (i.e., poly(ethylene glycol)) and characterized and optimized using a
large number of techniques including atomic force microscopy, quartz crystal microbalance,
surface plasmon resonance, x-ray photoelectron spectroscopy and fluorescence-based
techniques. The main plasma polymerization parameter important for surface chemical
content, specifically nitrogen to carbon content, was identified as being glow discharge
power, while reaction time and power determined plasma film thickness. Moreover, plasma
films were shown to be stable in aqueous environments. Covalently-bound poly(ethylene
glycol) (PEG) layers physicochemical and mechanical properties are dependent on
fabrication methods. Polymer concentration in solution is an important indicator of final layer
properties, and use of a theta solvent induces complex aggregation phenomena in solution
yielding layers with widely different properties. Chemically available primary amine groups
are also shown to be present, paving the way for the immobilization of bio-active molecules.
An application of low-fouling locally modified surfaces is given in Chapter 4 by the
development of a novel diagnostic surface to evaluate platelet activation which is until now
very difficult as platelets are readily activated by in vitro manipulations. Significant results
from volunteer donors indicate that this diagnostic instrument has the potential to allow the
rapid estimation of platelet activation levels in whole blood.

III
REMERCIEMENTS
J’aimerais exprimer mes plus profonds remerciements au Professeur Patrick Vermette qui a
été tout au long de mon travail un guide, un mentor et surtout un ami. Je ne serais pas le
scientifique que je suis devenu sans toi.
J’aimerais remercier le Conseil de Recherche en Sciences Naturelles et Génie du Canada
pour leur important appui financier tout au long de mes études.
J’aimerais remercier mes collègues étudiants, les divers professionnels de recherche que j’ai
côtoyés, les professeurs du département de génie chimique, ainsi que les chercheurs qui
m’ont appuyé au fil de mes travaux.
Surtout, j’aimerais remercier ma muse, Nadia. Tu es une étoile qui brille pour moi. Toujours.
Partout.
IV
TABLE DES MATIÈRES
INTRODUCTION ET CONTEXTE.....……………………………………………………………….1
INTODUCTION AND CONTEXT….…………………………………………………………………4
1. CELL-MATERIAL INTERACTIONS IN A THREE-DIMENSIONAL ENVIRONMENT……...7
1.1 Introduction……………………………………………………………………………………….9
1.2 Cells in three-dimensional environments………………………………………………….10
1.3 Parameters of 3D systems……………………………………………………………………16
1.3.1 Mechanical signals…………………………………………………………………………….16
1.3.2 Textures………………………………………………………………………………………...19
1.3.3 Biochemical signals…………………………………………………………………………...20
1.3.4 Transport properties…………………………………………………………………………..21
1.4 In vivo cell-matrix interactions………………………………………………………………22
1.5 Ex vivo 3D culture systems………………………………………………………………….23
1.5.1 Natural materials……………………………………………………………………………...23
1.5.2 Synthetic materials……………………………………………………………………………25
1.6 Discussion………………………………………………………...…………………………….26
1.7 References………………………………………………………………………………………27
2. STUDY OF THE EFFECT OF PROCESS PARAMETERS FOR N-HEPTYLAMINE
PLASMA POLYMERIZATION ON FINAL LAYER PROPERTIES…………………………….33
2.1 Introduction……………………………………………………………………………………..35
2.2 Experimental section………………………………………………………………………….36
2.2.1 Description of the plasma reactor system…………………………………………………..36
2.2.2 Plasma polymerization process operating conditions……………………………………..38
2.2.3 Elemental composition of the n-heptylamine plasma polymer (HApp) films by X-ray
photoelectron spectroscopy (XPS)…………………………………………………………………38
2.2.4 HApp film thickness by surface plasmon resonance (SPR) measurements……………39
2.2.5 HApp film thickness by atomic force microscopy (AFM) step height measurements….40
2.2.6 Swelling and stability of HApp films by quartz crystal microbalance (QCM)
measurements………………………………………………………………………………………..41
2.2.7 Factorial design and statistical analysis…………………………………………………….41
2.3 Results and discussion……………………………………………………………………….42
V
2.3.1 Statistical analysis of HApp film thickness by SPR………………………………………..42
2.3.2 HApp film thickness by AFM…………………………………………………………………46
2.3.3 Analysis of the stability and swelling of HApp layers in aqueous media by QCM……...48
2.3.4 Surface chemical composition by XPS………………………………………………….…..49
2.4 Conclusion………………………………………………………………………………………54
2.5 References………………………………………………………………………………………55
3. LOW-FOULING AMINE-TERMINATED POLY(ETHYLENE GLYCOL) THIN LAYERS
AND EFFECT OF IMMOBILIZATION CONDITIONS ON THEIR MECHANICAL AND
PHYSICOCHEMCIAL PROPERTIES……………………………………………………………..57
3.1 Introduction……………………………………………………………………………………..59
3.2 Experimental section………………………………………………………………………….61
3.2.1 Plasma polymer surfaces…………………………………………………………………….61
3.2.2 PEG layer fabrication………………………………………………………………………….61
3.2.3 Surface chemical composition by X-ray photoelectron spectroscopy (XPS)……………62
3.2.4 Viscoelastic properties of PEG layers and protein adsorption by quartz crystal
microbalance (QCM)…………………………………………………………………………………62
3.2.5 PEG layers structure by atomic force microscopy (AFM)…………………………………63
3.2.6 PEG aggregation measurements during cloud point conditions…………………………64
3.2.7 Chemical bonding of carboxyfluorescein to the amine-bearing PEG surfaces…………65
3.3 Results and discussion……………………………………………………………………….65
3.3.1 Chemical properties of the PEG layers……………………………………………………..65
3.3.2 PEG layer resistance to protein adsorption………………………………………………...68
3.3.3 Polymer layer mechanical properties by QCM and AFM measurements……………….77
3.3.4 Agglomeration kinetics of PEG molecules in theta solvent……………………………….81
3.3.5 Chemical bonding properties of the de-protected PEG layers……………………………85
3.4 Conclusion………………………………………………………………………………………87
3.5 References………………………………………………………………………………………88
4. INSTRUMENT AND TECHNIQUE FOR THE IN VITRO SCREENING OF PLATELET
ACTIVATION FROM WHOLE BLOOD SAMPLES……………………………………………...90
4.1 Introduction……………………………………………………………………………………..92
4.2 Experimental method………………………………………………………………………….93
4.3 Results and discussion……………………………………………………………………...101

VI
4.4 Conclusions……………………………………………………………………………………107
4.5 References……………………………………………………………………………………..108
VII
FIGURES
Figure 1.1 Key conceptual differences between 2D and 3D culture systems…………………10
Figure 1.2 Human fibroblasts project a dendritic network of extensions in collagen matrices
but not on collagen-coated coverslips……………………………………………………………..12
Figure 1.3 Cellular activities of HUVEC grown on two-dimensional (2D) culture dishes (A) and
cultured in 3D collagen gel matrices (B)…………………………………………….…………….14
Figure 1.4 In vivo 3D-matrix adhesions differ from focal or fibrillar adhesions on 2D
substrates……………………………………………………………………………………………..20
Figure 2.1 Schematic of the plasma reactor set-up………………………………………………37
Figure 2.2 Typical thickness versus refractive index curves obtained in air and water using
Fresnel modeling of SPR data at determined refractive indexes……………………………… 40
Figure 2.3 A) Half-normal plot of the effects of the four studied operating parameters and their
interactions on the SPR thickness of HApp layers. B) Half-normal plot of the effects of the
studied operating parameters and their interactions on the refractive index of HApp layers..42
Figure 2.4 Square plot summarizing the influence of power and deposition time on the
thickness of HApp layers……………………………………………………………………………46
Figure 2.5 Typical AFM step height measurement image of a HApp layer deposited on mica
and corresponding line plot of the section relative height……………………………………….47
Figure 2.6 Typical QCM HApp hydratation result……………………………………………...…49
Figure 2.7 Half-normal plot of the effects of the four studied operating parameters and their
interactions on the XPS N/C ratio…………………………………………………………………..52
Figure 3.1 XPS C 1s high-resolution spectra of different PEG-covered samples…………….67
Figure 3.2 QCM hydration data of four PEG-covered surfaces…………………………………72
Figure 3.3 dynamic data of protein adsorption on different PEG-covered surfaces………….75
Figure 3.4 Compression AFM force curves for different PEG samples………………………..80
Figure 3.5 Size distribution of PEG agglomerates in theta solvent in number %....................83
Figure 3.6 Mean PEG aggregate size in theta solvent in volume % as a function of time…..84
Figure 3.7 Fluorescence intensity measured from covalently-bound CF fluorescence intensity
and adsorbed CF for different PEG layers………………………………………………………..86
Figure 4.1: Schematic of the platelet activation measurement technique……………………..94
Figure 4.2: Protein array design used to measure platelet activation………………………….96
Figure 4.3: Typical ELISA result showing local NBT-NCIB precipitation upon reaction with
surface-immobilized secondary antibody………………………………………………………….97

VIII
Figure 4.4: Flow chamber designed to 1) circulate blood between parallel plates at a selected
surface shear rate, 2) limit blood exposure to air and, 3) allow continuous observation of
samples during blood circulation…………………………………………………………………...98
Figure 4.5: Simulation results showing shear rate distribution in the flow chamber for a
6ml/min flow rate……………………………………………………………………………………102
Figure 4.6: Fluorescently-labeled surface-adhered platelets on anti-CD62 50�g/ml spots with
artificial activation of the platelets using collagen (A) and without artificial activation (B) and
on anti-CD61 50�g/ml spots with artificial activation of the platelets using collagen (C) and
without artificial activation (D)……………………………………………………………………..105
IX
TABLES
Table 2.1 Thresholds of the operating parameters of n-heptylamine plasma polymerization 42
Table 2.2 Experimental operating conditions studied in the 2k factorial design analysis and
corresponding thickness and refractive index obtained by SPR measurements……………..43
Table 2.3 Repeatability of the plasma polymerization process and comparison of the HApp
layer thicknesses measured by SPR and AFM…………………………………………………..48
Table 2.4 XPS nitrogen, oxygen and fluorine to carbon atomic ratios (%) in HApp films
produced using 8 different operating conditions………………………………………………….50
Table 3.1 XPS survey data for different PEG-treated samples…………………………………66
Table 3.2 QCM results presenting protein adsorption on different PEG-coated quartz crystals
at steady state………………………………………………………………………………………..69
Table 3.3 QCM results (delta f and delta �) of PEG layers immobilized on HApp-activated
quartz crystals for different experimental conditions……………………………………………. 78
Table 4.1 Summary of platelet detection results and corresponding statistical analysis…...106
1
INTRODUCTION ET CONTEXTE
Les applications à l’intérieur desquelles les interactions cellules-matériaux sont spécifiques et
les niveaux de bruits sont minimisés sont inexistants dans la littérature scientifique. En effet,
des surfaces antiadhésives efficaces qui parviennent à diminuer fortement l’adsorption des
protéines et permettent des modifications locales en vue d’induire des interactions cellulaires
spécifiques ne sont pas disponibles pour le moment. De tels systèmes sont hautement
désirables pour un grand nombre d’applications qui incluent le génie tissulaire, l’utilisation in
vitro de modèles tissulaires 3D et le diagnostic médical basé sur les cellules. Par exemple, il
est connu que la culture cellulaire 3D présente des aspects très différents comparativement à
la culture 2D [LEWIS et al., 1924; WEISS, 1959]. Par contre, la culture 3D, incluant le génie
tissulaire, manque toujours de surfaces qui présentent des signaux localisés tout en limitant
les interactions non spécifiques pouvant être utilisés pour la culture de plusieurs types de
tissus. Ceci est démontré par une revue de littérature sur la culture cellulaire 3D, qui
constitue le Chapitre 1 de cette thèse.
De cette façon, ce travail doctoral a été entrepris avec l’objectif de développer des surfaces
utilisables qui diminuent ou éliminent l’adsorption non spécifique de protéines et permettent
l’immobilisation covalente locale de signaux bioactifs pour moduler les réponses cellulaires.
Comme première étape vers l’objectif, une gamme de surface a été activée chimiquement
par la polymérisation par plasma. Cette technique permet la création de revêtements aminés
qui peuvent ensuite être utilisés pour améliorer les propriétés antiadhésives du matériau.
Même si ces surfaces ont déjà été obtenues par la polymérisation par plasma [GRIESSER,
1989; VERMETTE et al., 2002; YANG et al., 2000], aucune étude ne rapporte l’effet des
paramètres du procédé sur certaines propriétés fondamentales des couches minces, telles la
stabilité des couches et leur contenu en azote. Dans le contexte de ce travail doctoral, ces
propriétés ont de fortes chances d’être vitales sur les interactions cellules-matériaux finales,
comme les propriétés antiadhésives. De cette façon, le Chapitre 2 présente une étude
menée en vue de connaître l’effet des paramètres du procédé de polymérisation par plasma
sur les propriétés finales des couches.
La présence d’une couche antiadhésive réactive chimiquement est critique à la mise sur pied
de systèmes de culture cellulaire avec interactions locales. Ici, des chaînes de poly(éthylène
glycol) (PEG) ont été immobilisées sur des surfaces réactives générées par plasma. Ce
polymère possède de bonnes propriétés antiadhésives dû à la résistance des couches de
2
PEG à l’adsorption de protéines. Cependant, les propriétés physicochimiques qui mènent à
ce phénomène ne sont pas encore totalement comprises, notamment en ce qui a trait à la
corrélation entre les modes d’immobilisation et les propriétés protéines et cellules-matériau
résultantes [GOLANDER et al., 1992; HARDER et al., 1998]. Ainsi, le Chapitre 3 vise au
développement de surfaces à base de PEG optimisées et bien caractérisées pouvant être
modifiées localement. L’attention a été portée sur l’effet de paramètres de la réaction
d’immobilisation sur les propriétés physicochimiques et mécaniques des couches de PEG
hydratées. De plus, des techniques proches de celles utilisées pour la manufacture de puces
à ADN ont été adaptées pour créer des motifs des molécules liées de façon covalente aux
couches de PEG en vue de permettre la fabrication de systèmes de culture avec signaux
locaux spécifiques et minimisation du bruit.
Le Chapitre 4 présente une application importante des systèmes développés et étudiés dans
cette thèse, soit le développement et la mise à l’essai de surfaces diagnostiques pour
l’évaluation de l’activation plaquettaire à partir d’échantillons de sang complet. L’activation
plaquettaire est une donnée clinique de première importance. Une augmentation de
l’activation plaquettaire indique en effet un risque accru d’accident vasculaire [MATSAGAS et
al., 2002; SMITH et al., 1999]. Par contre, cette mesure est pratiquement impossible en
clinique à l’heure actuelle, surtout en raison des nombreuses interactions non spécifiques qui
activent artificiellement les plaquettes [PREDECKI et al., 1980; RAND et al., 2003].
L’activation plaquettaire vise dans ce travail à être détectée par l’utilisation de couches
minces de PEG immobilisées sur des couches générées par plasma et modifiées localement
par des signaux spécifiques aux plaquettes activées.
GOLANDER, C, HERRON, J., LIM, K., CLAESSON, P., STENIUS, P., ANDRADE, J. (1992) In Poly(ethylene glycol) Chemistry, Biotechnical and Biomedical Applications; Harris, J., Ed., Plenum Press, p 221-245.
GRIESSER, H J (1989) Small-Scale Reactor for Plasma Processing of Moving Substrate Web, Vacuum, 39, p. 485-488.
HARDER, P, GRUNZE, M., DAHINT, R., WHITESIDES, G. M., LAIBINIS, P. E. (1998) Molecular conformation in oligo(ethylene glycol)-terminated self-assembled monolayers on gold and silver surfaces determines their ability to resist protein adsorption, Journal of Physical Chemistry B, 102, p. 426-436.
3
LEWIS, W H, LEWIS, M. R. (1924) Behavior of cells in tissue cultures, in General Cytology, COWDRY, E.V. editor, University of Chicago Press, p.384-447.
MATSAGAS, M I, GEROULAKOS, G., MIKHAILIDIS, D. P. (2002) The role of platelets in peripheral arterial disease: therapeutic implications, Annals of Vascular Surgery, 16, p. 246-258.
PREDECKI, P, LIFE, L., RASSEL, P. A. (1980) Measurement of the activation time for platelet adhesion to foreign surfaces, Journal of Biomedical Materials Research, 14, p. 417-426.
RAND, M L, LEUNG, R., PACKHAM, M. A. (2003) Platelet function assays, Transfusion & Apheresis Science, 28, p. 307-317.
SMITH, N M, PATHANSALI, R., BATH, P. M. (1999) Platelets and stroke, Vascular Medicine, 4, p. 165-172.
VERMETTE, P, MEAGHER, L. (2002) Immobilization and characterization of poly(acrylic acid) graft layers, Langmuir, 18, p. 10137-10145.
WEISS, P (1959) Cellular dynamics, Reviews of Modern Physics, 31, p. 11-20.
YANG, X J, FANE, A. G., BI, J., GRIESSER, H. J. (2000) Stabilization of supported liquid membranes by plasma polymerization surface coating, Journal of Membrane Science, 168, p. 29-37.
4
INTRODUCTION AND CONTEXT
Applications for which cell-material interactions are specific and non-specific interactions (or
noise levels) are minimized are inexistent in the scientific literature. Indeed, efficient low
fouling surfaces (i.e., surfaces that lower protein adsorption and cell interactions) that strongly
limit protein adsorption and allow localized modification to induce specific cellular interactions
are not available currently. Such systems are highly desirable for a wide range of applications
including tissue engineering, in vitro use of 3D cell and tissue culture models and cell-based
medical diagnostic. For example, although it has been known for many years that cell growth
in 3D presented widely different aspects compared to 2D culture [LEWIS et al., 1924; WEISS,
1959] , cell growth in 3D environments, which includes tissue engineering, still lacks surfaces
that present localized signaling and limit non specific interactions to be applicable for the
culture of many tissue types, as shown by a literature review on cell culture in 3D, which
constitutes Chapter 1 of this thesis.
As such, this doctoral work was undertaken to develop usable surfaces that strongly or
eliminate non specific protein adsorption and allow localized covalent immobilization of
bioactive signals to modulate specific cell responses. As a first step towards that objective, a
wide range of surfaces were chemically activated using plasma polymerization. This
technique allows the creation of amine coatings that can then be used to improve material
low fouling characteristics. Although amine surfaces had previously been obtained using
plasma polymerization [GRIESSER, 1989; VERMETTE et al., 2002; YANG et al., 2000], no
study reported the systemic effect of process parameters on critical coating properties such
as amine content and coating thickness. In the context of this doctoral work, these properties
are likely to be important on final cell-material interactions, including low fouling
characteristics and film stability. Thus, Chapter 2 presents a study conducted to evaluate the
effect of process parameters on coating properties.
Critical to cell culture systems with localized signaling is the presence of a chemically reactive
low fouling layer, in this case immobilized on plasma-treated surfaces. Poly(ethylene glycol)-
modified (PEG-modified) possess good low fouling properties and exhibit this potential mainly
through their resistance to non-specific protein adsorption. However, it is not yet clear what
forces predominantly come into play to repel proteins from adhering to varyingly ordered
hydrated PEG layers. Questions remain on the correlation between PEG immobilization
techniques and resulting protein and cell-material interactions [GOLANDER et al., 1992;
5
HARDER et al., 1998]. Then, Chapter 3 of this work is aimed at developing an optimized and
characterized PEG-based system to allow the localized covalent binding of a variety of bio-
active molecules onto a wide range of substrates. Efforts were placed to understand the
effect of reaction parameters on physicochemical and mechanical hydrated PEG layer
properties. Moreover, techniques originating from DNA and protein chip manufacture were
also used to allow the creation of patterns of covalently-bound molecules onto the PEG
layers to allow the fabrication of functional locally reactive cell culture systems with low noise
levels, that is in which non-specific interactions are minimized.
Chapter 4 presents an important application of the cell culture systems developed and
studied in this thesis. Diagnostic surfaces to evaluate platelets activation from whole blood
samples were designed and tested. Platelet activation is a very important clinical parameter:
An increased platelet activation level in circulating blood has been demonstrated to be an
important stroke risk factor and is thought to precede strokes [MATSAGAS et al., 2002;
SMITH et al., 1999]. However, it is as yet impossible to measure efficiently in the clinic due
mainly to non-specific cell-material interactions [PREDECKI et al., 1980; RAND et al., 2003].
In this work, platelet activation in whole blood was detected by using PEG layers immobilized
onto plasma-treated surfaces that lower protein adsorption and platelet adhesion while
presenting local bio-signaling to selectively attach activated platelets.
GOLANDER, C, HERRON, J., LIM, K., CLAESSON, P., STENIUS, P., ANDRADE, J. (1992) In Poly(ethylene glycol) Chemistry, Biotechnical and Biomedical Applications; Harris, J., Ed., Plenum Press, p 221-245.
GRIESSER, H J (1989) Small-Scale Reactor for Plasma Processing of Moving Substrate Web, Vacuum, 39, p. 485-488.
HARDER, P, GRUNZE, M., DAHINT, R., WHITESIDES, G. M., LAIBINIS, P. E. (1998) Molecular conformation in oligo(ethylene glycol)-terminated self-assembled monolayers on gold and silver surfaces determines their ability to resist protein adsorption, Journal of Physical Chemistry B, 102, p. 426-436.
LEWIS, W H, LEWIS, M. R. (1924) Behavior of cells in tissue cultures, in General Cytology, COWDRY, E.V. editor, University of Chicago Press, p.384-447.
MATSAGAS, M I, GEROULAKOS, G., MIKHAILIDIS, D. P. (2002) The role of platelets in peripheral arterial disease: therapeutic implications, Annals of Vascular Surgery, 16, p. 246-258.
6
PREDECKI, P, LIFE, L., RASSEL, P. A. (1980) Measurement of the activation time for platelet adhesion to foreign surfaces, Journal of Biomedical Materials Research, 14, p. 417-426.
RAND, M L, LEUNG, R., PACKHAM, M. A. (2003) Platelet function assays, Transfusion & Apheresis Science, 28, p. 307-317.
SMITH, N M, PATHANSALI, R., BATH, P. M. (1999) Platelets and stroke, Vascular Medicine, 4, p. 165-172.
VERMETTE, P, MEAGHER, L. (2002) Immobilization and characterization of poly(acrylic acid) graft layers, Langmuir, 18, p. 10137-10145.
WEISS, P (1959) Cellular dynamics, Reviews of Modern Physics, 31, p. 11-20.
YANG, X J, FANE, A. G., BI, J., GRIESSER, H. J. (2000) Stabilization of supported liquid membranes by plasma polymerization surface coating, Journal of Membrane Science, 168, p. 29-37.
7
CHAPITRE 1
INTÉRACTIONS CELLULES-MATÉRIAUX DANS UN ENVIRONNEMENT
TRIDIMENSIONNEL
Résumé
Les systèmes de culture cellulaire utilisés au cours du dernier siècle sont majoritairement de
type bidimensionnel (2D), c'est-à-dire qu’à l’intérieur des systèmes les cellules sont exposés
à la force gravitationnelle et à une forte polarité de leur environnement. Les avancées
récentes du génie tissulaire et des techniques d’imagerie cellulaire permettent maintenant
certaines formes de culture dans des environnements tridimensionnels (3D). Plusieurs
observations récentes effectuées à l’aide de ces systèmes révèlent une importante disparité
par rapport aux observations issues de systèmes de culture 2D. Par contre, la nature des
observations issues des systèmes 3D comporte à ce jour une importante variabilité qui peut
être attribuée aux divers matériaux utilisés pour la fabrication des systèmes, aux
phénomènes de transfert de matière à proximité des cellules, ainsi qu’aux champs de forces
exercés sur les cellules par leur matrice environnante. Ce chapitre vise à résumer, à partir de
la littérature scientifique, les observations les plus importantes effectuées sur des systèmes
3D au cours des dernières années, en plus de présenter les caractéristiques biochimiques,
mécaniques et de transfert de masse de divers systèmes 3D fabriqués à partir de molécules
naturelles ou synthétiques en vue d’obtenir une image complète de l’importance de
l’utilisation des ces systèmes et de comprendre l’importance de plusieurs paramètres sur les
réponses cellulaires observées.
8
CELL-MATERIAL INTERACTIONS IN A THREE-DIMENSIONAL ENVIRONMENT
Abstract
In the last century, the cell culture systems used to conduct in vitro research have been
predominantly of the two-dimensional (2D) type, which is to say that cells within these
systems were exposed to the gravitational force and to polarity of their environment. Recent
advances in tissue engineering and in cell imaging techniques now allow certain forms of
culture in three-dimensional (3D) environments. Recently, an important number of
observations taken from 3D systems show large discrepancies compared to observations
taken from 2D systems. Furthermore, important variability has been observed for 3D systems
which can be attributed to the diverse nature of the materials used, mass transfer properties
of the system and force fields applied on the cells by their surroundings. The aim of this
review chapter is to outline the most important observations recently taken from 3D systems,
as well as describe the biochemical, mechanical and transport properties of commonly used
3D cell culture systems. This is accomplished in order to understand the effect of 3D systems
parameters on cell response and to outline the importance of 3D systems to study cells in
vitro.
9
1.1 Introduction
The growth of cells in a three-dimensional (3D) environment is not a novel idea in biology.
More than 50 years ago [WEISS, 1959], experiments showed differences between the shape
of fibroblasts cultivated in blood plasma clots relatively to the orientation of the fibrous
network of the clot, hinting at the importance of the 3D surroundings of the cells on their
behaviour. Around the same time, mesenchymal cells cultivated on glass cover slips showed
stress fibres seldom encountered in vivo [LEWIS et al., 1924]. Despite these results,
however, 2D systems have been until recently the principle vehicle for in vitro cell study,
principally due to their relative ease of use. The current knowledge in cellular physiology,
genetics and proteomics has in large part been influenced by experiments in which cells were
artificially growth on flat surfaces, often plastics. Early-phase drug testing is also largely
accomplished in 2D environments while further validation is accomplished in animal models,
which are expensive and not completely comparable with human organisms.
In the last 10 to 15 years, the advancements in cellular characterization techniques (e.g.,
genomics, proteomics, PCR, microscopy) coupled with their increasing availability has fuelled
the scientific interest of creating and studying more representative cell culture systems. At the
same time, the emergence of tissue engineering has brought to the forefront the need to use
3D environment akin to the in vivo reality. These developments have yielded a large quantity
of scientific data that shatter in many particular cases findings derived from data collected
using 2D cell culture systems. An important number of conflicting data has thus emerged
form the comparison of studies conducted in different environments.
Any physical system that does not cause 1) bi-polar asymmetry conditions relatively to the
cell for all the cells in culture (i.e, the cell is exposed to culture conditions widely different on
one side compared to the other, not due to local effects, such as in culture plates) and 2)
flattening of the cells under the action of gravity due to the lack of mechanical support is
considered here to be a three-dimensional system. The emergence of these systems has
outlined the importance of many variables that did not have to be considered when cultivating
cells in 2D. In addition to usual considerations such as nutritive media composition, cell
density, dissolved gas composition and surface chemistry, variables such as extra-cellular
matrix (ECM) chemical composition (3D systems have been fabricated from materials derived
from in vivo constituents, such as the ECM, and from synthetic materials), and mechanical
properties are essential to define 3D culture systems. The mechanical properties of the
10
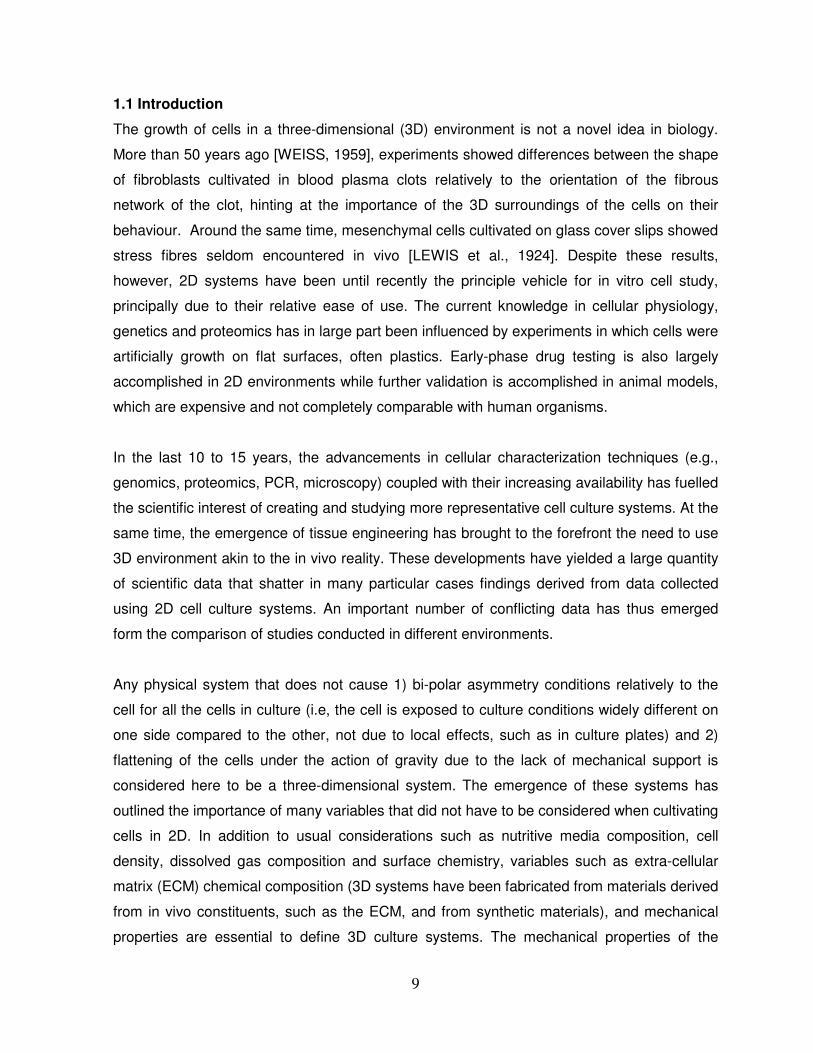
support matrix and its integration in a culture system (e.g., bioreactor) will define the force
field which will impact cell response. The flux of metabolites and nutrient gases imposed on
3D systems will also greatly contribute to define cell responses. These concepts are
illustrated in Figure 1.1.
Figure 1.1 Key conceptual differences between 2D and 3D culture systems
The aim of this chapter is to first present key results obtained in 3D environments. Then, the
important parameters of 3D systems, the mechanical, biochemical and transport properties of
the matrix surrounding the cultivated cells will be discussed. Finally, important culture
systems made from natural and synthetic materials will be reviewed, along with reported
uses.
1.2 Cells in three-dimensional environments
A large number of experiments have undoubtedly demonstrated dramatic variations in
cellular responses when cultivating cells in a 3D environment compared to typical flat culture
plates. Important differences in key biochemical events, cell shapes and cell motility have
been observed and characterized. Morphological differences often strike the imagination and
perhaps best convince of the huge gap between cell physiology in 2D and in 3D. For
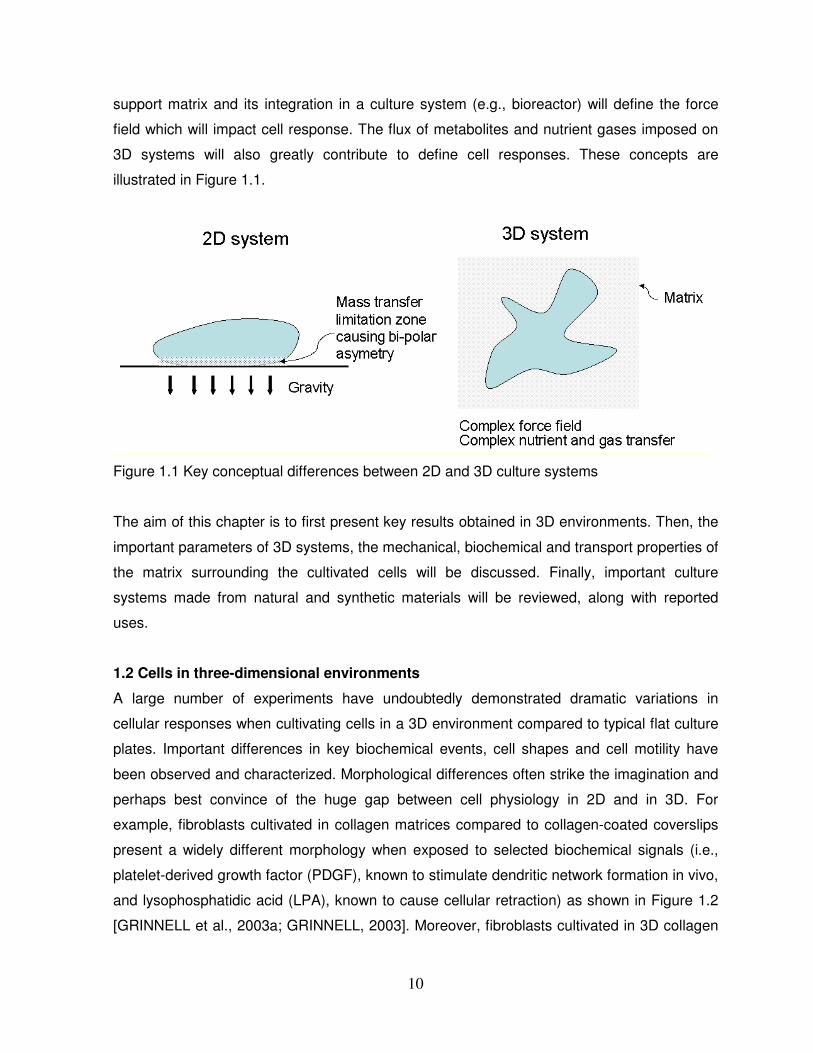
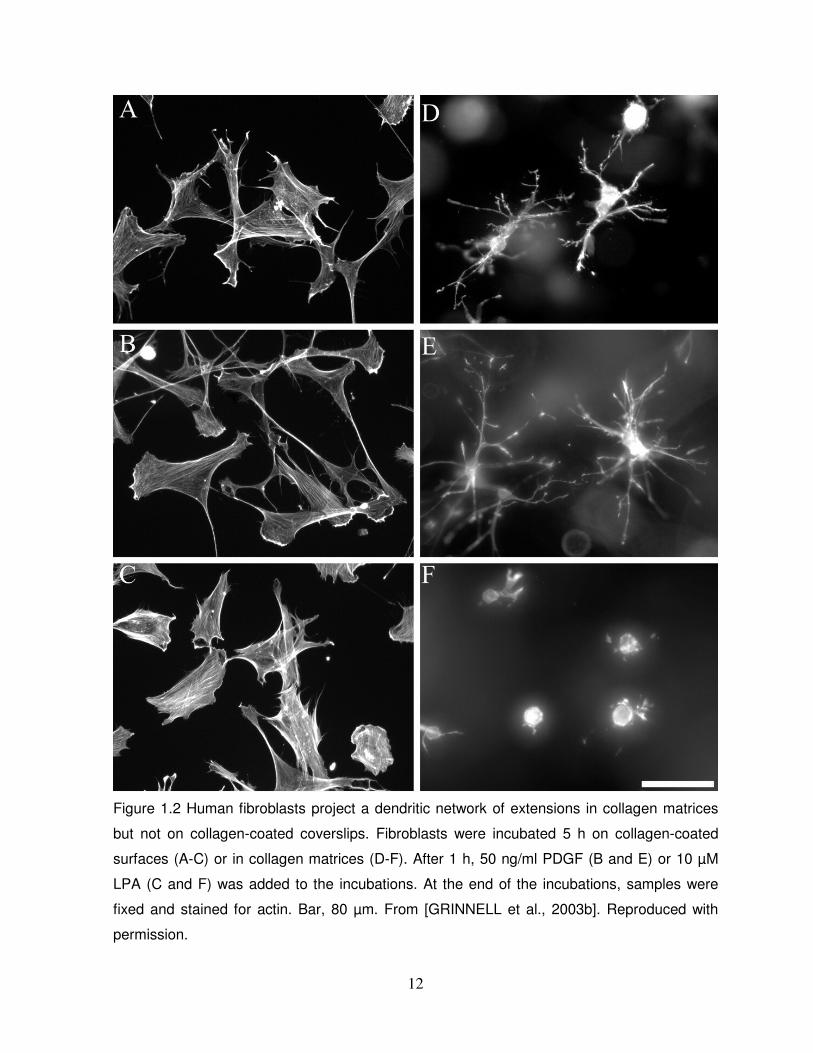
example, fibroblasts cultivated in collagen matrices compared to collagen-coated coverslips
present a widely different morphology when exposed to selected biochemical signals (i.e.,
platelet-derived growth factor (PDGF), known to stimulate dendritic network formation in vivo,
and lysophosphatidic acid (LPA), known to cause cellular retraction) as shown in Figure 1.2
[GRINNELL et al., 2003a; GRINNELL, 2003]. Moreover, fibroblasts cultivated in 3D collagen
11
matrices show important differences to growth factor stimulation and proliferative status that
impact the mechanical loading of the matrix [BROWN et al., 2002]. Mechanically loaded
matrices stimulate the differentiation of fibroblasts into myofibroblasts [GRINNELL, 2000].
Finally, mechanical tension is also important in wound repair as the minimisation of wound
tension is known to lower scarring. This can be plausibly explained by the well-known fact
that fibroblasts located in scar tissue tend to undergo apoptosis and lowered growth-factor
receptor signalling in mechanically unloaded matrices [CARLSON et al., 2002; HINZ et al.,
2001].
12
Figure 1.2 Human fibroblasts project a dendritic network of extensions in collagen matrices
but not on collagen-coated coverslips. Fibroblasts were incubated 5 h on collagen-coated
surfaces (A-C) or in collagen matrices (D-F). After 1 h, 50 ng/ml PDGF (B and E) or 10 µM
LPA (C and F) was added to the incubations. At the end of the incubations, samples were
fixed and stained for actin. Bar, 80 µm. From [GRINNELL et al., 2003b]. Reproduced with
permission.
13
During embryonic development, wound healing and in diseases such as cancer, cells migrate
extensively in the ECM. Cell locomotion in 3D is widely different from the distinct focal
contacts and stress fibers observed in haptokinetic cell migration in 2D culture systems
[FRIEDL et al., 2000]. Spindle-shaped cells such as fibroblasts, many tumor cells and
endothelial cells constantly reorganize their surrounding ECM through, for example, serin
proteases and metalloproteinases-mediated proteolysis, and interact constantly with the ECM
through the large number of integrins located on the surface of these cells in order to migrate
in 3D systems [BIRKEDAL-HANSEN, 1995; SHAPIRO, 1998]. On the other hand, cells with
low levels of integrins such as T lymphocytes and dendritic cells are reported to adapt their
morphology to their surroundings in order to migrate [FRIEDL et al., 2000]. As such, cell-
material interactions such as the location of receptor-binding sites or material architecture are
very important for cell locomotion in 3D surroundings while this interaction can vary
importantly for different types of cells and from the movement of cells in 2D culture systems.
It should also be noted that cells will migrate along physical structures of defined shapes both
in 2D and 3D environments due mainly to lowered resistance to pseudopod formation along
oriented structures [FRIEDL et al., 1997; SMILENOV et al., 1999].
Another example is angiogenesis, the formation of new capillaries from existing blood
vessels, which is present in various physiological processes whether they be normal, such as
embryogenesis and wound healing, or abnormal such as in developing cancer masses. Much
research has been conducted on the formation of blood capillaries using model cells in vitro.
In particular, human umbilical vein endothelial cells (HUVECs) have been extensively used to
model angiogenesis in vitro. Large developments have been achieved in understanding
important cell-material interactions linked to angiogenesis, and these developments are
reviewed in a later chapter of this thesis. Angiogenesis models have recently been shown to
exemplify the importance of studying cells in the third dimension rather than on flat surfaces.
Indeed, the importance of the extra-cellular matrix (ECM) for angiogenesis has been
documented for 2D models. Lately, however, evidence suggests that 3D models yield
dramatic differences in cell behaviour. Important cellular signalling pathways for
angiogenesis, such as mitogen activated protein (MAP) kinases and extra-cellular signal-
regulated kinases (ERK) pathways have both been shown to be strongly influenced by the
use of 3D collagen and fibrin environments compared to 2D models [YANG et al., 2004].
Moreover, the same study, by comparing 2D cell culture systems with collagen and fibrin
14
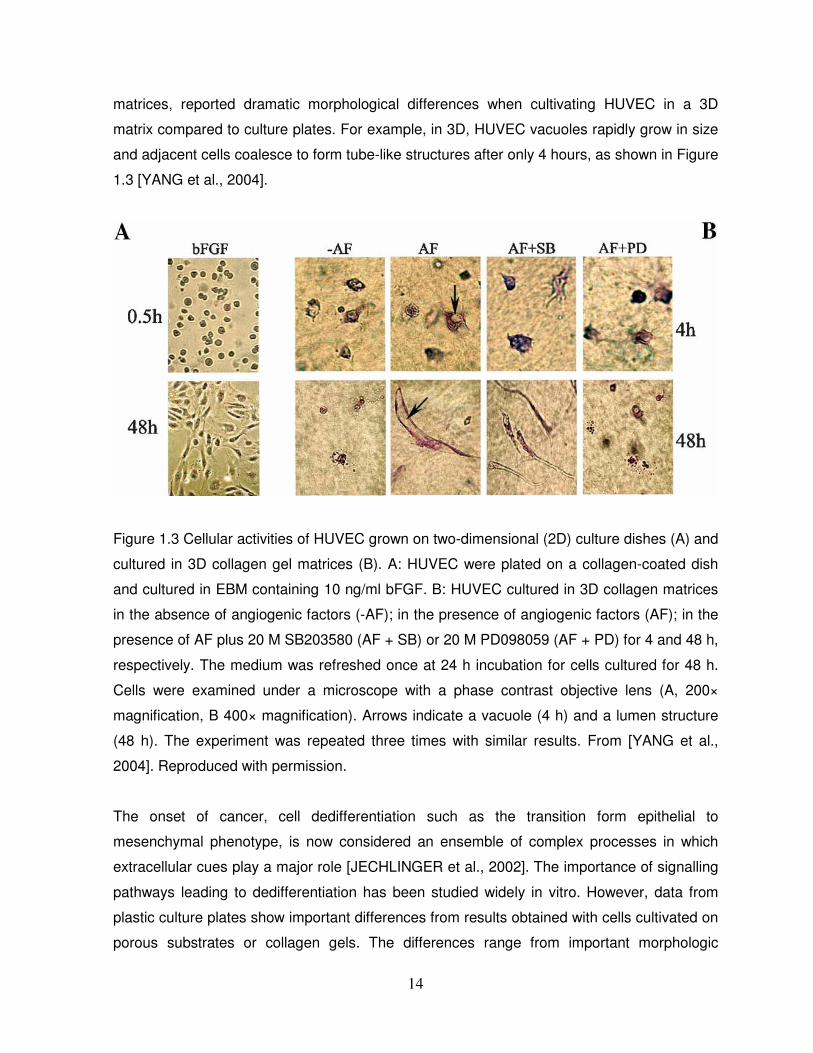
matrices, reported dramatic morphological differences when cultivating HUVEC in a 3D
matrix compared to culture plates. For example, in 3D, HUVEC vacuoles rapidly grow in size
and adjacent cells coalesce to form tube-like structures after only 4 hours, as shown in Figure
1.3 [YANG et al., 2004].
Figure 1.3 Cellular activities of HUVEC grown on two-dimensional (2D) culture dishes (A) and
cultured in 3D collagen gel matrices (B). A: HUVEC were plated on a collagen-coated dish
and cultured in EBM containing 10 ng/ml bFGF. B: HUVEC cultured in 3D collagen matrices
in the absence of angiogenic factors (-AF); in the presence of angiogenic factors (AF); in the
presence of AF plus 20 M SB203580 (AF + SB) or 20 M PD098059 (AF + PD) for 4 and 48 h,
respectively. The medium was refreshed once at 24 h incubation for cells cultured for 48 h.
Cells were examined under a microscope with a phase contrast objective lens (A, 200×
magnification, B 400× magnification). Arrows indicate a vacuole (4 h) and a lumen structure
(48 h). The experiment was repeated three times with similar results. From [YANG et al.,
2004]. Reproduced with permission.
The onset of cancer, cell dedifferentiation such as the transition form epithelial to
mesenchymal phenotype, is now considered an ensemble of complex processes in which
extracellular cues play a major role [JECHLINGER et al., 2002]. The importance of signalling
pathways leading to dedifferentiation has been studied widely in vitro. However, data from
plastic culture plates show important differences from results obtained with cells cultivated on
porous substrates or collagen gels. The differences range from important morphologic
15
differences upon biochemical signal exposition [NIEMANN et al., 1998] to variations in
apoptosis levels [OFT et al., 1996].
3D models have recently been used to study the mechanism of apoptosis in adult tissues. It
has been known for a long time that very important differences exist between the survival of
cancer cells embedded in 3D spheroid bodies compared to tumors grown in flat surfaces
when exposed to death stimuli [KUNZ-SCHUGHART et al., 1996; YU et al., 2002]. Also, the
presence of a larger number of adhesion molecules for cancer cells in a 3D environment is
suspected to be responsible for the drug resistance of certain types of cancers [SANTINI et
al., 2000]. These phenomena have been an obstacle for the in vitro discovery of novel anti-
cancer agents.
Aberrations in the apoptosis pathway in adult tissues are known to be an important factor in
the pathogenesis of cancer, among other diseases [ZAHIR et al., 2004]. Although thorough
apoptosis studies have been carried out using traditional single-cell cultures, its study in more
realistic 3D culture models is now thought to lead to a more conclusive understanding of its
mechanisms and, thus, of cancer [ZAKERI et al., 2002]. The loss of important cell-ECM
interactions has been associated with apoptosis for many tissue types. For example, the loss
of specific integrin-mediated interactions has been shown to result in apoptosis for neural and
mammary gland tissue, among others [DEBNATH et al., 2002; GOH et al., 1997]. While 2D
cultures have been used to reveal important adhesion mechanisms for apoptosis,
experiments conducted using 3D systems pointed towards the likelihood of more complex
apoptosis signalling regulation. For example, lumen formation by cell apoptosis during
mammary morphogenesis was shown not to be simply due to the loss of ECM interactions as
suggested by 2D studies, but to much more intricate phenomena [DEBNATH et al., 2002].
Among others, the polarity induced by 3D epithelial tissue architecture is though to be a
critical aspect of apoptosis regulation [ZAHIR et al., 2004], as are the differences in
mitochondria homeostasis modulation in 3D tissues compared to 2D cultures [IGNEY et al.,
2002].
Although the causes of the previous observations for different cell types in 3D compared with
traditional culture systems are not always understood, some general conclusions can be
drawn as to the underlying mechanisms guiding these events. 3D environments have the
capacity to convey a large spectre of mechanical stimuli, as well as to present a large array of
16
textures or shapes to attached cells, when compared to flat surfaces. As such, mechanical
signals (i.e., forces acting on the cells) and textures both are considered driving phenomena
that help explain the large variations observed between flat surfaces and matrixes along with
two other key aspects of 3D environments, supporting material chemical composition and its
gas, nutrient and waste permeability. These parameters can often have dramatic and
overlooked effects in some experiment schemes. The following sections will attempt to
synthesize the known effects of these phenomena and their mechanisms of action in cells.
1.3 Parameters of 3D systems
1.3.1 Mechanical signals
Mechanical signals trigger and regulate a large number of cell responses in vivo. For
example, mechanical forces influence morphogenesis, bone formation, neutrophil activation
and are responsible for several stress-related pathologies [CHAQOUR et al., 2006; PUTNAM
et al., 1998; YAP et al., 2005]. In fact, mechanical signals are now considered as important
for cell physiology as biochemical ones, although they remain far less understood and
studied. They affect cellular locomotion, morphology, adhesion, and protein expression
[GEORGES et al., 2005]. Three basic types of cell mechanical loading (i.e., the imposition of
stresses or strains through physical forces) exist: tension, compression and shear stress
[WANG et al., 2007]. In vivo, tensile load is most common for the majority of tissues, although
other types of load can be predominant in some instances. For example, smooth muscle cells
lining blood vessels must sustain shear stress and tension loads, which, when they reach a
threshold value in pathologies such as hypertension, may cause hypertrophic and/or fibrotic
cellular responses [CHAQOUR et al., 2006]. A feedback phenomenon is present between the
matrix stiffness and the cell physiology where cells modify their intracellular signaling
according to the mechanical signals they receive. The mechanical surroundings of the cells
have an impact on cell shape and cytoskeletal tensions which in turn may dramatically
influence the fate of cells [MCBEATH et al., 2004]. In vitro, mechanical loads can be applied
in a number of ways, which will have a profound effect on cell physiology. As such, 3D
systems for cell culture must be designed to provide mechanical forces of reasonably known
magnitude, orientation and type to allow interpretable and relevant observations.
The nature of the ECM, noticeably its rigidity, has a profound impact on transmission of
mechanical signals to entrapped cells. Moreover, nature and quality of focal adhesions
between cells and scaffold material is key to force retroaction and mechanical signal
17
transmission. The use of natural hydrogels such as collagen and fibrin typically allows low
matrix rigidity with strong focal adhesions while synthetic substrates, such as polyacrylamide
gels, yield large rigidity with few focal adhesions [GEORGES et al., 2005]. Ligand-coated
synthetic gels may improve in some cases cell-material focal adhesions.
Techniques such as atomic force microscopy (AFM) and micropipette aspiration can be used
to study the effect of mechanical forces on part of, or whole, individual cells. Typically,
however, mechanical loads are applied on macroscopic scaffolds in which cells are
entrapped. This can be accomplished in flat planes (e.g., in tissue culture wells), yielding a
2D system [WANG et al., 2007]. Systems able to stretch cell monolayers at known values are
available (e.g., Bio-Flex plate, Flexcell Intl Corp.) and have been used, for example, to
cultivate smooth muscle cells in strained collagen layers [PUTNAM et al., 1998]. 2D surfaces
are relevant to in vivo geometry for the study of endothelial cells embedded in blood vessel
walls, for example. However, important efforts are conducted to use 3D scaffolds which are
more representative of the in vivo reality for most tissue types. In such systems, scaffolds can
be “loaded” through the attachment of the whole scaffold to vessel walls or “unloaded” in free-
floating scaffolds [GRINNELL, 2003]. In vivo, cells and their ECM are almost always attached
mechanically. More complex bioreactor systems can also be used to control shear stresses
around entrapped cells [MARTIN et al., 2005].
Evaluation of mechanical forces acting on cells can be challenging. In 2D systems, wrinkling
of silicone sheets or membranes is often used [BROWN et al., 2002; GEORGES et al., 2005].
Silicone sheet elasticity can be varied for such systems, but membrane stiffness must be
quantified individually, which is a tedious procedure. Moreover, while wrinkled silicone sheets
aptly illustrate unidirectional forces, multi-directional forces are not quantifiable by this
system. In 3D, geometric shrinkage of scaffolds can be monitored, and apparatus that
monitor gel deformation with time have been developed [BROWN et al., 2002].
The cell family designated as fibroblasts remains predominantly studied relatively to
mechanical stimulation. Fibroblasts are typically seeded in mechanically loaded or unloaded
type I collagen gels in which can be added specific growth factors, or cultured as a monolayer
on gel-coated well with some form of force sensing device. Fibroblasts were found to be
highly mechanoresponsive cells, which is logical considering their role in tissue homeostasis,
i.e., in synthesis of ECM components such as collagens and proteoglycans and in tissue
18
remodeling and repair [WANG et al., 2007]. For example, fibroblast gene expression and
growth factor responses in multiple mechanically defined environments, both 2D and 3D,
show very important variations, as presented in a very nice review by Wang et al. [WANG et
al., 2007]. Also, collagen fibril density was shown to modulate fibroblast proliferation and
morphology [GRINNELL et al., 2003a; PIZZO et al., 2005]. Typically, fibroblasts are known to
proliferate when placed in unloaded matrices or 2D culture systems compared to
mechanically loaded systems. Finally, 3D systems linked to a force monitoring system can
also allow the study of the effect of growth factors on the generation of contractile forces by
fibroblasts [BROWN et al., 2002].
Other types of cells that have been studied for mechanical signaling relevance include
smooth muscle cells (SMCs), endothelial cells, myoblasts, hepatocytes, osteoblasts,
neurons, and neutrophils. SMCs show increased proliferation and altered response to growth
factors when subjected to mechanical strain in vitro [BIRUKOV et al., 1995; STEGEMANN et
al., 2003]. SMCs behavior has also been shown to be dramatically different in 2D collagen-
coated surfaces compared to 3D collagen gels, noticeably relatively to protein expression and
contractile activity [STEGEMANN et al., 2005]. Endothelial cells form an increase in network-
like structures in softer gels, but are more spread and present larger lumens on stiffer gels
[SIEMINSKI et al., 2004; VAILHE et al., 1997]. Myoblasts plated on collagen-coated
polyacrylamide gels in vitro present normal myotube striation only at intermediate matrix
rigidities that correspond to in vivo healthy muscle tissue rigidity [ENGLER et al., 2004].
Hepatocytes maintain a differentiated phenotype and aggregate only in relatively soft
materials (such as Matrigel) [SELDEN et al., 1999]. Neurons regeneration after injury in the
central and peripheral nervous system is enhanced by the use of soft hydrogels that are
hypothesized to lower the density of the otherwise impenetrable scar tissue at injury [TENG
et al., 2002]. Alkaline phosphatase activity, a marker of osteoblast activity, is enhanced up to
seven times when exposed to dynamic flow (i.e., elevated shear stresses) [LECLERC et al.,
2006]. Neutrophils, when mechanically deformed in vitro in narrow channels in order to mimic
in vivo deformation occurring in capillaries, activate, extend pseudopods and thus increase
their migratory tendencies [YAP et al., 2005].
1.3.2 Textures
Micropatterned culture systems have been widely used to mimic some aspects of 3D
environments as contact guidance is thought to be important in various in vivo events such as
19
embryonic morphogenesis, axon formation and wound healing [FRIEDL et al., 2000]. In vivo,
contact guidance is achieved by inherent tissue architecture (e.g., alignment of collagen
fibers in the dermis) or by temporarily induced orientation due to traction forces (e.g.,
fibroblast contraction in wound healing) [FRIEDL et al., 2000]. In vitro, for example, the
fabrication of grooves and ridges on flat surfaces using proton beam micromachining allow
the modulation of certain growth characteristics of cells. The confined culture of fibroblasts on
polymethylmethacrylate (PMMA) is possible with such an approach [SUN et al., 2004].
Microsyringe deposition and polymer printing devices also allow surface patterning [VOZZI et
al., 2002]. It should be noted, however, that systems of this type do not directly alter cell-cell
interaction dynamics, mechanical stimuli or polarized nutrient exposure. As such, the majority
of culture systems based on micropatterned surfaces are more an extension of 2D systems
rather than a truly 3D approach.
1.3.3 Biochemical signals
Living tissue architecture is largely dictated by the numerous molecular interactions between
cells and their surrounding matrix. Adhesion complexes on the surface of cells may bind
various constituents of the ECM or other cells, regulating cell signalling cascades (e.g.,
through kinases and phosphatases dependant pathways) and yielding the final properties of
living tissue. In vitro, cell-material and cell-cell adhesion sites, whether specific or not, may be
largely different in 2D systems compared to 3D systems. 3D matrices focal and fibrillar
adhesions differ from adhesions on 2D substrates in their integrin and paxillin content and
localization and in tyrosine phosphorylation of focal adhesion kinase (FAK) as illustrated by
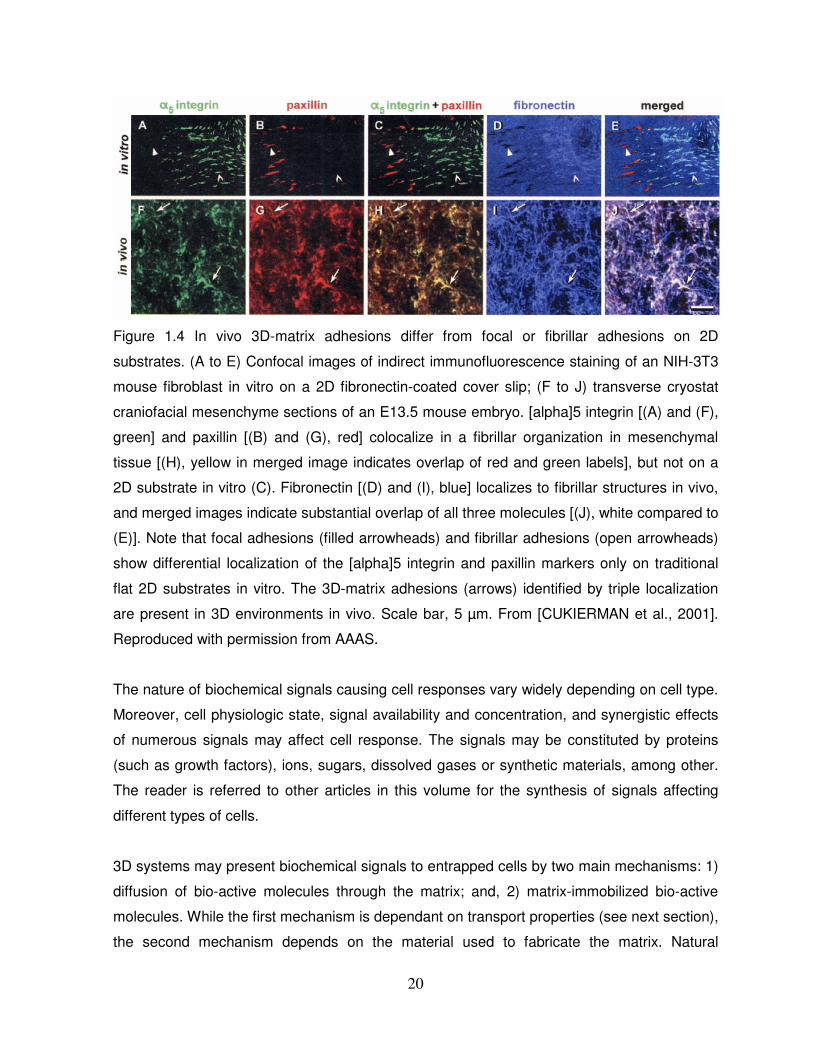
Figure 1.4 [CUKIERMAN et al., 2001]. Moreover, a number of adhesion molecules present in
natural ECM, for example the adhesions motifs found on fibronectin, are sometimes difficult
to obtain and localize in in vitro systems. An example is Matrigel, a collagen derivative used
to mimic the in vivo basal membrane, which is often used in 3D studies. This material is
known to possess a large number of trace molecules, including growth factors, which have
the capacity to elicit important effects on seeded cell populations. Novel polymeric materials
can also create unexpected responses from cells. As such, it is important to take great care
when comparing cell behaviour on plastic dish and in different scaffolds, whether natural or
synthetic.
20
Figure 1.4 In vivo 3D-matrix adhesions differ from focal or fibrillar adhesions on 2D
substrates. (A to E) Confocal images of indirect immunofluorescence staining of an NIH-3T3
mouse fibroblast in vitro on a 2D fibronectin-coated cover slip; (F to J) transverse cryostat
craniofacial mesenchyme sections of an E13.5 mouse embryo. [alpha]5 integrin [(A) and (F),
green] and paxillin [(B) and (G), red] colocalize in a fibrillar organization in mesenchymal
tissue [(H), yellow in merged image indicates overlap of red and green labels], but not on a
2D substrate in vitro (C). Fibronectin [(D) and (I), blue] localizes to fibrillar structures in vivo,
and merged images indicate substantial overlap of all three molecules [(J), white compared to
(E)]. Note that focal adhesions (filled arrowheads) and fibrillar adhesions (open arrowheads)
show differential localization of the [alpha]5 integrin and paxillin markers only on traditional
flat 2D substrates in vitro. The 3D-matrix adhesions (arrows) identified by triple localization
are present in 3D environments in vivo. Scale bar, 5 µm. From [CUKIERMAN et al., 2001].
Reproduced with permission from AAAS.
The nature of biochemical signals causing cell responses vary widely depending on cell type.
Moreover, cell physiologic state, signal availability and concentration, and synergistic effects
of numerous signals may affect cell response. The signals may be constituted by proteins
(such as growth factors), ions, sugars, dissolved gases or synthetic materials, among other.
The reader is referred to other articles in this volume for the synthesis of signals affecting
different types of cells.
3D systems may present biochemical signals to entrapped cells by two main mechanisms: 1)
diffusion of bio-active molecules through the matrix; and, 2) matrix-immobilized bio-active
molecules. While the first mechanism is dependant on transport properties (see next section),
the second mechanism depends on the material used to fabricate the matrix. Natural
21
polymers such as collagen will often contain trace molecules that are likely to interact with
entrapped cells. Synthetic materials, on the other hand, are devoid of such residues. As such,
growth factors must be added to stimulate cell growth and organize tissue architecture.
However, few techniques exist to spatially localize biochemical signals in synthetic materials
to mimic in vivo tissue architecture, which currently constitutes a very important limitation to
the use of 3D system to reproduce living tissue. Lithography-based deposition methods have,
for example, been developed to produce well-defined 2D surfaces for cell study [CHIU et al.,
2000]. However, these techniques are not transferable to 3D systems. Layer-by-layer printing
techniques have been reported that enable 3D positioning of matrix material. For example,
3D printing of porous hydroxyapatite scaffolds for bone engineering achieves well-defined
dimensions, although lacking localized molecular signals [CIMA et al., 1991; SEITZ et al.,
2005]. Polylactic acid 3D printing from CAD models was also reported, again lacking
localized signalling [GIORDANO et al., 1996]. Time to fabricate the scaffolds constitutes a
current limitation of 3D printing techniques.
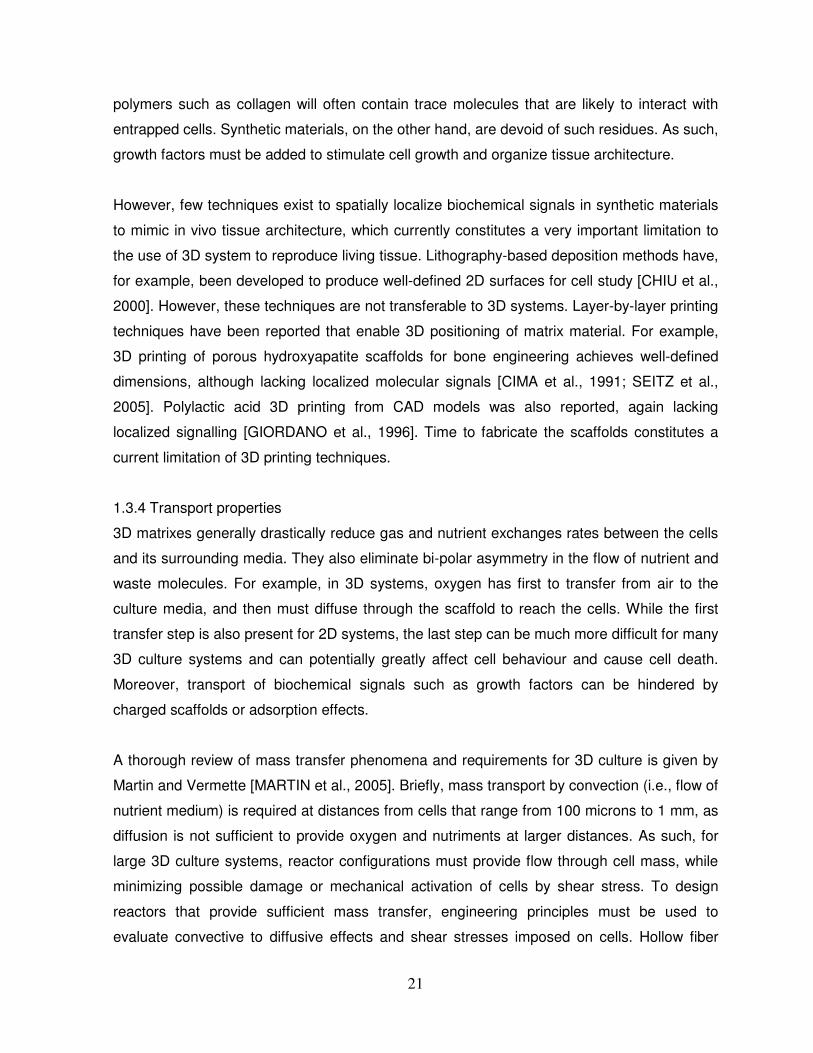
1.3.4 Transport properties
3D matrixes generally drastically reduce gas and nutrient exchanges rates between the cells
and its surrounding media. They also eliminate bi-polar asymmetry in the flow of nutrient and
waste molecules. For example, in 3D systems, oxygen has first to transfer from air to the
culture media, and then must diffuse through the scaffold to reach the cells. While the first
transfer step is also present for 2D systems, the last step can be much more difficult for many
3D culture systems and can potentially greatly affect cell behaviour and cause cell death.
Moreover, transport of biochemical signals such as growth factors can be hindered by
charged scaffolds or adsorption effects.
A thorough review of mass transfer phenomena and requirements for 3D culture is given by
Martin and Vermette [MARTIN et al., 2005]. Briefly, mass transport by convection (i.e., flow of
nutrient medium) is required at distances from cells that range from 100 microns to 1 mm, as
diffusion is not sufficient to provide oxygen and nutriments at larger distances. As such, for
large 3D culture systems, reactor configurations must provide flow through cell mass, while
minimizing possible damage or mechanical activation of cells by shear stress. To design
reactors that provide sufficient mass transfer, engineering principles must be used to
evaluate convective to diffusive effects and shear stresses imposed on cells. Hollow fiber
22
reactors and hypothetical cell assemblages with functional “blood” vessels broadly constitute
the most adequate reactor systems to achieve adequate mass transfer and minimize shear
forces. Moreover, oxygen is only sparsely soluble in typical culture media (i.e., human blood
may carry 50 times more oxygen due to hemoglobin). As such, oxygen carriers will need to
be developed to allow dense tissue growth in 3D culture systems.
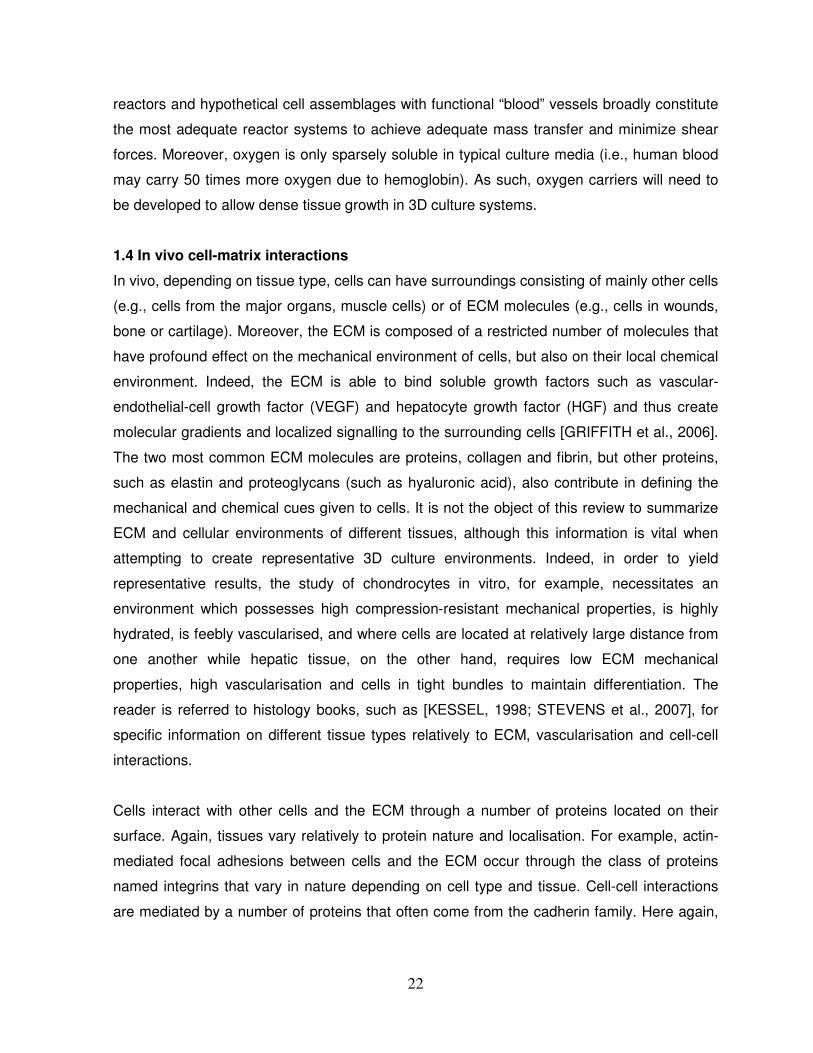
1.4 In vivo cell-matrix interactions
In vivo, depending on tissue type, cells can have surroundings consisting of mainly other cells
(e.g., cells from the major organs, muscle cells) or of ECM molecules (e.g., cells in wounds,
bone or cartilage). Moreover, the ECM is composed of a restricted number of molecules that
have profound effect on the mechanical environment of cells, but also on their local chemical
environment. Indeed, the ECM is able to bind soluble growth factors such as vascular-
endothelial-cell growth factor (VEGF) and hepatocyte growth factor (HGF) and thus create
molecular gradients and localized signalling to the surrounding cells [GRIFFITH et al., 2006].
The two most common ECM molecules are proteins, collagen and fibrin, but other proteins,
such as elastin and proteoglycans (such as hyaluronic acid), also contribute in defining the
mechanical and chemical cues given to cells. It is not the object of this review to summarize
ECM and cellular environments of different tissues, although this information is vital when
attempting to create representative 3D culture environments. Indeed, in order to yield
representative results, the study of chondrocytes in vitro, for example, necessitates an
environment which possesses high compression-resistant mechanical properties, is highly
hydrated, is feebly vascularised, and where cells are located at relatively large distance from
one another while hepatic tissue, on the other hand, requires low ECM mechanical
properties, high vascularisation and cells in tight bundles to maintain differentiation. The
reader is referred to histology books, such as [KESSEL, 1998; STEVENS et al., 2007], for
specific information on different tissue types relatively to ECM, vascularisation and cell-cell
interactions.
Cells interact with other cells and the ECM through a number of proteins located on their
surface. Again, tissues vary relatively to protein nature and localisation. For example, actin-
mediated focal adhesions between cells and the ECM occur through the class of proteins
named integrins that vary in nature depending on cell type and tissue. Cell-cell interactions
are mediated by a number of proteins that often come from the cadherin family. Here again,
23
the reader is referred to standard cell biology texts, such as Alberts et al [ALBERTS et al.,
2002].
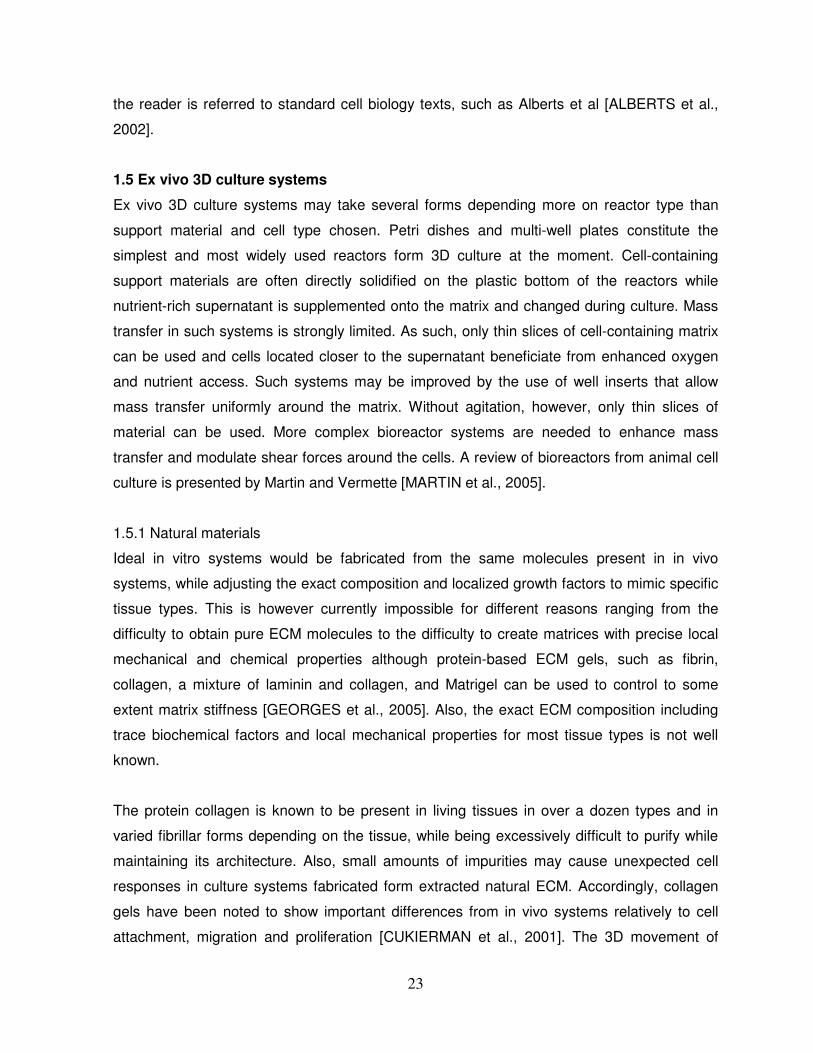
1.5 Ex vivo 3D culture systems
Ex vivo 3D culture systems may take several forms depending more on reactor type than
support material and cell type chosen. Petri dishes and multi-well plates constitute the
simplest and most widely used reactors form 3D culture at the moment. Cell-containing
support materials are often directly solidified on the plastic bottom of the reactors while
nutrient-rich supernatant is supplemented onto the matrix and changed during culture. Mass
transfer in such systems is strongly limited. As such, only thin slices of cell-containing matrix
can be used and cells located closer to the supernatant beneficiate from enhanced oxygen
and nutrient access. Such systems may be improved by the use of well inserts that allow
mass transfer uniformly around the matrix. Without agitation, however, only thin slices of
material can be used. More complex bioreactor systems are needed to enhance mass
transfer and modulate shear forces around the cells. A review of bioreactors from animal cell
culture is presented by Martin and Vermette [MARTIN et al., 2005].
1.5.1 Natural materials
Ideal in vitro systems would be fabricated from the same molecules present in in vivo
systems, while adjusting the exact composition and localized growth factors to mimic specific
tissue types. This is however currently impossible for different reasons ranging from the
difficulty to obtain pure ECM molecules to the difficulty to create matrices with precise local
mechanical and chemical properties although protein-based ECM gels, such as fibrin,
collagen, a mixture of laminin and collagen, and Matrigel can be used to control to some
extent matrix stiffness [GEORGES et al., 2005]. Also, the exact ECM composition including
trace biochemical factors and local mechanical properties for most tissue types is not well
known.
The protein collagen is known to be present in living tissues in over a dozen types and in
varied fibrillar forms depending on the tissue, while being excessively difficult to purify while
maintaining its architecture. Also, small amounts of impurities may cause unexpected cell
responses in culture systems fabricated form extracted natural ECM. Accordingly, collagen
gels have been noted to show important differences from in vivo systems relatively to cell
attachment, migration and proliferation [CUKIERMAN et al., 2001]. The 3D movement of
24
lymphocytes in native lymph nodes appears random and significantly faster than what was
observed in vitro in collagen gels [MILLER et al., 2002]. Moreover, cell-cell interactions are
seemingly prolonged in vivo compared to in vitro model systems [STOLL et al., 2002]. Cells
can be mixed with a collagen solution prior to polymerization in order to trap cells within the
matrix. Importantly, the density of collagen fibers and their orientation has a large effect on
cell locomotion and morphology [GUIDO et al., 1993]. Moreover, the mechanical loading of
the material is very important for cell fate. Gels or sponges may be attached to lower matrix
contraction or, inversely, kept floating to allow mechanically unloaded arrangements
[GRINNELL et al., 2003a]. Mass transfer limitations for collagen-based systems have until
now prevented reported growth of large tissues. Collagen matrices may be blended with
fibronectin or glycoaminoglycans such as hyaluronan in order to achieve in vivo-like matrices
[CIDADAO, 1989; MAASER et al., 1999]. However, such blends are also difficult to
reproduce and can yield different collagen structures as well as cell responses [BIRK et al.,
1994]. The supernatant of a Schwannoma cell line which predominantly contains laminin,
collagen IV and nidogen, named Matrigel, is often used to mimic the basement membrane.
However, as a large number of molecules can be found in Matrigel, it is often difficult to
reproduce observations made using this material [HIRAOKA et al., 1998]. As such, care
must be taken when interpreting results obtained from collagen-based systems as the
fabrication method and exact source of the material is likely to have an important influence on
the observations.
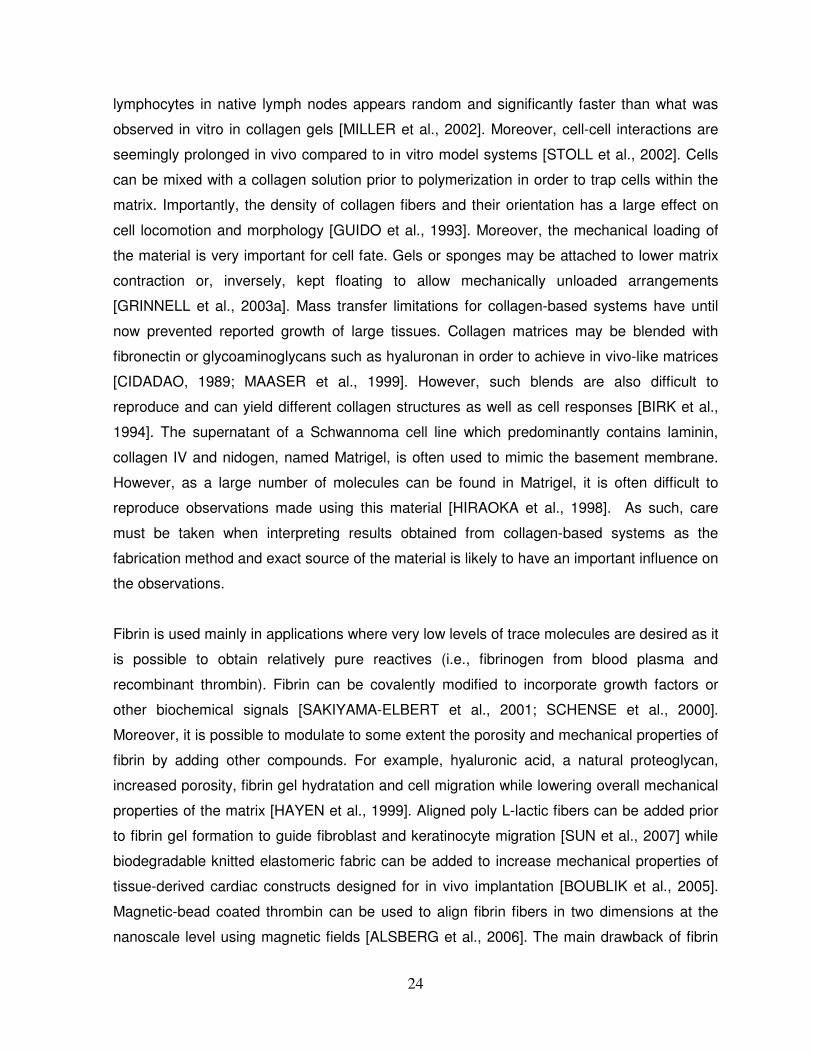
Fibrin is used mainly in applications where very low levels of trace molecules are desired as it
is possible to obtain relatively pure reactives (i.e., fibrinogen from blood plasma and
recombinant thrombin). Fibrin can be covalently modified to incorporate growth factors or
other biochemical signals [SAKIYAMA-ELBERT et al., 2001; SCHENSE et al., 2000].
Moreover, it is possible to modulate to some extent the porosity and mechanical properties of
fibrin by adding other compounds. For example, hyaluronic acid, a natural proteoglycan,
increased porosity, fibrin gel hydratation and cell migration while lowering overall mechanical
properties of the matrix [HAYEN et al., 1999]. Aligned poly L-lactic fibers can be added prior
to fibrin gel formation to guide fibroblast and keratinocyte migration [SUN et al., 2007] while
biodegradable knitted elastomeric fabric can be added to increase mechanical properties of
tissue-derived cardiac constructs designed for in vivo implantation [BOUBLIK et al., 2005].
Magnetic-bead coated thrombin can be used to align fibrin fibers in two dimensions at the
nanoscale level using magnetic fields [ALSBERG et al., 2006]. The main drawback of fibrin
25
use is its relatively low mechanical properties, especially with time as cell-based scaffold
degradation occurs. Aprotinin, a plasmin inhibitor, may be added to slow this process
[WILLERTH et al., 2006].
1.5.2 Synthetic materials
Synthetic materials are being studied to replace certain functions of natural materials. Such
materials have the mandate to behave in a similar fashion to in vivo materials. As such,
synthetic materials must allow specific localized interaction with certain types of cells, be non-
toxic and permit cell migration. In some cases, synthetic polymers are desirable as they allow
the isolation of specific signals for cell study. For example, use of ligand-coated
polyacrylamide gels for 3D cell culture allows separation of chemical signals received by cells
from mechanical signals [GEORGES et al., 2005]. A very large number of materials can be
used, while frequent novel materials are reported in the literature. Degradation of the
synthetic material is sometimes wanted to allow cell migration and tissue development. Three
vital requirements for the materials are non-toxicity, ease of sterilization and the promotion of
cell adhesion. However, while some of these materials can achieve well-defined porosities
and efficient cell seeding, most of these materials lack localized cell signals to allow
controlled cell-material interactions.
Transformed natural materials, such as cross-linked polysaccharides (e.g., agarose and
alginate) may be used to encapsulate and cultivate cells. Simple 3D constructs made of
encapsulated cells in alginate or agarose beads are often encountered in the tissue
engineering literature, noticeably for the cultivation of chondrocytes, pancreatic islet cells and
hepatic cells. Encapsulation is reported to increase cell viability, tolerance to shear stress and
proliferation as well as inducing in vivo-like behaviour [SELDEN et al., 1999]. Systems made
from these polymers show flexibility relatively to their mechanical properties; the elastic
modulus is dependant on polymer molecular mass [GEORGES et al., 2005]. They have been
widely used in bioreactor configurations where high shear stresses are present [MARTIN et
al., 2005]. In cancer research, 3D cultures of tumour cells are frequently achieved to assess
for the fundamental differences between 2D and 3D cultures. The cells are usually studied in
the form of spherical assemblies termed spheroids [KIM et al., 2004]. These assemblies can
be obtained by spontaneous aggregation from the 2D cultures of certain cell lines (usually
breast cell lines). Cancer cells can also be grown on agar, agarose or recombinant basement
membrane to help induce the formation of spheroids. Both techniques have yielded useful
26
data, although the inexistence of circulation (e.g., angiogenesis) limits spheroid size and
viability of inner cells. Moreover, the interaction of cancer cells with stromal cells cannot be
modeled with these systems although novel scaffolds are being developed to allow co-
cultures [KIM et al., 2004].
Bone cells necessitate scaffolds with elevated mechanical properties to mimic the in vivo
ECM. Composite systems made of polymers and ceramics are actively being developed in
order to combine the mechanical properties of ceramics with the advantages of polymers
(e.g., biodegradability, shapability, available chemical sites) [MAQUET et al., 2004; ZHANG
et al., 2004]. A review of materials developed to culture bone cells in 3D is presented by
Rezwan et al. [REZWAN et al., 2006]. Other types of cells have mainly been cultivated in
synthetic organic polymer scaffolds of various shapes, cell adhesion characteristics,
mechanical properties, and porosities. An example is hydrogels that combine receptor
binding sites to exert cell traction and protease-sensitive degradation sites to allow cell
migration which have been developed recently [LUTOLF et al., 2003]. These hydrogels were
fabricated from multiarm vinyl sulfone-functionalized poly(ethylene glycol) backbones with
either mono-cysteine adhesion peptides or bis-cysteine protease-sensitive peptides to allow
localized degradation. Such a scheme allowed a complex interaction between cells and
synthetic materials somewhat akin to the interactions present in native tissues. An extensive
list of polymers currently used is reviewed by Hutmacher [HUTMACHER, 2001]. Large efforts
are also devoted to scaffold creation with predetermined architecture using computational
topology design and solid free-form fabrication [HOLLISTER, 2005].
1.6 Discussion
Cells cultivated in 3D systems clearly demonstrate large differences relatively to morphology
and protein expression for example compared to those cultivated in 2D environments. This
should not be surprising considering the extent to which biochemical, mechanical and nutrient
and waste transfer properties differ for the two types of systems. Important advances have
been accomplished mainly in tissues with predominantly 2D characteristics, such as the
bladder [OBERPENNING et al., 1999]. However, large efforts still need to be deployed in
order to achieve the fabrication of 3D environments in vitro that can successfully reproduce
the in vivo reality with low variability and relative ease of use to allow everyday use. Until
now, 3D culture systems which have been reported in the literature often present limitations
27
in nutrient transfer, give inadequate or impossible to measure biochemical cues to cells or fail
to give important mechanical signals. Specifically, no 3D culture system known to the author
even attempts to integrate every element of the in vivo reality. Progress is made every year to
improve nutrient transfer through bioreactor design and attempts to induce channels in lumps
of cells (for example by angiogenesis). Novel materials are constantly reported to allow cell
growth in vitro. The next few years should witness the emergence of integrated systems.
However, some aspects of in the in vivo environment should rapidly be addressed. For
example, spatial localisation of key biochemical signals is very likely to be important to
reproduce the highly non-uniform in vivo tissues. While developments are generated on flat
surfaces to achieve this goal, very few 3D systems address this critical issue.
1.7 References
ALBERTS, B., JOHNSON, A., LEWIS, J., RAFF, M., ROBERTS, K., WALTER, P. (2002) Molecular Biology of the Cell, 4 edition, Garland.
ALSBERG, E, FEINSTEIN, E., JOY, M. P., PRENTISS, M., INGBER, D. E. (2006) Magnetically-guided self-assembly of fibrin matrices with ordered nano-scale structure for tissue engineering, Tissue Engineering, 12, p. 3247-3256.
BIRK, D E, LISENMAYER, T. F. (1994) Collagen fibril assembly, deposition, and organization91-128.
BIRKEDAL-HANSEN, H (1995) Proteolytic remodeling of extracellular matrix. [Review] [61 refs], Current Opinion in Cell Biology, 7, p. 728-735.
BIRUKOV, K G, SHIRINSKY, V. P., STEPANOVA, O. V., TKACHUK, V. A., HAHN, A. W., RESINK, T. J., SMIRNOV, V. N. (1995) Stretch affects phenotype and proliferation of vascular smooth muscle cells, Molecular & Cellular Biochemistry.144(2):131-9,
BOUBLIK, J, PARK, H., RADISIC, M., TOGNANA, E., CHEN, F., PEI, M., VUNJAK-NOVAKOVIC, G., FREED, L. E. (2005) Mechanical properties and remodeling of hybrid cardiac constructs made from heart cells, fibrin, and biodegradable, elastomeric knitted fabric, Tissue Engineering, 11, p. 1122-1132.
BROWN, R A, SETHI, K. K., GWANMESIA, I., RAEMDONCK, D., EASTWOOD, M., MUDERA, V. (2002) Enhanced fibroblast contraction of 3D collagen lattices and integrin expression by TGF-beta1 and -beta3: mechanoregulatory growth factors?, Experimental Cell Research, 274, p. 310-322.
CARLSON, M A, LONGAKER, M. T., THOMPSON, J. S. (2002) Granulation tissue regression induced by musculocutaneous advancement flap coverage, Surgery, 131, p. 332-337.
28
CHAQOUR, B, GOPPELT-STRUEBE, M. (2006) Mechanical regulation of the Cyr61/CCN1 and CTGF/CCN2 proteins, FEBS Journal, 273, p. 3639-3649.
CHIU, D T, JEON, N. L., HUANG, S., KANE, R. S., WARGO, C. J., CHOI, I. S., INGBER, D. E., WHITESIDES, G. M. (2000) Patterned deposition of cells and proteins onto surfaces by using three-dimensional microfluidic systems, Proceedings of the National Academy of Sciences of the United States of America, 97, p. 2408-2413.
CIDADAO, A J (1989) Interactions between fibronectin, glycosaminoglycans and native collagen fibrils: an EM study in artificial three-dimensional extracellular matrices, European Journal of Cell Biology, 48, p. 303-312.
CIMA, L G, VACANTI, J. P., VACANTI, C., INGBER, D., MOONEY, D., LANGER, R. (1991) Tissue engineering by cell transplantation using degradable polymer substrates, Journal of Biomechanical Engineering.113(2):143-51,
CUKIERMAN, E, PANKOV, R., STEVENS, D. R., YAMADA, K. M. (2001) Taking cell-matrix adhesions to the third dimension, Science, 294, p. 1708-1712.
DEBNATH, J, MILLS, K. R., COLLINS, N. L., REGINATO, M. J., MUTHUSWAMY, S. K., BRUGGE, J. S. (2002) The role of apoptosis in creating and maintaining luminal space within normal and oncogene-expressing mammary acini.[erratum appears in Cell. 2002 Nov 27;111(5):757.], Cell, 111, p. 29-40.
ENGLER, A J, GRIFFIN, M. A., SEN, S., BONNEMANN, C. G., SWEENEY, H. L., DISCHER, D. E. (2004) Myotubes differentiate optimally on substrates with tissue-like stiffness: pathological implications for soft or stiff microenvironments, Journal of Cell Biology.166(6):877-87,
FRIEDL, P, BROCKER, E. B. (2000) The biology of cell locomotion within three-dimensional extracellular matrix, Cellular & Molecular Life Sciences, 57, p. 41-64.
FRIEDL, P, MAASER, K., KLEIN, C. E., NIGGEMANN, B., KROHNE, G., ZANKER, K. S. (1997) Migration of highly aggressive MV3 melanoma cells in 3-dimensional collagen lattices results in local matrix reorganization and shedding of alpha2 and beta1 integrins and CD44, Cancer Research, 57, p. 2061-2070.
GEORGES, P C, JANMEY, P. A. (2005) Cell type-specific response to growth on soft materials, Journal of Applied Physiology, 98, p. 1547-1553.
GIORDANO, R A, WU, B. M., BORLAND, S. W., CIMA, L. G., SACHS, E. M., CIMA, M. J. (1996) Mechanical properties of dense polylactic acid structures fabricated by three dimensional printing, Journal of Biomaterials Science, Polymer Edition, 8, p. 63-75.
GOH, K L, YANG, J. T., HYNES, R. O. (1997) Mesodermal defects and cranial neural crest apoptosis in alpha5 integrin-null embryos, Development, 124, p. 4309-4319.
GRIFFITH, L G, SWARTZ, M. A. (2006) Capturing complex 3D tissue physiology in vitro, Nature Reviews Molecular Cell Biology, 7, p. 211-224.
29
GRINNELL, F (2003) Fibroblast biology in three-dimensional collagen matrices, Trends in Cell Biology, 13, p. 264-269.
GRINNELL, F (2000) Fibroblast-collagen-matrix contraction: growth-factor signalling and mechanical loading, Trends in Cell Biology, 10, p. 362-365.
GRINNELL, F, HO, C. H., TAMARIZ, E., LEE, D. J., SKUTA, G. (2003b) Dendritic fibroblasts in three-dimensional collagen matrices, Molecular Biology of the Cell, 14, p. 384-395.
GRINNELL, F, HO, C. H., TAMARIZ, E., LEE, D. J., SKUTA, G. (2003a) Dendritic fibroblasts in three-dimensional collagen matrices, Molecular Biology of the Cell, 14, p. 384-395.
GUIDO, S, TRANQUILLO, R. T. (1993) A methodology for the systematic and quantitative study of cell contact guidance in oriented collagen gels. Correlation of fibroblast orientation and gel birefringence, Journal of Cell Science, 105, p. 317-331.
HAYEN, W, GOEBELER, M., KUMAR, S., RIESSEN, R., NEHLS, V. (1999) Hyaluronan stimulates tumor cell migration by modulating the fibrin fiber architecture, Journal of Cell Science, 112, p. 2241-2251.
HINZ, B, MASTRANGELO, D., ISELIN, C. E., CHAPONNIER, C., GABBIANI, G. (2001) Mechanical tension controls granulation tissue contractile activity and myofibroblast differentiation, American Journal of Pathology, 159, p. 1009-1020.
HIRAOKA, N, ALLEN, E., APEL, I. J., GYETKO, M. R., WEISS, S. J. (1998) Matrix metalloproteinases regulate neovascularization by acting as pericellular fibrinolysins, Cell, 95, p. 365-377.
HOLLISTER, S J (2005) Porous scaffold design for tissue engineering.[erratum appears in Nat Mater. 2006 Jul;5(7):590], Nature Materials.4(7):518-24,
HUTMACHER, D W (2001) Scaffold design and fabrication technologies for engineering tissues--state of the art and future perspectives, Journal of Biomaterials Science, Polymer Edition.12(1):107-24,
IGNEY, F H, KRAMMER, P. H. (2002) Death and anti-death: tumour resistance to apoptosis, Nature Reviews, Cancer., p. 277-288.
JECHLINGER, M, GRUNERT, S., BEUG, H. (2002) Mechanisms in epithelial plasticity and metastasis: insights from 3D cultures and expression profiling, Journal of Mammary Gland Biology & Neoplasia, 7, p. 415-432.
KESSEL, R. G. (1998) Basic Medical Histology: the Biology of Cells, Tissues, and Organs, 1 edition, Oxford University Press.
KIM, J B, STEIN, R., O'HARE, M. J. (2004) Three-dimensional in vitro tissue culture models of breast cancer-- a review, Breast Cancer Research & Treatment, 85, p. 281-291.
KUNZ-SCHUGHART, L A, GROEBE, K., MUELLER-KLIESER, W. (1996) Three-dimensional cell culture induces novel proliferative and metabolic alterations associated with oncogenic transformation, International Journal of Cancer, 66, p. 578-586.
30
LECLERC, E, DAVID, B., GRISCOM, L., LEPIOUFLE, B., FUJII, T., LAYROLLE, P., LEGALLAISA, C. (2006) Study of osteoblastic cells in a microfluidic environment, Biomaterials, 27, p. 586-595.
LEWIS, W H, LEWIS, M. R. (1924) Behavior of cells in tissue cultures, in General Cytology, COWDRY, E.V. editor, University of Chicago Press, p.384-447.
LUTOLF, M P, RAEBER, G. P., ZISCH, A. H., TIRELLI, N., HUBBELL, J. A. (2003) Cell-responsive synthetic hydrogels, Advanced Materials, 15, p. 888-892.
MAASER, K, WOLF, K., KLEIN, C. E., NIGGEMANN, B., ZANKER, K. S., BROCKER, E. B., FRIEDL, P. (1999) Functional hierarchy of simultaneously expressed adhesion receptors: integrin alpha2beta1 but not CD44 mediates MV3 melanoma cell migration and matrix reorganization within three-dimensional hyaluronan-containing collagen matrices, Molecular Biology of the Cell, 10, p. 3067-3079.
MAQUET, V, BOCCACCINI, A. R., PRAVATA, L., NOTINGHER, I., JEROME, R. (2004) Porous poly(alpha-hydroxyacid)/Bioglass composite scaffolds for bone tissue engineering. I: Preparation and in vitro characterisation, Biomaterials.25(18):4185-94,
MARTIN, Y., VERMETTE, P. (2005) Bioreactors for tissue mass culture: Design, caracterization, and recent advances, Biomaterials, 26, p.7481-7503.
MCBEATH, R, PIRONE, D. M., NELSON, C. M., BHADRIRAJU, K., CHEN, C. S. (2004) Cell shape, cytoskeletal tension, and RhoA regulate stem cell lineage commitment, Developmental Cell, 6, p. 483-495.
MILLER, M J, WEI, S. H., PARKER, I., CAHALAN, M. D. (2002) Two-photon imaging of lymphocyte motility and antigen response in intact lymph node, Science, 296, p. 1869-1873.
NIEMANN, C, BRINKMANN, V., SPITZER, E., HARTMANN, G., SACHS, M., NAUNDORF, H., BIRCHMEIER, W. (1998) Reconstitution of mammary gland development in vitro: requirement of c-met and c-erbB2 signaling for branching and alveolar morphogenesis, Journal of Cell Biology, 143, p. 533-545.
OBERPINNING, F, MENG, J, YOO, J J, ATALA, A. (1999) De novo reconstitution of a functional mammalian urinary bladder by tissue engineering. Nature Biotechnology, 17, p. 149-155.
OFT, M, PELI, J., RUDAZ, C., SCHWARZ, H., BEUG, H., REICHMANN, E. (1996) TGF-beta1 and Ha-Ras collaborate in modulating the phenotypic plasticity and invasiveness of epithelial tumor cells, Genes & Development, 10, p. 2462-2477.
PIZZO, A M, KOKINI, K., VAUGHN, L. C., WAISNER, B. Z., VOYTIK-HARBIN, S. L. (2005) Extracellular matrix (ECM) microstructural composition regulates local cell-ECM biomechanics and fundamental fibroblast behavior: a multidimensional perspective, Journal of Applied Physiology, 98, p. 1909-1921.
PUTNAM, A J, CUNNINGHAM, J. J., DENNIS, R. G., LINDERMAN, J. J., MOONEY, D. J. (1998) Microtubule assembly is regulated by externally applied strain in cultured smooth muscle cells, Journal of Cell Science, 111, p. 3379-3387.
31
REZWAN, K, CHEN, Q. Z., BLAKER, J. J., BOCCACCINI, A. R. (2006) Biodegradable and bioactive porous polymer/inorganic composite scaffolds for bone tissue engineering, Biomaterials, 27, p. 3413-3431.
SAKIYAMA-ELBERT, S E, PANITCH, A., HUBBELL, J. A. (2001) Development of growth factor fusion proteins for cell-triggered drug delivery, FASEB Journal, 15, p. 1300-1302.
SANTINI, M T, RAINALDI, G., INDOVINA, P. L. (2000) Apoptosis, cell adhesion and the extracellular matrix in the three-dimensional growth of multicellular tumor spheroids, Critical Reviews in Oncology-Hematology, 36, p. 75-87.
SCHENSE, J C, BLOCH, J., AEBISCHER, P., HUBBELL, J. A. (2000) Enzymatic incorporation of bioactive peptides into fibrin matrices enhances neurite extension, Nature Biotechnology, 18, p. 415-419.
SEITZ, H, RIEDER, W., IRSEN, S., LEUKERS, B., TILLE, C. (2005) Three-dimensional printing of porous ceramic scaffolds for bone tissue engineering, Journal of Biomedical Materials Research, Part, p. 782-788.
SELDEN, C, SHARIAT, A., MCCLOSKEY, P., RYDER, T., ROBERTS, E., HODGSON, H. (1999) Three-dimensional in vitro cell culture leads to a marked upregulation of cell function in human hepatocyte cell lines--an important tool for the development of a bioartificial liver machine, Annals of the New York Academy of Sciences, 875, p. 353-363.
SHAPIRO, S D (1998) Matrix metalloproteinase degradation of extracellular matrix: biological consequences, Current Opinion in Cell Biology, 10, p. 602-608.
SIEMINSKI, A L, HEBBEL, R. P., GOOCH, K. J. (2004) The relative magnitudes of endothelial force generation and matrix stiffness modulate capillary morphogenesis in vitro, Experimental Cell Research.297(2):574-84,
SMILENOV, L B, MIKHAILOV, A., PELHAM, R. J., MARCANTONIO, E. E., GUNDERSEN, G. G. (1999) Focal adhesion motility revealed in stationary fibroblasts, Science, 286, p. 1172-1174.
STEGEMANN, J P, HONG, H., NEREM, R. M. (2005) Mechanical, biochemical, and extracellular matrix effects on vascular smooth muscle cell phenotype, Journal of Applied Physiology, 98, p. 2321-2327.
STEGEMANN, J P, NEREM, R. M. (2003) Altered response of vascular smooth muscle cells to exogenous biochemical stimulation in two- and three-dimensional culture, Experimental Cell Research, 283, p. 146-155.
STEVENS, A., LOWE, J. S. (2007) Human Histology, 3 edition, Mosby.
STOLL, S, DELON, J., BROTZ, T. M., GERMAIN, R. N. (2002) Dynamic imaging of T cell-dendritic cell interactions in lymph nodes, Science, 296, p. 1873-1876.
SUN, F, CASSE, D., VAN KAN, J. A., GE, R., WATT, F. (2004) Geometric control of fibroblast growth on proton beam-micromachined scaffolds, Tissue Engineering, 10, p. 267-272.
32
SUN, T, NORTON, D., RYAN, A. J., MACNEIL, S., HAYCOCK, J. W. (2007) Investigation of fibroblast and keratinocyte cell-scaffold interactions using a novel 3D cell culture system, Journal of Materials Science-Materials in Medicine, 18, p. 321-328.
TENG, Y D, LAVIK, E. B., QU, X., PARK, K. I., OUREDNIK, J., ZURAKOWSKI, D., LANGER, R., SNYDER, E. Y. (2002) Functional recovery following traumatic spinal cord injury mediated by a unique polymer scaffold seeded with neural stem cells, Proceedings of the National Academy of Sciences of the United States of America.99(5):3024-9,
VAILHE, B, RONOT, X., TRACQUI, P., USSON, Y., TRANQUI, L. (1997) In vitro angiogenesis is modulated by the mechanical properties of fibrin gels and is related to alpha(v)beta3 integrin localization, In Vitro Cellular & Developmental Biology.Animal.33(10):763-73, Dec.
VOZZI, G, PREVITI, A., DE, R. D., AHLUWALIA, A. (2002) Microsyringe-based deposition of two-dimensional and three-dimensional polymer scaffolds with a well-defined geometry for application to tissue engineering, Tissue Engineering, 8, p. 1089-1098.
WANG, J H, THAMPATTY, B. P., LIN, J. S., IM, H. J. (2007) Mechanoregulation of gene expression in fibroblasts, Gene, 391, p. 1-15.
WEISS, P (1959) Cellular dynamics, Reviews of Modern Physics, 31, p. 11-20.
WILLERTH, S M, ARENDAS, K. J., GOTTLIEB, D. I., SAKIYAMA-ELBERT, S. E. (2006) Optimization of fibrin scaffolds for differentiation of murine embryonic stem cells into neural lineage cells, Biomaterials, 27, p. 5990-6003.
YANG, B, CAO, D. J., SAINZ, I., COLMAN, R. W., GUO, Y. L. (2004) Different roles of ERK and p38 MAP kinases during tube formation from endothelial cells cultured in 3-dimensional collagen matrices, Journal of Cellular Physiology, 200, p. 360-369.
YAP, B, KAMM, R. D. (2005) Mechanical deformation of neutrophils into narrow channels induces pseudopod projection and changes in biomechanical properties, Journal of Applied Physiology, 98, p. 1930-1939.
YU, J L, COOMBER, B. L., KERBEL, R. S. (2002) A paradigm for therapy-induced microenvironmental changes in solid tumors leading to drug resistance, Differentiation, 70, p. 599-609.
ZAHIR, N, WEAVER, V. M. (2004) Death in the third dimension: apoptosis regulation and tissue architecture, Current Opinion in Genetics & Development, 14, p. 71-80.
ZAKERI, Z, LOCKSHIN, R. A. (2002) Cell death during development, Journal of Immunological Methods, 265, p. 3-20.
ZHANG, K, WANG, Y., HILLMYER, M. A., FRANCIS, L. F. (2004) Processing and properties of porous poly(L-lactide)/bioactive glass composites, Biomaterials.25(13):2489-500.
33
CHAPITRE 2
ÉTUDE DE L’EFFET DES PARAMÈTRES DU PROCÉDÉ DE POLYMÉRISATION PAR
PLASMA N-HEPTYLAMINE SUR LES PROPRIÉTÉS FINALES DES COUCHES
Résumé
Les procédés de polymérisation par plasma sont largement utilisés pour ajouter des fonctions
chimiques actives sur des surfaces. Les propriétés des couches minces ainsi formées
peuvent être modulées par les variables d’opération du procédé. Dans ce chapitre, des
couches minces de polymères présentant des fonctions amines primaires ont été produites
sur des surfaces solides à l’aide de décharges de vapeurs de n-heptylamine générées par
radiofréquences dans un réacteur fait sur mesure. Des expériences planifiées ont été
menées afin d’évaluer l’importance de 4 paramètres du procédé sur la composition chimique
et l’épaisseur des couches résultantes. Les paramètres à l’étude furent : 1) le temps de
déposition, 2) la puissance de la décharge de radiofréquences, 3) la géométrie du réacteur et
4) la pression du monomère n-heptylamine. Les interactions entre les paramètres ont été
évaluées par l’utilisation de designs factoriels. L’étude révèle que l’épaisseur des couches
minces polymérisées d’heptylamine est dépendante de la puissance de la décharge et du
temps de déposition, tel que mesuré par les techniques de résonance de plasmon et de
mesure de hauteur de marche par microscopie à force atomique. Aussi, le ratio d’atomes
d’azote sur ceux de carbone des surfaces traitées est dépendant principalement par la
puissance de la décharge, tel que révélé par spectroscopie de photoélectrons. Une analyse
par microbalance à cristal de quartz a aussi confirmé la stabilité des couches minces
lorsqu’immergées dans une solution aqueuse. Un tel travail pave la voie à l’utilisation des
couches minces pour le traitement préliminaire de surfaces destinées à interagir
spécifiquement avec des cellules en culture.
Publié sous :
MARTIN, Y., BOUTIN, D., VERMETTE, P. (2007) Study of the effect of process parameters
for n-heptlyamine plasma enhanced chemical vapour deposition on final layer properties,
Thin Solid Films, 515 (17), p. 6844-6852.
34
STUDY OF THE EFFECT OF PROCESS PARAMETERS FOR N-HEPTYLAMINE PLASMA
POLYMERIZATION ON FINAL LAYER PROPERTIES
Abstract
Plasma polymerization processes are widely used to chemically functionalize surfaces, which
properties can be tuned by different operating variables. In this study, thin amine-containing
polymer layers were produced on solid substrates in a custom-made cylindrical plasma
polymerization reactor by radio frequency glow discharges of n-heptylamine vapours.
Carefully planned experiments were conducted to evaluate the importance of four different
process parameters on the chemical composition and thickness of the resulting films. The
parameters investigated were: 1) deposition time, 2) power of the glow discharge, 3) distance
between the electrodes, and 4) monomer pressure. Possible interactions between these
variables were investigated through the use of statistical analyses (i.e., factorial design). This
study reveals that n-heptylamine plasma polymer (HApp) layer thickness is influenced by the
power of the glow discharge and the deposition time, as assessed by surface plasmon
resonance and atomic force microscopy step height measurements. Also, the atomic ratio of
nitrogen to carbon atoms on the treated surfaces is mainly influenced by the power of the
glow discharge, as revealed by X-ray photoelectron spectroscopy. Quartz crystal
microbalance analysis also confirmed that HApp layers are stable when immersed in
aqueous solution. This work paves the way to use HApp thin layers for the primary treatment
of materials destined for specific cell-material interactions.
Published as:
MARTIN, Y., BOUTIN, D., VERMETTE, P. (2007) Study of the effect of process parameters
for n-heptlyamine plasma enhanced chemical vapour deposition on final layer properties,
Thin Solid Films, 515 (17), p. 6844-6852.
35
2.1 Introduction
Plasma polymerization is used in many applications such as in the biomedical field, where it
is used to modulate the surface characteristics of biomedical devices (e.g., to enhance
biocompatibility) without altering the material bulk properties. Generally, plasma
polymerization is accomplished by introducing an organic monomer into the plasma reactor
chamber under rough (or low) vacuum. A microwave or radiofrequency (RF) generator then
creates an oscillating electrical current between the electrodes placed within the chamber,
resulting in an electrical field. Under its influence, the organic monomer is ionized as a
mixture of free radicals, charged molecules, ions and free electrons. Radicals and charged
molecules then condense and polymerize on the electrodes on which the substrates to be
treated are placed [MOROSOFF, 1990]. Many parameters, such as the nature of the organic
monomer itself, the monomer flow rate, the pressure in the reactor chamber, the reaction
time, the power and frequency of the glow discharge, the temperature at the substrate
position, and the geometry and physical dimensions of the reactor are believed to influence
the outcome of the plasma polymerization process (e.g., the surface properties of the
resulting thin films) and its repeatability [CHEN et al., 2004; GRIESSER, 1989; HUBER et al.,
1996; MOROSOFF, 1990].
One of the main interests of our group is to develop surfaces with defined biological
properties to elicit specific and controlled cellular responses. As such, plasma polymerization
can be used to obtain amine-bearing coatings on inert surfaces (such as glass, mica,
fluoroethylenepropylene (FEP) or polytetrafluoroethylene) to allow subsequent amine-based
chemical modifications. Indeed, amine coatings are effective on biomedical devices to allow:
1) the binding of polymer layers (e.g., polysaccharides) to improve the biocompatibility and
low-fouling characteristics of some materials [KINGSHOTT et al., 2002; VERMETTE et al.,
2002], and 2) to immobilize biologically active molecules for varied biomedical applications
[CHEN et al., 2004; MARATSUGU et al., 1991]. Amine-functionalized surfaces have
previously been obtained through plasma polymerization using different monomers such as
allylamine [CHEN et al., 2004; MARATSUGU et al., 1991; SHARD et al., 2004], propylamine
[FALLY et al., 1995; SHARD et al., 2004], ethylene diamine and diaminocyclohexane
[CHOUKOUROV et al., 2004] and n-heptylamine [GRIESSER, 1989; VERMETTE et al.,
2002; YANG et al., 2000]. In the present study, a custom-made reactor was fabricated to
produce surfaces bearing primary amines though the use of n-heptylamine monomer
vapours.
36
To be able to modulate to some extent the surface properties of the substrates obtained
through plasma polymerization (e.g., to modulate the plasma layer thickness in applications
such as contact lens surface modification), carefully planned experiments analyzed using
appropriate statistical tools are needed to shed some light on the relative effect of the main
process operating variables. These experiments are required as few previous reports have
properly addressed the effect of operating conditions on important substrate properties such
as thickness, water swelling and stability and chemical composition; the large majority of
studies often describe operating conditions that "work" for specific applications. Other studies
have focused on the study of one or two plasma polymerization process parameters; the
conclusions, although useful, do not provide information on the relative importance of the
unstudied process parameters. Finally, some studies are difficult to compare as parameters
such as reactor dimensions, the nature of the monomer, the use of electrical pulses or the RF
generator frequency differ importantly.
Thus, the aim of this study was to investigate, through the use of atomic force microscopy
(AFM), surface plasmon resonance (SPR), quartz crystal microbalance (QCM) and X-ray
photoelectron spectroscopy, combined with a factorial design approach, whether key
operating parameters have any individual and/or synergistic effects on the thickness and
chemical composition of the thin films produced using vapors of n-heptylamine. The operating
parameters studied here were: 1) deposition time (t), 2) power of the glow discharge (P), 3)
distance between the electrodes (d), and 4) monomer pressure in the reactor chamber (p).
2.2 Experimental Section
2.2.1 Description of the plasma reactor system
The reactor is composed of several sub-units as illustrated in Figure 2.1. The reactor
chamber is made of a glass cylinder (30 cm outside diameter, 1 cm glass thickness, 50 cm
height). Two disk-shaped horizontal copper electrodes (14 cm diameter, 5 mm thickness) are
maintained in the chamber by vertical copper rods (top rod: 7 mm diameter with an adjustable
vertical position; bottom rod: 2.5 cm diameter, 17 cm chamber length). The rods are screwed
into the electrodes, and are fixed to Teflon plates (35 cm diameter, 5 cm thickness) at the
top and bottom of the chamber. The top rod can be moved vertically to modify the distance
between the electrodes. The glass chamber is fitted to the Teflon™ plates through circular
slits encasing Viton gaskets.
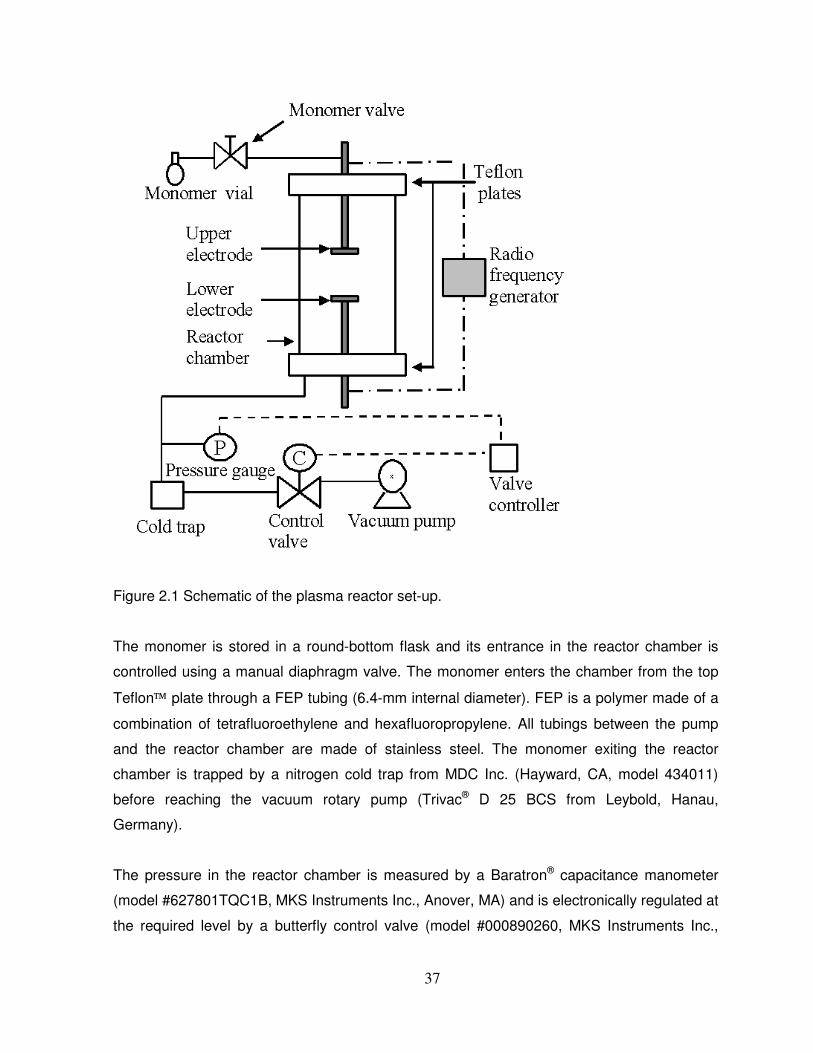
37
Figure 2.1 Schematic of the plasma reactor set-up.
The monomer is stored in a round-bottom flask and its entrance in the reactor chamber is
controlled using a manual diaphragm valve. The monomer enters the chamber from the top
Teflon plate through a FEP tubing (6.4-mm internal diameter). FEP is a polymer made of a
combination of tetrafluoroethylene and hexafluoropropylene. All tubings between the pump
and the reactor chamber are made of stainless steel. The monomer exiting the reactor
chamber is trapped by a nitrogen cold trap from MDC Inc. (Hayward, CA, model 434011)
before reaching the vacuum rotary pump (Trivac® D 25 BCS from Leybold, Hanau,
Germany).
The pressure in the reactor chamber is measured by a Baratron® capacitance manometer
(model #627801TQC1B, MKS Instruments Inc., Anover, MA) and is electronically regulated at
the required level by a butterfly control valve (model #000890260, MKS Instruments Inc.,
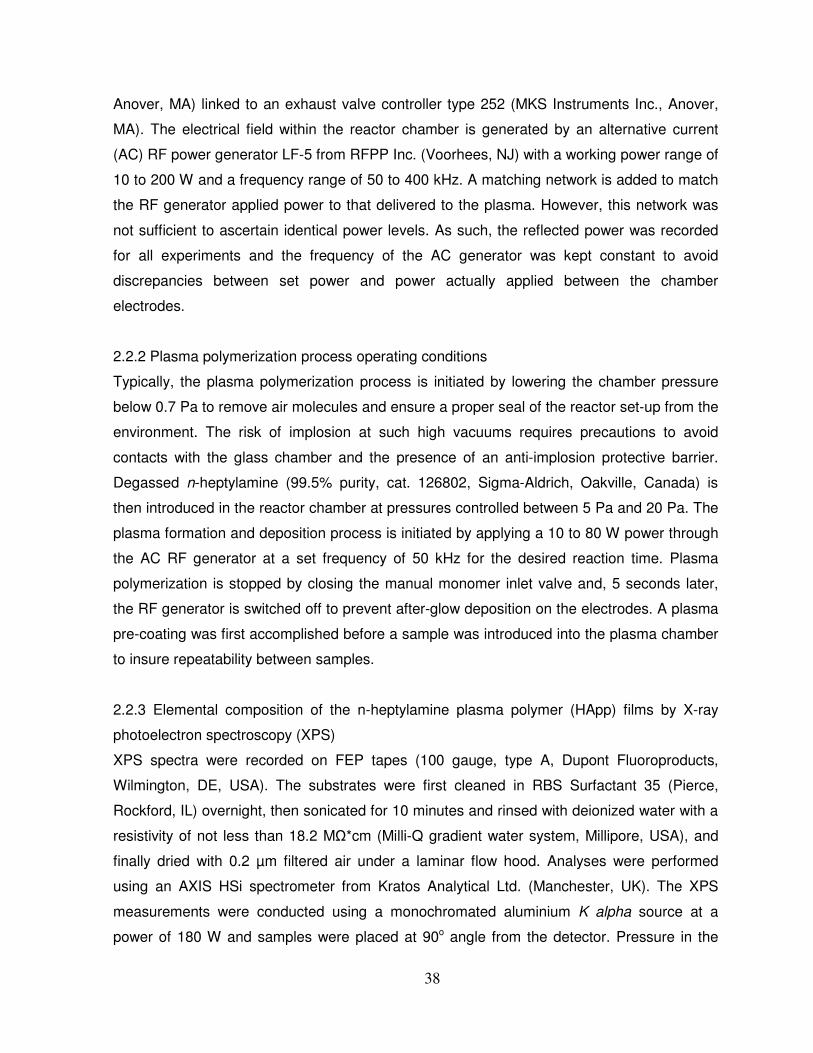
38
Anover, MA) linked to an exhaust valve controller type 252 (MKS Instruments Inc., Anover,
MA). The electrical field within the reactor chamber is generated by an alternative current
(AC) RF power generator LF-5 from RFPP Inc. (Voorhees, NJ) with a working power range of
10 to 200 W and a frequency range of 50 to 400 kHz. A matching network is added to match
the RF generator applied power to that delivered to the plasma. However, this network was
not sufficient to ascertain identical power levels. As such, the reflected power was recorded
for all experiments and the frequency of the AC generator was kept constant to avoid
discrepancies between set power and power actually applied between the chamber
electrodes.
2.2.2 Plasma polymerization process operating conditions
Typically, the plasma polymerization process is initiated by lowering the chamber pressure
below 0.7 Pa to remove air molecules and ensure a proper seal of the reactor set-up from the
environment. The risk of implosion at such high vacuums requires precautions to avoid
contacts with the glass chamber and the presence of an anti-implosion protective barrier.
Degassed n-heptylamine (99.5% purity, cat. 126802, Sigma-Aldrich, Oakville, Canada) is
then introduced in the reactor chamber at pressures controlled between 5 Pa and 20 Pa. The
plasma formation and deposition process is initiated by applying a 10 to 80 W power through
the AC RF generator at a set frequency of 50 kHz for the desired reaction time. Plasma
polymerization is stopped by closing the manual monomer inlet valve and, 5 seconds later,
the RF generator is switched off to prevent after-glow deposition on the electrodes. A plasma
pre-coating was first accomplished before a sample was introduced into the plasma chamber
to insure repeatability between samples.
2.2.3 Elemental composition of the n-heptylamine plasma polymer (HApp) films by X-ray
photoelectron spectroscopy (XPS)
XPS spectra were recorded on FEP tapes (100 gauge, type A, Dupont Fluoroproducts,
Wilmington, DE, USA). The substrates were first cleaned in RBS Surfactant 35 (Pierce,
Rockford, IL) overnight, then sonicated for 10 minutes and rinsed with deionized water with a
resistivity of not less than 18.2 M�*cm (Milli-Q gradient water system, Millipore, USA), and
finally dried with 0.2 µm filtered air under a laminar flow hood. Analyses were performed
using an AXIS HSi spectrometer from Kratos Analytical Ltd. (Manchester, UK). The XPS
measurements were conducted using a monochromated aluminium K alpha source at a
power of 180 W and samples were placed at 90o angle from the detector. Pressure in the
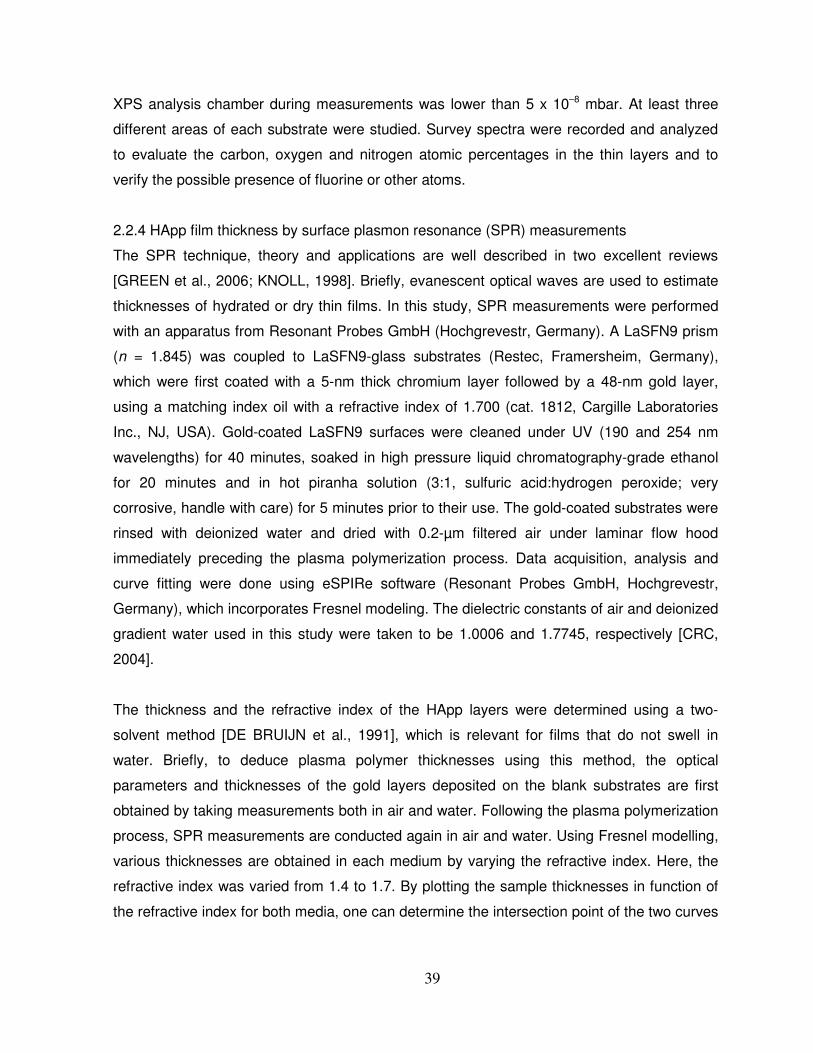
39
XPS analysis chamber during measurements was lower than 5 x 10⁻⁸ mbar. At least three
different areas of each substrate were studied. Survey spectra were recorded and analyzed
to evaluate the carbon, oxygen and nitrogen atomic percentages in the thin layers and to
verify the possible presence of fluorine or other atoms.
2.2.4 HApp film thickness by surface plasmon resonance (SPR) measurements
The SPR technique, theory and applications are well described in two excellent reviews
[GREEN et al., 2006; KNOLL, 1998]. Briefly, evanescent optical waves are used to estimate
thicknesses of hydrated or dry thin films. In this study, SPR measurements were performed
with an apparatus from Resonant Probes GmbH (Hochgrevestr, Germany). A LaSFN9 prism
(n = 1.845) was coupled to LaSFN9-glass substrates (Restec, Framersheim, Germany),
which were first coated with a 5-nm thick chromium layer followed by a 48-nm gold layer,
using a matching index oil with a refractive index of 1.700 (cat. 1812, Cargille Laboratories
Inc., NJ, USA). Gold-coated LaSFN9 surfaces were cleaned under UV (190 and 254 nm
wavelengths) for 40 minutes, soaked in high pressure liquid chromatography-grade ethanol
for 20 minutes and in hot piranha solution (3:1, sulfuric acid:hydrogen peroxide; very
corrosive, handle with care) for 5 minutes prior to their use. The gold-coated substrates were
rinsed with deionized water and dried with 0.2-µm filtered air under laminar flow hood
immediately preceding the plasma polymerization process. Data acquisition, analysis and
curve fitting were done using eSPIRe software (Resonant Probes GmbH, Hochgrevestr,
Germany), which incorporates Fresnel modeling. The dielectric constants of air and deionized
gradient water used in this study were taken to be 1.0006 and 1.7745, respectively [CRC,
2004].
The thickness and the refractive index of the HApp layers were determined using a two-
solvent method [DE BRUIJN et al., 1991], which is relevant for films that do not swell in
water. Briefly, to deduce plasma polymer thicknesses using this method, the optical
parameters and thicknesses of the gold layers deposited on the blank substrates are first
obtained by taking measurements both in air and water. Following the plasma polymerization
process, SPR measurements are conducted again in air and water. Using Fresnel modelling,
various thicknesses are obtained in each medium by varying the refractive index. Here, the
refractive index was varied from 1.4 to 1.7. By plotting the sample thicknesses in function of
the refractive index for both media, one can determine the intersection point of the two curves
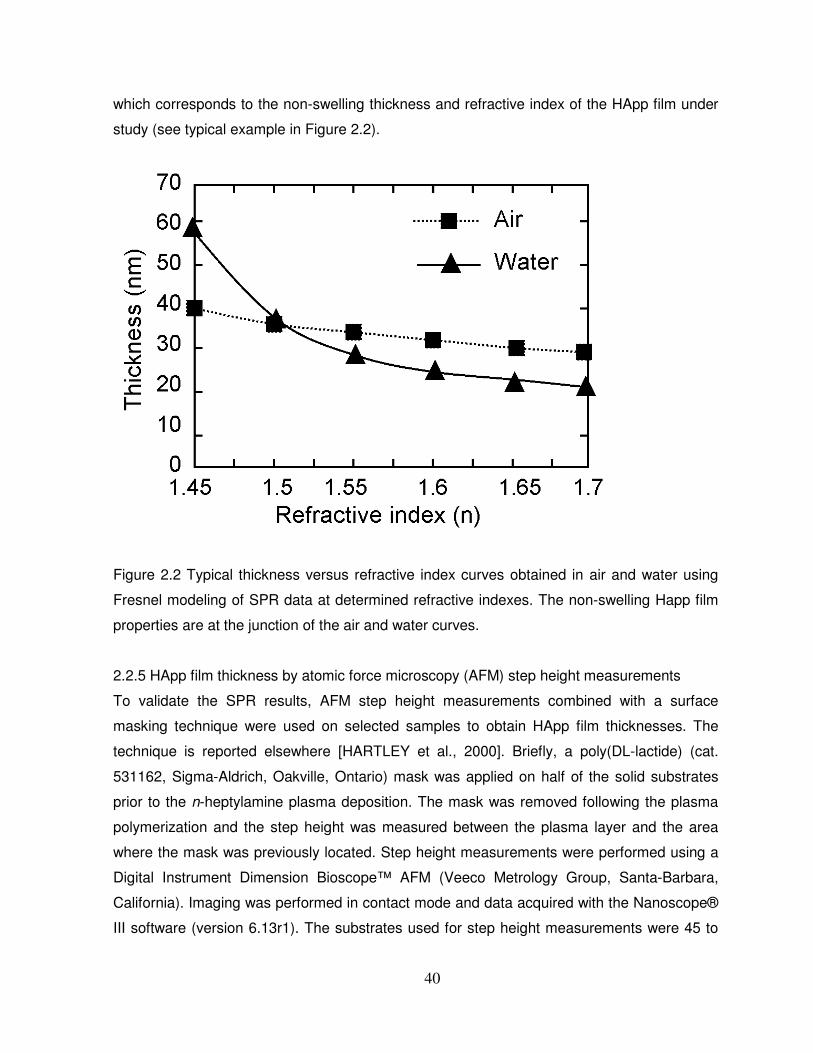
40
which corresponds to the non-swelling thickness and refractive index of the HApp film under
study (see typical example in Figure 2.2).
Figure 2.2 Typical thickness versus refractive index curves obtained in air and water using
Fresnel modeling of SPR data at determined refractive indexes. The non-swelling Happ film
properties are at the junction of the air and water curves.
2.2.5 HApp film thickness by atomic force microscopy (AFM) step height measurements
To validate the SPR results, AFM step height measurements combined with a surface
masking technique were used on selected samples to obtain HApp film thicknesses. The
technique is reported elsewhere [HARTLEY et al., 2000]. Briefly, a poly(DL-lactide) (cat.
531162, Sigma-Aldrich, Oakville, Ontario) mask was applied on half of the solid substrates
prior to the n-heptylamine plasma deposition. The mask was removed following the plasma
polymerization and the step height was measured between the plasma layer and the area
where the mask was previously located. Step height measurements were performed using a
Digital Instrument Dimension Bioscope™ AFM (Veeco Metrology Group, Santa-Barbara,
California). Imaging was performed in contact mode and data acquired with the Nanoscope®
III software (version 6.13r1). The substrates used for step height measurements were 45 to
41
50 nm thick gold-coated glass disks (Ssens bv, Hengelo, Netherlands) and freshly-cleaved
mica. Gold-coated glass and mica substrates were cleaned similarly to the SPR LASFN9
surfaces.
2.2.6 Swelling and stability of HApp films by quartz crystal microbalance (QCM)
measurements
QCM measurements were performed using an apparatus from Resonant Probes GmbH
(Hochgrevestr, Germany). For QCM experiments, the plasma-coated resonators were placed
into a commercial holder (CHT100, Maxtek, Cypress, CA, USA). Data from the network
analyzer (HP4396A, Agilent, Palo Alto, CA) were analyzed using the software from Resonant
Probes. Techniques and theory behind this apparatus are well explained elsewhere [DU et
al., 2004; KANKARE, 2002].
Swelling and stability of HApp layers in water were verified by placing an oxidized plasma-
coated resonator into the dry QCM holder made of Teflon. Reference frequencies were taken
in air and, upon stabilization of the frequency and half-band-half-width (i.e., the dissipation
multiplicated by the frequency of vibration divided by two) signals, deionized water was
automatically injected into the holder for two minutes at a rate of 10 ml/min. At this flow rate
and considering our QCM liquid cell geometry, the flow pattern is within the Stokes flow
regime. The shifts in frequency and half-band-half-width signals were then monitored for 24
hours to assess for any plasma layer swelling or desorption. Phosphate-buffered saline
solutions of an osmolarity of 300 mOsm were subsequently injected at various time intervals.
2.2.7 Factorial design and statistical analysis
As mentioned earlier, plasma polymerization is a complex process with many potent
variables affecting the surface properties (i.e., thickness and atomic composition) of the
resulting thin films. Moreover, XPS chemical analyses, SPR and AFM thickness
measurements, and plasma polymerization itself are time-consuming and costly procedures.
Thus, a non-replicated 2k-1 half-factorial design was used to plan the XPS experiments, while
a 2k full factorial design was used for the SPR experiments, as factorial and half-factorial
planning of experiments allow the rapid identification of the important variables affecting
plasma polymerization and subsequent analysis of variance (ANOVA) tests. Based on our
personal experience and limitations of the RF generator, upper and lower thresholds were
defined for each of the four variables investigated in this study. The variables studied and
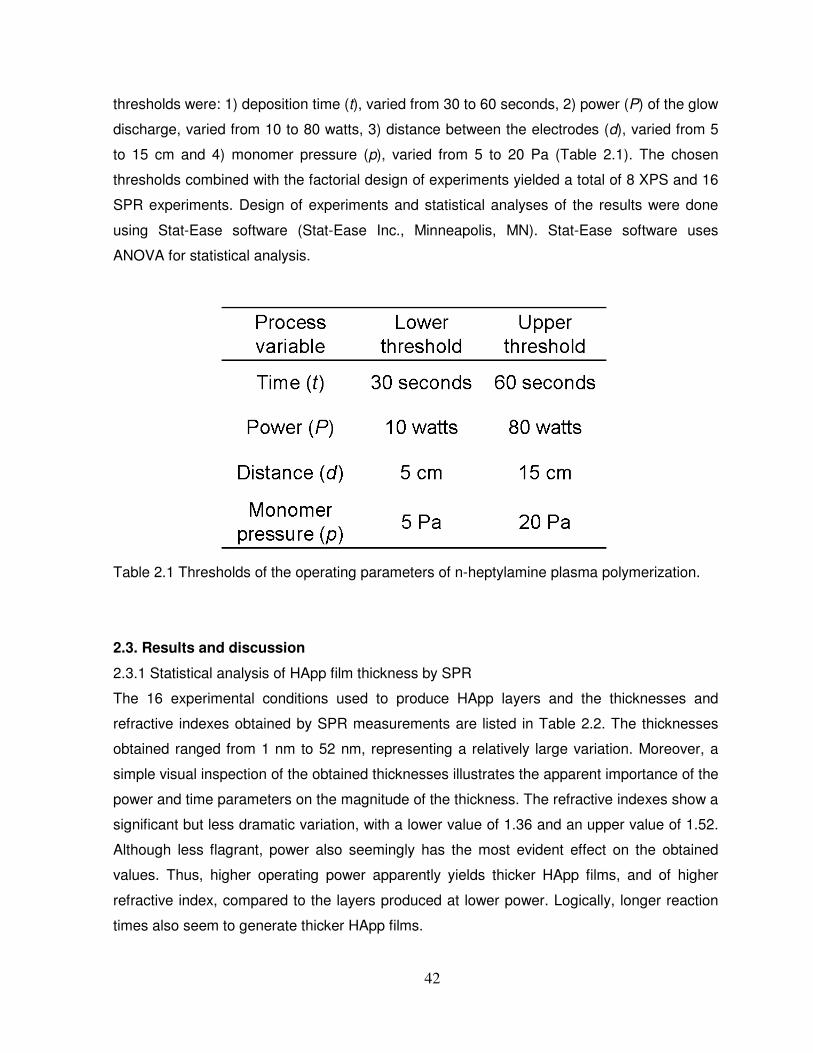
42
thresholds were: 1) deposition time (t), varied from 30 to 60 seconds, 2) power (P) of the glow
discharge, varied from 10 to 80 watts, 3) distance between the electrodes (d), varied from 5
to 15 cm and 4) monomer pressure (p), varied from 5 to 20 Pa (Table 2.1). The chosen
thresholds combined with the factorial design of experiments yielded a total of 8 XPS and 16
SPR experiments. Design of experiments and statistical analyses of the results were done
using Stat-Ease software (Stat-Ease Inc., Minneapolis, MN). Stat-Ease software uses
ANOVA for statistical analysis.
Table 2.1 Thresholds of the operating parameters of n-heptylamine plasma polymerization.
2.3. Results and discussion
2.3.1 Statistical analysis of HApp film thickness by SPR
The 16 experimental conditions used to produce HApp layers and the thicknesses and
refractive indexes obtained by SPR measurements are listed in Table 2.2. The thicknesses
obtained ranged from 1 nm to 52 nm, representing a relatively large variation. Moreover, a
simple visual inspection of the obtained thicknesses illustrates the apparent importance of the
power and time parameters on the magnitude of the thickness. The refractive indexes show a
significant but less dramatic variation, with a lower value of 1.36 and an upper value of 1.52.
Although less flagrant, power also seemingly has the most evident effect on the obtained
values. Thus, higher operating power apparently yields thicker HApp films, and of higher
refractive index, compared to the layers produced at lower power. Logically, longer reaction
times also seem to generate thicker HApp films.
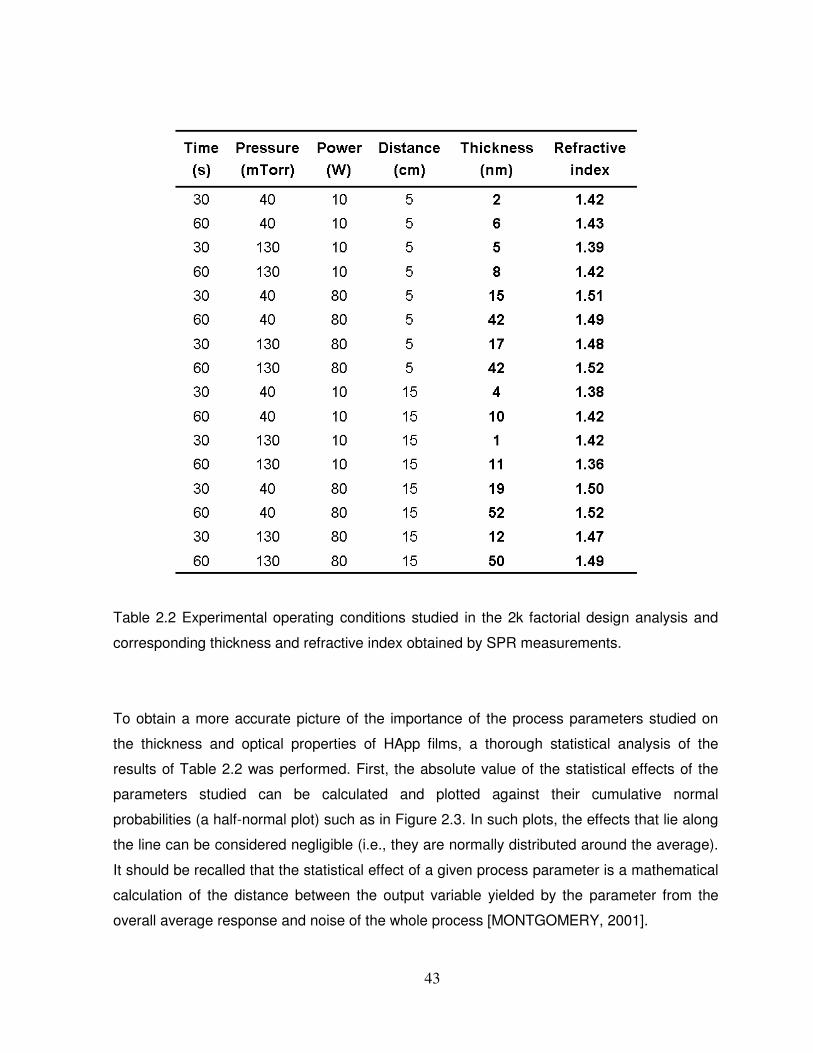
43
Table 2.2 Experimental operating conditions studied in the 2k factorial design analysis and
corresponding thickness and refractive index obtained by SPR measurements.
To obtain a more accurate picture of the importance of the process parameters studied on
the thickness and optical properties of HApp films, a thorough statistical analysis of the
results of Table 2.2 was performed. First, the absolute value of the statistical effects of the
parameters studied can be calculated and plotted against their cumulative normal
probabilities (a half-normal plot) such as in Figure 2.3. In such plots, the effects that lie along
the line can be considered negligible (i.e., they are normally distributed around the average).
It should be recalled that the statistical effect of a given process parameter is a mathematical
calculation of the distance between the output variable yielded by the parameter from the
overall average response and noise of the whole process [MONTGOMERY, 2001].
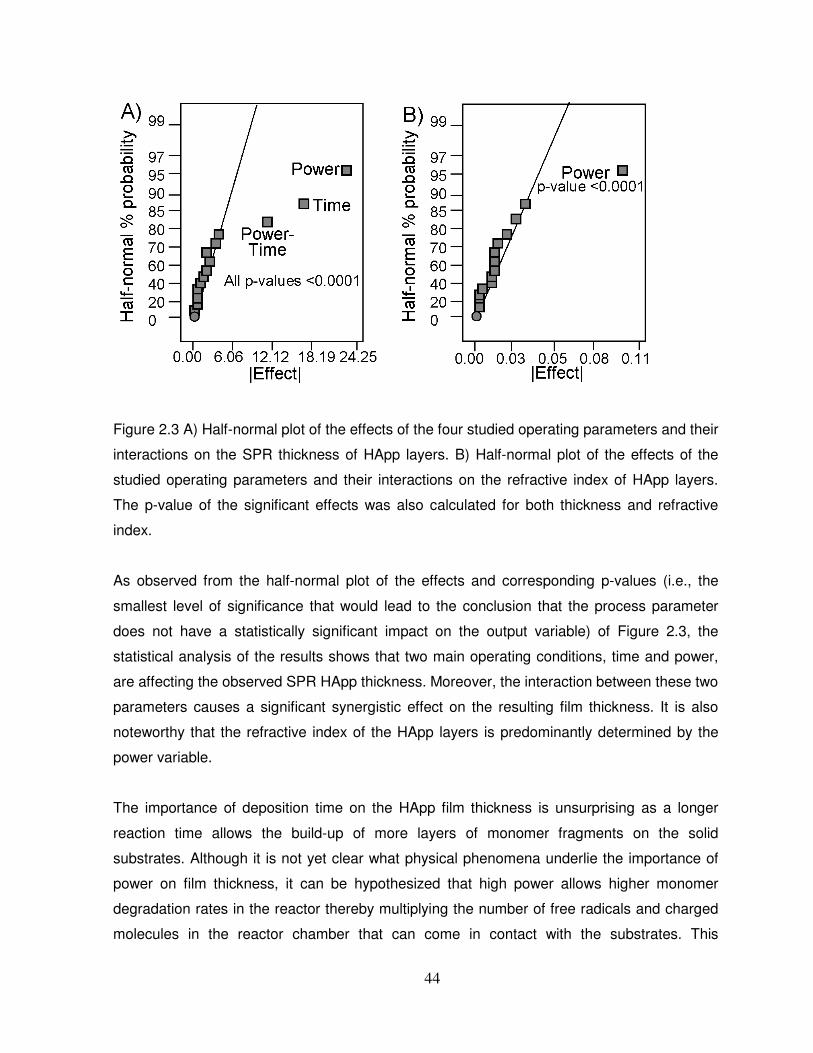
44
Figure 2.3 A) Half-normal plot of the effects of the four studied operating parameters and their
interactions on the SPR thickness of HApp layers. B) Half-normal plot of the effects of the
studied operating parameters and their interactions on the refractive index of HApp layers.
The p-value of the significant effects was also calculated for both thickness and refractive
index.
As observed from the half-normal plot of the effects and corresponding p-values (i.e., the
smallest level of significance that would lead to the conclusion that the process parameter
does not have a statistically significant impact on the output variable) of Figure 2.3, the
statistical analysis of the results shows that two main operating conditions, time and power,
are affecting the observed SPR HApp thickness. Moreover, the interaction between these two
parameters causes a significant synergistic effect on the resulting film thickness. It is also
noteworthy that the refractive index of the HApp layers is predominantly determined by the
power variable.
The importance of deposition time on the HApp film thickness is unsurprising as a longer
reaction time allows the build-up of more layers of monomer fragments on the solid
substrates. Although it is not yet clear what physical phenomena underlie the importance of
power on film thickness, it can be hypothesized that high power allows higher monomer
degradation rates in the reactor thereby multiplying the number of free radicals and charged
molecules in the reactor chamber that can come in contact with the substrates. This
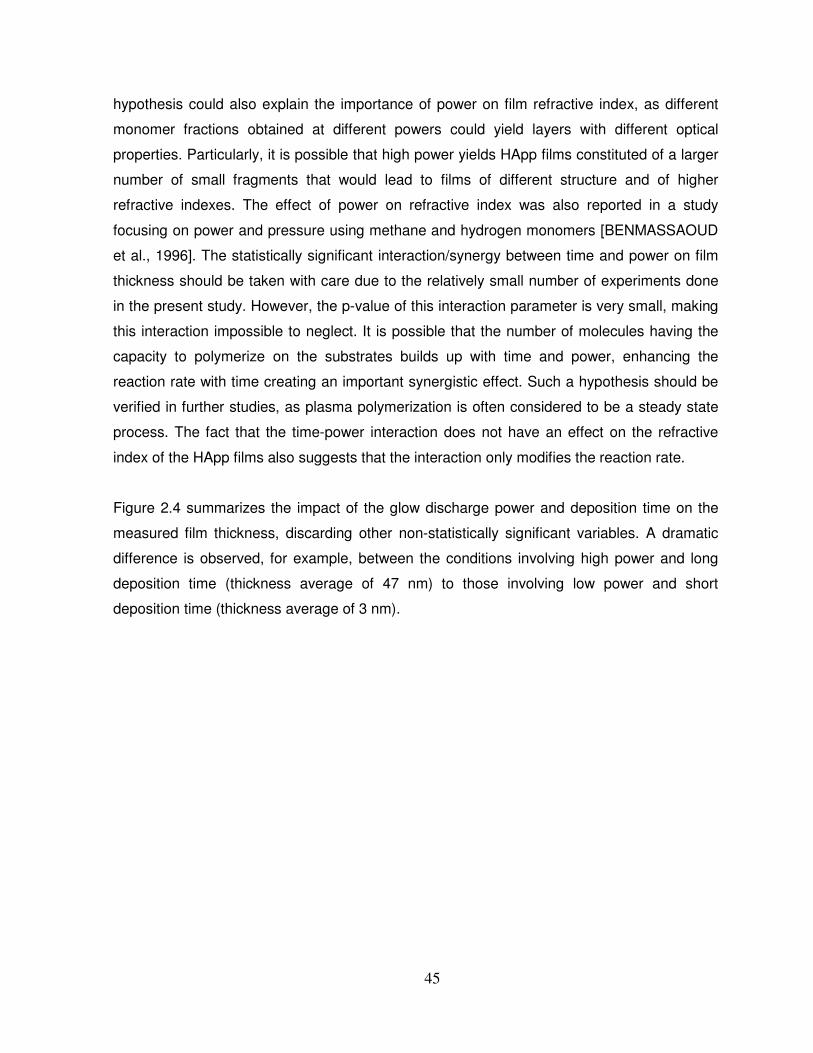
45
hypothesis could also explain the importance of power on film refractive index, as different
monomer fractions obtained at different powers could yield layers with different optical
properties. Particularly, it is possible that high power yields HApp films constituted of a larger
number of small fragments that would lead to films of different structure and of higher
refractive indexes. The effect of power on refractive index was also reported in a study
focusing on power and pressure using methane and hydrogen monomers [BENMASSAOUD
et al., 1996]. The statistically significant interaction/synergy between time and power on film
thickness should be taken with care due to the relatively small number of experiments done
in the present study. However, the p-value of this interaction parameter is very small, making
this interaction impossible to neglect. It is possible that the number of molecules having the
capacity to polymerize on the substrates builds up with time and power, enhancing the
reaction rate with time creating an important synergistic effect. Such a hypothesis should be
verified in further studies, as plasma polymerization is often considered to be a steady state
process. The fact that the time-power interaction does not have an effect on the refractive
index of the HApp films also suggests that the interaction only modifies the reaction rate.
Figure 2.4 summarizes the impact of the glow discharge power and deposition time on the
measured film thickness, discarding other non-statistically significant variables. A dramatic
difference is observed, for example, between the conditions involving high power and long
deposition time (thickness average of 47 nm) to those involving low power and short
deposition time (thickness average of 3 nm).
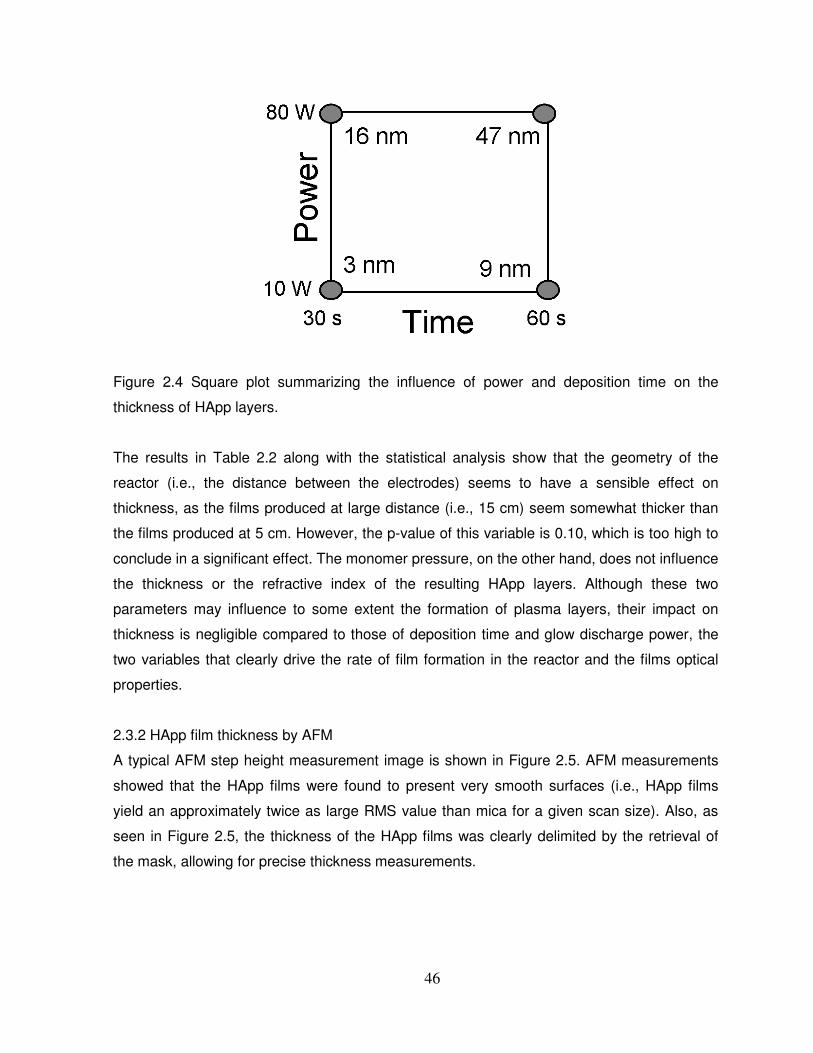
46
Figure 2.4 Square plot summarizing the influence of power and deposition time on the
thickness of HApp layers.
The results in Table 2.2 along with the statistical analysis show that the geometry of the
reactor (i.e., the distance between the electrodes) seems to have a sensible effect on
thickness, as the films produced at large distance (i.e., 15 cm) seem somewhat thicker than
the films produced at 5 cm. However, the p-value of this variable is 0.10, which is too high to
conclude in a significant effect. The monomer pressure, on the other hand, does not influence
the thickness or the refractive index of the resulting HApp layers. Although these two
parameters may influence to some extent the formation of plasma layers, their impact on
thickness is negligible compared to those of deposition time and glow discharge power, the
two variables that clearly drive the rate of film formation in the reactor and the films optical
properties.
2.3.2 HApp film thickness by AFM
A typical AFM step height measurement image is shown in Figure 2.5. AFM measurements
showed that the HApp films were found to present very smooth surfaces (i.e., HApp films
yield an approximately twice as large RMS value than mica for a given scan size). Also, as
seen in Figure 2.5, the thickness of the HApp films was clearly delimited by the retrieval of
the mask, allowing for precise thickness measurements.
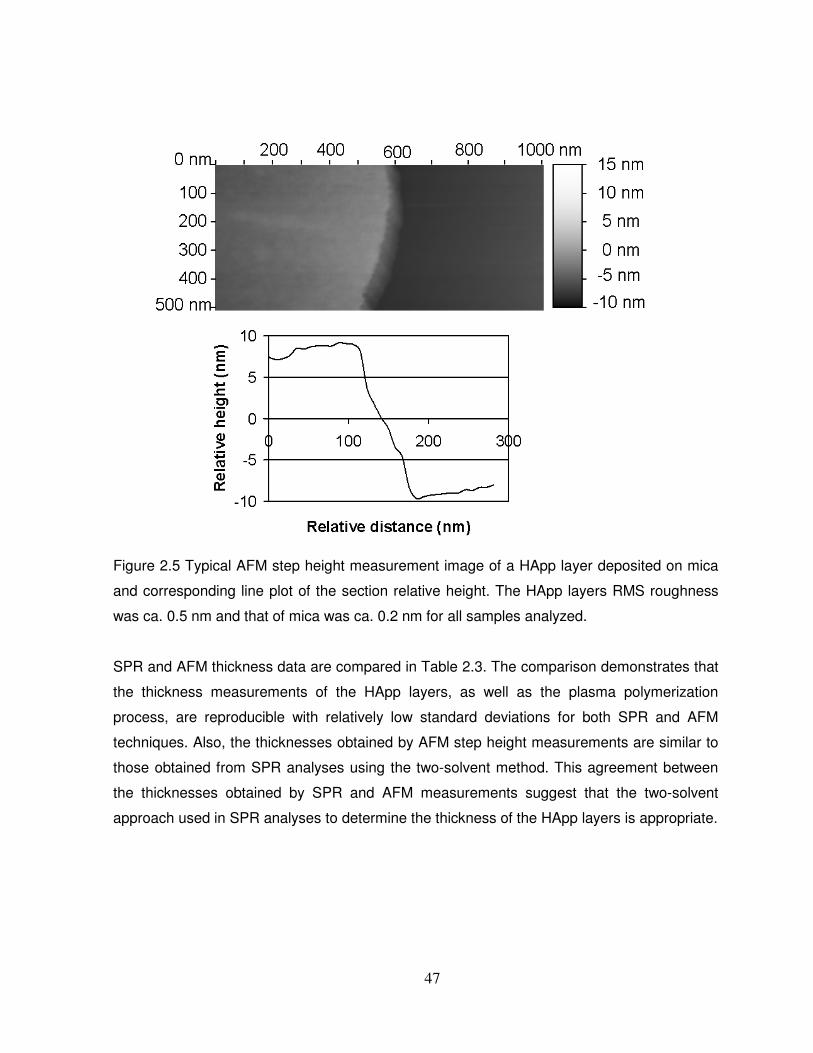
47
Figure 2.5 Typical AFM step height measurement image of a HApp layer deposited on mica
and corresponding line plot of the section relative height. The HApp layers RMS roughness
was ca. 0.5 nm and that of mica was ca. 0.2 nm for all samples analyzed.
SPR and AFM thickness data are compared in Table 2.3. The comparison demonstrates that
the thickness measurements of the HApp layers, as well as the plasma polymerization
process, are reproducible with relatively low standard deviations for both SPR and AFM
techniques. Also, the thicknesses obtained by AFM step height measurements are similar to
those obtained from SPR analyses using the two-solvent method. This agreement between
the thicknesses obtained by SPR and AFM measurements suggest that the two-solvent
approach used in SPR analyses to determine the thickness of the HApp layers is appropriate.
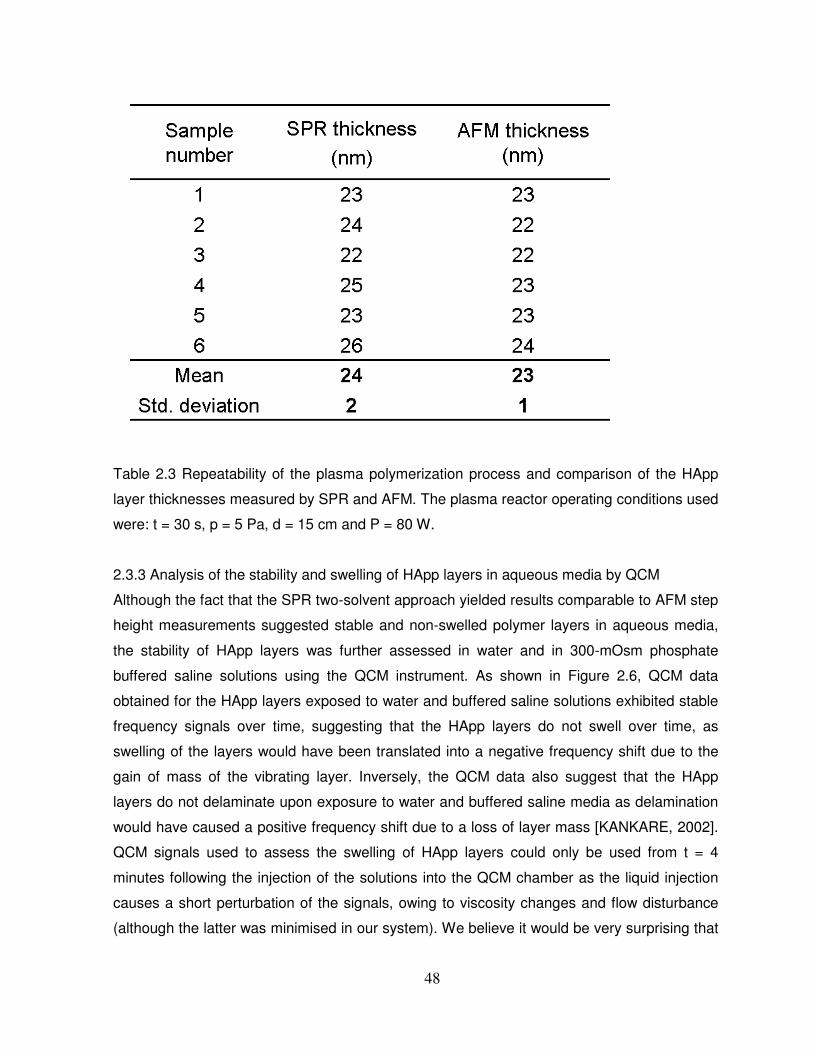
48
Table 2.3 Repeatability of the plasma polymerization process and comparison of the HApp
layer thicknesses measured by SPR and AFM. The plasma reactor operating conditions used
were: t = 30 s, p = 5 Pa, d = 15 cm and P = 80 W.
2.3.3 Analysis of the stability and swelling of HApp layers in aqueous media by QCM
Although the fact that the SPR two-solvent approach yielded results comparable to AFM step
height measurements suggested stable and non-swelled polymer layers in aqueous media,
the stability of HApp layers was further assessed in water and in 300-mOsm phosphate
buffered saline solutions using the QCM instrument. As shown in Figure 2.6, QCM data
obtained for the HApp layers exposed to water and buffered saline solutions exhibited stable
frequency signals over time, suggesting that the HApp layers do not swell over time, as
swelling of the layers would have been translated into a negative frequency shift due to the
gain of mass of the vibrating layer. Inversely, the QCM data also suggest that the HApp
layers do not delaminate upon exposure to water and buffered saline media as delamination
would have caused a positive frequency shift due to a loss of layer mass [KANKARE, 2002].
QCM signals used to assess the swelling of HApp layers could only be used from t = 4
minutes following the injection of the solutions into the QCM chamber as the liquid injection
causes a short perturbation of the signals, owing to viscosity changes and flow disturbance
(although the latter was minimised in our system). We believe it would be very surprising that
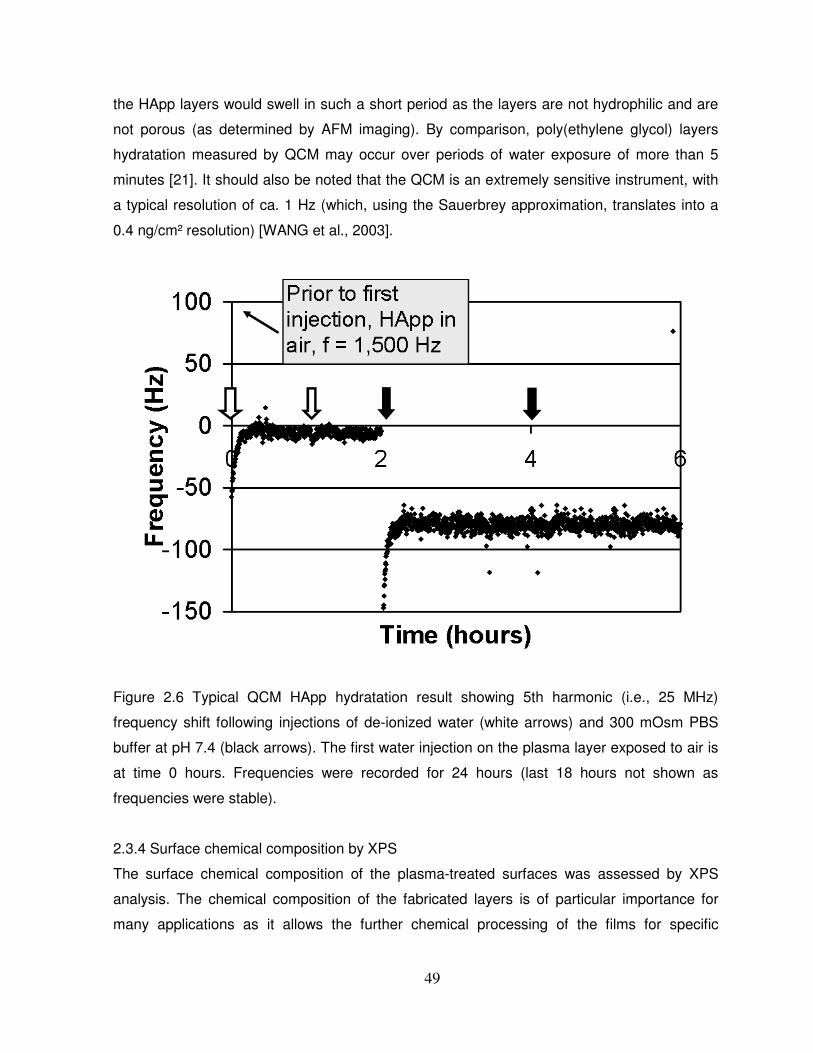
49
the HApp layers would swell in such a short period as the layers are not hydrophilic and are
not porous (as determined by AFM imaging). By comparison, poly(ethylene glycol) layers
hydratation measured by QCM may occur over periods of water exposure of more than 5
minutes [21]. It should also be noted that the QCM is an extremely sensitive instrument, with
a typical resolution of ca. 1 Hz (which, using the Sauerbrey approximation, translates into a
0.4 ng/cm² resolution) [WANG et al., 2003].
Figure 2.6 Typical QCM HApp hydratation result showing 5th harmonic (i.e., 25 MHz)
frequency shift following injections of de-ionized water (white arrows) and 300 mOsm PBS
buffer at pH 7.4 (black arrows). The first water injection on the plasma layer exposed to air is
at time 0 hours. Frequencies were recorded for 24 hours (last 18 hours not shown as
frequencies were stable).
2.3.4 Surface chemical composition by XPS
The surface chemical composition of the plasma-treated surfaces was assessed by XPS
analysis. The chemical composition of the fabricated layers is of particular importance for
many applications as it allows the further chemical processing of the films for specific
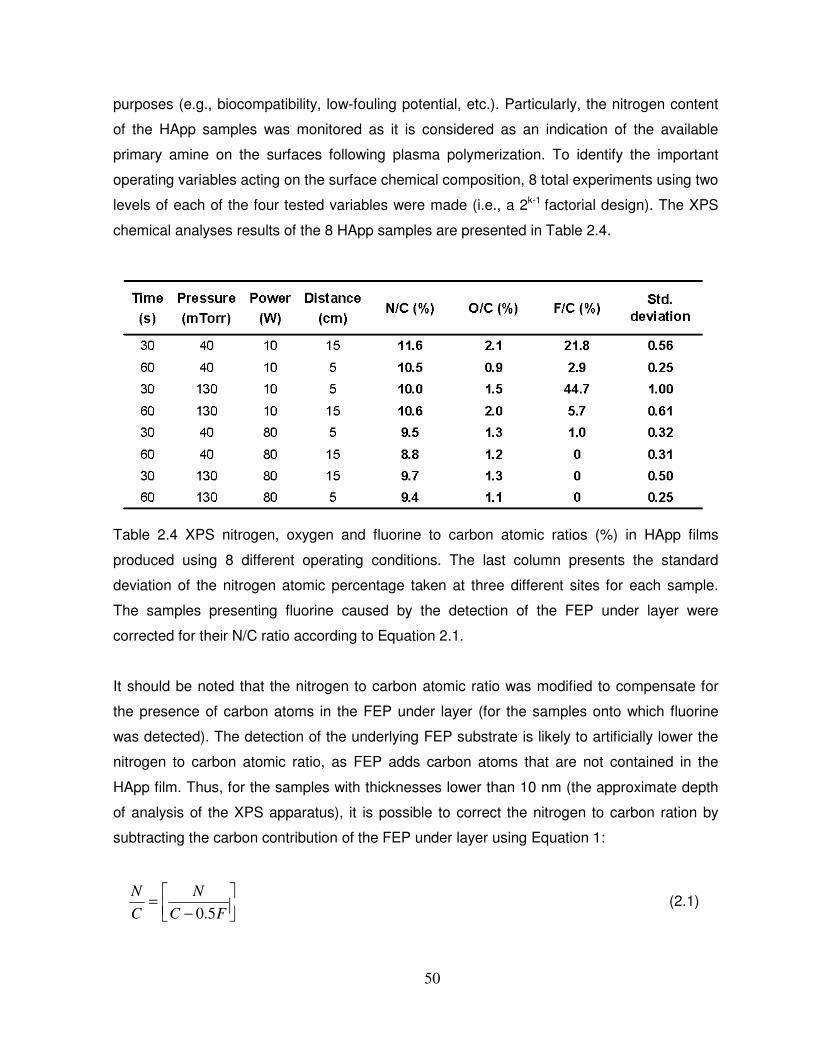
50
purposes (e.g., biocompatibility, low-fouling potential, etc.). Particularly, the nitrogen content
of the HApp samples was monitored as it is considered as an indication of the available
primary amine on the surfaces following plasma polymerization. To identify the important
operating variables acting on the surface chemical composition, 8 total experiments using two
levels of each of the four tested variables were made (i.e., a 2k-1 factorial design). The XPS
chemical analyses results of the 8 HApp samples are presented in Table 2.4.
Table 2.4 XPS nitrogen, oxygen and fluorine to carbon atomic ratios (%) in HApp films
produced using 8 different operating conditions. The last column presents the standard
deviation of the nitrogen atomic percentage taken at three different sites for each sample.
The samples presenting fluorine caused by the detection of the FEP under layer were
corrected for their N/C ratio according to Equation 2.1.
It should be noted that the nitrogen to carbon atomic ratio was modified to compensate for
the presence of carbon atoms in the FEP under layer (for the samples onto which fluorine
was detected). The detection of the underlying FEP substrate is likely to artificially lower the
nitrogen to carbon atomic ratio, as FEP adds carbon atoms that are not contained in the
HApp film. Thus, for the samples with thicknesses lower than 10 nm (the approximate depth
of analysis of the XPS apparatus), it is possible to correct the nitrogen to carbon ration by
subtracting the carbon contribution of the FEP under layer using Equation 1:
��
���
�
−=
FCN
CN
5.0 (2.1)
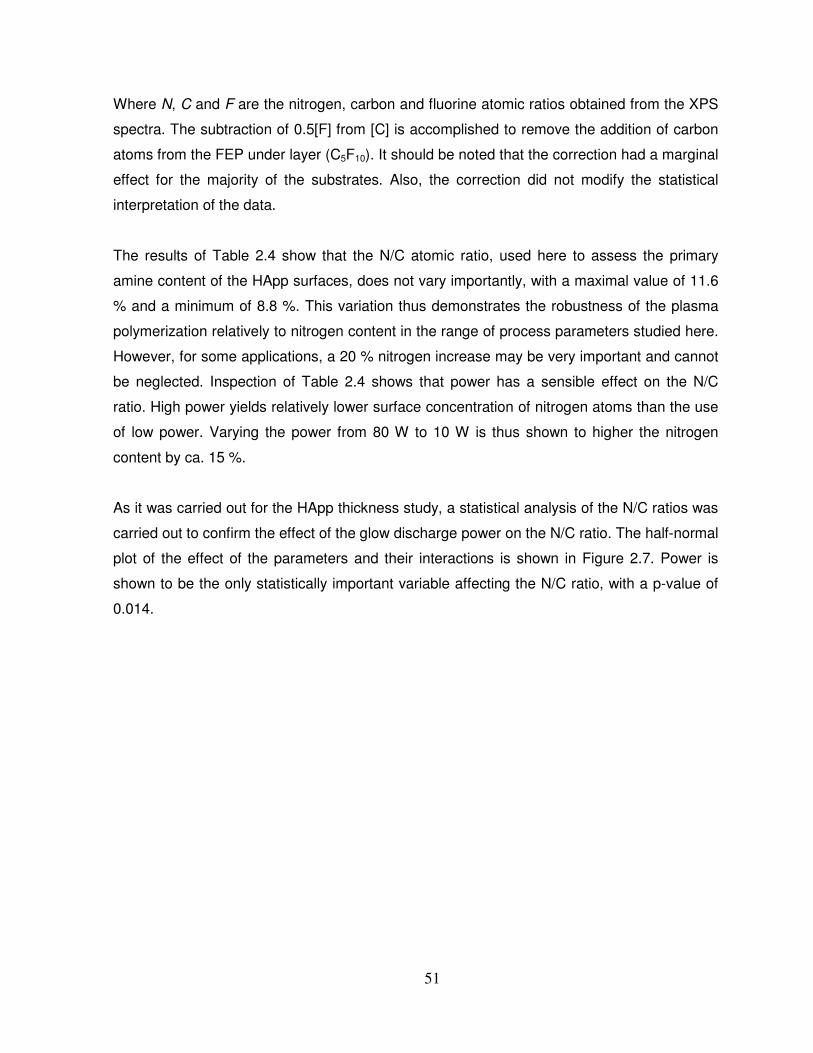
51
Where N, C and F are the nitrogen, carbon and fluorine atomic ratios obtained from the XPS
spectra. The subtraction of 0.5[F] from [C] is accomplished to remove the addition of carbon
atoms from the FEP under layer (C5F10). It should be noted that the correction had a marginal
effect for the majority of the substrates. Also, the correction did not modify the statistical
interpretation of the data.
The results of Table 2.4 show that the N/C atomic ratio, used here to assess the primary
amine content of the HApp surfaces, does not vary importantly, with a maximal value of 11.6
% and a minimum of 8.8 %. This variation thus demonstrates the robustness of the plasma
polymerization relatively to nitrogen content in the range of process parameters studied here.
However, for some applications, a 20 % nitrogen increase may be very important and cannot
be neglected. Inspection of Table 2.4 shows that power has a sensible effect on the N/C
ratio. High power yields relatively lower surface concentration of nitrogen atoms than the use
of low power. Varying the power from 80 W to 10 W is thus shown to higher the nitrogen
content by ca. 15 %.
As it was carried out for the HApp thickness study, a statistical analysis of the N/C ratios was
carried out to confirm the effect of the glow discharge power on the N/C ratio. The half-normal
plot of the effect of the parameters and their interactions is shown in Figure 2.7. Power is
shown to be the only statistically important variable affecting the N/C ratio, with a p-value of
0.014.
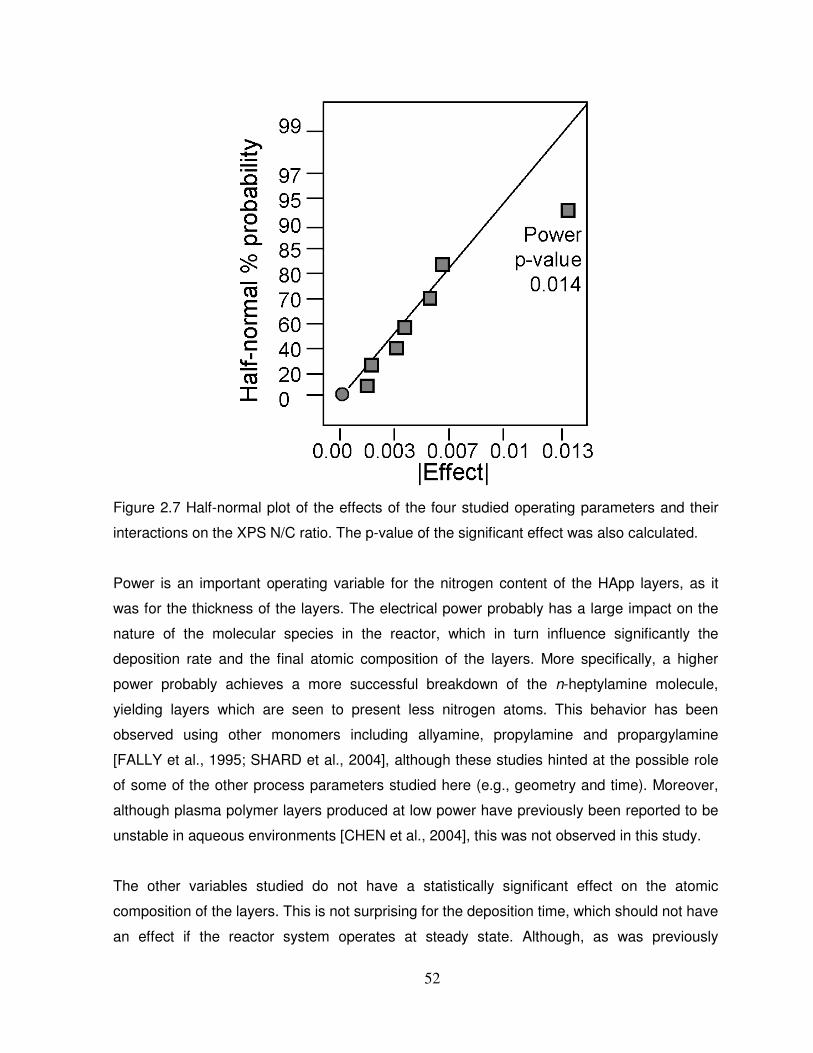
52
Figure 2.7 Half-normal plot of the effects of the four studied operating parameters and their
interactions on the XPS N/C ratio. The p-value of the significant effect was also calculated.
Power is an important operating variable for the nitrogen content of the HApp layers, as it
was for the thickness of the layers. The electrical power probably has a large impact on the
nature of the molecular species in the reactor, which in turn influence significantly the
deposition rate and the final atomic composition of the layers. More specifically, a higher
power probably achieves a more successful breakdown of the n-heptylamine molecule,
yielding layers which are seen to present less nitrogen atoms. This behavior has been
observed using other monomers including allyamine, propylamine and propargylamine
[FALLY et al., 1995; SHARD et al., 2004], although these studies hinted at the possible role
of some of the other process parameters studied here (e.g., geometry and time). Moreover,
although plasma polymer layers produced at low power have previously been reported to be
unstable in aqueous environments [CHEN et al., 2004], this was not observed in this study.
The other variables studied do not have a statistically significant effect on the atomic
composition of the layers. This is not surprising for the deposition time, which should not have
an effect if the reactor system operates at steady state. Although, as was previously
53
discussed, the time-power interaction has an important effect on HApp layer thickness, the
effect seems to be mainly acting on reaction/build-up rate rather than on final layer atomic
composition, as was also observed for the refractive index. The reactor pressure and the
distance between the electrodes could have an impact on nitrogen content of HApp films;
however, more experiments would be needed to investigate this possible impact, which
would be minimal compared to that of power.
It is important to realize that the atomic ratio of nitrogen to carbon atoms can only be used as
an approximation of the quantity of surface primary amines useful for applications requiring
subsequent chemical modifications. Other less reactive nitrogen-containing groups, such as
imines, nitriles or amides, may be in fact present at the surface [SHARD et al., 2004]. As
such, derivatization studies could be performed to assess this possibility, although the
numerous pitfalls of the various derivatization techniques should be considered [FALLY et al.,
1995].
The oxidation of the samples was very low for all samples, with the O/C ratios ranging
between 0.9 and 2.1 %. Moreover, no process parameter had statistically important effects
on the oxidation, the variations observed likely being caused by slightly different exposure
times to air.
The presence of fluorine atoms was detected for some HApp samples, as illustrated by their
non-zero F/C ratio. These samples must present a thickness smaller than 10 nm, which is,
again, the depth of analysis of the XPS. As can be predicted from the SPR data, the HApp
samples that were produced at short deposition times and low glow discharge powers
showed a relatively important presence of fluorine atoms, while the surfaces produced at high
power and long deposition time were fluorine-free. The XPS results further confirm the
validity of the SPR and AFM data relatively to the measured HApp thicknesses.
The standard deviation data presented in Table 2.4 was used to assess the possible effect of
the process variables on the chemical uniformity of the HApp layers. The nitrogen atomic
percentage was taken at three different spots on each sample and the standard deviation,
along with a corresponding statistical ANOVA analysis, show that no process parameter
significantly modifies layer uniformity.
54
Finally, high-resolution XPS spectra on carbon were taken for selected samples (data not
shown) and revealed a broad C 1s peak associated with a variety of chemical structures
formed during thin film deposition from the gas plasma. As a result, it is difficult to clearly
resolve the C-N containing species from those containing C-O, which may result from the
spontaneous quenching of carbon radicals within the film on exposure to air.
Other process parameters should be studied in the future, especially the factors that can
change in a non-controllable fashion in the process, such as leaks, pumping rate and the
presence of flow restrictions due to accumulated monomer. These parameters may
significantly lower the repeatability of the plasma polymerization process and its outcome
[FAVIA et al., 2001]. However, these parameters are very hard to measure and to control.
Perhaps the in situ monitoring of the process parameters through optical techniques, for
example, could help to achieve this goal and insure more reliable plasma polymerization
processes. Moreover, in this study, variations in film properties were not observed for
different types of substrates. For example, film thicknesses appear to be similar on mica
(AFM step height measurements) and on gold (SPR). However, variations are possible and
should be considered when planning to work with different substrates.
2.4 Conclusion
This study systematically described the influence of four operating parameters (monomer
pressure, power of the glow discharge, deposition time, and distance between the electrodes)
involved in n-heptylamine plasma polymerization on two key HApp film properties: thickness
and nitrogen content. SPR measurements showed that the thickness of HApp layers was
influenced predominantly by the glow discharge power and, unsurprisingly, the deposition
time. Moreover, a synergistic effect between time and power is present and generates thicker
HApp layers. The refractive index of the HApp film was shown to be exclusively influenced by
power, thus hinting that time and its synergy with power act on the reaction rate but do not
affect the nature of the reactive chemical species in the reactor.
AFM imaging showed that HApp layers deposited on mica substrates were pinhole free and
smooth with a RMS of approximately 0.5 nm. We have also demonstrated, with AFM step
height measurements, that the SPR two-solvent method was an appropriate and reproducible
technique to obtain the thickness of plasma polymer layers. QCM analyses showed that
HApp layers were very stable over time in aqueous media and did not swell. Finally, the
55
nitrogen content of the HApp films was shown to be mainly determined by power, lower
power yielding significantly more surface nitrogen atoms.
This is the first study, to our knowledge, that determines statistically the importance of the key
operating variables in plasma polymerization on final layer characteristics. Such investigation
should be important when attempting to fabricate plasma polymer layers to be able to tune
the surface properties of the resulting layers.
2.5 References
(2004) CRC Handbook Chemistry and Physics, 85th Edition edition, CRC Press.
BENMASSAOUD, A A, PAYNTER, R. W. (1996) Influence of the power and pressure on the growth rate and refractive index of a-C:H thin films deposited by r.f. plasma-enhanced chemical vapour deposition, Thin Solid Films, 287, p. 125-129.
CHEN, Q, FÖRCH, R., KNOLL, W. (2004) Characterization of pulsed plasma polymerization allylamine as an adhesion layer for DNA adsorption/hybridization, Chemistry of Materials, 16, p. 614-620.
CHOUKOUROV, A, BIEDERMAN, H., OLODKOV, I., AVINSKA, D., CHOVA, M., LLANDER, A. (2004) Properties of amine-containing coatings prepared by plasma polymerization, Journal of Applied Polymer Science, 92, p. 979-990.
DE BRUIJN, H E, ALTENBURG, B. S. F., KOOYMAN, R. P. H., GREVE, J. (1991) Determination of thickness and dielectric constant of thin transparent dielectric layers using surface plasmon resonance, Optics Communications, 82, p. 425-432.
DU, B Y, JOHANNSMANN, D. (2004) Operation of the quartz crystal microbalance in liquids: Derivation of the elastic compliance of a film from the ratio of bandwidth shift and frequency shift, Langmuir, 20, p. 2809-2812.
FALLY, F, DONEUX, C., RIGA, J., VERBIST, J. J. (1995) Quantification of the functional groups present at the surface of plasma polymers deposited from propylamine, allylamine, and propargylamine, Journal of Applied Polymer Science, 56, p. 597-614.
FAVIA, P, CREATORE, M., PALUMBO, F., COLAPRICO, V., D'AGOSTINO, R. (2001) Process control for plasma processing of polymers, Surface and Coatings Technology, 142-144, p. 1-6.
GREEN, R J, FRAZIER, R. A., SHAKESHEFF, K. M., DAVIES, M. C., ROBERTS, C. J., TENDLER, S. J. B. (2006) Surface plasmon resonance analysis of dynamic biological interactions with biomaterials, Biomaterials, 21, p. 1823-1835.
56
GRIESSER, H J (1989) Small-Scale Reactor for Plasma Processing of Moving Substrate Web, Vacuum, 39, p. 485-488.
HARTLEY, P G, THISSEN, H., VAITHIANATHAN, T., GRIESSER, H. J. (2000) A surface masking technique for the determination of plasma polymer film thickness by AFM, Plasmas and Polymers, 5, p. 47-60.
HUBER, F, SPRINGER, J. (1996) Construction of a plasma polymerization reactor system for laboratory use, Journal of Applied Polymer Science, 62, p. 145-151.
KANKARE, J (2002) Sauerbrey equation of quartz crystal microbalance in liquid medium, Langmuir, 18, p. 7092-7094.
KINGSHOTT, P, THISSEN, H., GRIESSER, H. J. (2002) Effects of cloud-point grafting, chain length, and density of PEG layers on competitive adsorption of ocular proteins, Biomaterials.23(9):2043-56,
KNOLL, W (1998) Interfaces and thin films as seen by bound electromagnetic waves, Annual Review of Physical Chemistry, 49, p. 569-639.
MARATSUGU, M, KUROSAWA, S., KAMO, N. (1991) Adsorption and desorption of F(ab')2Anti-hIgG on plasma-polymerized allylamine thin film: The application of the film to immunoassay, Journal of Colloid and Interface Science, 147, p. 378-386.
MONTGOMERY, D. C. (2001) Design and Analysis of Experiments, 5th Edition, John Wiley & Sons.
MOROSOFF, N (1990) An introduction to plasma polymerization, in Plasma Deposition Treatment and Etching of Polymers, edited by D'AGOSTINO, R., Academic Press, p. 1-94.
SHARD, A G, WHITTLE, J. D., BECK, A. J., BROOKES, P. N., BULLETT, N. A., TALIB, R. A., MISTRY, A., BARTON, D., MCARTHUR, S. L. (2004) A NEXAFS examination of unsaturation in plasma polymers of allylamine and propylamine, Journal of Physical Chemistry B, 102, p. 12472-12480.
VERMETTE, P, MEAGHER, L. (2002) Immobilization and characterization of poly(acrylic acid) graft layers, Langmuir, 18, p. 10137-10145.
WANG, Z, KUCKLING, D., JOHANNSMANN, D. (2003) Temperature-induced swelling and de-swelling of thin poly(N-isopropylacrylamide) gels in water: combined acoustic and optical measurements, Soft Materials, 1, p. 353-364.
YANG, X J, FANE, A. G., BI, J., GRIESSER, H. J. (2000) Stabilization of supported liquid membranes by plasma polymerization surface coating, Journal of Membrane Science, 168, p. 29-37.
57
CHAPITRE 3
COUCHES MINCES ANTI-ADHÉSIVES DE POLY(ÉTHYLÈNE GLYCOL) AVEC
GROUPEMENT AMINE TERMINAL ET EFFET DES CONDITIONS D’IMMOBILISATION
SUR LEURS PROPRIÉTÉS MÉCANIQUES ET PHYSICOCHIMIQUES.
Résumé
Les propriétés mécaniques et physicochimiques de couches de poly(ethylene glycol) (PEG)
antiadhésives avec groupement amine terminal et immobilisées de façon covalente sur des
surfaces sont dépendante des méthodes de fabrication utilisées. En particulier, l’utilisation de
solvants thêta conduit à des couches denses de polymères qui possèdent des propriétés mal
définies par les modèles traditionnels. Une technique à base de diffraction de la lumière a été
utilisée afin de comprendre l’influence de la cinétique d’agrégation du polymère dans un
solvant thêta sur les propriétés finales des couches de PEG. Les propriétés des couches de
polymères ont été caractérisées par la spectroscopie à rayons X, la microscopie à force
atomique en mode force, la microbalance à cristal de quartz et la microscopie avec
fluorescence traditionnelle. Les résultats montrent que la concentration du polymère en
solution est un indicateur important des propriétés finales des couches, et que l’utilisation
d’un solvant thêta provoque des phénomènes d’agrégation complexes en solution
provoquant des disparités importantes entre les diverses conditions. Les couches minces de
PEG présentées dans ce chapitre montrent des sites disponibles pour les modifications
chimiques subséquentes à travers des amines primaires, ce qui pave la voie à
l’immobilisation de molécules bioactives de façon locale sur les surfaces.
Publié sous :
MARTIN, Y., VERMETTE, P. (2006) Low-fouling amine-terminated poly(ethylene glycol) thin
layers and effect of immobilization conditions on their mechanical and physicochemical
properties, Macromolecules, 39, p. 8083-8091.
58
LOW-FOULING AMINE-TERMINATED POLY(ETHYLENE GLYCOL) THIN LAYERS AND
EFFECT OF IMMOBILIZATION CONDITIONS ON THEIR MECHANICAL AND
PHYSICOCHEMCIAL PROPERTIES
Abstract
The physicochemical and mechanical properties of amine-terminated covalently-bound
poly(ethylene glycol) (PEG) layers are dependent on fabrication methods. In particular, the
use of a theta solvent yields dense polymer layers with properties not well described by
traditional models. Light diffraction techniques were used in an attempt to understand the
influence of polymer aggregation kinetics in a theta solvent on the final properties of the
fabricated PEG layers. The polymer layer properties were characterized using X-ray
photoelectron spectroscopy (XPS), atomic force microscopy (AFM) in force mode, quartz
crystal microbalance (QCM) and fluorescence microscopy. Results show that polymer
concentration in solution is an important indicator of final layer properties, and that the use of
a theta solvent induces complex aggregation phenomena in solution yielding layers with
widely different properties. The PEG layers fabricated through the process described in this
article are also shown to present chemically available primary amine groups, paving the way
for the immobilization of bio-active molecules.
Published as:
MARTIN, Y., VERMETTE, P. (2006) Low-fouling amine-terminated poly(ethylene glycol) thin
layers and effect of immobilization conditions on their mechanical and physicochemical
properties, Macromolecules, 39, p. 8083-8091.
�
�
59
3.1 Introduction
Poly(ethylene glycol)-modified (PEG-modified) surfaces have attracted much attention in the
past years due to their good anti-biofouling properties. PEG-coated surfaces are reported to
exhibit their anti-biofouling potential mainly through their resistance to non-specific protein
adsorption. However, it is not yet clear what forces predominantly come into play to repel
proteins from adhering to varyingly ordered hydrated PEG layers. Atomic force microscopy
(AFM) and surface force apparatus (SFA) studies have yielded partial answers, namely that
steric repulsion and/or hydration/water structuring interactions are mainly responsible for this
capacity. Other types of interactions that must be reported when attempting to model PEG
layers resistance towards protein adsorption include electrical double layer interactions and
van der Waals interactions, both of which can be attractive forces. PEG layers thus generally
provide a repulsive interaction barrier through steric repulsion and hydration/water structuring
of greater magnitude and longer range than either attractive electrostatic or van der Waals
interactions [VERMETTE et al., 2003b]. The importance of the repulsive interaction barrier,
which is directly proportional to the resistance to protein adhesion, is dependent on the exact
structure of immobilized PEG layers. From the well-known theories of de Gennes and
Alexander [ALEXANDER, 1977; DE GENNES, 1976], in which the conformation of grafted
polymers is dependent on the radius of gyration of the polymer, the distance between grafting
points and the quality of the solvent, so-called ‘brush’, ‘mushroom’ and ‘pancake’
conformations are described. The ‘brush’ conformation represents tightly packed and
extended polymer chains while the ‘pancake’ represents rather flat and non-interacting
polymer chains and the ‘mushroom’ stands somewhere in the middle of the two preceding
conformations (more or less tightly gathered polymer ‘balls’). It is widely believed that brush
conformations, where the polymer chains are the most tightly crowded on the surface, yield
the highest energy barrier to protein adsorption. This is, however, subject to caution as a
study on self-assembled monolayers of ethylene oxide-terminated molecules showed that
very high ethylene oxide densities can enhance protein adsorption by varying chain
conformation and water structuring characteristics [HARDER et al., 1998].
Different approaches can be undertaken to graft PEG molecules densely on surfaces in a
‘brush’ conformation to minimize protein adsorption. Modified PEG molecules can either be
adsorbed on a substrate or covalently immobilized. PEG-covered surfaces produced using
simple physisorption can detach, as it has been observed in some studies for poly(lysine)-
PEG surfaces [PASCHE et al., 2005]. It is believed that to achieve stable high-density PEG
60
layers, covalent immobilization is preferable to simple adsorption. Moreover, the PEG
molecular weight, its concentration in solution, the use of branched polymers, the nature of
the solvent used for immobilization and the number of grafting sites on the substrate all
contribute to yield different immobilized PEG layers. Thus, many reports have been published
to study the effect of these parameters on final layer conformation [DROBEK et al., 2005;
FICK et al., 2004; KINGSHOTT et al., 2002a; PASCHE et al., 2005; UNSWORTH et al.,
2005b; VLADKOVA et al., 1999]. Although a complete picture has not yet been developed, it
is clear that the use of a theta solvent or of a poor solvent yields layers of substantially higher
polymer density and enhanced low-fouling properties as first reported by Golander et al.
[GOLANDER et al., 1992] and subsequently by others [KINGSHOTT et al., 2002b;
UNSWORTH et al., 2005a]. High-density coatings obtained by covalent grafting from a good
solvent are difficult to achieve due to the steric hindrance of PEG chains as they approach a
surface which already contains some grafted chains. This effect can be lessened by carrying
out the PEG conjugation to the solid support at or just slightly below the cloud point
temperature, where the intrachain segment repulsions are small.
Although numerous reports have been published on the fabrication and characterization of
PEG layers, a much smaller number have been written on the application of specific PEG as
a base material for modulating specific cell responses. For example, one interesting
application, in our opinion, is the use of terminally modified PEG layers to allow subsequent
covalent addition of bio-active molecules. Such systems, although not widely described in the
literature, have been reported in efforts to minimize non-specific binding of biological
compounds (e.g., proteins) in label-free monitoring of affinity interactions [PIEHLER et al.,
2000], for the in vitro control of cellular attachment and proliferation [THISSEN et al., 2006]
and for the modulation of the coagulation of whole blood on PEG surfaces [HANSSON et al.,
2005]. Considerable efforts are also made to locate geometrically bio-active compounds on
low-fouling layers to achieve superior modulation of in vitro cell behavior. The principal
techniques currently available to produce such systems are described in an excellent review
by Li et al. [LI et al., 2003].
This study aimed to develop an optimized and characterized PEG-based system to allow the
localized covalent binding of a variety of bio-active molecules onto a wide range of
substrates. Efforts were placed to understand the effect of reaction parameters on
physicochemical and mechanical hydrated PEG layer properties. Quartz crystal microbalance
61
(QCM), atomic force microscopy (AFM) using the colloidal probe force measurement and X-
ray photoelectron spectroscopy (XPS) were used to achieve this understanding critical for
cell-based applications. The PEG layers produced in theta solvents were found to show
important discrepancies to traditional models and further investigation was carried out to
assess the possible effect of polymer aggregate kinetics in solution at different polymer
concentrations on PEG layer properties. The measure of aggregate sizes was achieved using
light diffraction. To our knowledge, this is the first study to attempt to understand the
significance of cloud point colloidal properties on immobilized polymer layer physicochemical
and mechanical properties. Moreover, techniques originating from DNA and protein chip
manufacture were also used to allow the creation of patterns of covalently-bound molecules
onto the PEG layers. The possibility to produce defined patterns was assessed by
fluorescence techniques.
3.2 Experimental Section
3.2.1 Plasma polymer surfaces
Plasma enhanced chemical vapour deposition (PECVD) was used to create stable reactive
amine-bearing layers through a process previously described [GRIESSER, 1989;
VERMETTE et al., 2003a]. Briefly, substrates to be modified were introduced into a home-
made cylindrical plasma reactor. N-heptylamine monomer (Sigma, Ontario (CAN), cat.
126802) was introduced in the reactor chamber until a pressure of 40 mTorr was reached.
The PECVD process was initiated by applying a radio-frequency current between two
electrodes. The samples were deposited onto the bottom electrode. The operating conditions
were set at a frequency of 50 kHz, a glow discharge power of 80 watts, a distance between
the electrodes of 10 cm, and a deposition time of 45 seconds. The choice of the operating
conditions was based on a previous study aiming to maximize the quantity of surface reactive
amines and to obtain layers of 25 nm (to be published).
3.2.2 PEG layer fabrication
Heptylamine plasma polymer (HApp) substrates were made to react at room temperature in a
solution of Boc-NH2-poly(ethylene glycol)-NHS of 3,400-Da molecular weight from Nektar
Therapeutics (San Carlos (CA), cat. 4M530F02). The PEG concentration was varied from 0.1
mg/ml to 5 mg/ml in either de-ionized water or in a theta solvent, in this case a Na2SO4
solution near saturation (Sigma, Ontario (CAN), cat. 239313). Cloud point formation was
used to define the theta solvent, which was not previously known for this polymer at room
62
temperature. It should be noted that the cloud point phenomenon occurs in a slightly poorer
solvent than the actual theta solvent. Samples were allowed to react overnight under
agitation and rinsed repeatedly in saline solutions and de-ionized water to remove salts and
unbound PEG molecules. Varied substrates were used to immobilize the PEG layers
depending on end-use. Perfluorinated poly(ethylene-co-propylene) tape from Dupont (Teflon
FEP Type A, Mississauga (CAN)) was used for XPS analyses and fluorescence studies. This
substrate was chosen mainly for its ease of use and the possibility to detect a fluorine signal
in XPS analyses. Quartz substrates coated with gold electrodes for QCM analyses were
bought from Maxtek (CA, 5 MHz blanks). Cleaved mica substrates were used for AFM force
measurements. All substrates were cleaned in RBS 35 surfactant (Pierce, Rockford (IL), cat.
27952), rinsed in water and in ethanol, and blown-dried using filtered air. Immobilized Boc-
NH2-PEG-plasma layers were Boc-deprotected following manufacturer’s recommendations
by immersing the substrates in a 50% v/v solution of trifluoroacetic acid (Sigma, Ontario
(CAN), cat. T62200) and dichloromethane (Sigma, Ontario (CAN), cat. D65100) for one hour.
The substrates were afterwards repeatedly rinsed in a 5% v/v solution of n,n-
diisopropylethylamine (Sigma, Ontario (CAN), cat. D3887) in dichloromethane.
3.2.3 Surface chemical composition by X-ray photoelectron spectroscopy (XPS)
XPS analyses were performed using an AXIS HSi spectrometer from Kratos Analytical Ltd.
(Manchester, UK). XPS measurements were conducted with a monochromated aluminium K
alpha source at a power of 180 Watts. Pressure of the XPS chamber during measurements
was lower than 5 x 10⁻⁸ mbar. FEP samples were fixed on XPS holder by a silver glue to
prevent charge accumulation during measurements. High-resolution C 1s and N 1s spectra,
along with survey spectra, were taken for each sample. Moreover, at least three different
areas on each substrate were analyzed. Each condition was represented by at least three
samples.
3.2.4 Viscoelastic properties of PEG layers and protein adsorption by quartz crystal
microbalance (QCM)
Quartz crystal microbalance measurements were performed using an apparatus from
Resonant Probes GmbH (Hochgrevestr, Germany). The gold-coated quartz resonators were
placed into a commercial holder (Maxtek (CA), CHT100). Data from the network analyzer
(Agilent, Palo Alto (CA), HP4396A) was analyzed using the software from Resonant Probes.
For protein adsorption assays, PEG-coated substrates were placed in the QCM holder
63
immersed in a 37 °C bath to maintain the temperature constant. RPMI 1640 medium (Sigma,
Ontario (CAN), cat. R8758) at the same temperature was automatically injected at a rate of
10 ml/min into the QCM chamber. Upon stability of the signal (at least one hour), a solution of
10% v/v de-complemented fetal bovine serum (Sigma, Ontario (CAN), cat. F2442) in RPMI
1640 was injected into the chamber at 10 ml/min. This injection was normalized at time 5
minutes to compare different layers. The choice of the protein medium used for the
adsorption tests was dictated by the wide range of proteins contained in FBS, so that the
versatility of protein resistance of the layers could be assessed. The frequency and half-
band-half-width shift (i.e., the dissipation times the frequency of vibration divided by two)
were recorded by the software to monitor changes in layer mass (e.g., adsorption of proteins)
and in layer viscoelastic properties.
For PEG grafting monitoring (i.e., so-called PEGylation), plasma-modified QCM substrates
were rapidly placed into the holder in contact with water. The frequencies of harmonic
vibrations were located and a Boc-PEG-NHS solution was automatically introduced into the
holder at a rate of 10 ml /min. The frequency and half-band-half-width signals were recorded
as for the adsorptions assays. In this case, the whole system was maintained at room
temperature (i.e., 22 °C) for the PEGylation tests. For hydration assays, PEG layers
covalently attached onto the quartz resonators were blown dried and placed into a desiccator
for at least 48 hours. The crystals were placed rapidly into the dry holder and harmonics were
taken in air. Water was injected at a rate of 10 ml/min for thirty seconds and variations in
frequency and half-band-half-width were measured until stabilisation of the signals (at least
one hour). Other water injections were made to insure a stable signal. All QCM experiments
were carried out in at least two different samples for each condition. For all QCM
measurements, data were taken at least for harmonics located at 15 MHz, 25 MHz, 35 MHz
and 45 MHz (the fundamental frequency being 5 MHz). Harmonic number 5 (i.e., 25 MHz) is
the harmonic reported in the graphics of this article.
3.2.5 PEG layers structure by atomic force microscopy (AFM)
A Bioscope (Digital Instruments , Santa Barbara, CA) coupled to a Zeiss inverted microscope
and linked to a Nanoscope IIIa controller was used to conduct force measurements on the
hydrated PEG layers based on the colloidal probe method as previously described
[VERMETTE et al., 2004]. Briefly, the AFM was operated at a frequency of 1 Hz and ramp
sizes of 100, 250 and 500 nm, recording both approaching and extending data. Silica
64
microspheres of 4.12 µm of diameter (Bangs Laboratories, Fisher (IN), cat. SS05N) were
attached using medical-grade epoxy-type glue (Master Bond, Hackensack (NJ), cat.
EP30MED) to Si3N4 cantilevers with a measured spring constant of 0.137 N/m (Veeco,
Woodbury (NY), DNP-S) using the resonance method proposed by Cleveland et al.
[CLEVELAND et al., 1993]. Cantilever deflection and z-piezo position was transformed into
force-versus-distance curves using a home-made software based on the developments by
Ducker et al. [DUCKER et al., 1992]. This software is made freely available upon request to
P. Vermette. Force measures were done at room temperature in 100 mOsm, 10 mOsm and 1
mOsm NaCl solutions buffered in 10 mM Hepes, in RPMI 1640 media and in deionized water,
allowing for at least 1 hour of stabilization before taking measures. At least three different
spots were studied on each sample, and at least 20 force curves were recorded for each
spot.
3.2.6 PEG aggregation measurements during cloud point conditions
While in a slightly poorer solvent than the theta solvent, the Boc-PEG-NHS polymer forms
aggregates that are visible to the naked eye through the formation of cloudiness in the
solution (thus the term “cloud point”). A Malvern Mastersizer 2000 (Malvern Instruments,
Malvern, UK) was used to measure the aggregate size distribution based on the light
diffraction technique (i.e., aggregates yield different diffraction patterns relatively to their
size). The particle size was determined as a function of time using a measured refractive
index for the solvent of 1.35787 (using a refractometer from Schmidt+Haensch, model DUR-
W2, GER) and a refractive index of 1.47 for the PEG aggregates [UNSWORTH et al., 2005b].
The approximate shear rate during the measures was of 34 s-1 corresponding to a stirring
rate of 150 rpm [PANG et al., 2002]. The instrument was thoroughly cleaned before each
sample. The solvent was first introduced into the circulation loop of the apparatus. A
concentrated homogenized PEG solution was fabricated by hand agitation and rapidly added
at time 0 min into the circulation loop of the apparatus to achieve the desired final PEG
concentration. This procedure contrasts with other procedures reported to monitor PEG
agglomeration in theta solvent where the PEG is completely dissolved in a good solvent such
as water before incorporation in the apparatus filled with the theta solvent [PANG et al.,
2002]. The procedure was chosen to mimic the actual use of the PEG molecules to form
layers as speed is necessary to avoid hydrolysis of the active ester end-group before
exposure to the amine substrate.
65
3.2.7 Chemical bonding of carboxyfluorescein to the amine-bearing PEG surfaces
A BioChip Arrayer (PerkinElmer, Wellesley (MA)) was used to dispense picoliters of solution
to precise locations on PEG surfaces. Carboxyfluorescein (CF, Molecular Probes, Eugene
(OR), cat. C-194) was made to react with the de-protected amine groups on the PEG layers
through the use of N-ethyl-N'-(3-dimethylaminopropyl)carbodiimide (EDC) (Sigma, Ontario
(CAN), cat. E1769) and N-hydroxysuccinimide (NHS) (Sigma, Ontario (CAN), cat. H7377) to
form a stable amide bond between the PEG layer and the fluorescent molecules. Solutions
with ratios of 0.5:0.5:1 between EDC:NHS:CF using different CF concentrations were placed
in multi-well plates. The Biochip Arrayer sampled the solutions to deposit droplets of ca. 300
pl at different locations on the substrates, in this case to form the layer “Y” with dots varyingly
spaced. One or both of the activated carboxylic groups on the CF molecule could then react
with the amine groups available on the PEG-coated substrates and form stable amide bonds.
Samples were then rinsed thoroughly in saline buffer and in de-ionized water while avoiding
exposure to light. Fluorescence was preserved by using FluoroGuard (Bio-Rad Laboratories,
Hercules (CA)) and fixing the FEP samples beneath a glass cover slip with transparent nail
polish. Fluorescence on the samples was observed using a Leica binocular microscope with
appropriate filters. Photos were taken at an exposure of 1 second and green intensity was
measured using SigmaScan Pro software (Systat Software, Richmond (CA)). Calibration
curves were constructed to insure the use of proper concentrations of CF to deposit on the
surfaces to be in a linear regime and avoid quenching. CF solutions of concentrations ranging
from 0.017 to 1.7 mM were thus made to react with three different samples. For each sample,
it was observed that the use of a 0.17 mM CF solution was in a linear and non-quenching
regime (data not shown) and this concentration was then deposited on all samples to be
tested. At least twenty droplets were deposited on each sample and at least two samples
were studied for each immobilization conditions.
3.3 Results and Discussion
3.3.1 Chemical properties of the PEG layers
Covalent immobilization of protected Boc-PEG-NHS onto radio-frequency generated plasma
reactive amine layer was performed at PEG solution concentrations varying from 0.1 mg/ml
to 5 mg/ml in either water or an aqueous Na2SO4 theta solvent (yielding the so-called cloud
point or CP condition). Successful covalent immobilization of the polymer layers can be
monitored by XPS measurements. Table 3.1 presents the atomic composition of different
PEG layers obtained from XPS survey spectra.
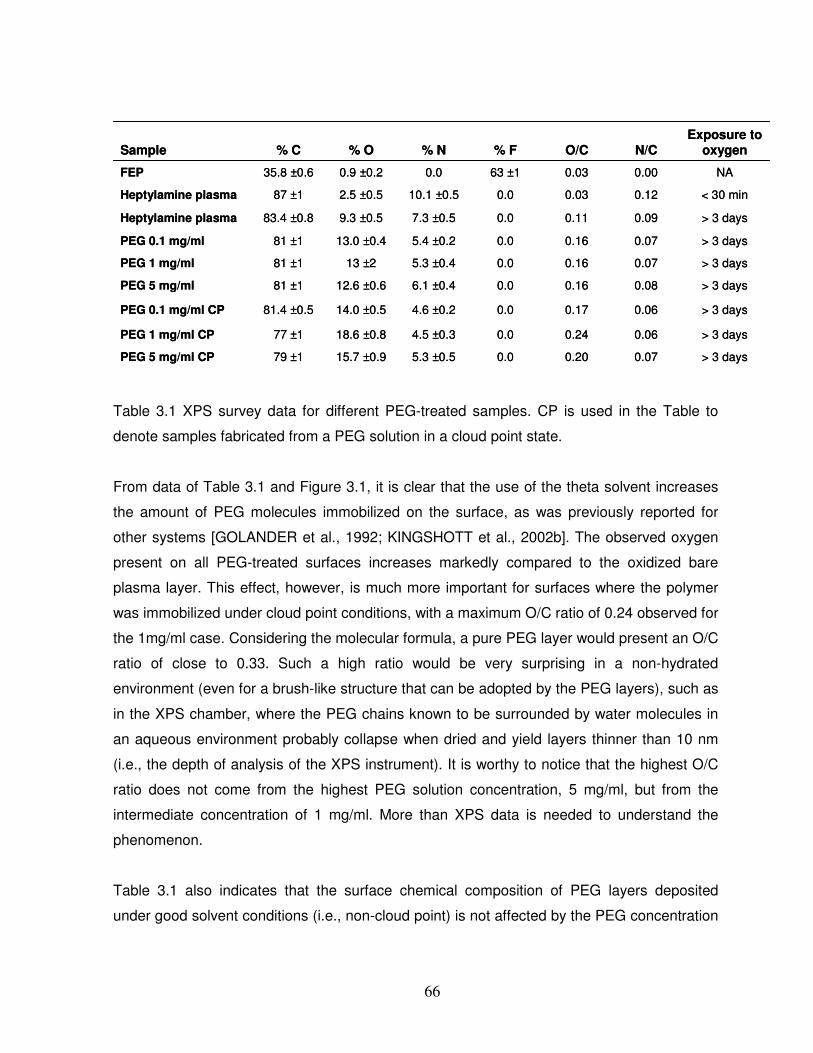
66
Table 3.1 XPS survey data for different PEG-treated samples. CP is used in the Table to
denote samples fabricated from a PEG solution in a cloud point state.
From data of Table 3.1 and Figure 3.1, it is clear that the use of the theta solvent increases
the amount of PEG molecules immobilized on the surface, as was previously reported for
other systems [GOLANDER et al., 1992; KINGSHOTT et al., 2002b]. The observed oxygen
present on all PEG-treated surfaces increases markedly compared to the oxidized bare
plasma layer. This effect, however, is much more important for surfaces where the polymer
was immobilized under cloud point conditions, with a maximum O/C ratio of 0.24 observed for
the 1mg/ml case. Considering the molecular formula, a pure PEG layer would present an O/C
ratio of close to 0.33. Such a high ratio would be very surprising in a non-hydrated
environment (even for a brush-like structure that can be adopted by the PEG layers), such as
in the XPS chamber, where the PEG chains known to be surrounded by water molecules in
an aqueous environment probably collapse when dried and yield layers thinner than 10 nm
(i.e., the depth of analysis of the XPS instrument). It is worthy to notice that the highest O/C
ratio does not come from the highest PEG solution concentration, 5 mg/ml, but from the
intermediate concentration of 1 mg/ml. More than XPS data is needed to understand the
phenomenon.
Table 3.1 also indicates that the surface chemical composition of PEG layers deposited
under good solvent conditions (i.e., non-cloud point) is not affected by the PEG concentration
NA0.000.0363 ±10.00.9 ±0.235.8 ±0.6 FEP
> 3 days0.070.200.05.3 ±0.515.7 ±0.979 ±1PEG 5 mg/ml CP
> 3 days0.060.240.04.5 ±0.318.6 ±0.877 ±1PEG 1 mg/ml CP
> 3 days0.060.170.04.6 ±0.214.0 ±0.581.4 ±0.5PEG 0.1 mg/ml CP
> 3 days0.080.160.06.1 ±0.412.6 ±0.681 ±1PEG 5 mg/ml
> 3 days0.070.160.05.3 ±0.413 ±281 ±1PEG 1 mg/ml
> 3 days0.070.160.05.4 ±0.213.0 ±0.481 ±1PEG 0.1 mg/ml
> 3 days0.090.110.07.3 ±0.59.3 ±0.583.4 ±0.8Heptylamine plasma
< 30 min0.120.030.010.1 ±0.52.5 ±0.587 ±1 Heptylamine plasma
Exposure to oxygenN/CO/C% F% N% O% CSample
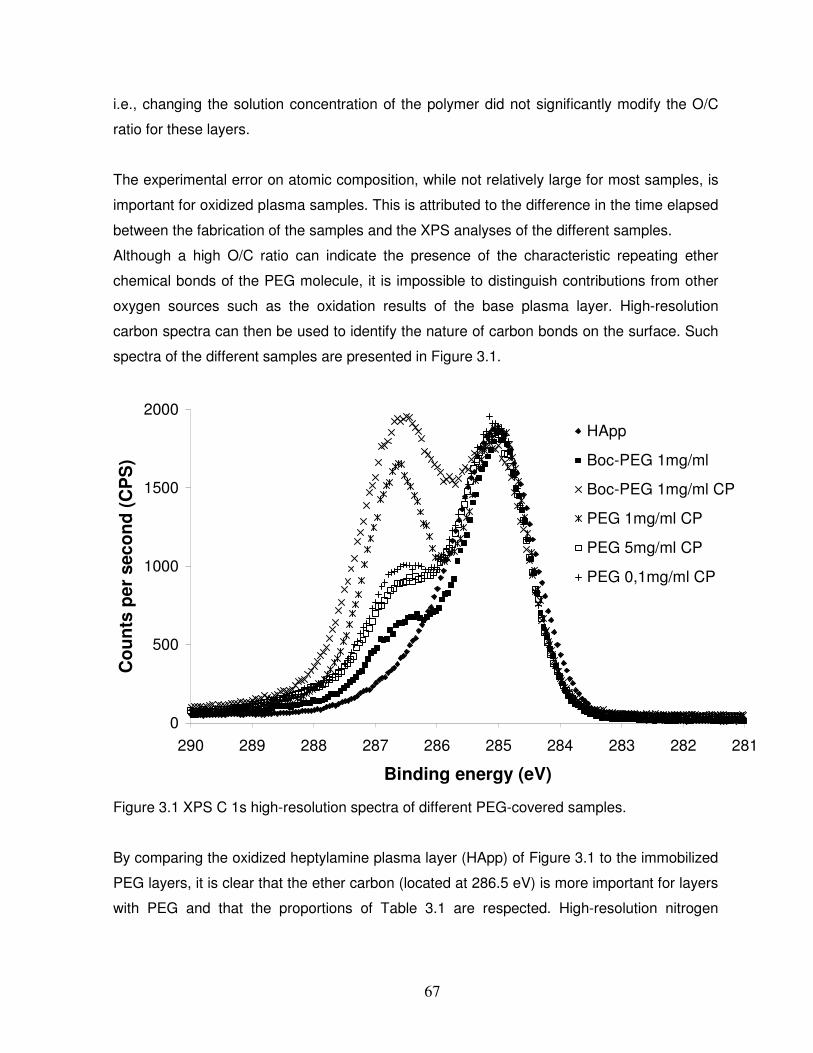
67
i.e., changing the solution concentration of the polymer did not significantly modify the O/C
ratio for these layers.
The experimental error on atomic composition, while not relatively large for most samples, is
important for oxidized plasma samples. This is attributed to the difference in the time elapsed
between the fabrication of the samples and the XPS analyses of the different samples.
Although a high O/C ratio can indicate the presence of the characteristic repeating ether
chemical bonds of the PEG molecule, it is impossible to distinguish contributions from other
oxygen sources such as the oxidation results of the base plasma layer. High-resolution
carbon spectra can then be used to identify the nature of carbon bonds on the surface. Such
spectra of the different samples are presented in Figure 3.1.
0
500
1000
1500
2000
281282283284285286287288289290
Binding energy (eV)
Cou
nts
per
seco
nd (C
PS
)
HApp
Boc-PEG 1mg/ml
Boc-PEG 1mg/ml CP
PEG 1mg/ml CP
PEG 5mg/ml CP
PEG 0,1mg/ml CP
Figure 3.1 XPS C 1s high-resolution spectra of different PEG-covered samples.
By comparing the oxidized heptylamine plasma layer (HApp) of Figure 3.1 to the immobilized
PEG layers, it is clear that the ether carbon (located at 286.5 eV) is more important for layers
with PEG and that the proportions of Table 3.1 are respected. High-resolution nitrogen
68
spectra were also recorded to insure that C-N bonds (also located at 286.5 eV) are not
responsible for the different intensities (data not shown).
XPS data was also used to confirm the stability of the PEG layers both after autoclaving and
after acidic Boc deprotection using trifluoroacetic acid (data not shown). The absence of
contaminants such as salts and silicone was also verified. As observed in Table 3.1, no
samples present Fluor atoms except for the bare FEP tape. This indicates that the plasma
layer is thicker than the depth of analysis of the instrument estimated at ca. 10 nm and no
“holes” were detected (by AFM imaging) in the substrates.
The results presented in Table 3.1 and Figure 3.1, although indicative of the quantity of PEG
molecules covalently immobilized on heptylamine plasma polymer-coated (HApp-coated)
FEP surfaces, do not give information on the architecture of the hydrated layers and can be
misleading when attempting to correlate results with future biological responses. Thus,
measurements in aqueous environments are mandatory to assess the real impact of
immobilization methods on layer architecture.
3.3.2 PEG layer resistance to protein adsorption
The main reason to produce substrates covered by thin PEG layers is to lower or eliminate
non-specific cell-material interactions. A good estimation of this property is to monitor
dynamic protein adsorption on the polymer layers, as this adsorption will dictate the
interaction level of cells with the material. The quartz crystal microbalance apparatus (QCM)
was used to measure the adsorption of the large spectra of proteins found in fetal bovine
serum (FBS) on the different PEG samples. This can be accomplished with the QCM through
the analysis of the frequency and half-band-half-width (HBHW) signals, as the QCM
apparatus directly measures minute changes in the distribution of oscillating frequencies of a
gold-coated quartz crystal occurring as the load present on the crystal changes. Among the
advantages of the technique is the possibility to work in different aqueous media and the
extreme sensitivity of the technique. The results for protein adsorption are shown in Table
3.2.
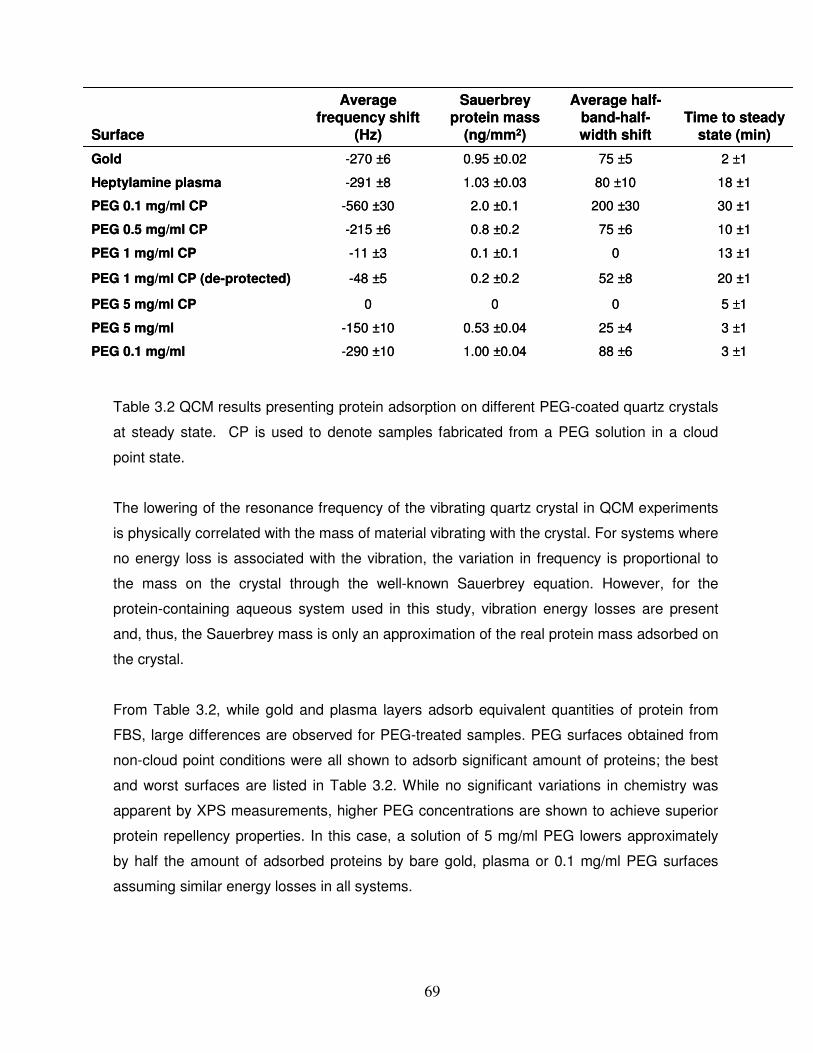
69
Table 3.2 QCM results presenting protein adsorption on different PEG-coated quartz crystals
at steady state. CP is used to denote samples fabricated from a PEG solution in a cloud
point state.
The lowering of the resonance frequency of the vibrating quartz crystal in QCM experiments
is physically correlated with the mass of material vibrating with the crystal. For systems where
no energy loss is associated with the vibration, the variation in frequency is proportional to
the mass on the crystal through the well-known Sauerbrey equation. However, for the
protein-containing aqueous system used in this study, vibration energy losses are present
and, thus, the Sauerbrey mass is only an approximation of the real protein mass adsorbed on
the crystal.
From Table 3.2, while gold and plasma layers adsorb equivalent quantities of protein from
FBS, large differences are observed for PEG-treated samples. PEG surfaces obtained from
non-cloud point conditions were all shown to adsorb significant amount of proteins; the best
and worst surfaces are listed in Table 3.2. While no significant variations in chemistry was
apparent by XPS measurements, higher PEG concentrations are shown to achieve superior
protein repellency properties. In this case, a solution of 5 mg/ml PEG lowers approximately
by half the amount of adsorbed proteins by bare gold, plasma or 0.1 mg/ml PEG surfaces
assuming similar energy losses in all systems.
3 ±125 ±40.53 ±0.04-150 ±10PEG 5 mg/ml
2 ±175 ±5 0.95 ±0.02-270 ±6 Gold
3 ±188 ±61.00 ±0.04-290 ±10PEG 0.1 mg/ml
5 ±1000PEG 5 mg/ml CP
20 ±152 ±80.2 ±0.2-48 ±5PEG 1 mg/ml CP (de-protected)
13 ±100.1 ±0.1-11 ±3PEG 1 mg/ml CP
10 ±175 ±60.8 ±0.2-215 ±6PEG 0.5 mg/ml CP
30 ±1200 ±302.0 ±0.1-560 ±30PEG 0.1 mg/ml CP
18 ±180 ±101.03 ±0.03-291 ±8 Heptylamine plasma
Time to steadystate (min)
Average half-band-half-width shift
Sauerbreyprotein mass
(ng/mm2)
Averagefrequency shift
(Hz)Surface
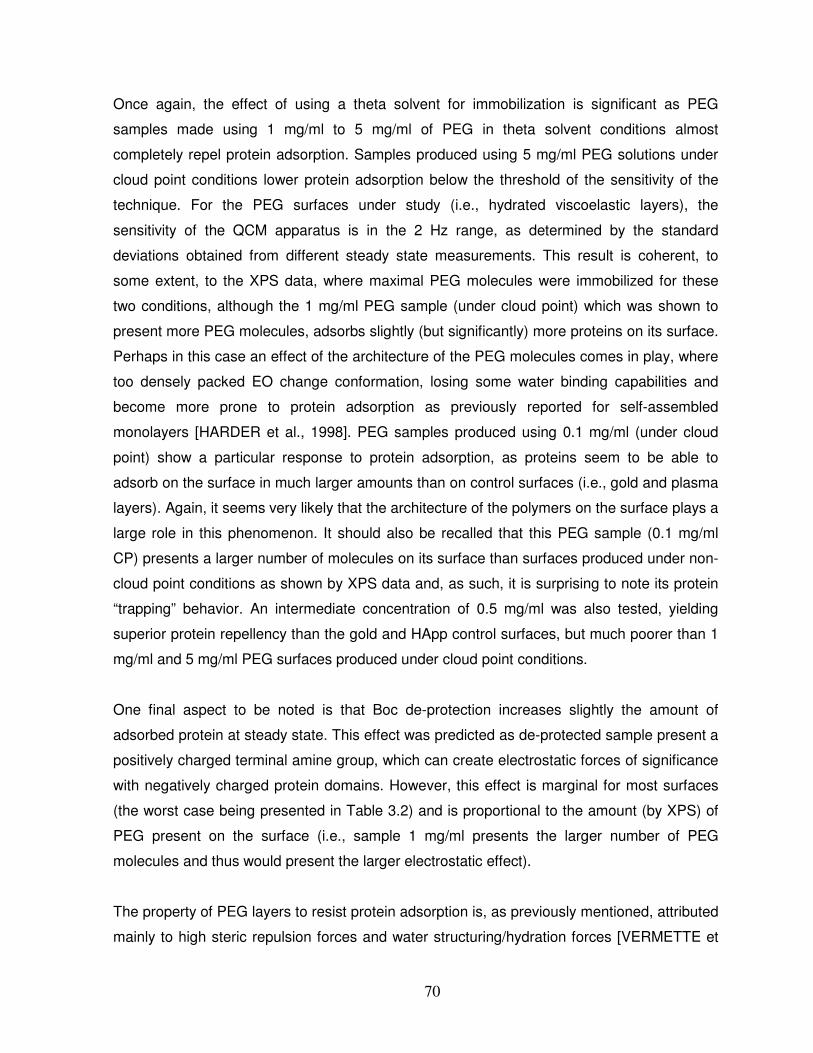
70
Once again, the effect of using a theta solvent for immobilization is significant as PEG
samples made using 1 mg/ml to 5 mg/ml of PEG in theta solvent conditions almost
completely repel protein adsorption. Samples produced using 5 mg/ml PEG solutions under
cloud point conditions lower protein adsorption below the threshold of the sensitivity of the
technique. For the PEG surfaces under study (i.e., hydrated viscoelastic layers), the
sensitivity of the QCM apparatus is in the 2 Hz range, as determined by the standard
deviations obtained from different steady state measurements. This result is coherent, to
some extent, to the XPS data, where maximal PEG molecules were immobilized for these
two conditions, although the 1 mg/ml PEG sample (under cloud point) which was shown to
present more PEG molecules, adsorbs slightly (but significantly) more proteins on its surface.
Perhaps in this case an effect of the architecture of the PEG molecules comes in play, where
too densely packed EO change conformation, losing some water binding capabilities and
become more prone to protein adsorption as previously reported for self-assembled
monolayers [HARDER et al., 1998]. PEG samples produced using 0.1 mg/ml (under cloud
point) show a particular response to protein adsorption, as proteins seem to be able to
adsorb on the surface in much larger amounts than on control surfaces (i.e., gold and plasma
layers). Again, it seems very likely that the architecture of the polymers on the surface plays a
large role in this phenomenon. It should also be recalled that this PEG sample (0.1 mg/ml
CP) presents a larger number of molecules on its surface than surfaces produced under non-
cloud point conditions as shown by XPS data and, as such, it is surprising to note its protein
“trapping” behavior. An intermediate concentration of 0.5 mg/ml was also tested, yielding
superior protein repellency than the gold and HApp control surfaces, but much poorer than 1
mg/ml and 5 mg/ml PEG surfaces produced under cloud point conditions.
One final aspect to be noted is that Boc de-protection increases slightly the amount of
adsorbed protein at steady state. This effect was predicted as de-protected sample present a
positively charged terminal amine group, which can create electrostatic forces of significance
with negatively charged protein domains. However, this effect is marginal for most surfaces
(the worst case being presented in Table 3.2) and is proportional to the amount (by XPS) of
PEG present on the surface (i.e., sample 1 mg/ml presents the larger number of PEG
molecules and thus would present the larger electrostatic effect).
The property of PEG layers to resist protein adsorption is, as previously mentioned, attributed
mainly to high steric repulsion forces and water structuring/hydration forces [VERMETTE et

71
al., 2003b]. High steric forces are traditionally associated with brush-like structures and dense
PEG coatings. However, from the QCM data of Table 3.2 and XPS results of Table 1, dense
PEG layers do not necessarily translate into higher anti-biofouling properties, noticeably for
PEG samples produced using 1 mg/ml and 0.1 mg/ml (under cloud point conditions). Then,
water structuring/hydration forces are probably responsible for part of the observed behavior
of the layers to protein adsorption.
To get a better insight on the water structuring properties of the different samples, QCM
hydration measurements were made where water was rapidly injected on dried PEG layers
and frequency and half-band-half-width signals were recorded. These results are presented
in Figure 3.2.
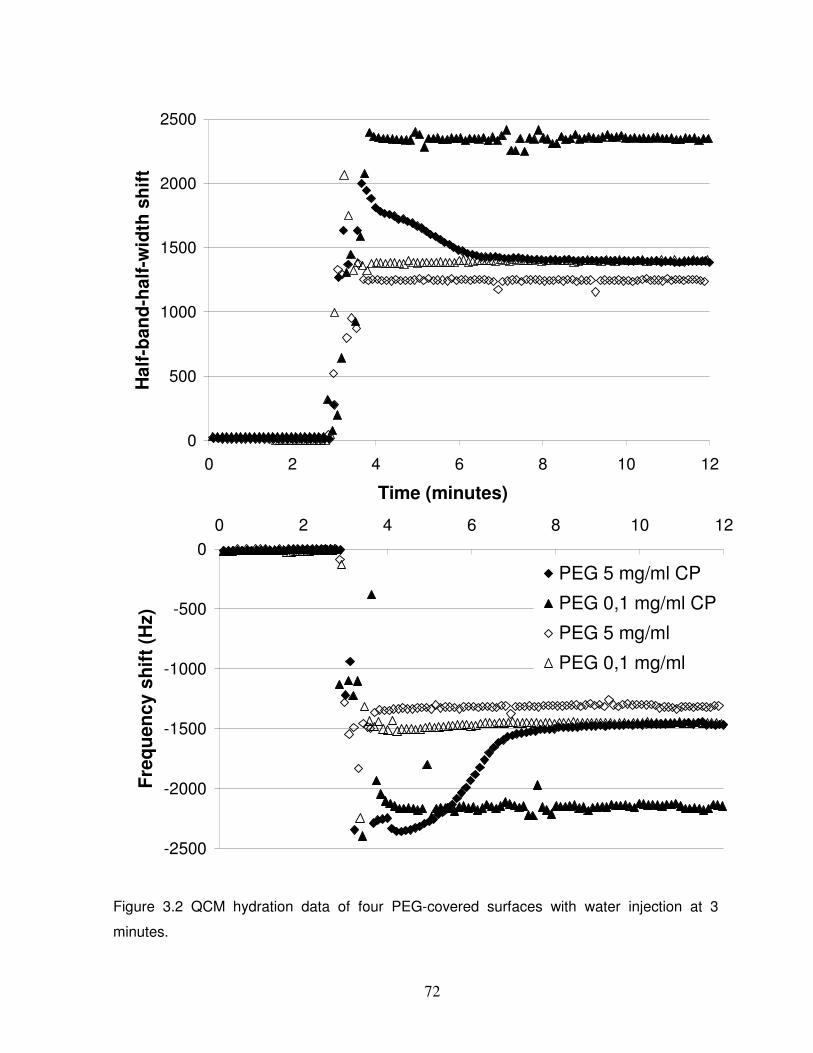
72
0
500
1000
1500
2000
2500
0 2 4 6 8 10 12
Time (minutes)
Hal
f-ba
nd-h
alf-
wid
th s
hift
-2500
-2000
-1500
-1000
-500
00 2 4 6 8 10 12
Freq
uenc
y sh
ift (H
z)
PEG 5 mg/ml CP
PEG 0,1 mg/ml CP
PEG 5 mg/ml
PEG 0,1 mg/ml
Figure 3.2 QCM hydration data of four PEG-covered surfaces with water injection at 3
minutes.
73
Figure 3.2 presents the hydration data of four representative PEG surfaces. The samples that
were not constructed using cloud point conditions present similar dynamic behaviors, rapidly
(i.e., less than one minute) reaching a steady-state and show comparable frequency and half-
band-half-width shifts. This indicates similar water uptake and water structuring properties.
However, surfaces constructed with the use of a theta solvent present important differences
between samples. First, surfaces covered with 0.1 mg/ml PEG (under cloud point) were
shown to entrap more water molecules than all other samples illustrated by a 33% decreased
frequency shift and a 70% increased half-band-half-width (compared to the other three PEG
surfaces tested). Moreover, this water is rapidly arranged around the PEG molecules as the
steady state of the system is also reached in less than one minute. Second, the sample
constructed with 5 mg/ml PEG (under cloud point) reach similar frequency and half-band-half-
width shifts than non-cloud point samples, but shows a different dynamic behavior.
In control theory, physical systems dynamic responses to stimuli can be expressed either as
first, second or higher order differential equations, depending on the physical phenomena.
From this observation, variables can be used to completely define dynamic responses; for
second order systems, three variables are sufficient. They are the steady state gain (i.e., Kp
in the standard nomenclature of second order systems), which basically gives the steady
state variation between unperturbed and perturbed states, the natural period of oscillation
(i.e., �) and the damping factor (i.e., �) which together express the dynamic “shape” of the
response. In Figure 3.2, PEG surfaces made with 5 mg/ml (under cloud point) present a
second-order dynamic behavior relatively to the frequency shift as illustrated by the “S” shape
of the system frequency response to hydration (i.e., there is an initial lag in the frequency
response). A similar dynamic behavior is observed for samples made with 1 mg/ml (under
cloud point) (data not shown). While the steady state gains (i.e., the Kp) of the 1 mg/ml and 5
mg/ml PEG surfaces (under cloud point) are comparable at values of 750 approximately, the
natural period of oscillation (i.e., �) is different for both systems (if both systems are
considered critically damped, � = 1, which is reasonable considering the shape of the
frequency response) at approximately 1 minute for the 5 mg/ml system and at approximately
4 minutes for the 1 mg/ml system. Interestingly, these time parameters correspond to the
times to steady state for protein adsorption of Table 3.2, indicating a very probable relation
between water structuring effects and protein adsorption.

74
Thus, it can be worthwhile to inspect the dynamic response to protein adsorption of the
different samples presented in Table 3.2. Figure 3.3 presents the dynamic recordings of the
protein adsorption measurements.
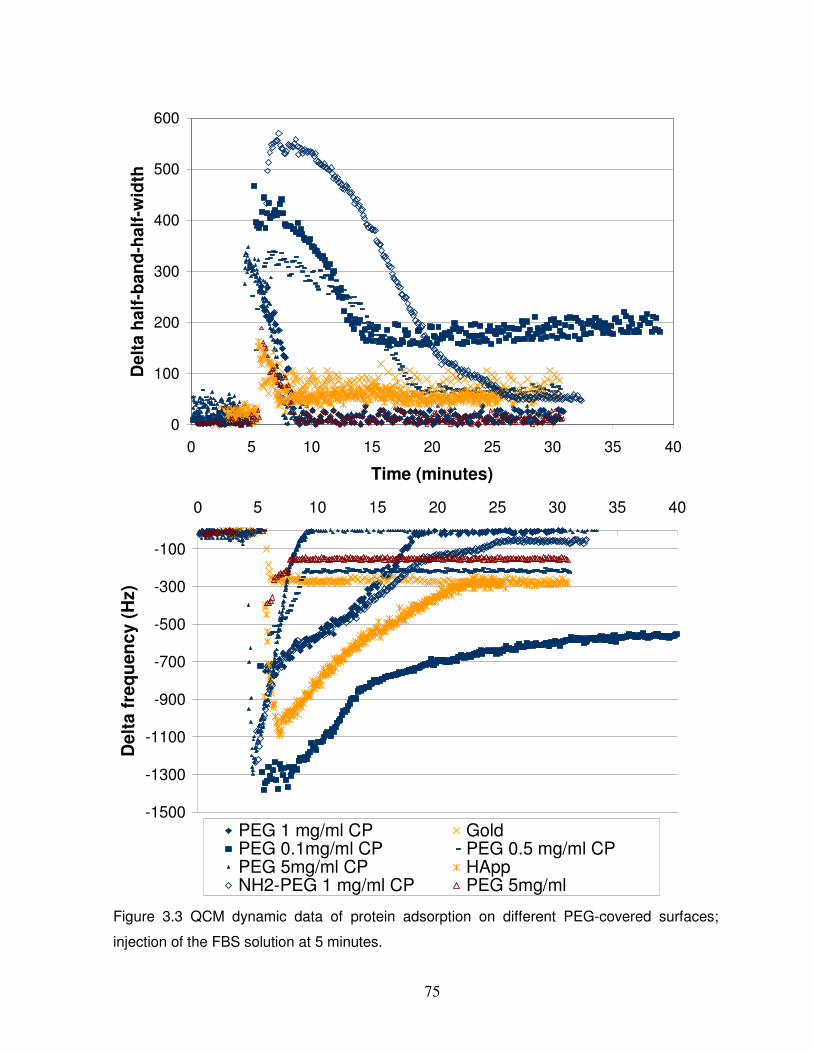
75
0
100
200
300
400
500
600
0 5 10 15 20 25 30 35 40
Time (minutes)
Del
ta h
alf-
band
-hal
f-w
idth
-1500
-1300
-1100
-900
-700
-500
-300
-100
0 5 10 15 20 25 30 35 40
Del
ta fr
eque
ncy
(Hz)
PEG 1 mg/ml CP GoldPEG 0.1mg/ml CP PEG 0.5 mg/ml CPPEG 5mg/ml CP HAppNH2-PEG 1 mg/ml CP PEG 5mg/ml
Figure 3.3 QCM dynamic data of protein adsorption on different PEG-covered surfaces;
injection of the FBS solution at 5 minutes.
76
The dynamic responses presented in Figure 3.3 are in good agreement with the hydration
data of Figure 3.2. The response of PEG surfaces produced under non-cloud point conditions
(represented in Figure 3.3 by the 5 mg/ml sample) is very rapid as the steady state is rapidly
reached. The bare gold sample presents a similar dynamic behavior. However, all dynamic
responses of the cloud point-made PEG layers present a second order-like dynamic
response. Moreover, the steady state gains relatively to frequency for all these surfaces is
comparable at a value of approximately 1100, and the time constants (the natural periods of
oscillation) follow a similar pattern than for the hydration results of Figure 3.2 as the 1 mg/ml
PEG surfaces (produced under cloud point) present a value of approximately 4 minutes while
the 5 mg/ml PEG surfaces (produced under cloud point) present a value of 1 minute. The 0.1
mg/ml PEG surfaces (produced under cloud point) present a 10 minutes time constant, but
their gain is lower due to the large amount of protein molecules adsorbed on the layer. Once
again, this is coherent with the large quantity of protein molecules that was found to be
vibrating with the surface in Figure 3.2. It can probably be accepted that while PEG layers
made with non-cloud point solvents repel, to some extent, protein adsorption mainly by steric
forces, PEG layers made in theta solvent achieve their anti-biofouling potential through a
combination of steric forces and hydration/water structuring forces. Architecture of the PEG
layers thus plays a large role in the resistance to protein adsorption, and this is exemplified
by the 0.1 mg/ml PEG surfaces (produced under cloud point) which, although presenting
more PEG molecules than all non-cloud point samples, adsorbs much more protein
molecules.
Two PEG surfaces in Figure 3.3 present charges and create electrostatic interactions with the
charged protein molecules. The heptylamine plasma layer is probably positively charged to
some extent in the buffer media and this can explain the second-order dynamic behavior to
protein adsorption as negatively charged proteins can rapidly adsorb on the surface followed
by the adsorption of other proteins with higher affinity to the surface (through the well-known
Vroman effect) until a steady state is reached. The de-protected 1 mg/ml cloud point sample
presents a similar behavior as positive charges on the amine PEG end-group may also be
present. In this case, the electrostatic effect is probably responsible for the increased lag of
the dynamic response (i.e., time constant of approximately 6 minutes compared to 4 minutes
for protected PEG) and for the large half-band-half-width variations compared to the
protected sample.
77
The very large difference between the properties of PEG layers fabricated in water (i.e., good
solvent) and PEG layers fabricated in a theta solvent were foreseen based, as previously
mentioned, on earlier reports. Indeed, part of the large differences observed might lie in the
mechanical state of the PEG chains in the two different solvents. It has been known for a long
time that PEG in aqueous solution do not behave as free rotating polymers as expected from
the added flexibility of their ether linkages in water, but rather are “stiffened” by hydration so
that their extension approaches that found in hydrocarbon polymers with hindered rotation
[BAILEY et al., 1959]. The use of a theta solvent completely modifies this forced mechanical
state, allowing PEG molecules to present higher rotation freedom. Moreover, PEG molecules
in a theta solvent exhibit a higher thermodynamic affinity towards other PEG molecules than
towards water, which is the opposite of the phenomenon observed in water, enabling PEG
molecules to crowd on the reactive surfaces and yield dense layers. This behavior visibly
allows an increase in PEG surface bonding through amine bounds and, although the
surfaces are rinsed thoroughly after the reaction in good solvents such as water, may result
in physisorbed PEG chains entrapped strongly in bound PEG chains.
3.3.3 Polymer layer mechanical properties by QCM and AFM measurements
The mechanical properties of the immobilized PEG molecules were characterized to get a
better insight on the physical properties affecting protein adsorption and, ultimately,
interactions with living cells. The QCM apparatus has been used to determine elastic
compliance modulus of thin layers in viscoelastic systems (i.e., exhibiting energy losses
linked to vibration). The elastic modulus can be isolated from QCM PEG grafting data (i.e.,
PEGylation), as the final frequency and half-band-half-width shifts measured at different
harmonics were used in mathematical models previously validated with experimental data.
The model used to calculate the elastic compliance of the different samples in this study was
derived by Du and Johannsmann [DU et al., 2004] and, for thin films in water, can be
expressed as:
´02 fJnf
fηπ
δδ ≈
−Γ
(3.1)
Where � is the half-band-half-width, f the frequency (in Hz), n is the overtone order, f0 is the
reference frequency (5 MHz in our system), � is the viscosity of water (in Pa•s), and J´f is the
elastic compliance (in Pa-1). By plotting the negative of the half-band-half-width shift divided
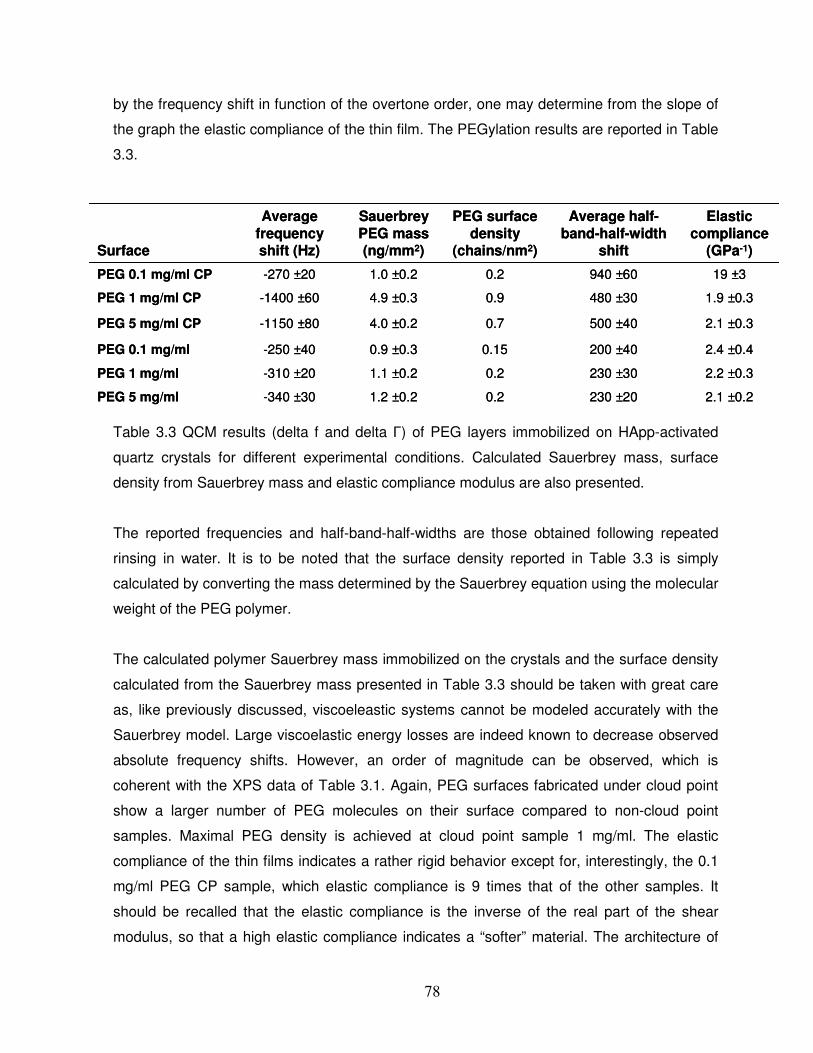
78
by the frequency shift in function of the overtone order, one may determine from the slope of
the graph the elastic compliance of the thin film. The PEGylation results are reported in Table
3.3.
Table 3.3 QCM results (delta f and delta �) of PEG layers immobilized on HApp-activated
quartz crystals for different experimental conditions. Calculated Sauerbrey mass, surface
density from Sauerbrey mass and elastic compliance modulus are also presented.
The reported frequencies and half-band-half-widths are those obtained following repeated
rinsing in water. It is to be noted that the surface density reported in Table 3.3 is simply
calculated by converting the mass determined by the Sauerbrey equation using the molecular
weight of the PEG polymer.
The calculated polymer Sauerbrey mass immobilized on the crystals and the surface density
calculated from the Sauerbrey mass presented in Table 3.3 should be taken with great care
as, like previously discussed, viscoeleastic systems cannot be modeled accurately with the
Sauerbrey model. Large viscoelastic energy losses are indeed known to decrease observed
absolute frequency shifts. However, an order of magnitude can be observed, which is
coherent with the XPS data of Table 3.1. Again, PEG surfaces fabricated under cloud point
show a larger number of PEG molecules on their surface compared to non-cloud point
samples. Maximal PEG density is achieved at cloud point sample 1 mg/ml. The elastic
compliance of the thin films indicates a rather rigid behavior except for, interestingly, the 0.1
mg/ml PEG CP sample, which elastic compliance is 9 times that of the other samples. It
should be recalled that the elastic compliance is the inverse of the real part of the shear
modulus, so that a high elastic compliance indicates a “softer” material. The architecture of
1.2 ±0.2
1.1 ±0.2
0.9 ±0.3
4.0 ±0.2
4.9 ±0.3
1.0 ±0.2
SauerbreyPEG mass (ng/mm2)
2.2 ±0.3230 ±300.2-310 ±20PEG 1 mg/ml
2.1 ±0.2230 ±200.2-340 ±30PEG 5 mg/ml
2.4 ±0.4200 ±400.15-250 ±40PEG 0.1 mg/ml
2.1 ±0.3500 ±400.7-1150 ±80PEG 5 mg/ml CP
1.9 ±0.3480 ±300.9-1400 ±60PEG 1 mg/ml CP
19 ±3940 ±600.2-270 ±20PEG 0.1 mg/ml CP
Elasticcompliance
(GPa-1)
Average half-band-half-width
shift
PEG surface density
(chains/nm2)
Averagefrequencyshift (Hz)Surface
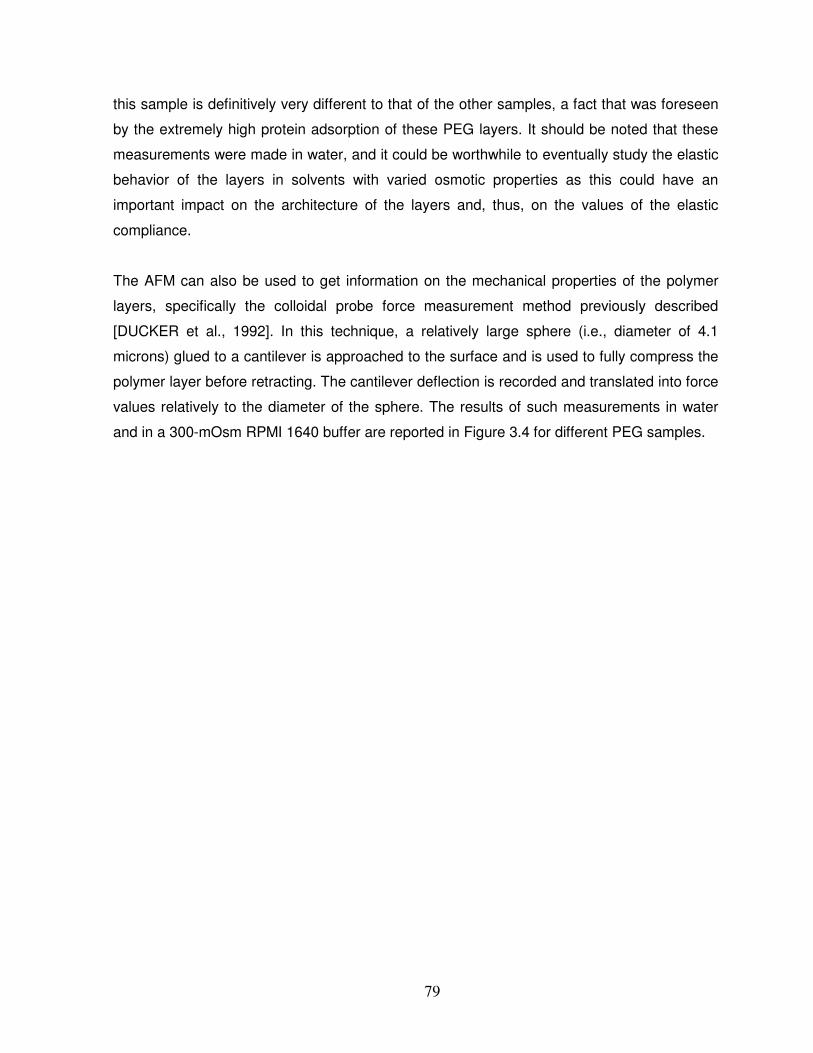
79
this sample is definitively very different to that of the other samples, a fact that was foreseen
by the extremely high protein adsorption of these PEG layers. It should be noted that these
measurements were made in water, and it could be worthwhile to eventually study the elastic
behavior of the layers in solvents with varied osmotic properties as this could have an
important impact on the architecture of the layers and, thus, on the values of the elastic
compliance.
The AFM can also be used to get information on the mechanical properties of the polymer
layers, specifically the colloidal probe force measurement method previously described
[DUCKER et al., 1992]. In this technique, a relatively large sphere (i.e., diameter of 4.1
microns) glued to a cantilever is approached to the surface and is used to fully compress the
polymer layer before retracting. The cantilever deflection is recorded and translated into force
values relatively to the diameter of the sphere. The results of such measurements in water
and in a 300-mOsm RPMI 1640 buffer are reported in Figure 3.4 for different PEG samples.
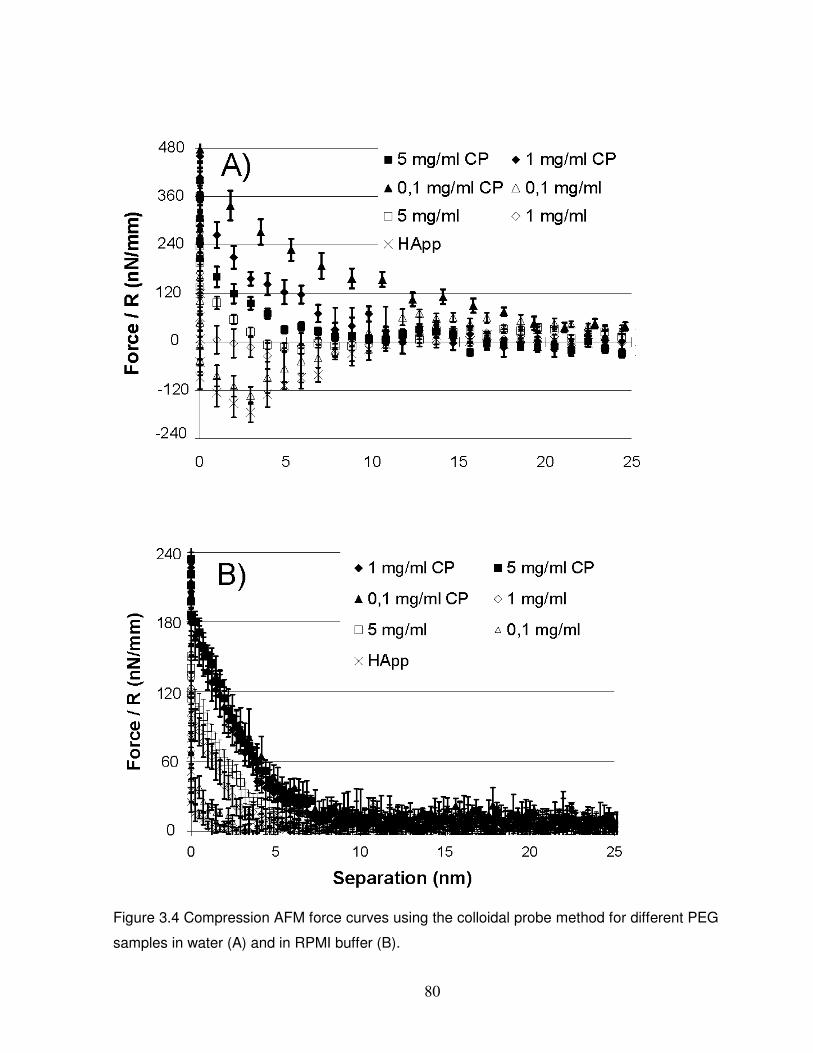
80
Figure 3.4 Compression AFM force curves using the colloidal probe method for different PEG
samples in water (A) and in RPMI buffer (B).
81
The AFM compression force curves of Figure 3.4 show that the hydrated PEG layers have a
“thickness” of 4 to 8 nm in RPMI buffer, the thickest films exhibited by the cloud point-
fabricated samples while the 0.1 mg/ml non-cloud point was the thinnest. By thickness, here,
we mean the separation distance at which the force between the colloidal probe and the PEG
surfaces became non-nil when approaching the cantilever towards the surfaces. All PEG
samples produced under cloud point have similar compression profiles while the non-cloud
point samples have decreased compression resistance and thickness from highest to lowest
concentrations. The AFM compression data in water in the same figure shows the
electrostatic effects of the negatively charged AFM silica sphere and the positively charged
plasma layer for the samples with small PEG densities i.e., for non-cloud point PEG samples
1 mg/ml and 0.1 mg/ml, as a “jump to contact” was recorded upon approach of the surface.
This probably translates into a poor coverage of the entire surface for these two conditions,
which is coherent with XPS data of Table 3.1 and protein adsorption experiments. 5 mg/ml
PEG surfaces produced under cloud point show similar behavior to compression in water and
in buffer, but the 1 mg/ml and, principally, the 0.1 mg/ml PEG surfaces produced under cloud
point both present a significant increase of their thickness, while their resistance to
compression (i.e., the slope of the compression curve) is slightly reduced. The use of a better
solvent and the high degree of freedom of their architecture probably enable the extension of
the polymer chains in the solvent, a result that was not expected and not previously reported.
Evidence builds up on the unusual architectures of the layers made under cloud point
conditions and their extreme sensitivity to PEG concentration on the final PEG layer
characteristics. Further testing would be required to assess the behavior of the cloud point
samples in intermediate solvent osmolarities.
3.3.4 Agglomeration kinetics of PEG molecules in theta solvent
The very wide range of characteristics (i.e., number of bound PEG molecules, resistance to
protein adsorption and mechanical properties) exhibited by the PEG surfaces produced under
cloud point at different PEG concentrations is not coherent with the traditional Alexander and
de Gennes models, contrarily to the PEG surfaces fabricated in water. In a theta solvent,
PEG molecules are known to form large aggregates of different size distributions depending
on a variety of factors such as concentration, shear stress and temperature [PANG et al.,
2002]. Using a light diffraction-based instrument, the Malvern Mastersizer, the size of the
polymer aggregates was measured over time to assess possible effects of PEG agglomerate
82
size in solution on final PEG layer chemistry and properties. To conduct such measurements,
PEG is usually injected from a concentrated well-mixed PEG aqueous solution to the
instrument in which is circulated the theta solvent to achieve desired PEG concentration and
to monitor the agglomeration process. However, the PEG molecules in our study display a
relatively short stability in aqueous environments owing to the hydrolysis of the active ester
reactive groups available on one end of the PEG polymers. This hydrolysis is complete in
approximately an hour at room temperature and is obviously much faster at higher
temperatures, thus the rational to use Na2SO4 in this system to achieve cloud point conditions
at room temperature. The time necessary to achieve the dissolution of the solid PEG has to
be reduced to a minimum by hand agitation. Typically, an agitation of two minutes is required
to insure dissolution of visible solid PEG particles and proceed with the surface
immobilization reaction. For the light diffraction measurements, PEG was dissolved for two
minutes by hand agitation and added directly to the theta solvent circulating in the apparatus
to mimic as closely as possible the actual procedure for PEG immobilization. The agitation in
the apparatus was also set to be as close as possible to the agitation present in typical
immobilization reactions. The results in number % are presented in Figure 3.5 and the size of
the agglomerates in volume % over time is presented in Figure 3.6.
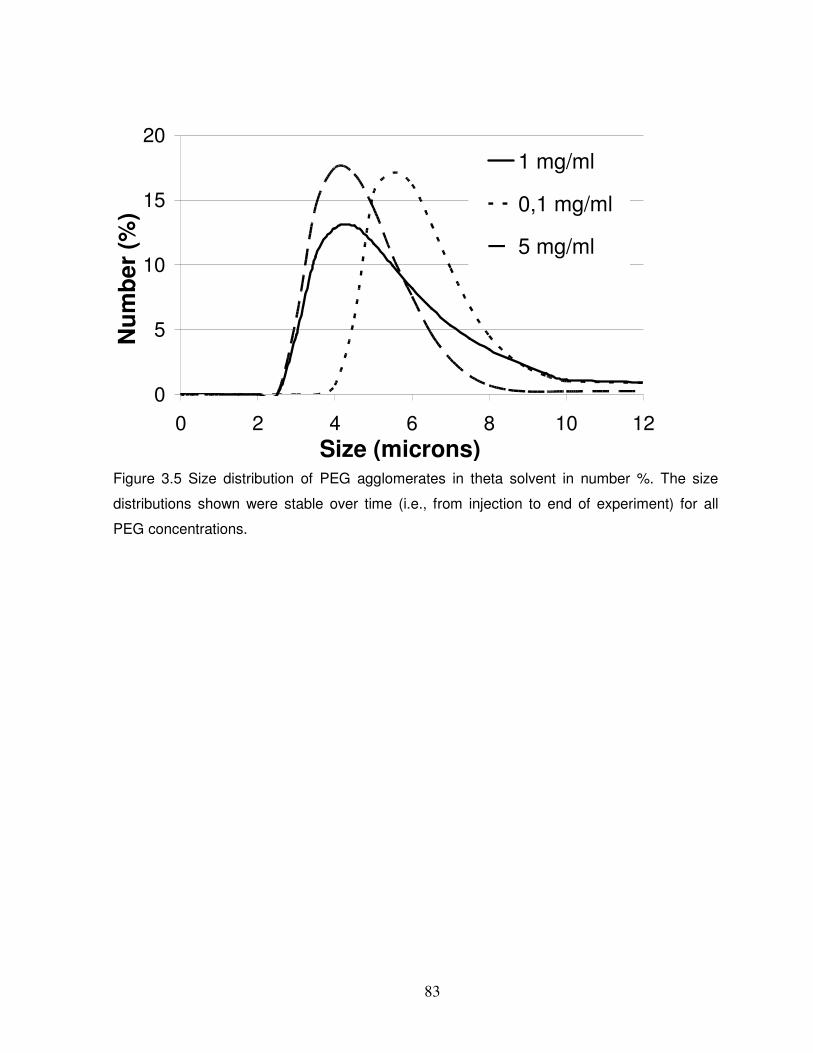
83
0
5
10
15
20
0 2 4 6 8 10 12Size (microns)
Num
ber
(%)
1 mg/ml
0,1 mg/ml
5 mg/ml
Figure 3.5 Size distribution of PEG agglomerates in theta solvent in number %. The size
distributions shown were stable over time (i.e., from injection to end of experiment) for all
PEG concentrations.
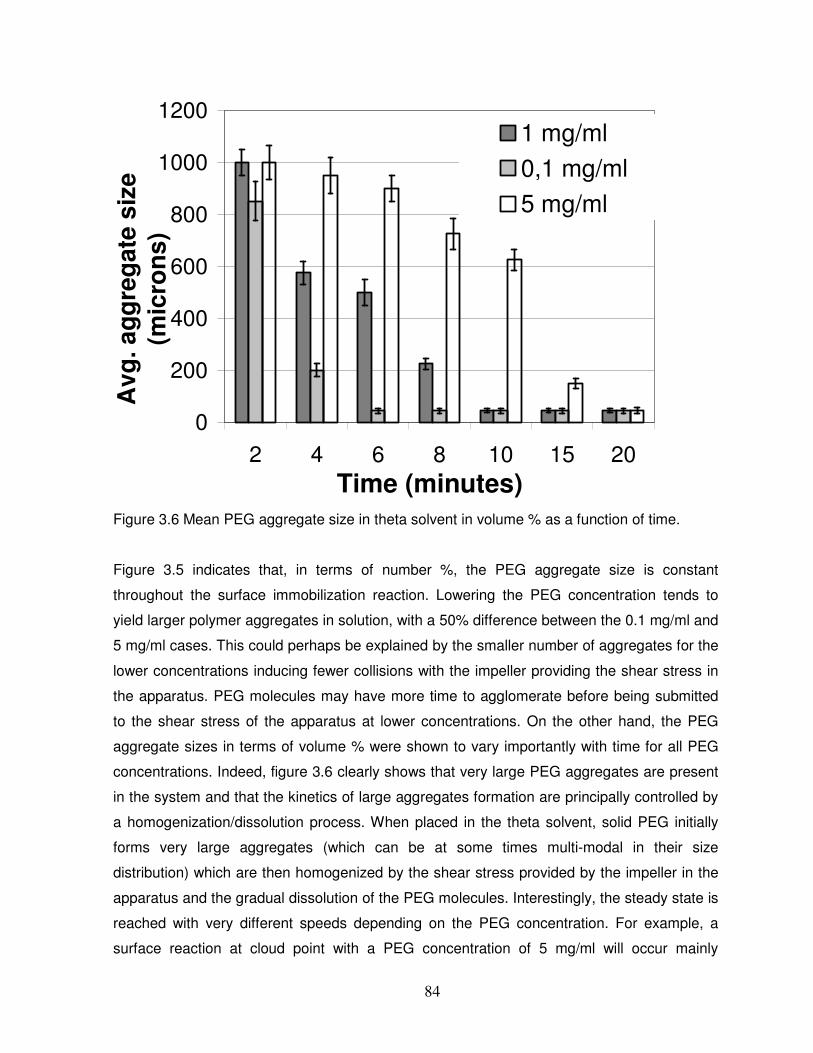
84
0
200
400
600
800
1000
1200
2 4 6 8 10 15 20Time (minutes)
Avg
. agg
rega
te s
ize
(mic
rons
)1 mg/ml0,1 mg/ml5 mg/ml
Figure 3.6 Mean PEG aggregate size in theta solvent in volume % as a function of time.
Figure 3.5 indicates that, in terms of number %, the PEG aggregate size is constant
throughout the surface immobilization reaction. Lowering the PEG concentration tends to
yield larger polymer aggregates in solution, with a 50% difference between the 0.1 mg/ml and
5 mg/ml cases. This could perhaps be explained by the smaller number of aggregates for the
lower concentrations inducing fewer collisions with the impeller providing the shear stress in
the apparatus. PEG molecules may have more time to agglomerate before being submitted
to the shear stress of the apparatus at lower concentrations. On the other hand, the PEG
aggregate sizes in terms of volume % were shown to vary importantly with time for all PEG
concentrations. Indeed, figure 3.6 clearly shows that very large PEG aggregates are present
in the system and that the kinetics of large aggregates formation are principally controlled by
a homogenization/dissolution process. When placed in the theta solvent, solid PEG initially
forms very large aggregates (which can be at some times multi-modal in their size
distribution) which are then homogenized by the shear stress provided by the impeller in the
apparatus and the gradual dissolution of the PEG molecules. Interestingly, the steady state is
reached with very different speeds depending on the PEG concentration. For example, a
surface reaction at cloud point with a PEG concentration of 5 mg/ml will occur mainly
85
between the surface and agglomerates larger than 600 microns for the first 10 minutes of the
reaction. On the other hand, the same 10 minutes of the reaction will mainly occur between
aggregates of 50 microns and the surface for a PEG concentration of 0.1 mg/ml, which is an
order of magnitude difference with the 5 mg/ml PEG solution. The kinetic behaviour of the
agglomerates in the theta solvent can perhaps begin to explain the very different
architectures observed previously.
3.3.5 Chemical bonding properties of the de-protected PEG layers
The immobilized PEG layer system studied in this article allows the covalent immobilization of
molecules after Boc de-protection of the PEG molecules exposing primary amino groups.
Moreover, the molecules can be immobilized in a spatially defined manner by using a
dispensing robot. The wide range of polymer architecture expressed by the different PEG
samples studied makes it important to monitor the chemical grafting potential of the different
samples. A fluorescent molecule, carboxyfluorescein (CF) was deposited by a dispensing
robot on the different samples and immobilized by a covalent amide bound. The fluorescence
intensity, after rinsing, is indicative of the quantity of CF molecule that successfully bound to
the PEG-end amines if the concentrations of CF used are located in the linear non-quenching
regime. This was insured by a calibration curve done on different samples (data not shown).
The results of the immobilisation of CF are shown in Figure 3.7.
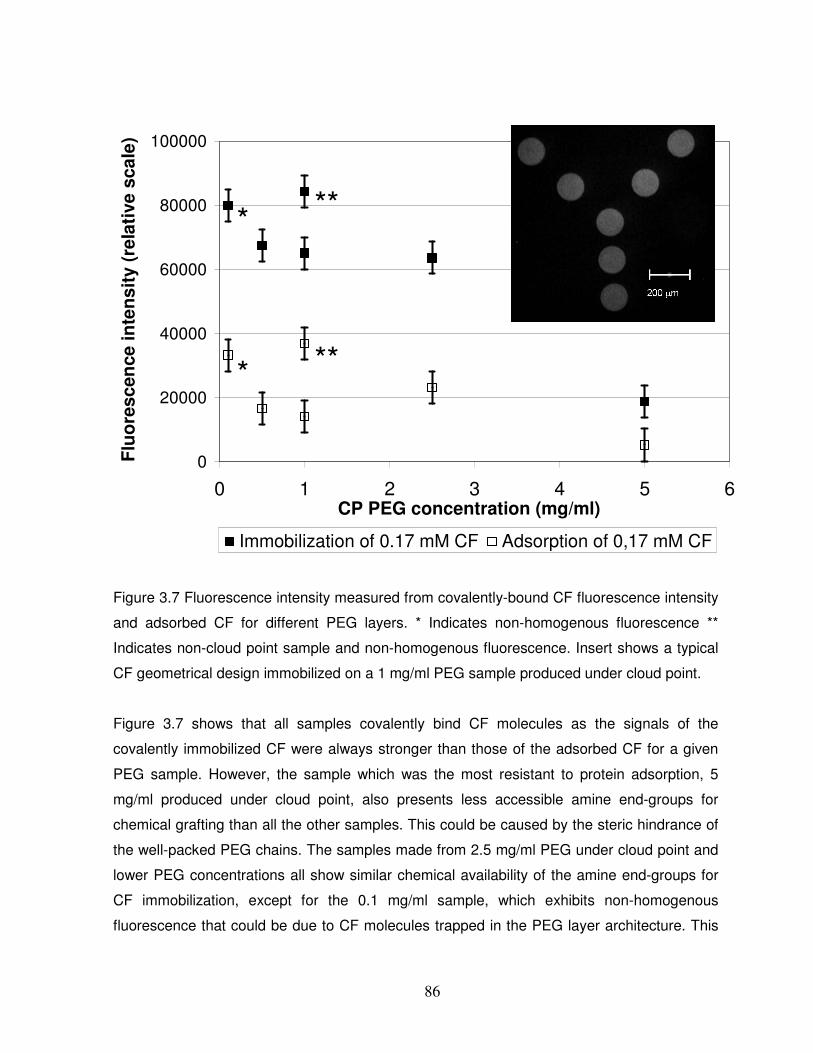
86
0
20000
40000
60000
80000
100000
0 1 2 3 4 5 6CP PEG concentration (mg/ml)
Fluo
resc
ence
inte
nsity
(rel
ativ
e sc
ale)
Immobilization of 0.17 mM CF Adsorption of 0,17 mM CF
*
*
**
**
Figure 3.7 Fluorescence intensity measured from covalently-bound CF fluorescence intensity
and adsorbed CF for different PEG layers. * Indicates non-homogenous fluorescence **
Indicates non-cloud point sample and non-homogenous fluorescence. Insert shows a typical
CF geometrical design immobilized on a 1 mg/ml PEG sample produced under cloud point.
Figure 3.7 shows that all samples covalently bind CF molecules as the signals of the
covalently immobilized CF were always stronger than those of the adsorbed CF for a given
PEG sample. However, the sample which was the most resistant to protein adsorption, 5
mg/ml produced under cloud point, also presents less accessible amine end-groups for
chemical grafting than all the other samples. This could be caused by the steric hindrance of
the well-packed PEG chains. The samples made from 2.5 mg/ml PEG under cloud point and
lower PEG concentrations all show similar chemical availability of the amine end-groups for
CF immobilization, except for the 0.1 mg/ml sample, which exhibits non-homogenous
fluorescence that could be due to CF molecules trapped in the PEG layer architecture. This
87
hypothesis seems to be confirmed by an increase in the non-specific adsorption of CF
molecules on the samples. As observed from QCM data, the 0.1 mg/ml PEG sample was
also the sample which was the most prone to protein adsorption. The behaviour of the
samples fabricated under non-cloud point conditions is for all concentrations similar to that of
the 0.1 mg/ml cloud point sample. Non-homogenous fluorescence is also observed with an
increase in CF adsorption. However, the behaviour of samples fabricated under non-cloud
point conditions could be explained by the non-homogenous coverage of the surfaces by
PEG molecules that was observed by AFM force measurements in water, or by the low
surface PEG chain density that was observed by XPS. Thus, all the layers could be used to
graft covalently and spatially molecules with varying yields, which depend on the underlying
PEG surfaces.
3.4 Conclusion
A system to immobilize PEG molecules on various solid substrates was described, and the
use of two reaction parameters i.e., 1) the use of a theta solvent and 2) different polymer
concentrations in solution, were studied to assess their impact on PEG layer properties.
Results show that PEG layers deposited using cloud point conditions present unusual
reaction PEG concentration-dependent architectures as observed, noticeably, by protein
adsorption assays and AFM force measurements. While high polymer concentrations yield
structurally stiff layers, low PEG concentrations exhibit higher structural flexibility which
enhances chemical bonding capabilities, but, on the other hand, can enhance non-specific
protein adsorption. Traditional models do not represent well the observed immobilized PEG
polymer structures on the surfaces. The size of polymer aggregates in a theta solvent during
a surface reaction may play an important role in final layer properties as PEG aggregation
kinetics showed important variations in aggregate sizes for different PEG concentrations,
which correlate with observed mechanical and physicochemical layer properties. It is not yet
known what responses these architectures will trigger when exposed, for example, to live
cells. This is the aim of a future work in our laboratory.
88
3.5 References
ALEXANDER, S (1977), Le Journal de Physique, 38, p. 983-987.
BAILEY, F, CALLARD, R. (1959) Some properties of poly(ethylene oxide) in aqueous solution, Journal of Applied Polymer Science, 1, p. 56-62.
CLEVELAND, J P, MANNE, S., BOCEK, D., HANSMA, P. K. (1993) A Nondestructive Method for Determining the Spring Constant of Cantilevers for Scanning Force Microscopy, Review of Scientific Instruments, 64, p. 403-405.
DE GENNES, P G (1976), J.Physique, 37, p. 1445-1452.
DROBEK, T, SPENCER, N. D., HEUBERGER, M. (2005) Compressing PEG brushes, Macromolecules, 38, p. 5254-5259.
DU, B Y, JOHANNSMANN, D. (2004) Operation of the quartz crystal microbalance in liquids: Derivation of the elastic compliance of a film from the ratio of bandwidth shift and frequency shift, Langmuir, 20, p. 2809-2812.
DUCKER, W A, SENDEN, T. J., PASHLEY, R. M. (1992) Measurement of Forces in Liquids Using A Force Microscope, Langmuir, 8, p. 1831-1836.
FICK, J, STEITZ, R., LEINER, V., TOKUMITSU, S., HIMMELHAUS, M., GRUNZE, M. (2004) Swelling behavior of self-assembled monolayers of alkanethiol-terminated poly(ethylene glycol): A neutron reflectometry study, Langmuir, 20, p. 3848-3853.
GOLANDER, C, HERRON, J., LIM, K., CLAESSON, P., STENIUS, P., ANDRADE, J. (1992) In Poly(ethylene glycol) Chemistry, Biotechnical and Biomedical Applications; Harris, J., Ed., Plenum Press, p 221-245.
GRIESSER, H J (1989) Small-Scale Reactor for Plasma Processing of Moving Substrate Web, Vacuum, 39, p. 485-488.
HANSSON, K M, TOSATTI, S., ISAKSSON, J., WETTERO, J., TEXTOR, M., LINDAHL, T. L., TENGVALL, P. (2005) Whole blood coagulation on protein adsorption-resistant PEG and peptide functionalised PEG-coated titanium surfaces, Biomaterials.26(8):861-72,
HARDER, P, GRUNZE, M., DAHINT, R., WHITESIDES, G. M., LAIBINIS, P. E. (1998) Molecular conformation in oligo(ethylene glycol)-terminated self-assembled monolayers on gold and silver surfaces determines their ability to resist protein adsorption, Journal of Physical Chemistry B, 102, p. 426-436.
KINGSHOTT, P, MCARTHUR, S., THISSEN, H., CASTNER, D. G., GRIESSER, H. J. (2002a) Ultrasensitive probing of the protein resistance of PEG surfaces by secondary ion mass spectrometry, Biomaterials.23(24):4775-85,
KINGSHOTT, P, THISSEN, H., GRIESSER, H. J. (2002b) Effects of cloud-point grafting, chain length, and density of PEG layers on competitive adsorption of ocular proteins, Biomaterials.23(9):2043-56,
89
LI, N, TOUROVSKAIA, A., FOLCH, A. (2003) Biology on a chip: microfabrication for studying the behavior of cultured cells. [Review] [295 refs], Critical Reviews in Biomedical Engineering.31(5-6):423-88,
PANG, P, ENGLEZOS, P. (2002) Kinetics of the aggregation of polyethylene oxide at temperatures above the polyethylene oxide-water cloud point temperature, Colloids and Surfaces A-Physicochemical and Engineering Aspects, 204, p. 23-30.
PASCHE, S, VOROS, J., GRIESSER, H. J., SPENCER, N. D., TEXTOR, M. (2005) Effects of ionic strength and surface charge on protein adsorption at PEGylated surfaces, Journal of Physical Chemistry B, 109, p. 17545-17552.
PIEHLER, J, BRECHT, A., VALIOKAS, R., LIEDBERG, B., GAUGLITZ, G. (2000) A high-density poly(ethylene glycol) polymer brush for immobilization on glass-type surfaces, Biosensors & Bioelectronics.15(9-10):473-81,
THISSEN, H, JOHNSON, G., HARTLEY, P. G., KINGSHOTT, P., GRIESSER, H. J. (2006) Two-dimensional patterning of thin coatings for the control of tissue outgrowth, Biomaterials, 27, p. 35-43.
UNSWORTH, L D, SHEARDOWN, H., BRASH, J. L. (2005a) Polyethylene oxide surfaces of variable chain density by chemisorption of PEO-thiol on gold: adsorption of proteins from plasma studied by radiolabelling and immunoblotting, Biomaterials.26(30):5927-33,
UNSWORTH, L D, TUN, Z., SHEARDOWN, H., BRASH, J. L. (2005b) Chemisorption of thiolated poly(ethylene oxide) to gold: surface chain densities measured by ellipsometry and neutron reflectometry, Journal of Colloid and Interface Science, 281, p. 112-121.
VERMETTE, P, GENGENBACH, T., DIVISEKERA, U., KAMBOURIS, P. A., GRIESSER, H. J., MEAGHER, L. (2003a) Immobilization and surface characterization of NeutrAvidin biotin-binding protein on different hydrogel interlayers, Journal of Colloid and Interface Science, 259, p. 13-26.
VERMETTE, P, GRIESSER, H. J., KAMBOURIS, P., MEAGHER, L. (2004) Characterization of surface-immobilized layers of intact liposomes, Biomacromolecules, 5, p. 1496-1502.
VERMETTE, P, MEAGHER, L. (2003b) Interactions of phospholipid- and poly(ethylene glycol)-modified surfaces with biological systems: relation to physico-chemical properties and mechanisms, Colloids and Surfaces B-Biointerfaces, 28, p. 153-198.
VLADKOVA, T, KRASTEVA, N., KOSTADINOVA, A., ALTANKOV, G. (1999) Preparation of PEG-coated surfaces and a study for their interaction with living cells, Journal of Biomaterials Science, Polymer Edition.10(6):609-20,
90
CHAPITRE 4
INSTRUMENT ET TECHNIQUE POUR LA DÉTECTION IN VITRO DE L’ACTIVATION
PLAQUETTAIRE À PARTIE D’ÉCHANTILLONS DE SANG COMPLET
Résumé
L’évaluation de l’activation plaquettaire est extrêmement difficile à accomplir en clinique
puisque les plaquettes s’activent rapidement par les manipulations in vitro. Même si certaines
techniques existent pour estimer la fonction plaquettaire, telles la cytométrie de flux et
l’agrégation plaquettaire, des limitations importantes limitent leur utilisation et leur validation.
Dans ce chapitre, des surfaces antiadhésives à base de PEG limitant l’activation ex vivo des
plaquettes ont été modifiées localement avec l’objectif de détecter rapidement l’activation des
plaquettes dans des échantillons de sang complet à partir d’interactions spécifiques menant
à l’agrégation et l’adhésion locale des plaquettes activées. Pour obtenir ce résultat, une
méthode de fabrication a été mise au point pour la production de puces d’anticorps anti-
CD62 et anti-CD61 immobilisés de façon covalente sur des substrats transparents couverts
de couches minces de polymère antiadhésif. De plus, en vue de limiter l’activation ex vivo et
d’obtenir des résultats reproductibles, une chambre d’écoulement a été conçue à l’aide de
modélisation assistée par l’ordinateur visant à minimiser les forces de cisaillement appliquées
aux plaquettes. Cet instrument diagnostique a le potentiel de permettre l’évaluation rapide de
l’activation des plaquettes dans le sang complet.
Publié sous :
MARTIN, Y., LÉPINE, M., BANNARI, A., VERMETTE, P. (2007) Instrument and technique for
the in vitro evaluation of platelet activation from whole blood samples, Review of Scientific
Instruments, 78 (1).
91
INSTRUMENT AND TECHNIQUE FOR THE IN VITRO SCREENING OF PLATELET
ACTIVATION FROM WHOLE BLOOD SAMPLES
Abstract
The measurement of platelet activation is very difficult to accomplish clinically as platelets are
readily activated by in vitro manipulations. Although techniques such as platelet aggregation
and flow cytometry exist to estimate platelet function, important limitations prevent these
techniques to be widely accepted. In this study, low-fouling surfaces used to limit ex vivo
platelet activation were locally bio-activated to rapidly detect platelet activation from whole
blood through the selective local adhesion and aggregation of artificially activated platelets.
To achieve this result, a fabrication method was developed to create arrays of anti-CD62 and
anti-CD61 proteins covalently immobilized on substrates covered by low-fouling graft layers.
Moreover, to further limit ex vivo platelet activation and to obtain reproducible results, a
custom-made flow chamber was designed and fabricated with the help of computer-assisted
mathematical modeling to create defined shear environments. This diagnostic instrument has
the potential to allow the rapid estimation of platelet activation levels in whole blood.
Published as:
MARTIN, Y., LÉPINE, M., BANNARI, A., VERMETTE, P. (2007) Instrument and technique for
the in vitro evaluation of platelet activation from whole blood samples, Review of Scientific
Instruments, 78 (1).
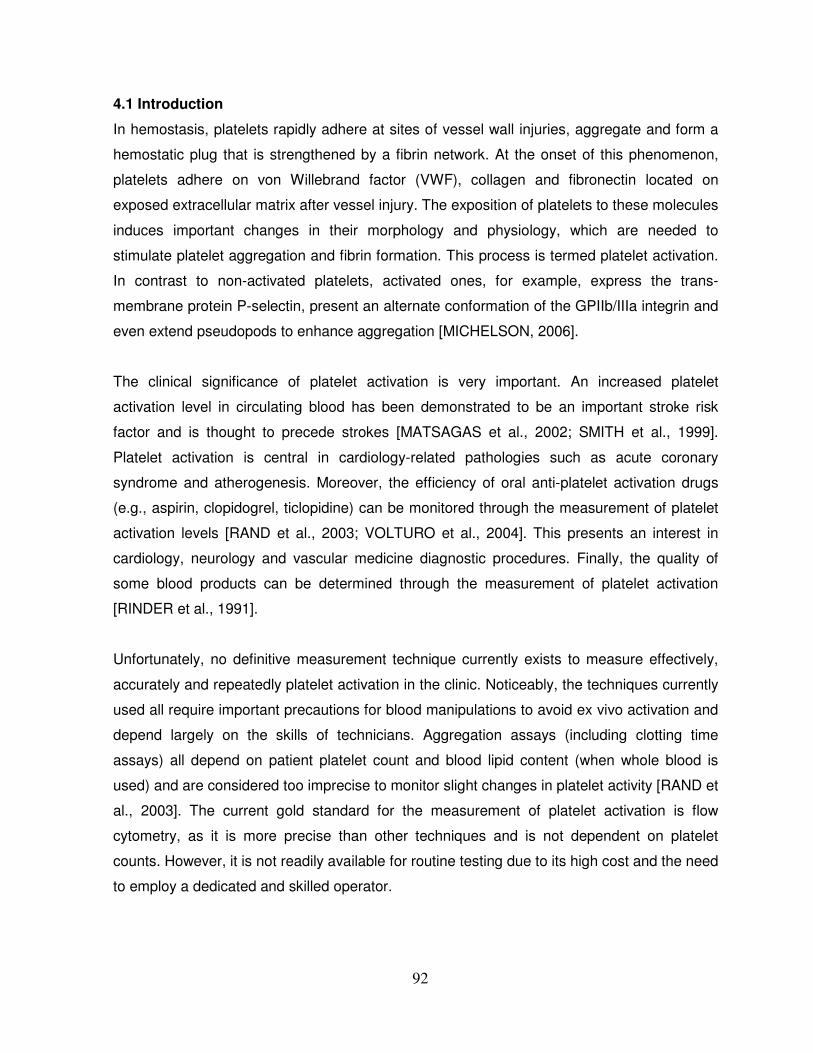
92
4.1 Introduction
In hemostasis, platelets rapidly adhere at sites of vessel wall injuries, aggregate and form a
hemostatic plug that is strengthened by a fibrin network. At the onset of this phenomenon,
platelets adhere on von Willebrand factor (VWF), collagen and fibronectin located on
exposed extracellular matrix after vessel injury. The exposition of platelets to these molecules
induces important changes in their morphology and physiology, which are needed to
stimulate platelet aggregation and fibrin formation. This process is termed platelet activation.
In contrast to non-activated platelets, activated ones, for example, express the trans-
membrane protein P-selectin, present an alternate conformation of the GPIIb/IIIa integrin and
even extend pseudopods to enhance aggregation [MICHELSON, 2006].
The clinical significance of platelet activation is very important. An increased platelet
activation level in circulating blood has been demonstrated to be an important stroke risk
factor and is thought to precede strokes [MATSAGAS et al., 2002; SMITH et al., 1999].
Platelet activation is central in cardiology-related pathologies such as acute coronary
syndrome and atherogenesis. Moreover, the efficiency of oral anti-platelet activation drugs
(e.g., aspirin, clopidogrel, ticlopidine) can be monitored through the measurement of platelet
activation levels [RAND et al., 2003; VOLTURO et al., 2004]. This presents an interest in
cardiology, neurology and vascular medicine diagnostic procedures. Finally, the quality of
some blood products can be determined through the measurement of platelet activation
[RINDER et al., 1991].
Unfortunately, no definitive measurement technique currently exists to measure effectively,
accurately and repeatedly platelet activation in the clinic. Noticeably, the techniques currently
used all require important precautions for blood manipulations to avoid ex vivo activation and
depend largely on the skills of technicians. Aggregation assays (including clotting time
assays) all depend on patient platelet count and blood lipid content (when whole blood is
used) and are considered too imprecise to monitor slight changes in platelet activity [RAND et
al., 2003]. The current gold standard for the measurement of platelet activation is flow
cytometry, as it is more precise than other techniques and is not dependent on platelet
counts. However, it is not readily available for routine testing due to its high cost and the need
to employ a dedicated and skilled operator.
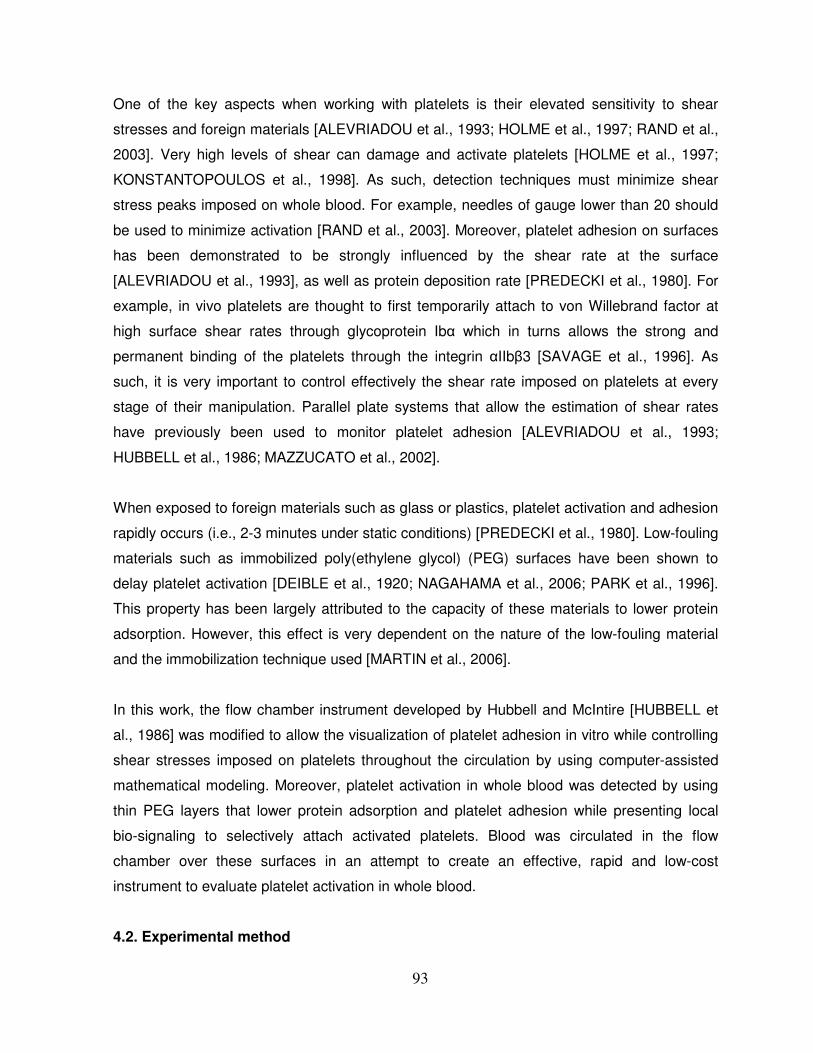
93
One of the key aspects when working with platelets is their elevated sensitivity to shear
stresses and foreign materials [ALEVRIADOU et al., 1993; HOLME et al., 1997; RAND et al.,
2003]. Very high levels of shear can damage and activate platelets [HOLME et al., 1997;
KONSTANTOPOULOS et al., 1998]. As such, detection techniques must minimize shear
stress peaks imposed on whole blood. For example, needles of gauge lower than 20 should
be used to minimize activation [RAND et al., 2003]. Moreover, platelet adhesion on surfaces
has been demonstrated to be strongly influenced by the shear rate at the surface
[ALEVRIADOU et al., 1993], as well as protein deposition rate [PREDECKI et al., 1980]. For
example, in vivo platelets are thought to first temporarily attach to von Willebrand factor at
high surface shear rates through glycoprotein Ib� which in turns allows the strong and
permanent binding of the platelets through the integrin �IIb�3 [SAVAGE et al., 1996]. As
such, it is very important to control effectively the shear rate imposed on platelets at every
stage of their manipulation. Parallel plate systems that allow the estimation of shear rates
have previously been used to monitor platelet adhesion [ALEVRIADOU et al., 1993;
HUBBELL et al., 1986; MAZZUCATO et al., 2002].
When exposed to foreign materials such as glass or plastics, platelet activation and adhesion
rapidly occurs (i.e., 2-3 minutes under static conditions) [PREDECKI et al., 1980]. Low-fouling
materials such as immobilized poly(ethylene glycol) (PEG) surfaces have been shown to
delay platelet activation [DEIBLE et al., 1920; NAGAHAMA et al., 2006; PARK et al., 1996].
This property has been largely attributed to the capacity of these materials to lower protein
adsorption. However, this effect is very dependent on the nature of the low-fouling material
and the immobilization technique used [MARTIN et al., 2006].
In this work, the flow chamber instrument developed by Hubbell and McIntire [HUBBELL et
al., 1986] was modified to allow the visualization of platelet adhesion in vitro while controlling
shear stresses imposed on platelets throughout the circulation by using computer-assisted
mathematical modeling. Moreover, platelet activation in whole blood was detected by using
thin PEG layers that lower protein adsorption and platelet adhesion while presenting local
bio-signaling to selectively attach activated platelets. Blood was circulated in the flow
chamber over these surfaces in an attempt to create an effective, rapid and low-cost
instrument to evaluate platelet activation in whole blood.
4.2. Experimental method
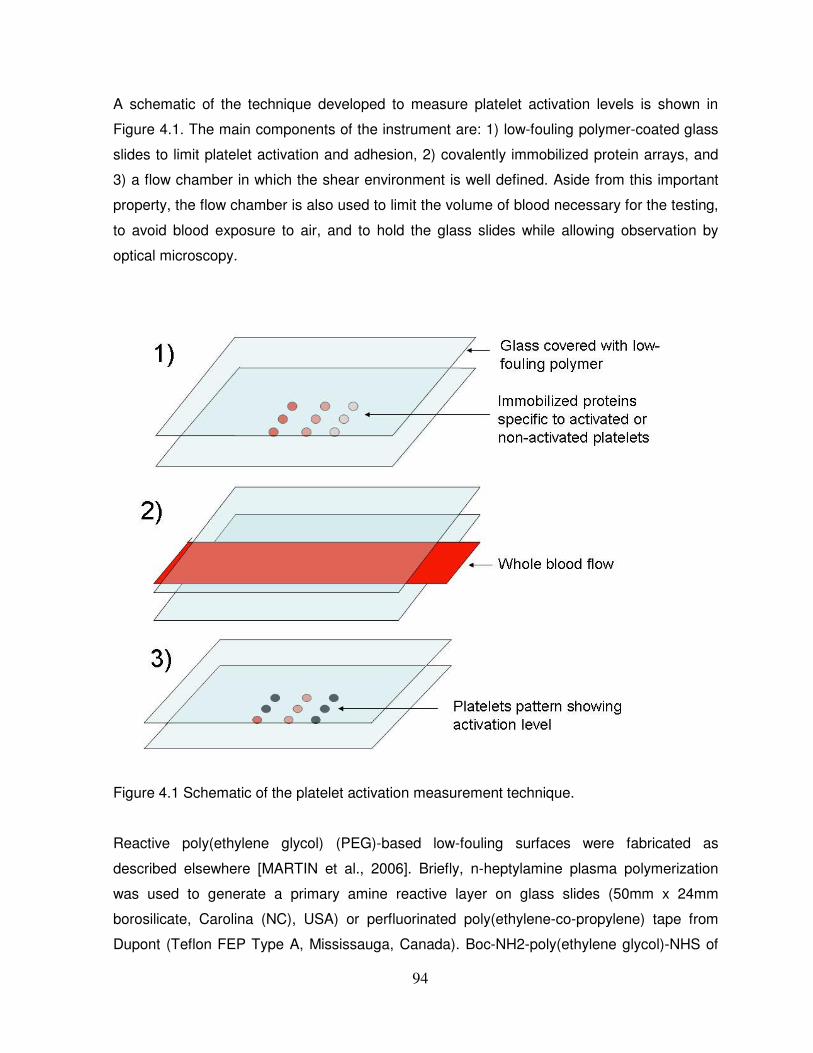
94
A schematic of the technique developed to measure platelet activation levels is shown in
Figure 4.1. The main components of the instrument are: 1) low-fouling polymer-coated glass
slides to limit platelet activation and adhesion, 2) covalently immobilized protein arrays, and
3) a flow chamber in which the shear environment is well defined. Aside from this important
property, the flow chamber is also used to limit the volume of blood necessary for the testing,
to avoid blood exposure to air, and to hold the glass slides while allowing observation by
optical microscopy.
Figure 4.1 Schematic of the platelet activation measurement technique.
Reactive poly(ethylene glycol) (PEG)-based low-fouling surfaces were fabricated as
described elsewhere [MARTIN et al., 2006]. Briefly, n-heptylamine plasma polymerization
was used to generate a primary amine reactive layer on glass slides (50mm x 24mm
borosilicate, Carolina (NC), USA) or perfluorinated poly(ethylene-co-propylene) tape from
Dupont (Teflon FEP Type A, Mississauga, Canada). Boc-NH2-poly(ethylene glycol)-NHS of
95
3,400-Da molecular weight from Nektar Therapeutics (cat. 4M530F02, San Carlos (CA),
USA) was then made to react with the amine groups through its NHS end-groups to create a
stable amide bond. The layer final properties can be modulated by varying reaction
conditions such as polymer concentration or the use of a theta solvent [MARTIN et al., 2006].
In this work, PEG layers were fabricated using a PEG concentration of 1 mg/ml in a theta
solvent at room temperature. The theta solvent used in this work is a 1.4M Na2SO4 solution.
Modified surfaces can be stored in buffered saline at 4°C for extended periods of time without
change in properties (data not shown). Immobilized Boc-NH2-PEG-plasma layers were Boc-
deprotected following manufacturer’s recommendations. Briefly, the substrates were
immersed in a 50% v/v solution of trifluoroacetic acid (cat. T62200, Sigma-Aldrich, Ontario,
Canada) and dichloromethane (cat. D65100, Sigma-Aldrich, Ontario, Canada) for one hour.
The substrates were afterwards repeatedly rinsed in a 5% v/v solution of N,N-
diisopropylethylamine (cat. D3887, Sigma-Aldrich, Ontario, Canada) in dichloromethane.
Anti-CD62 (anti-p-selectin) mouse IgG (cat. 30402, BioLegend, San Diego (CA), USA) and
anti-CD61 mouse IgG (cat. 555752, BD Biosciences, Boston (MA), USA) were arrayed on the
low-fouling surfaces using a BioChip Arrayer from PerkinElmer (Wellesley (MA), USA). The
surfaces were previously activated through the use of the cross-linking agent, disuccinimidyl
carbonate (DSC, cat. 225827, Sigma-Aldrich, Ontario, Canada) to incorporate active ester
groups on the amine surfaces. Twenty drops (ca. 300 pl per drop) of dilute protein solutions
were deposited on the activated surfaces and placed overnight in a controlled humidity
chamber to allow amide bond formation between the available primary amine groups of the
proteins (i.e., N-terminal and lysine residues) and the NHS-activated PEG surfaces. The
droplet design used in this work to measure platelet activation is presented in Figure 4.2.
Following reaction, surfaces were thoroughly rinsed in 300mOsm PBS buffer at pH 7.4.
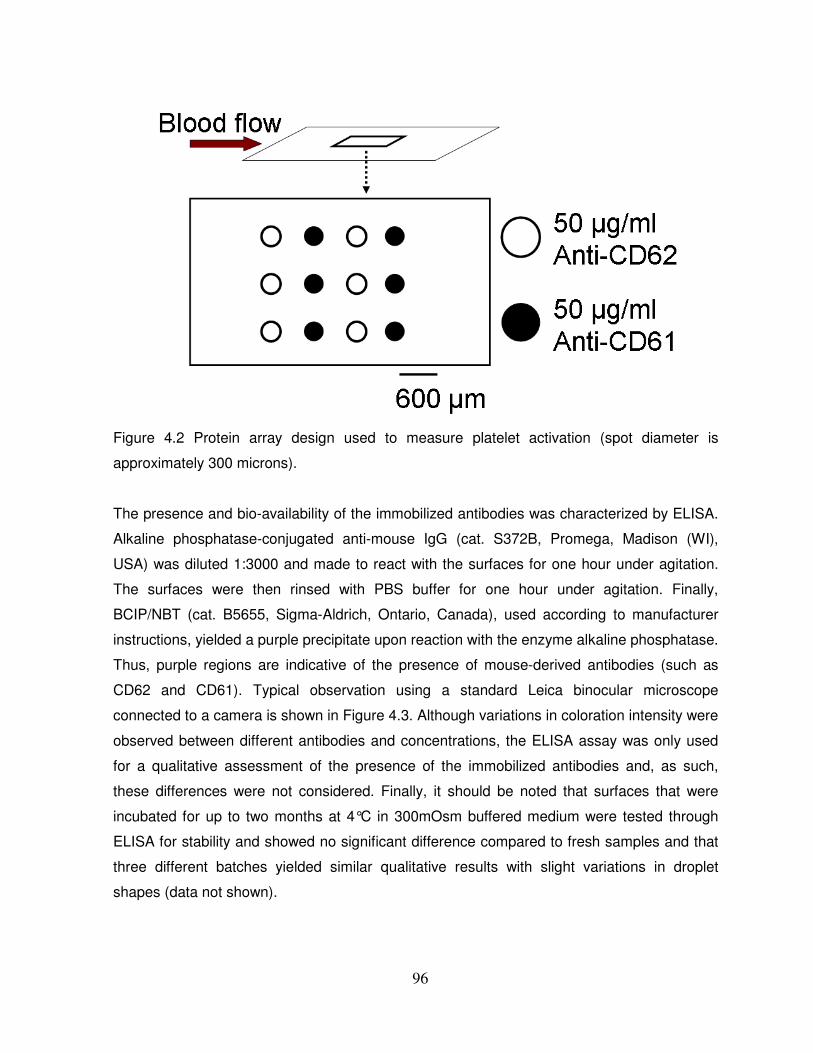
96
Figure 4.2 Protein array design used to measure platelet activation (spot diameter is
approximately 300 microns).
The presence and bio-availability of the immobilized antibodies was characterized by ELISA.
Alkaline phosphatase-conjugated anti-mouse IgG (cat. S372B, Promega, Madison (WI),
USA) was diluted 1:3000 and made to react with the surfaces for one hour under agitation.
The surfaces were then rinsed with PBS buffer for one hour under agitation. Finally,
BCIP/NBT (cat. B5655, Sigma-Aldrich, Ontario, Canada), used according to manufacturer
instructions, yielded a purple precipitate upon reaction with the enzyme alkaline phosphatase.
Thus, purple regions are indicative of the presence of mouse-derived antibodies (such as
CD62 and CD61). Typical observation using a standard Leica binocular microscope
connected to a camera is shown in Figure 4.3. Although variations in coloration intensity were
observed between different antibodies and concentrations, the ELISA assay was only used
for a qualitative assessment of the presence of the immobilized antibodies and, as such,
these differences were not considered. Finally, it should be noted that surfaces that were
incubated for up to two months at 4°C in 300mOsm buffered medium were tested through
ELISA for stability and showed no significant difference compared to fresh samples and that
three different batches yielded similar qualitative results with slight variations in droplet
shapes (data not shown).
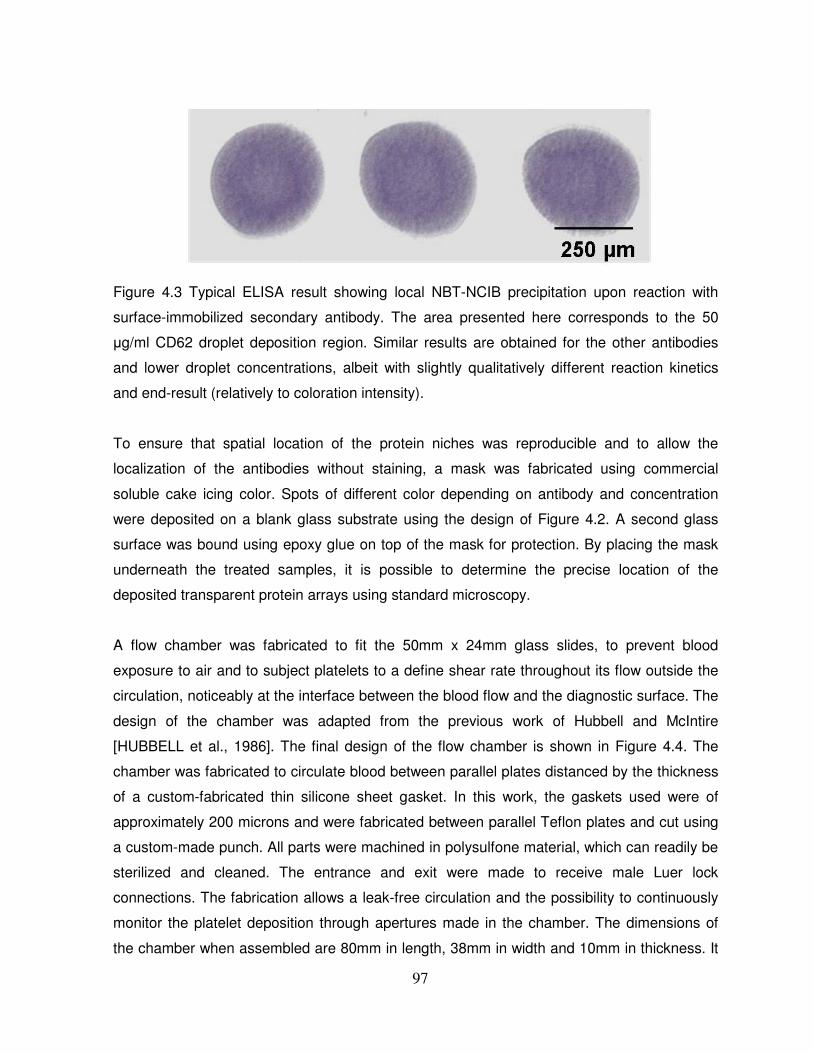
97
Figure 4.3 Typical ELISA result showing local NBT-NCIB precipitation upon reaction with
surface-immobilized secondary antibody. The area presented here corresponds to the 50
�g/ml CD62 droplet deposition region. Similar results are obtained for the other antibodies
and lower droplet concentrations, albeit with slightly qualitatively different reaction kinetics
and end-result (relatively to coloration intensity).
To ensure that spatial location of the protein niches was reproducible and to allow the
localization of the antibodies without staining, a mask was fabricated using commercial
soluble cake icing color. Spots of different color depending on antibody and concentration
were deposited on a blank glass substrate using the design of Figure 4.2. A second glass
surface was bound using epoxy glue on top of the mask for protection. By placing the mask
underneath the treated samples, it is possible to determine the precise location of the
deposited transparent protein arrays using standard microscopy.
A flow chamber was fabricated to fit the 50mm x 24mm glass slides, to prevent blood
exposure to air and to subject platelets to a define shear rate throughout its flow outside the
circulation, noticeably at the interface between the blood flow and the diagnostic surface. The
design of the chamber was adapted from the previous work of Hubbell and McIntire
[HUBBELL et al., 1986]. The final design of the flow chamber is shown in Figure 4.4. The
chamber was fabricated to circulate blood between parallel plates distanced by the thickness
of a custom-fabricated thin silicone sheet gasket. In this work, the gaskets used were of
approximately 200 microns and were fabricated between parallel Teflon plates and cut using
a custom-made punch. All parts were machined in polysulfone material, which can readily be
sterilized and cleaned. The entrance and exit were made to receive male Luer lock
connections. The fabrication allows a leak-free circulation and the possibility to continuously
monitor the platelet deposition through apertures made in the chamber. The dimensions of
the chamber when assembled are 80mm in length, 38mm in width and 10mm in thickness. It
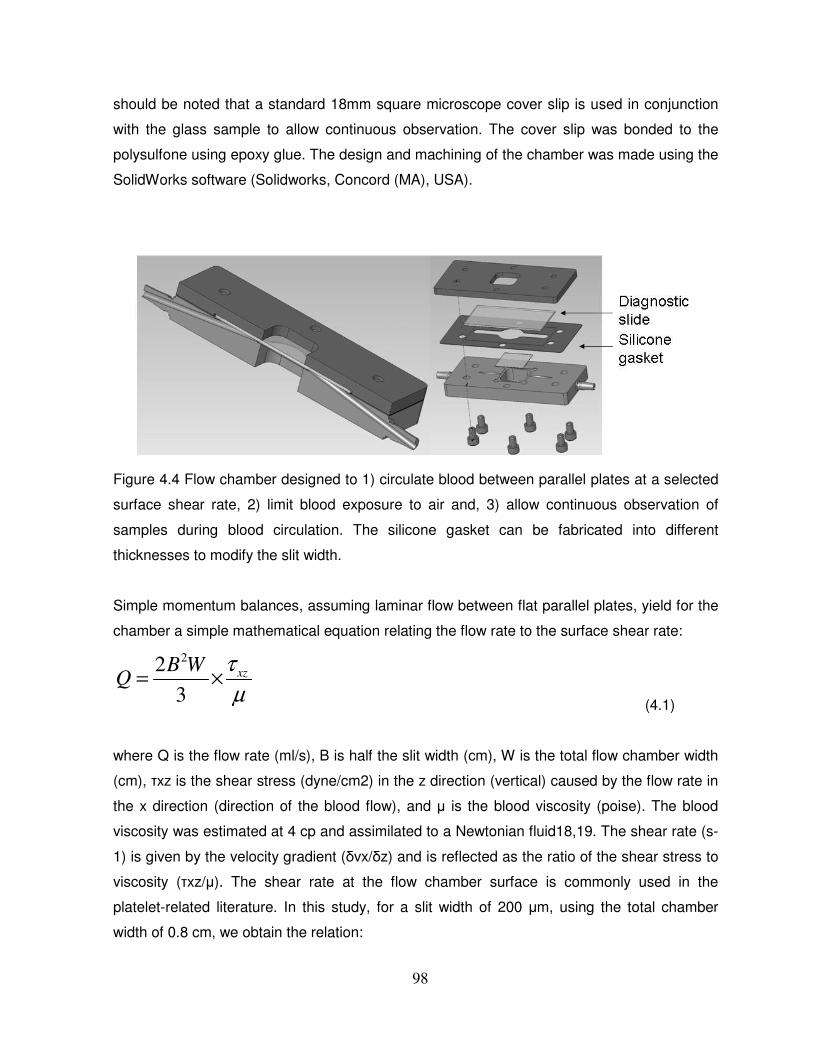
98
should be noted that a standard 18mm square microscope cover slip is used in conjunction
with the glass sample to allow continuous observation. The cover slip was bonded to the
polysulfone using epoxy glue. The design and machining of the chamber was made using the
SolidWorks software (Solidworks, Concord (MA), USA).
Figure 4.4 Flow chamber designed to 1) circulate blood between parallel plates at a selected
surface shear rate, 2) limit blood exposure to air and, 3) allow continuous observation of
samples during blood circulation. The silicone gasket can be fabricated into different
thicknesses to modify the slit width.
Simple momentum balances, assuming laminar flow between flat parallel plates, yield for the
chamber a simple mathematical equation relating the flow rate to the surface shear rate:
223
xzB WQ
τµ
= × (4.1)
where Q is the flow rate (ml/s), B is half the slit width (cm), W is the total flow chamber width
(cm), �xz is the shear stress (dyne/cm2) in the z direction (vertical) caused by the flow rate in
the x direction (direction of the blood flow), and � is the blood viscosity (poise). The blood
viscosity was estimated at 4 cp and assimilated to a Newtonian fluid18,19. The shear rate (s-
1) is given by the velocity gradient (vx/z) and is reflected as the ratio of the shear stress to
viscosity (�xz/�). The shear rate at the flow chamber surface is commonly used in the
platelet-related literature. In this study, for a slit width of 200 �m, using the total chamber
width of 0.8 cm, we obtain the relation:
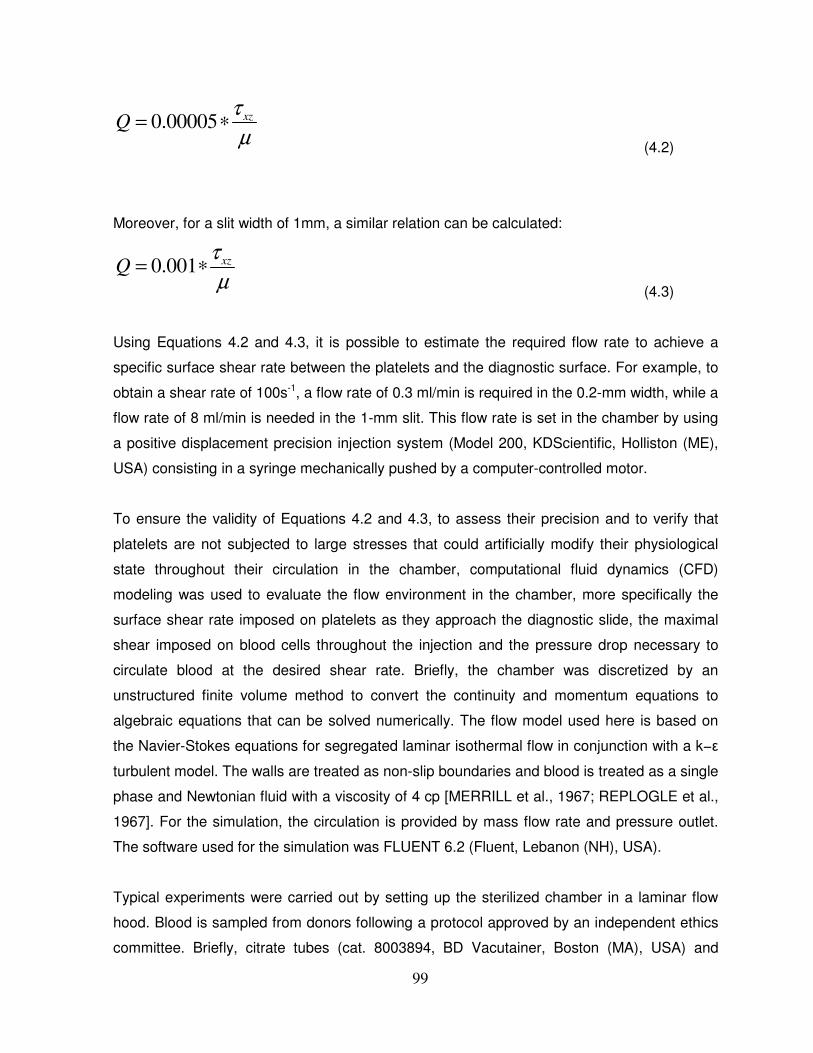
99
0.00005 xzQτµ
= ∗ (4.2)
Moreover, for a slit width of 1mm, a similar relation can be calculated:
0.001 xzQτµ
= ∗ (4.3)
Using Equations 4.2 and 4.3, it is possible to estimate the required flow rate to achieve a
specific surface shear rate between the platelets and the diagnostic surface. For example, to
obtain a shear rate of 100s-1, a flow rate of 0.3 ml/min is required in the 0.2-mm width, while a
flow rate of 8 ml/min is needed in the 1-mm slit. This flow rate is set in the chamber by using
a positive displacement precision injection system (Model 200, KDScientific, Holliston (ME),
USA) consisting in a syringe mechanically pushed by a computer-controlled motor.
To ensure the validity of Equations 4.2 and 4.3, to assess their precision and to verify that
platelets are not subjected to large stresses that could artificially modify their physiological
state throughout their circulation in the chamber, computational fluid dynamics (CFD)
modeling was used to evaluate the flow environment in the chamber, more specifically the
surface shear rate imposed on platelets as they approach the diagnostic slide, the maximal
shear imposed on blood cells throughout the injection and the pressure drop necessary to
circulate blood at the desired shear rate. Briefly, the chamber was discretized by an
unstructured finite volume method to convert the continuity and momentum equations to
algebraic equations that can be solved numerically. The flow model used here is based on
the Navier-Stokes equations for segregated laminar isothermal flow in conjunction with a k−
turbulent model. The walls are treated as non-slip boundaries and blood is treated as a single
phase and Newtonian fluid with a viscosity of 4 cp [MERRILL et al., 1967; REPLOGLE et al.,
1967]. For the simulation, the circulation is provided by mass flow rate and pressure outlet.
The software used for the simulation was FLUENT 6.2 (Fluent, Lebanon (NH), USA).
Typical experiments were carried out by setting up the sterilized chamber in a laminar flow
hood. Blood is sampled from donors following a protocol approved by an independent ethics
committee. Briefly, citrate tubes (cat. 8003894, BD Vacutainer, Boston (MA), USA) and
100
needles of gauge 20 or lower were used to collect blood samples. The samples were used
within two hours to ensure platelet function. In this work, platelets were artificially activated by
adding collagen from equine tendon (cat. 5368, Helena Laboratories, Beaumont (TX), USA)
at a 2 µg/ml concentration in whole blood five minutes prior to injection. Blood was then
injected in the circulation chamber at a constant rate for one minute. The flow rate used here
was adjusted to obtain a surface shear rate of 100s-1 (e.g., 0.3 ml/min for a 0.2-mm slit).
Following blood injection, the chamber is rinsed with pH 7.4 iso-osmolar PBS buffer for two
minutes using the same flow rate as for blood. Microscope observations are carried out
throughout this process using a camera-conjugated Zeiss stereomicroscope (Carl Zeiss
Canada, Toronto (ON), Lumar V12) and appropriate filters. Surface-bound platelets may then
be fixed with 10% formaldehyde for further experiments, such as SEM observation. To
enable microscope observations during blood circulation in the chamber and to eliminate the
need for rinsing, quinacrine dihydrochloride (cat. Q3251, Sigma-Aldrich, Ontario, Canada)
was added at a concentration of 10�M to the whole blood samples five minutes prior to
injection in order to fluorescently label platelets. Quinacrine dihydrochloride is reported to
label platelets and leucocytes when used in whole blood and have no effect on platelet
function [TURNER et al., 1995]. Blood samples were destroyed after use.
Still images, on which fluorescently-labeled platelet aggregates yielded high luminosity areas,
were treated manually to quantify the number of surface-adhered platelets. Using the mask
previously described, spot locations were delimited on the images. Using Photoshop software
(Adobe, San Jose (CA), USA), 50 µm squares were created to evaluate the average pixel
luminosity inside their boundaries. The average pixel luminosity in the spots was compared to
the luminosity obtained in twenty random locations outside the spots. As the luminosity
distribution was exponentially distributed (i.e., there was a more important number of large
luminosity values compared to low values), the natural logarithm of the luminosity was taken
to perform the statistical analysis. Areas of null average luminosity were assimilated to areas
of 0.01 average luminosity to allow the transformation of the data. Moreover, the logarithmic
transformation generates negative values for surfaces with luminosity from 0.01 to 0.99
which, although counterintuitive, allows sounder statistical comparisons as the normality
criteria is better respected. Student t-tests were performed to determine if the average natural
logarithm of luminosity from a spot was statistically different from that of its surroundings
(indicating a positive test for this spot or group of spots).
101
4.3 Results and Discussion
CFD modeling was carried out to verify the validity of the laminar parallel plate model to
calculate the surface shear rate imposed on platelets as they approach the diagnostic slide in
the flow chamber. Two different chamber dimensions were studied to get an insight on the
effect of plate separation on the shear environments.
Images of the surface shear rate distributions in the 0.2-mm and 1-mm slit width chambers
are presented in Figure 4.5 for a 6 ml/min flow rate. The shear rates in the diagnostic area
agree within 25% to the estimations calculated from Equations 4.2 and 4.3. At larger slit
widths, the shear rates calculated from the simpler equations are in good agreement with
those obtained from computer-assisted simulation, while at smaller slit widths, the shear rates
calculated from the simulation can be slightly lower in the diagnostic area. Equations 4.2 and
4.3 can then be preferred to computer-assisted simulations to routinely evaluate surface
shear levels in the parallel-plate blood circulation device owing to their adequate accuracy
and ease of use.
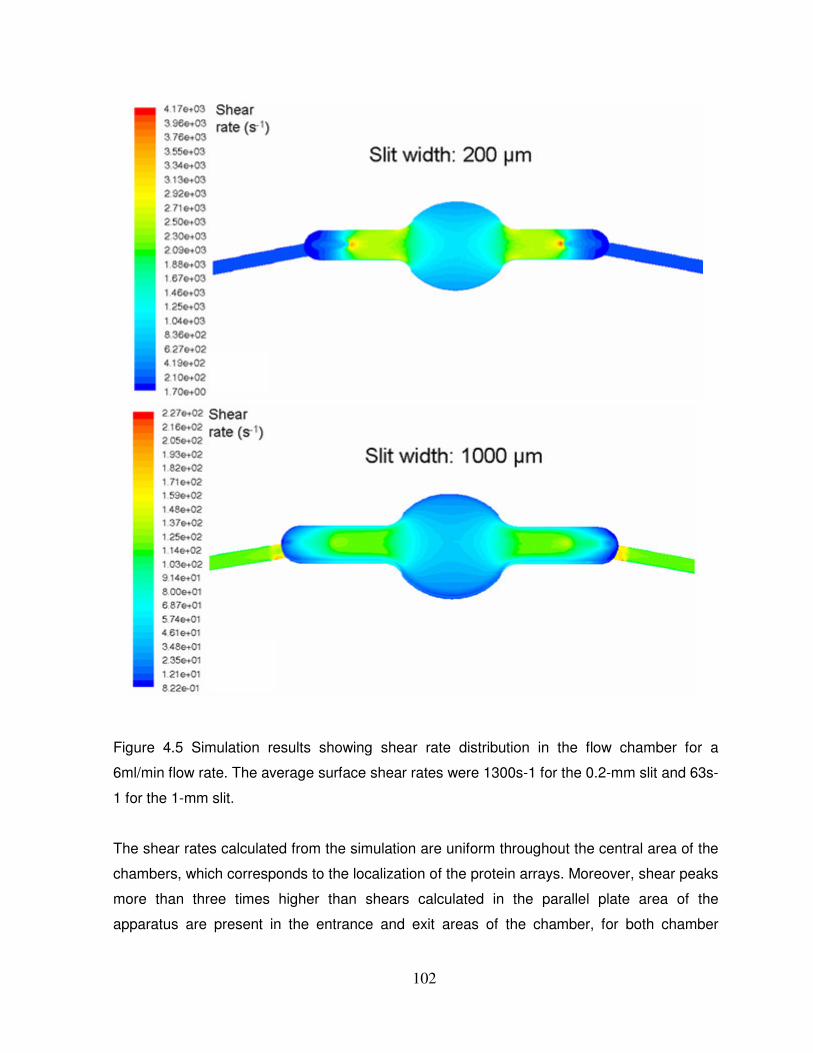
102
Figure 4.5 Simulation results showing shear rate distribution in the flow chamber for a
6ml/min flow rate. The average surface shear rates were 1300s-1 for the 0.2-mm slit and 63s-
1 for the 1-mm slit.
The shear rates calculated from the simulation are uniform throughout the central area of the
chambers, which corresponds to the localization of the protein arrays. Moreover, shear peaks
more than three times higher than shears calculated in the parallel plate area of the
apparatus are present in the entrance and exit areas of the chamber, for both chamber
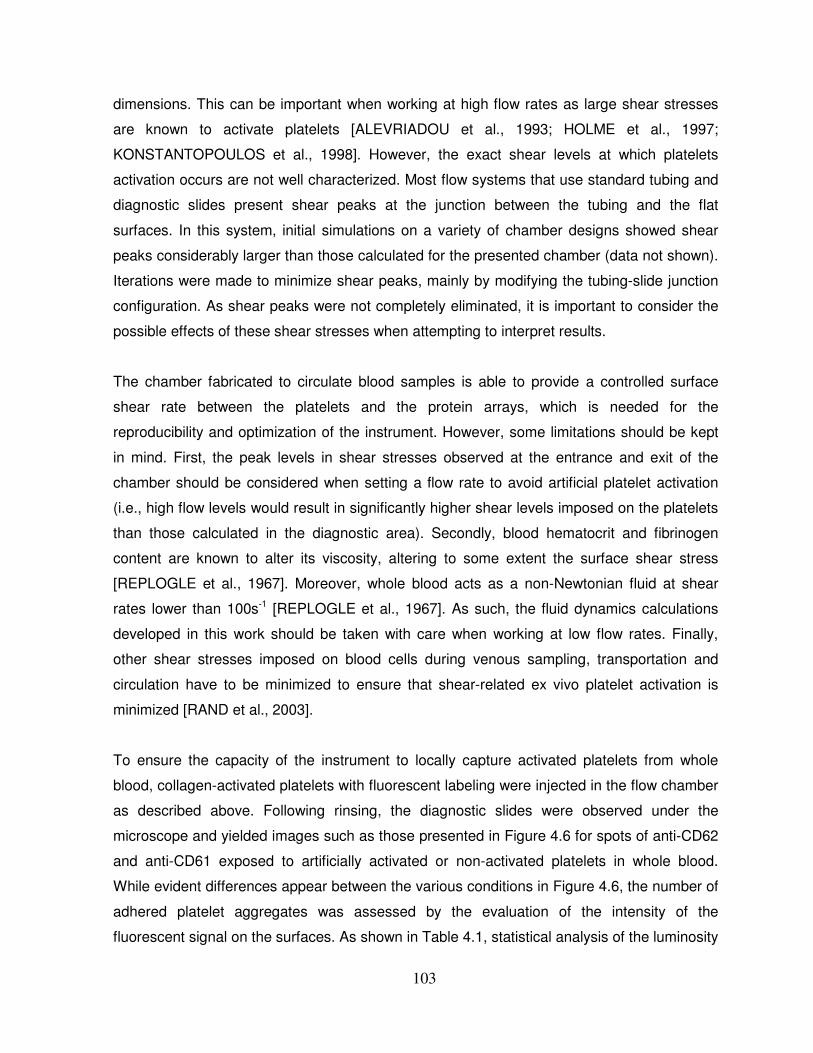
103
dimensions. This can be important when working at high flow rates as large shear stresses
are known to activate platelets [ALEVRIADOU et al., 1993; HOLME et al., 1997;
KONSTANTOPOULOS et al., 1998]. However, the exact shear levels at which platelets
activation occurs are not well characterized. Most flow systems that use standard tubing and
diagnostic slides present shear peaks at the junction between the tubing and the flat
surfaces. In this system, initial simulations on a variety of chamber designs showed shear
peaks considerably larger than those calculated for the presented chamber (data not shown).
Iterations were made to minimize shear peaks, mainly by modifying the tubing-slide junction
configuration. As shear peaks were not completely eliminated, it is important to consider the
possible effects of these shear stresses when attempting to interpret results.
The chamber fabricated to circulate blood samples is able to provide a controlled surface
shear rate between the platelets and the protein arrays, which is needed for the
reproducibility and optimization of the instrument. However, some limitations should be kept
in mind. First, the peak levels in shear stresses observed at the entrance and exit of the
chamber should be considered when setting a flow rate to avoid artificial platelet activation
(i.e., high flow levels would result in significantly higher shear levels imposed on the platelets
than those calculated in the diagnostic area). Secondly, blood hematocrit and fibrinogen
content are known to alter its viscosity, altering to some extent the surface shear stress
[REPLOGLE et al., 1967]. Moreover, whole blood acts as a non-Newtonian fluid at shear
rates lower than 100s-1 [REPLOGLE et al., 1967]. As such, the fluid dynamics calculations
developed in this work should be taken with care when working at low flow rates. Finally,
other shear stresses imposed on blood cells during venous sampling, transportation and
circulation have to be minimized to ensure that shear-related ex vivo platelet activation is
minimized [RAND et al., 2003].
To ensure the capacity of the instrument to locally capture activated platelets from whole
blood, collagen-activated platelets with fluorescent labeling were injected in the flow chamber
as described above. Following rinsing, the diagnostic slides were observed under the
microscope and yielded images such as those presented in Figure 4.6 for spots of anti-CD62
and anti-CD61 exposed to artificially activated or non-activated platelets in whole blood.
While evident differences appear between the various conditions in Figure 4.6, the number of
adhered platelet aggregates was assessed by the evaluation of the intensity of the
fluorescent signal on the surfaces. As shown in Table 4.1, statistical analysis of the luminosity

104
signals revealed that collagen activation yielded significant platelet immobilization on anti-
CD62 and anti-CD61 spots (p-value < 0.03). Moreover, non-activated platelets did not
significantly adhere on anti-CD62 spots while they showed significant anti-CD61 adhesion on
two thirds of the tested samples. This was expected as platelets are known to present CD61
independently of their activation levels. The data presented in Table 4.1 also seem to point to
a somewhat more important presence of artificially-activated platelet aggregates on the anti-
CD62 spots compared to the anti-CD61 spots. Some blood samples also seem to yield
platelets that are more readily adhesive on the surfaces. Whether this effect, which is of large
clinical importance, is due to differences in the state of activation of the donor’s platelets or to
variability arising from blood manipulations or instrument noise will need to be studied in
future work using blood samples with donors with known clinical backgrounds.
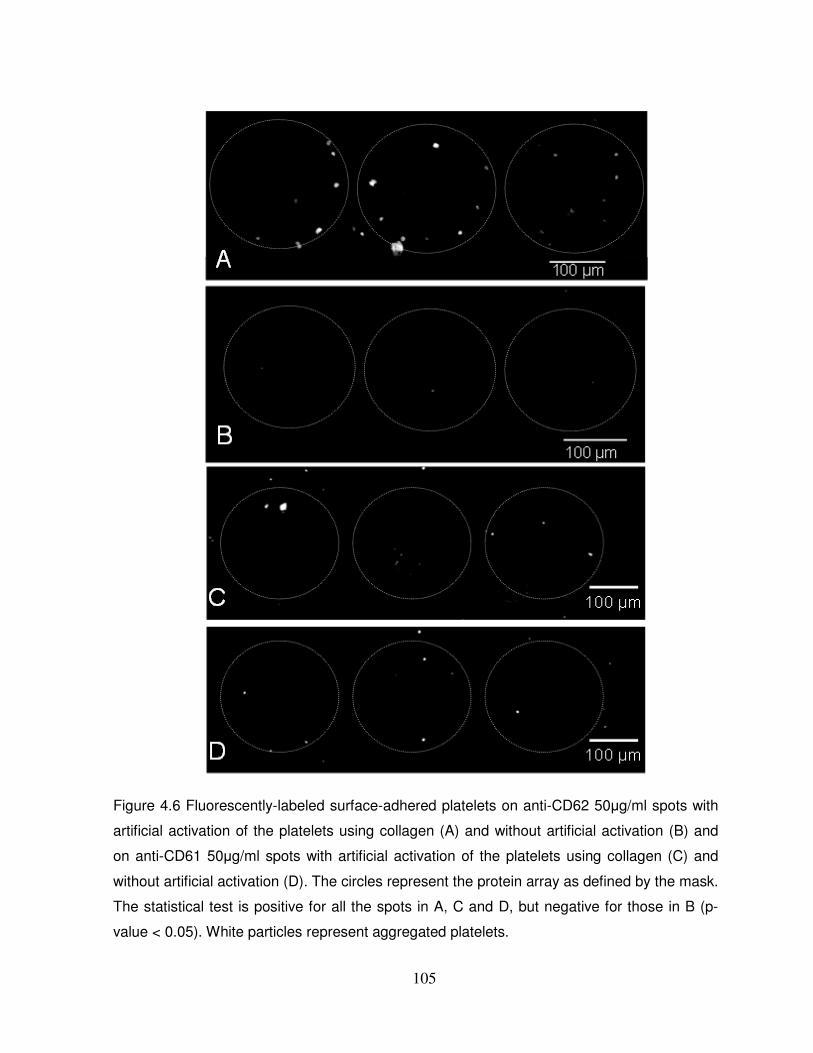
105
Figure 4.6 Fluorescently-labeled surface-adhered platelets on anti-CD62 50�g/ml spots with
artificial activation of the platelets using collagen (A) and without artificial activation (B) and
on anti-CD61 50�g/ml spots with artificial activation of the platelets using collagen (C) and
without artificial activation (D). The circles represent the protein array as defined by the mask.
The statistical test is positive for all the spots in A, C and D, but negative for those in B (p-
value < 0.05). White particles represent aggregated platelets.
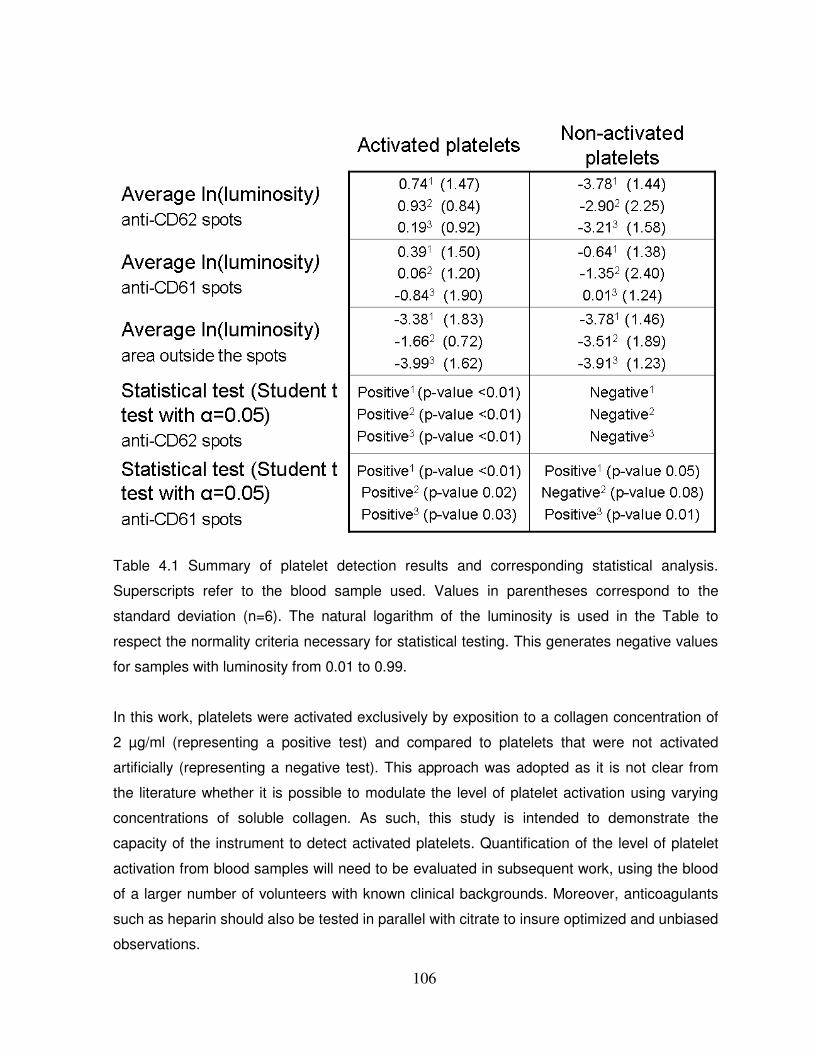
106
Table 4.1 Summary of platelet detection results and corresponding statistical analysis.
Superscripts refer to the blood sample used. Values in parentheses correspond to the
standard deviation (n=6). The natural logarithm of the luminosity is used in the Table to
respect the normality criteria necessary for statistical testing. This generates negative values
for samples with luminosity from 0.01 to 0.99.
In this work, platelets were activated exclusively by exposition to a collagen concentration of
2 µg/ml (representing a positive test) and compared to platelets that were not activated
artificially (representing a negative test). This approach was adopted as it is not clear from
the literature whether it is possible to modulate the level of platelet activation using varying
concentrations of soluble collagen. As such, this study is intended to demonstrate the
capacity of the instrument to detect activated platelets. Quantification of the level of platelet
activation from blood samples will need to be evaluated in subsequent work, using the blood
of a larger number of volunteers with known clinical backgrounds. Moreover, anticoagulants
such as heparin should also be tested in parallel with citrate to insure optimized and unbiased
observations.
107
Variability between similar spots on the same surface can sometimes be important.
Noticeably, platelets tend to form aggregates which are, for the flow conditions studied,
unevenly distributed on the surfaces and the spots. For instance, very large aggregates of
high intensity are often present in only a fraction of the spots, while other spots contain much
smaller aggregates. This phenomenon lowers the resolution of the instrument and requires a
larger number of spots to be studied to yield conclusive statistical interpretation. It also
requires that the test areas be completely randomly chosen to ensure unbiased interpretation
of the data. In the areas outside the spots, platelet aggregates seem to adhere predominantly
to the surrounding of the spots. This could be attributed to a small offset between the position
of the spot predicted by the mask and their actual localization. Finally, it should be noted that
for the spot design used, no significant difference in platelet aggregates content was
observed between upstream and downstream spots.
4.4 Conclusions
The instrument presented in this work enables an evaluation of platelet activation from whole
blood. For this instrument to be used in the clinic, a thorough study with a large number of
blood samples from donors with known clinical backgrounds and a systematic evaluation of
the optimal spot composition and shear rate to be used in the flow chamber will have to be
undertaken. Moreover, the use an automatic scanning of the surface should be developed to
ensure a superior robustness and ease of use of the instrument. The miniaturization of the
diagnostic device is also desirable as it would allow smaller samples of blood necessary for
the test and possibly transform the need of professionally-assisted blood sampling into auto-
sampling from skin capillaries (such as in glucose monitoring). Finally, the use of other
activation-dependent molecules (e.g., PAC-1 IgM antibody which binds the GPIIb/IIIa integrin
of activated platelets) could be used on the surfaces to hypothetically make the diagnostic
more efficient with a larger platelet activation detection range.
108
4.5 References
ALEVRIADOU, B R, MOAKE, J. L., TURNER, N. A., RUGGERI, Z. M., FOLIE, B. J., PHILLIPS, M. D., SCHREIBER, A. B., HRINDA, M. E., MCINTIRE, L. V. (1993) Real-time analysis of shear-dependent thrombus formation and its blockade by inhibitors of von Willebrand factor binding to platelets, Blood, 81, p. 1263-1276.
DEIBLE, C R, PETROSKO, P., JOHNSON, P. C., BECKMAN, E. J., RUSSELL, A. J., WAGNER, W. R. (1920) Molecular barriers to biomaterial thrombosis by modification of surface proteins with polyethylene glycol, Biomaterials., 101-109.
HOLME, P A, ORVIM, U., HAMERS, M. J., SOLUM, N. O., BROSSTAD, F. R., BARSTAD, R. M., SAKARIASSEN, K. S. (1997) Shear-induced platelet activation and platelet microparticle formation at blood flow conditions as in arteries with a severe stenosis, Arteriosclerosis, Thrombosis & Vascular Biology, 17, p. 646-653.
HUBBELL, J A, MCINTIRE, L. V. (1986) Technique for visualization and analysis of mural thrombogenesis, Review in Scientific Instruments, 57, p. 892-897.
KONSTANTOPOULOS, K, NEELAMEGHAM, S., BURNS, A. R., HENTZEN, E., KANSAS, G. S., SNAPP, K. R., BERG, E. L., HELLUMS, J. D., SMITH, C. W., MCINTIRE, L. V., SIMON, S. I. (1998) Venous levels of shear support neutrophil-platelet adhesion and neutrophil aggregation in blood via P-selectin and beta2-integrin, Circulation, 98, p. 873-882.
MARTIN, Y, VERMETTE, P. (2006) Low-fouling amine-terminated poly(ethylene glycol) thin layers and effect of immobilization conditions on their mechanical and physicochemical properties, Macromolecules, 39, p.8083-8091.
MATSAGAS, M I, GEROULAKOS, G., MIKHAILIDIS, D. P. (2002) The role of platelets in peripheral arterial disease: therapeutic implications, Annals of Vascular Surgery, 16, p. 246-258.
MAZZUCATO, M, COZZI, M. R., PRADELLA, P., PERISSINOTTO, D., MALMSTROM, A., MORGELIN, M., SPESSOTTO, P., COLOMBATTI, A., DE, M. L., PERRIS, R. (2002) Vascular PG-M/versican variants promote platelet adhesion at low shear rates and cooperate with collagens to induce aggregation, FASEB Journal, 16, p. 1903-1916.
MERRILL, E W, PELLETIER, G. A. (1967) Viscosity of human blood: transition from Newtonian to non-Newtonian, Journal of Applied Physiology, 23, p. 178-182.
MICHELSON, A D (2006) Evaluation of platelet function by flow cytometry. [Review] [197 refs], Pathophysiology of Haemostasis & Thrombosis, 35, p. 67-82.
NAGAHAMA, K, OHYA, Y., OUCHI, T. (2006) Suppression of cell and platelet adhesion to star-shaped 8-armed poly(ethylene glycol)-poly(L-lactide) block copolymer films, Macromolecular Bioscience.6(6), 412-9,
PARK, K D, SUZUKI, K., LEE, W. K., LEE, J. E., KIM, Y. H., SAKURAI, Y., OKANO, T. (1996) Platelet adhesion and activation on polyethylene glycol modified polyurethane surfaces. Measurement of cytoplasmic calcium, ASAIO Journal.42(5), M876-81.
109
PREDECKI, P, LIFE, L., RASSEL, P. A. (1980) Measurement of the activation time for platelet adhesion to foreign surfaces, Journal of Biomedical Materials Research, 14, p. 417-426.
RAND, M L, LEUNG, R., PACKHAM, M. A. (2003) Platelet function assays, Transfusion & Apheresis Science, 28, p. 307-317.
REPLOGLE, R L, MEISELMAN, H. J., MERRILL, E. W. (1967) Clinical implications of blood rheology studies, Circulation, 36, p. 148-160.
RINDER, H M, MURPHY, M., MITCHELL, J. G., STOCKS, J., AULT, K. A., HILLMAN, R. S. (1991) Progressive platelet activation with storage: evidence for shortened survival of activated platelets after transfusion, Transfusion, 31, p. 409-414.
SAVAGE, B, SALDIVAR, E., RUGGERI, Z. M. (1996) Initiation of platelet adhesion by arrest onto fibrinogen or translocation on von Willebrand factor, Cell, 84, p. 289-297.
SMITH, N M, PATHANSALI, R., BATH, P. M. (1999) Platelets and stroke, Vascular Medicine, 4, p. 165-172.
TURNER, N. A., MOAKE, J. L., KAMAT, S. G., SCHAFER, A. I., KLEIMAN, N. S., JORDAN, R., MCINTIRE, L.V. (1995), Coronary Heart Disease/Platelet Activation/Myocardial Infarction: Comparative Real-Time Effects on Platelet Adhesion and Aggregation Under Flowing Conditions of In Vivo Aspirin, Heparin, and Monoclonal Antibody Fragment Against Glycoprotein IIb-IIIa, Circulation 91 (5), p.1354-1362.
VOLTURO, G A, AGHABABIAN, R. V. (2004) Facilitating optimal care of acute coronary, cerebrovascular and peripheral vascular syndromes in the emergency department: the role of oral antiplatelet therapy, Journal of Thrombosis & Thrombolysis, 17, p. 29-34.
CONCLUSION Ce travail doctoral a permis le développement, l’étude, l’optimisation et l’utilisation de
surfaces qui peuvent moduler les réponses cellulaires. Des surfaces pouvant diminuer ou
éliminer les interactions non spécifiques cellules-matériaux tout en permettant la présence de
signaux locaux ont été démontrées nécessaires pour la culture tissulaire et cellulaire en 3D et
pour des applications de diagnostic médical basé sur les cellules. Ainsi, des objectifs de
recherche ont été mis en place pour construire et optimiser de telles surfaces basées sur la
polymérisation par plasma et l’immobilisation covalente de chaînes de PEG fonctionnalisées.
Des couches minces aminées ont été déposées en utilisant la polymérisation par plasma et
les paramètres du procédé ont été étudiés pour obtenir une densité d’azote améliorée et une
stabilité de couche suffisante pour les applications cellulaires. La puissance de la déposition
et le temps de réaction se sont révélés être les paramètres importants par rapport aux
propriétés des films. Des chaînes de PEG ont été immobilisées sur les surfaces activées et
les conditions d’immobilisation ont été étudiées soigneusement pour obtenir des surfaces
antiadhésives et permettre l’immobilisation subséquente de molécules bioactives. De plus,
les propriétés fondamentales d’hydratation des couches de PEG ont été investiguées,
fournissant des conclusions importantes pour l’utilisation de tels systèmes. La densité
d’immobilisation des chaînes dictée par l’utilisation de solvants thêta et par la concentration
en solution des molécules de PEG affecte l’adsorption de protéines, les propriétés
d’hydratation, les forces à la surface et le potentiel de greffage chimique. Les propriétés
colloïdales du polymère en solution ont aussi révélées être critiques pour les propriétés
finales des films. Finalement, une surface diagnostique utile a été développée et testée pour
évaluer l’activation plaquettaire à partir d’échantillons de sang complet. L’activation
plaquettaire de sang obtenu de donneurs a été évaluée avec succès par les surfaces en
utilisant une chambre d’écoulement fabriquée sur mesure, des anticorps immobilisés et des
mesures en fluorescence. Cette thèse ouvre la voie à de nombreuses applications en génie
tissulaire, en diagnostic médical et avec les interactions cellules-matériaux en général. De
plus, les applications diagnostiques basées sur les protéines et les sucres où le ratio signal-
bruit est un facteur limitant pourraient aussi bénéficier fortement de la technologie décrite
dans cette thèse.
CONCLUSION This doctoral work allowed the development, study, optimization and use of surfaces that
modulate localized cell responses. Surfaces that lower or eliminate non specific cell-material
interaction while allowing localized signalling were shown to be needed for 3D cell and tissue
culture and cell-based medical diagnostic applications. Thus, research objectives were set to
construct and optimize such surfaces based on plasma polymerization and functionalized
PEG covalent attachment. Amine-containing thin films were deposited using plasma
polymerization and process parameters were thoroughly studied to achieve enhanced
surface amine density and sufficient layer stability for cell-based applications. Glow discharge
power and reaction time were shown to be important for film properties. PEG molecules were
covalently immobilized on the amine-containing layers and reaction conditions were
thoroughly studied to achieve elevated low fouling properties and allow subsequent covalent
molecule attachment. Moreover, fundamental water structuring properties of PEG layers were
investigated, yielding important conclusions for the use of such systems. Grafting density as
dictated by cloud point deposition and polymer concentration in solution affects protein
adsorption, hydratation properties, surface forces and grafting potential. Polymer colloidal
properties in solution were also shown to be critical for film properties. Finally, a useful cell-
based medical diagnostic surface was developed and tested to evaluate platelet activation
form whole blood samples. Platelet activation in blood obtained from donors was aptly
evaluated by the surfaces using as custom-made flow chamber, immobilized antibodies and
fluorescent-based measurements. This thesis opens the way to a large number of
applications in tissue engineering, medical diagnostic and cell-material interactions in
general. Moreover, protein- or sugar-based diagnostic applications in which signal-to-noise
ratio is a limiting factor may also strongly beneficiate from the technology described in this
thesis.


![INTERNATIONAL JOURNAL OF ENGINEERING … · petroleum hydrocarbon [1]. Power production by MFCs varies with bacterial cell species, specific substrate concentration, cathode catalysts](https://img.pdfslide.tips/doc/110x75/5d500fe788c99349728bac0e/international-journal-of-engineering-petroleum-hydrocarbon-1-power-production.jpg)