Embed Size (px)
Citation preview
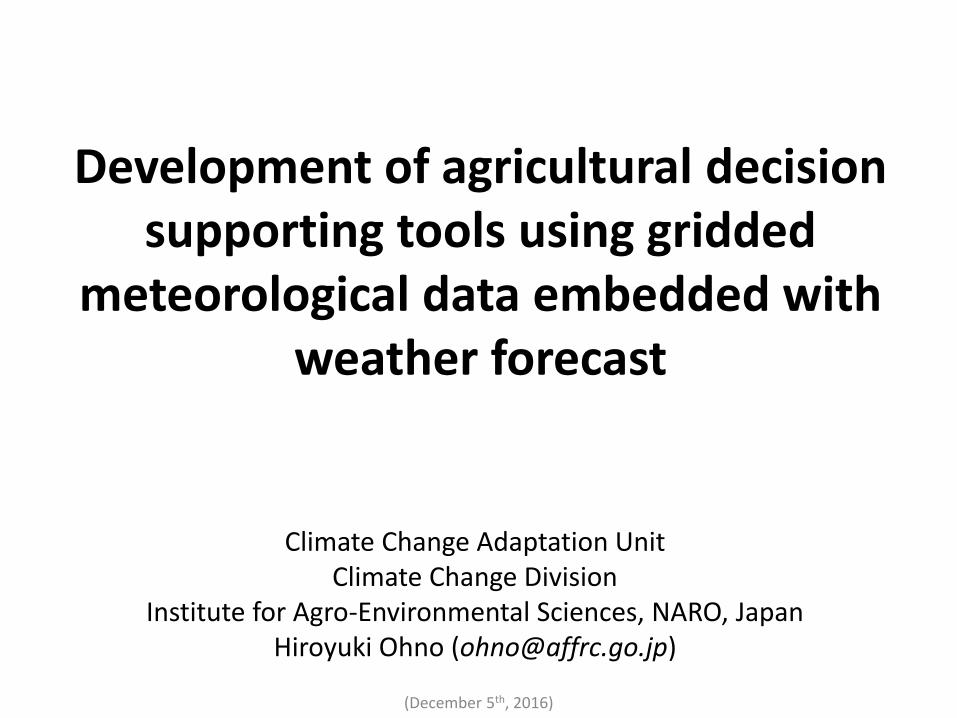
Development of agricultural decision supporting tools using gridded
meteorological data embedded with weather forecast
Climate Change Adaptation Unit Climate Change Division
Institute for Agro-Environmental Sciences, NARO, Japan Hiroyuki Ohno ([email protected])
(December 5th, 2016)
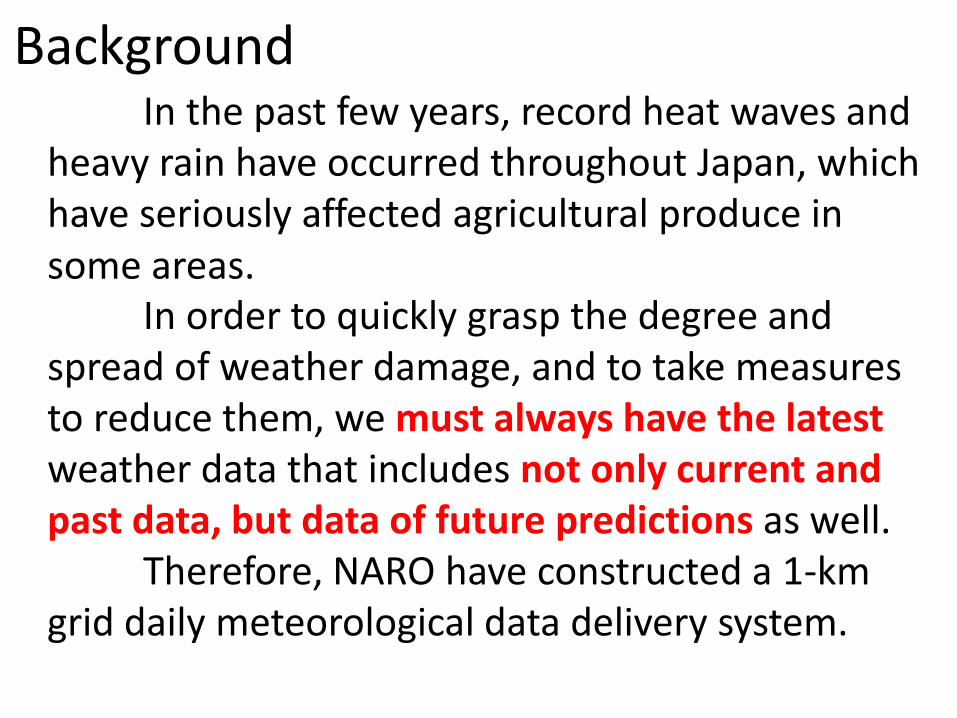
Background In the past few years, record heat waves and heavy rain have occurred throughout Japan, which have seriously affected agricultural produce in some areas. In order to quickly grasp the degree and spread of weather damage, and to take measures to reduce them, we must always have the latest weather data that includes not only current and past data, but data of future predictions as well. Therefore, NARO have constructed a 1-km grid daily meteorological data delivery system.
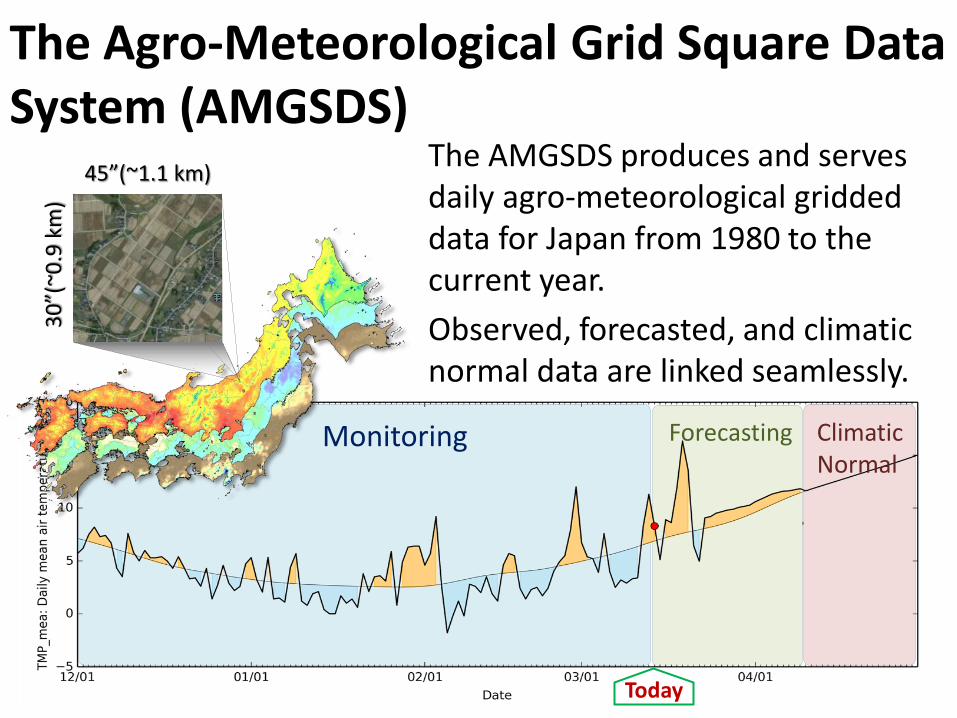
The Agro-Meteorological Grid Square Data System (AMGSDS)
<-7日平均->
Monitoring Forecasting Climatic Normal
Today
45”(~1.1 km)
30
”(~0
.9 k
m)
The AMGSDS produces and serves daily agro-meteorological gridded data for Japan from 1980 to the current year.
Observed, forecasted, and climatic normal data are linked seamlessly.
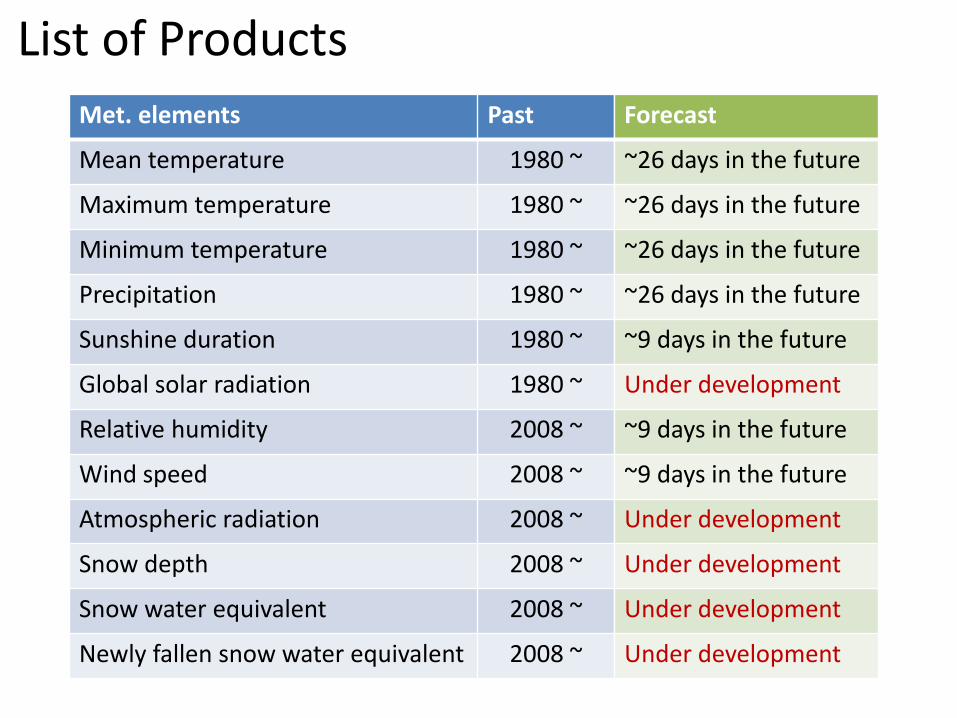
Met. elements Past
Mean temperature 1980 ~
Maximum temperature 1980 ~
Minimum temperature 1980 ~
Precipitation 1980 ~
Sunshine duration 1980 ~
Global solar radiation 1980 ~
Relative humidity 2008 ~
Wind speed 2008 ~
Atmospheric radiation 2008 ~
Snow depth 2008 ~
Snow water equivalent 2008 ~
Newly fallen snow water equivalent 2008 ~
List of Products
Forecast
~26 days in the future
~26 days in the future
~26 days in the future
~26 days in the future
~9 days in the future
Under development
~9 days in the future
~9 days in the future
Under development
Under development
Under development
Under development
(Source: http://www.jma.go.jp/jma/kishou/know/amedas/kaisetsu.html)
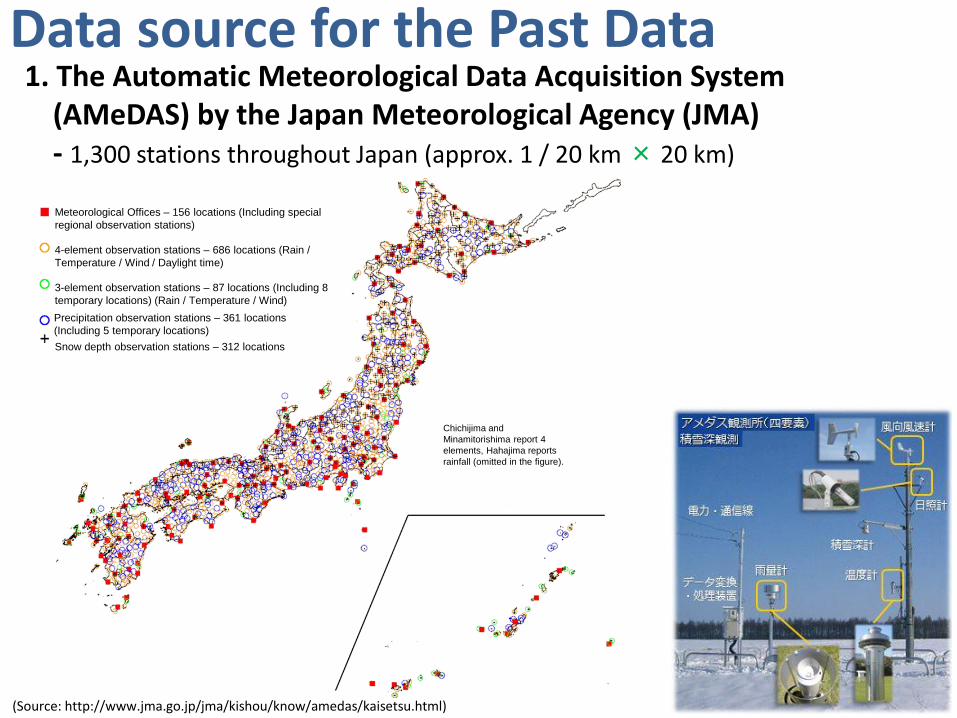
Data source for the Past Data 1. The Automatic Meteorological Data Acquisition System
(AMeDAS) by the Japan Meteorological Agency (JMA) - 1,300 stations throughout Japan (approx. 1 / 20 km × 20 km)
Meteorological Offices – 156 locations (Including special
regional observation stations)
4-element observation stations – 686 locations (Rain /
Temperature / Wind / Daylight time)
3-element observation stations – 87 locations (Including 8
temporary locations) (Rain / Temperature / Wind)
Precipitation observation stations – 361 locations
(Including 5 temporary locations)
Snow depth observation stations – 312 locations
Chichijima and
Minamitorishima report 4
elements, Hahajima reports
rainfall (omitted in the figure).
+
=
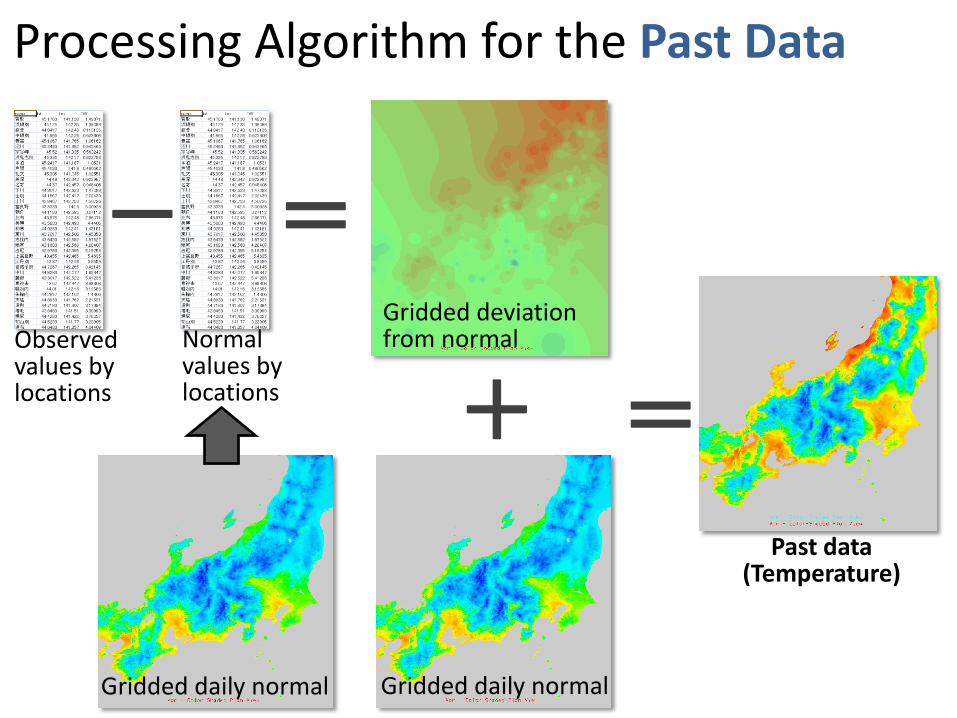
Observed values by locations
Gridded deviation from normal
Gridded daily normal
-
Normal values by locations
=
Past data (Temperature)
Processing Algorithm for the Past Data
Gridded daily normal
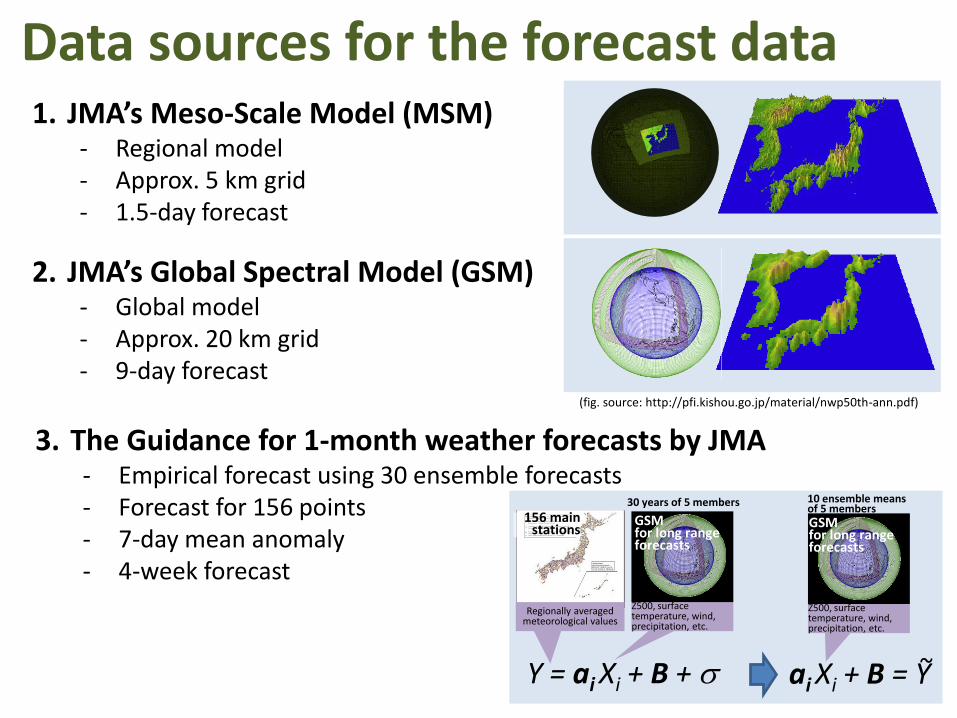
1. JMA’s Meso-Scale Model (MSM) - Regional model - Approx. 5 km grid - 1.5-day forecast
(fig. source: http://pfi.kishou.go.jp/material/nwp50th-ann.pdf)
Data sources for the forecast data
2. JMA’s Global Spectral Model (GSM) - Global model - Approx. 20 km grid - 9-day forecast
3. The Guidance for 1-month weather forecasts by JMA - Empirical forecast using 30 ensemble forecasts - Forecast for 156 points - 7-day mean anomaly - 4-week forecast
Y = ai Xi + B +
Z500, surface temperature, wind, precipitation, etc.
Regionally averaged meteorological values
ai Xi + B = Y
156 main stations
GSM for long range forecasts
Z500, surface temperature, wind, precipitation, etc.
10 ensemble means of 5 members
30 years of 5 members
GSM for long range forecasts
~
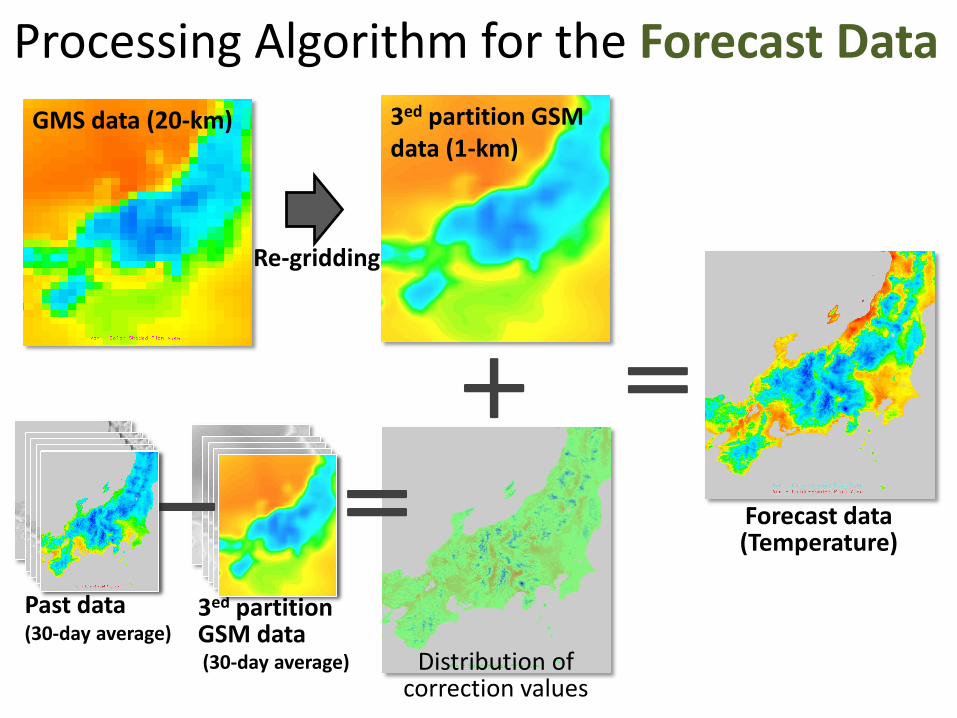
Past data (30-day average)
GMS data (20-km) 3ed partition GSM data (1-km)
Distribution of correction values
+ =
- = Forecast data (Temperature)
Re-gridding
3ed partition GSM data (30-day average)
Processing Algorithm for the Forecast Data
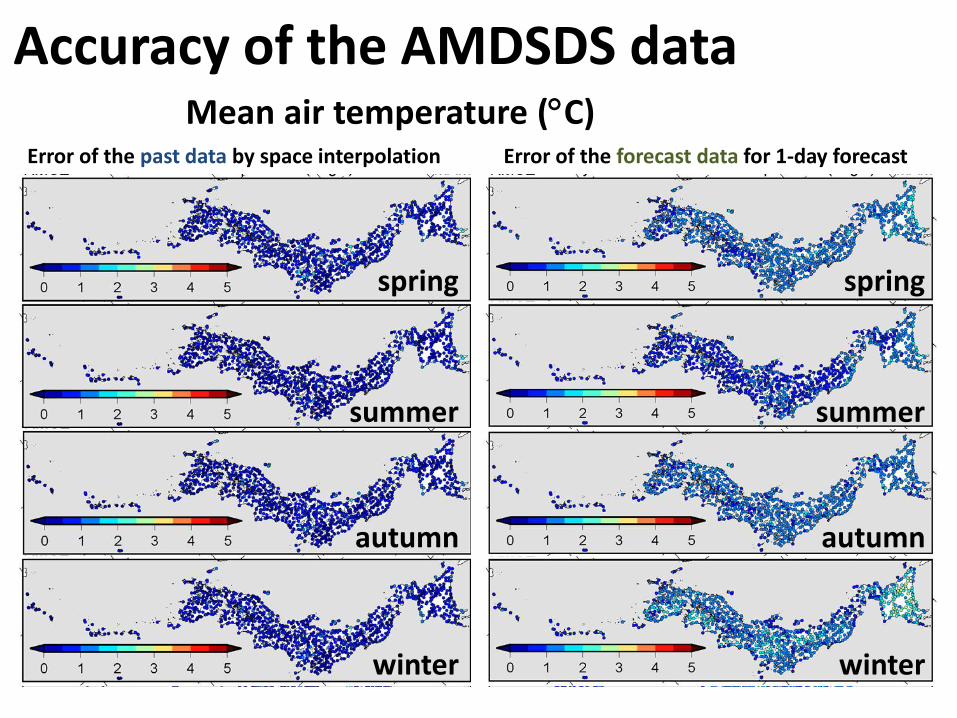
Accuracy of the AMDSDS data
spring
summer
autumn
winter
Error of the past data by space interpolation Error of the forecast data for 1-day forecast
spring
summer
autumn
winter
Mean air temperature (C)
0%
10%
20%
30%
40%
50%
60%
0 5 10 15 20 25 30
誤差低減の効果
[%]
日数(n)
n日先の日値に対する効果
向こうn日間の平均値に対する効果
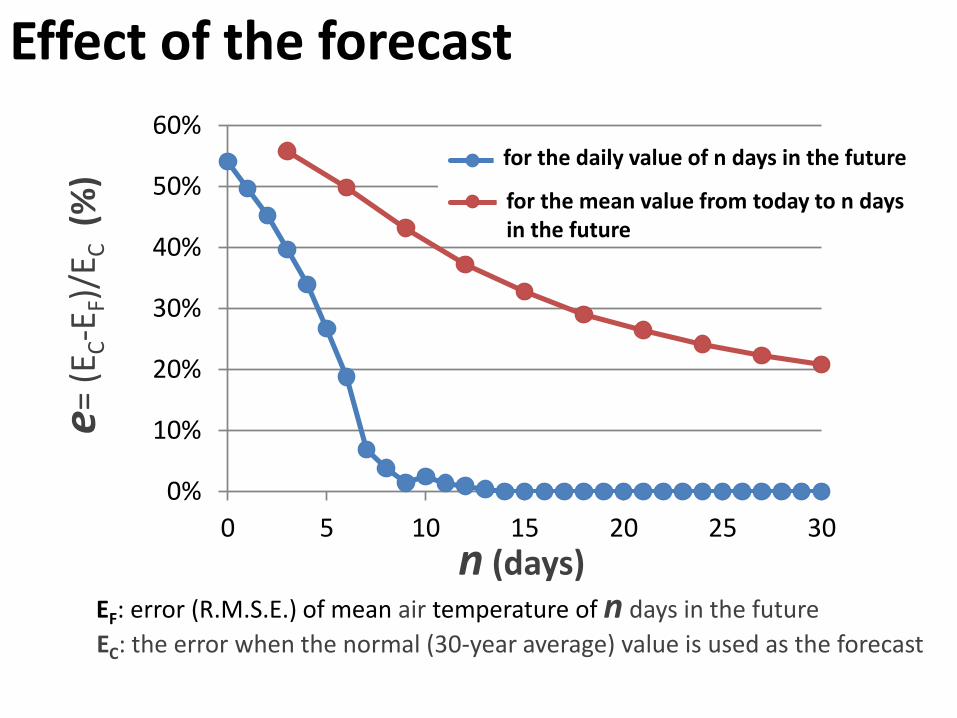
EF: error (R.M.S.E.) of mean air temperature of n days in the future
EC: the error when the normal (30-year average) value is used as the forecast
Effect of the forecast
n (days)
e= (
E C-E
F)/E
C (
%)
for the daily value of n days in the future
for the mean value from today to n days in the future
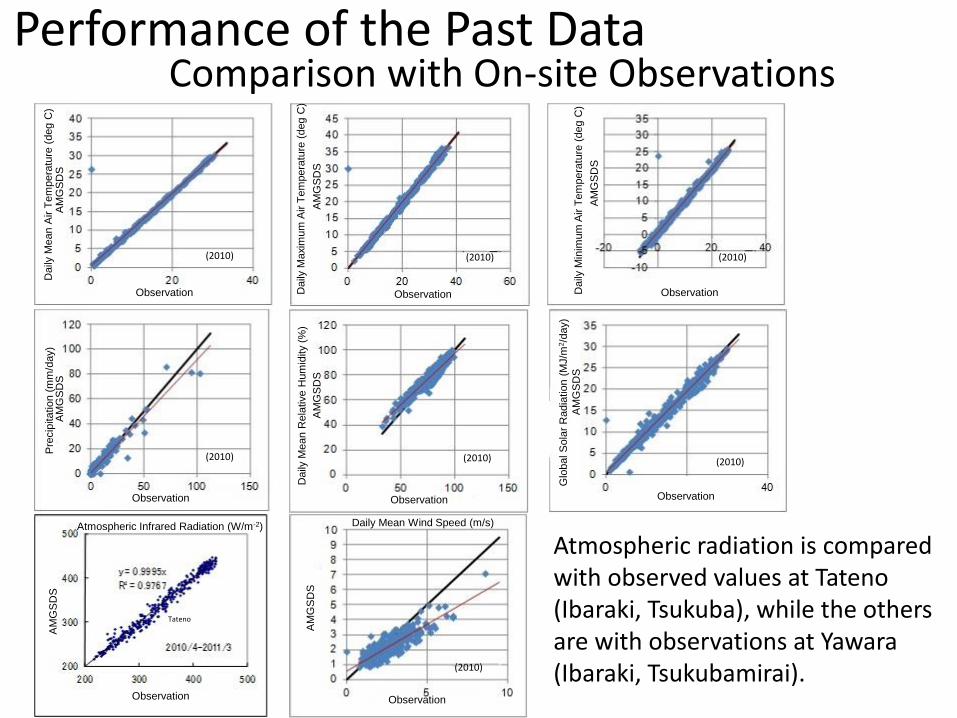
Atmospheric radiation is compared with observed values at Tateno (Ibaraki, Tsukuba), while the others are with observations at Yawara (Ibaraki, Tsukubamirai).
Performance of the Past Data A
MG
SD
S
Observation
(2010) (2010) (2010)
Pre
cip
itatio
n (
mm
/day)
(2010) (2010)
Daily
Mean R
ela
tive H
um
idity (
%)
Glo
bal S
ola
r R
adia
tio
n (
MJ/m
2/d
ay)
Tateno
Daily Mean Wind Speed (m/s)
(2010)
(2010)
Daily
Maxim
um
Air T
em
pera
ture
(deg C
)
Daily
Mean A
ir T
em
pera
ture
(deg C
)
Daily
Min
imum
Air T
em
pera
ture
(deg C
)
Observation
AM
GS
DS
Observation
Observation Observation Observation
Observation
Atmospheric Infrared Radiation (W/m-2)
Observation
Comparison with On-site Observations
AM
GS
DS
AM
GS
DS
AM
GS
DS
AM
GS
DS
AM
GS
DS
AM
GS
DS
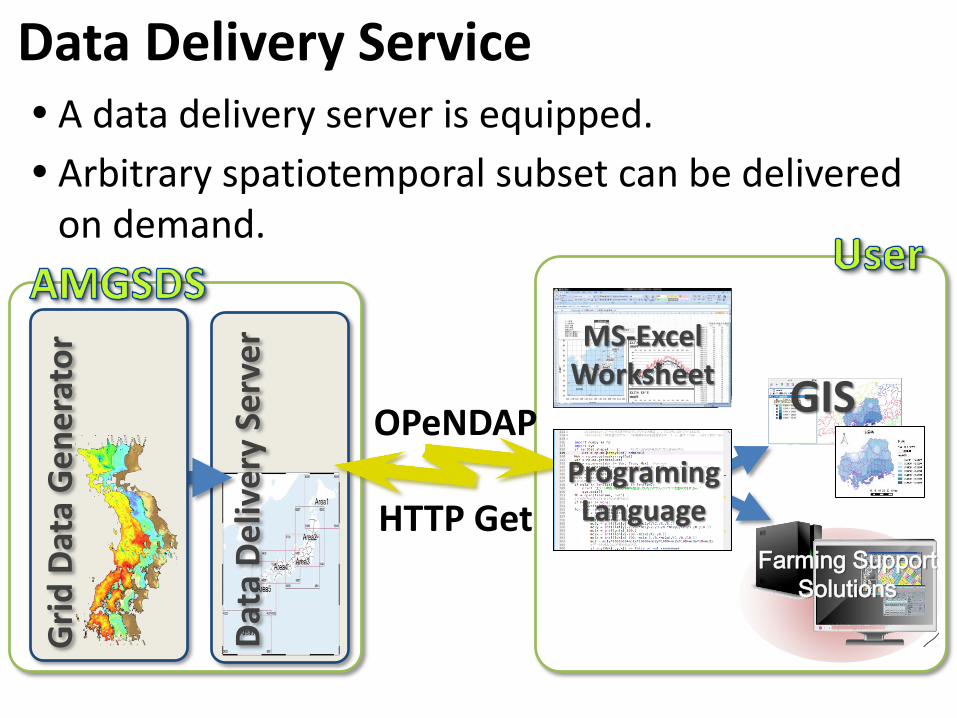
OPeNDAP
HTTP Get
Gri
d D
ata
Ge
ne
rato
r
Dat
a D
eliv
ery
Se
rve
r
Data Delivery Service A data delivery server is equipped.
Arbitrary spatiotemporal subset can be delivered on demand.
MS-Excel Worksheet
GIS
Farming Support
Solutions
Programing Language
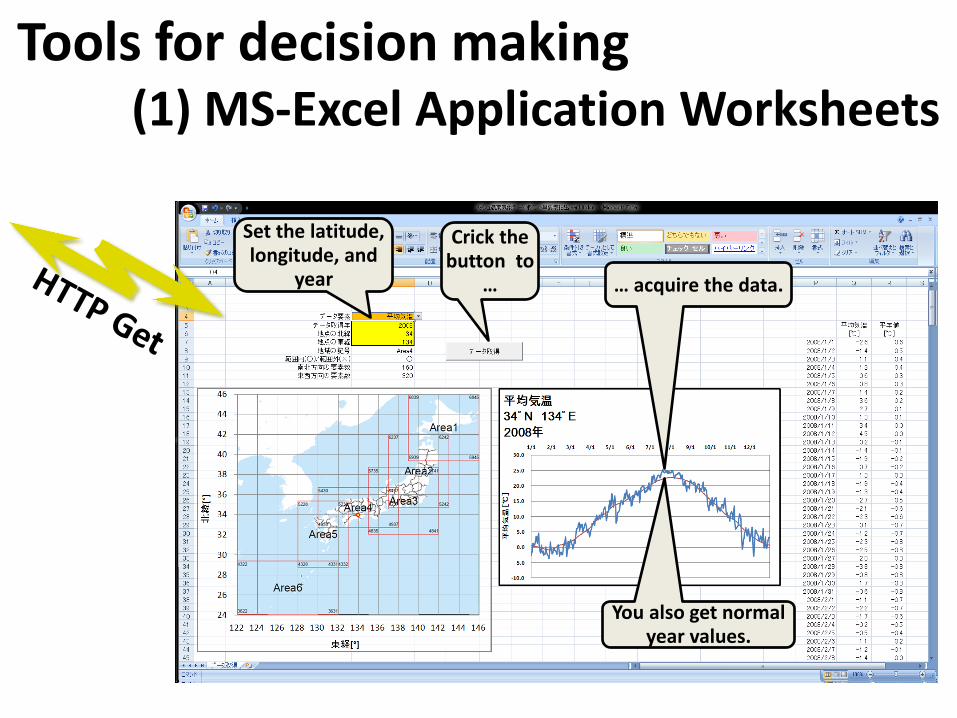
Set the latitude, longitude, and
year … acquire the data.
Crick the button to
…
You also get normal year values.
Tools for decision making (1) MS-Excel Application Worksheets
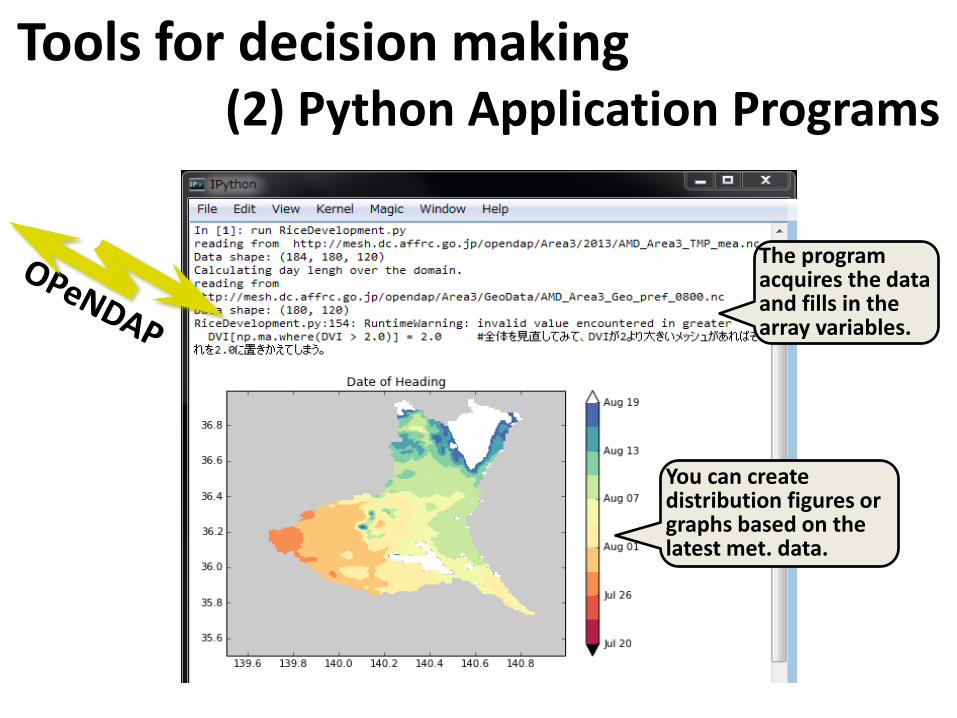
The program acquires the data and fills in the array variables.
You can create distribution figures or graphs based on the latest met. data.
Tools for decision making (2) Python Application Programs
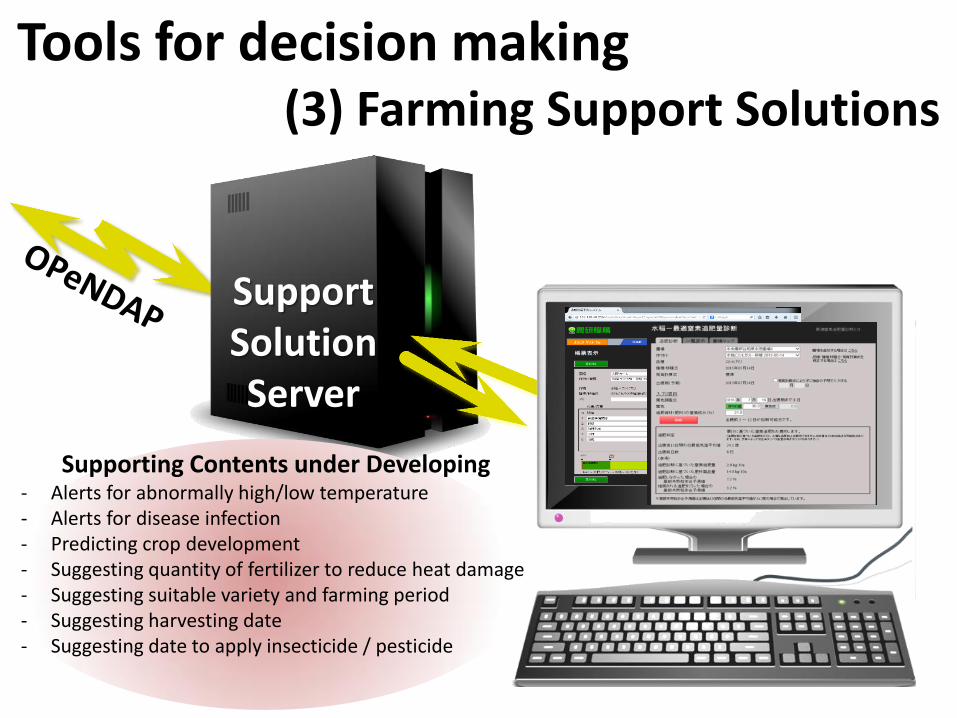
Tools for decision making (3) Farming Support Solutions
Support Solution Server
Supporting Contents under Developing - Alerts for abnormally high/low temperature - Alerts for disease infection - Predicting crop development - Suggesting quantity of fertilizer to reduce heat damage - Suggesting suitable variety and farming period - Suggesting harvesting date - Suggesting date to apply insecticide / pesticide

Web API Server
Solution A
Solution B
Solution C
Tools for decision making (4) Web API Services
Supporting Contents under Developing - Alerts for abnormally high/low temperature - Alerts for disease infection - Predicting crop development - Suggesting quantity of fertilizer to reduce heat damage - Suggesting suitable variety and farming period - Suggesting harvesting date - Suggesting date to apply insecticide / pesticide
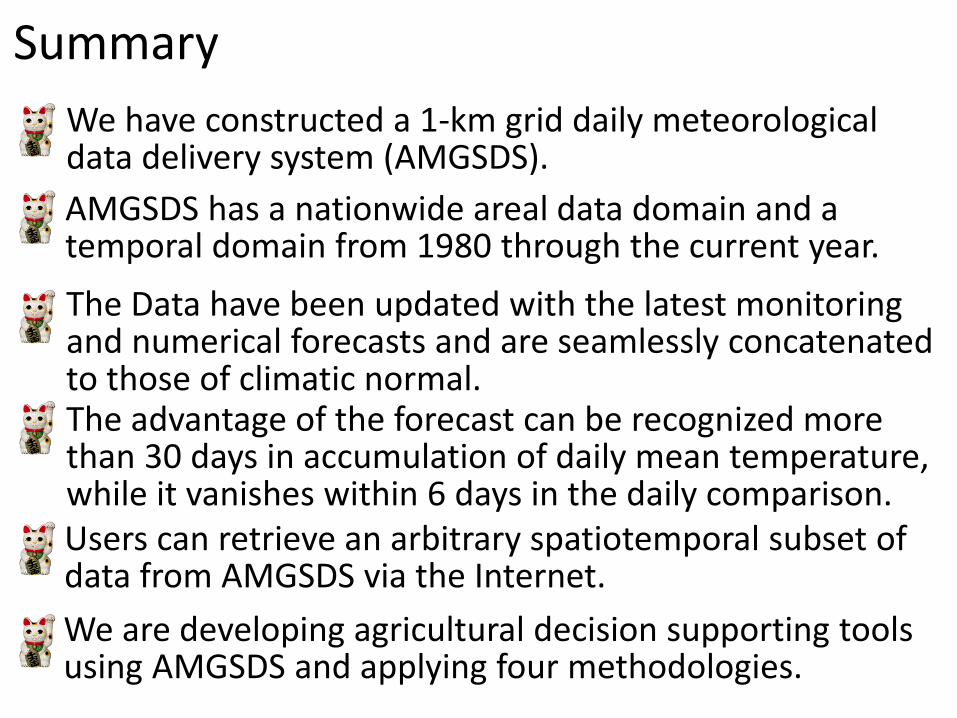
Summary
We have constructed a 1-km grid daily meteorological data delivery system (AMGSDS).
The Data have been updated with the latest monitoring and numerical forecasts and are seamlessly concatenated to those of climatic normal.
AMGSDS has a nationwide areal data domain and a temporal domain from 1980 through the current year.
Users can retrieve an arbitrary spatiotemporal subset of data from AMGSDS via the Internet.
The advantage of the forecast can be recognized more than 30 days in accumulation of daily mean temperature, while it vanishes within 6 days in the daily comparison.
We are developing agricultural decision supporting tools using AMGSDS and applying four methodologies.