Embed Size (px)
Citation preview

117
Developments in Land Prices and Bank Lending
in Interwar Japan:Effects of the Real Estate
Finance Problem on the Banking Industry
Takashi Nanjo
Assistant Manager and Economist, Research Division III, Institute for Monetary andEconomic Studies, Bank of Japan (E-mail: [email protected])
This paper is a revised English-language version of the author’s report at a workshop,“Asset-Price Fluctuations and Policy Responses: Experiences of Interwar Japan,” held bythe Institute for Monetary and Economic Studies (IMES), Bank of Japan (December 20,2001). The author has received many valuable comments from workshop participants,including Professor Masanao Ito of the University of Tokyo and Professor Kazuo Ogawaof Osaka University. Nevertheless, the views expressed in this study are solely those of theauthor and do not necessarily reflect those of the Bank of Japan or IMES.
MONETARY AND ECONOMIC STUDIES/OCTOBER 2002
This paper investigates the relationship between fluctuations in assetprices and the real economic activity in interwar Japan, focusing onthe effects of land price movements on the volume of bank lending.When what is called the “real estate finance problem” arose in the1920s and the beginning of the 1930s, falling land prices may haveaffected bank lending, possibly due to the reduced collateral value ofreal estate held by borrowers and the reduced risk-taking capacity ofthe banking industry caused by impaired equity capital. Fluctuationsin land prices and changes in the volume of lending made by ordinaryand savings banks show similar developments, and regression analysesincluding panel data analyses at the prefectural level have indicated asignificant relationship between land prices and bank lending. Withrespect to the equity capital of banking industry, consideration hasbeen given to the scale of losses in real estate collateral loans caused byfalling land prices, based on data from the Nihon Kangyo Bank.
Key words: Interwar economy; Financial crisis; Showa depression;Asset prices; Stability of the financial system
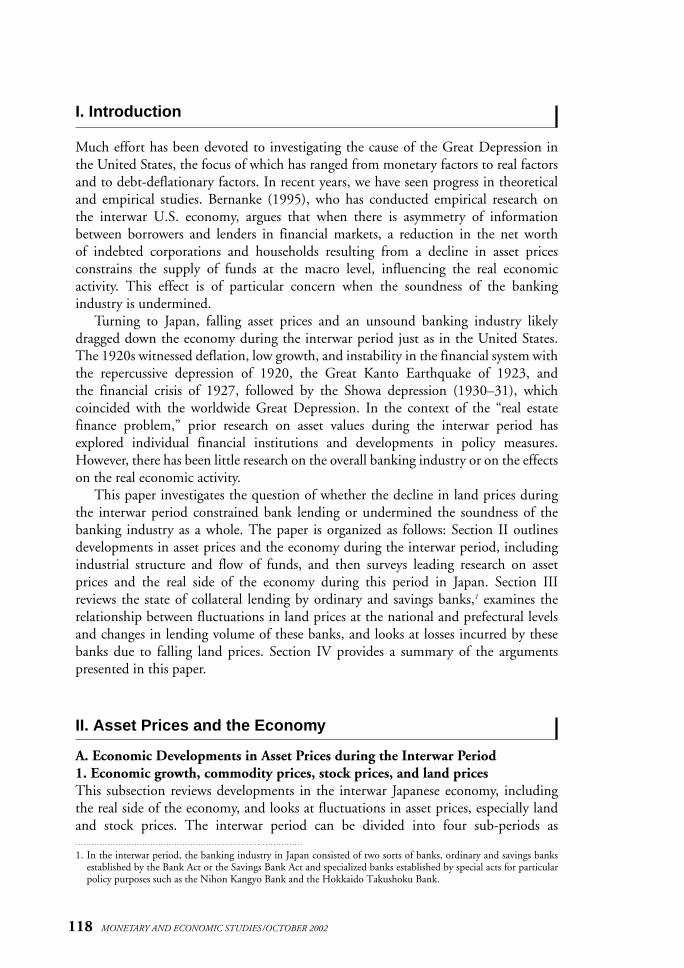
I. Introduction
Much effort has been devoted to investigating the cause of the Great Depression inthe United States, the focus of which has ranged from monetary factors to real factorsand to debt-deflationary factors. In recent years, we have seen progress in theoreticaland empirical studies. Bernanke (1995), who has conducted empirical research onthe interwar U.S. economy, argues that when there is asymmetry of informationbetween borrowers and lenders in financial markets, a reduction in the net worth of indebted corporations and households resulting from a decline in asset prices constrains the supply of funds at the macro level, influencing the real economic activity. This effect is of particular concern when the soundness of the bankingindustry is undermined.
Turning to Japan, falling asset prices and an unsound banking industry likelydragged down the economy during the interwar period just as in the United States.The 1920s witnessed deflation, low growth, and instability in the financial system withthe repercussive depression of 1920, the Great Kanto Earthquake of 1923, and the financial crisis of 1927, followed by the Showa depression (1930–31), which coincided with the worldwide Great Depression. In the context of the “real estatefinance problem,” prior research on asset values during the interwar period hasexplored individual financial institutions and developments in policy measures.However, there has been little research on the overall banking industry or on the effectson the real economic activity.
This paper investigates the question of whether the decline in land prices duringthe interwar period constrained bank lending or undermined the soundness of thebanking industry as a whole. The paper is organized as follows: Section II outlinesdevelopments in asset prices and the economy during the interwar period, includingindustrial structure and flow of funds, and then surveys leading research on assetprices and the real side of the economy during this period in Japan. Section IIIreviews the state of collateral lending by ordinary and savings banks,1 examines therelationship between fluctuations in land prices at the national and prefectural levelsand changes in lending volume of these banks, and looks at losses incurred by thesebanks due to falling land prices. Section IV provides a summary of the argumentspresented in this paper.
II. Asset Prices and the Economy
A. Economic Developments in Asset Prices during the Interwar Period1. Economic growth, commodity prices, stock prices, and land pricesThis subsection reviews developments in the interwar Japanese economy, includingthe real side of the economy, and looks at fluctuations in asset prices, especially landand stock prices. The interwar period can be divided into four sub-periods as
118 MONETARY AND ECONOMIC STUDIES/OCTOBER 2002
1. In the interwar period, the banking industry in Japan consisted of two sorts of banks, ordinary and savings banksestablished by the Bank Act or the Savings Bank Act and specialized banks established by special acts for particularpolicy purposes such as the Nihon Kangyo Bank and the Hokkaido Takushoku Bank.

described by Nakamura (1989): the boom period around World War I (WWI), theperiod of deflation during the 1920s, the period of global depression at the beginningof the 1930s, and the period of recovery and growth after 1932 (the period of theTakahashi Economic Policy) (Table 1 and Figure 1).
119
Developments in Land Prices and Bank Lending in Interwar Japan: Effects of the Real Estate Finance Problem on the Banking Industry
Table 1 Real GNP, GNP Deflator, Asset Prices, and Bank Lending in Interwar JapanPercent, except as indicated
Real GNP Annualized Annualized Annualized percentage percentage
Annualized Annualized percentage change in change in Amount percentage percentage change in lending by local bank of the Annualized change in change in agricultural ordinary lending
final year percentage Individual Capital GNP stock land prices and (excluding (¥ billions) change consumption investment Others deflator prices (rice savings the five
paddies) banks largest banks)
1913–19 11.4 5.4 4.5 14.9 3.5 12.2 10.6 13.2 22.2 21.6 1920–29 13.7 1.8 2.3 –3.2 3.5 –1.3 –6.5 –3.0 0.7 –0.4 1930–31 13.9 0.8 1.4 –10.2 3.7 –10.3 –14.8 –12.0 –4.0 –5.9 1932–36 18.7 6.1 2.8 15.4 20.1 1.5 6.0 1.3 –0.2 –3.1Sources: Ohkawa et al. (1974); Fujino and Akiyama (1977); Takamatsu (1966); Goto (1970).
Figure 1 Stock Prices and Land Prices in the Interwar Japan
120
100
80
60
40
20
01910 15 20 25 30 35 40
Stock pricesUrban land prices (residential)Agricultural land prices (rice paddies)
1919 = 100
Sources: Fujino and Akiyama (1977); Takamatsu (1966); Committee for Compiling the One-Hundred-Year History of the Bank of Japan (1986).
In the boom period (1913–19) around WWI, an increase in the export of textilesto Asia and North America and the emergence of the heavy and chemical industriesresulting from reduced imports from the United States and Europe fueled real eco-nomic growth. Domestic prices rose significantly, reflecting tight demand in domesticand overseas markets and rising prices in international commodity markets. Thoughthe economy temporarily backtracked following the end of the war, it rebounded inmid-1919, owing to increases in domestic demand led by consumption and investmentand in overseas demand associated with economic restoration in Europe. Along with

the economy, stock prices rose by 22 percent in 1915 and by 74 percent in 1916 overthe previous year. After falling slightly in 1917–18, stock prices rebounded in 1919 toa level 2.1 times that of 1913.2 Agricultural land prices (rice paddies) declined during1913–15, rose in 1916–19, and in 1919 reached a level 2.4 times that of 1913.3 Urbanland prices (residential) followed a modestly increasing trend during 1914–17, andthen rose significantly in 1918–19, attaining in 1919 a level 4.2 times that of 1913.4
The 1920s (1920–29) witnessed low real economic growth and instability in thefinancial system, with the repercussive depression (1920) resulting from a decline inexports, the destruction caused by the Great Kanto Earthquake in 1923, and thefinancial crisis of 1927. The low real economic growth in this period is referred to as “chronic recession” by some observers (Ouchi [1962]). Nevertheless, domesticdemand rose steadily, driven by the growth in heavy and chemical industries, byinvestments in infrastructure including electric power, railroads, and telecommunica-tions, and by rapid urbanization. Domestic prices declined slightly in the first half of the 1920s and substantially in the latter half of the 1920s, as commodity prices fell in international markets and international supply capacity grew with postwarreconstruction. Stock prices began to fall in 1920, and by 1922 declined to 58 percent of their peak values in 1919. They were flat during 1923–24, increasingslightly in 1925–26, before falling thereafter. During this period, agricultural landprices were in overall decline, and had fallen to 74 percent of their peak in 1919 by1929. During the first half of the 1920s, urban land prices fell overall, then rose in1926–27 before falling again, so that the 1929 level was 87 percent of the 1919 level.
In the wake of the Great Depression, the years 1930–31 witnessed the appreciationof exchange rates, which accompanied the lifting of the gold embargo and resulted ina receding economy. The rate of real economic growth plunged and commodity pricesfell dramatically in this period. In 1930, stock prices fell by 34 percent from the previous year, before increasing by 10 percent in 1931. Meanwhile, agricultural landprices fell by 7 percent from the previous year in 1930 and by 17 percent in 1931.5
During the recovery and growth period in 1932–36, the rate of real economicgrowth rose, with commodity prices beginning to rise as well, due to the Takahashi
120 MONETARY AND ECONOMIC STUDIES/OCTOBER 2002
2. Stock price indexes are from Fujino and Akiyama (1977). These stock indexes are a composite of 76 stocks listedon the Tokyo Stock Exchange in industries including coal mining, oil, fisheries, railroads, marine transportation,gas, electric, cotton spinning, foodstuffs, chemicals, utensils, banking, insurance, stock exchange, and others.Estimates are made by the Fisher formula, using 1934–36 transaction volumes as weight, with each stock pricestandardized according to the 1934–36 level.
3. Agricultural land prices are based on long-term estimates made by Takamatsu (1966). While agricultural landincludes plowed fields as well as rice paddies, this paper focuses its analysis on the prices of rice paddies. On thispoint, Hashimoto (1994) analyzes land prices during the period 1913–41, based on Sales Prices of AgriculturalLand and Rents by the Nihon Kangyo Bank, and comments that price fluctuations for rice paddies and plowedfields are similar, and that there is no year during which the direction of price movements differed between ricepaddies and plowed fields. Thus, he concludes that the factors determining the prices of rice paddies and plowedfields are the same.
4. Urban land prices are average residential land sales prices in the six major metropolitan areas of Tokyo, Kyoto, Osaka, Yokohama, Kobe, and Nagoya as given in publications from the Committee for Compiling the One-Hundred-Year History of the Bank of Japan (1986). Figures are computed for the period 1913–30.
5. Statistics for urban land prices after 1936 are available from the Japan Real Estate Institute, but there are few statistics available for the period 1931–36, and details are unclear. In a study by the Nihon Kangyo Bank (1953),the average land price index for the districts in the city of Tokyo (computed by the bank) was 84 in 1930, 67 in1931, 69 in 1932, and 65 in 1933. Accordingly, land prices in the area fell by more than 20 percent in 1931, butwere almost flat in 1932–33.

Economic Policy, which conducted an exchange rate policy featuring the free depreciation of the yen, lower interest rates, and increased government expenditures.Stock prices increased, so that they were up by 34 percent in 1936 compared to thelevel of 1931.6 Agricultural land prices bottomed out in 1933, and by 1936 they hadrisen to 13 percent above the 1933 level.
In summary, the boom period around WWI witnessed rising real GNP, com-modity prices, and asset prices. During the 1920s, real GNP continued to grow,whereas commodity prices and asset prices fell. At the start of the 1930s, commodityprices and asset prices plunged, whereas real GNP remained roughly flat. In the ensuing period of recovery and growth beginning in 1932, commodity prices andasset prices rebounded, and real GNP increased.2. Changes in the industrial structureIt is useful to look at the characteristics of and changes in the industrial structure andfinancial intermediations in order to properly assess the relationship between assetprices and the real economic activity. Ohkawa et al. (1974) estimates net domesticproduct by industry for the prewar and interwar period.7 Prior to WWI, the “agricul-tural, forestry, and fishery industries” and “commercial and service industries” eachaccounted for more than 30 percent, whereas “mining and manufacturing industries”totaled only 20 percent (Table 2). The “commercial and service industries” included large numbers of traditional domestic wholesale and retail businesses in addition to trading companies owned by the zaibatsu. From 1928, the proportion of the mining and manufacturing industries exceeded that for the agriculture, forestry, and fishery industries. The 1920s witnessed increasing proportions for “transportation, telecommunications, and public utilities industries,” led by the electric power andtelecommunications industries. The contribution of mining and manufacturingindustries further increased in the 1930s, and such trends became especially marked inthe latter half of the 1930s during the transition to a wartime economy.
121
Developments in Land Prices and Bank Lending in Interwar Japan: Effects of the Real Estate Finance Problem on the Banking Industry
Table 2 Percentage Distribution of Net Domestic Product by Industry in Japan
Percent, except as indicated
Net domestic Agricultural, Transportation,product forestry, and Mining and telecommunications, Commercial
(¥ billions) fishery manufacturing and public utilities and service
industries industries industries industries
1910 3.6 30.8 20.4 6.3 33.1
1915 4.6 27.8 24.4 7.4 32.0
1920 13.6 29.5 23.5 7.8 32.0
1925 15.5 26.9 20.5 10.2 32.6
1930 13.0 16.6 24.2 12.2 35.7
1935 16.4 17.3 29.0 9.8 33.5
1940 35.6 18.3 38.6 6.9 26.0
Source: Ohkawa et al. (1974).
6. During this period, the total market value of the stocks listed on “long-term settlement” section of the TokyoStock Exchange increased approximately threefold, from ¥2.6 billion at the beginning of 1931 to ¥7.6 billion atthe beginning of 1937, owing to a rise in stock prices and the increased number of listed stocks.
7. Ohkawa et al. (1974) does not estimate the gross domestic product by industry due to inaccuracy of data.

Shinohara (1972) calculates the value of production by sectors in the manufac-turing industry. Prior to WWI, the majority of production was light manufacturing,including food products and textiles. The proportion of textiles continued to increasein the first half of the 1920s, but industries such as chemicals and steel increasedtheir proportion in the latter half of the 1920s. In the 1930s, the proportion of foodproducts and textiles declined, whereas the proportion of both steel and machineryincreased rapidly (Table 3).
3. Finance in the private sectorIn their estimate of the flow of funds in the interwar period, Fujino and Teranishi(2000) show that “borrowings” totaled over 60 percent of the overall private sectorfund-raising in 1915, followed by “securities,” which was over 30 percent. Thereafter,the proportion of securities gradually increased, pulling ahead of borrowings in thelatter half of the 1920s (Figure 2).
It is difficult, however, to establish a convincing interpretation of private financing,as no statistics exist that provide a breakdown of corporate and household financing.Past analyses utilize mainly individual statistics and materials, such as financial statements of corporations and farm-household surveys. The views in such analysesvary depending on the perspective of the observers, as well as the statistics and materials used. Leading research on corporate financing can be divided into two major categories: the direct financing view and the indirect financing view. For the former, Okazaki and Okuno (1993) assert that the primary source for funds had been direct financing through the issuance of stocks or bonds on the open market, and that corporate capital demand was met primarily by borrowings from financialinstitutions only after around 1936. Kataoka and Teranishi (1996) also state that corporations prior to the World War II (WWII) period raised funds primarily throughdirect financing via the securities market, and that the proportion of funds by indirectfinancing through banks was small.8 On the other hand, for the latter, Ishii (1997)
122 MONETARY AND ECONOMIC STUDIES/OCTOBER 2002
Table 3 Percentage Distribution of Industrial Production by Industry in Japan
Percent, except as indicated
Industrialproduction Food
Textiles Chemicals SteelNonferrous
Machinery(¥ billions) products metals
1910 2.0 34.0 33.6 11.4 1.8 1.6 6.5
1915 2.8 27.2 33.1 11.8 4.5 3.8 9.3
1920 9.5 23.9 34.3 12.4 4.6 1.9 14.5
1925 10.1 25.6 39.4 10.1 4.4 2.0 7.2
1930 8.8 25.0 30.6 12.8 6.2 2.5 11.3
1935 14.9 16.4 29.1 14.4 10.0 2.8 16.3
1940 33.2 12.2 16.8 16.6 14.0 2.4 25.9
Source: Shinohara (1972).
8. In regard to the function of capital markets, Teranishi (1989) observes that some companies could finance throughthe capital markets (companies such as the rising zaibatsu, which were active in the heavy and chemical industries inwhich the minimum capital requirements were large, and electrical companies, which raised funds from the

emphasizes the importance of the indirect financing. He points out that shareholdersdepended on borrowings from banks for their capital payments, and that banks hadpurchased corporation bonds extensively.9
There was heavy borrowing in the private sector, which consists of householdsengaged in the agricultural, forestry, and fishery industries (the primary interwarindustries) and also includes those engaged in commercial and handicraft industriesas subsidiary businesses. It is likely that they borrowed mainly from specializedbanks and local ordinary and savings banks, as well as through the granting of creditbetween individuals.
B. Leading Empirical Research on the Relationship between Asset Prices and the Real Economic Activity
Much research has been conducted on the relationship between asset values and thereal economic activity. This subsection takes up exclusively those issues related tofluctuations in asset values during the interwar period, and in particular, the effects offalling stock prices and land prices on the real economic activity after WWI.
Land prices and stock prices affect the real economic activity, possibly throughcredit rationing effects and wealth effects. Credit rationing effects refer to the processin which fluctuations in asset prices affect collateral values and consequently affect
123
Developments in Land Prices and Bank Lending in Interwar Japan: Effects of the Real Estate Finance Problem on the Banking Industry
Figure 2 Funding Patterns in the Private Sector in Japan
70
60
50
40
30
20
10
01900 05 10 15 20 25 30 35 40
Percent
Securities Stocks Borrowings Investments
Source: Fujino and Teranishi (2000).
European and U.S. markets using foreign currency-denominated bonds). Teranishi argues that the growth of capital markets was promoted by increasing demand for securities by middle-class households. However, he notesthat since the issuers tended to avoid disclosure of information, the growth of the securities markets was limited.
9. Ito (1995) notes the importance of “stock collateral financing” of banks to individual stockholders; this served as a kind of “detour funding” from the banks to the corporations through the individual stockholder. However,Hoshi and Kashyap (2001) argue that even if the banks actually provided the funds by means of stock collateralfinancing, the stockholders controlled the activities of the borrowing corporations, so that there was no differencewith direct financing in terms of corporate governance.

the constraints on expenditures of corporations or individuals. This includes cases inwhich banks hold nonperforming loans, thereby putting constraints on new lendingand reinforcing the collection of past loans. On the other hand, wealth effects refer to the process in which prices of assets held by individuals or corporations fluctuateand affect decisions of corporations concerning capital investment and decisions ofindividuals concerning consumption and housing investment.1. Credit rationing effectsA good deal of research has focused on credit rationing effects in relation to lendingby local banks and farm household expenditures during the interwar period in Japan.For example, Takahashi (1955) argues that, during the Showa depression of the early1930s, farm households were unable to finance their agricultural production due to ashortage of collateral resulting from depressed land prices, which led to reductions inincome and consumption of the households. Asakura (1988) cites the expandingbank losses stemming from the decline in value of collateral properties as a reason forbank runs and failures of local banks after the repercussive depression of 1920. Ito(1983a) and Takeda (1983) conclude that the Great Kanto Earthquake in 1923 andthe financial crisis in 1927 entailed the concentration of deposits at the five largestbanks, constraining funds in rural areas.
A series of studies on the real estate finance problem have explored the effects offalling asset prices on bank lending. Ito (1983b) describes the real estate finance prob-lem as a problem over how to resolve overdue loans collateralized by real estate, an issuethat gradually became a serious problem for the Nihon Kangyo Bank, agri-industrialbanks, and ordinary banks in the 1920s. The real estate financial problem had been recognized as early as the 1910s. The nationwide bankers’ meeting in 1917 decided tosubmit a request to the Diet for liquidation of real estate collateral. The goal of therequest was to prepare for liquidity emergencies through mutual consultation amongbanks including ordinary banks, the Nihon Kangyo Bank, and agri-industrial banks.At that time, the government imposed a tentative administrative guidance restrictingloans collateralized by real estate, but the problematic loans continued to grow. Thefinancial crisis of 1927 called for an urgent liquidation of real estate, both for banks and for small and medium-sized corporations, all of which faced financial difficulties.The Nihon Kangyo Bank, the Japan Chamber of Commerce, and others from the business community offered various proposals, and the government established a newfacility to refinance loans collateralized by real estate. Based on the report of theFinancial System Research Committee in 1930, the government enacted the MortgageCertificate Act in 1931, and the Real Estate Financing and Loss Indemnification Actin 1932. Nevertheless, Murakami (1983) concludes that, because the government wasunable to produce an effective policy for improvement, the problems were resolved onlyafter an increase in real estate prices following the transition to a wartime economy.
A number of case studies on the real estate finance problem have been conducted.Shindo (1977) examines bad loans at local banks and finds that the banks refrainedfrom making new loans and sought to collect outstanding loans.10 Asakura (1978)
124 MONETARY AND ECONOMIC STUDIES/OCTOBER 2002
10. Shindo (1977) also points out that many local banks took consolidation as a measure for disposing of nonperformingloans and strengthening management, leading to difficulty in small and medium-sized companies’ finances.
asserts that banks tightened conditions on loans collateralized by real estate in light ofincreasing nonperforming loans, altering the traditional attitude toward real estatecollateral that had prevailed since the Meiji Period (1868–1912). Ueda (1983) examines the disposition and its effects of nonperforming loans at the Agri-IndustrialBank of Hiroshima Prefecture in 1928–32. Hashimoto (1995) reviewed the disposi-tion of overdue loans collateralized by real estate by the Nihon Kangyo Bank whenland prices bottomed out in the first half of the 1930s.2. Wealth effectsThere have been virtually no explicit analyses of the wealth effects caused by the declinein asset prices after WWI. Nevertheless, stock prices could have affected expendituresof landowners, given that the landowners invested in financial assets such as stocks outof their revenue from rental and commodities sales such as rice and silk.
III. The Relationship between Land Prices and Bank Lendingduring the Interwar Period
This section examines the relationship between fluctuations in land prices and bank lending. While the effects of stock price fluctuations on capital investment andthe wealth effects are important in analyzing the effects of asset price fluctuations on the real economic activity, I will concentrate the present analysis on land pricesand bank lending.
Bernanke (1995) and other leading researchers on the Great Depression in theUnited States suggest two primary channels by which a decline in land prices constrains bank lending. First, a decline in land prices reduces the net worth of borrowers and/or the collateral values of real estate owned by borrowers, and harmsthe borrowers’ credibility in the financial market. Second, losses incurred by banksfrom the decline in the collateral value of real estate may decrease the risk-takingcapacity of banks.
This section employs several empirical analyses in an effort to examine these twochannels. First, it reviews the use of real estate as collateral. Second, it performs aregression analysis to estimate the loan supply function of banks with land prices asan explanatory variable, and investigates the relationship between fluctuations in land prices and changes in the lending at the prefectural level. Third, based on thenonperforming-loan and loss data of the Nihon Kangyo Bank in the 1930s, it calculates the potential losses incurred in the banking industry due to the decline inland prices to look at the risk-taking capacity of the banking industry.
A. Loans at Ordinary and Savings BanksGoto (1970) classifies loans at ordinary and savings banks into six categories by collateral type.11 According to his study, prior to WWI, the proportion of loans with
125
Developments in Land Prices and Bank Lending in Interwar Japan: Effects of the Real Estate Finance Problem on the Banking Industry
11. The categories are loans with collateral of “governmental bonds and municipal bonds,” “stocks,” “foreign bonds,corporate bonds, and others,” “land, housing, and other real estates,” “products, shipping and others,” and loanson “guarantees and credit.” Loans on “guarantees and credit” at savings banks include loans to depositors without

real estate collateral represented as land, housing, and other real estate was the largestcategory, amounting to over 30 percent. During WWI, the proportion of loans withstocks increased significantly, and the proportion of loans with land, housing, andother real estate declined (Table 4). The proportion of loans with land, housing, andother real estate recovered in the 1920s, while stock proportions declined. This situation was reversed in the first half of 1930s, as stock proportions increased andland, housing, and other real estates proportions declined. From the 1920s onward,the proportion of loans on guarantees and credit was always above 30 percent.12 Inmany cases, local banks in rural areas primarily accepted real estate as collateral inlending because there were few candidates for collateral other than real estate.Meanwhile large banks in urban areas presumably relied less on real estate collateral.13
126 MONETARY AND ECONOMIC STUDIES/OCTOBER 2002
Table 4 Loans of Ordinary and Savings Banks by Type of Collateral in Japan
Percent, except as indicated
GovernmentalForeign
Land,bonds and
bonds, housing,
Products,Guarantees
Loan
municipalStocks corporate
and other shipping,
and creditamount
bondsbonds, and
real estateand others (¥ millions)
others
1910 5.5 22.2 1.5 35.3 9.1 26.4 6651915 3.3 21.5 2.9 39.4 6.8 26.1 9171920 1.8 31.8 3.7 15.4 11.5 35.9 5,9541925 2.6 27.1 5.5 21.1 8.2 35.4 7,4241930 3.3 21.3 7.4 24.6 6.2 37.2 6,8661935 4.4 26.4 13.4 18.6 3.7 33.5 6,032
Note: A statistical discontinuity exists between the period up to 1915 and the period thereafter. Up to 1915, “loanson bills” were not included in “loan” statistics, and were reckoned as a type of “bills discounted”; from 1916on, “loans on bills” were included in “loans.”
Source: Goto (1970).
There are several views regarding the background of the changes in the proportionof stock collateral lending and real estate collateral lending. Hashimoto (1995, 2000)argues that loans with real estate collateral increased as a result of higher land prices around the time of WWI, and that land prices fell less in the 1920s relative to stock prices, encouraging the use of real estate as collateral. On the other hand,Ishii (2001) concludes that loans collateralized by stock increased due to rising stock prices around the time of WWI, and that borrowers offered real estate as additionalcollateral in the event of plunging stock prices in the 1920 depression, especially to
explicit collateral. A statistical discontinuity exists between the period up to 1915 and the period thereafter. Up to 1915, “loans on bills” were excluded from “loans” and were reckoned as a type of “bills discounted.”
12. Bills were usually discounted on “guarantees and credit.” For example, bills discounted on “guarantees andcredit” accounted for 93.2 percent of the total, ¥1.4 billion, at ordinary and savings banks in 1920. The figuresfor “loans” do not include bills discounted. Accordingly, the sum of loans and bills discounted is supposed tohave a larger weight of “guarantees and credit,” whereas the weight of other collateral decreases.
13. It should also be noted that there were tiers based on the level of capital amounts. Shindo (1977) finds that, in1926, the proportion of real estate collateral at banks having official capital of ¥2 million or more was 15 percent,whereas that at banks having official capital of less than ¥2 million was 34 percent.

local banks. According to Eiichi Baba, head of the Nihon Kangyo Bank at that time,many farmers during the boom years after WWI invested in stock by borrowing withland collateral (Baba [1935]).
Real estate also served as implicit collateral for “guarantees and credit” loans during the interwar period. Shindo (1977) notes that stock and real estate commonlyserved as latent collateral for credit loans, and that when repayment of a loan fell inarrears, real estate was provided as final collateral to preserve a claim even though itwas initially made in credit.
B. The Relationship between Land Prices and Bank Lending1. Nationwide trendsIn the interwar period, volumes in lending (the sum of “loans” and “bills dis-counted”)14 and prices of agricultural land show similar developments. Figure 3 showsyear-on-year percentage changes in lending by ordinary and savings banks and year-on-year percentage changes in agricultural land prices from 1913 to 1936.When land prices declined from 1913 to 1915, increases in volumes of bank lending lessened. In 1916, the land prices and the volumes of lending picked up and showedsubsequent increases from 1917 to 1919. Due to the repercussive depression, in the
127
Developments in Land Prices and Bank Lending in Interwar Japan: Effects of the Real Estate Finance Problem on the Banking Industry
Figure 3 Agricultural Land Prices (Rice Paddies) and Bank Lending in Japan
80
60
40
20
0
–20
–401913 18 23 28 33
Year-on-year percentage change
Agricultural land prices (rice paddies)Lending by ordinary and savings banksLending by ordinary and savings banks (excluding the five largest banks)Lending by ordinary, savings, and real estate banks
Sources: Takamatsu (1966); Goto (1970).
14. There is no statistical discontinuity (referred to in Footnote 12) in this subsection unless otherwise indicated as “lending” includes “bills discounted.”

first half of the 1920s the land prices turned down and the volumes of lendingshowed a sharp decline in the growth rate. Both generally decreased from the latterhalf of the 1920s to the beginning of the 1930s.15,16 Presumably, lending volumeswere affected by land prices through the use of real estate either as explicit collateralfor lending, or as implicit collateral of guarantees and credit loans.
The two variables, land prices and bank lending, moved differently in some cases.For example, land prices increased in 1922 and 1926, while increases in bank lendingweakened in 1922 and bank lending declined in 1926. In 1931, lending continuedto decline slightly, while land prices fell significantly.
This study applies a similar analysis to different data categories of bank loans.During the interwar period, real estate banks consisting of the Nihon Kangyo Bank,agri-industrial banks, and the Hokkaido Takushoku Bank, as well as ordinary andsavings banks, provided real estate collateral loans to individuals in the agricultural,commercial, and industrial sectors. The sum of the lending by these specialized banks(or real estate banks) and that of ordinary and savings banks shows almost the samedevelopments as the lending by ordinary and savings banks alone.17
Ordinary and savings banks consisted of the five largest banks (Mitsui,Mitsubishi, Daiichi, Yasuda, and Sumitomo) with a low proportion of real estate collateral lending and local banks with a high proportion. Lending by local banksfluctuated in almost the same manner as the lending by ordinary and savings banksas a whole, while the rate of change after the middle of the 1920s was lower than thatof ordinary and savings banks as a whole.
This study embarks on a closer examination of this by conducting a regressionanalysis to estimate loan supply function for the period between 1913 and 1936. Theestimate uses year-on-year percentage changes of bank lending (L ) as a dependent
128 MONETARY AND ECONOMIC STUDIES/OCTOBER 2002
15. The coefficient of the dynamic cross-correlation between year-on-year percentage changes of agricultural landprices and year-on-year percentage changes of lending by ordinary and savings banks is highest (0.795) when thetime difference is zero (see table below).
16. For the period 1914–30, the correlation coefficient between year-on-year percentage changes of urban land pricesand year-on-year percentage changes of lending by ordinary and savings banks was 0.539.
17. Lending by ordinary, savings, and real estate banks totaled ¥8.37 billion in 1933, including ¥6.08 billion by ordinary banks, ¥0.34 billion by savings banks, ¥1.07 billion by the Nihon Kangyo Bank, ¥0.65 billion by agri-industrial banks, and ¥0.20 billion by the Hokkaido Takushoku Bank.
Dynamic Cross-Correlation between Year-on-Year Percentage Changes in Agricultural Land Prices
and Bank Lending in Japan
Lending by ordinary and Lending by ordinary, savings, savings banks and real estate banks
Land price precedent–3 –0.032 0.000 –2 0.130 0.168 –1 0.385 0.408
0 0.795 0.799 1 0.602 0.567 2 0.382 0.338 3 0.237 0.214
Lending precedent
Sources: Takamatsu (1966); Goto (1970).

variable and interest rates (i ), year-on-year percentage changes of land prices (P ),year-on-year percentage changes of equity capital of banks (C ), and year-on-year percentage changes of deposits (D ) as explanatory variables.18,19
Lt = α + βit + γPt + δCt + εDt .
Bank lending (L ) is represented by the sum of ordinary and savings bank lendingincluding bills discounted. Interest rate (i ) is represented by interest rates for loans ondeeds.20 Land price (P ) is represented by agricultural land prices as estimated byTakamatsu (1966). Equity capital (C ) is represented by the sum of paid-in capitaland reserves at ordinary and savings banks. Deposit (D ) is represented by the sum ofdeposits, savings, and periodic deposits at ordinary and savings banks. The estimate isbased on the two-stage least-squares method, as the ordinary least-squares methodwould bias the results (a bias known as a “simultaneous equation bias”) in estimatingsimultaneous equations comprised of a supply function and a demand function.Instrument variables include the constant α , year-on-year percentage changes of agricultural production, those of manufacturing production, and one-period lags of explanatory variables (interest rate, i, year-on-year percentage changes of landprices, P, those of equity capital, C, and those of deposits, D ).
The results of estimation are shown in Table 5. Coefficients for year-on-year percentage changes of land prices, equity capital, and deposits are positive and statistically significant, whereas the coefficient for interest rates, although positive, is not significant.21 Estimation of a loan supply function for ordinary, savings, and real estate banks yields almost the same results.22 These estimation results suggestthat bank lending was constrained as a result of the fall in land prices during the interwar period. Still, a more rigorous interpretation is required, and it demandsan examination of other factors affecting bank lending and refinement of methods of estimation.23
129
Developments in Land Prices and Bank Lending in Interwar Japan: Effects of the Real Estate Finance Problem on the Banking Industry
18. Loan demand function is estimated with explanatory variables consisting of loan interest rates, year-on-year percentage changes of agricultural production, and year-on-year percentage changes of manufacturing production.Agricultural and manufacturing production data come from Ohkawa et al. (1974).
19. There are few studies estimating a loan supply function in the interwar period. Teranishi (1991) estimates a loansupply function for informal credit by using data of individual prefectures.
20. Interest rates are represented by the rates on loans ranging between ¥500 and ¥10,000 with a contract term ofless than three months and collateralized by securities and products.
21. In regard to the loan demand function, the two-stage least-squares estimate is conducted using year-on-year percentage changes of land prices, equity capital, deposits, and the one-period lags of the explanatory variables(interest rates, year-on-year percentage changes of agricultural production and manufacturing production) asinstrument variables. The coefficient for the year-on-year percentage changes of agricultural production is positive and statistically significant. Although the coefficients for interest rates and the year-on-year percentagechanges of manufacturing production are positive, they are not statistically significant.
22. As real estate banks depended heavily on bonds as a means of financing, in addition to my estimation using the year-on-year percentage changes in the sums of deposits, I also examine changes in the sums of bonds anddeposits. The results are almost the same as presented here on the sums of deposits.
23. Further investigation is required in regard to the determination of formulas for loan supply functions and loandemand functions, as well as the selection of interest rates variables.

2. Analyses by individual prefecturea. The use of collateral in rural areas and cities by individual prefectureAmong the 47 prefectures of Japan, there were significant differences in the develop-ment of bank lending and land prices, and the use of real estate as collateral in theinterwar period. In this subsection, all 47 prefectures are classified as either rural orurban. In one group, agricultural land was used as primary collateral, while in theother urban land was used more than agricultural land as collateral.
There are no statistics to distinguish loans collateralized by agricultural land and those by urban land. However, the Nihon Kangyo Bank categorized real estateloans by “rural areas” and “cities” in Statistics on Japanese Real Estate Financing, andexamination of this can yield a rough proportion between agricultural land and residential land. Presumably, agricultural land served as primary collateral in ruralareas, while residential land served as that in cities. In 1927, loans in rural areasaccounted for 52.3 percent and those in cities accounted for 47.7 percent of thenationwide loans collateralized by real estate. There were significant differences byprefecture. Among 47 prefectures, the proportion for cities was highest in Tokyo(94.6 percent), Osaka (82.3 percent), Hyogo (64.1 percent), Aichi (61.9 percent),and Kyoto (61.8 percent). Each of these five prefectures, plus Kanagawa, containsone of six biggest cities: the city of Tokyo in Tokyo, the city of Osaka in Osaka, thecity of Kobe in Hyogo, the city of Nagoya in Aichi, the city of Kyoto in Kyoto, andthe city of Yokohama in Kanagawa. In contrast, the proportion for rural areas wasgenerally high in the remaining 41 prefectures, with the proportion for rural areashighest in Akita (90.8 percent), Iwate (89.0 percent), Chiba (88.5 percent), Saitama(87.8 percent), and Shimane (86.4 percent). Accordingly, for the 41 rural prefectures,excluding the six urban prefectures, this study investigates the relationship between
130 MONETARY AND ECONOMIC STUDIES/OCTOBER 2002
Table 5 Results of Regression Analysis of Banks’ Loan Supply Function
Estimate equation: L = α + βi + γP + δC + εD(Period of estimation: 1913–36)
Lending by ordinary Lending by
and savings bankscommercial, savings,and real estate banks
Constant (α ) –3.960 (–0.379) –9.885 (–0.964)
Loan interest rates (i ) 1.006 (0.257) 3.710 (0.967)
Land prices (P ) 0.317 (2.901)** 0.345 (3.225)**
Equity capital (C ) 0.253 (2.339)* 0.239 (2.245)*
Deposits (D ) 0.585 (4.741)** 0.472 (3.834)**
Adjusted R2 0.915 0.898
D-W statistic 1.509 1.452
Notes: 1. Figures in parentheses are t -values. The symbols * and ** denote the statistical significanceat the 5 percent and 1 percent levels, respectively.
2. Estimates are made with the two-stage least-squares method, in which the percentagechanges from the previous year in the amount of agricultural and manufacturing productionand the one-period lags of the explanatory variables are used as the instrument variables.
Sources: Ohkawa et al. (1974); Takamatsu (1966); Goto (1970); Ministry of Finance, Banking Bureau,Annual Report of the Banking Bureau (annual editions); Ministry of Finance, FinancialBureau, Reference Book of Financial Matters (annual editions).

loans collateralized by real estate and agricultural land prices, regarding the real estate loans as approximations of loans collateralized by agricultural land. For the sixprefectures with big cities, an analysis was made of the relationship between realestate loans and urban land prices, regarding the real estate loans as approximationsof loans collateralized by urban land.24
b. Panel data analysis and its interpretationsThis subsection employs panel data analysis to examine the relationship betweenbank loans and land prices.25 The dependent variables are year-on-year percentagechanges of bank loans. As sequential data of individual prefectures are not availablefor real estate banks, the loans of ordinary and savings banks represent the bank loansin this analysis. The explanatory variables are year-on-year percentage changes ofagricultural land prices for the 41 rural prefectures, and those of urban land prices forthe six urban prefectures. Land price data of each prefecture are available in theMinistry of Finance’s Annual Report on Statistics of the Taxation Bureau. Average salesprices of rice paddies are used to represent agricultural land prices, and those of resi-dential land are used to represent urban land prices. The estimation period is from1914 to 1930.26 Both a fixed-effect model and a random-effect model were applied tothis analysis.27
Table 6 shows the results of regressions for the 41 rural prefectures. The coeffi-cient of agricultural land prices is positive and statistically significant, indicating that loans and agricultural land prices move in the same direction.28 The statisticallysignificant relationship between agricultural land prices and bank loans in rural prefectures suggests that loans were constrained by the decline in land prices duringthe interwar period in these areas.
Table 7 shows the results of regressions for six urban prefectures. The coefficientof urban land prices is not statistically significant, as in these areas collateral values seem to have had no or little effect on bank lending. The hypothesis is thatloans increased steadily owing to urbanization and industrialization, and/or that real estate served as a small proportion of collateral. However, more detailed and extensiveanalysis is required, and should include various factors that influence loan supply anddemand as well as developments in real estate markets in individual prefectures.
131
Developments in Land Prices and Bank Lending in Interwar Japan: Effects of the Real Estate Finance Problem on the Banking Industry
24. Urban land includes residential land, commercial land, and industrial land, and post-1936 data are available foreach category from the urban land statistics of the Japan Real Estate Institute. However, prior to 1936, there wereno macro-level statistics for the prices of commercial land and industrial land, and their development was onlypartially demonstrated by case studies.
25. The estimated equation here does not represent a loan supply function, but rather indicates the relationshipbetween the observed values of land prices and loans.
26. The equation includes a “statistical discontinuity dummy.” The value of the dummy variable is one for 1916 andzero for other years. Refer to Footnote 10.
27. The fixed-effect model presumes a specific (or fixed) effect associated with each cross-section unit (herein eachprefecture), whereas the random-effect model assumes such an effect as stochastic.
28. The Statistics on Japanese Real Estate Financing issued by the Nihon Kangyo Bank also offers data on agriculturalland prices for individual prefectures (average sales prices per tan , or approximately 991 square meters). Panelestimates based on these data obtain the same results, as the coefficients of agricultural land prices are positiveand statistically significant with both a fixed-effect model and a random-effect model.

C. Estimation of Losses Incurred by the Banking Industry Due to Falling Land Prices
1. Development at the Nihon Kangyo Bank: Overdue loans collateralized by real estate and disposition of collateral
No statistics exist regarding the development of a shortage of real estate collateral as aresult of falling land prices and of the corresponding losses experienced in the bankingindustry as a whole. As a specialized bank, the Nihon Kangyo Bank conducted lendingagainst real estate collateral as its primary business during the interwar period. NihonKangyo Bank (1953) contains data on the bank’s nonperforming loans, losses, and the disposition of real estate collateral from the second half of 1932 to the first half of 1936.29,30
132 MONETARY AND ECONOMIC STUDIES/OCTOBER 2002
Table 6 Results of Panel Data Analysis of Year-on-Year Percentage Changes in Lending by Ordinary and Savings Banks (41 Rural Prefectures)
Coefficient Fixed-effect model Random-effect model
Constant — 5.752 (10.958)*
Dummy variable 47.841 (18.385)* 55.903 (18.764)*
Agricultural land prices (rice paddies) 0.338 (12.902)* 0.332 (11.359)*
Adjusted R2 0.340 0.389
D-W statistic 1.742 1.737
Notes: 1. Figures in parentheses are t -values. The symbol * denotes the statistical significance at the1 percent level.
2. The dummy variable is one for 1916 and zero for all other years.
Sources: Ministry of Finance, Banking Bureau, Annual Report of the Banking Bureau (annual editions);Ministry of Finance, Taxation Bureau, Annual Report on Statistics of the Taxation Bureau(annual editions).
Table 7 Results of Panel Data Analysis of Year-on-Year Percentage Changes in Lending by Ordinary and Savings Banks (Six Urban Prefectures)
Coefficient Fixed-effect model Random-effect model
Constant — 8.196 (1.857)
Dummy variable 168.215 (19.224)* 215.039 (16.774)*
Urban land prices (residential) 0.008 (0.362) 0.009 (0.299)
Adjusted R2 0.694 0.737
D-W statistic 1.982 1.974
Notes: 1. Figures in parentheses are t -values. The symbol * denotes the statistical significance at the1 percent level.
2. The dummy variable is one for 1916 and zero for all other years.
Sources: Ministry of Finance, Banking Bureau, Annual Report of the Banking Bureau (annual editions);Ministry of Finance, Taxation Bureau, Annual Report on Statistics of the Taxation Bureau(annual editions).
29. Hashimoto (1995) examines the overdue credits and the disposition of real estate collateral by the Nihon KangyoBank in the 1930s, using the data from the Nihon Kangyo Bank (1953).
30. Ueda (1983) examines the status of nonperforming loans at the Agri-Industrial Bank in Hiroshima Prefecture by using the bank’s business reports and so forth. Based on these sources, the amount of overdue principal in thelatter half of 1928 totaled 6 percent of the amount to be repaid in the same period, whereas overdue interestaccounted for 13 percent of the loan interest to be paid during the same period. Although there are no data thereafter based on the same sources, presumably, overdue principal and interest rapidly increased. The numberof cases of two or more years overdue at the head office increased from four cases in April 1928 to 39 cases in

The bank’s balance of outstanding loans collateralized by real estate was ¥757 million in the second half of 1932. This amount included overdue principal of¥46 million, or 6.1 percent of the real estate collateral loans (Table 8). The ratio ofoverdue principal rose to 6.6 percent in the first half of 1933, but declined as theeconomy recovered afterwards.
The bank collected some part of the overdue principal by the exercise of securityrights and subsequent auction of real estate collateral. Since the bank believed auctions were not always advantageous, especially if real estate prices had fallen too far (Nihon Kangyo Bank [1953]), auctions were often held only after land pricesbegan to recover from 1932, with auction volume expanding from the second half of1932. However, beginning in the second half of 1934, cases without successful bidsbegan to rise, and, as a result, the bank increased its real estate holdings throughrepossessions due to unsuccessful auctions of real estate collateral. There were 4,564successful auctions between the second half of 1932 and the first half of 1936. Thebank sold real estate collateral corresponding to ¥29 million of loan principal at auctions from the second half of 1932 to the first half of 1936. The total amount ofthe credit balance was ¥34 million, including overdue interest and auction expenses.The appraised value of real estate collateral auctioned was 138 percent of loan principal, while the auction value was 72 percent of the loan principal. The loss fromthe disposition of the real estate collateral amounted to 27.9 percent of the principal,or ¥8 million, while the loss including overdue interest and auction expensesamounted to 44.5 percent of the principal, or ¥13 million. 2. Estimation of the Nihon Kangyo Bank’s overall lossesWhile it is relatively easy to calculate the “realized” losses associated with real estate collateral sold at auction, it is quite difficult to estimate the “potential” lossesassociated with nonperforming loans at any given point in time, such as 1933, whenthere was a peak in the ratio of overdue loans to total loans. This difficulty is due tothe lack of two statistics essential for the estimation of the potential losses: the lossratio for overdue loans (for which the real estate collateral was not yet auctioned),and the loss ratio for the real estate collateral (which failed to be auctioned off ) owned by lenders.31
There are many issues that should be taken into consideration in estimating the loss ratio for overdue loans. When loans were overdue, lenders often waited forthe recovery of borrowers’ financial conditions and did not exercise their securityright immediately if the borrower’s condition seemed likely to improve. Real estatecollateral, which was subject to auction, had been primarily offered by insolvent parties or parties at risk of insolvency. Thus, it is likely that the ratio of potentiallosses for total overdue principal was lower than that of realized losses for the overdueprincipal, the real estate collateral for which was sold at auction. On the other hand,
133
Developments in Land Prices and Bank Lending in Interwar Japan: Effects of the Real Estate Finance Problem on the Banking Industry
April 1930, then to 136 cases in April 1931, and to 223 cases in April 1932 (56 times the number in 1928). Thedeteriorating situation encouraged both collections of loans by auctions of collateral properties and nominalreduction of overdue loans with forbearance lending.
31. This study defines the nonperforming loans as the sum of overdue loans and real estate collateral that failed to beauctioned off. The nonperforming loans at the Nihon Kangyo Bank at the end of 1933 consisted of overdueprincipal of ¥45 million and real estate collateral of ¥3 million.

134M
ON
ETAR
Y AN
D EC
ON
OM
IC ST
UD
IES/O
CT
OB
ER 2002
Table 8 Losses from the Disposition of Real Estate Collateral and Nonperforming Loans of the Nippon Kangyo Bank in the 1930s
Disposition of real estate collateral and resulting losses during the period Nonperforming loans at period-end
Credit balance of
Loan which real Losses from Loss ratio
principal estate auctions of loan Real estate Balance ofof which collateral Auctioned (including principal collateral loans Ratio of Non- Ratio of
real estate was amount of Auctioned interest in (including that failed collateralized Overdue overdue performing non-
collateral auctioned real estate Appraised amount/ arrears and interest in to be by real principal principal loans performing
was (including collateral amount appraised auction arrears and auctioned estate (¥ thousands) (percent) (¥ thousands) loans
auctioned interest in (¥ thousands) (¥ thousands) amount expenses) auction off (¥ thousands) (G) (G)/(F) (H) = (E) + (G) (percent)
(¥ thousands) arrears and (C) (percent) (¥ thousands) expenses) (¥ thousands) (F) (H)/(F)
(A) auction (D) = (B) – (C) (percent) (E)expenses) (D)/(A)
(¥ thousands)(B)
1932(second half) 2,090 2,238 1,665 3,152 52.8 573 27.4 3,512 757,901 46,527 6.1 50,039 6.6
1933(first half)
n.a. n.a. n.a. n.a. n.a. n.a. n.a. 3,688 743,029 48,697 6.6 52,385 7.1
1933(second half)
3,268 3,441 2,163 4,749 45.5 1,278 39.1 3,738 717,534 45,680 6.4 49,418 6.9
1934(first half) 2,996 3,587 2,259 4,846 46.6 1,328 44.3 3,822 681,729 41,281 6.1 45,103 6.6
1934(second half) 4,422 5,469 3,336 6,299 53.0 2,133 48.2 5,731 689,587 40,420 5.9 46,151 6.7
1935(first half) 6,465 7,925 4,741 8,733 54.3 3,184 49.2 7,551 665,731 33,581 5.0 41,132 6.2
1935(second half) 5,781 5,996 3,707 6,918 53.6 2,289 39.6 8,500 661,854 29,847 4.5 38,347 5.8
1936(first half) 4,957 6,290 3,746 6,658 56.3 2,544 51.3 10,032 647,635 27,574 4.3 37,606 5.8
Total 29,979 34,946 21,617 41,355 52.3 13,329 44.5 42,886 — — — — —
Notes: 1. The total does not include the first half of 1933.Notes: 2. The first half covers January to June, and the second half covers July to December.
Source: Data prepared by the Nippon Kangyo Bank (1953).

the auctions tended to fail if the market value of the real estate collateral was low.Thus, the ratio of potential losses for real estate owned by lenders due to unsuccessfulauction could be higher than that of realized losses by disposition of real estate collateral through auction.
If the loss/principal ratio (loss divided by corresponding principal) of all non-performing loans is assumed to be the same as that of the overdue principal with collateral successfully sold at auction, the potential total loss can be roughly estimatedat ¥19 million at the end of 1933.32 Although this amount exceeds the bank’s 1933net profit of ¥12 million, it amounts to 11 percent of its stockholders’ net accounts,which totaled ¥171 million (capital plus reserves and profits minus unpaid capitaland losses).3. Outlook for ordinary and savings banksIn this subsection, I extend our analysis to ordinary and savings banks. Unlike thecase with the Nihon Kangyo Bank, there are no statistics on nonperforming loansand collateral dispositions for these banks, so I provide here an estimate of the lossesof these banks by referring to the data of the Nihon Kangyo Bank. Assuming that theoverdue ratio to total outstanding loans and loss ratio for overdue loans were thesame as for the Nihon Kangyo Bank, the potential loss amount can be estimated at¥36 million at the end of 1933, when the overdue ratio reached its peak. At thattime, the real estate loans amounted to ¥1.37 billion.33
In an examination of the equity capital of ordinary and savings banks, it is necessary to look at other factors that could affect their equity capital, such as thecollateral shortage for loans secured by other property or personal guarantees. It is generally accepted that real estate appraisals by the Nihon Kangyo Bank were conducted according to more rigorous standards than ordinary and savings banks,and that the ratio of actual lending to appraised value of collateral was lower than atthese banks. Consequently, the loss amount incurred by ordinary and savings banksmay be underestimated when relying on overdue ratios and loss ratios of the NihonKangyo Bank.
Guarantees and credit loans are a candidate for the source of loss due to decliningland prices. When these kinds of loans become overdue, real estate collateral is typically offered. The ultimate solvency of the borrower and guarantor is supportedby their assets, especially their real estate. As a result, the value of the real estate, particularly the land price, affects the loss amount when guarantees and credit loansbecome nonperforming. When land prices fall, guarantees and credit loans generallygive rise to the same kind of losses as loans collateralized by real estate.
135
Developments in Land Prices and Bank Lending in Interwar Japan: Effects of the Real Estate Finance Problem on the Banking Industry
32. Losses include overdue interest and auction expenses. Since data indicating the disposition of real estate collateralin the first half of 1933 are not available, it is assumed that the loss ratio in 1933 was the same as in the latter halfof the year (39.1 percent). The amount of potential losses at the end of 1933 can be computed by multiplyingthe nonperforming loans (¥49 million) by this ratio.
33. The ratio of the total amount of overdue principal and real estate collateral that failed to be auctioned off was 6.9 percent at the Nihon Kangyo Bank in the latter half of 1933, and the ratio of losses by the disposition of real estate collateral to loan principal was 39.1 percent (including overdue interest and auction expenses). By multiplying these two ratios, the loss/principal ratio is estimated to be 2.7 percent.

Another candidate is the type of loans collateralized by securities, including governmental and municipal bonds, stocks, foreign bonds, and corporate bonds. TheMinistry of Finance’s Annual Report of the Banking Bureau shows the development in these loans. The value of securities used as collateral exceeded the loan amountsduring the interwar period, including the financial crisis of 1927 and the Showadepression of 1930 (Table 9). If one assumes that the value was based on a propervaluation of security and takes into account fluctuations in market value, that meansno loss would be incurred upon the disposition of collateral securities. The standardfor valuation at that time remains to be investigated, and the conclusions of the preceding case studies are not uniform. Therefore, this study has excluded collaterallending based on securities collateral from the estimation of potential losses.34 Inaddition, it has excluded loans collateralized by products, shipping, and others, asthey account for a relatively small proportion of lending.
136 MONETARY AND ECONOMIC STUDIES/OCTOBER 2002
34. With respect to individual banks, the value of the securities by which loans are collateralized might have fallenbelow the amount of the loans. Shindo (1977) indicates that the collateral securities at large banks and at thebranches of small and medium-sized banks in the prefectures where their headquarters did not exist were sound.On the other hand, Nishimura (2001) investigates the securities held by the Shinano Bank (in NaganoPrefecture), which went bankrupt in 1930. She points out that the securities mainly consisted of local equities,many of which were storehouse equities relating to the silk industry, and that most of their value in fiscal 1934 was zero.
35. Savings banks’ guarantees and credit loans include loans collateralized by products, shipping, and others.
Table 9 Loans of Ordinary and Savings Banks by Type of Collateral and EstimatedValue of Securities Collateral
1927 1930
Estimated Estimated Estimatedvalue of
Estimatedvalue ofLoan amount value of
collateral Loan amount value of
collateral(¥ millions) collateralas portion
(¥ millions) collateral as portion(¥ millions)
of loan (¥ millions)
of loan (percent) (percent)
Securities 2,622 3,767 144 2,194 2,820 129 Stocks 1,969 2,916 148 1,459 1,873 128 Governmental bonds 164 202 123 201 237 118 Municipal bonds 0 1 — 24 31 129 Corporate bonds 150 203 135 173 230 133
Land, housing, andother real estate
1,672 — — 1,688 — —
Products, shipping,and others
497 — — 427 — —
Guarantees and credit 2,493 — — 2,556 — —Total 7,285 — — 6,866 — —
Source: Ministry of Finance, Banking Bureau, Annual Report of the Banking Bureau (annual editions).
Next, this study examines the loss amount from loans collateralized by real estateand from loans on guarantees and credit, which accounted for around 60 percent oftotal loans at ordinary and savings banks in 1933.35 As there are no overall statistics

on overdue ratios and loss ratios for overdue loans for ordinary and savings banks,this subsection tries to explicate the financial condition in which overdue loans andshortage of collateral impaired the equity capital of the banks.
According to the Ministry of Finance’s Annual Report of the Banking Bureau , theequity capital of ordinary and savings banks in 1933 was ¥1.8 billion. Excluding thefive largest banks, which had low ratios of real estate loans, I find that local banks’equity capital was ¥1.2 billion in 1933.36 The ratio of equity capital to the sum ofloans collateralized by real estate and loans with guarantees and credit, ¥3.4 billion,was 36 percent. Therefore, the entire equity capital of local banks would be impairedby losses from real estate loans and loans with guarantees and credit when theloss/principal ratio exceeded 36 percent. This occurred when, for example, the overdue ratio of these loans was 100 percent of total loans of the banks and the potential loss ratio for overdue loans resulting from a decline in land prices was36 percent, or when the overdue ratio was 36 percent and the potential loss ratio foroverdue loans was 100 percent. Loan losses impaired one-half of the equity capital oflocal banks when either the overdue ratio or loss ratio was one-half of the percentagesstated above.
It is possible to examine loss ratios gathered at the time of business suspension for some banks that either went bankrupt or merged with other banks during theinterwar period. This enables us to test whether the loss/principal ratio of 36 percentmentioned above is relatively high compared to the loss/principal ratios of bankruptbanks. The Bank of Japan (1969) provides the reasons for suspension of business andthe method of disposition for 20 banks that went bankrupt or merged in the 1920s,especially during the financial crisis of 1927. In its study, the Bank of Japan andother organizations conducted an assessment of loans and estimated loss/principalratios of bankrupt banks at the time of their bankruptcies. Excluding the TaiwanBank, a specialized bank, and the Dai-65 Bank, for which the loss ratio was not available, 11 of 18 banks had loss/principal ratios of 36 percent or greater at the time of bankruptcy, while seven had the ratios below that level.37 Assuming that loans by the bankrupt banks were worse than those by ordinary and savings banksoverall, some banks went bankrupt while maintaining a loss/principal ratio below 36 percent. Thus, it cannot be concluded that the loss/principal ratio exceeded 36 percent for real estate collateral loans and loans by guarantees and credit at ordinary and savings bank during the interwar period, and that the majority of theirequity capital was impaired. Still, possible losses that damaged the equity capital ofordinary and savings banks were attributable not only to loans, but to a variety of other factors related to the banking business. Therefore, further analysis from
137
Developments in Land Prices and Bank Lending in Interwar Japan: Effects of the Real Estate Finance Problem on the Banking Industry
36. Data on the equity capital of the five largest banks come from each bank’s company history and business report(Institute for Japanese Business History [1978], Committee for Compiling the History of the Mitsubishi Bank[1954], Office for Compiling the Eighty-Year History of the Daiichi Bank [1958], Committee for the Sixty-YearCommemorative Project of the Yasuda Bank [1940], and Committee for Compiling the History of theSumitomo Bank [1955]).
37. Even if the ordinary and savings banking industry had sufficient equity capital as a whole, failures by a portion ofthe banks that incur significant losses to their equity capital could destabilize the banking industry overallthrough the elicitation of systemic risk. On the other hand, the amount of individual equity capital might be aless serious problem for the banks with close relationships with the five largest banks.
many points of view is necessary to determine whether equity capital was damagedseriously enough to undermine the soundness of the overall banking industry duringthe interwar period.38
IV. Conclusions
This paper has examined several arguments related to the effects of the real estatefinance problem on the real side of the economy in interwar Japan, primarily fromthe perspective of the credit rationing effects of falling asset prices. From 1913 to1936, agricultural land prices and volume of lending by ordinary and savings bankswere closely related. This is illustrated by the results of my estimation of banks’ loansupply function, which suggest that changes in land prices had a positive and statisti-cally significant effect on those of lending by ordinary and savings banks. Also, paneldata analysis by individual prefecture shows that, in 41 rural prefectures where agricultural land was the primary collateral, there was a statistically significant relationship between changes of agricultural land prices and those of loans by ordinary and savings banks. No significant relationship was determined betweenchanges of urban land prices and those of loans by ordinary and savings banks in sixurban prefectures where urban land was the primary collateral. The results of theseanalyses suggest that falling land prices during the interwar period, particularly inagricultural regions, constrained bank lending.
The relationship between the loans and equity capital of the ordinary and savingsbanks suggests that falling land prices did not necessarily give rise to the high ratio ofnonperforming loans nor to the loss ratio for nonperforming loans that led to the utterdevastation of the equity capital of ordinary and savings banks. Still, many issuesremain to be investigated regarding overall assessment of losses of equity capital in theordinary and savings bank industry during the interwar period, such as developmentsin stock and bond prices and the impact of the use of these securities as collateral.
In addition, there remain many other factors influencing credit rationing effectsthat must be investigated. In-depth analysis must be undertaken on such matters asthe role of direct and indirect financing underlying the funding and investmentbehavior of corporations and households, and their assets and liabilities. Anotherpotential topic for research is a comparison of the interwar Japanese economy and theeconomies of the United States and other countries, as well as a comparison with thepostwar Japanese economy.
The underlying mechanism that determined how developments in asset pricesaffected the real economic activity during the interwar period remains to be fullyunderstood. Research by Bernanke (1995) and others emphasizes the information
138 MONETARY AND ECONOMIC STUDIES/OCTOBER 2002
38. As stated above, the proportion of real estate financing in banks during the interwar period was tiered accordingto the bank size. There are constraints on the availability of data in order to extend these analyses for tiers of banksize. Some observers argue that small and medium-sized banks could have been strongly affected by falling landprices due to relatively large proportions of real estate collateral loans. In this regard, Ishii (2001) pointed outthat, beginning in 1927, the difference between the rates of net return on equity capital expanded rapidlybetween city banks and other ordinary banks mainly composed of local banks.

asymmetry between lenders and borrowers in the financial markets as a premise forcredit rationing effects.39 In relation to this, another important topic for furtherresearch is banks’ ability to adequately assess risk. The question remains whetherbanks could have appropriately evaluated the profitability and risks of their borrowers, based on past experiences in lending to local farmers and small andmedium-sized businesses, to take an example.40 Also, I must ask whether the situationin the interwar period is similar in the mining and manufacturing industries, manyof whose technologies and management skills were imported from Europe and theUnited States. Another factor to consider is that many ordinary and savings banksduring the interwar period in many ways resembled “organ banks” (kikan ginko),41
a theme that has generated a significant amount of research addressing the “moralhazard” problem posed by the “organ banks.” One thing to keep in mind is that it ispossible that the accumulation of corporate information through long-term businessrelationships in some ways alleviates information asymmetry. Investigation of theseintriguing issues will lead to a more comprehensive understanding of the relationshipbetween land prices and bank lending in interwar Japan, especially in light of loancollateral and the screening capabilities of banks.
139
Developments in Land Prices and Bank Lending in Interwar Japan: Effects of the Real Estate Finance Problem on the Banking Industry
39. Ogawa and Kitasaka (1998) discuss the relationship between fluctuations in land prices and bank lending afterWWII. They argue that banks extended their lending to small and medium-sized corporations, facing a shift of large corporations to direct financing during the liberalization of capital markets in the 1980s. Then, due tothe difficulties in assessing their new borrowers’ profitability and financial condition, they relied increasingly onreal estate collateral.
40. Some observers point out that the structure of Japan’s interwar financing was “multitiered,” and that risk assessment for lending to small borrowers was difficult, leading to “informal credit” through such sources as loansharks (refer to Teranishi [1991]).
41. The banks that had a large part of their funds tied up with a single firm or a small handful of firms are oftencalled organ banks. It has been pointed out that the lack of diversification of funds made their management risky.

140 MONETARY AND ECONOMIC STUDIES/OCTOBER 2002
Asakura, Kokichi, Ginko Keiei no Keifu: Fudosan-Tanpo-Kin’yu to Obaron (A Chronology of Banking:Real Estate Collateral Finance and Over-Loan), Nihon Keizai Shimbun Inc., 1978 (inJapanese).
———, Shimpen Nihon Kin’yu-Shi (A New History of Japanese Finance), Nihon Keizai Hyoronsha,Ltd., 1988 (in Japanese).
Baba, Eiichi, Fudosan Kin’yu (Real Estate Finance), The Finance Research Institute, 1935 (in Japanese).Bank of Japan, Research Department, “Sho-Kyugyo-Ginko no Hatan Genin Oyobi Sono Seiri (The
Causes of Bankruptcies of Operation-Suspended Banks and Their Consolidation),” NihonKin’yu-Shi Shiryo: Showa-Hen (Materials of Japan’s Financial History: Showa Edition), 24,1969, pp. 168–529 (in Japanese).
———, Statistics Department, Meiji-Iko Honpo Shuyo Keizai Tokei (Primary Economic Statistics ofJapan since the Meiji Era), 1966 (in Japanese).
Bernanke, Ben S., “The Macroeconomics of the Great Depression: A Comparative Approach,” Journalof Money, Credit, and Banking, 27 (1), February, 1995, pp. 1–28.
———, Essays on the Great Depression, Princeton, New Jersey: Princeton University Press, 2000.Committee for Compiling the History of the Mitsubishi Bank, Mitsubishi Ginko-Shi (History of the
Mitsubishi Bank), 1954 (in Japanese).Committee for Compiling the History of the Sumitomo Bank, Sumitomo Ginko-Shi (History of the
Sumitomo Bank), 1955 (in Japanese).Committee for Compiling the One-Hundred-Year History of the Bank of Japan, Nippon Ginko
Hyakunen-Shi: Shiryohen (One-Hundred-Year History of the Bank of Japan: Source Materials),1986 (in Japanese).
Committee for the Sixty-Year Commemorative Project of the Yasuda Bank, Yasuda Ginko Rokujunen-Shi (Sixty-Year History of the Yasuda Bank), 1940 (in Japanese).
Fujino, Shozaburo, Nihon no Mane Sapurai (The Money Supply of Japan), Keisoshobo, 1994 (inJapanese).
———, and Ryoko Akiyama, Shoken Kakaku to Rishi-Ritsu: 1874–1975 (Securities Prices and InterestRates: 1874–1975), Economic Research Institute of Hitotsubashi University and the JapanEconomic Statistics and Documents Center, 1977 (in Japanese).
———, and Juro Teranishi, Nihon Kin’yu no Suryo Bunseki (Quantitative Analysis of JapaneseFinance), Toyo Keizai Shimposha, 2000 (in Japanese).
Goto, Shinichi, Nihon no Kin’yu Tokei (Japanese Financial Statistics), Toyo Keizai Shimposha, 1970 (in Japanese).
Hashimoto, Juro, “Sen-Zen Nihon ni Okeru Chika Hendo to Fudosan-Gyo (Land Price Fluctuationsand the Real Estate Industry in Pre-War Japan),” in Housing Research & AdvancementFoundation of Japan, ed. Fudosan-Gyo ni Kansuru Shiteki Kenkyu I (Historical Research concerning the Real Estate Industry I), Housing Research & Advancement Foundation ofJapan, 1994, pp. 1–25 (in Japanese).
———, “Sen-Zen Nihon ni Okeru Fudosan Kin’yu (Real Estate Finance in Pre-War Japan),” inHousing Research & Advancement Foundation of Japan, ed. Fudosan-Gyo ni Kansuru ShitekiKenkyu II (Historical Research concerning the Real Estate Industry II), Housing Research &Advancement Foundation of Japan, 1995, pp. 1–30 (in Japanese).
———, Gendai Nihon Keizai-Shi (A History of Modern Japanese Economy), Iwanami Shoten, 2000(in Japanese).
Hoshi, Takeo, and Anil K. Kashyap, Corporate Financing and Governance in Japan: The Road to theFuture, Boston, Massachusetts: MIT Press, 2001.
Institute for Japanese Business History, Mitsui Ginko Shiryo I: Eigyo Hokoku-Sho (Historical Materialsfor Mitsui Bank: Business Reports), 1978 (in Japanese).
Ishii, Kanji, Nihon no Sangyo Kakumei (The Japanese Industrial Revolution), Asahi Shimbunsha, 1997(in Japanese).
References
141
Developments in Land Prices and Bank Lending in Interwar Japan: Effects of the Real Estate Finance Problem on the Banking Industry
——, “Senkanki no Kin’yu Kiki to Chiho Ginko (Interwar Financial Crises and Local Banks),” in KanjiIshii and Kazuo Sugiyama, eds. Kin’yu Kiki to Chiho Ginko (Financial Crises and Local Banks),University of Tokyo Press, 2001, pp. 3–22 (in Japanese).
Ito, Masanao, “Zaisei/Kin’yu (Public Finance and Banking),” in the 1920s Historical Study Group, ed.1920-Nendai no Nihon Keizai (The Japanese Economy during the 1920s), University of TokyoPress, 1983a, pp. 85–121 (in Japanese).
———, “Showa Nogyo Kyoko Zengo no Kangin/Nogin-Ron (An Essay on the Nihon Kangyo Bankand the Agricultural Banks around the Showa Agricultural Crisis),” in Toshihiko Kato, ed.Nihon Kin’yu-Ron no Shiteki Kenkyu (Historical Research on the Studies of Japanese Finance),University of Tokyo Press, 1983b, pp. 189–207 (in Japanese).
Ito, Osamu, Nihon-Gata Kin’yu no Rekishiteki Kozo (The Historical Structure of Japan’s FinancialSystem), University of Tokyo Press, 1995 (in Japanese).
Kataoka, Yutaka, and Juro Teranishi, “Sangyo Kin’yu to Kin’yu Seisaku (Industrial Finance andFinancial Policies),” in Shunsaku Nishikawa, Konosuke Odaka, and Osamu Saitou, eds. NihonKeizai no 200-Nen (200 Years of the Japanese Economy), Nihon Hyoronsha, 1996, pp. 95–116(in Japanese).
Ministry of Finance, Banking Bureau, Ginko-Kyoku Nenpo (Annual Report of the Banking Bureau),annual editions (in Japanese).
———, Financial Bureau, Kin’yu Jiko Sanko-Sho (Reference Book of Financial Matters), annual editions (in Japanese).
———, Taxation Bureau, Shuzei-Kyoku Tokei Nenpo-Sho (Annual Report on Statistics of the TaxationBureau), annual editions (in Japanese).
Murakami, Hatsu, “Futsu Ginko (Ordinary Banks),” in Toshihiko Kato, ed. Nihon Kin’yu-Ron noShiteki Kenkyu (Historical Research on the Studies of Japanese Finance), University of TokyoPress, 1983, pp. 383–439 (in Japanese).
Nakamura, Takafusa, Showa Kyoko to Keizai Seisaku (Showa Depression and Economic Policies), NihonKeizai Shimbunsha, 1978 (in Japanese).
———, “Keiki Hendo to Keizai Seisaku (Economic Development and Economic Policies),” in TakafusaNakamura and Konosuke Odaka, eds. Nihon-Keizai-Shi 6: Niju-Kozo (Japanese EconomicHistory 6: Dual Structure), Iwanami Shoten, 1989, pp. 275–322 (in Japanese).
Nihon Kangyo Bank, Ltd., Research Department, Honpo Fudosan Kin’yu ni Kansuru Sho-Tokei(Statistics on Japanese Real Estate Financing), annual editions (in Japanese).
———, Futsu Ginko ni Okeru Fudosan Teito Kashitsuke-Kin Chosa (Survey of Real Estate CollateralLoans at Ordinary Banks), 1927 (in Japanese).
———, Nihon Kangyo Ginko-Shi: Tokushu Ginko Jidai (History of the Nihon Kangyo Bank: The Eraof the Specialized Bank), 1953 (in Japanese).
Nishimura, Hatsu, “Chiho Ginko no Keiei Kiki to Fudosan Tanpo Yushi no Shikin-ka: Shinano TochiShoken no Setsuritsu to Nichigin Tokuyu wo Chushin to Shite (The Management Crisis atLocal Banks and Liquidation of Real Estate Collateral Financing: The Establishment of ShinanoLand and Securities and Special Loans of the Bank of Japan),” Chiho Kin’yu Kenkyu (Researchof Local Finance), 32, Chiho Kin’yu-Shi Kenkyu-Kai (Institute for Local Finance History),2001, pp. 1–28 (in Japanese).
Numajiri, Akinobu, “Sen-Zen Tokyo no Toshi Keikaku to Kojo Ritchi: 1920/1930-Nendai woChushin ni (City Planning in Tokyo before the War and Location of Factories: A Focus on the1920s and 1930s),” in Housing Research & Advancement Foundation of Japan, ed. Fudosan-Gyo ni Kansuru Shiteki Kenkyu III (Historical Research concerning the Real Estate Industry III),Housing Research & Advancement Foundation of Japan, 1996, pp. 74–94 (in Japanese).
Office for Compiling the Eighty-Year History of the Daiichi Bank, Daiichi Ginko-Shi: Gekan (Historyof the Daiichi Bank: Volume II), 1958 (in Japanese).
Ogawa, Kazuo, and Shinichi Kitasaka, Shisan Shijo to Keiki Hendo (Asset Markets and EconomicFluctuations), Nihon Keizai Shimbunsha, 1998 (in Japanese).

Ohkawa, Kazushi, Nobukiyo Takamatsu, and Yuzo Yamamoto, Choki Keizai Tokei 1: Kokumin Shotoku(Estimates of Long-Term Economic Statistics of Japan since 1868 1: National Income), ToyoKeizai Shimposha, 1974 (in Japanese).
Okazaki, Tetsuji, and Masahiro Okuno (Fujiwara), “Gendai-Nihon no Keizai Shisutemu to SonoRekishiteki Genryu (The Modern Japanese Economic System and Its Historical Background),”in Tetsuji Okazaki and Masahiro Okuno (Fujiwara), eds. Gendai-Nihon Keizai Shisutemu toSono Genryu (The Modern Japanese Economic System and Its Background), Nihon KeizaiShimbunsha, 1993, pp. 1–34 (in Japanese).
Okina, Kunio, and Shigenori Shiratsuka, “Asset Price Bubbles, Price Stability, and Monetary Policy:Japan’s Experience,” Monetary and Economic Studies, 20 (3), Institute for Monetary andEconomic Studies, Bank of Japan, 2001, pp. 35–76 (this issue).
Ouchi, Chikara, Nihon Keizai-Ron: Jo (An Essay on Japanese Economics: Volume 1), University ofTokyo Press, 1962 (in Japanese).
Shibata, Tokutaro, “Fusai Defureshon to Dai-Kyoko (Debt Deflation and the Great Depression),” in Hiroshi Yoshikawa and Tetsuji Okazaki, eds. Keizai Riron eno Rekishi-Teki Pasupekuchibu(Historical Perspectives of Economic Theories), University of Tokyo Press, 1990, pp. 45–67 (inJapanese).
Shimura, Kaichi, Nihon Shihon Shijo Bunseki (An Analysis of Japanese Capital Markets), University ofTokyo Press, 1969 (in Japanese).
Shindo, Hiroshi, “Taisho-Koki/Showa-Shoki ni Okeru Chiho Ginko no Fudosan Tanpo Kashidashi(Real Estate Collateral Lending by Local Banks in the Late Taisho and Early Showa Periods),”Kin’yu Keizai (Journal of Financial Economics), 165/166, Institute for Banking and FinancialResearch Inc., 1977, pp. 307–351 (in Japanese).
Shinohara, Miyohei, Choki Keizai Tokei 10: Kokogyo (Long-Term Economic Statistics 10: Mining andManufacturing Industries), Toyo Keizai Shimposha, 1972 (in Japanese).
Sugimoto, Masayuki, Shigaichi Kakaku-Ron (An Essay on Urban Land Prices), Ganshodo Shoten, 1933(in Japanese).
———, Nochi Kakaku-Ron (An Essay on Agricultural Land Prices), Ganshodo Shoten, 1934 (inJapanese).
———, Fudosan Kin’yu Yoron (A Brief Essay on Real Estate Finance), Kaizosha, 1935 (in Japanese).Takahashi, Kamekichi, Taisho Showa Zaikai Hendo-Shi: Chu-Kan (Economic Trends during the Taisho
and Showa Periods, Vol. 2), Toyo Keizai Shimposha, 1955 (in Japanese).Takamatsu, Nobukiyo, “Kosaku-Ryo/Chika/Chingin (Rent, Land Prices and Wages),” in Mataji
Umemura, Saburo Yamada, Yujiro Hayami, Nobukiyo Takamatsu, and Minoru Kumazaki, eds.Choki Keizai Tokei 9: Noringyo (Long-Term Economic Statistics 9: Agriculture and Forestry),Toyo Keizai Shimposha, 1966 (in Japanese).
Takeda, Haruhito, “Kyoko (Crisis),” in 1920s Historical Study Group, ed. 1920-Nendai no Nihon Keizai (The Japanese Economy during the 1920s), University of Tokyo Press, 1983, pp. 329–371 (in Japanese).
Teranishi, Juro, Nihon no Keizai Hatten to Kin’yu (Japanese Economic Development and FinancialSystem), Iwanami Shoten, 1982 (in Japanese).
———, “Fukinko-Seicho to Kin’yu (Unbalanced Economic Growth and Finance),” in TakafusaNakamura and Konosuke Odaka, eds. Nihon-Keizai-Shi 6: Niju-Kozo (Japanese EconomicHistory 6: Dual Structure), Iwanami Shoten, 1989, pp. 185–229 (in Japanese).
———, Kogyo-ka to Kin’yu Shisutemu (Industrialization and Financial System), Toyo KeizaiShimposha, 1991 (in Japanese).
Toyo Keizai Shimposha, Keizai Nenkan (Economic Yearbook), annual editions (in Japanese).Ueda, Kinji, “Ryoutaisen-Kan-ki ni Okeru Noko Ginko no Sonritsu Joken (Jo): Hiroshima Noko
Ginko no Kenkyu (Conditions for the Existence of Agri-Industrial Banks during the InterwarPeriod: Research on the Agri-Industrial Bank in Hiroshima Prefecture),” Kin’yu Keizai (Journalof Financial Economics), 200, Institute for Banking and Financial Research Inc., 1983, pp. 495–532 (in Japanese).
142 MONETARY AND ECONOMIC STUDIES/OCTOBER 2002