Embed Size (px)
Citation preview
18th International Symposium on the Application of Laser and Imaging Techniques to Fluid Mechanics・LISBON | PORTUGAL ・JULY 4 – 7, 2016
Differential Infrared Thermography (DIT) for Dynamic Stall Detection
M. Raffel*, A.D. Gardner, T. Schwermer, C.B. Merz, A. Weiss, J. Braukmann, C.C. Wolf, B. Ewers
Institute of Aerodynamics and Flow Technology, German Aerospace Center, Göttingen, Germany * Correspondent author: [email protected]
Keywords: Differential Infrared Thermography, Dynamic Stall, Unsteady Flow, Transition
ABSTRACT
Flow separation plays an important role in the aerodynamics of propellers and helicopter rotors. Although the ideal is to retain attached flow under all flight conditions, the main rotor of a helicopter sees partial separation under highly loaded forward flight or for flight conditions which include the blades intersecting their own wakes. The presence and position of flow separation on the blade is of great interest during its operation. The knowledge of the flow separation is needed for the performance assessment, for the validation of the design, and for the calibration of numerical transition prediction tools. The paper describes the first use of Differential Infrared Thermography as a new method for dynamic stall measurements on pitching and rotating blades.
1. Introduction Raffel and Merz (2014) have pioneered Differential Infrared Thermography (DIT), a method whereby the difference of two sequential infrared images taken during an unsteady flow is analyzed to extract the point of greatest difference between the flows, which, for attached flows, is equivalent to the boundary layer transition position (Richter et al. 2016). For flows with dynamic flow separation, the strongest feature in the infrared difference images is no longer the transition, but the separated flow. Gardner and Richter (2015) showed that the standard deviation of pressure measurements at the transition point had a small peak, but the separated flow had a much larger peak in the standard deviation of pressure. Similarly the infrared images can be analyzed to extract the presence and extent of separated flow on an airfoil. DIT offers a great advantage over using pressure sensors to detect boundary layer separation, since it does not require any special equipment to be attached to or built into the model observed. The major aim of the investigations presented here was the production of “stall maps” where the areas on the rotor disc which are stalled are geometrically described. These are currently most
18th International Symposium on the Application of Laser and Imaging Techniques to Fluid Mechanics・LISBON | PORTUGAL ・JULY 4 – 7, 2016
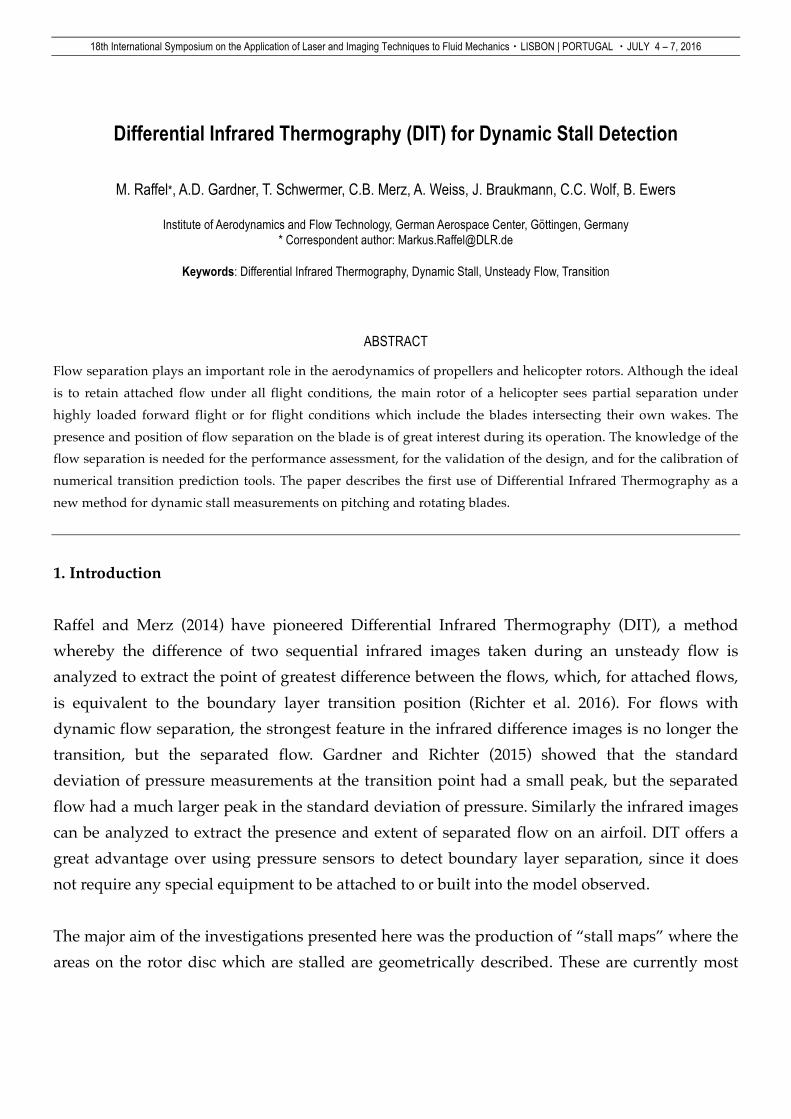
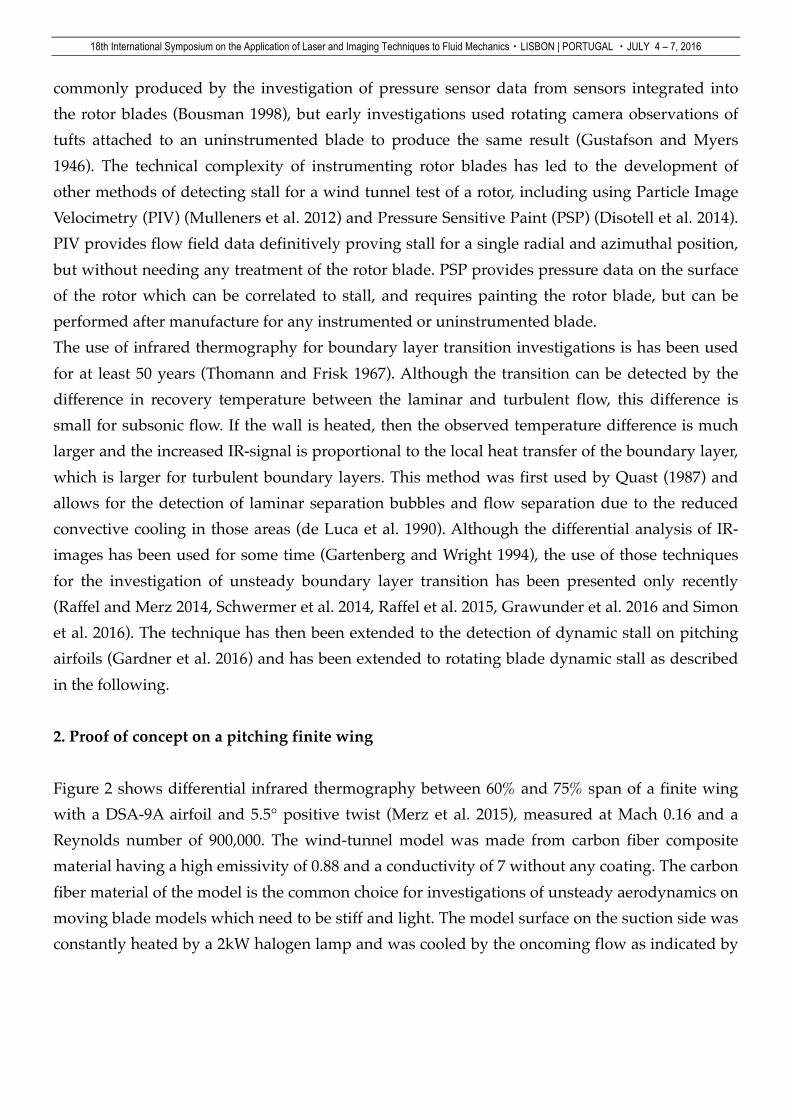
commonly produced by the investigation of pressure sensor data from sensors integrated into the rotor blades (Bousman 1998), but early investigations used rotating camera observations of tufts attached to an uninstrumented blade to produce the same result (Gustafson and Myers 1946). The technical complexity of instrumenting rotor blades has led to the development of other methods of detecting stall for a wind tunnel test of a rotor, including using Particle Image Velocimetry (PIV) (Mulleners et al. 2012) and Pressure Sensitive Paint (PSP) (Disotell et al. 2014). PIV provides flow field data definitively proving stall for a single radial and azimuthal position, but without needing any treatment of the rotor blade. PSP provides pressure data on the surface of the rotor which can be correlated to stall, and requires painting the rotor blade, but can be performed after manufacture for any instrumented or uninstrumented blade. The use of infrared thermography for boundary layer transition investigations is has been used for at least 50 years (Thomann and Frisk 1967). Although the transition can be detected by the difference in recovery temperature between the laminar and turbulent flow, this difference is small for subsonic flow. If the wall is heated, then the observed temperature difference is much larger and the increased IR-signal is proportional to the local heat transfer of the boundary layer, which is larger for turbulent boundary layers. This method was first used by Quast (1987) and allows for the detection of laminar separation bubbles and flow separation due to the reduced convective cooling in those areas (de Luca et al. 1990). Although the differential analysis of IR-images has been used for some time (Gartenberg and Wright 1994), the use of those techniques for the investigation of unsteady boundary layer transition has been presented only recently (Raffel and Merz 2014, Schwermer et al. 2014, Raffel et al. 2015, Grawunder et al. 2016 and Simon et al. 2016). The technique has then been extended to the detection of dynamic stall on pitching airfoils (Gardner et al. 2016) and has been extended to rotating blade dynamic stall as described in the following. 2. Proof of concept on a pitching finite wing Figure 2 shows differential infrared thermography between 60% and 75% span of a finite wing with a DSA-9A airfoil and 5.5° positive twist (Merz et al. 2015), measured at Mach 0.16 and a Reynolds number of 900,000. The wind-tunnel model was made from carbon fiber composite material having a high emissivity of 0.88 and a conductivity of 7 without any coating. The carbon fiber material of the model is the common choice for investigations of unsteady aerodynamics on moving blade models which need to be stiff and light. The model surface on the suction side was constantly heated by a 2kW halogen lamp and was cooled by the oncoming flow as indicated by
18th International Symposium on the Application of Laser and Imaging Techniques to Fluid Mechanics・LISBON | PORTUGAL ・JULY 4 – 7, 2016
the sketch in Fig. 2. This resulted in a surface temperature of about 322K (49°C) compared to the air flow temperature of approximately 314K.
Fig. 1 Low-speed wind tunnel (SWG) of the DLR in Göttingen.
Fig. 2 DIT set up and positively twisted pitching finite wing with DSA-9A profile in SWG.
A FLIR SC7750L infrared camera had a spectral range of 8.0-9.4 μm detected by a Cadmium-Mercury-Telluride (MCT) detector with a resolution of 640x512 px. A 50mm focal length lens with an aperture 2.0 was used. The camera was mounted above the suction side of the finite wing and recorded the temperature distribution in an area around mid-span of the model from the leading edge to the trailing edge. The readout area was 640x512 pixels with a frame rate of facq=100Hz at an exposure time of texp=200µs. The pitching motion was set to α(t)=9+6.0°sin(2π f t) with a pitching frequency of 3.2Hz and a free stream velocity of U∞=55m/s. This causes attached
18th International Symposium on the Application of Laser and Imaging Techniques to Fluid Mechanics・LISBON | PORTUGAL ・JULY 4 – 7, 2016
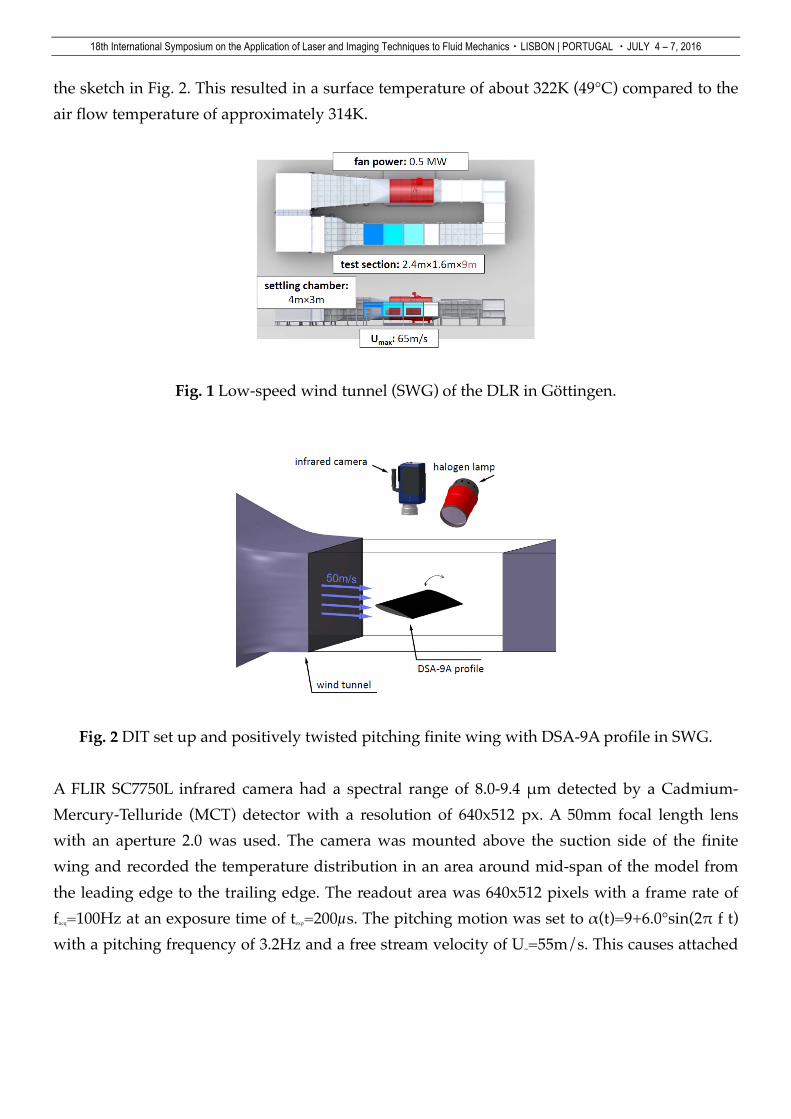
flow at low angles of attack, and flow separation at high angle of attack on the upstroke which reattaches some time later on the downstroke, creating a deep dynamic stall condition. Figure 3 shows the difference of thermal images recorded with a time delay of ∆t=10ms. The laminar-turbulent transition can be seen on the airfoil around 15% along the chord in both figures. A disturbance was added to the airfoil leading edge by a disc glued to the airfoil, which caused transition in its wake. As described by Raffel et al. (2015), the color change in the DIT results is in the opposite direction for the pitch-down case (dark to light along the flow direction), when compared to the pitch-up flow case (light to dark in the flow direction).
Fig. 3 DIT results of attached flow and laminar – turbulent boundary layer transition during downstroke (left) and upstroke (right) phase of the pitching motion.
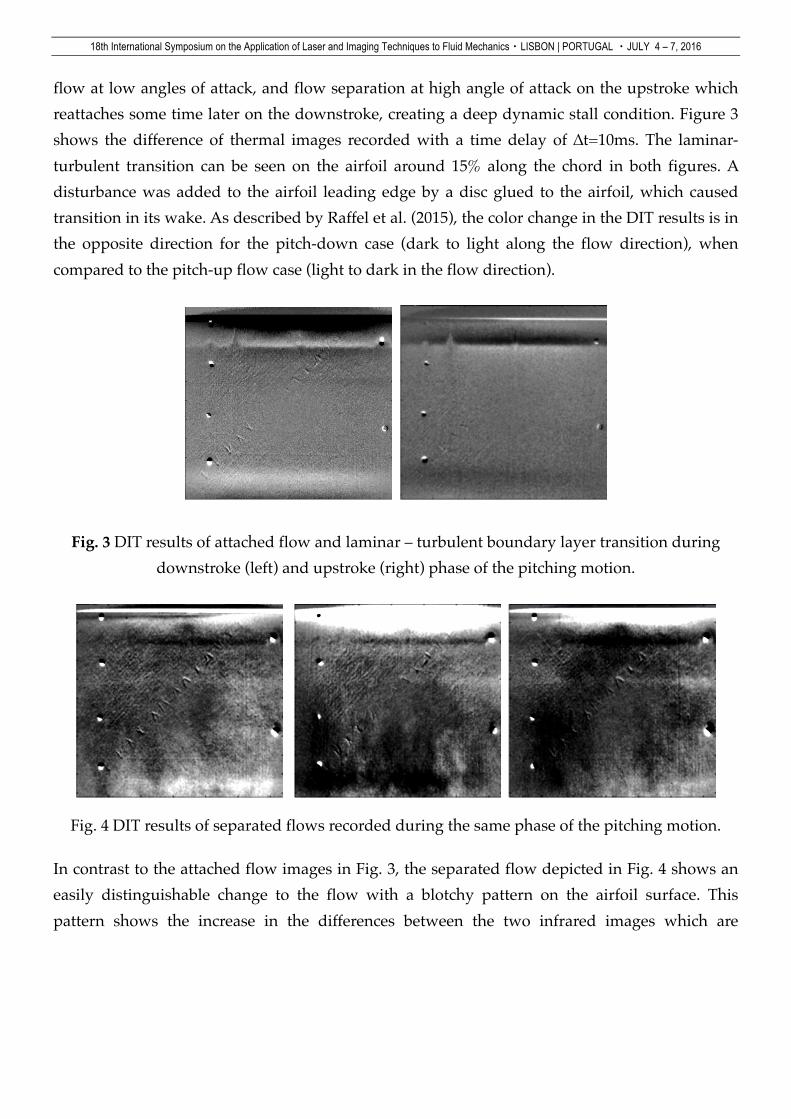
Fig. 4 DIT results of separated flows recorded during the same phase of the pitching motion.
In contrast to the attached flow images in Fig. 3, the separated flow depicted in Fig. 4 shows an easily distinguishable change to the flow with a blotchy pattern on the airfoil surface. This pattern shows the increase in the differences between the two infrared images which are
18th International Symposium on the Application of Laser and Imaging Techniques to Fluid Mechanics・LISBON | PORTUGAL ・JULY 4 – 7, 2016
differenced to form the DIT images. This increased standard deviation can be extracted from an analysis of the DIT images to show which points on the pitching cycle are stalled. 3. Application on a rotating blade at cyclic pitch
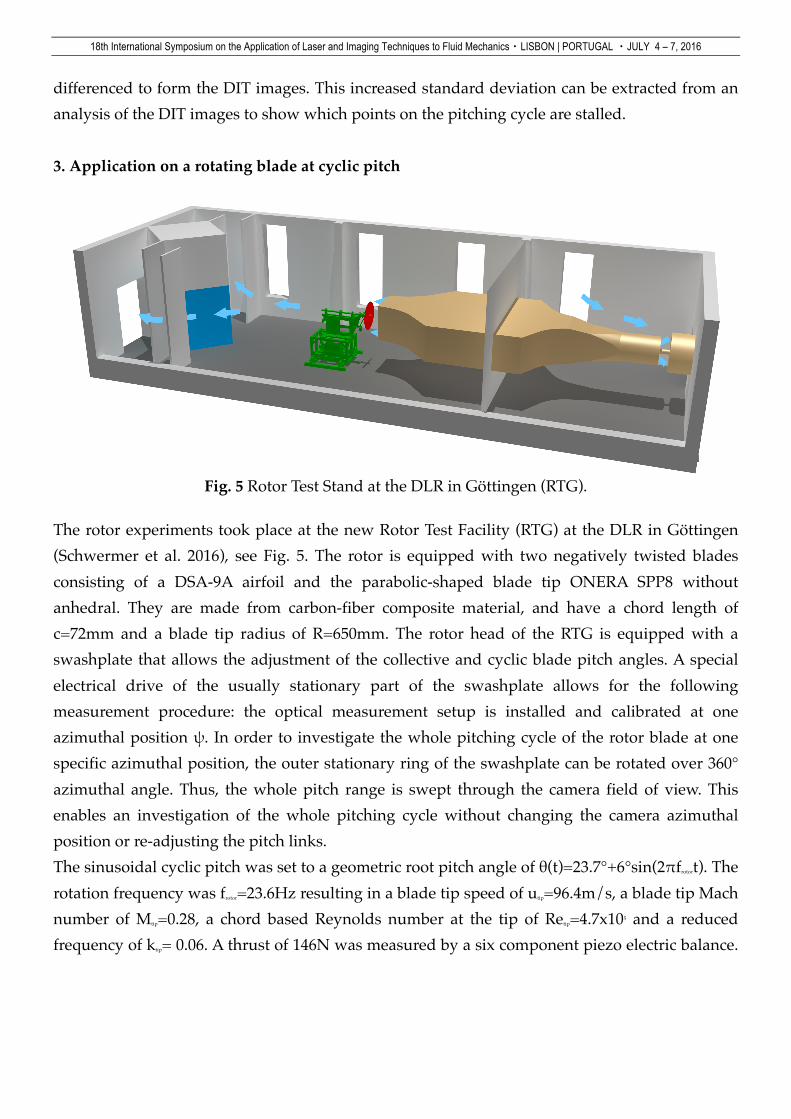
Fig. 5 Rotor Test Stand at the DLR in Göttingen (RTG).
The rotor experiments took place at the new Rotor Test Facility (RTG) at the DLR in Göttingen (Schwermer et al. 2016), see Fig. 5. The rotor is equipped with two negatively twisted blades consisting of a DSA-9A airfoil and the parabolic-shaped blade tip ONERA SPP8 without anhedral. They are made from carbon-fiber composite material, and have a chord length of c=72mm and a blade tip radius of R=650mm. The rotor head of the RTG is equipped with a swashplate that allows the adjustment of the collective and cyclic blade pitch angles. A special electrical drive of the usually stationary part of the swashplate allows for the following measurement procedure: the optical measurement setup is installed and calibrated at one azimuthal position ψ. In order to investigate the whole pitching cycle of the rotor blade at one specific azimuthal position, the outer stationary ring of the swashplate can be rotated over 360° azimuthal angle. Thus, the whole pitch range is swept through the camera field of view. This enables an investigation of the whole pitching cycle without changing the camera azimuthal position or re-adjusting the pitch links. The sinusoidal cyclic pitch was set to a geometric root pitch angle of θ(t)=23.7°+6°sin(2πfrotort). The rotation frequency was frotor=23.6Hz resulting in a blade tip speed of utip=96.4m/s, a blade tip Mach number of Mtip=0.28, a chord based Reynolds number at the tip of Retip=4.7x10⁵ and a reduced frequency of ktip= 0.06. A thrust of 146N was measured by a six component piezo electric balance.
18th International Symposium on the Application of Laser and Imaging Techniques to Fluid Mechanics・LISBON | PORTUGAL ・JULY 4 – 7, 2016
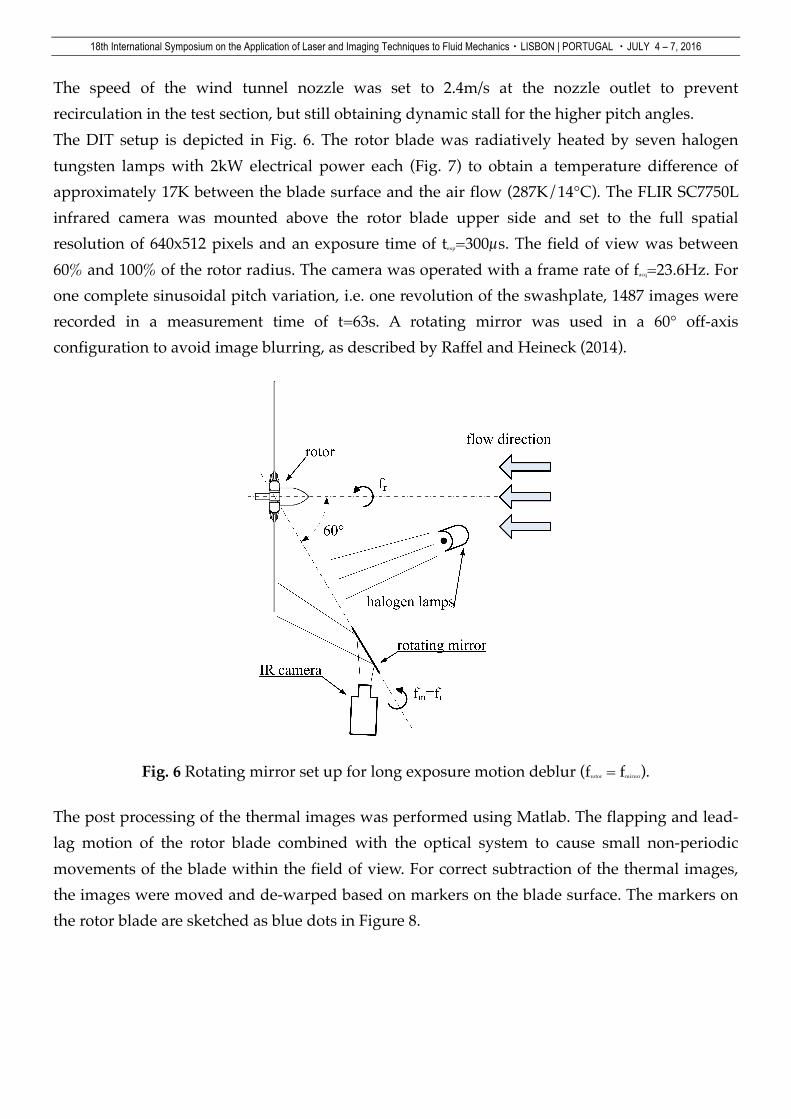
The speed of the wind tunnel nozzle was set to 2.4m/s at the nozzle outlet to prevent recirculation in the test section, but still obtaining dynamic stall for the higher pitch angles. The DIT setup is depicted in Fig. 6. The rotor blade was radiatively heated by seven halogen tungsten lamps with 2kW electrical power each (Fig. 7) to obtain a temperature difference of approximately 17K between the blade surface and the air flow (287K/14°C). The FLIR SC7750L infrared camera was mounted above the rotor blade upper side and set to the full spatial resolution of 640x512 pixels and an exposure time of texp=300µs. The field of view was between 60% and 100% of the rotor radius. The camera was operated with a frame rate of facq=23.6Hz. For one complete sinusoidal pitch variation, i.e. one revolution of the swashplate, 1487 images were recorded in a measurement time of t=63s. A rotating mirror was used in a 60° off-axis configuration to avoid image blurring, as described by Raffel and Heineck (2014).
Fig. 6 Rotating mirror set up for long exposure motion deblur (frotor = fmirror). The post processing of the thermal images was performed using Matlab. The flapping and lead-lag motion of the rotor blade combined with the optical system to cause small non-periodic movements of the blade within the field of view. For correct subtraction of the thermal images, the images were moved and de-warped based on markers on the blade surface. The markers on the rotor blade are sketched as blue dots in Figure 8.
18th International Symposium on the Application of Laser and Imaging Techniques to Fluid Mechanics・LISBON | PORTUGAL ・JULY 4 – 7, 2016
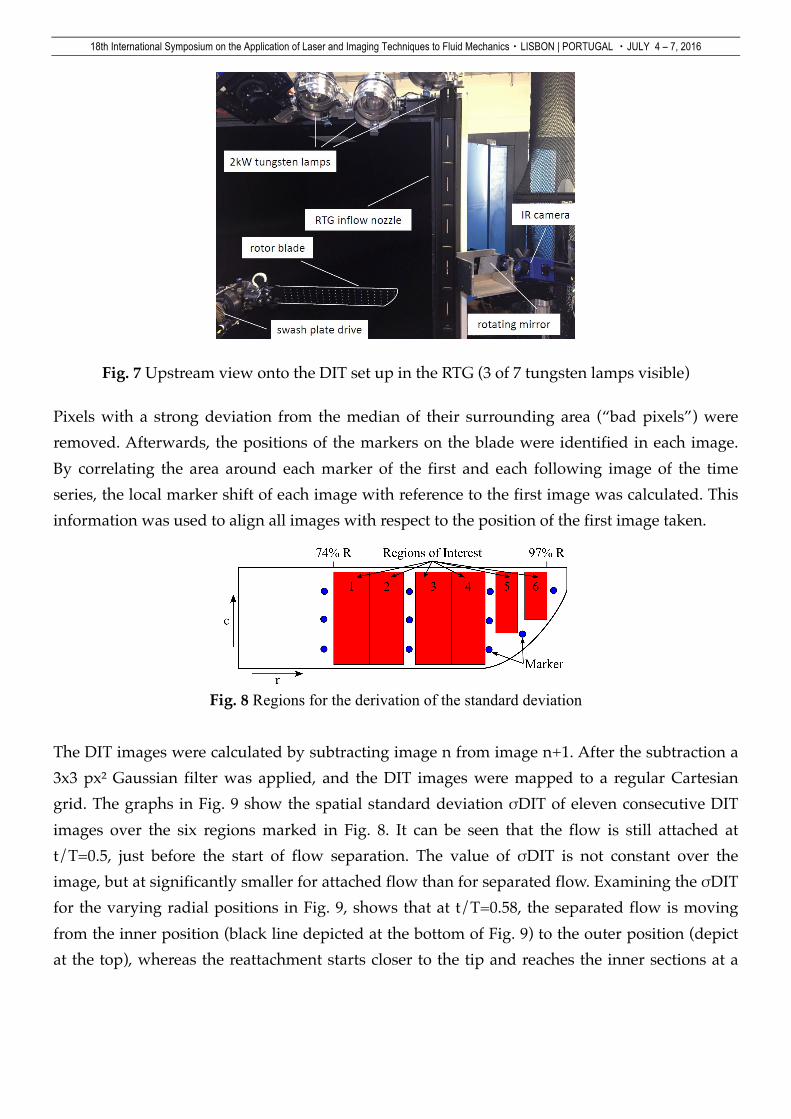
Fig. 7 Upstream view onto the DIT set up in the RTG (3 of 7 tungsten lamps visible)
Pixels with a strong deviation from the median of their surrounding area (“bad pixels”) were removed. Afterwards, the positions of the markers on the blade were identified in each image. By correlating the area around each marker of the first and each following image of the time series, the local marker shift of each image with reference to the first image was calculated. This information was used to align all images with respect to the position of the first image taken.
Fig. 8 Regions for the derivation of the standard deviation
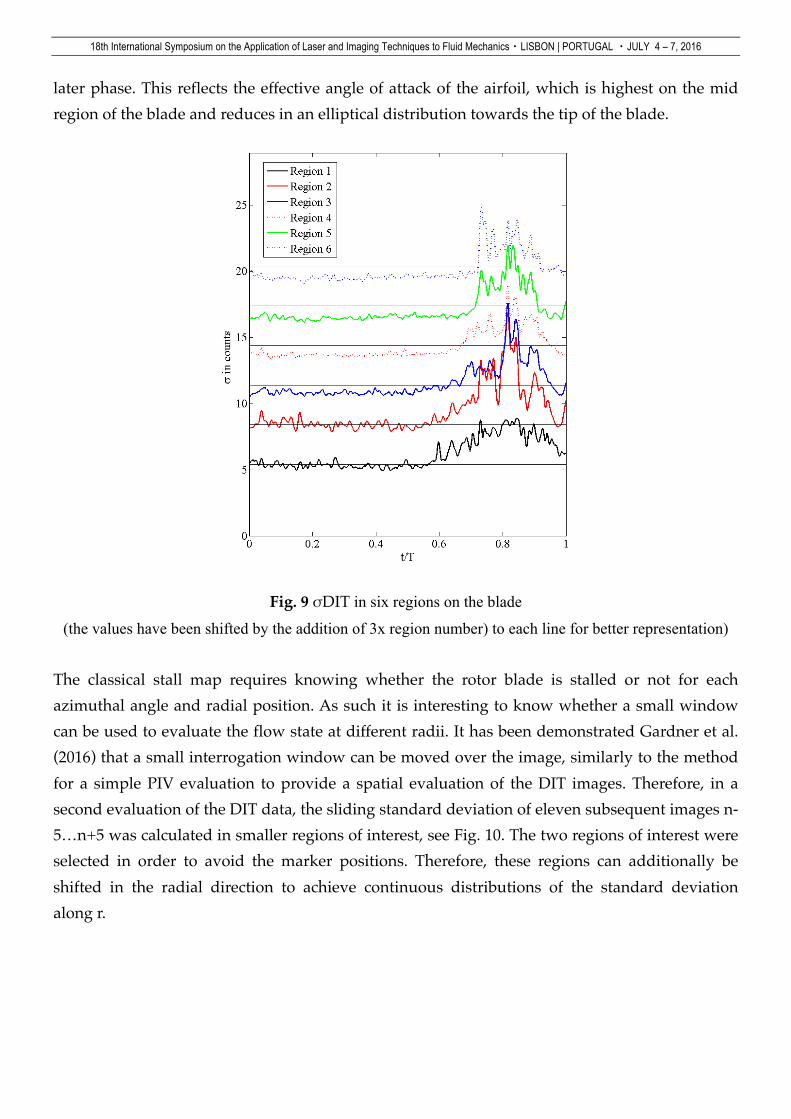
The DIT images were calculated by subtracting image n from image n+1. After the subtraction a 3x3 px² Gaussian filter was applied, and the DIT images were mapped to a regular Cartesian grid. The graphs in Fig. 9 show the spatial standard deviation σDIT of eleven consecutive DIT images over the six regions marked in Fig. 8. It can be seen that the flow is still attached at t/T=0.5, just before the start of flow separation. The value of σDIT is not constant over the image, but at significantly smaller for attached flow than for separated flow. Examining the σDIT for the varying radial positions in Fig. 9, shows that at t/T=0.58, the separated flow is moving from the inner position (black line depicted at the bottom of Fig. 9) to the outer position (depict at the top), whereas the reattachment starts closer to the tip and reaches the inner sections at a
18th International Symposium on the Application of Laser and Imaging Techniques to Fluid Mechanics・LISBON | PORTUGAL ・JULY 4 – 7, 2016
later phase. This reflects the effective angle of attack of the airfoil, which is highest on the mid region of the blade and reduces in an elliptical distribution towards the tip of the blade.
Fig. 9 σDIT in six regions on the blade
(the values have been shifted by the addition of 3x region number) to each line for better representation) The classical stall map requires knowing whether the rotor blade is stalled or not for each azimuthal angle and radial position. As such it is interesting to know whether a small window can be used to evaluate the flow state at different radii. It has been demonstrated Gardner et al. (2016) that a small interrogation window can be moved over the image, similarly to the method for a simple PIV evaluation to provide a spatial evaluation of the DIT images. Therefore, in a second evaluation of the DIT data, the sliding standard deviation of eleven subsequent images n-5…n+5 was calculated in smaller regions of interest, see Fig. 10. The two regions of interest were selected in order to avoid the marker positions. Therefore, these regions can additionally be shifted in the radial direction to achieve continuous distributions of the standard deviation along r.
18th International Symposium on the Application of Laser and Imaging Techniques to Fluid Mechanics・LISBON | PORTUGAL ・JULY 4 – 7, 2016
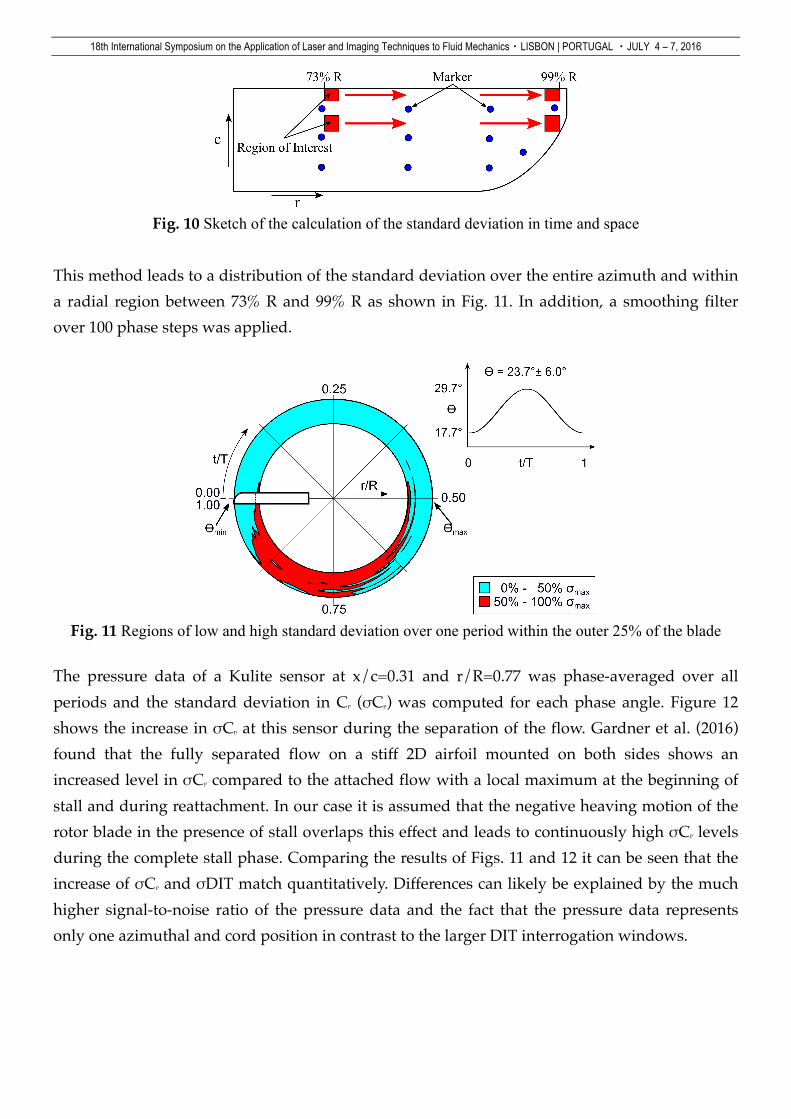
Fig. 10 Sketch of the calculation of the standard deviation in time and space
This method leads to a distribution of the standard deviation over the entire azimuth and within a radial region between 73% R and 99% R as shown in Fig. 11. In addition, a smoothing filter over 100 phase steps was applied.
Fig. 11 Regions of low and high standard deviation over one period within the outer 25% of the blade
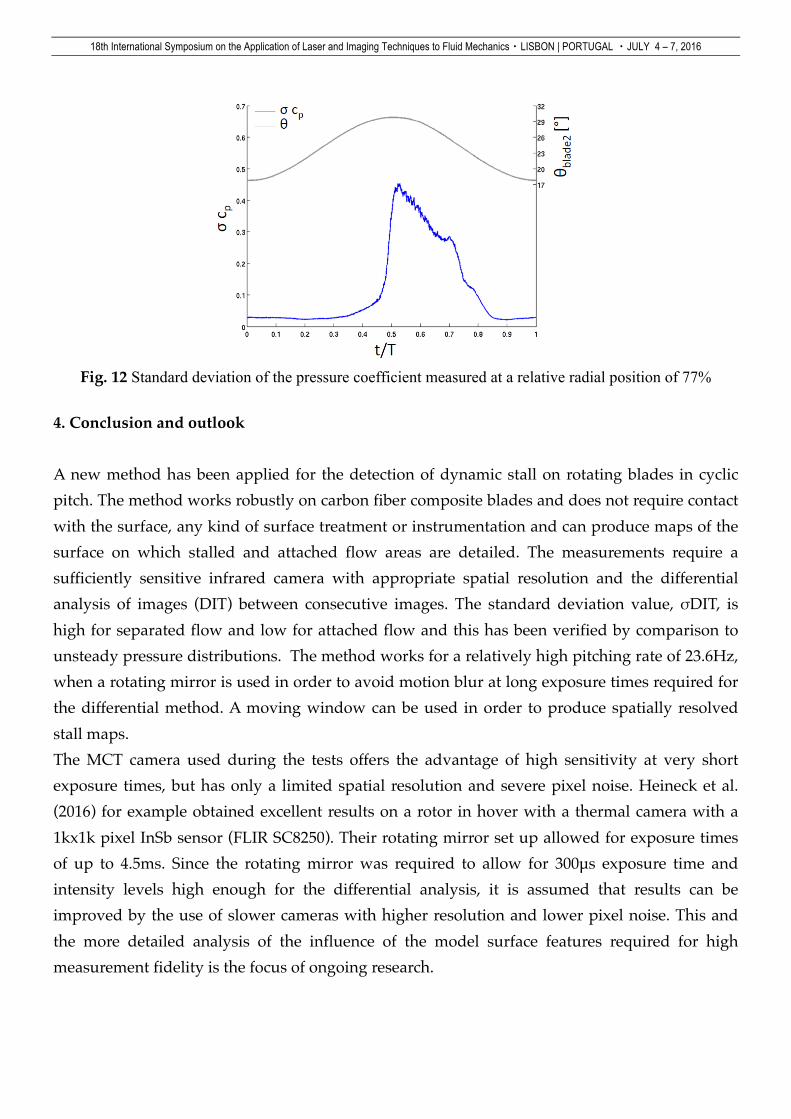
The pressure data of a Kulite sensor at x/c=0.31 and r/R=0.77 was phase-averaged over all periods and the standard deviation in CP (σCP) was computed for each phase angle. Figure 12 shows the increase in σCP at this sensor during the separation of the flow. Gardner et al. (2016) found that the fully separated flow on a stiff 2D airfoil mounted on both sides shows an increased level in σCP compared to the attached flow with a local maximum at the beginning of stall and during reattachment. In our case it is assumed that the negative heaving motion of the rotor blade in the presence of stall overlaps this effect and leads to continuously high σCP levels during the complete stall phase. Comparing the results of Figs. 11 and 12 it can be seen that the increase of σCP and σDIT match quantitatively. Differences can likely be explained by the much higher signal-to-noise ratio of the pressure data and the fact that the pressure data represents only one azimuthal and cord position in contrast to the larger DIT interrogation windows.
18th International Symposium on the Application of Laser and Imaging Techniques to Fluid Mechanics・LISBON | PORTUGAL ・JULY 4 – 7, 2016
Fig. 12 Standard deviation of the pressure coefficient measured at a relative radial position of 77%
4. Conclusion and outlook A new method has been applied for the detection of dynamic stall on rotating blades in cyclic pitch. The method works robustly on carbon fiber composite blades and does not require contact with the surface, any kind of surface treatment or instrumentation and can produce maps of the surface on which stalled and attached flow areas are detailed. The measurements require a sufficiently sensitive infrared camera with appropriate spatial resolution and the differential analysis of images (DIT) between consecutive images. The standard deviation value, σDIT, is high for separated flow and low for attached flow and this has been verified by comparison to unsteady pressure distributions. The method works for a relatively high pitching rate of 23.6Hz, when a rotating mirror is used in order to avoid motion blur at long exposure times required for the differential method. A moving window can be used in order to produce spatially resolved stall maps. The MCT camera used during the tests offers the advantage of high sensitivity at very short exposure times, but has only a limited spatial resolution and severe pixel noise. Heineck et al. (2016) for example obtained excellent results on a rotor in hover with a thermal camera with a 1kx1k pixel InSb sensor (FLIR SC8250). Their rotating mirror set up allowed for exposure times of up to 4.5ms. Since the rotating mirror was required to allow for 300µs exposure time and intensity levels high enough for the differential analysis, it is assumed that results can be improved by the use of slower cameras with higher resolution and lower pixel noise. This and the more detailed analysis of the influence of the model surface features required for high measurement fidelity is the focus of ongoing research.

18th International Symposium on the Application of Laser and Imaging Techniques to Fluid Mechanics・LISBON | PORTUGAL ・JULY 4 – 7, 2016
5 Acknowledgments
The authors are grateful for the assistance of Markus Krebs during the experiments.
References Bousman WG (1998) A Qualitative Examination of Dynamic Stall from Flight Test Data. Journal of the American Helicopter Society, 43(4):279-295. De Luca L, Carlomagno GM, Buresti G (1990) Boundary-layer diagnostics by means of an infrared scanning radiometer. Experiments in Fluids, 9(3):121-128. Disotell KJ, Peng D, Juliano TJ, Gregory JW, Crafton JW, Komerath NM (2014) Single-shot temperature- and pressure-sensitive paint measurements on an unsteady helicopter blade. Experiments in Fluids, 55(2):1-15. doi: 10.1007/s00348-014-1671-2 Gardner AD, Richter K (2015) Boundary layer transition determination for periodic and static flows using phase-averaged pressure data. Experiments in Fluids, 56(6):1-13. doi: 10.1007/s00348-015-015-1992-9 Gardner AD, Wolf CC, Raffel M (2016) A new method of dynamic and static stall detection using infrared thermography. Accepted for publication on the European Rotorcraft Forum, Lille, France, September 2016 Gartenberg E, Wright RE (1994) Boundary-layer transition detection with infrared imaging emphasizing cryogenic applications. AIAA J 32(9):1875–1882 Grawunder M, Reß R, Breitsamter C (2016) Thermographic transition detection for low-speed wind-tunnel experiments. AIAA J, 54(6):2012-2016 Gustafson FB, Myers GC Jr (1946) Stalling of Helicopter Blades. NACA Report No. 840.

18th International Symposium on the Application of Laser and Imaging Techniques to Fluid Mechanics・LISBON | PORTUGAL ・JULY 4 – 7, 2016
Heineck JT, Schairer ET, Roozeboom NH, Ramasami M (2016) Simultaneous boundary layer transition, tip vortex, and blade deformation measurements of a rotor in hover. AHS Technical Meeting on Aeromechanics Design for Vertical Lift, San Francisco, CA Merz CB, Wolf CC, Richter K, Kaufmann K, Mielke A, Raffel M (2015) Spanwise Differences in Static and Dynamic Stall on a Pitching Rotor Blade Tip Model. 41st European Rotorcraft Forum, Munich, Germany. Mulleners K, Kindler K, Raffel M (2012) Dynamic stall on a fully equipped helicopter model. Aerospace Science and Technology 19:72-76. doi:10.1016/j.ast.2011.03.013 Quast A (1987) Detection of Transition by Infrared Image Technique. In: ICIASF’87 - 12th International Congress on Instrumentation in Aerospace Simulation Facilities, Williamsburg, VA, vol. 1, pp 125-134. Raffel M, Merz CB, Schwermer T, Richter K (2015) Differential infrared thermography for boundary layer transition detection on pitching rotor blade models. Experiments in Fluids, 56(2):1-13. doi: 10.1007/s00348-015-1905-y Raffel M, Heineck JT (2014) Mirror-Based Image Derotation for Aerodynamic Rotor Measurements. AIAA Journal, 52(6):1-5. Raffel M, Merz CB (2014) Differential Infrared Thermography for Unsteady Boundary-Layer Transition Measurements. AIAA Journal, DOI: 10.2514/1.J053235. Richter K, Wolf CC, Gardner AD, Merz CB (2016) Detection of Unsteady Boundary Layer Transition Using Three Experimental Methods. Paper AIAA-2016-1072, 54th AIAA Aerospace Sciences Meeting, AIAA SciTech, San Diego, CA, USA. Schwermer T, Merz CB, Richter K, Frieling D, Raffel M (2014) Differential Infrared Thermography for Transition Detection on Rotor Blades. 17th International Symposium on Applications of Laser Techniques to Fluid Mechanics, Lisbon, Portugal.

18th International Symposium on the Application of Laser and Imaging Techniques to Fluid Mechanics・LISBON | PORTUGAL ・JULY 4 – 7, 2016
Schwermer T, Richter K, Raffel M (2016) Development of a Rotor Test Facility for the Investigation of Dynamic Stall. In: Dillmann A et al. (eds) New Results in Numerical and Experimental Fluid Mechanics X, Notes on Numerical Fluid Mechanics and Multidisciplinary Design, Volume 132,Springer, pp 663-673. doi: 10.1007/978-3-319-27279-5 58 Simon B, Filius A, Tropea C, Grundmann S (2016) IR thermography for dynamic detection of laminar-turbulent Transition. Experiments in Fluids, 57:93, DOI 10.1007/s00348-016-2178-9 Thomann H, Frisk B (1968) Measurement of Heat Transfer with an Infrared Camera. International Journal of Heat and Mass Transfer, 11:819-826.