Embed Size (px)
Citation preview

Introduction
Oestrogen receptors (ERs) are key mediators of oestrogen functionand play roles in many pathological processes, including carcino-genesis [1]. Although the roles of ER� in carcinogenesis are rela-tively well understood, the roles of ER� remain uncertain. This ispartly because analyses have been confused by consistent discrep-ancies between ER� expression at mRNA and protein levels inbreast tissue [2–3], leading to difficulties in interpreting mRNAexpression data. In addition, ER� is expressed as five functionallydistinct isoforms [4], yet their roles have frequently been studied incombination at the level of total ER�. ER� appears to be anti-pro-liferative and anti-apoptotic, and has been discussed as a tumoursuppressor [5–9]. However, the specific effects of each isoformand whether these result from independent actions as transcription
factors, or via hetero-dimerization with other receptors remainundetermined [10–11]. An understanding of how ER� mRNA andprotein levels relate, and how expression of each individual isoformis determined would provide useful background from which toassess the importance of each isoform more effectively.
In recent years, evidence has accumulated that deregulation ofgene-specific translation plays a role in oncogenic transformationand tumour progression [12]. Translation occurs mainly by a cap-dependent mechanism with most regulation during initiation [13].Initiation involves translational machinery binding to the mRNAcap and scanning along the 5� untranslated region (UTR) to thereading frame, where an initiation codon is recognized and proteinsynthesis starts [14]. 5�UTRs are thus placed in unique positionsto regulate the efficiencies of recruitment and scanning of thetranslational machinery [15]. In particular, translation can beinhibited by the presence within 5�UTRs of upstream open readingframes (uORFs) or regions that form stable secondary structures[16–17]. Many mRNAs have short 5�UTRs (composed of �50nucleotides) that lack these motifs and consequently these5�UTRs are thought to have little regulatory effect on translation[18–19]. A substantial minority of mRNAs have long 5�UTRs
Differential regulation of oestrogen receptor � isoforms
by 5� untranslated regions in cancer
Laura Smith a, Rebecca A. Brannan b, Andrew M. Hanby b, Abeer M. Shaaban b, Eldo T. Verghese b, Mark B. Peter a, Steven Pollock a, Sampoorna Satheesha a,
Marcin Szynkiewicz a, Valerie Speirs a, Thomas A. Hughes a, *
a Leeds Institute of Molecular Medicine, Leeds University, Leeds, UKb Department of Histopathology, St James’s University Hospital, Leeds, UK
Received: June 2, 2009; Accepted: July 16, 2009
Abstract
Oestrogen receptors (ERs) are critical regulators of the behaviour of many cancers. Despite this, the roles and regulation of one of thetwo known ERs – ER� – are poorly understood. This is partly because analyses have been confused by discrepancies between ER�expression at mRNA and proteins levels, and because ER� is expressed as several functionally distinct isoforms. We investigated humanER� 5� untranslated regions (UTRs) and their influences on ER� expression and function. We demonstrate that two alternative ER�5�UTRs have potent and differential influences on expression acting at the level of translation. We show that their influences are mod-ulated by cellular context and in carcinogenesis, and demonstrate the contributions of both upstream open reading frames and RNA sec-ondary structure. These regulatory mechanisms offer explanations for the non-concordance of ER� mRNA and protein. Importantly, wealso demonstrate that 5�UTRs allow the first reported mechanisms for differential regulation of the expression of the ER� isoforms 1,2 and 5, and thereby have critical influences on ER� function.
Keywords: breast cancer • ER� • 5�UTRs • translation • uORFs • RNA structure • alternative splicing
J. Cell. Mol. Med. Vol 14, No 8, 2010 pp. 2172-2184
*Correspondence to: Thomas A. HUGHES,Leeds Institute of Molecular Medicine,St. James’s University Hospital,Leeds, LS9 7TF, UK.Tel.: 44 113 3438422Fax: 44 113 3438431E-mail: [email protected]
© 2009 The AuthorsJournal compilation © 2010 Foundation for Cellular and Molecular Medicine/Blackwell Publishing Ltd
doi:10.1111/j.1582-4934.2009.00867.x

J. Cell. Mol. Med. Vol 14, No 8, 2010
2173© 2009 The AuthorsJournal compilation © 2010 Foundation for Cellular and Molecular Medicine/Blackwell Publishing Ltd
(�200 nucleotides) and/or contain these regulatory sequences[20]. Interestingly, many oncogenes and tumour suppressorgenes express these atypically long or complex 5�UTRs, highlight-ing the importance of 5�UTRs in carcinogenesis [19]. Various cel-lular activities impact on the degrees of translational inhibitionspecified by these 5�UTRs allowing them to act as sites of regula-tion; for example changes in activities of translation factors eIF2�
and eIF4E modify the influences of uORFs and secondary struc-tures, respectively [21–22]. It is also clear that further layers ofregulation involving 5�UTRs exist, since many genes allow expres-sion of alternative 5�UTRs resulting from use of multiple tran-scriptional start sites or from differential splicing [23]. Alternative5�UTRs allow tissue- and/or stimuli-specific gene regulation bycontrol of relative proportions of 5�UTRs with different transla-tional properties in the total pool of mRNAs from that gene [24].Given the wide range of cancer-related genes that allow expressionof potentially regulatory 5�UTRs and the frequency of expressionof multiple 5�UTRs, deregulation of translation via inappropriateexpression of UTR-regulatory factors and/or changes in relativeproportions of alternative 5�UTRs is thought to play a key role incarcinogenesis [12].
Our hypothesis was that regulation of ER� translation isresponsible for the non-concordance of ER� mRNA and proteinlevels, and provides an important level of regulation of total ER�
expression and expression of specific ER� isoforms. Accordingly,we have investigated the influences of ER� 5�UTRs. We show thatER� 5�UTRs have potent differential influences on expression ofER� isoforms, and that these are modulated by cellular contextand in carcinogenesis.
Materials and methods
Cell culture, transfection and flow-cytometry
Cell lines were obtained from Dr. Valerie Speirs (University of Leeds; BT-20, HB2, MCF7, MDA-MB-231 and MDA-MB-453), Prof Pamela Rabbitts(Univesity of Leeds; A549) or ATCC (H1299). Culture and transfection con-ditions are shown in Table S1. For flow-cytometry, cells were removedfrom wells with trypsin and resuspended in fresh medium containing 1%serum. GFP expression was quantified (mean fluorescent intensity of 104
events after exclusion of debris/dead cells on the basis of forward activatedlight scatter versus side scatter) at 525 nm (LSRII, BD Biosciences,Oxford, UK). Gates were set so that �1% of untransfected cells weredefined as expressing GFP.
Plasmids
pTH-GFPa and pcDNA3HA-eIF4E have been described previously [25–26].UTR reporters were created by cloning UTRs upstream of the GFP ORF inpTH-GFPa using a cloning strategy described previously [27]. Importantly,this strategy results in the removal of the 5� end of the multiple cloning site,therefore inserted 5�UTRs are immediately adjacent to the transcriptionalstart site with no restriction sites intervening. QuikChange Lightning
(Stratagene, La Jolla, CA, USA) was used for mutagenesis. All primers arelisted in Table S2.
cDNA synthesis and PCR
All primers are listed in Table S2. RNA was purified from cells with RNeasykits (Qiagen, Crawley, UK) or tissues with Trizol (Sigma, Poole, UK); con-taminating DNA was removed with Turbo DNase I (Applied Biosystems,Warrington, UK). First strand cDNA was synthesized using SuperScript II(according to the manufacturer’s protocol) and oligo(dT) or random hexa-mers, or SuperScript III and ER� isoform specific primers. The SuperscriptIII protocol was modified to enhance primer specificity. RNA and primers(0.4 pmol) were heated (80�C, 2 min.) and cooled to 55�C (0.03�C/s). Amaster mix (RNase OUT [Invitrogen, Paisley, UK], dNTPs, DTT, buffer,Superscript) was incubated at 55�C (5 min.) and then mixed with RNAs.Reactions were incubated (55�C 50 min.; 70�C 10 min.). cDNAs panels fornormal human tissues and matched normal and tumour lung tissues werepurchased (Clontech, Mountain View, CA, USA; 637260, 631765).Thorough semi-quantitative PCR analyses were performed at least twicefor each cDNA sample exactly as described previously [27]; in particular,PCR reactions were analysed after at least three different numbers ofcycles in order to establish that the products shown were taken from reac-tions within the linear range of amplification; representative data areshown. Note that products in lanes marked with asterisks were unde-tectable after 55 cycles of amplification. In some lanes, products were onlydetectable after this level of amplification – these products are not shown,in order to preserve the linear PCR dynamics of the other reactions, but arenot marked with asterisks to indicate that they can be detected. Triplicatereal-time PCR analysis was performed (Applied Biosystems SYBR® GreenPCR Master Mix and 7900HT machine). Dissociation curves and serialcDNA dilutions were performed to ensure primer specificities and equalamplification efficiencies. Reactions were also performed with templatelacking reverse transcriptase (RT): products were either undetectable orgreatly reduced (�30,000 fold less products than the equivalent RT�)hence genomic DNA contamination was not considered to interfere withour data. 5�RACE reactions were performed with 5�RACE System2(Invitrogen). Products were analysed on 2.5% agarose (0.5 g/ml ethid-ium bromide, 1TBE) and visualized on an UV trans-illuminator. Productswere excised from gels and cloned into pGEM-Teasy (Promega, Madison,WI, USA); up to five clones for each were sequenced.
Western blotting
This was performed as previously [27] using SDS 4–15% polyacrylamidegels (Bio-Rad Laboratories, Hercules, CA, USA) and Hybond-ECL mem-brane (Amersham Biosciences, Buckinghamshire, UK). Membranes wereincubated (4�C overnight) with rat anti-HA (Roche, Basel, Switzerland,3F10; 1:1500), anti eIF4E (Santa Cruz, USA, sc9976, 1:500) or �-actin(Sigma AC-15; 1:10,000) and HRP-conjugated secondaries (Santa CruzBiotech, Santa Cruz, CA, USA; 1:1000; 1 hr), before being visualized withSupersignal pico (Pierce, Northumberland, UK).
Patient samples and immunohistochemistry (IHC)
Ethical approval was obtained (Leeds East 05/Q1206/136, 00/102 and02/029). For initial semi-quantitative PCR analyses, breast tumour

2174 © 2009 The AuthorsJournal compilation © 2010 Foundation for Cellular and Molecular Medicine/Blackwell Publishing Ltd
samples were collected prospectively, matched normal and tumour cellswere dissected on the basis of histology under guidance of breast pathol-ogists (AMH, AMS) and RNA was extracted immediately. For IHC,archival breast cancer specimens were obtained for 424 patients whowere treated at the LTH NHS Trust from 1983 to 2006. Tissue microar-rays (TMAs) were constructed from these cases using 0.6 mm coresselected from the most representative tumour area (determined byhaematoxylin and eosin staining). IHC analyses for ER� isoforms wereperformed exactly as we have previously validated and described [28].For eIF4E, antigens were retrieved by 2 min. pressure-cooking (boilingand maximum pressure) in antigen un-masking solution (Vector,Burlingame, CA, USA) and sections were stained with anti-eIF4E (sc-9976, Santa Cruz Biotech; 1:100 TBS; 4�C, overnight). This antibody haspreviously been validated for IHC [29]. Envision detection was used(DAKO, Glostrup, Denmark). Negative controls (primary antibodies omit-ted) were included in each IHC run; adjacent normal epithelium, lympho-cytes and blood vessel endothelium served as internal controls. Slideswere scanned into Spectrum Web Viewer (Aperio Technologies, Vista,CA, USA). Cores were scored for immunoreactivity by two independentindividuals taking into account both average staining intensity and per-centage positively stained tumour cells (ER� isoforms [30], eIF4E [31]),under supervision of consultant breast pathologists (AMH, AMS). Whereindependent scores differed consensus scores were determined. Somedata were not available due to TMA core loss during processing (a well-recognized problem associated with TMA IHC), meaning that a totalcohort of 408 with follow up data was available.
RNA structure and statistical analyses
Modelling was performed with mfold v3.1 as previously [27]. This algo-rithm predicts potential secondary structures for RNA molecules byfinding base-pairing solutions that are sterically possible and release thegreatest amount of free energy (G). �G represents the free energy releasedduring structural folding; more stable structures release more energy asthey form and therefore have greater �G values [32]. The Student’s t-testor Spearman correlation was used for statistical analyses using MicrosoftExcel or SPSS (SPSS, Inc., IL, USA). Correlation coefficients were inter-preted as follows: �0.2 little (if any) correlation, 0.2–0.5 weak correlation,0.5–0.8 moderate correlation. All P-values were two-sided; P � 0.05 wasconsidered significant.
Results
Alternative ER� 5�UTRs are differentiallyexpressed in human cells
We identified four alternative 5�UTRs for ER� from the literature[33] and from Genbank, which we have termed UTRa, UTRa-long,UTRb and UTRc. Figure 1(A) shows an alignment of mRNAs containing these 5�UTRs with the 5� end of the human ER� geneon 14q23. The gene includes two promoters (black arrows) thatallow expression of different untranslated first exons (E0K andE0N), while a further section of untranslated sequence and the
translational start site are within exon 1 (E1). Alternative splicingand transcriptional start sites allow expression of UTRa (e.g.accession BC024181), UTRa-long (e.g. NM_001040276), UTRb(e.g. AB006589) and UTRc (e.g. NM_001437). These 5�UTRs con-tain motifs that provide potential mechanisms for regulation ofER� translation, including uORFs and regions capable of formingsubstantial secondary structures. UTRa, a-long, b and c have 6, 9,33 and 2 uORFs, respectively. We used computer modelling withthe mfold algorithm to determine potential UTR secondary struc-tures [32]. The degree and stability of structures was quantifiedusing theoretical change in free energies (�G); more stable struc-tures release more energy as they form and have greater �G val-ues. UTRa, a-long, b and c have predicted secondary structureswith �Gs of –84, –305, –400 and –166 kcal/mole, respectively. Forcomparison, the �G of the non-regulatory �-actin 5�UTR is only–24 kcal/mole. In vitro studies have revealed that structures with�Gs greater than –30 kcal/mole can be sufficient to inhibit trans-lation [34]. Our hypothesis was that these alternative 5�UTRs playa role in regulating ER� translation. As a first step in testing thishypothesis, we have investigated the cell types in which these5�UTRs are expressed.
We performed 5�RACE reactions to determine which 5�UTRswere expressed in primary breast tumour cells and in breast celllines. We identified 5�UTR sequences representing UTRa andUTRc, but not UTRa-long or UTRb. In subsequent analyses wewere unable to detect expression of UTRa-long or UTRb in anysample tested (human tissues and a panel of human cell lines;data not shown); therefore we do not believe these UTRs have arole in most human cells and they were not investigated further.Representative RACE reactions using RNA prepared from twoindependent breast tumours are shown in Fig. 1(B). Variable 5�
ends were identified for UTRa and UTRc; these may represent 5�
mRNA truncations but are more likely to represent variation intranscriptional start site as is typical from promoters lacking TATAboxes. We designed primers for analysis of UTRa and UTRcexpression based on sequences common to all the sequencedUTRa and UTRc RACE products (forward primers positioned inthe shaded regions in Fig. 1B; filled arrows in Fig. 1A). Semi-quan-titative PCR analyses of expression of UTRa and UTRc were per-formed on cDNA from human tissues (Fig. 1C). Reactions werealso performed with primers specific for a sequence encoded byexon 1 that is within the ER� reading frame as a measurement oftotal ER� expression, and for glyceraldehyde-3-phosphate dehy-drogenase to allow assessment of relative amounts of overallcDNA template. ER� mRNA was present in all tissues tested andwas expressed most strongly in brain. Clear differential expressionof UTRa and UTRc was observed between tissues; UTRa wasexpressed in pancreas and brain but was undetectable in other tis-sues (asterisks; Fig. 1C), while UTRc showed a wide distribution,although it was expressed at very low levels in heart (onlydetectable following many amplification cycles; not visible in Fig. 1C as lesser amplification was used to preserve the linearityof the other reactions). We also examined whether 5�UTR expres-sion is altered during carcinogenesis by comparing expression in
J. Cell. Mol. Med. Vol 14, No 8, 2010
2175© 2009 The AuthorsJournal compilation © 2010 Foundation for Cellular and Molecular Medicine/Blackwell Publishing Ltd
matched normal and tumour samples from patients with eitherbreast or lung cancers. PCR analyses were performed on cDNAprepared from these tissues as before (using �-actin to determinerelative amounts of total cDNA) (Fig. 1D). As before, ER� mRNAwas present in all tissues tested. Interestingly, UTRa was consis-tently up-regulated in breast and lung tumours relative to matchednormal tissues. In contrast, changes in UTRc expression were lessconsistent. We concluded that UTRa and UTRc have tissue spe-cific distributions in normal cells and are differentially expressedbetween normal and tumour tissues of breast and lung.
5�UTRs define ER� translational efficiency
Next, we investigated whether ER� 5�UTRs directly influencetranslational efficiencies of downstream ORFs using an estab-lished reporter assay [27]. UTRa and UTRc were cloned upstreamof the GFP reading frame in expression vectors. We clonedsequences that were common to all identified UTRa and UTRcRACE products (shaded boxes, Fig. 1B). Following on from ouranalysis of breast and lung tumours (Fig. 1D), breast and lung celllines were used for our analyses. Cells were transiently transfected
Fig. 1 Alternative ER� 5�UTRs are differentially expressed in human tissues and in cancer. (A) Alignment of the 5� end of the human ER� gene withmRNAs containing different 5�UTRs. UTR exons (filled boxes), coding regions (open boxes), transcriptional (black arrows) and translational (ATG)start sites, intron sizes (kbp), and primers used for PCR analysis (grey arrows) are shown. (B) 5� ends of ER� mRNAs correspond to variable positions in exon (E) 0K and E0N. 5�RACE reactions were performed on two breast tumour samples (1 and 2). Products corresponding to the 5� endof E0K (UTRa) or 0N (UTRc) are shown; UTRa was only detected in tumour 1. These (and other) products were sequenced; the diagram showssequence consistently included in transcripts (grey boxes) and sequence containing variable start sites (open boxes and double-headed arrows; vari-ation for UTRa and UTRc spans 35 or 72 bases), with genomic locations with respect to the E1 ATG codon. (C) and (D) PCR analyses showed thatUTRa and UTRc have tissue specific distributions in normal cells and are differentially expressed between breast and lung matched normal and tumourtissues. Heart, brain, placenta, lung, liver, smooth muscle, kidney, pancreas; patients 1–4 (D), normal, tumour) *species not detected. Note: speciesnot visible in (C) and (D) but lacking * were detected after 55 amplification cycles but this is not shown in order to preserve the linear PCR dynam-ics of the other reactions.

2176 © 2009 The AuthorsJournal compilation © 2010 Foundation for Cellular and Molecular Medicine/Blackwell Publishing Ltd
with equal numbers of copies of either empty expression vector(negative control; data not shown) or vector to allow expression ofGFP mRNAs with non-regulatory 5�UTRs (positive control), orwith reporters for UTRa or UTRc (Fig. 2A). GFP protein expressionwas measured by flow-cytometry and GFP mRNA expression wasmeasured by real-time PCR. Protein and mRNA levels were usedto calculate translational efficiencies for each GFP message: theseare amounts of GFP protein produced per unit mRNA and were uti-lized to account for differences in GFP transcription from vectors(Fig. S1). A minimum of two independent experiments were performed and within each experiment three technical replicateswere included. Representative translational efficiencies are shownrelative to positive controls in each cell type (Fig. 2B). Each ER�
5�UTR inhibited GFP translation; in particular, UTRa was strikinglyinhibitory in nature. For example, in HB2 cells, UTRa allowed atranslational efficiency of only 6% of the positive control. A con-sistent pattern of relative influences for each UTR was seen acrossthe cell line panel, with UTRa being more, and UTRc lessinhibitory. However, substantial differences were also observed inabsolute degrees of inhibition between cell lines. For example,UTRa showed a 2.6-fold difference in translational efficiencybetween HB2 and MDA-MB-231 cells. We concluded that ER�
5�UTRs specify the efficiencies with which downstream ORFs aretranslated, and also that these efficiencies are further modulatedby the cellular context.
Upstream ORFs reduce ER�translational efficiency
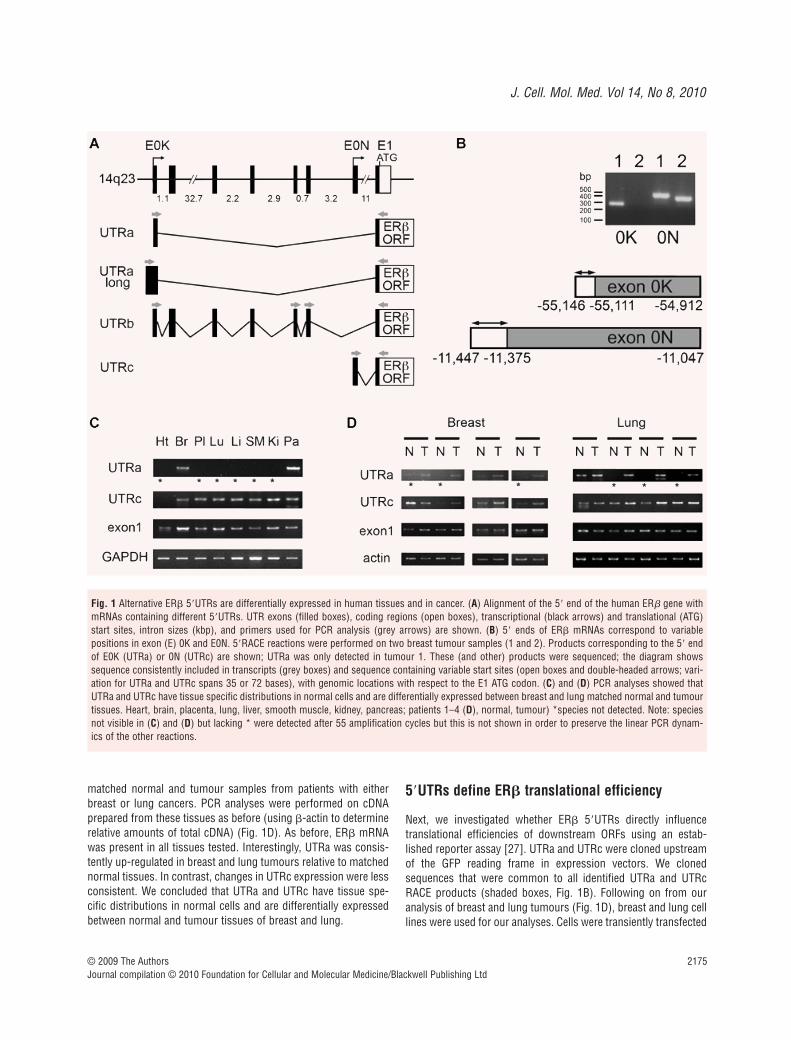
Next, we were interested in which regulatory motifs in the UTRswere responsible for specifying translational inhibition. First, weexamined uORFs, which can reduce translational efficiency bystopping some scanning ribosomes from reaching the true mRNAinitiation codon [35]. UTRa contains six, and UTRc two uORFs.One uORF is encoded within exon 1 (E1), therefore is common toUTRa and UTRc, while the others are unique to each UTR. Startcodons of uORFs are required for their inhibition of expression ofdownstream reading frames. We mutated the start codon of eachuORF within our GFP reporters to test whether particular uORFswere responsible for translational inhibition (Fig. 3A). Cells weretransfected with equal copy numbers of the vectors and transla-tional efficiency was analysed as before (Fig. 3B). Mutation of thestart codons of the first, second, third/fourth and fifth uORFs significantly increased translation from UTRa by 2.0-fold (P �
2.7 10 5), 4.4-fold (P � 2.7 10 6), 1.3-fold (P � 0.02) and1.1-fold (P � 0.03). Mutation of the sixth uORF had no significanteffect. For UTRc, mutation of the start codons of the first and second uORFs also significantly increased translation by 1.1-fold(P � 0.01) and 1.3-fold (P � 5.8 10 5). The Kozak context wasgenerally weak for all uORFs. The first uORF in UTRa showed thestrongest consensus and was shown to have an influence ontranslation. More surprisingly, the second uORF in UTRa had aweaker consensus yet demonstrated a stronger translationaleffect. In order to be confident that these changes related mainly
to loss of uORFs, we also examined how these mutations influ-enced the potential secondary structure formed by the UTRs(using mfold; see above). Each mutation within UTRa causedsmall increases in the extent of structure as assessed by �G, whilemutations within UTRc caused either a small decrease (m1) or asmall increase (m2) in the extent of structure (Table S3). Theseanalyses underline the role of the uORFs since the strikingincreases in translational efficiency seen with UTRa m1 and m2,and with UTRc m2 each occurred despite the presence of smallincreases in potentially inhibitory secondary structure. We havenot examined the effect of combined mutations on uORF function
Fig. 2 5�UTRs regulate ER� translational efficiency. (A) Reporters wereconstructed to express mRNAs containing the GFP reading frame (greybox) preceded by different 5�UTRs (white boxes). Sequences encoded byE0K, 0N and 1 are shown. (B) The translational efficiency specified byeach UTR varies in different cell lines. Cell lines were transiently trans-fected with equal copy numbers of either control or experimental con-structs. GFP protein and mRNA were quantified by flow-cytometry andreal-time PCR, respectively. Translational efficiency (protein synthesizedper unit mRNA) is presented relative to the GFP control that lacks a spe-cialized 5�UTR. Error bars show the standard deviation of technical trip-licates within a representative experiment.
J. Cell. Mol. Med. Vol 14, No 8, 2010
2177© 2009 The AuthorsJournal compilation © 2010 Foundation for Cellular and Molecular Medicine/Blackwell Publishing Ltd
since structural predictions suggest that these mutations maycause more substantial changes in overall secondary structure.We concluded that that uORFs, particularly the first and second inUTRa, and the second in UTRc, play a role in the translational inhi-bition specified by these UTRs.
5�UTR secondary structure reduces ER� translational efficiency
Secondly, we were interested in whether RNA secondary structurewithin these UTRs was responsible for translational inhibition. Wehave already shown in silico that these 5�UTRs may form poten-tially inhibitory secondary structures (see above). The inhibitoryinfluence of 5�UTR structures is especially important in carcino-
genesis since translation of these mRNAs can be specifically de-repressed by the action of the oncogenic translational factor eIF4E[36]. eIF4E is frequently over-expressed in cancers, includingthose of breast [37] and lung [38], leading to enhanced translationof a wide range of cancer-related transcripts. We examinedwhether ER� 5�UTRs specify responsiveness to eIF4E by co-transfecting our 5�UTR GFP reporters with an expression vectorfor eIF4E, and examining translational efficiency as before. Forthese analyses we have used two cell lines, HB2 and MCF7, sincethese have different constitutive eIF4E activities (HB2s expresslow eIF4E levels compared to MCF7s; Fig. S2) and therefore arelikely to respond differently to over-expressed eIF4E.
Cell lines were co-transfected with GFP reporters (Fig. 2A) andeither empty expression plasmids or plasmids allowing eIF4Eover-expression. Western blot analysis was used to confirmexpression of exogenous eIF4E in the appropriate co-transfectedcells (Fig. 4A). Translational efficiencies of reporters were deter-mined as before (Fig. 4B). As expected, the translational efficiencyof the control reporter (GFP), which expresses a non-specialized5�UTR, was not significantly altered in either cell line by eIF4Eover-expression. This demonstrated that over-expression of eIF4Edid not result in non-specific changes in translation. In contrast,translational efficiencies specified by each ER� 5�UTRs wereincreased. In HB2 cells, exogenous eIF4E enhanced translationfrom UTRa by 1.2-fold (P � 0.004) and from UTRc by 1.8-fold (P � 0.0008) (Fig. 4B). Increases were also seen in MCF7 cells(UTRa, 1.2-fold [P � 0.047], UTRc 1.3-fold [P � 0.004]) (Fig. 4B). It is worth emphasizing that the inhibitory effect of UTRcwas relieved by exogenous eIF4E so effectively in HB2 cells thattranscripts were translated as efficiently as uninhibited controls(Fig. 4B). We therefore concluded that secondary structure withinthese 5�UTRs was responsible for inhibition of translation, andthat this inhibition, especially that specified by UTRc, can be over-come by highly active eIF4E – delineating a potential pathway fortranslational de-regulation of ER� in cancer.
Different 3� spliced isoforms are associated with particular 5�UTRs
Having defined influences of ER� 5�UTRs and mechanismsinvolved using reporter assays, we were interested to examinewhether 5�UTRs impacted on endogenous ER� protein. However,this question is complex since the ER� gene gives rise to multipledifferent ER� mRNA isoforms that code for different proteins(ER�1–5). ER�1, 2 and 5 are particularly relevant in breast celllines and cancers, since ER�3 is thought to be testis-specific [4]and ER�4 is not expressed in the breast [39], and we focused onthese. The protein isoforms have identical N-termini but differentC-termini due to differential 3� splicing of their transcripts (Fig. 5A).Importantly, the proteins are functionally distinct being associatedwith differential responses to anti-oestrogens and patient survival[28, 40–42]. We have investigated whether alternative ER�
5�UTRs are differentially associated with mRNAs for each ER�
Fig. 3 uORFs within UTRa and UTRc are responsible for inhibition oftranslation. (A) The start codons within the uORFs of UTRa or UTRc weremutated to UUG or AUC as shown in the context of UTR-GFP reporterconstructs. UTRa and UTRc are shown with sequences encoded by E0Kor 0N as open boxes (with unique uORFs) and by E1 as shaded boxes(containing uORF common to UTRs). (B) MCF7 cells were transfectedwith reporter constructs and translational efficiencies determined relativeto GFP control. Error bars show the standard deviation of technical trip-licates within a representative experiment. The statistical significance ofthe difference between the wild-type UTRs and each mutant is shown: *P � 0.05, **P � 0.001.

2178 © 2009 The AuthorsJournal compilation © 2010 Foundation for Cellular and Molecular Medicine/Blackwell Publishing Ltd
isoform, and therefore would have separate influences on expres-sion of each isoform.
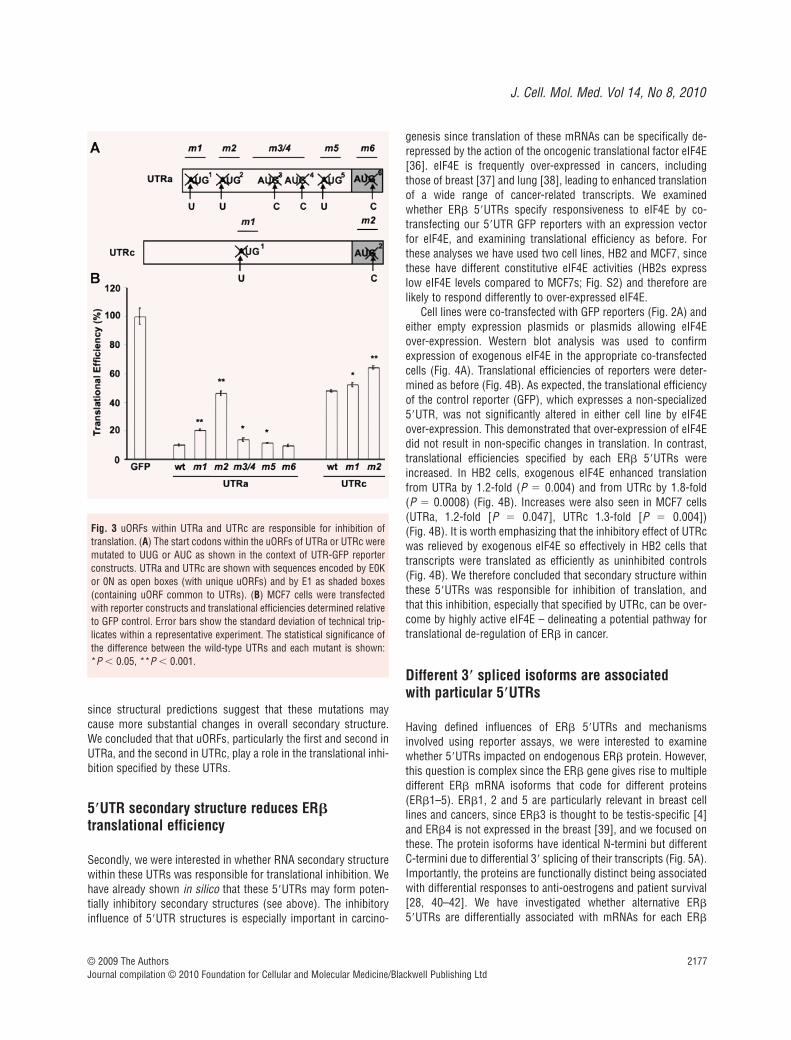
To perform these analyses we synthesized cDNA usingprimers specific for ER�1, 2 or 5 and a protocol to enhanceprimer specificity, thereby creating cDNA pools greatly enrichedfor each specific message of interest (Fig. 5A). ER� isoform spe-cific cDNA pools were prepared from MCF7, HB2 and MDA-MB-231 cells. First, we determined whether enrichment for eachisoform was successful using real-time PCR analysis of levels ofER�1, 2 and 5 cDNA (Fig. 5B). In each case, cDNA pools wereenriched for target isoforms, therefore in subsequent analyses wewere able to examine relative expressions of 5�UTRs on tran-scripts for each isoform in isolation. Relative expression levels of5�UTRs within these enriched cDNAs were then determined usingreal-time PCR for UTRa and UTRc (Fig. 5C–E). Clear differencesin associations of 5�UTRs with mRNAs for specific isoforms wereseen. For example, in MCF7 cells (Fig. 5C), ER�2 mRNAs mainlycontain UTRc (compare lanes 3 and 4) while ER�1 and ER�5mRNAs mainly contain UTRa (lanes 1 and 2, or 5 and 6).Furthermore, these associations varied in different cell lines; forexample, in contrast to MCF7 cells, ER�1 messages mainly con-tained UTRc in both HB2 (Fig. 5D) and MDA-MB-231 cells (Fig. 5E), and UTRa containing ER�5 mRNAs could not bedetected in MDA-MB-231 cells. We concluded that mRNAs foreach isoform have different and cell-type specific proportions ofthe two 5�UTRs. Since we have also shown that ER� 5�UTRsdetermine greatly differing translational efficiencies (Fig. 2) we concluded that the proportions of the UTRs may define theoverall translational efficiencies for each isoform, and therebycontribute to defining each expression level.
5�UTRs define how eIF4E impacts on expression of ER� isoforms in tumours
Since ER� 5�UTRs specified different degrees of response toeIF4E (Fig. 4), we expected that the relative proportions of theseUTRs expressed on transcripts for each isoform would define dif-ferent extents of translational enhancement given by eIF4E over-expression in cancer. We examined this complex regulation intumour tissues by determining whether expression of ER�1, 2 or5 correlated with eIF4E expression. We predicted that correlationswould differ depending on cancer-cell specific factors. For exam-ple, in tumour cells with similar regulation acting as is the case inHB2 cells, high eIF4E expression would stimulate translation ofER�, effecting UTRc containing transcripts most strongly (Fig. 4),and since these were over-represented in mRNAs for ER�1 (Fig. 5), we expected a stronger positive correlation between eIF4Eexpression and ER�1 than with other isoforms. In contrast, inMCF7 or MDA-MB-231 cells UTRc was associated with eitherER�2 (MCF7) or with all three isoforms (MDA-MB-231), thereforewe predicted that tumour cells with similar behaviour to these celllines, would show more varied correlations, with the strongestpositive correlation with ER�2.
Fig. 4 Inhibition of translation by UTRa and UTRc is mediated by regionsof stable secondary structure, and can be relieved by eIF4E. HB2 andMCF7 cells were transiently transfected with equal copy numbers of con-trol or experimental GFP reporter constructs, without (using empty vectoras a control plasmid) or with co-transfection to allow eIF4E overexpres-sion. (A) Expression of exogenous proteins was examined within trans-fected HB2 and MCF7 cells, as shown, by Western blot analysis.Exogenous GFP and eIF4E both include the HA-epitope. (B) Translationalefficiencies of reporters were determined relative to GFP control. Errorbars show the standard deviation of technical triplicates within a represen-tative experiment. The statistical significance of the difference between the UTRs with and without exogenous eIF4E is shown: *P � 0.05, **P � 0.01, ***P � 0.001.
J. Cell. Mol. Med. Vol 14, No 8, 2010
2179© 2009 The AuthorsJournal compilation © 2010 Foundation for Cellular and Molecular Medicine/Blackwell Publishing Ltd
TMAs containing samples from 424 breast tumours wereestablished with mean patient follow up, in terms of disease-freesurvival, of 91.9 months. We performed IHC for eIF4E, ER�1, 2and 5 on sections of these TMAs and assessed immunoreactivitywithin the tumour cells in each core, taking into account both pro-portions of tumour cells staining positively and average intensity.We, and others, have previously extensively validated the speci-ficity of the antibodies we have used for IHC applications [28–29,31]. Due to core loss during processing; a well recognized prob-lem associated with TMAs, scores were available for 408 cases.Representative staining patterns are shown in Fig. 6. For eIF4E,tumour stroma and normal tissue were negative while positivestaining within tumour cells was generally cytoplasmic, althoughnuclear staining was noted in some cases (data not shown [29]).All ER� isoforms investigated were expressed in epithelial andsome stromal cell nuclei. In some cases, additional cytoplasmic
ER�1 expression was seen and cytoplasmic ER�2 was occasion-ally detected in the absence of nuclear immunoreactivity (data notshown, but shown and discussed in our previous work [28]). Thefull range of scores was observed for each antigen, with scores of5, 6, 8, and 8 occurring most frequently for eIF4E, ER�1, ER�2and ER�5, respectively. Associations between markers wereexamined using Spearman’s correlation tests (Table 1). Over thewhole cohort (n � 408), eIF4E expression showed a positive asso-ciation with ER�1 expression (correlation co-efficient r � 0.28;P � 0.0001), although no association with ER�2 or ER�5. We
next examined associations between these markers in two patientgroups, those who experienced recurrences (n � 74) and thosethat did not (n � 334), since we expected correlations to differwith cell-specific factors (Fig. 5), and since both eIF4E [36] and ER� [28] influence the likelihood of recurrences. In the non-recurrence group (n � 334), eIF4E expression showed a positive
Fig. 5 Transcripts for ER�1, 2 and 5 have cell-type specific associations with 5�UTRs. (A) Strategy for analysis of 5�UTRs of transcripts for ER�1, 2and 5. Isoform specific primers (open arrows) were designed to prime reverse transcriptase reactions specifically from only transcripts of ER� iso-forms of interest. Expression of UTRa and UTRc was examined within these isoform-enriched cDNA pools (black arrows). (B) cDNA synthesized usingisoform specific primers was greatly enriched for the ER� isoform of interest. ER� isoform enriched cDNA pools were synthesized from RNA of cellsas shown and real-time PCR was used to determine apparent expressions of ER�1, 2 and 5. (C–E) Real-time PCR was used to determine expressionof UTRa and UTRc within each highly-enriched cDNA pool. UTR expression is expressed relative to each other as indicated. Error bars indicate the stan-dard deviation of technical triplicates within a representative experiment.

2180 © 2009 The AuthorsJournal compilation © 2010 Foundation for Cellular and Molecular Medicine/Blackwell Publishing Ltd
association with expression of only ER�1 (r � 0.28; P � 0.01). In contrast, in the recurrence group (n � 74), eIF4E expressionshowed a positive association with expression of ER�2 (r � 0.27;P � 0.05), and weaker non-significant associations with ER�1 andER�5. We concluded that correlations seen in the patient groupsmirrored the differences we expected based on analysis of cell lines;with regulation occurring within tumours that did not recur resem-bling that in the transformed, but non-malignant HB2 cells, whiletumours that did recur resembled the weakly (MCF7) and strongly(MDA-MB-231) invasive cancer cell lines of metastatic origin.
DiscussionWe have investigated the abilities of ER� 5�UTRs to allow post-transcriptional regulation of ER� expression, and – via differentialeffects on ER� isoforms – ER� function. Initially, we studied fouralternative 5�UTRs (Fig. 1A), although we were only able to showexpression of two and we believe these, UTRa and UTRc, to be themajority species (Fig. 1B–D). Unlike most vertebrate 5�UTRs,these are relatively long (�200 nucleotides) and containsequences with potential to confer translational regulation upon
Fig. 6 Representative breast tumourTMA cores showing immunoreactivityfor eIF4E (A–B), ER�1 (C–D), ER�2(E–F) and ER�5 (G–H). These coreswere scored: A 3, B 7, C 3, D 7, E 3, F 7, G 3, H 7. Examples of areas ofstromal cells or epithelial cancer cellsare labelled ‘S’ or ‘Ep’, respectively.

J. Cell. Mol. Med. Vol 14, No 8, 2010
2181© 2009 The AuthorsJournal compilation © 2010 Foundation for Cellular and Molecular Medicine/Blackwell Publishing Ltd
their mRNAs. We have demonstrated that these 5�UTRs directlyinhibit translation of downstream reading frames (Fig. 2), and wehave determined that uORFs (Fig. 3) and stable secondary struc-tures (Fig. 4) are responsible for these effects. Importantly, wehave found that these 5�UTRs act as sites of regulation of expres-sion, rather than of invariant repression, by at least two separatemechanisms. First, we found that the degree of translational inhi-bition specified by each 5�UTR depended on the cellular context;UTRa was generally strongly inhibitory, but the degree of transla-tion varied in different cell lines by up to 2.6-fold when comparingthe least inhibited to the most. UTRc was generally much lessinhibitory, although similar variation was seen (up to 1.9-fold)between cell lines. It is clear that changes in expression or activ-ity of cellular factors (including, for example, eIF4E; Fig. 4) canalter the degree of translation from ER� transcripts. Secondly, therelative proportions of each UTR within either the total pool of ER�
transcripts (Fig. 1C and D) or within transcripts for a specific ER�
isoform (Fig. 5C–E) varied substantially, therefore altering the nettranslational efficiency for that isoform. ER� would be more highlyexpressed in cells that express a greater proportion of UTRc (forexample, ER�2 transcripts in MCF7 cells; Fig. 5C), since thesetranscripts would be translated relatively efficiently (Fig. 2), ascompared to lower expression from transcripts containing amajority of UTRa (for example, ER�5 transcripts in MCF7 cells;Fig. 5C). Thus, ER� expression is defined not only by the totalamount of mRNA, but also by the proportions of the different5�UTRs within these messages, and by the cell-type specific trans-lational efficiency specified by each UTR. ER� joins a growing listof potential oncogenes and tumour suppressor genes for whichthis has been reported [27, 43–44]. The fact that proportions ofER� 5�UTRs differ for transcripts coding for each ER� isoformseparately (Fig. 5) demonstrates the potential complexity of theseregulatory mechanisms.
It is important to note that differing proportions of these5�UTRs are associated with mRNAs with different 3� splice pat-terns and this has fundamental implications for transcription andmRNA processing dynamics. It appears that in MCF7 cells, if tran-scription initiates at E0K the mRNAs contain UTRa and are likelyto be spliced at their 3� ends into transcripts for ER�1 or ER�5,and are relatively unlikely to become ER�2 transcripts (Fig. 5C). Incontrast, if transcription initiates at E0N the mRNAs contain UTRcand are more likely to be spliced at their 3� ends to form ER�2. An
interesting question is how could either the transcriptional startsite and/or the presence of a particular 5�UTR influence 3� splic-ing taking place mega-bases of DNA away? It is also evident thatthis influence is itself regulated by cellular context as a differentrelationship between the transcriptional start site/5�UTR and 3�
splicing was observed in HB2 cells (Fig. 5D). Cross-talk betweenmRNA 5� ends and 3� splicing has been reported only rarely andvarious models have been proposed [45–46]. These includerecruitment at specific promoters and maintenance within theextending polymerase complex of transcription factors with func-tions in both transcription and splicing [47–48]. Alternatively, 5�
mRNA structure may influence alternative splicing by controllingpolymerase processivity [46, 49–50] or by binding directly tosplicing factors. It has been estimated that at least 10–18% ofgenes have multiple promoters [24, 51] allowing expression ofalternative 5�UTRs and that the majority of genes show differentialsplicing within their coding regions [48], therefore this regulatorycross talk may be extremely influential.
ER� deregulation in cancer
The role and expression of ER� in carcinogenesis is poorly under-stood. ER� appears to be anti-proliferative and pro-apoptotic,although details differ as to whether effects of each isoform resultfrom their independent actions as transcription factors, or via het-ero-dimerization with other receptors [10–11]. Expression ofER�1 is down-regulated during carcinogenesis in breast andcolon, as one might expect for an anti-proliferative molecule, andconsequently ER� has been discussed as a tumour suppressor[52–54], although this may be misleading given the different func-tions of the other isoforms. ER�2 appears to be up-regulated dur-ing carcinogenesis [55–56], while little is known about these pat-terns of expression of ER�5. In terms of prognostic value, con-flicting reports abound, with expression of ER�1 but not ER�2[42], or ER�2 and 5 but not ER�1 [28, 40–41] being associatedwith good prognosis, or with ER�2 associated with poor progno-sis [57]. This suggests that these isoforms should be consideredas functionally distinct receptors. Even less is known about theregulatory mechanisms responsible for the expression changes incancer, although hypermethylation of the ER� promoter has beensuggested as a mechanism for loss of ER�1 expression [5, 54,
Table 1 eIF4E expression is differentially associated with ER� isoforms in breast tumours that did or did not recur. Spearman’s rho analyseswere performed to examine correlations between expression of eIF4E and ER�1, 2 and 5 in a cohort of breast tumours. Correlation coefficientsare shown for the whole cohort (n � 408), and for the cohort split into patients who did (n � 74), or did not suffer recurrences (n � 334). Thethree strongest and most significant associations are highlighted in bold. *P � 0.05; **P � 0.01; *** P � 0.001.
eIF4E ER�1 ER�2 ER�5
Whole cohort: (n � 408) 0.28*** 0.15* 0.16*
Non-recurrences: (n � 334) 0.28** 0.12 0.15*
Recurrences: (n � 74) 0.24 0.27* 0.21

2182 © 2009 The AuthorsJournal compilation © 2010 Foundation for Cellular and Molecular Medicine/Blackwell Publishing Ltd
58]. It is well established that changes in translational efficiency ofkey oncogenes and tumour suppressor genes are associated withand contribute to carcinogenesis [12]. Here, we provide evidencethat translational regulation allows deregulation of ER� expres-sion in cancer by three related mechanisms.
First, we show that UTRa, which specifies very inefficienttranslation (Fig. 2B), is up-regulated in breast and lung tumoursrelative to matched normal tissues in the absence of up-regulationof total message (Fig. 1D). The result is a higher proportion oftranslationally repressed transcripts within the total ER� mRNApool, and therefore protein expression would be down-regulatedwithin tumours, as has been reported [53–54, 56]. A change inratio of differentially acting 5�UTRs has also been implicated in thederegulation of other tumour suppressors and oncogenes, includ-ing BRCA1 [44] and Mdm2 [43]. Secondly, the translational effi-ciencies of ER� mRNAs were increased by eIF4E (Fig. 4). Thistranslation factor is overexpressed in a wide range of cancers[37–38, 59–60], and contributes to carcinogenesis by derepress-ing translation of cancer-related transcripts that are otherwiseinefficiently translated on account of 5�UTR secondary structures[21]. This mechanism allows up-regulation of ER� expressionduring carcinogenesis and is dependent on the degree of eIF4Eactivity. Since ER�1 has been discussed as a tumour suppressor[52–54], it may seem surprising to uncover a mechanism for itsup-regulation in cancer. However, this up-regulation could act as adriving force for expression loss by other mechanisms during themolecular evolution of tumours. In addition, and supported by ourwork, eIF4E is likely to act differentially on the different ER� iso-forms – some of which have no reported tumour suppressor func-tion. With this in mind, we finally examined how these mecha-nisms combine to allow changes in expression of specific ER�
isoforms. We showed that 5�UTRs were differentially associatedwith transcripts for ER�1, 2 and 5 (Fig. 5) and demonstrated a dif-ferential response of the UTRs to eIF4E (Fig. 4), allowing us toinfer that overexpression of eIF4E in cancer would cause differentdegrees of induction of each isoform. Therefore, we examinedassociations between expressions of eIF4E and ER�1, 2 and 5 ina large cohort of invasive breast cancers (Fig. 6, Table 1). Theassociations between ER� isoforms and eIF4E varied betweenpatients that had a recurrence and those that did not, suggestingthat eIF4E not only had a differential influence on translation ofeach isoform, but that this influence was dependent on furthertumoral factors. In particular, eIF4E apparently stimulated theexpression of ER�1 in tumours that did not recur, and the expres-sion of ER�2 in tumours that did recur. These observations mir-rored our observations in cell lines where eIF4E would preferen-tially stimulate expression of ER�1 in HB2 cells, an immortalizedbreast cell line without malignant or metastatic properties, sincethe 5�UTR associated with ER�1 transcripts responds moststrongly to eIF4E (Figs 4 and 5D). Similarly, the 5�UTR expressionpatterns for each ER� isoform in MCF7 cells, a more aggressivebreast cell line of malignant and metastatic origin, would meanthat eIF4E would preferentially stimulate ER�2 expression in thesecells (Figs 4 and 5C). Breast cancer cell lines are likely to reflect
features of cancer cells in vivo [61], therefore this correlation alsovalidated our use of these in vitro models within the study.Unfortunately, reliable quantitative detection of either the proteinisoforms in cell lines, or the mRNA species in archival tumour tissues is not possible, hence we are unable to confirm that theregulation occurring within HB2 and MCF7 cells is truly represen-tative of these tumours. It is worth noting that eIF4E expressiondid not significantly associate with expression of all three isoformssimultaneously, as would be predicted if the tumours’ 5�UTRexpression patterns were as seen in MDA-MB-231 cells (Fig. 5E).A probable explanation is that MDA-MB-231 cells have a basalphenotype and these tumours were rare within our cohort.
Conclusion
We have defined complex regulatory mechanisms for ER� thathave a role in deregulation of ER� expression in cancer.Importantly, these are the first reported insights into separate reg-ulation of expression of the functionally distinct ER� isoforms,and are therefore likely to be critical in defining ER� function.Interestingly, our data also provide novel evidence of a role forpromoter or 5�UTR elements in the regulation of alternative splic-ing downstream.
Acknowledgements
We thank Nahum Sonenberg for the eIF4E plasmid and Nigel Groome andPhillipa Saunders for the ER�5 antibody. We also thank Mike Shires fortechnical assistance with IHC. We also thank Breast Cancer Campaign, theBreast Cancer Research Action Group and Yorkshire Cancer Research forfunding.
Supporting Information
Additional Supporting Information may be found in the online ver-sion of this article:
Fig. S1 Translational efficiencies (C) from GFP mRNA expressionlevels, as determined by real-time PCR analyses and normalized tocontrol (A) and GFP protein expression levels, as determined fromthe mean fluorescence intensity of cell populations and normal-ized to control (B). Representative data from transfection of MCF7cells with either the control GFP reporter, or the reporters for UTRaand UTRc are shown.
Fig. S2 HB2 cells express lower levels of endogeneous eIF4E pro-tein than MCF7 cells. Expression of eIF4E, or beta-actin, wasexamined within protein lysates of HB2 and MCF7 cells byWestern blotting.

J. Cell. Mol. Med. Vol 14, No 8, 2010
2183© 2009 The AuthorsJournal compilation © 2010 Foundation for Cellular and Molecular Medicine/Blackwell Publishing Ltd
Table S1 Culture and transfection conditions
Table S2 Primer details
Table S3 Mutations of each uORF within UTRa caused smallincreases in the extent of structure relative to the wild-typesequence as assessed by �G, whereas mutations within UTRc
caused either a small decrease or small increase in the extent ofstructure relative to the wild-type.
Please note: Wiley-Blackwell are not responsible for the content orfunctionality of any supporting materials supplied by the authors.Any queries (other than missing material) should be directed tothe corresponding author for the article.
References
1. Sommer S, Fuqua S. Estrogen receptorand breast cancer. Semin Cancer Biol.2001; 11: 339–52.
2. O’Neill P, Davies M, Shaaban A, et al.Wild-type ER�1 mRNA and proteinexpression in Tamoxifen-treated post-menopausal breast cancers. Br J Cancer.2004; 91: 1694–702.
3. Speirs V. ER� in breast cancer: good, bad,or still too early to tell? J Pathol. 2002;197: 143–7.
4. Moore J, McKee D, Slentz-Kesler K,et al. Cloning and characterization ofhuman ER� isoforms. Biochem BiophysRes Commun. 1998; 247: 75–8.
5. Bardin A, Boulle N, Lazennec G,et al. Loss of ER� expression as a com-mon step in estrogen-dependent tumorprogression. Endocr Relat Cancer. 2004;11: 537–51.
6. Galluzzo P, Caiazza F, Moreno S, et al.Role of ERbeta palmitoylation in the inhibi-tion of human colon cancer cell prolifera-tion. Endocr Relat Cancer. 2007; 14:153–67.
7. Lazennec G. Estrogen receptor beta, apossible tumor suppressor involved inovarian carcinogenesis. Cancer Lett. 2006;231: 151–7.
8. Stettner M, Kaulfuss S, Burfeind P, et al.The relevance of estrogen receptor-betaexpression to the antiproliferative effectsobserved with histone deacetylaseinhibitors and phytoestrogens in prostatecancer treatment. Mol Cancer Ther. 2007;6: 2626–33.
9. Treeck O, Lattrich C, Springwald A, et al.Estrogen receptor beta exerts growth-inhibitory effects on human mammaryepithelial cells. Breast Cancer Res Treat.2009; DOI 10.1007/s10549–009-0413–2.
10. Leung Y, Mak P, Hassan S, et al. ER�
isoforms: a key to understanding ER�
signalling. PNAS. 2006; 103: 13162–7.11. Zhao C, Matthews J, Tujague M, et al.
ER�2 negatively regulates the transactiva-
tion of ER� in human breast cancer cells.Cancer Res. 2007; 67: 3955–62.
12. Audic Y, Hartley R. Post-transcriptionalregulation in cancer. Biol Cell. 2004; 97:479–98.
13. Gray N, Wickens M. Control of translationinitiation in animals. Annu Rev Cell DevBiol. 1998; 14: 399–458.
14. Pain V. Initiation of protein synthesis ineukaryotic cells. Eur J Biochem. 1996;236: 747–71.
15. Gebauer F, Hentze M. Molecular mecha-nisms of translational control. Nat RevMol Cell Biol. 2004; 5: 827–35.
16. Kozak, M. Regulation of translation viamRNA structure in prokaryotes andeukaryotes. Gene. 2005; 361: 13–37.
17. Morris D, Geballe A. Upstream ORFs asregulators of mRNA translation. Mol CellBiol. 2000; 20: 8635–42.
18. Kozak, M. An analysis of 5�-noncodingsequences from 699 vertebrate messengerRNAs. Nucleic Acids Res. 1987; 15:8125–48.
19. Kozak, M. An analysis of vertebrate mRNAsequences: intimations of translationalcontrol. J Cell Biol. 1991; 115: 887–903.
20. Pesole G, Mignone F, Gissi C, et al.Structural and functional features of eukary-otic mRNA UTRs. Gene. 2001; 276: 73–81.
21. Koromilas A, Lazaris-Karatzas A,Sonenberg N. mRNAs containing exten-sive secondary structure in their 5� non-coding region translate efficiently in cellsoverexpressing initiation factor eIF4E.EMBO J. 1992; 11: 4153–58.
22. Wek R, Jiang H, Anthony T. Coping withstress: eIF2 kinases and translational con-trol. Biochem Soc Trans. 2006; 34: 7–11.
23. Hughes, T. Regulation of gene expressionby alternative UTRs. Trends Genet. 2006;22: 119–22.
24. Zhang T, Haws P, Wu Q. Multiple variablefirst exons: a mechanism for cell- and tis-sue-specific gene regulation. Genome Res.2004; 14: 79–89.
25. Hughes T, Brady H. Cross-talk betweenpRb/E2F and Wnt/�-catenin pathways:E2F1 induces axin2 leading to repressionof Wnt signalling and to increased celldeath. Exp Cell Res. 2005; 303: 32–46.
26. Pyronnet S, Imataka H, Gingras A, et al.Human eIF4G recruits mnk1 to phosphory-late eIF4E. EMBO J. 1999; 18: 270–9.
27. Hughes T, Brady H. Expression of axin2 isregulated by the alternative 5’UTRs of itsmRNA. J Biol Chem. 2005; 280: 8581–8.
28. Shaaban A, Green A, Karthik S, et al.Nuclear and cytoplasmic expression ofER�1, 2 and 5 identifies distinct prognos-tic outcome for breast cancer patients.Clin Cancer Res. 2008; 14: 5228–35.
29. Coleman LJ, Peter MB, Teall TJ, et al.Combined analysis of eIF4E and 4E-bind-ing protein expression predicts breast can-cer survival and estimates eIF4E activity.Br J Cancer. 2009; 100: 1393–9.
30. Allred D, Harvey J, Berado M, et al.Prognostic and predictive factors in breastcancer by immunohistochemical analysis.Mod Pathol. 1998; 11: 155–68.
31. Zhou S, Wang G, Liu C, et al. eIF4E andangiogenesis: prognostic markers for breastcancer. BMC Cancer. 2006; 6: 231–43.
32. Zuker M. Mfold web server for nucleic acidfolding and hybridization prediction.Nucleic Acids Res. 2003; 31: 3406–15.
33. Hirata S, Shoda T, Kato J, et al. The mul-tiple untranslated first exons system of thehuman ER� gene. J Steroid Biochem MolBiol. 2001; 78: 33–40.
34. Gray N, Hentze M. Regulation of proteinsynthesis by mRNA structure. Mol BiolRep. 1994; 19: 195–200.
35. Meijer H, Thomas A. Control of eukaryoticprotein synthesis by upstream ORFs in the5’UTR of an mRNA. Biochem J. 2002; 367:1–11.
36. Clemens M. Targets and mechanisms forthe regulation of translation in malignanttransformation. Oncogene. 2004; 23:3180–8.
2184 © 2009 The AuthorsJournal compilation © 2010 Foundation for Cellular and Molecular Medicine/Blackwell Publishing Ltd
37. Kerekatte V, Smiley K, Hu B, et al. Theprotooncogene/translation factor eIF4E: asurvey of expression in breast carcinomas.Int J Cancer. 1995; 64: 27–31.
38. Rosenwald I, Hutzler M, Wang S, et al.Expression of eIF4E and eIF2alpha isincreased frequently in bronchioloalveolarbut not in squamous cell carcinomas of thelung. Cancer. 2001; 92: 2164–71.
39. Poola I, Abraham J, Baldwin K, et al.ER�4 and �5 are full length functionallydistinct ER� isoforms: cloning fromhuman ovary and functional characteriza-tion. Endocrine. 2005; 27: 227–38.
40. Sugiura H, Toyama T, Hara Y, et al.Expression of ER� wild-type and its vari-ant ER�2 is correlated with better progno-sis in breast cancer. Jpn J Clin Oncol.2007; 37: 820–8.
41. Vinayagam R, Sibson D, Holcombe C,et al. Association of ER�2/ER�cx withoutcome of adjuvant endocrine treat-ment for primary breast cancer-a retro-spective study. BMC Cancer. 2007; 7:131–40.
42. Honma N, Horii R, Iwase T, et al. Clinicalimportance of ER� evaluation in breastcancer patients treated with adjuvanttamoxifen therapy. J Clin Oncol. 2008; 26:3727–34.
43. Okumura N, Saji S, Eguchi H, et al.Distinct promoter usage of mdm2 gene inhuman breast cancer. Oncol Rep. 2002; 9:557–63.
44. Sobczak K, Krzyzosiak W. Structuraldeterminants of BRCA1 translation regula-tion. J Biol Chem. 2002; 277: 17349–58.
45. Gendra E, Colgan D, Meany B, et al. Asequence motif in the SV40 early core pro-moter affects alternative splicing of tran-scribed mRNA. J Biol Chem. 2007; 282:11648–57.
46. Russcher H, Dalm V, de Jong F, et al.Associations between promoter usage andalternative splicing of the GR gene. J MolEncrinol. 2007; 38: 91–8.
47. Auboeuf D, Dowhan D, Kang Y, et al.Differential recruitment of nuclear receptorcoactivators may determine alternativeRNA splice site choice in target genes.PNAS. 2004; 101: 2270–4.
48. Auboeuf D, Honig A, Berget S, et al.Coordinate regulation of transcription andsplicing by steroid receptor coregulators.Science. 2002; 298: 416–9.
49. Nogues G, Kadener S, Cramer P, et al.Transcriptional activators differ in theirabilities to control alternative splicing. J Biol Chem. 2002; 277: 43110–4.
50. Rosonina E, Bakowski M, McCracken S,et al. Transcriptional activators controlsplicing and 3�-end cleavage levels. J BiolChem. 2003; 278: 43034–40.
51. Trinklein N, Aldred S, Saldanha A, et al.Identification and functional analysis ofhuman transcriptional promoters. GenomeRes. 2003; 13: 308–12.
52. Foley E, Jazaeri A, Shupnik M, et al.Selective loss of ER� in malignant humancolon. Cancer Res. 2000; 60: 245–8.
53. Roger P, Sahla M, Mäkelä S, et al.Decreased expression of ER� protein in proliferative preinvasive mammarytumors. Cancer Res. 2001; 61: 2537–41.
54. Skliris G, Munot K, Bell S, et al. Reducedexpression of ER� in invasive breast can-cer and its re-expression using DNAmethyl transferase inhibitors in a cell linemodel. J Pathol. 2003; 201: 213–20.
55. Esslimani-Sahla M, Kramar A, Simony-Lafontaine J, et al. Increased ER beta2expression during mammary carcinogene-sis. Clin Cancer Res. 2005; 11: 3170–4.
56. Shaaban A, O’Neill P, Davies M, et al.Declining ER� expression defines malig-nant progression of human breast neopla-sia. Am J Surg Pathol. 2003; 27: 1502–12.
57. Saji S, Omoto Y, Shimizu C, et al.Expression of ER betacx protein inERalpha-positive breast cancer: specificcorrelation with PgR. Cancer Res. 2002;62: 4849–53.
58. Rody A, Holtrich U, Solbach C, et al.Methylation of ER� promoter correlateswith loss of ER� expression in mammarycarcinoma and is an early indicationmarker in premalignant lesions. EndocrRelat Cancer. 2005; 12: 903–16.
59. Nathan C, Franklin S, Abreo F, et al.Expression of eIF4E during head andneck tumorigenesis: possible role inangiogenesis. Laryngoscope. 1999; 109:1253–8.
60. Rosenwald I, Chen J, Wang S, et al.Upregulation of protein synthesis initiationfactor eIF4E is an early event during coloncarcinogenesis. Oncogene. 1999; 18:2507–17.
61. Lacroix M, Leclercq G. Relevance ofbreast cancer cell lines as models forbreast tumours: an update. Breast CancerRes Treat. 2004; 83: 249–89.
62. Giard DJ, Aaronson SA, Todaro GJ, et al.In vitro cultivation of human tumors:establishment of cell lines derived from aseries of solid tumors. J Natl Cancer Inst.1973; 51: 1417–23.
63. Nelson-Rees WA, Flandermeyer RR,Hawthorne PK. Distinctive banded markerchromosomes of human tumor cell lines.Int J Cancer. 1975; 16: 145–50.
64. Marot D, Opolon P, Brailly-Tabard S,et al. The tumor suppressor activityinduced by adenovirus-mediated BRCA1overexpression is not restricted to breastcancers. Gene Ther. 2006; 13: 235–44.
65. Berdichevsky F, Alford D, D’Souza B,et al. Branching morphogenesis of humanmammary epithelial cells in collagen gels.J Cell Sci. 1994; 107: 3557–68.
66. Soule HD, Vazguez J, Long A, et al. Ahuman cell line from a pleural effusionderived from a breast carcinoma. J NatlCancer Inst. 1973; 51: 1409–16.
67. Cailleau R, Olivé M, Cruciger QV. Long-term human breast carcinoma cell lines ofmetastatic origin: preliminary characteriza-tion. In Vitro. 1978; 14: 911–5.