Embed Size (px)
Citation preview
1
Digital Library Development in the Asia Pacific
Digital Library Future Research
Case Study in International Disease Surveillance
Hsinchun Chen, Ph.D.
美國亞歷桑那大學, 陳炘鈞 博士
McClelland Professor,
Director, Artificial Intelligence Lab
NSF COPLINK Center
Dept. of Management Information Systems
University of Arizona
Acknowledgement:
*NSF DLI1, DLI2, NSDL
*NIH, NLM, NCI
*NSF DG, DOJ, DOD,
DHS
2
Outline
• DL After the First Decade – Asian Digital Library Development
– NSF Cyberinfrastructure Program and NSF Chatham Digital Library Workshop
• Case Study: International Disease Surveillance – BioPortal (from FMD to Avian Influenza)
3
Introduction
• Digital libraries represent a form of information technology in which social impact matters as much as technological advancement.
• Over the past decade the development of digital library activities has been steadily increasing.
• International conferences in digital library have proliferated from their roots of ACM and IEEE Digital Conferences (and then the Joint Conference on Digital Libraries, JCDL) to the European version of ECDL (European Conference on Digital Libraries) and the Asian version of ICADL (International Conference of Asian Digital Libraries).
4
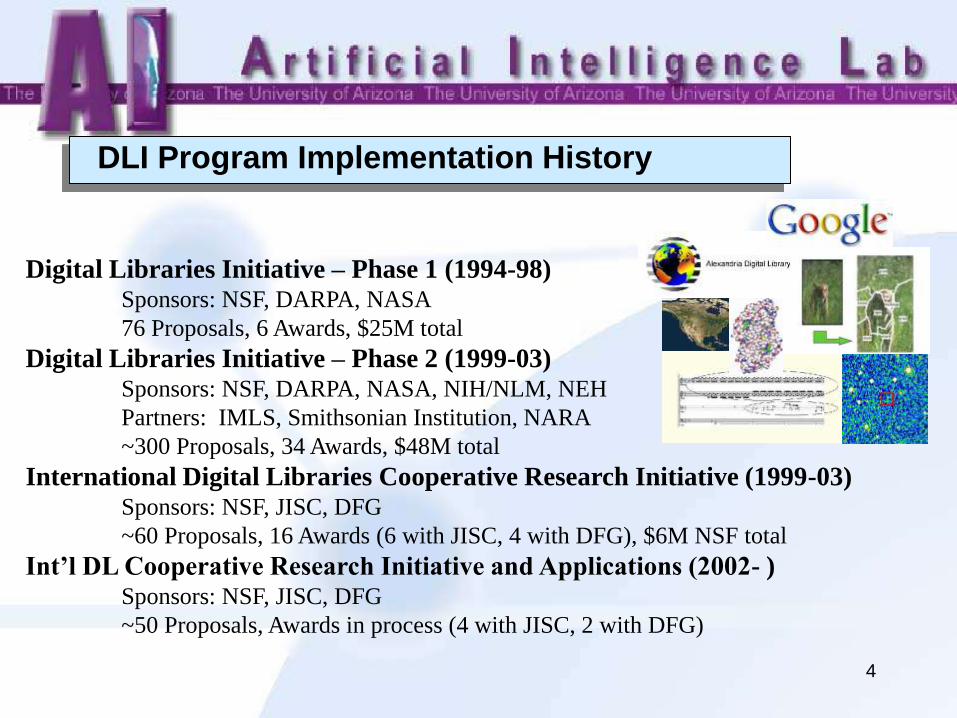
DLI Program Implementation History
Digital Libraries Initiative – Phase 1 (1994-98) Sponsors: NSF, DARPA, NASA
76 Proposals, 6 Awards, $25M total
Digital Libraries Initiative – Phase 2 (1999-03) Sponsors: NSF, DARPA, NASA, NIH/NLM, NEH
Partners: IMLS, Smithsonian Institution, NARA
~300 Proposals, 34 Awards, $48M total
International Digital Libraries Cooperative Research Initiative (1999-03) Sponsors: NSF, JISC, DFG
~60 Proposals, 16 Awards (6 with JISC, 4 with DFG), $6M NSF total
Int’l DL Cooperative Research Initiative and Applications (2002- ) Sponsors: NSF, JISC, DFG
~50 Proposals, Awards in process (4 with JISC, 2 with DFG)
5
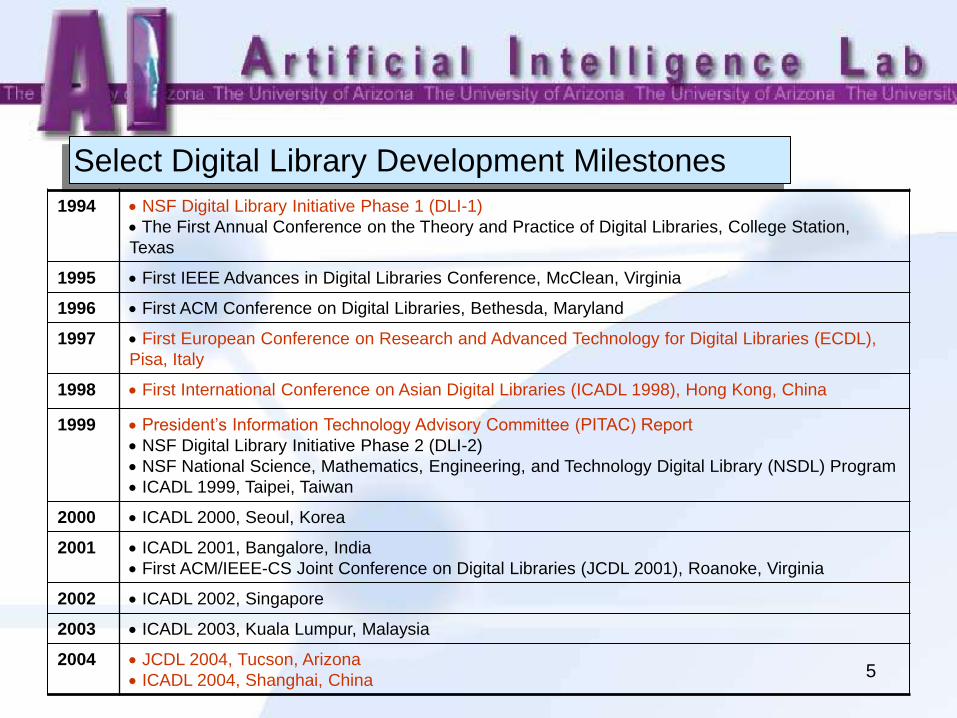
Select Digital Library Development Milestones
1994 NSF Digital Library Initiative Phase 1 (DLI-1)
The First Annual Conference on the Theory and Practice of Digital Libraries, College Station,
Texas
1995 First IEEE Advances in Digital Libraries Conference, McClean, Virginia
1996 First ACM Conference on Digital Libraries, Bethesda, Maryland
1997 First European Conference on Research and Advanced Technology for Digital Libraries (ECDL),
Pisa, Italy
1998 First International Conference on Asian Digital Libraries (ICADL 1998), Hong Kong, China
1999 President’s Information Technology Advisory Committee (PITAC) Report
NSF Digital Library Initiative Phase 2 (DLI-2)
NSF National Science, Mathematics, Engineering, and Technology Digital Library (NSDL) Program
ICADL 1999, Taipei, Taiwan
2000 ICADL 2000, Seoul, Korea
2001 ICADL 2001, Bangalore, India
First ACM/IEEE-CS Joint Conference on Digital Libraries (JCDL 2001), Roanoke, Virginia
2002 ICADL 2002, Singapore
2003 ICADL 2003, Kuala Lumpur, Malaysia
2004 JCDL 2004, Tucson, Arizona
ICADL 2004, Shanghai, China
6
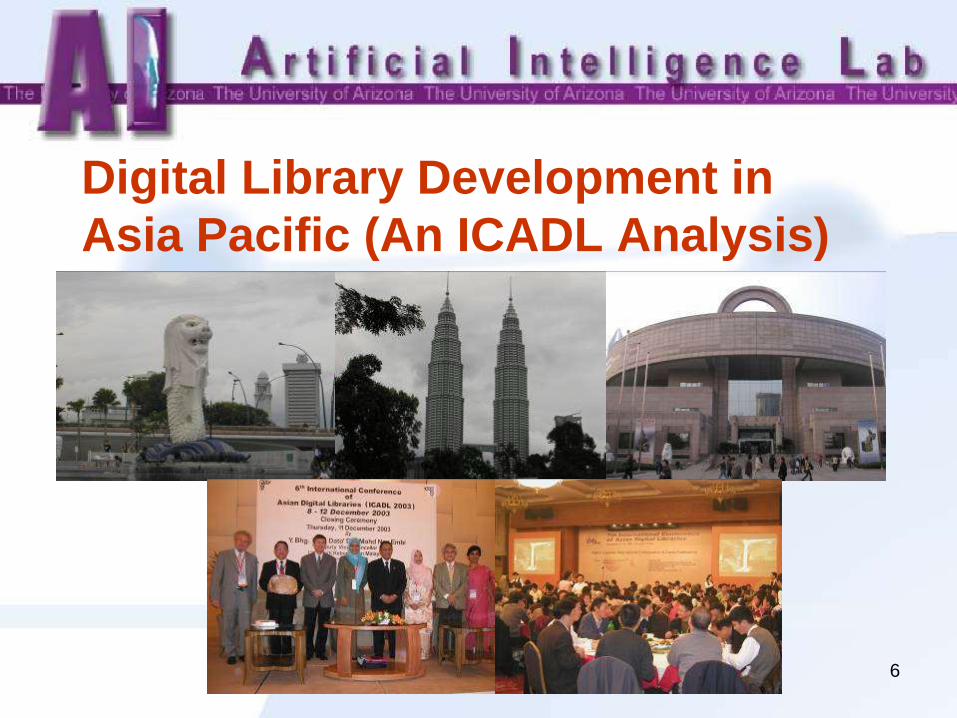
Digital Library Development in
Asia Pacific (An ICADL Analysis)
7
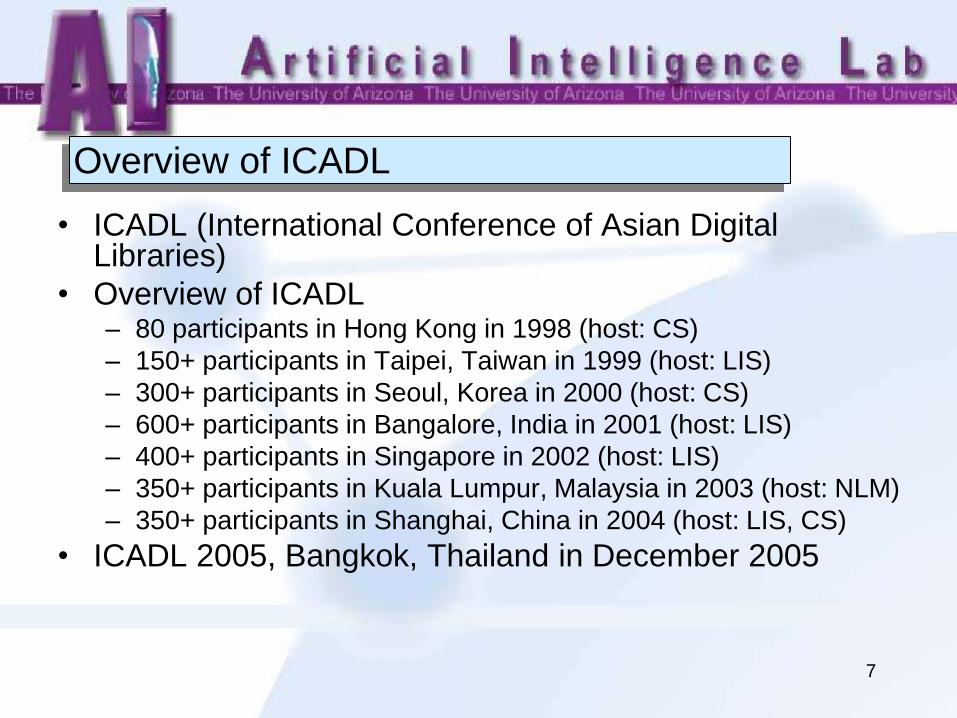
Overview of ICADL
• ICADL (International Conference of Asian Digital Libraries)
• Overview of ICADL – 80 participants in Hong Kong in 1998 (host: CS)
– 150+ participants in Taipei, Taiwan in 1999 (host: LIS)
– 300+ participants in Seoul, Korea in 2000 (host: CS)
– 600+ participants in Bangalore, India in 2001 (host: LIS)
– 400+ participants in Singapore in 2002 (host: LIS)
– 350+ participants in Kuala Lumpur, Malaysia in 2003 (host: NLM)
– 350+ participants in Shanghai, China in 2004 (host: LIS, CS)
• ICADL 2005, Bangkok, Thailand in December 2005
8
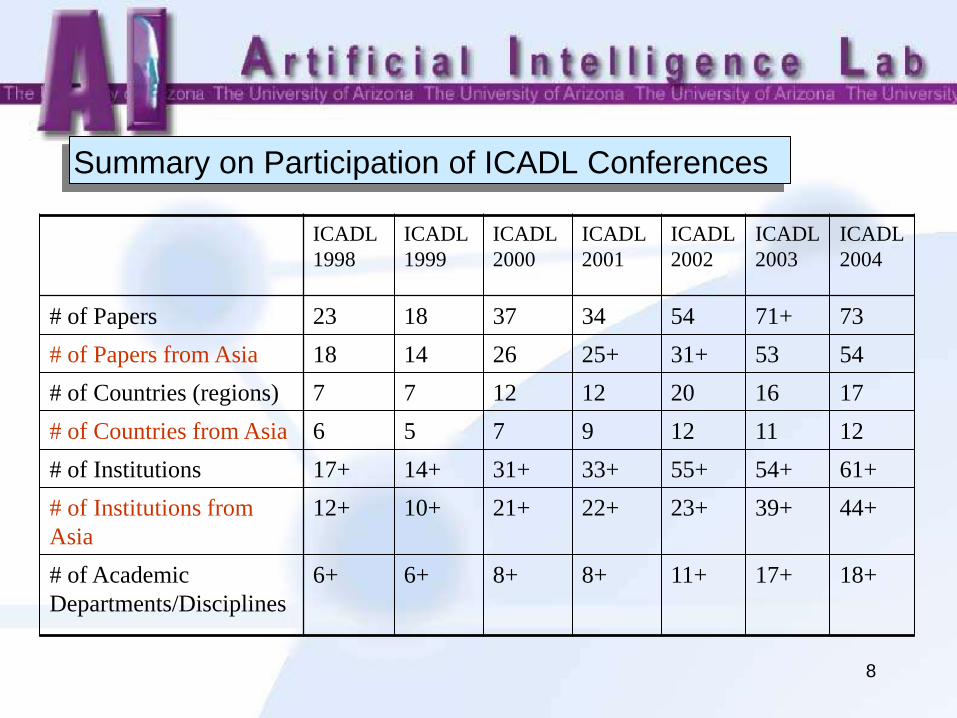
Summary on Participation of ICADL Conferences
ICADL
1998
ICADL
1999
ICADL
2000
ICADL
2001
ICADL
2002
ICADL
2003
ICADL
2004
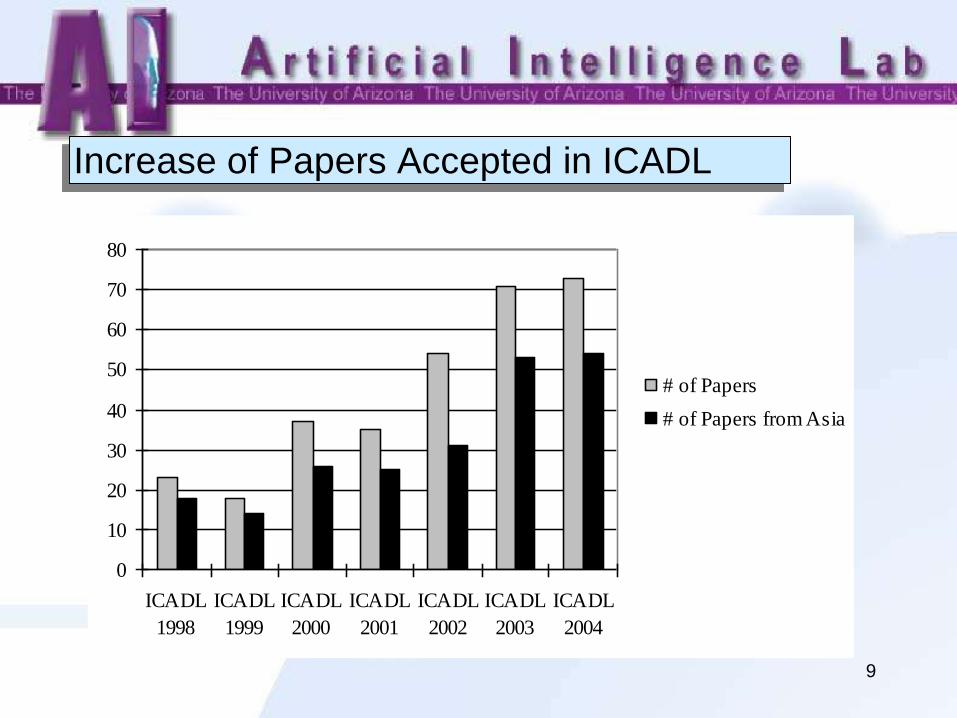
# of Papers 23 18 37 34 54 71+ 73
# of Papers from Asia 18 14 26 25+ 31+ 53 54
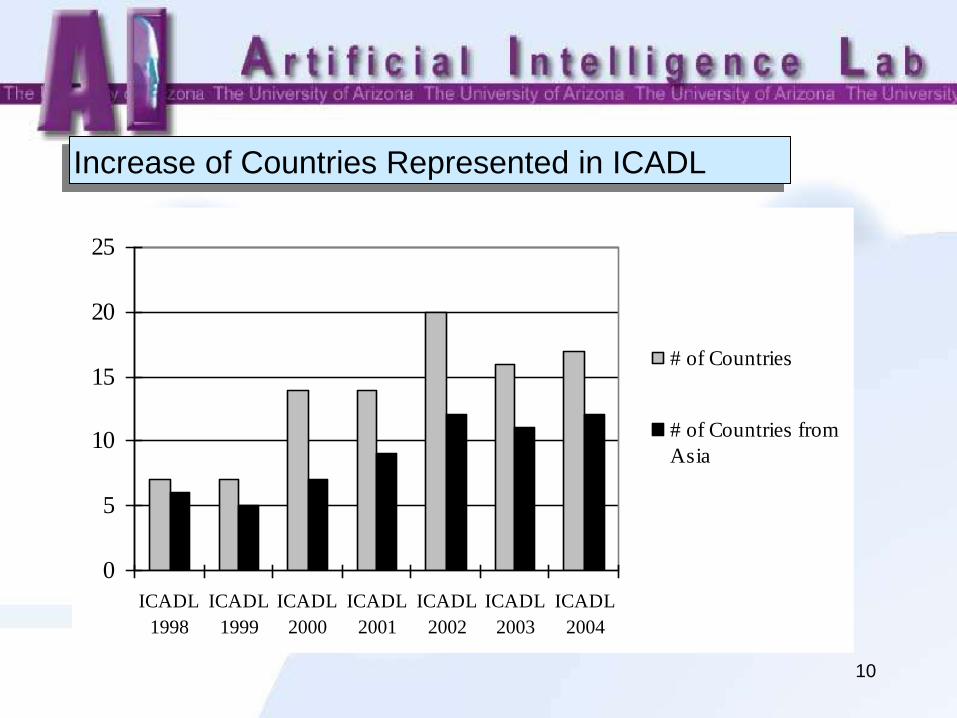
# of Countries (regions) 7 7 12 12 20 16 17
# of Countries from Asia 6 5 7 9 12 11 12
# of Institutions 17+ 14+ 31+ 33+ 55+ 54+ 61+
# of Institutions from
Asia
12+ 10+ 21+ 22+ 23+ 39+ 44+
# of Academic
Departments/Disciplines
6+ 6+ 8+ 8+ 11+ 17+ 18+
9
Increase of Papers Accepted in ICADL
0
10
20
30
40
50
60
70
80
ICADL
1998
ICADL
1999
ICADL
2000
ICADL
2001
ICADL
2002
ICADL
2003
ICADL
2004
# of Papers
# of Papers from Asia
10
Increase of Countries Represented in ICADL
0
5
10
15
20
25
ICADL
1998
ICADL
1999
ICADL
2000
ICADL
2001
ICADL
2002
ICADL
2003
ICADL
2004
# of Countries
# of Countries from
Asia
11
Topical Analysis in ICADL
• Digital library research is not restricted to only technical aspects; it involves social aspects as well.
• From a technological perspective, digital libraries are a set of electronic resources that are built to help create, search, and use information.
• From a sociological perspective, digital libraries are constructed by a community of users who use the system to better support their informational needs and applications. (Borgman, 1998)
12
Topical Analysis: Social Aspect
• Multicultural Issues
– In Asian digital library applications, there are
countless scenarios that involve creating and
distributing locally produced information collections.
– e.g.
• INFLIBNT project aimed at creating a digital library of theses
and dissertations from India (Vijayakumar and Murthy, 2001).
• The Tsinghua University Architecture Digital Library
developed a prototype system to provide rich, valuable
resources for traditional Chinese architecture research and
education (Xing et al., 2002).
13
Topical Analysis: Social Aspect
• Asian Languages and Cross-lingual Issues
– A crucial feature of Asian digital libraries is the ability to work in various local languages.
– Chinese, Japanese, Korean, Indian, Malaysian, and Thai language processing techniques have been reported.
– e.g. • Wong and Li (1998) and Yang et al. (1998) both studied
Chinese information retrieval and discussed issues related to Chinese language indexing techniques.
• Theeramunkong et al. (2002) investigated using n-gram and HMM approaches for Thai OCR application.
14
Topical Analysis: Social Aspect
• Asian Languages and Cross-lingual Issues (cont’d)
– Cross-lingual information retrieval between English
and Asian languages has been more widely studied in
ICADL conferences than in other western digital
library conferences.
– e.g.
• Qin et al. (2003) presented an English-Chinese cross-lingual
Web retrieval system in the business domain.
• Sugimoto (2001) presented a multilingual document browsing
tool and its metadata creation carried out at ULIS.
15
Samples of Significant Digital Library
Research in Asia Pacific: Capturing
Cultural Heritage and Indigenous
Knowledge
16 http://www.iidl.net
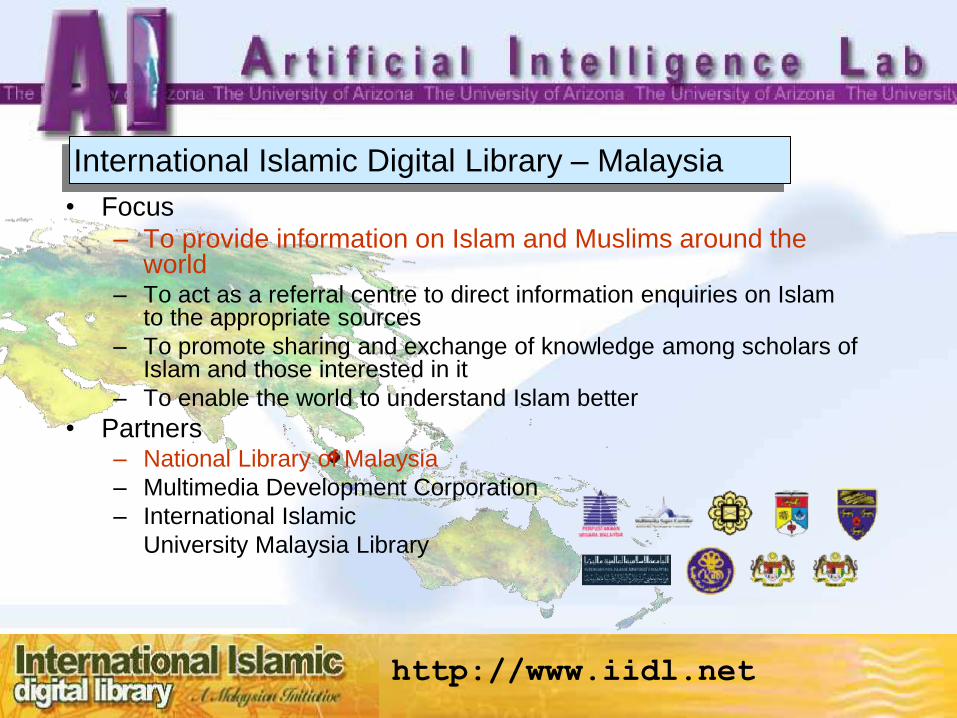
• Focus
– To provide information on Islam and Muslims around the world
– To act as a referral centre to direct information enquiries on Islam to the appropriate sources
– To promote sharing and exchange of knowledge among scholars of Islam and those interested in it
– To enable the world to understand Islam better
• Partners – National Library of Malaysia
– Multimedia Development Corporation
– International Islamic
University Malaysia Library
International Islamic Digital Library – Malaysia
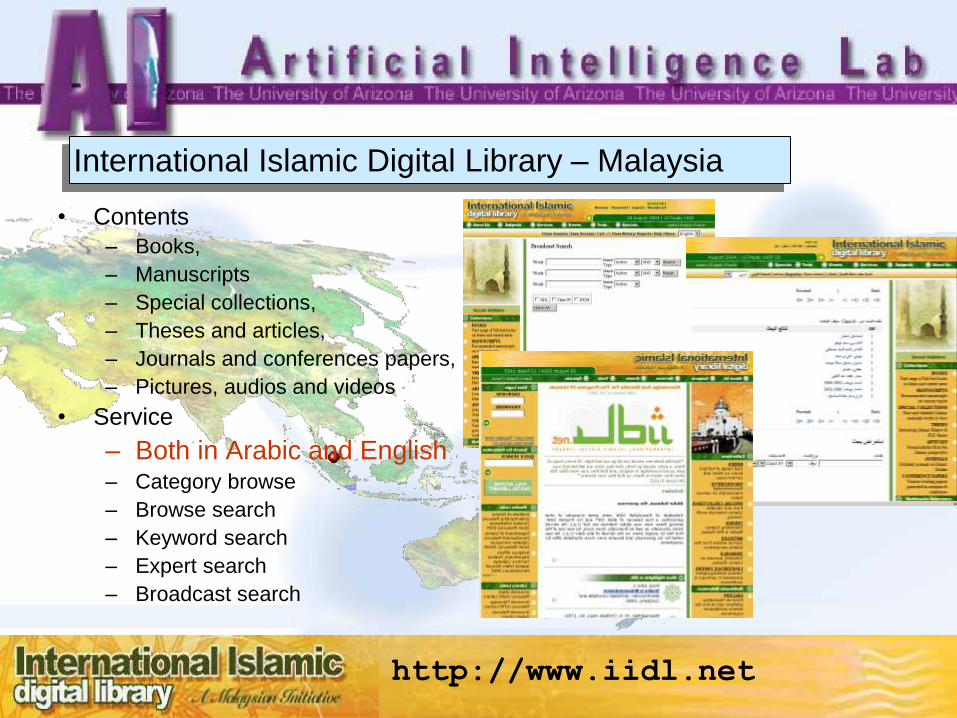
17 http://www.iidl.net
• Contents
– Books,
– Manuscripts
– Special collections,
– Theses and articles,
– Journals and conferences papers,
– Pictures, audios and videos
• Service
– Both in Arabic and English
– Category browse
– Browse search
– Keyword search
– Expert search
– Broadcast search
International Islamic Digital Library – Malaysia
18
• Focus
– To develop information processing tools to facilitate human machine interaction in Indian languages and multi-lingual knowledge resources.
– To support R&D efforts in the area of information processing in Indian Languages and to support research on knowledge tools: representation, integration, compression and learning methodologies.
– To consolidate technologies thus developed for Indian languages and integrate these to develop innovative user products and services.
http://www.tdil.mit.gov.in
Technology Development for Indian Languages – India
19
• Funding
– Ministry of Information Technology, India
• Partners
– Indian Institute of Technology, Kanpur Hindi, Nepali
– Indian Institute of Technology, Mumbai Marathi, Konkani
– Indian Institute of Technology, Guwahati Assamese,
Manipuri
http://www.tdil.mit.gov.in
Technology Development for Indian Languages – India
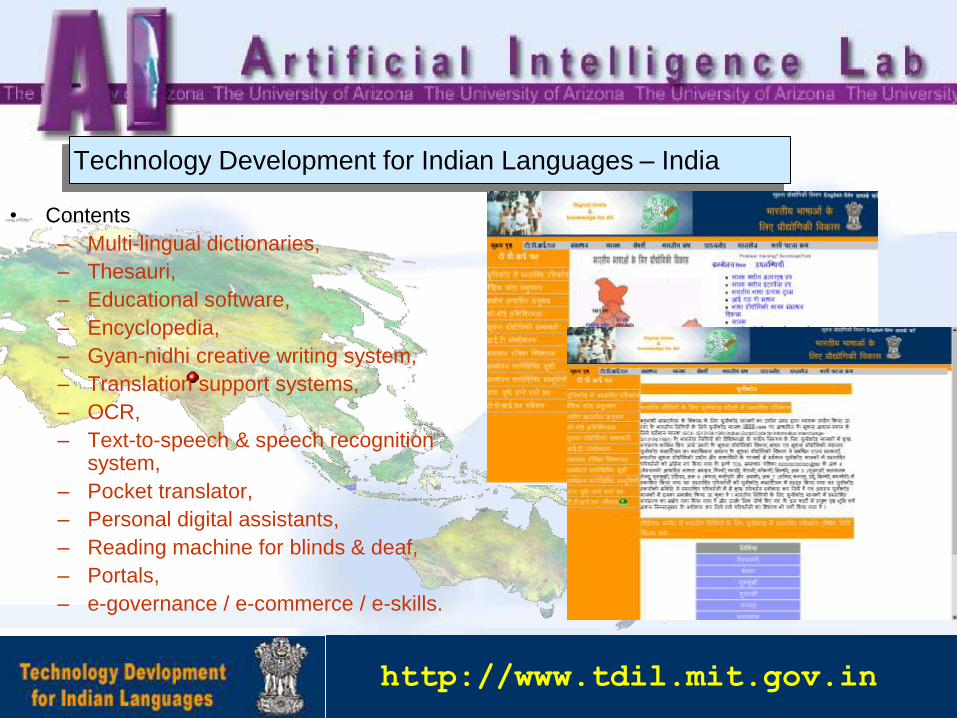
20
Technology Development for Indian Languages – India
• Contents
– Multi-lingual dictionaries,
– Thesauri,
– Educational software,
– Encyclopedia,
– Gyan-nidhi creative writing system,
– Translation support systems,
– OCR,
– Text-to-speech & speech recognition system,
– Pocket translator,
– Personal digital assistants,
– Reading machine for blinds & deaf,
– Portals,
– e-governance / e-commerce / e-skills.
http://www.tdil.mit.gov.in
21
• Focus
– Strengthen and protect the cultural tradition
and heritage
– Enhance the usage and sharing of
information resource
– Serve the national projects and related
researches
http://www.nlc.gov.cn
China Digital Library – China
22
• Funding – 10th “Five-year Project”
– Ministry of Culture, China
• Partners – National Library of China
– Tsinghua University
– Peking University
– China Academy of Science
– China Academy of Social Science
– etc. (more than 100 different types of libraries and partners)
http://www.nlc.gov.cn
China Digital Library – China
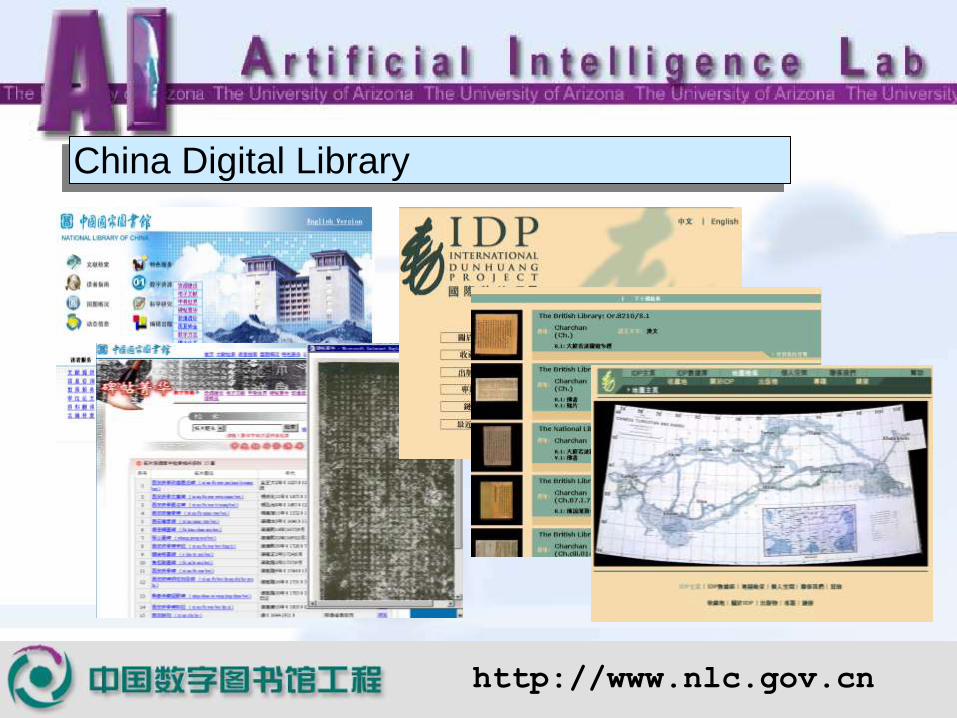
23
China Digital Library
http://www.nlc.gov.cn
24
Research Directions for Digital Libraries
(The Next Decade):
- JCDL 2004, 2005, 2006
- NSF Cyberinfrastructure Program
- NSF Chatham Digital Library Workshop
25
Overview of JCDL 2004
• Joint IEEE-CS/ACM Conference on Digital
Libraries (JCDL), Tucson, AZ
• Theme: Global Reach and Diverse Impact.
– Co-Chairs:
• Hsinchun Chen, Howard Wactlar, Ching-chih Chen
26
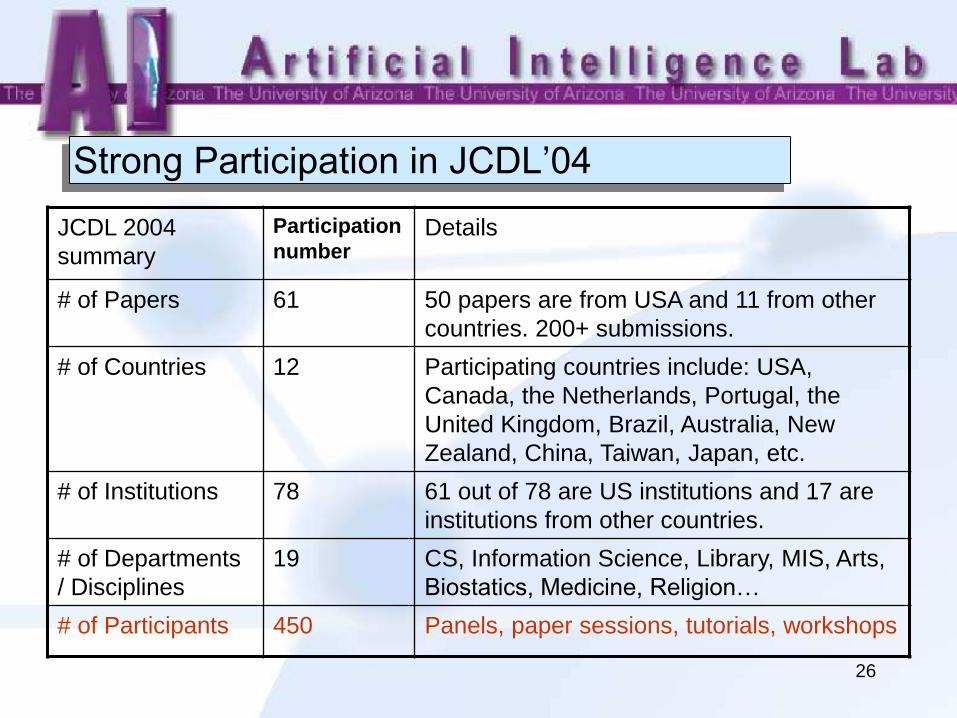
Strong Participation in JCDL’04
JCDL 2004
summary
Participation
number Details
# of Papers 61 50 papers are from USA and 11 from other
countries. 200+ submissions.
# of Countries
12 Participating countries include: USA,
Canada, the Netherlands, Portugal, the
United Kingdom, Brazil, Australia, New
Zealand, China, Taiwan, Japan, etc.
# of Institutions 78 61 out of 78 are US institutions and 17 are
institutions from other countries.
# of Departments
/ Disciplines
19 CS, Information Science, Library, MIS, Arts,
Biostatics, Medicine, Religion…
# of Participants 450 Panels, paper sessions, tutorials, workshops
27
JCDL 2005 and 2006
• JCDL 2005, Denver, Colorado
• JCDL 2006, Charlotte, North Carolina
28
Social Networks,
Cyberinfrastructure (CI)
and Meta CI
Daniel E. Atkins
School of Information & Dept. of Elec. Engr. & Comp. Sci.
University of Michigan Ann Arbor
[email protected] November 2005
29
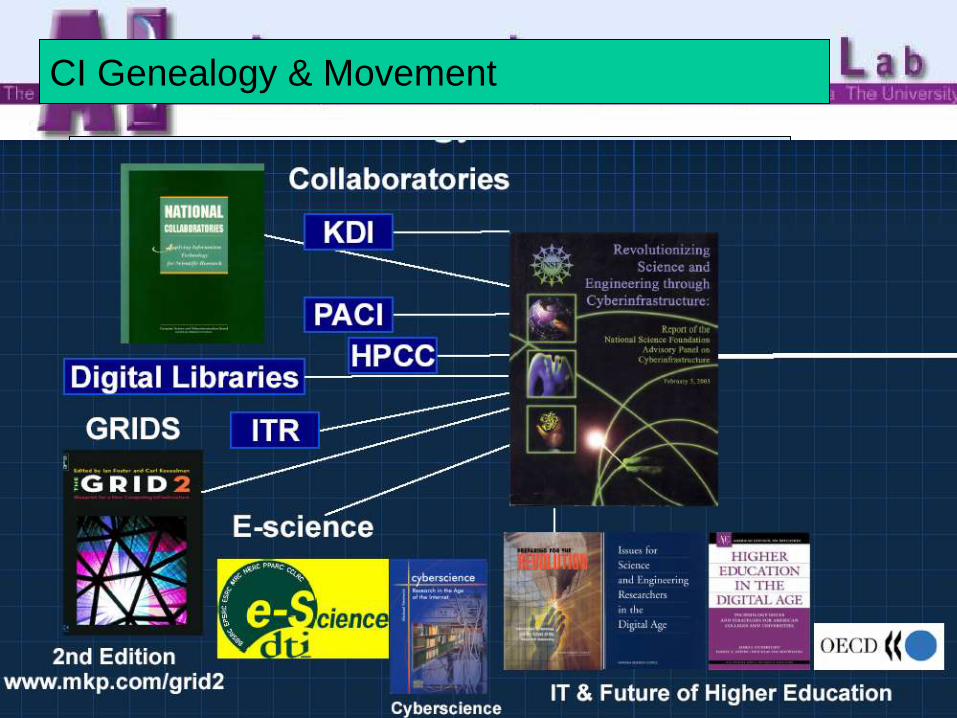
CI Genealogy & Movement
30
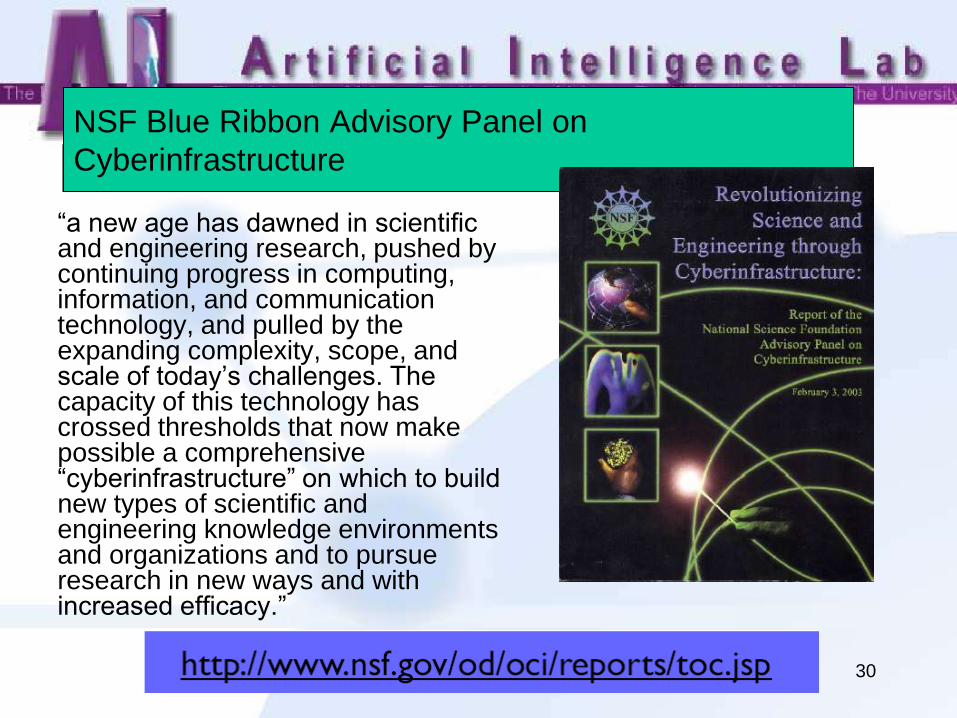
NSF Blue Ribbon Advisory Panel on
Cyberinfrastructure
“a new age has dawned in scientific and engineering research, pushed by continuing progress in computing, information, and communication technology, and pulled by the expanding complexity, scope, and scale of today’s challenges. The capacity of this technology has crossed thresholds that now make possible a comprehensive “cyberinfrastructure” on which to build new types of scientific and engineering knowledge environments and organizations and to pursue research in new ways and with increased efficacy.”
31
32
NSF states intent to
“play a leadership role”
• NSF will play a leadership role in the development and support of a comprehensive cyberinfrastructure essential to 21st century advances in science and engineering research and education.
• NSF is the only agency within the U.S. government that funds research and education across all disciplines of science and engineering. ... Thus, it is strategically placed to leverage, coordinate and transition cyberinfrastructure advances in one field to all fields of research. – From NSF Cyberinfrastructure Vision for the 21st Century
Discovery
33
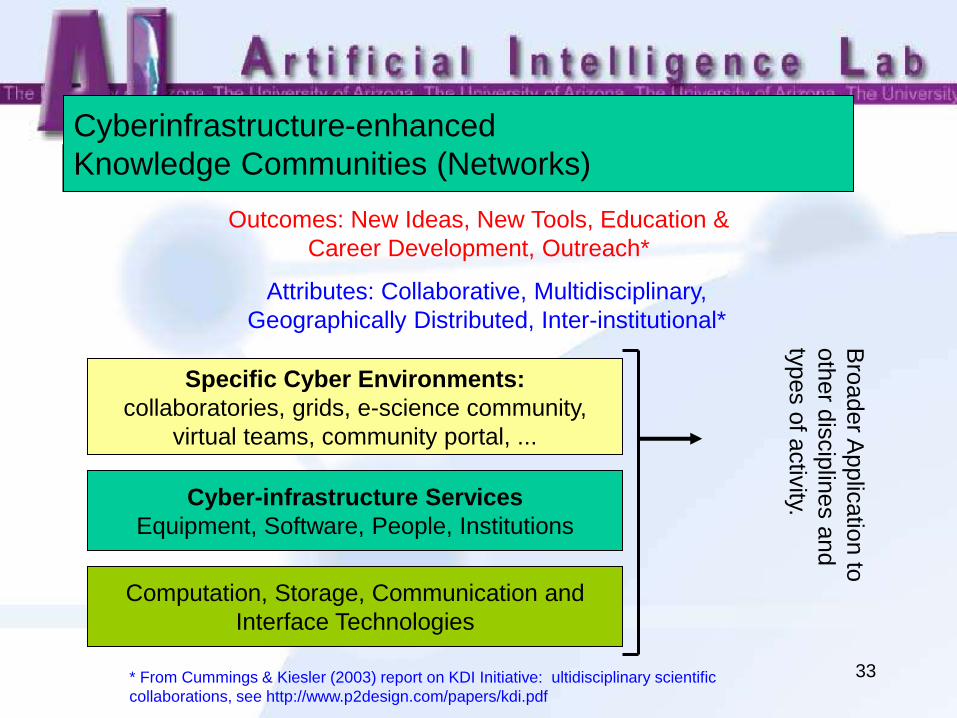
Cyberinfrastructure-enhanced
Knowledge Communities (Networks)
Outcomes: New Ideas, New Tools, Education &
Career Development, Outreach*
Attributes: Collaborative, Multidisciplinary,
Geographically Distributed, Inter-institutional*
Specific Cyber Environments:
collaboratories, grids, e-science community,
virtual teams, community portal, ...
Cyber-infrastructure Services
Equipment, Software, People, Institutions
Computation, Storage, Communication and
Interface Technologies
Bro
ader A
pplic
atio
n to
oth
er d
iscip
lines a
nd
types o
f activ
ity.
* From Cummings & Kiesler (2003) report on KDI Initiative: ultidisciplinary scientific
collaborations, see http://www.p2design.com/papers/kdi.pdf
34
Cyberinfrastructure
includes both
• Technology Infrastructure (creation and
provisioning) - middleware, portals, HPC,
hybrid (IP & lambda) networks, ....
• Social Infrastructure (competition &
cooperation, IP policies, incentive
structure, cost, etc.)
35
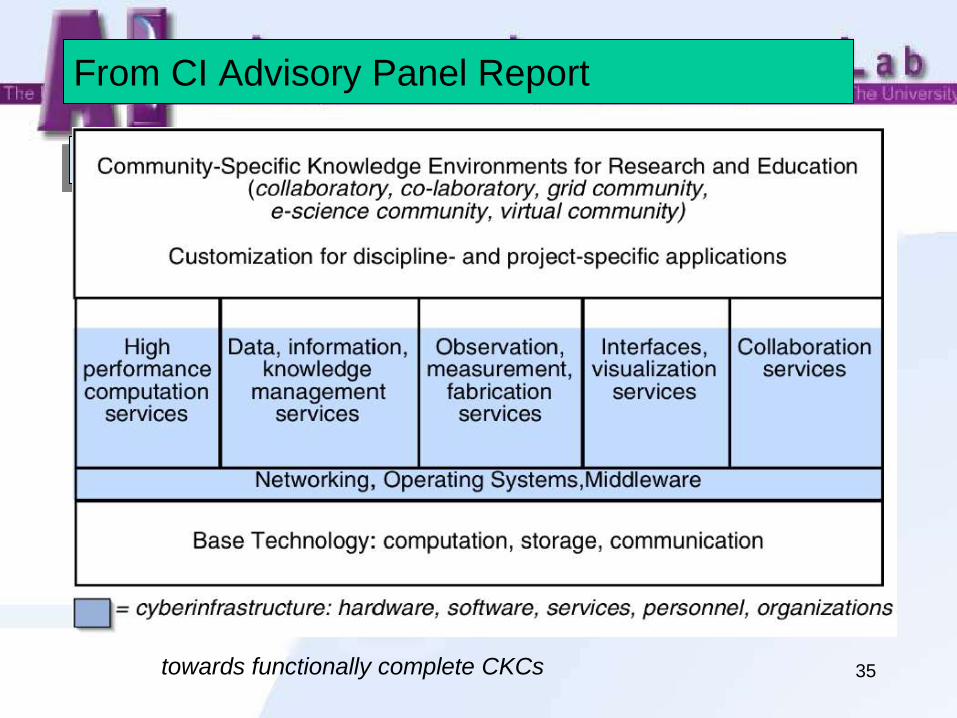
From CI Advisory Panel Report
towards functionally complete CKCs
36
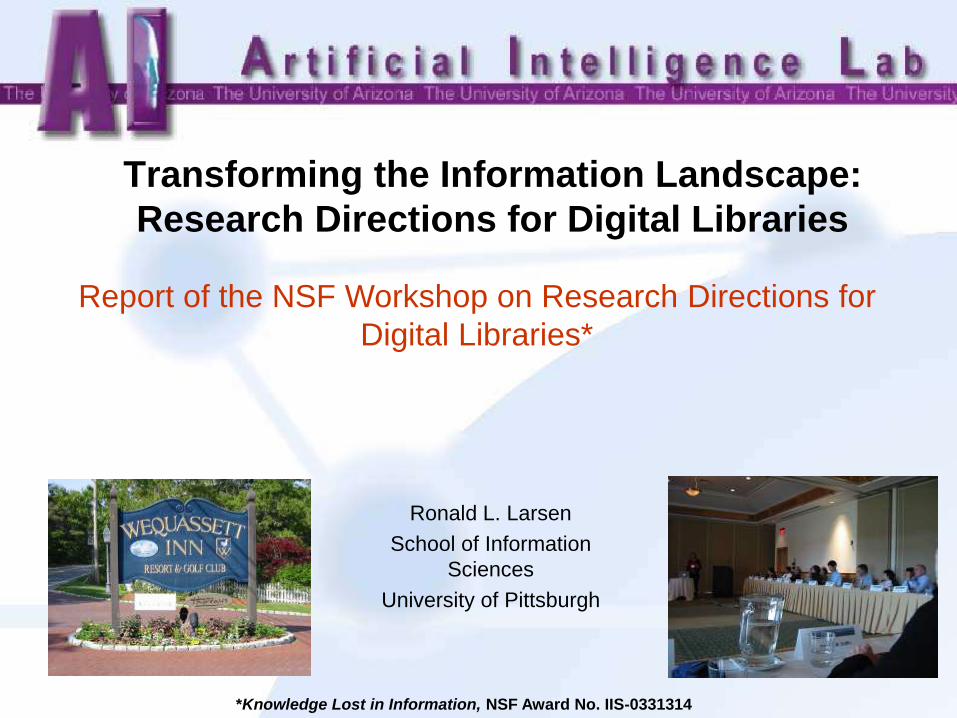
Transforming the Information Landscape:
Research Directions for Digital Libraries
Ronald L. Larsen
School of Information
Sciences
University of Pittsburgh
Report of the NSF Workshop on Research Directions for
Digital Libraries*
*Knowledge Lost in Information, NSF Award No. IIS-0331314
37
Workshop Background
• DLI over, DLI2 winding down
• What is next?
– Did we finish the job? Are we done?
• What have we learned?
– What constitutes DL research?
– Does it influence other disciplines?
• Should DL change from
“Initiative” to “Program”?
38
Emerging U.S. Vision for DL’s
Next generation digital libraries will be:
• A confluence of resources, technology and infrastructure
• An intersection of national priorities and scientific goals
• A common testbed for all computer and information science research (sub)disciplines
• Federated resources serving individuals, institutions and governments simultaneously
• A progression from information to knowledge
39
Users
• Cognitive Completion
– MS spell-checker for facts and knowledge
– Task and user context sensitive
• Do what I mean
– Find what I need
– Be aware of what I know
• Collaboration
– Identifying the collegial context
– Providing contextual guidance
• Managing personal libraries
– All that is seen and heard
– Personal memory assistant
40
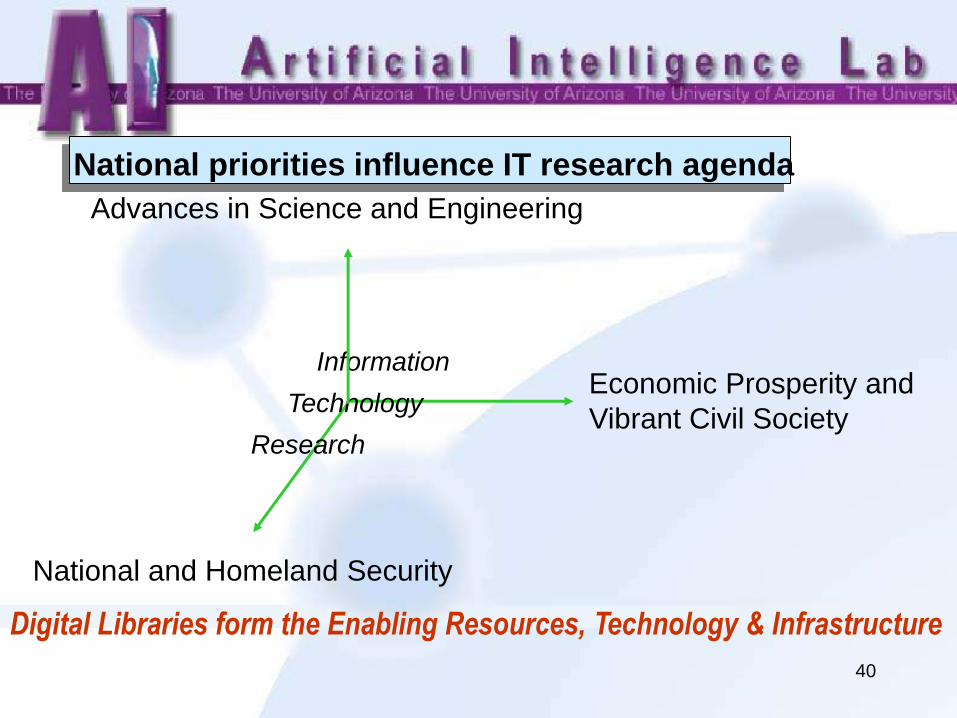
National priorities influence IT research agenda
Advances in Science and Engineering
Economic Prosperity and
Vibrant Civil Society
National and Homeland Security
Information
Technology
Research
Digital Libraries form the Enabling Resources, Technology & Infrastructure
41
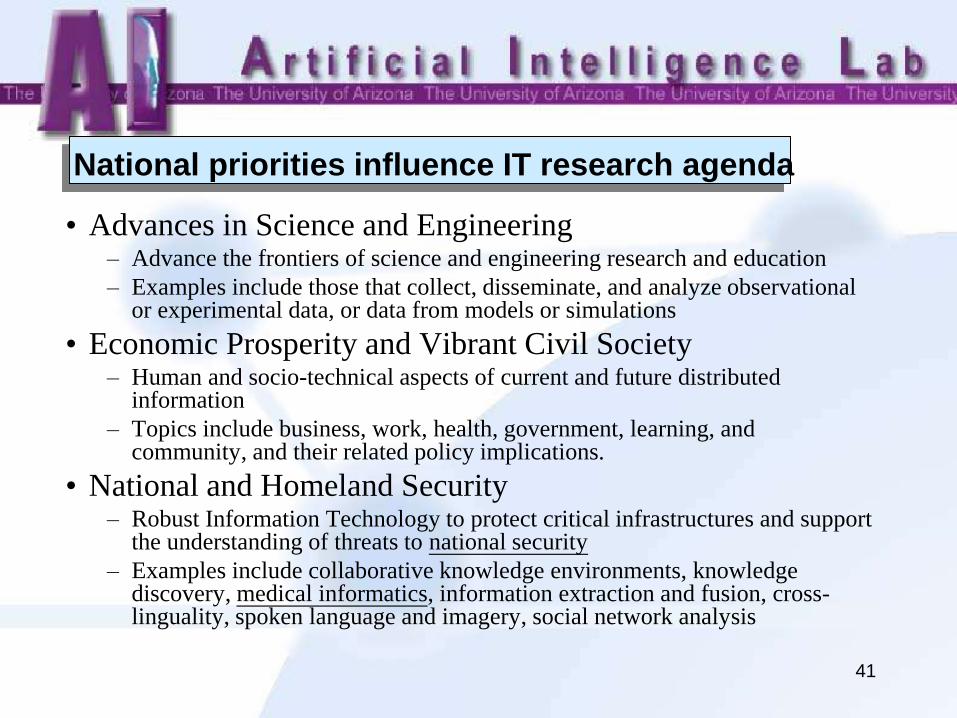
National priorities influence IT research agenda
• Advances in Science and Engineering – Advance the frontiers of science and engineering research and education
– Examples include those that collect, disseminate, and analyze observational or experimental data, or data from models or simulations
• Economic Prosperity and Vibrant Civil Society – Human and socio-technical aspects of current and future distributed
information
– Topics include business, work, health, government, learning, and community, and their related policy implications.
• National and Homeland Security – Robust Information Technology to protect critical infrastructures and support
the understanding of threats to national security
– Examples include collaborative knowledge environments, knowledge discovery, medical informatics, information extraction and fusion, cross-linguality, spoken language and imagery, social network analysis
42
Recommendations
• $20M / year for new U.S. research
– Search, context, extraction, ubiquity, productivity
• $40M /year for sustaining evolving resources in the U.S.
– Acquisition, access, usage, stewardship, management
• Coordinate with Advanced Cyberinfrastructure Program
43
DL Research After the First Decade –
Global Reach and Diverse Impact!
Can DL help with international security?
Can DL help save human life and
improve patient well-being?
44
Case Study: International Disease
Surveillance -- BioPortal
45
BioPortal: Disease and Bioagent Information Sharing,
Surveillance, Analysis, and Visualization
• Research Team
University of Arizona
University of California, Davis
Kansas State University
Arizona Department of Public Health
University of Utah
New York State Department of Health/HRI
California Department of Health Services/PHFE
U.S. Geological Survey
The SIMI Group
• Acknowledgements: NSF, ITIC, DHS, DOD/AFMIC, IDIWC, AZDPS
46
Research Partners and Supports
• University of Arizona
• University of California, Davis
• Kansas State University
• University of Utah
• Arizona Department of Public Health
• New York State Department of Health/HRI
• California Department of Health Services/PHFE
• U.S. Geological Survey
• The SIMI Group
• NSF
• CIA/ITIC
• DHS
• DOD/AFMIC
• CDC
• AZDPS
47
Outline
• Project Background
• BioPortal V1.0 Achievements
– System Architecture
– System Functionalities
– BioPortal Collaboration Framework
• New Developments
– International Foot-and-mouth Disease Monitoring
– Syndromic Surveillance
– Livestock Health Surveillance
48
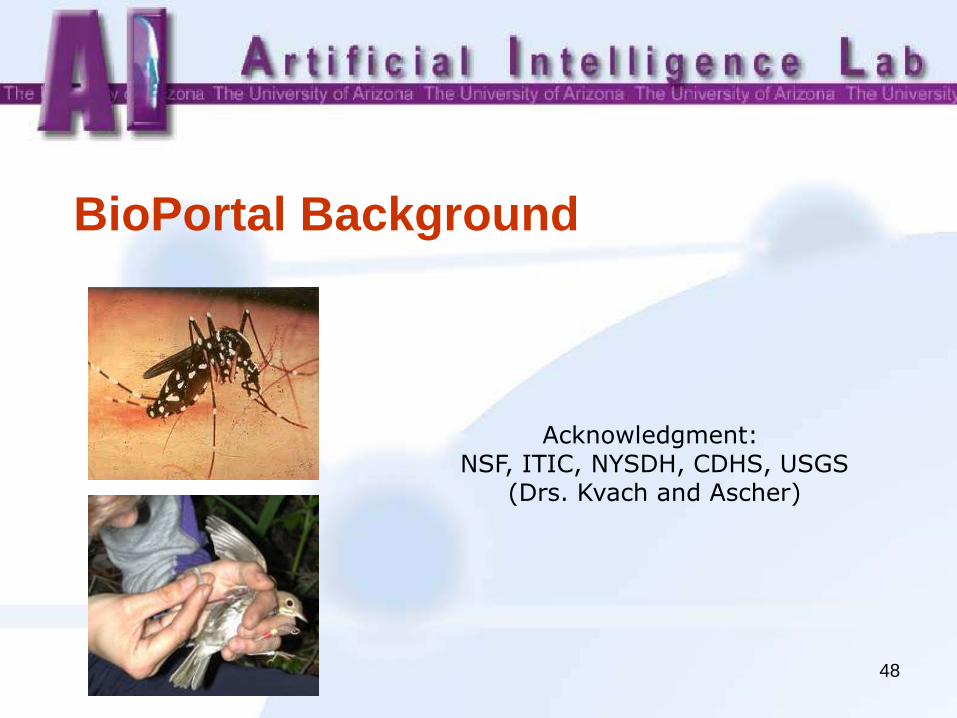
BioPortal Background
Acknowledgment: NSF, ITIC, NYSDH, CDHS, USGS
(Drs. Kvach and Ascher)
49
Background (I)
• In September, 2002, representatives of 18 different agencies, including DOD, DOE, DOJ, DHS, NIH/NLM, CDC, CIA, NSF, and NASA, were convened to discuss “disease surveillance.”
• An interagency working group called Disease Informatics Senior Coordinating Committee (DISCC) was established.
• DISCC established an Infectious Disease Informatics Working Committee (IDIWC) to survey the field and identify gaps.
• IDIWC developed “requirements” for a National Infectious Disease Informatics Infrastructure (NIDII).
50
Background (II)
• In June, 2003, IDIWC was charged with the task of developing one or more rapid prototype systems to demonstrate interoperability and innovation across species and jurisdictions.
• Botulism and West Nile virus were selected as diseases.
• States of New York and California were selected as partners.
• The University of Arizona was chosen as integrator and was provided with a supplement to an existing NSF grant.
51
BioPortal Project Goals
• Demonstrate and assess the technical feasibility and
scalability of an infectious disease information
sharing (across species and jurisdictions),
alerting, and analysis framework.
• Develop and assess advanced data mining and
visualization techniques for infectious disease data
analysis and predictive modeling.
• Identify important technical and policy-related
challenges in developing a national infectious
disease information infrastructure.
52
BioPortal V1.0 Accomplishments
• Prototype system design and development – Initial design and implementation of interoperable
messaging backbones
– Live prototype systems
– Preliminary user evaluation
• Information sharing – Data sharing agreements/memoranda of understanding
(MOUs) developed
– Many disease datasets integrated into the portal
• Analysis and visualization – Hotspot analysis research
– Spatial-Temporal Visualizer (STV)
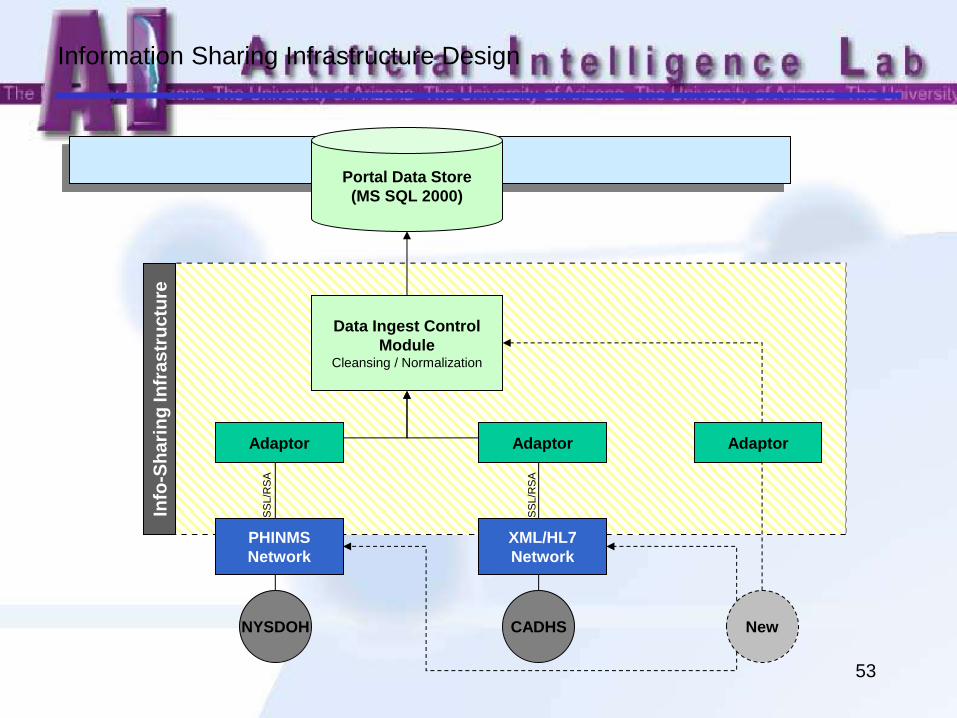
53
Data Ingest Control
Module Cleansing / Normalization
New
Info
-Sh
ari
ng
In
fra
str
uctu
re
NYSDOH CADHS
XML/HL7
Network
PHINMS
Network
Adaptor Adaptor Adaptor
Portal Data Store
(MS SQL 2000)
SS
L/R
SA
SS
L/R
SA
Information Sharing Infrastructure Design
54
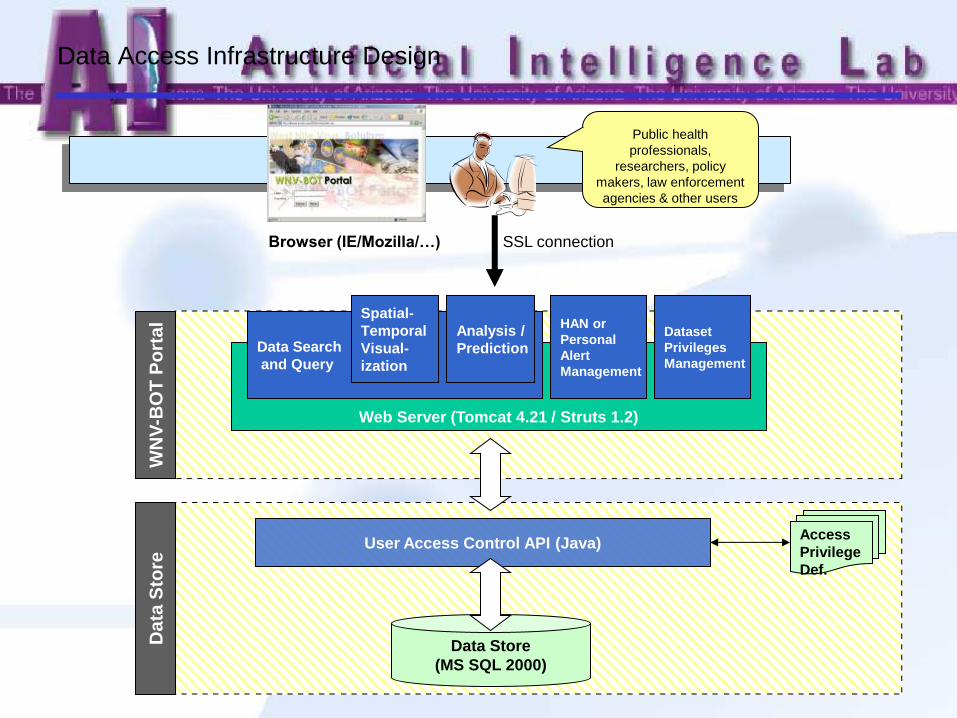
Data Access Infrastructure Design
Web Server (Tomcat 4.21 / Struts 1.2)
Data Store
(MS SQL 2000)
Da
ta S
tore
W
NV
-BO
T P
ort
al
Data Search
and Query
Spatial-
Temporal
Visual-
ization
HAN or
Personal
Alert
Management
Analysis /
Prediction
User Access Control API (Java)
Dataset
Privileges
Management
Browser (IE/Mozilla/…)
Public health
professionals,
researchers, policy
makers, law enforcement
agencies & other users
Access
Privilege
Def.
SSL connection
55
BioPortal Collaboration Framework
• A Memorandum of Understanding (MOU) is used to document the relationship between parties that will be sharing data: – Who the entities are and how they will act
independently and cooperatively
– What the mutual interests, benefits, and purposes of sharing data are
– How each party will maintain control over and share their resources, and what each party shall provide to the other (e.g., system accounts, portal access)
– Which types of data are to be shared (e.g., dead bird surveillance)
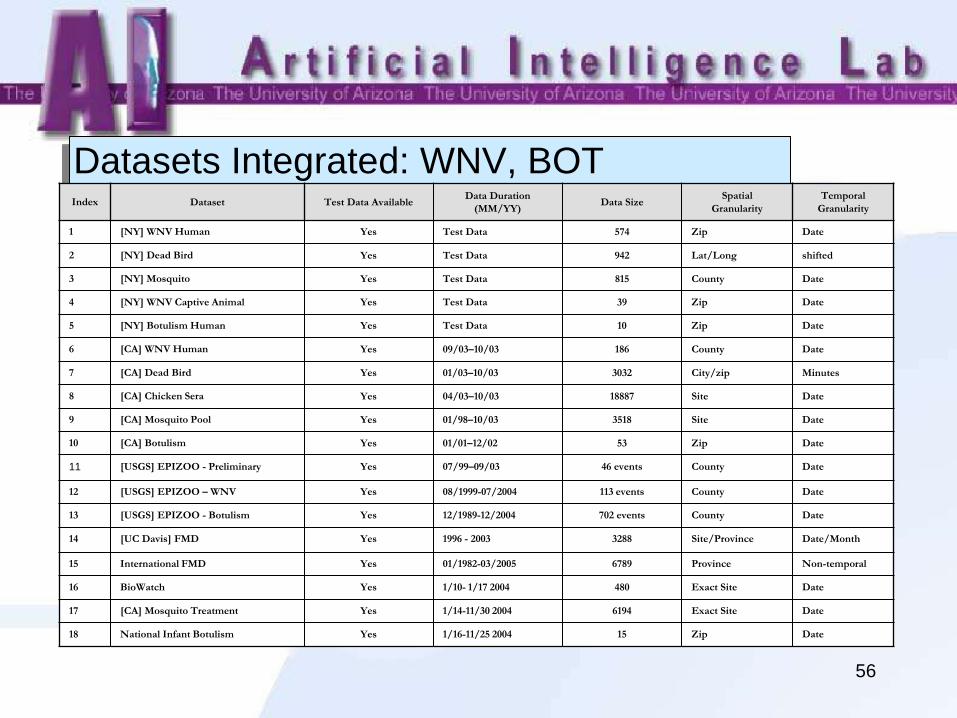
56
Datasets Integrated: WNV, BOT Index Dataset Test Data Available
Data Duration
(MM/YY) Data Size
Spatial
Granularity
Temporal
Granularity
1 [NY] WNV Human Yes Test Data 574 Zip Date
2 [NY] Dead Bird Yes Test Data 942 Lat/Long shifted
3 [NY] Mosquito Yes Test Data 815 County Date
4 [NY] WNV Captive Animal Yes Test Data 39 Zip Date
5 [NY] Botulism Human Yes Test Data 10 Zip Date
6 [CA] WNV Human Yes 09/03–10/03 186 County Date
7 [CA] Dead Bird Yes 01/03–10/03 3032 City/zip Minutes
8 [CA] Chicken Sera Yes 04/03–10/03 18887 Site Date
9 [CA] Mosquito Pool Yes 01/98–10/03 3518 Site Date
10 [CA] Botulism Yes 01/01–12/02 53 Zip Date
11 [USGS] EPIZOO - Preliminary Yes 07/99–09/03 46 events County Date
12 [USGS] EPIZOO – WNV Yes 08/1999-07/2004 113 events County Date
13 [USGS] EPIZOO - Botulism Yes 12/1989-12/2004 702 events County Date
14 [UC Davis] FMD Yes 1996 - 2003 3288 Site/Province Date/Month
15 International FMD Yes 01/1982-03/2005 6789 Province Non-temporal
16 BioWatch Yes 1/10- 1/17 2004 480 Exact Site Date
17 [CA] Mosquito Treatment Yes 1/14-11/30 2004 6194 Exact Site Date
18 National Infant Botulism Yes 1/16-11/25 2004 15 Zip Date
57
Communications/Messaging
• Scalable, flexible, light-weight, and extendible. Easy to include: – New diseases
– New jurisdictions
– New techniques!
• Messaging infrastructure – installed and tested – NYSDOH-UA: PHIN MS
– CADHS-UA: Regional message broker
– NWHC-UA: PHIN MS
• XML generation/conversion – NY_DeadBird, NY_Alerts, NY_BotHuman, NY_WNVHuman,
NY_CaptiveAnimal, NY_Mosquito
– CA_BotHuman, CA_WNVHuman, CA_DeadBird, CA_Chicken, CA_Mosquito
– USGS_Epizoo
58
BioPortal Research Framework
• BioPortal – Demo: Develop the system for
demonstration purposes using scrubbed data.
Refine system functionality and performance
based on user feedback.
• BioPortal – Operation: Develop the system for
production mode with real data and real users.
• BioPortal – Research: Continue to develop
advanced technologies and practical sharing
policies. Expand to new diseases and jurisdictions.
59
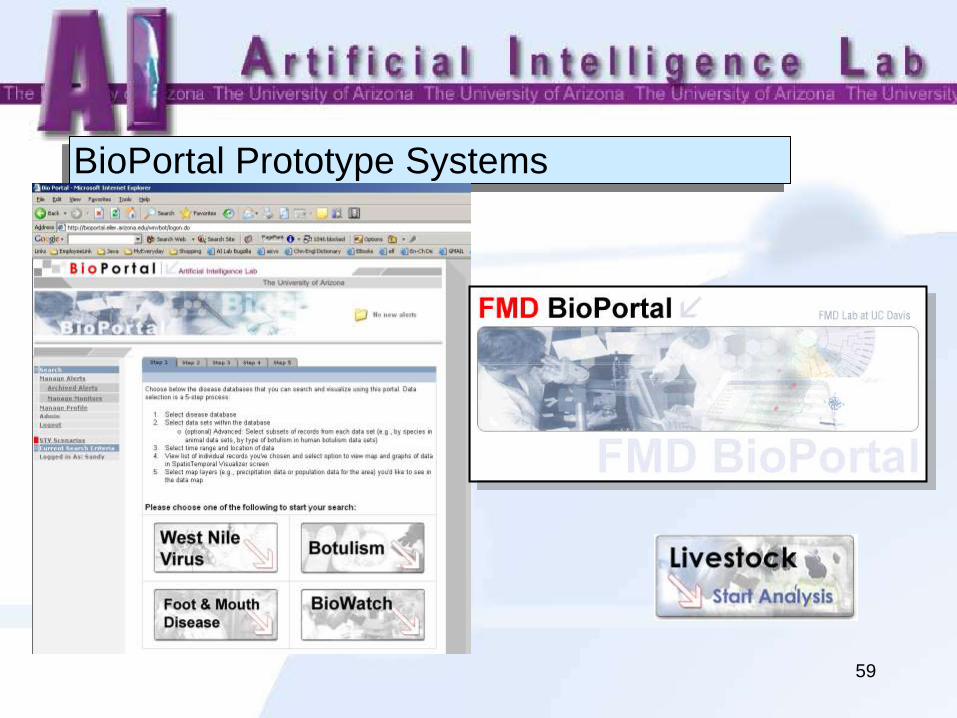
BioPortal Prototype Systems
60
Spatio-Temporal Data Mining & Hotspot Analysis
• A hotspot is a condition indicating some form of clustering in a spatial and temporal distribution (Rogerson & Sun 2001; Theophilides et al. 2003;
Patil & Tailie 2004).
• For WNV, localized clusters of dead birds typically identify high-risk disease areas (Gotham et
al. 2001).
• Automatic detection of dead bird clusters using hotspot analysis can help predict disease outbreaks and aid in effective allocation of prevention/control resources.
61
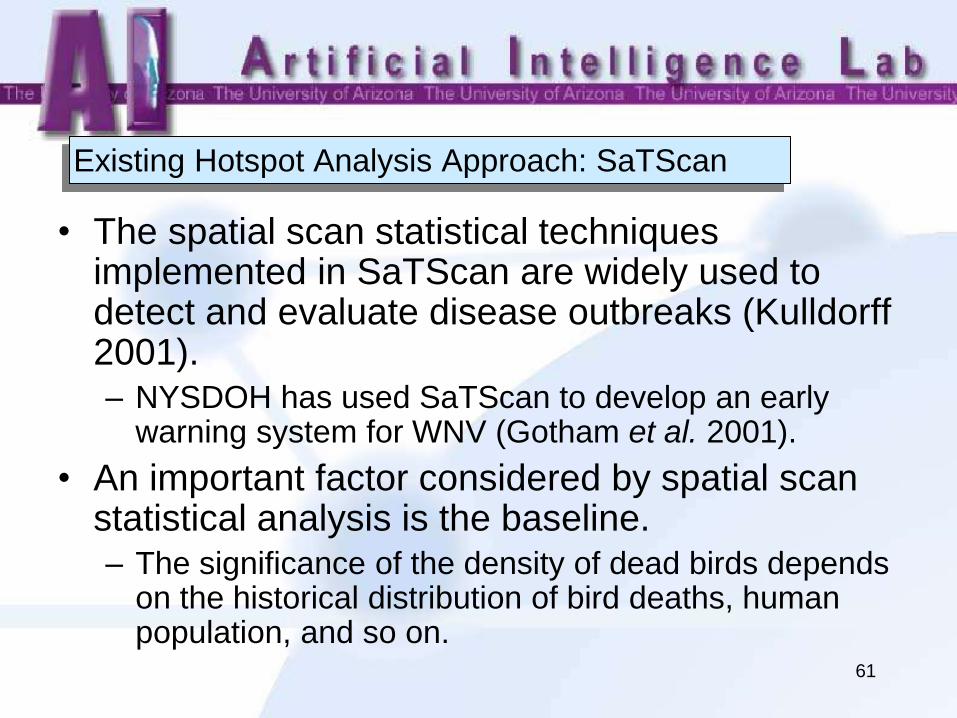
Existing Hotspot Analysis Approach: SaTScan
• The spatial scan statistical techniques implemented in SaTScan are widely used to detect and evaluate disease outbreaks (Kulldorff 2001). – NYSDOH has used SaTScan to develop an early
warning system for WNV (Gotham et al. 2001).
• An important factor considered by spatial scan statistical analysis is the baseline. – The significance of the density of dead birds depends
on the historical distribution of bird deaths, human population, and so on.
62
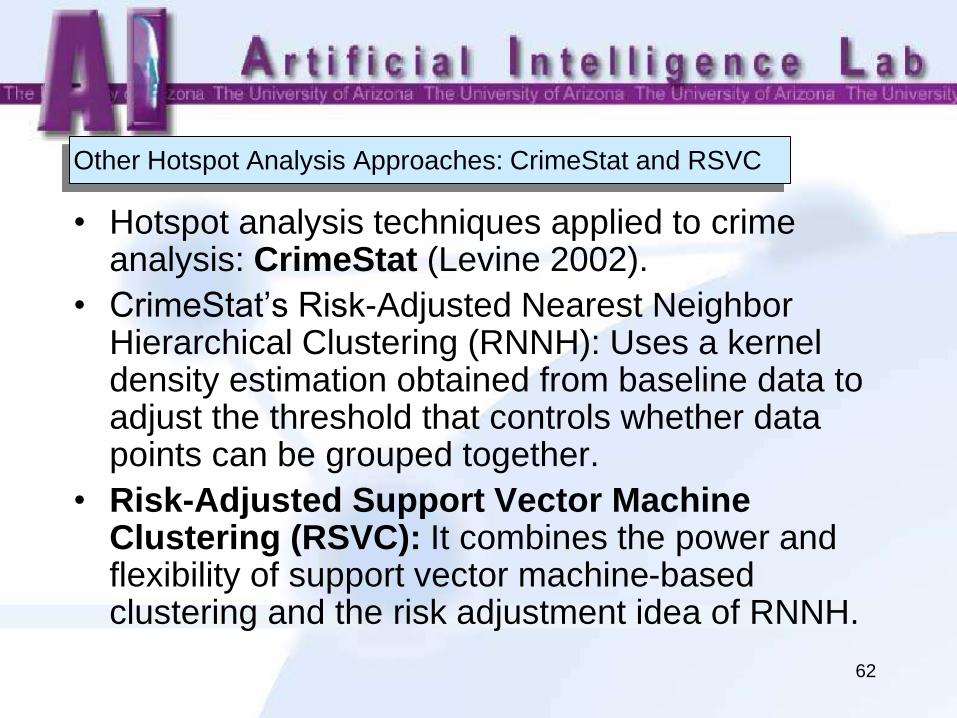
Other Hotspot Analysis Approaches: CrimeStat and RSVC
• Hotspot analysis techniques applied to crime analysis: CrimeStat (Levine 2002).
• CrimeStat’s Risk-Adjusted Nearest Neighbor Hierarchical Clustering (RNNH): Uses a kernel density estimation obtained from baseline data to adjust the threshold that controls whether data points can be grouped together.
• Risk-Adjusted Support Vector Machine Clustering (RSVC): It combines the power and flexibility of support vector machine-based clustering and the risk adjustment idea of RNNH.
63
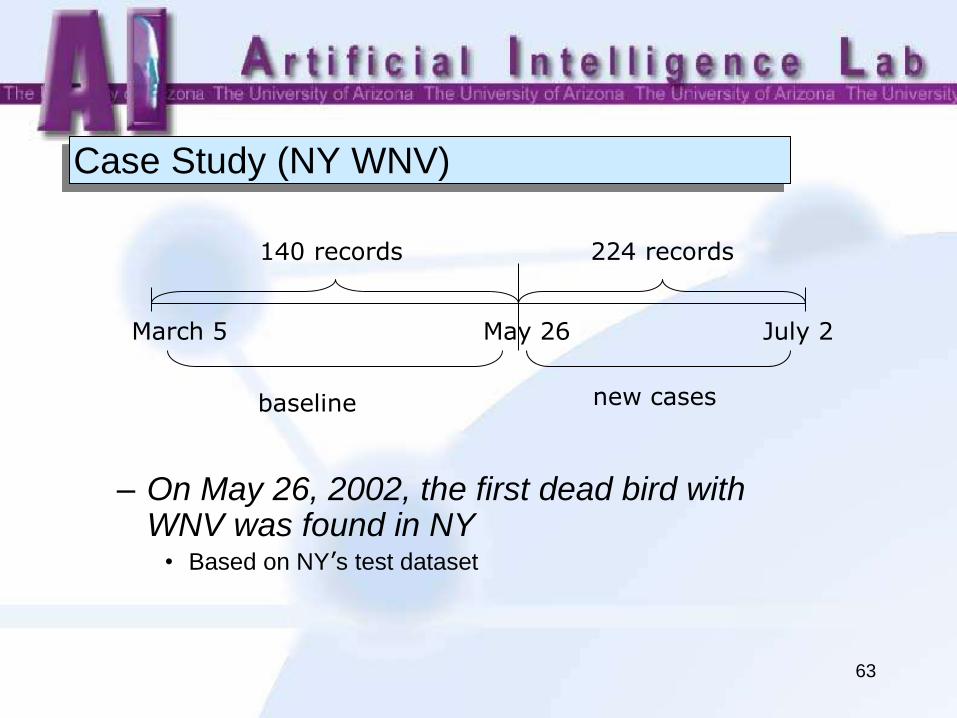
Case Study (NY WNV)
– On May 26, 2002, the first dead bird with
WNV was found in NY • Based on NY’s test dataset
March 5 May 26 July 2
baseline new cases
140 records 224 records
64
NY Dead bird 2002
RNNH
SaTScan #1
SaTScan #2
Analysis results from SaTScan and RNNH
high density
area
Zoom in
Baseline cases in zoomed-in area Baseline + new cases in zoomed-in area Hotspot analysis results
SaTScan
RNNH
Hotspots Zoom in
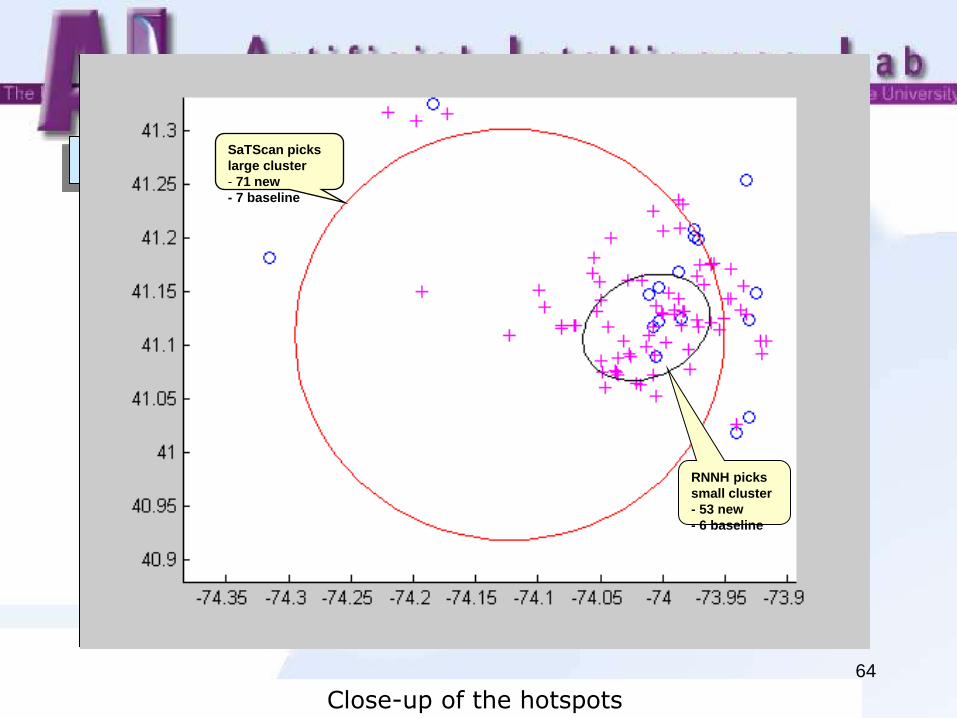
Close-up of the hotspots
SaTScan picks
large cluster
- 71 new
- 7 baseline
RNNH picks
small cluster
- 53 new
- 6 baseline
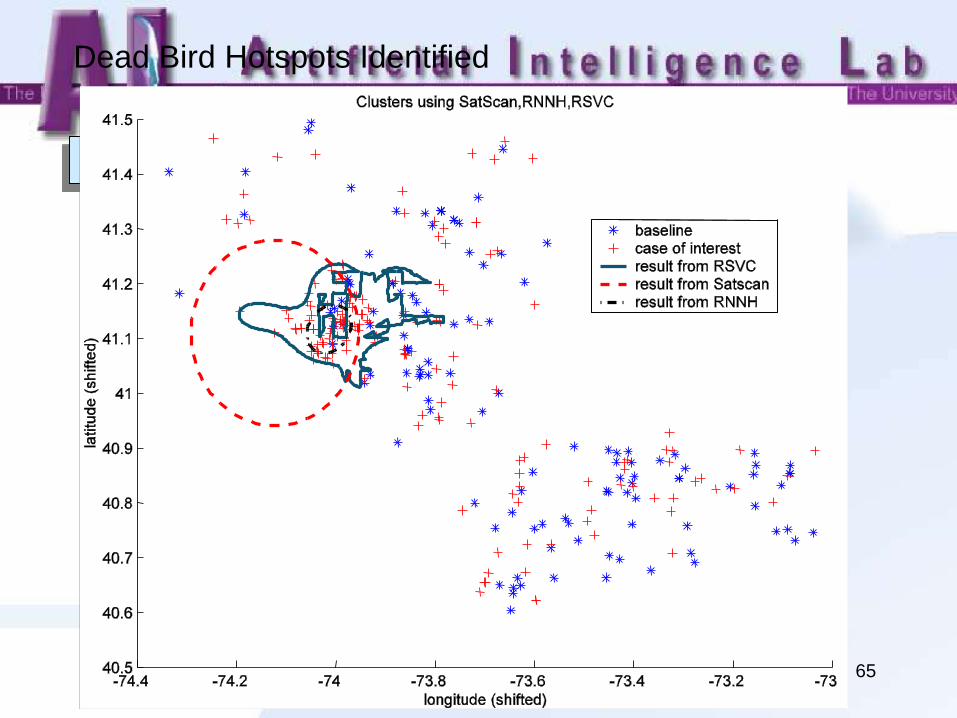
65
Dead Bird Hotspots Identified
66
Hotspot Analysis Findings
• RSVC delivers similar recall levels and
higher precision than SaTScan.
• RNNH matches RSVC precision, but has
very low recall.
• RSVC significantly outperforms other
methods in the F-measure.
• Techniques could be complementary for
different hotspot analysis tasks.
67
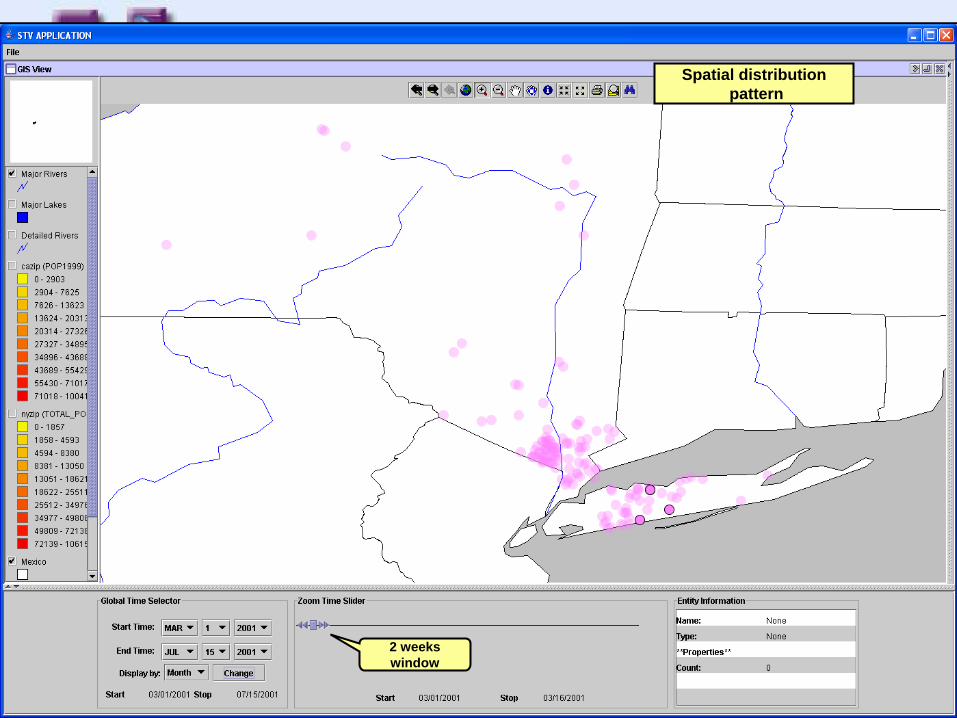
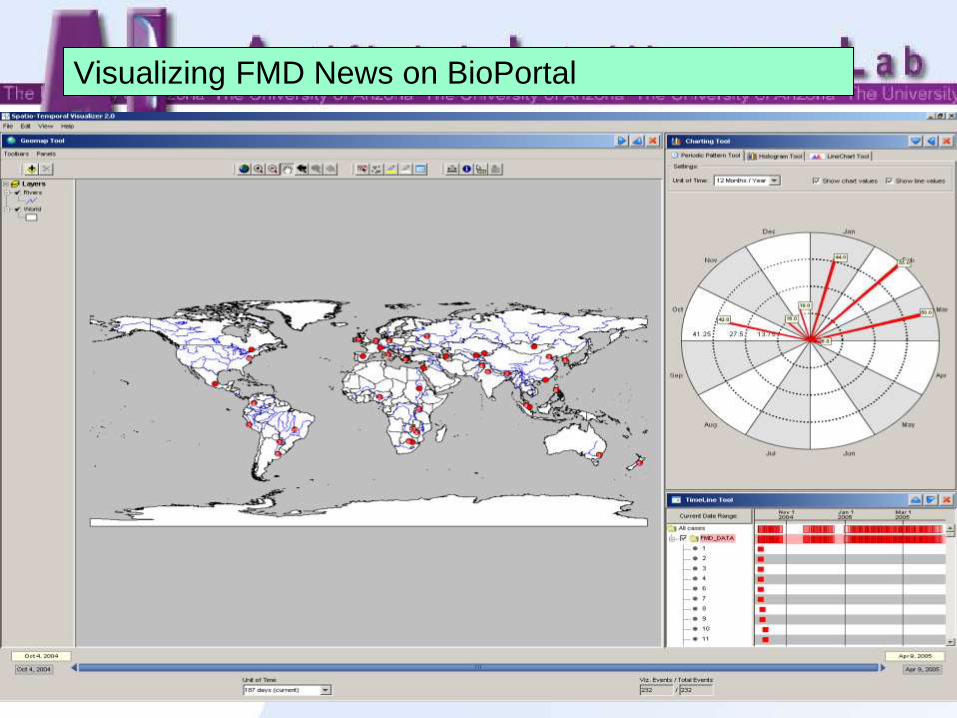
Spatial-Temporal Visualization
• Integrates four visualization techniques – GIS View
– Periodic Pattern View
– Timeline View
– Central Time Slider
• Visualizes the events in multiple dimensions to identify hidden patterns – Spatial
– Temporal
– Hotspot analysis
– Phylogenetic (planned)
68
User Login
Choose WNV disease
data
User main page Available dataset list
Select CA dead bird,
chicken and NY dead
bird data
Select CA dead bird,
chicken and NY dead
bird data
Advanced Search criteria
Positive cases
Positive cases
Positive cases
Specify bird
species
Dataset name
Spatial / Temporal
Time range
County / State
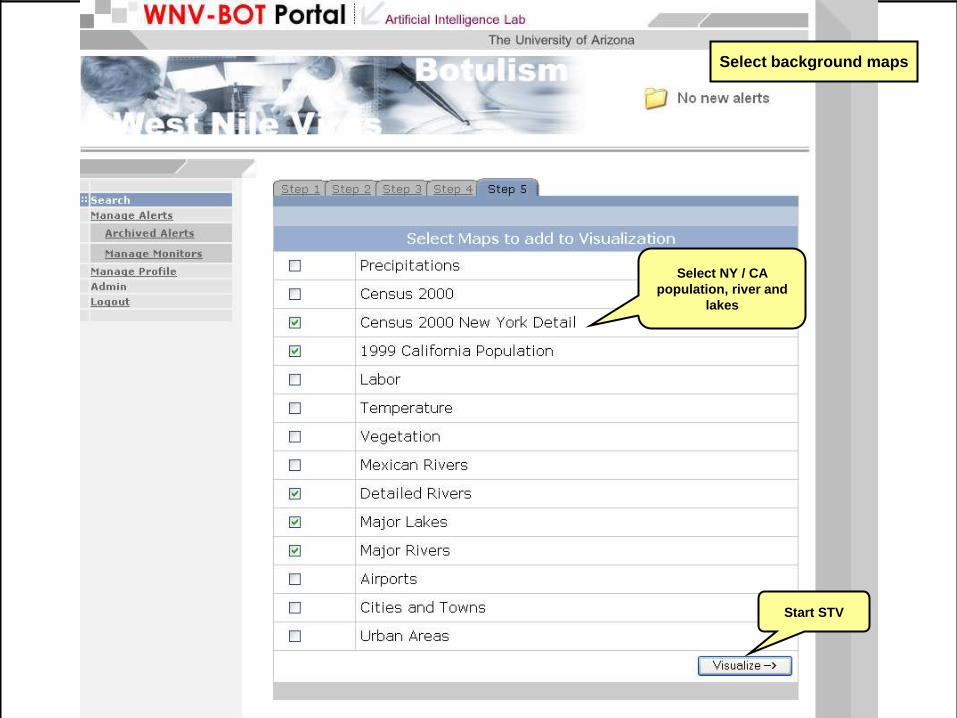
Results listed in table Select background maps
Select NY / CA
population, river and
lakes
Start STV
69
Zoom in
NY
Timeline
Periodic
Pattern
GIS
Control
panel View all 3 year
data
Overall pattern
NY dead bird temporal
distribution pattern
1 year window
in 3 year span
Concentrated
in May / Jun
NY dead bird temporal
distribution pattern
Move time
slider, year 2 Similar time
pattern
NY dead bird temporal
distribution pattern
Move time
slider, year 3 Similar time
pattern
NY dead bird temporal
distribution pattern
Zoom in
Close Close
Year 2001
data
Spatial distribution
pattern
Spatial distribution
pattern
2 weeks
window
Spatial distribution
pattern
70
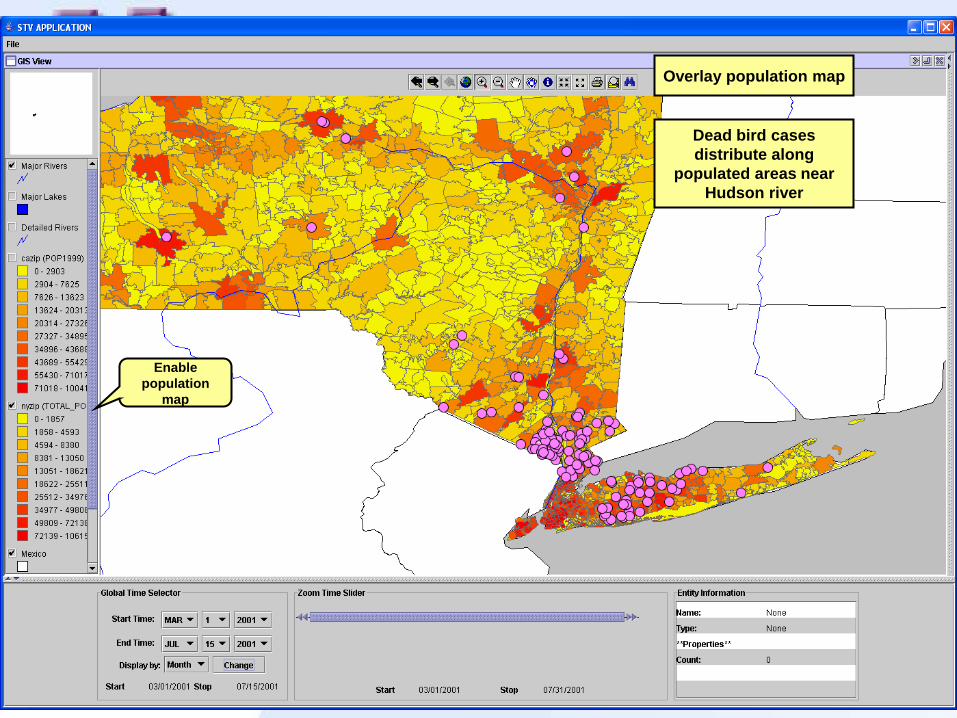
Move time
slider
Spatial distribution
pattern
Spatial distribution
pattern
Spatial distribution
pattern
Spatial distribution
pattern
Spatial distribution
pattern
Spatial distribution
pattern
Spatial distribution
pattern
Spatial distribution
pattern
Spatial distribution
pattern
Spatial distribution
pattern
Spatial distribution
pattern
Spatial distribution
pattern
Spatial distribution
pattern
Season end
Dead bird cases
migrate from long island
Into upstate NY
Enable
population
map
Overlay population map
Dead bird cases
distribute along
populated areas near
Hudson river
71
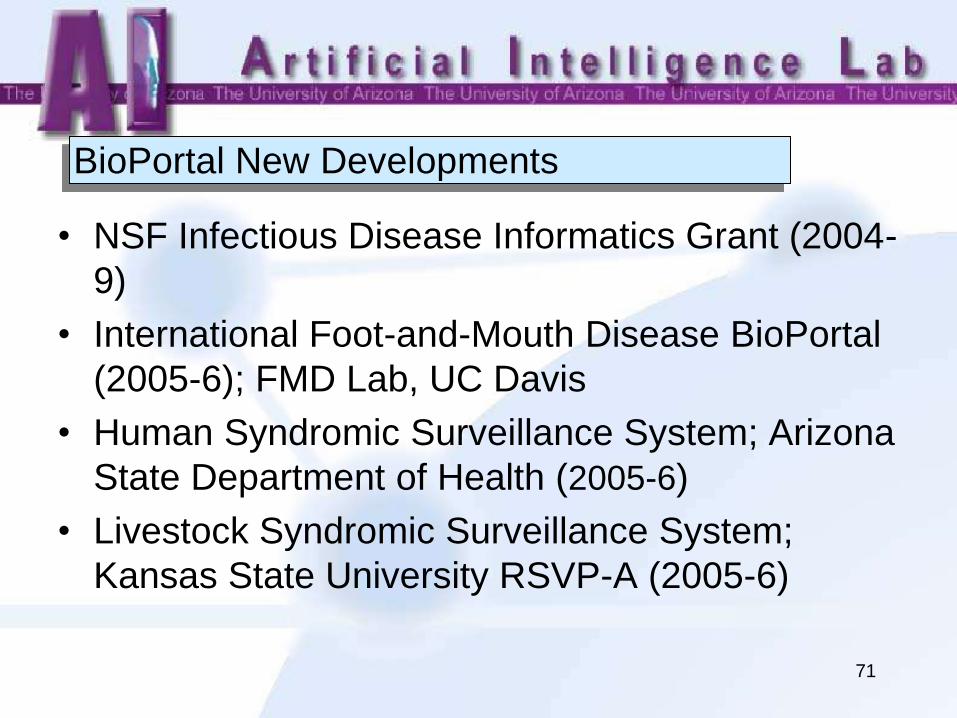
BioPortal New Developments
• NSF Infectious Disease Informatics Grant (2004-
9)
• International Foot-and-Mouth Disease BioPortal
(2005-6); FMD Lab, UC Davis
• Human Syndromic Surveillance System; Arizona
State Department of Health (2005-6)
• Livestock Syndromic Surveillance System;
Kansas State University RSVP-A (2005-6)
72
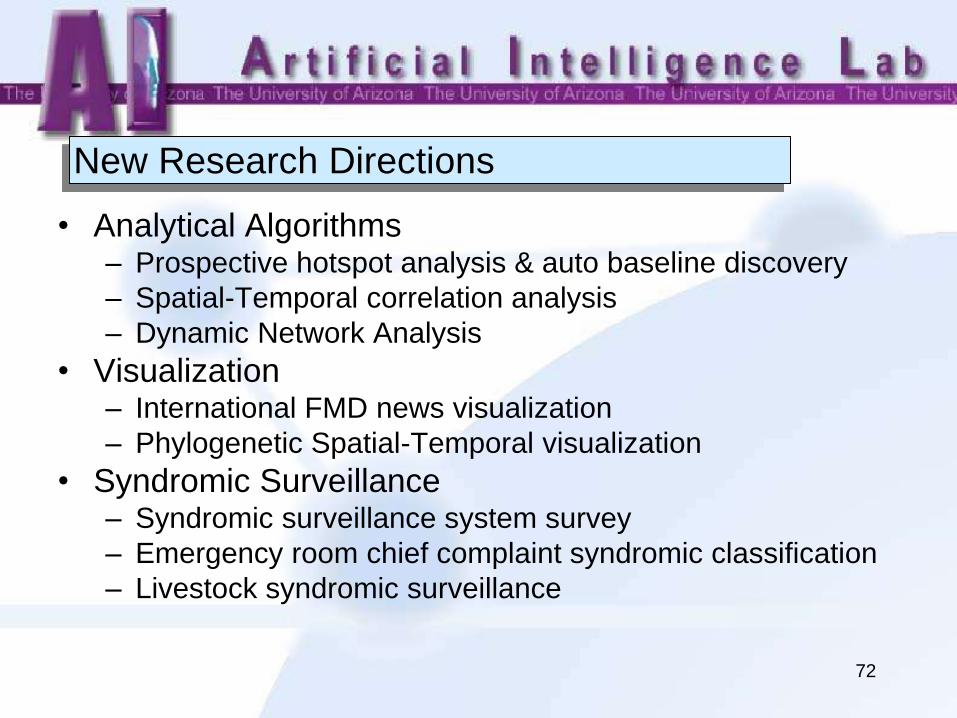
New Research Directions
• Analytical Algorithms – Prospective hotspot analysis & auto baseline discovery
– Spatial-Temporal correlation analysis
– Dynamic Network Analysis
• Visualization – International FMD news visualization
– Phylogenetic Spatial-Temporal visualization
• Syndromic Surveillance – Syndromic surveillance system survey
– Emergency room chief complaint syndromic classification
– Livestock syndromic surveillance
73
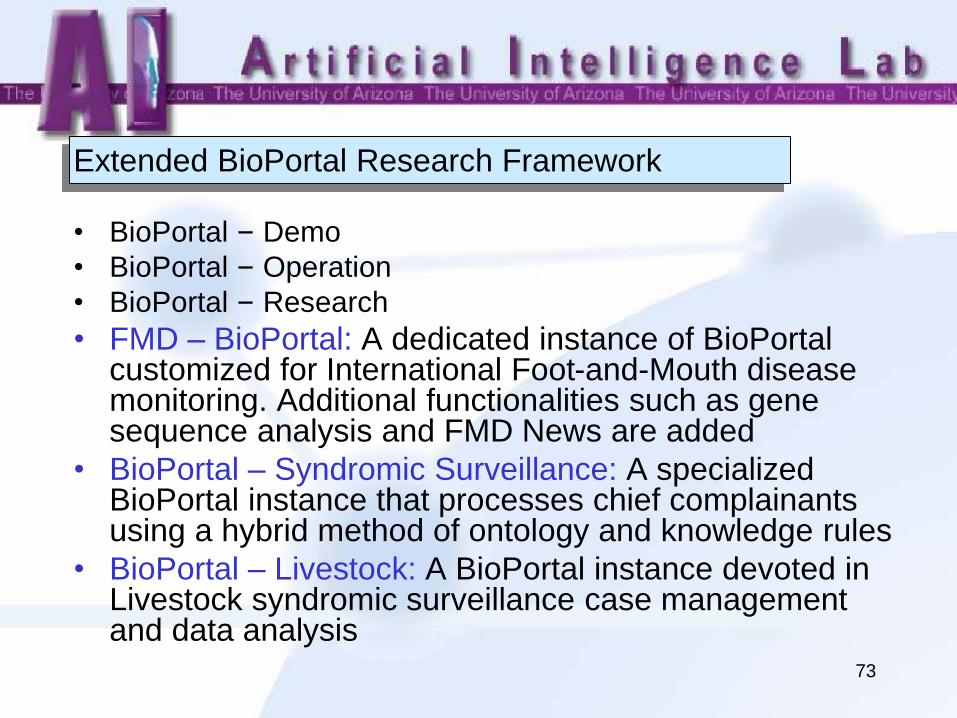
Extended BioPortal Research Framework
• BioPortal – Demo
• BioPortal – Operation
• BioPortal – Research
• FMD – BioPortal: A dedicated instance of BioPortal customized for International Foot-and-Mouth disease monitoring. Additional functionalities such as gene sequence analysis and FMD News are added
• BioPortal – Syndromic Surveillance: A specialized BioPortal instance that processes chief complainants using a hybrid method of ontology and knowledge rules
• BioPortal – Livestock: A BioPortal instance devoted in Livestock syndromic surveillance case management and data analysis
74
International FMD BioPortal
Acknowledgment: DHS, DOD, UC Davis (Drs. Thurmond and Lynch)
75
Introduction
• Foot-and-mouth disease (FMD) is the top disease on the Office International des Epizooties (OIE) List A, which can infect all cloven-hoofed animals.
• FMD is the most contagious infectious diseases of livestock animals:
– Massive shedding of virus and contamination of the environment.
– Transmitted by direct or indirect contact (droplets), animate vectors (humans), inanimate vectors (vehicles
– Serologically diverse with seven distinct types (A, O, C, SAT1, SAT2, SAT3, Asia1), which makes diagnosis and vaccination problematic, and genetic diversity likely.
• Endemic in Africa, Asia, Middle East and South America
• Potential cost for U.S. outbreaks: >$10 billion
• Broader economic impact: trade and travel restrictions.
76
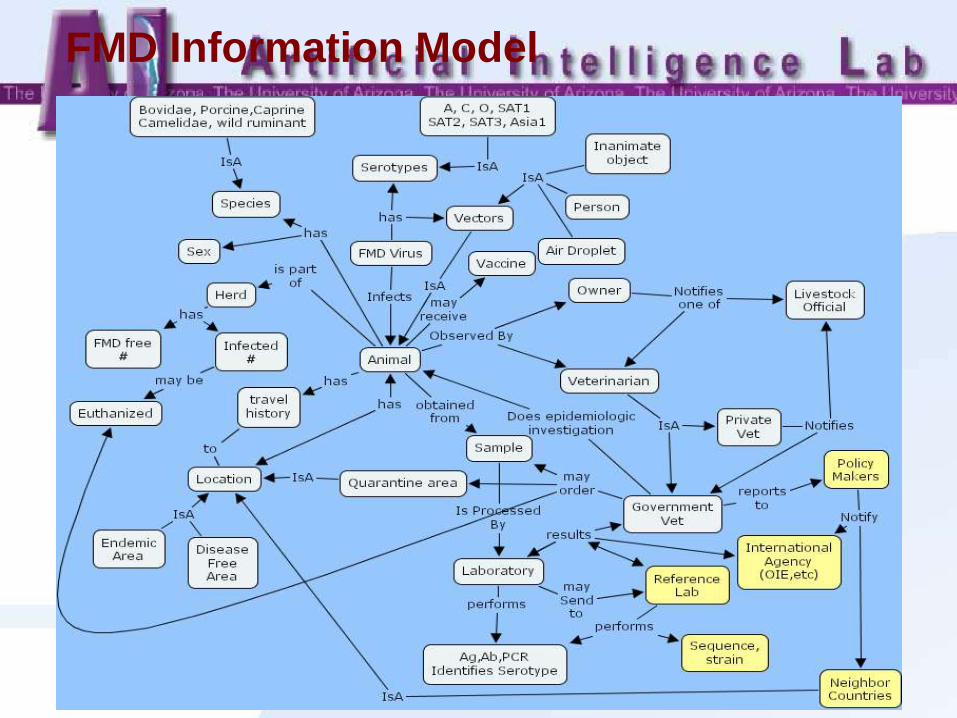
FMD Information Model
77
International FMD BioPortal Goals
• Real-time, web-based situational awareness of FMD
outbreaks worldwide through the establishment of an
international information sharing and analysis system
• FMDv characterization at the genomic level integrated
with associated epidemiological information and
modeling tools to forecast national, regional, and/or
international spread and the prospect of import into the
U.S. and the rest of North America
• Web-based crisis management of resources—
facilities, personnel, diagnostics, and therapeutics
78
Research Plans
• Global FMD epidemiological data
– (Near) real-time data collection
– Web-based information sharing and analysis
• International FMD news
– Indexed collection of global FMD news
– Search and visualization of the FMD news via the web
• FMD genetic/sequence data
– Predictive model using phylogenetic, spatial, and temporal
information to stop FMD at the boarder
– Visualization for FMD event in time, space, and genetic
space
79
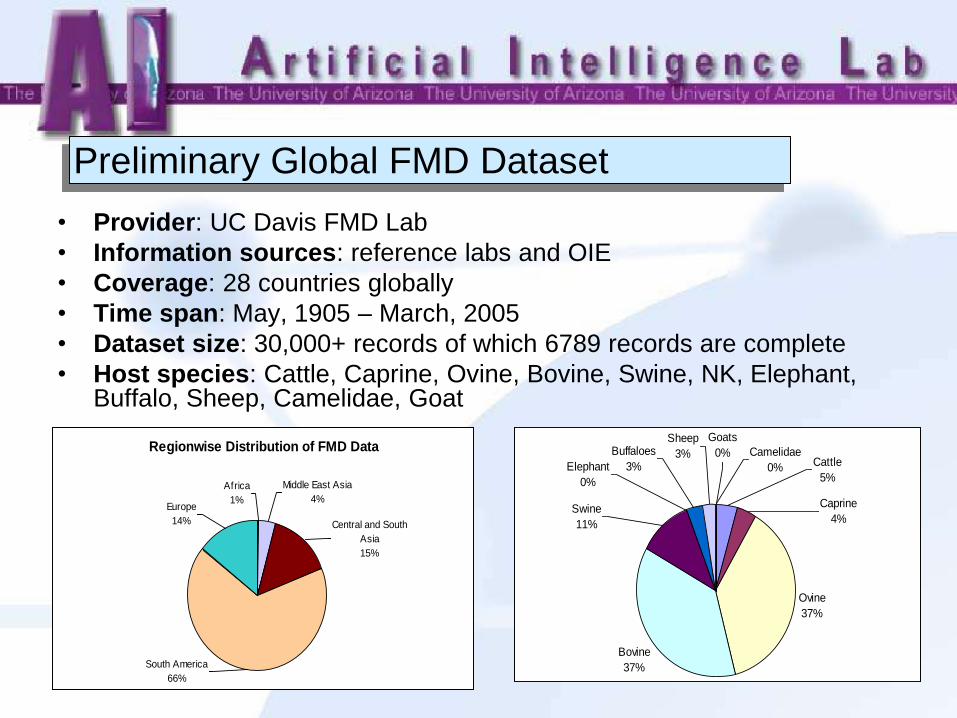
Preliminary Global FMD Dataset
• Provider: UC Davis FMD Lab
• Information sources: reference labs and OIE
• Coverage: 28 countries globally
• Time span: May, 1905 – March, 2005
• Dataset size: 30,000+ records of which 6789 records are complete
• Host species: Cattle, Caprine, Ovine, Bovine, Swine, NK, Elephant, Buffalo, Sheep, Camelidae, Goat
Ovine
37%
Bovine
37%
Caprine
4%
Cattle
5%
Sheep
3% Camelidae
0%
Goats
0%
Swine
11%
Elephant
0%
Buffaloes
3%
Regionwise Distribution of FMD Data
South America
66%
Central and South
Asia
15%
Africa
1%
Middle East Asia
4%Europe
14%
80
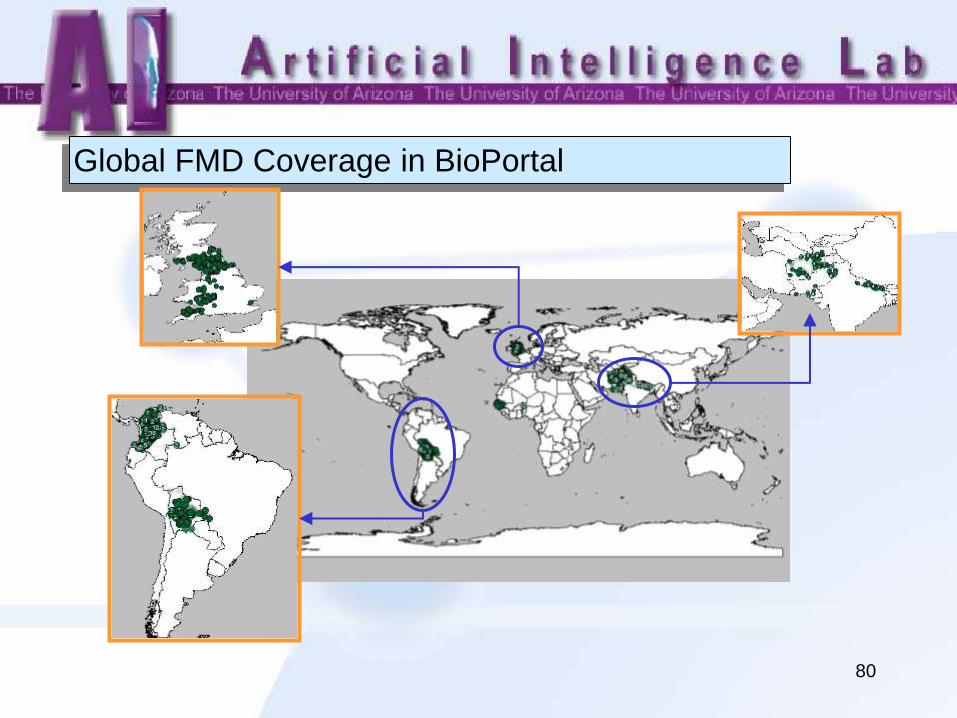
Global FMD Coverage in BioPortal
81
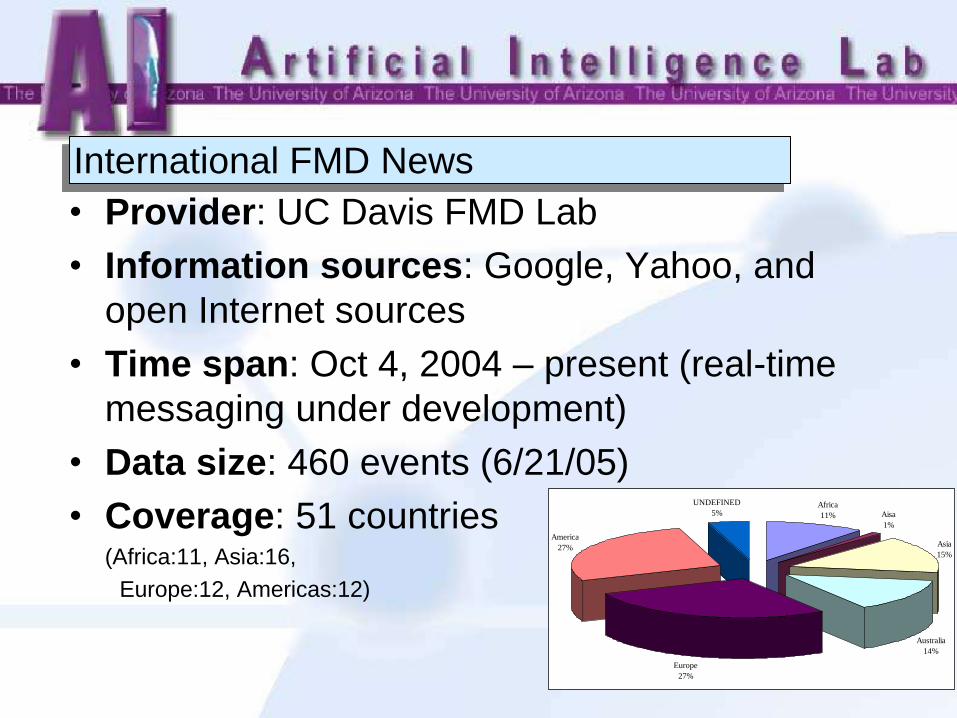
International FMD News
• Provider: UC Davis FMD Lab
• Information sources: Google, Yahoo, and
open Internet sources
• Time span: Oct 4, 2004 – present (real-time
messaging under development)
• Data size: 460 events (6/21/05)
• Coverage: 51 countries (Africa:11, Asia:16,
Europe:12, Americas:12)
Africa
11% Aisa
1%
Asia
15%
Australia
14%
Europe
27%
America
27%
UNDEFINED
5%
82
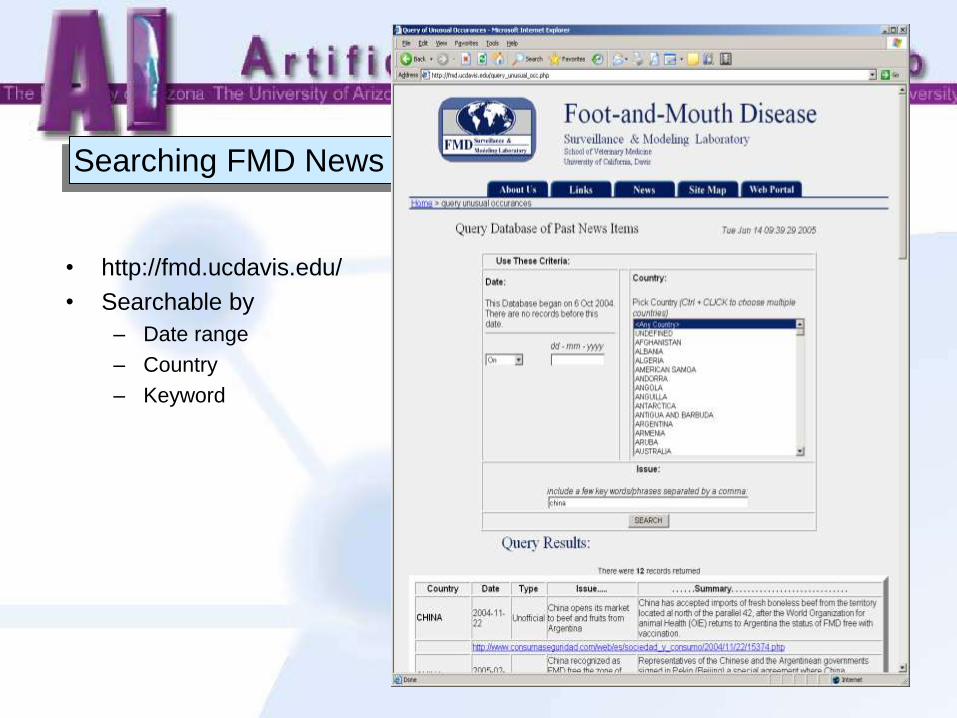
Searching FMD News
• http://fmd.ucdavis.edu/
• Searchable by
– Date range
– Country
– Keyword
83
Visualizing FMD News on BioPortal
84
FMD Genetic Information Analysis
• Genome clustering analysis
– Phylogenetic clustering
– Spatial clustering
– Temporal clustering
• Hotspot detection among gene sequences
– Create a tree structure based on semantic distance
between gene sequences.
– Automatically detect the dense portion of the tree.
– Identify the connection between the semantic cluster and
the geographic pattern of gene sequences.
85
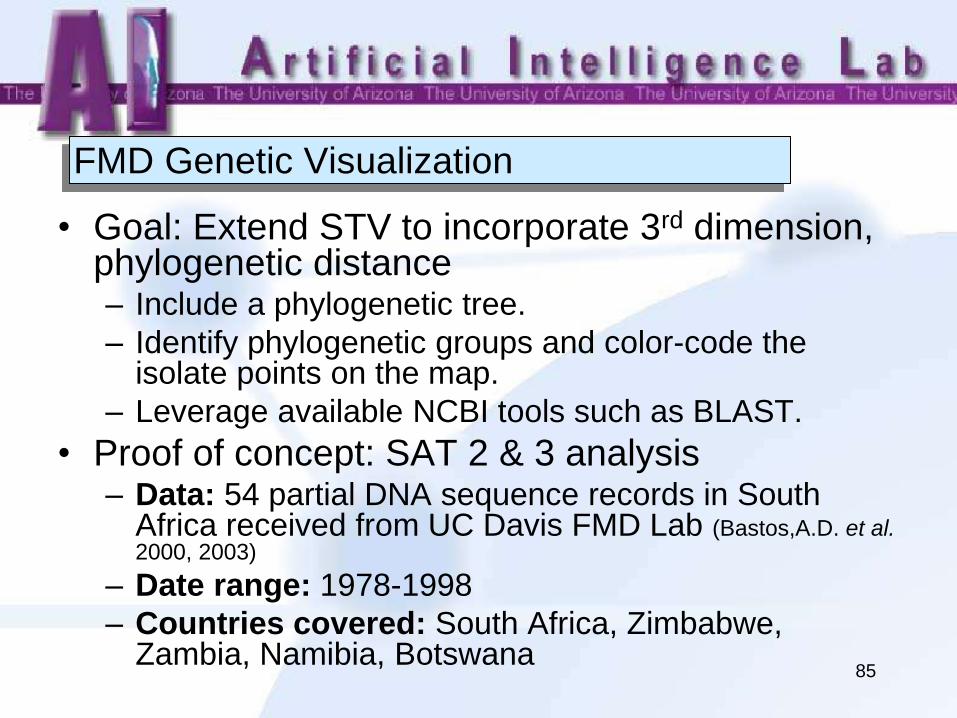
FMD Genetic Visualization
• Goal: Extend STV to incorporate 3rd dimension, phylogenetic distance – Include a phylogenetic tree.
– Identify phylogenetic groups and color-code the isolate points on the map.
– Leverage available NCBI tools such as BLAST.
• Proof of concept: SAT 2 & 3 analysis – Data: 54 partial DNA sequence records in South
Africa received from UC Davis FMD Lab (Bastos,A.D. et al. 2000, 2003)
– Date range: 1978-1998
– Countries covered: South Africa, Zimbabwe, Zambia, Namibia, Botswana
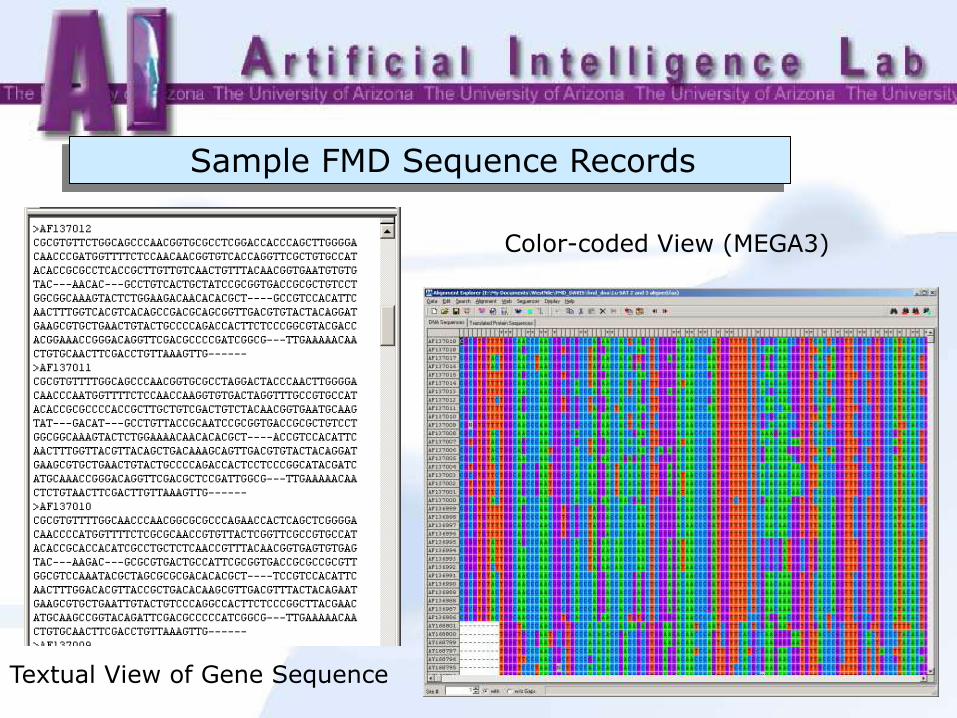
86 Textual View of Gene Sequence
Color-coded View (MEGA3)
Sample FMD Sequence Records
87
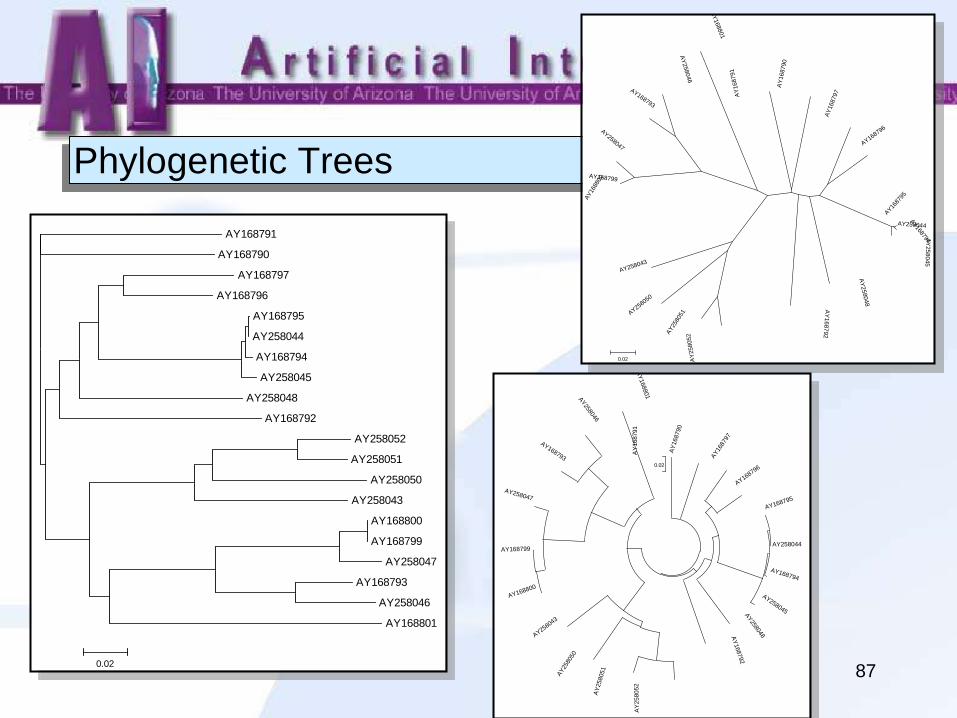
Phylogenetic Trees
AY168791
AY168790
AY168797
AY168796
AY168795
AY258044
AY168794
AY258045
AY258048
AY168792
AY258052
AY258051
AY258050
AY258043
AY168800
AY168799
AY258047
AY168793
AY258046
AY168801
0.02
AY
168791
AY
168790
AY
168797
AY168796
AY16
8795
AY258044
AY168794
AY
2580
45
AY
258048
AY
1687
92
AY
258052A
Y25
8051AY258050
AY258043
AY
1688
00
AY168799
AY258047
AY168793
AY
258046
AY
168801
0.02
AY
168791
AY
168790
AY16
8797
AY168796
AY168795
AY258044
AY168794
AY258045AY258048A
Y168792
AY
2580
52
AY
258051
AY25
8050
AY258043
AY168800
AY168799
AY258047
AY168793
AY258046
AY
168801
0.02
88
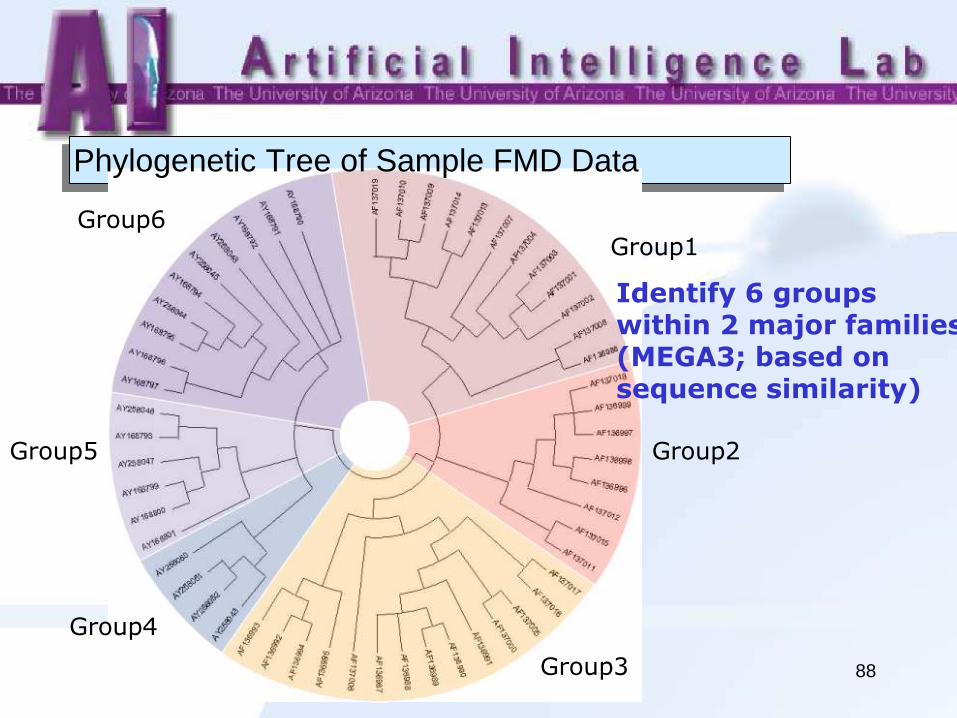
Phylogenetic Tree of Sample FMD Data
Identify 6 groups within 2 major families (MEGA3; based on sequence similarity)
Group4
Group2
Group3
Group1
Group5
Group6
89
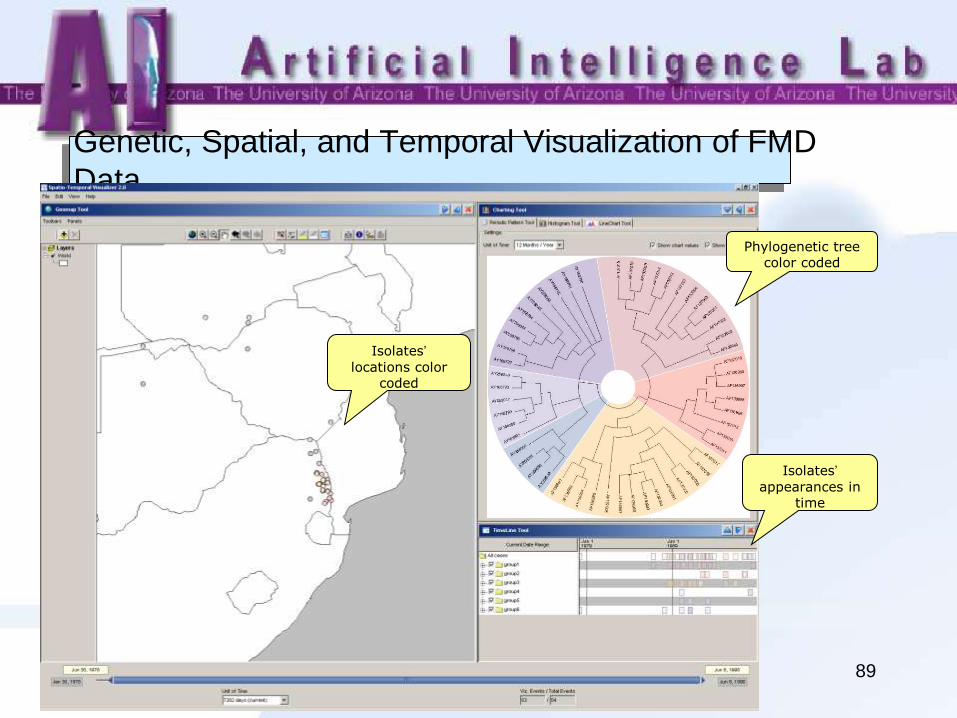
Genetic, Spatial, and Temporal Visualization of FMD
Data
Isolates’
locations color coded
Phylogenetic tree color coded
Isolates’
appearances in time
90
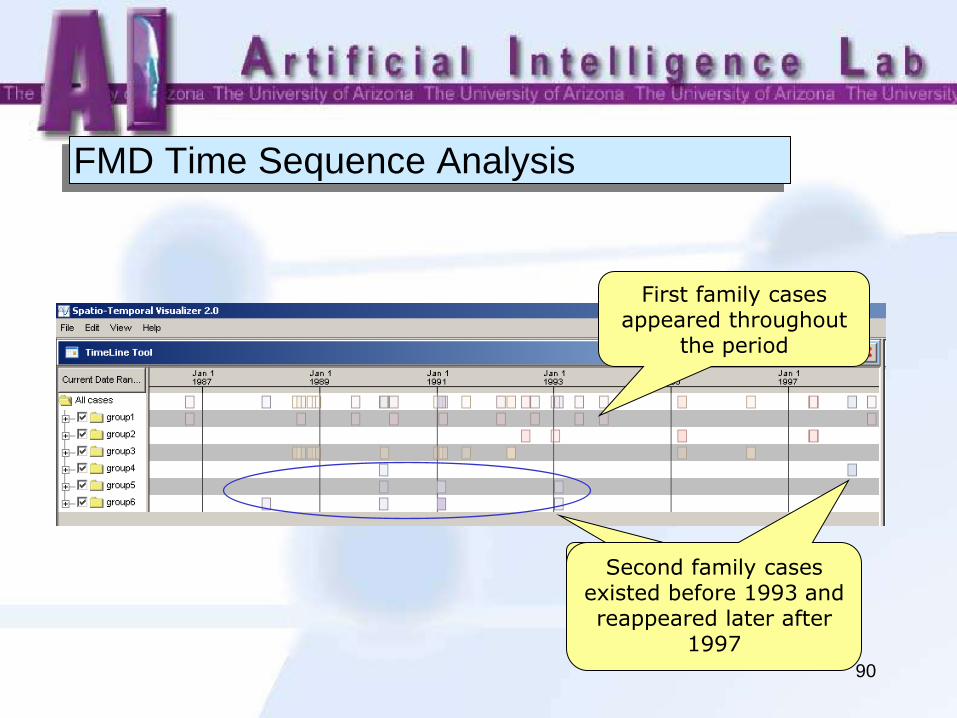
FMD Time Sequence Analysis
2nd family cases exist before 1993 and a comeback lately
First family cases appeared throughout
the period
Second family cases existed before 1993 and reappeared later after
1997
91
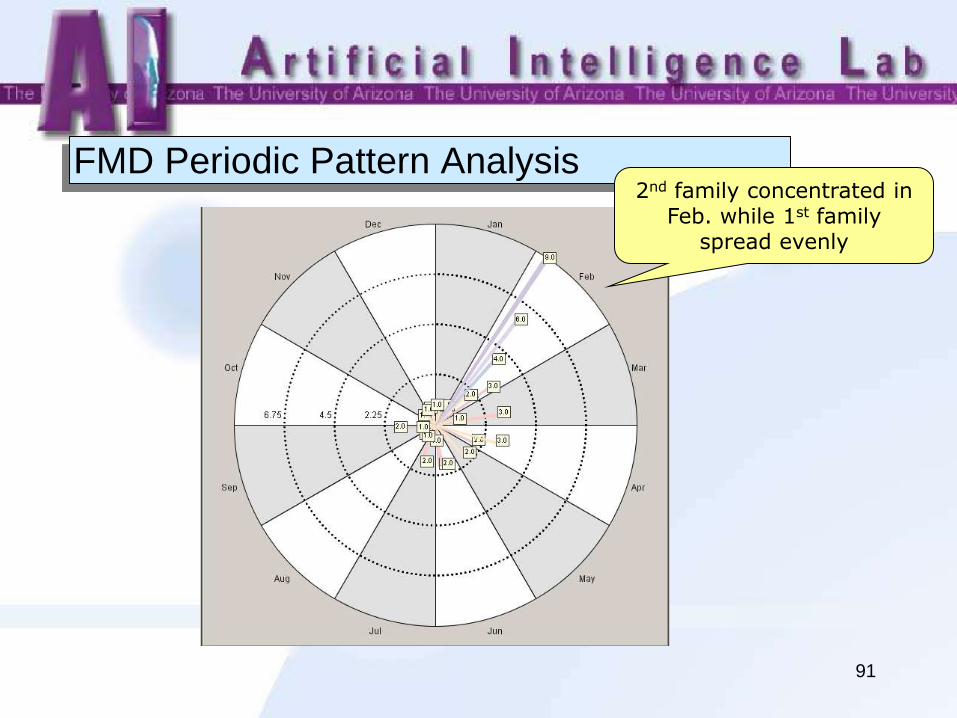
FMD Periodic Pattern Analysis 2nd family concentrated in
Feb. while 1st family spread evenly
92
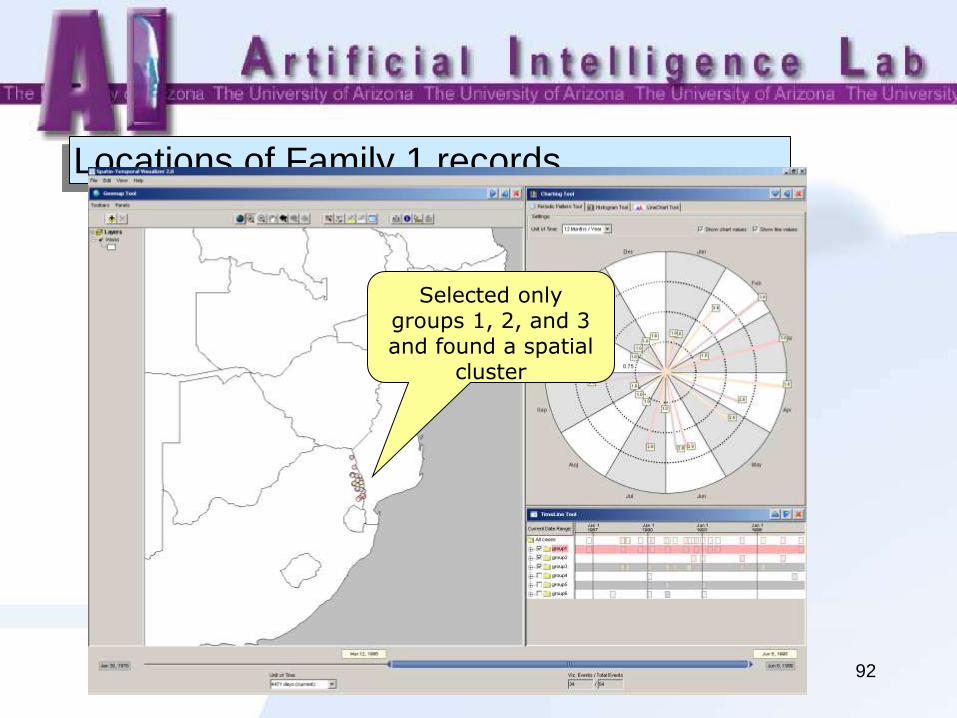
Locations of Family 1 records
Selected only groups 1, 2, and 3 and found a spatial
cluster
93
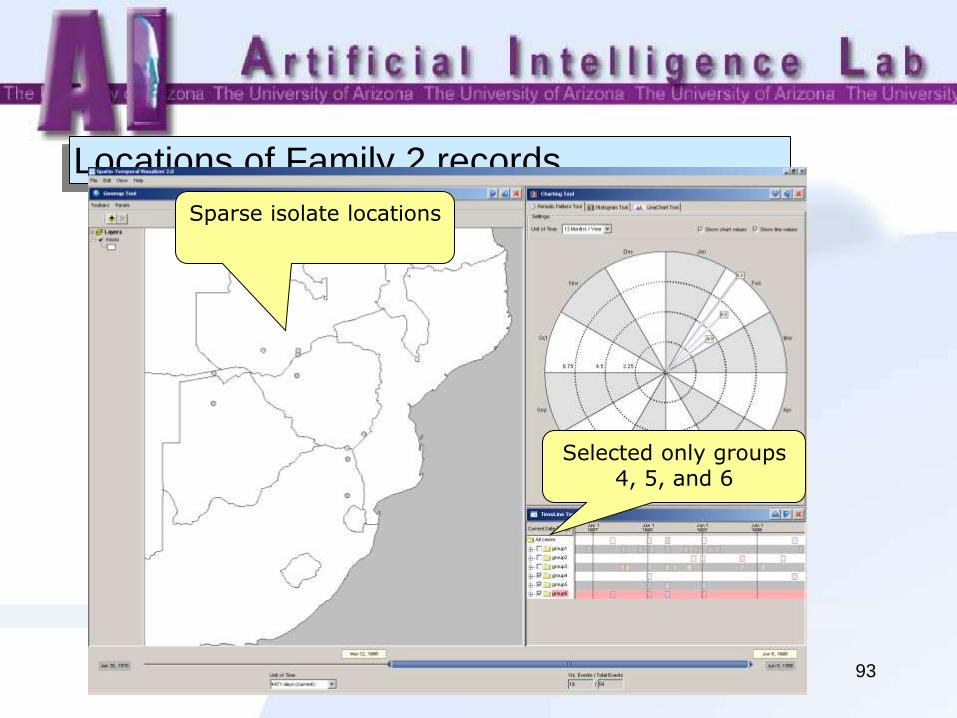
Locations of Family 2 records
Selected only groups 4, 5, and 6
Sparse isolate locations
94
BioPortal: Future Work
• Complete open source, generic BioPortal
architecture and system
• Develop multi-lingual BioPortal
• Incorporate other diseases, e.g., avian
influenza, SARS
• Solicit partners and expand test sites
• Continue infectious disease informatics
research
96
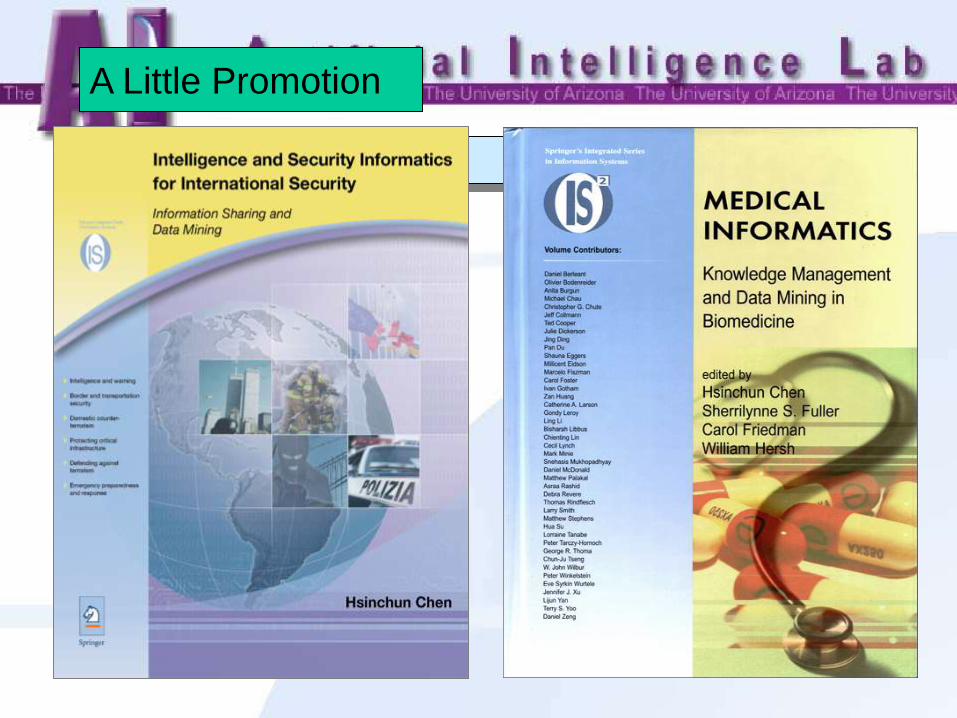
A Little Promotion
97
“Library as the Place”
“Librarian in Context”
Role of a librarian in a digital world?
Challenges and opportunities facing the
library and information profession?

98
For more information:
Hsinchun Chen
AI Lab web site:
http://ai.arizona.edu