Embed Size (px)
Citation preview
Disability and Poverty in Developing Countries:A Snapshot from the World Health Survey
Joint work between Sophie Mitra, Fordham University, Aleksandra Posarac, World Bank
Brandon Vick, Fordham UniversityOctober 12th, 2011
Presentation for Human Development Network, The World Bank
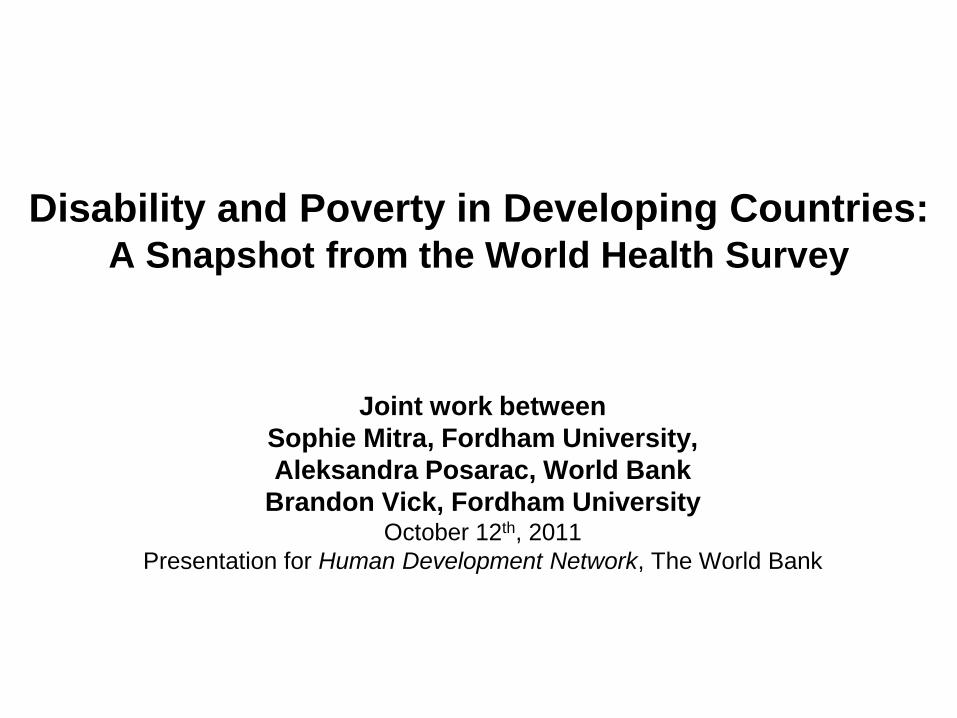
Outline
• Research Question• Background: Definitions and Pathways between
disability and poverty• Prior Research• Methods:
- Data; - Disability Measures;- Economic well being measures;- Multidimensional Poverty Measures;
• Results• Summary of Main Findings and Policy Implications
Research Question
• Are there differences in economic well being and poverty status between individuals with and without disability in developing countries?
Background: Definitions
In this study, what do we mean by• Poverty and economic well being?
This study considers both monetary(income/consumption expenditure) and non-monetary aspects of living standard and poverty (e.g., living conditions), at the household level (e.g. expenditures, assets), and at the individual level (e.g. educational attainment, employment).
• Disability?We use the International Classification of Functioning, Disability and Health (ICF).It denotes the negative aspects of the interaction between an individual (with a health condition) and that individual’s contextual factors (environmental and personal factors)
• Poverty may lead to the onset of a health condition which may result in disability including through:- malnutrition (Maulik et al. 2007; Lancet 2008), - diseases whose incidence and prevalence are strongly associated with poverty, - lack of inadequate public health interventions (e.g., immunization), - poor living conditions (e.g., lack of safe water and sanitation).
• Poverty, as a contextual factor, may also increase the likelihood that a health condition may result in impairment, activity limitation, or participation restriction: - limited access to health care and rehabilitation services; - limited access to prosthetic, orthotic and mobility devices.
Background: Poverty Disability
Background: Disability Poverty• Education. Disability may prevent school attendance of children and
youth with disabilities and restrict human capital accumulation.
• Employment. Disability may prevent work, or constrain the kind and amount of work a person can do (Gertler and Gruber 2002).
• Income. Through the ‘earnings handicap’, i.e. by affecting an individual’s ability to earn, disability may lead to the lower income for the individual and the household (Kochar 2001; Schultz et al 1997) and may result in worsening of the living standard if the household cannot compensate for the lost income and has to adjust its expenditures downward.
• Expenditures. Through the ‘conversion handicap’, disability may also lead to additional expenditures for the individual and the household with disability, in particular in relation to specific services (health care, transportation, assistive devices, personal assistance, and house adaptation). (Jones and O’Donnell 1995; Erb and Harris-White 2001) Because disability can both limit and increase household expenditures, the net effect is not a priori obvious.
Background (Cont.)
• Whether disability and poverty are associated is an empirical question.
Results on this association are expected to be context specific and, within a particular context, may vary by disability type and also by economic indicator (e.g., educational attainment, employment, living conditions).
• In developing countries, where disability benefit programs are scarce, where schools are often not accessible, and where vocational rehabilitation programs are small and under funded, one expects to find an association between disability and poverty in most countries.
Background (Cont.): Hypotheses
• Hypothesis # 1: In the 15 countries under study, disability is associated with poverty, where poverty may take the form of non-employment, low educational attainment, higher health expenditures, lower asset accumulations and worse living conditions.
• Hypothesis #2: This association between disability and poverty will vary across countries and thus will be contextual in nature. It may take different forms and have different magnitudes across countries.
Prior Research (1)
Regarding employment, almost all studies show that persons with disabilities are less likely to be employed:
• Contreras et al. 2006 (Chile and Uruguay); • Eide et al. 2003b (Namibia); • Eide and Loeb 2006 (Zambia), • Eide and Kamaleri 2009 (Mozambique); • Hoogeven 2005 (Uganda); • Mete 2008 (Eastern Europe); • Mitra 2008 (South Africa); • Mitra and Sambamoorthi 2008 (India); • World Bank 2009 (India); • Loeb and Eide (2004) (Malawi), • Trani and Loeb 2010 (Afghanistan and Zambia); • Zambrano 2006 (Peru).
Exception: in Zimbabwe, Eide et al. (2003a)
Prior Research (2)
Looking at the educational attainment among adults, there is consistent evidence that adults with disabilities have lower educational attainment:
• Contreras et al. 2006 (Chile and Uruguay); • Hoogeven 2005 (Uganda); • Loeb and Eide 2004 (Malawi);• Loeb et al. 2008 (South Africa); • Mete 2008 (Eastern Europe); • Rischewski et al. 2008 (Rwanda); • Trani and Loeb 2010 (Afghanistan and Zambia); • World Bank 2009 (India); • Zambrano 2006 (Peru).
Exception: Trani et al. (2010) for urban Sierra Leone.
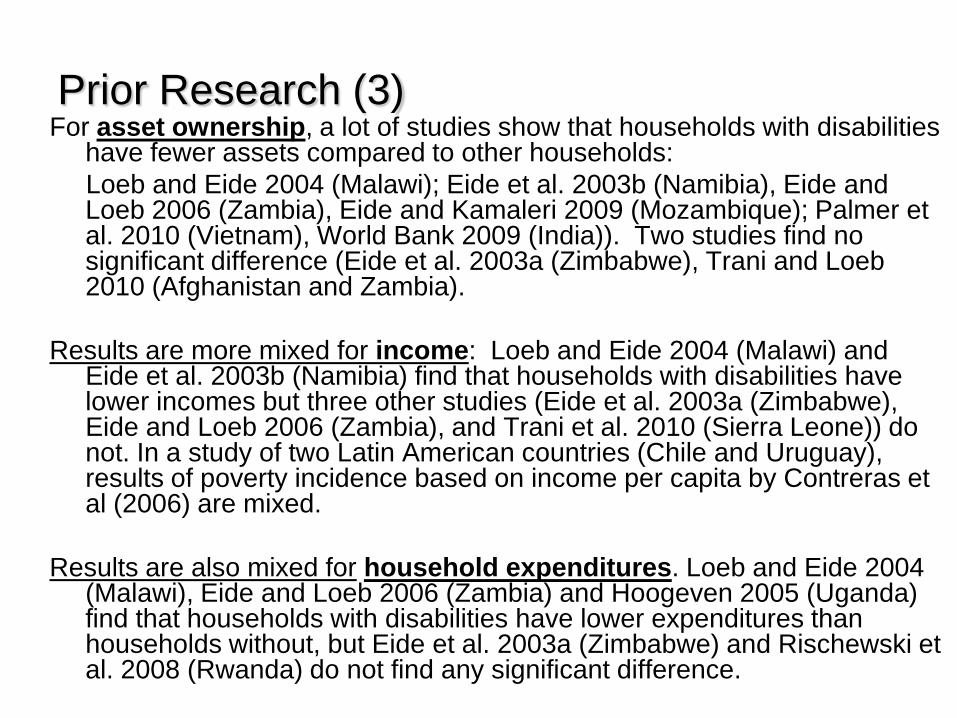
Prior Research (3)For asset ownership, a lot of studies show that households with disabilities
have fewer assets compared to other households:Loeb and Eide 2004 (Malawi); Eide et al. 2003b (Namibia), Eide and Loeb 2006 (Zambia), Eide and Kamaleri 2009 (Mozambique); Palmer et al. 2010 (Vietnam), World Bank 2009 (India)). Two studies find no significant difference (Eide et al. 2003a (Zimbabwe), Trani and Loeb 2010 (Afghanistan and Zambia).
Results are more mixed for income: Loeb and Eide 2004 (Malawi) and Eide et al. 2003b (Namibia) find that households with disabilities have lower incomes but three other studies (Eide et al. 2003a (Zimbabwe), Eide and Loeb 2006 (Zambia), and Trani et al. 2010 (Sierra Leone)) do not. In a study of two Latin American countries (Chile and Uruguay), results of poverty incidence based on income per capita by Contreras et al (2006) are mixed.
Results are also mixed for household expenditures. Loeb and Eide 2004 (Malawi), Eide and Loeb 2006 (Zambia) and Hoogeven 2005 (Uganda) find that households with disabilities have lower expenditures than households without, but Eide et al. 2003a (Zimbabwe) and Rischewski et al. 2008 (Rwanda) do not find any significant difference.
Prior Research (4)
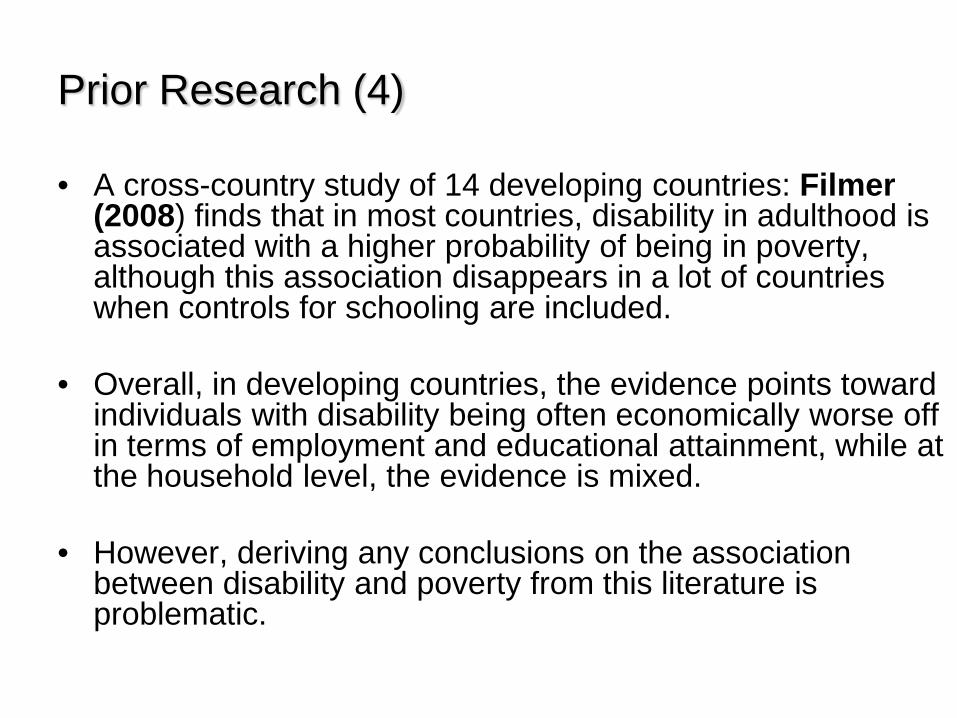
• A cross-country study of 14 developing countries: Filmer(2008) finds that in most countries, disability in adulthood is associated with a higher probability of being in poverty, although this association disappears in a lot of countries when controls for schooling are included.
• Overall, in developing countries, the evidence points toward individuals with disability being often economically worse off in terms of employment and educational attainment, while at the household level, the evidence is mixed.
• However, deriving any conclusions on the association between disability and poverty from this literature is problematic.
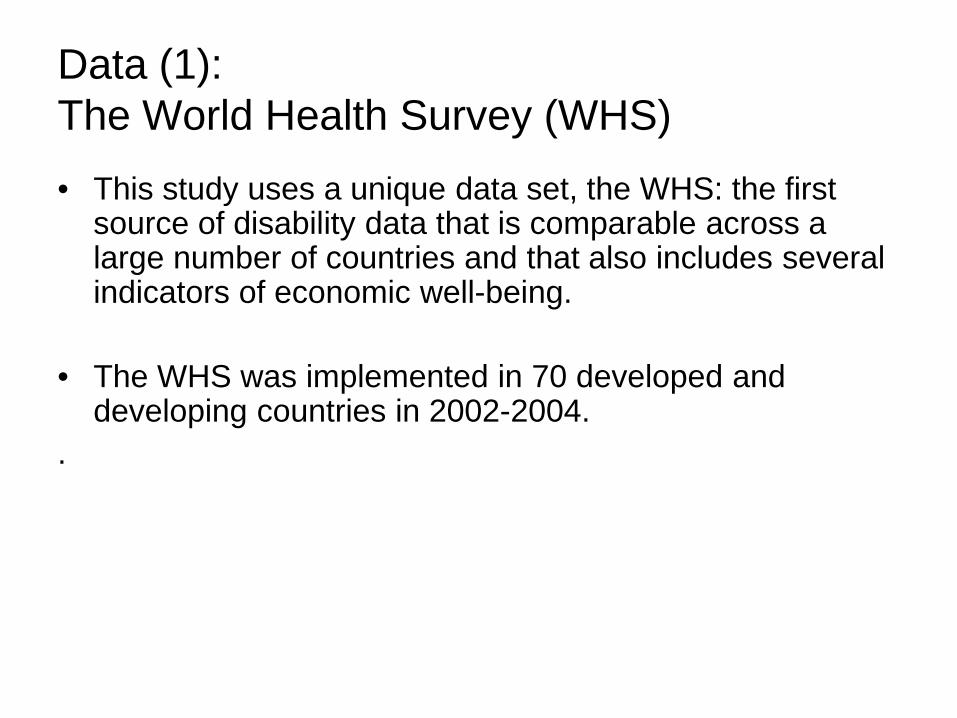
Data (1): The World Health Survey (WHS)• This study uses a unique data set, the WHS: the first
source of disability data that is comparable across a large number of countries and that also includes several indicators of economic well-being.
• The WHS was implemented in 70 developed and developing countries in 2002-2004.
.
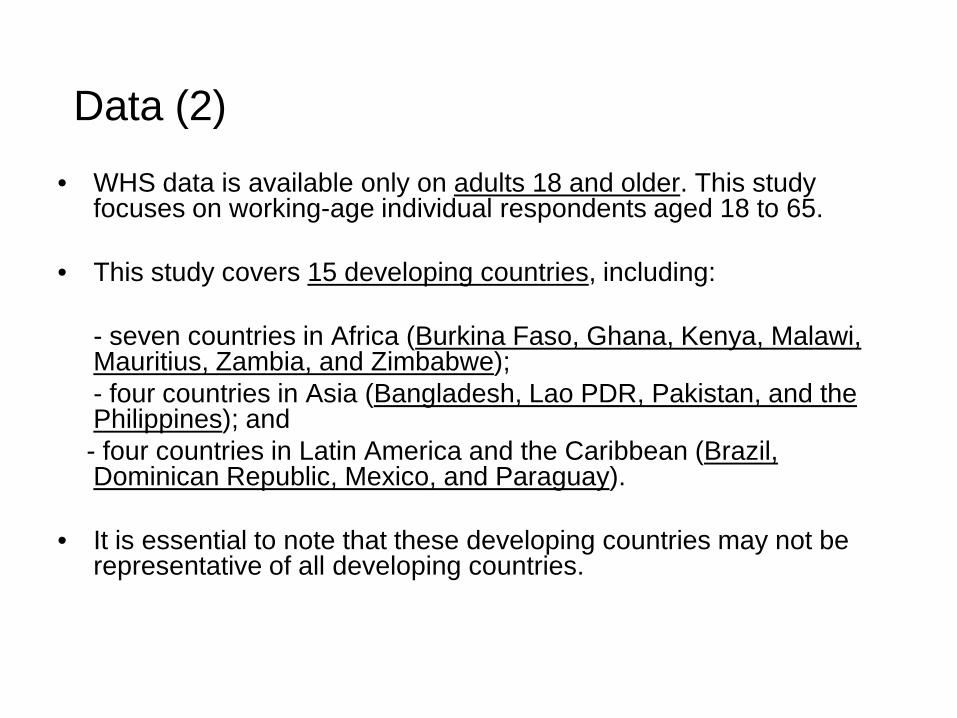
• WHS data is available only on adults 18 and older. This study focuses on working-age individual respondents aged 18 to 65.
• This study covers 15 developing countries, including:
- seven countries in Africa (Burkina Faso, Ghana, Kenya, Malawi, Mauritius, Zambia, and Zimbabwe);- four countries in Asia (Bangladesh, Lao PDR, Pakistan, and the Philippines); and - four countries in Latin America and the Caribbean (Brazil, Dominican Republic, Mexico, and Paraguay).
• It is essential to note that these developing countries may not be representative of all developing countries.
Data (2)
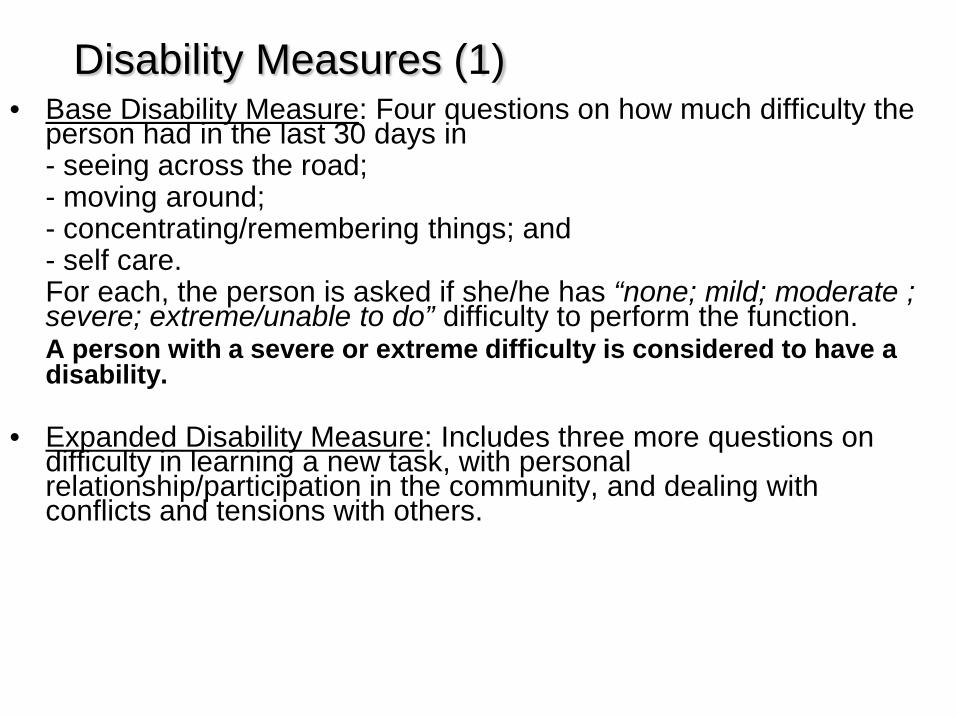
Disability Measures (1)• Base Disability Measure: Four questions on how much difficulty the
person had in the last 30 days in - seeing across the road;- moving around; - concentrating/remembering things; and - self care. For each, the person is asked if she/he has “none; mild; moderate ; severe; extreme/unable to do” difficulty to perform the function.A person with a severe or extreme difficulty is considered to have a disability.
• Expanded Disability Measure: Includes three more questions on difficulty in learning a new task, with personal relationship/participation in the community, and dealing with conflicts and tensions with others.
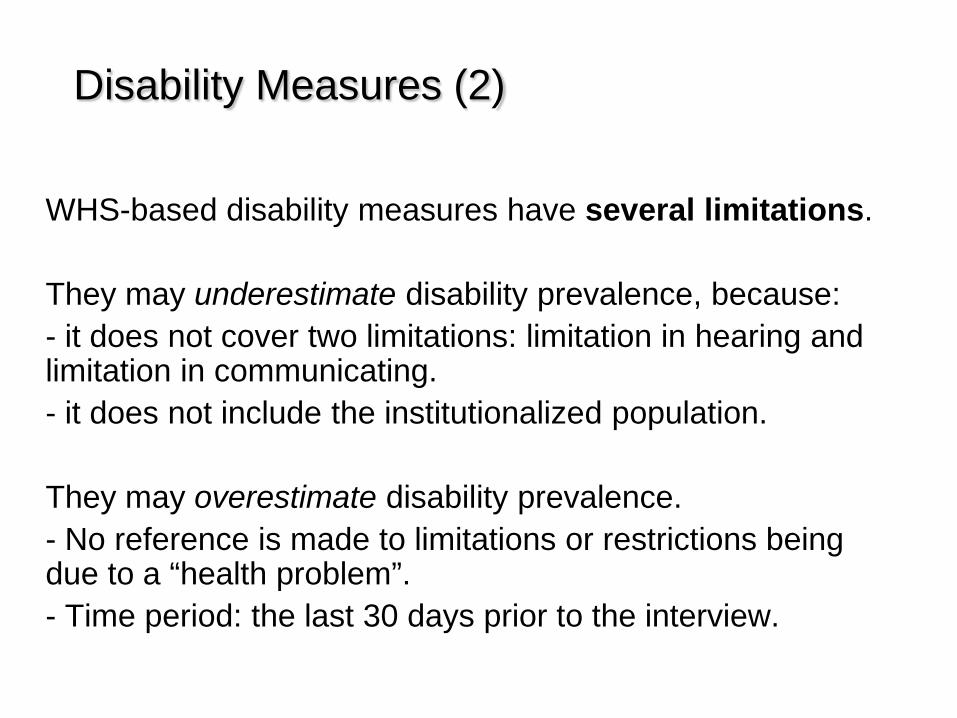
WHS-based disability measures have several limitations.
They may underestimate disability prevalence, because:- it does not cover two limitations: limitation in hearing and limitation in communicating. - it does not include the institutionalized population.
They may overestimate disability prevalence. - No reference is made to limitations or restrictions being due to a “health problem”. - Time period: the last 30 days prior to the interview.
Disability Measures (2)
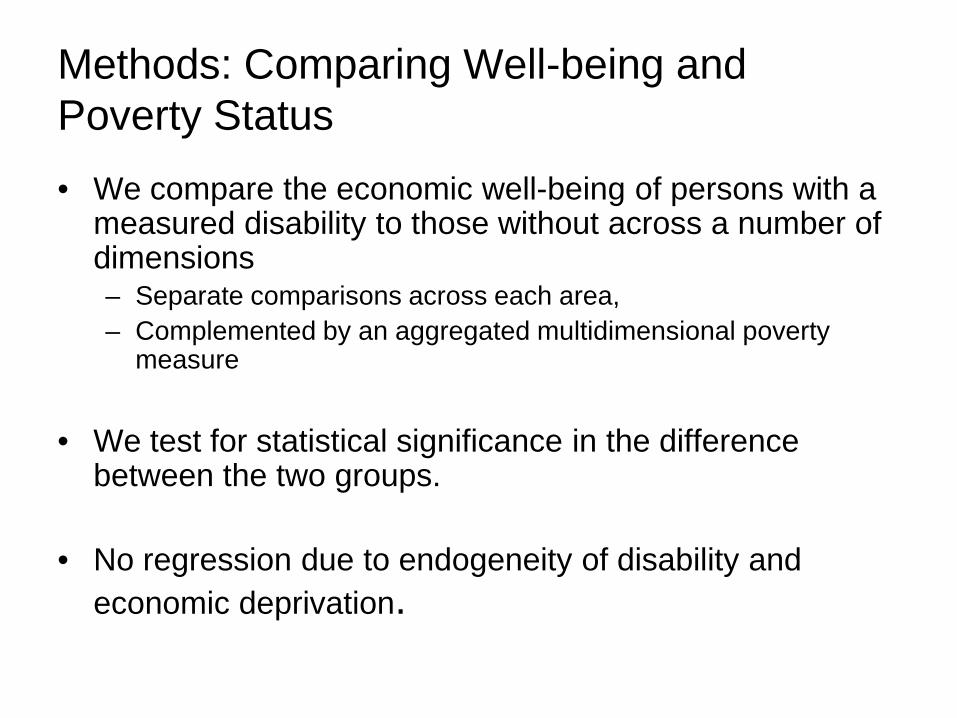
Methods: Comparing Well-being and Poverty Status• We compare the economic well-being of persons with a
measured disability to those without across a number of dimensions – Separate comparisons across each area,– Complemented by an aggregated multidimensional poverty
measure
• We test for statistical significance in the difference between the two groups.
• No regression due to endogeneity of disability and economic deprivation.
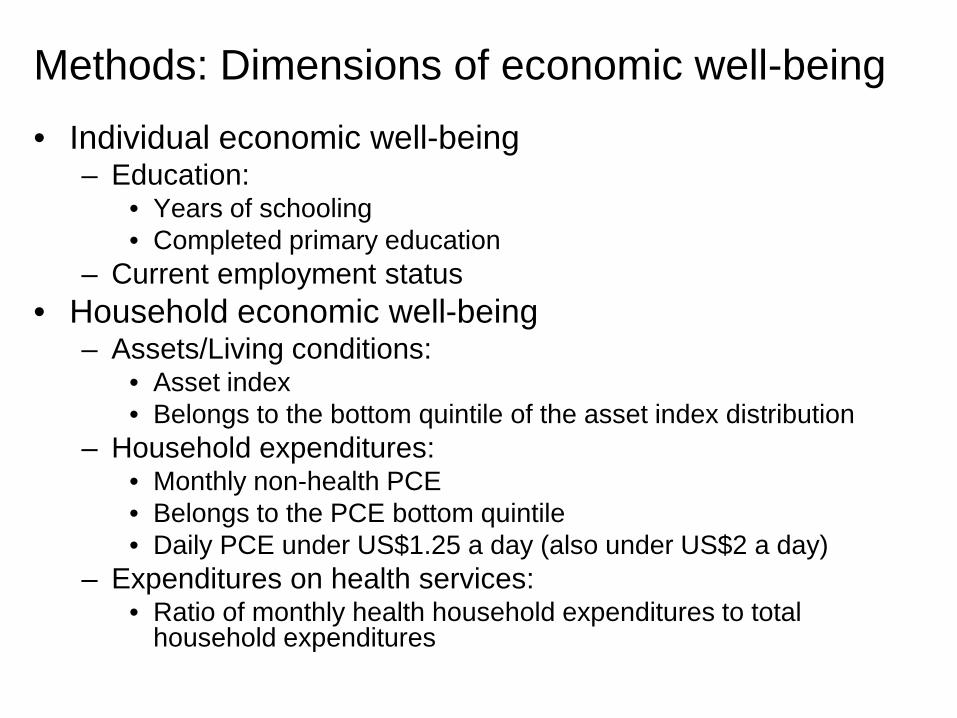
Methods: Dimensions of economic well-being• Individual economic well-being
– Education: • Years of schooling• Completed primary education
– Current employment status• Household economic well-being
– Assets/Living conditions: • Asset index• Belongs to the bottom quintile of the asset index distribution
– Household expenditures:• Monthly non-health PCE• Belongs to the PCE bottom quintile• Daily PCE under US$1.25 a day (also under US$2 a day)
– Expenditures on health services: • Ratio of monthly health household expenditures to total
household expenditures
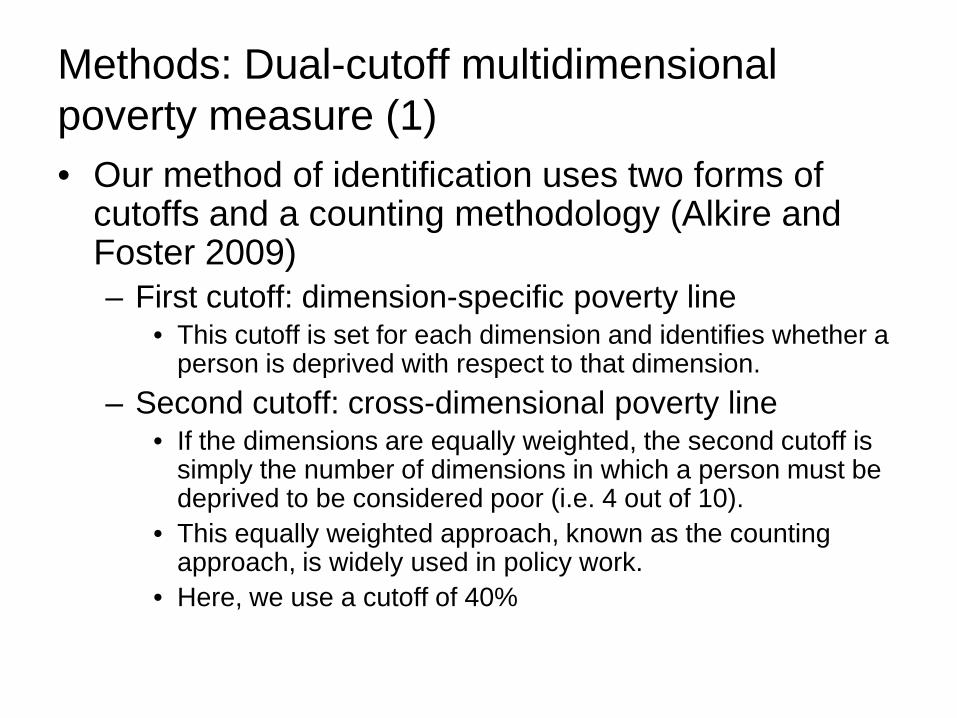
Methods: Dual-cutoff multidimensional poverty measure (1)• Our method of identification uses two forms of
cutoffs and a counting methodology (Alkire and Foster 2009)– First cutoff: dimension-specific poverty line
• This cutoff is set for each dimension and identifies whether a person is deprived with respect to that dimension.
– Second cutoff: cross-dimensional poverty line• If the dimensions are equally weighted, the second cutoff is
simply the number of dimensions in which a person must be deprived to be considered poor (i.e. 4 out of 10).
• This equally weighted approach, known as the counting approach, is widely used in policy work.
• Here, we use a cutoff of 40%
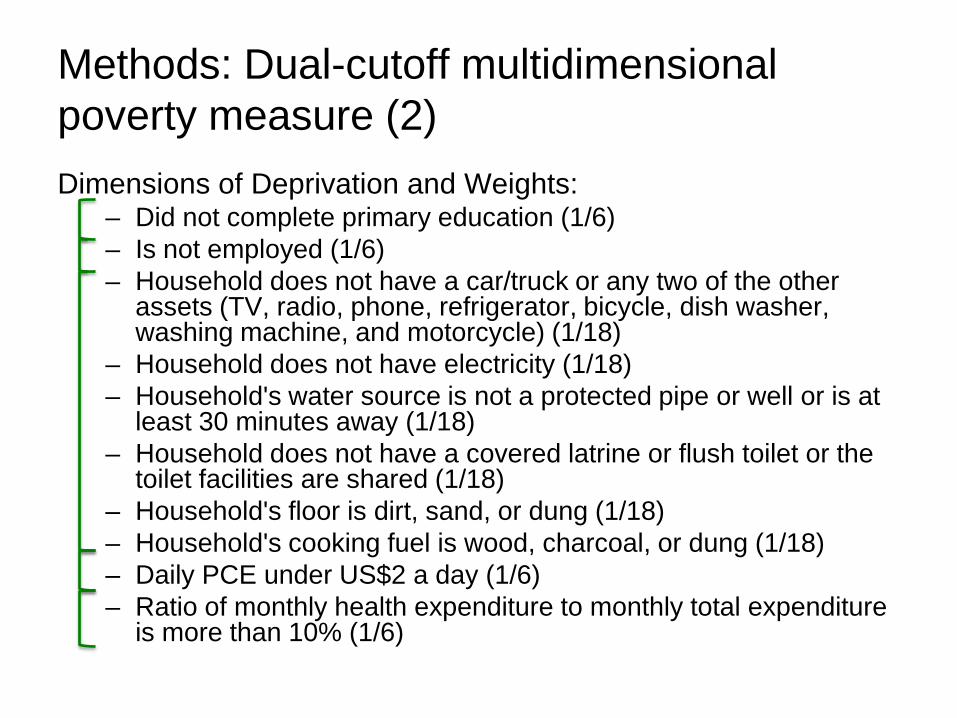
Dimensions of Deprivation and Weights:– Did not complete primary education (1/6)– Is not employed (1/6)– Household does not have a car/truck or any two of the other
assets (TV, radio, phone, refrigerator, bicycle, dish washer, washing machine, and motorcycle) (1/18)
– Household does not have electricity (1/18)– Household's water source is not a protected pipe or well or is at
least 30 minutes away (1/18)– Household does not have a covered latrine or flush toilet or the
toilet facilities are shared (1/18)– Household's floor is dirt, sand, or dung (1/18)– Household's cooking fuel is wood, charcoal, or dung (1/18)– Daily PCE under US$2 a day (1/6)– Ratio of monthly health expenditure to monthly total expenditure
is more than 10% (1/6)
Methods: Dual-cutoff multidimensional poverty measure (2)
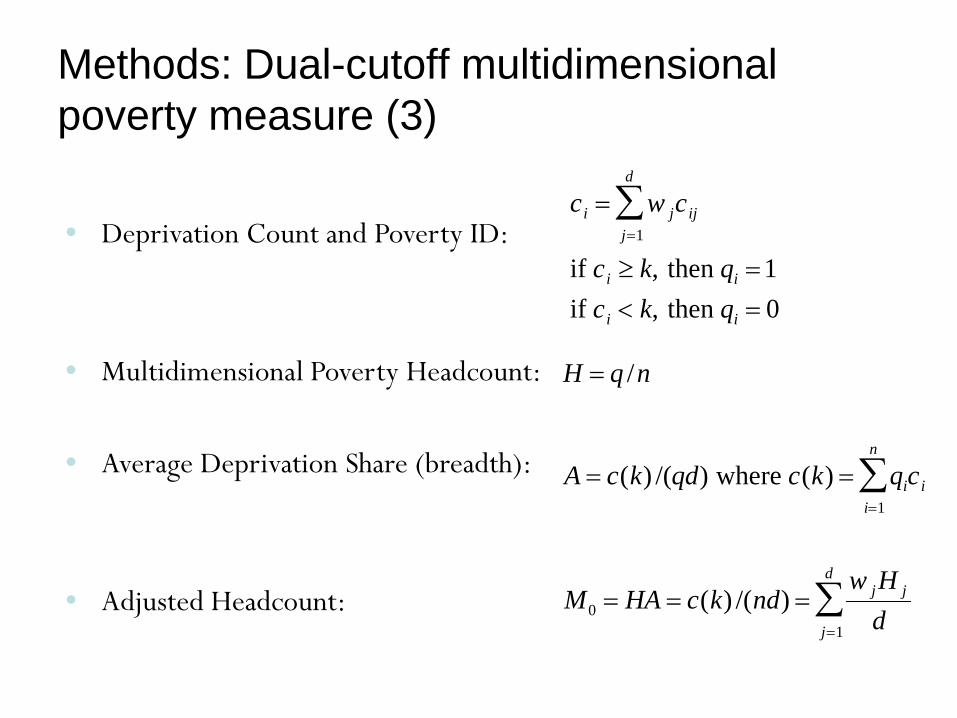
• Deprivation Count and Poverty ID:
• Multidimensional Poverty Headcount:
• Average Deprivation Share (breadth):
• Adjusted Headcount:
ci = w jj=1
d
∑ cij
if ci ≥ k, then qi =1if ci < k, then qi = 0
H = q /n
A = c(k) /(qd) where c(k) = qii=1
n
∑ ci
M0 = HA = c(k) /(nd) =w jH j
dj=1
d
∑
Methods: Dual-cutoff multidimensional poverty measure (3)
Results: Prevalence among working age adults
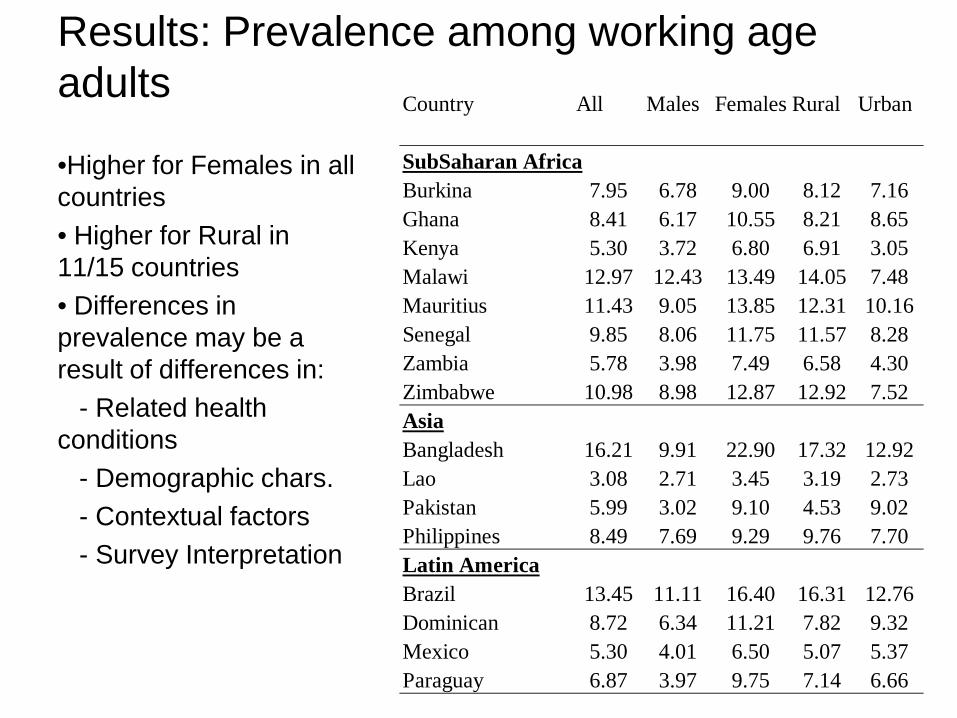
•Higher for Females in all countries• Higher for Rural in 11/15 countries• Differences in prevalence may be a result of differences in:
- Related health conditions
- Demographic chars. - Contextual factors- Survey Interpretation
Country All Males Rural Urban
SubSaharan AfricaBurkina 7.95 6.78 9.00 8.12 7.16Ghana 8.41 6.17 10.55 8.21 8.65Kenya 5.30 3.72 6.80 6.91 3.05Malawi 12.97 12.43 13.49 14.05 7.48Mauritius 11.43 9.05 13.85 12.31 10.16Senegal 9.85 8.06 11.75 11.57 8.28Zambia 5.78 3.98 7.49 6.58 4.30Zimbabwe 10.98 8.98 12.87 12.92 7.52AsiaBangladesh 16.21 9.91 22.90 17.32 12.92Lao 3.08 2.71 3.45 3.19 2.73Pakistan 5.99 3.02 9.10 4.53 9.02Philippines 8.49 7.69 9.29 9.76 7.70Latin AmericaBrazil 13.45 11.11 16.40 16.31 12.76Dominican 8.72 6.34 11.21 7.82 9.32Mexico 5.30 4.01 6.50 5.07 5.37Paraguay 6.87 3.97 9.75 7.14 6.66
Females
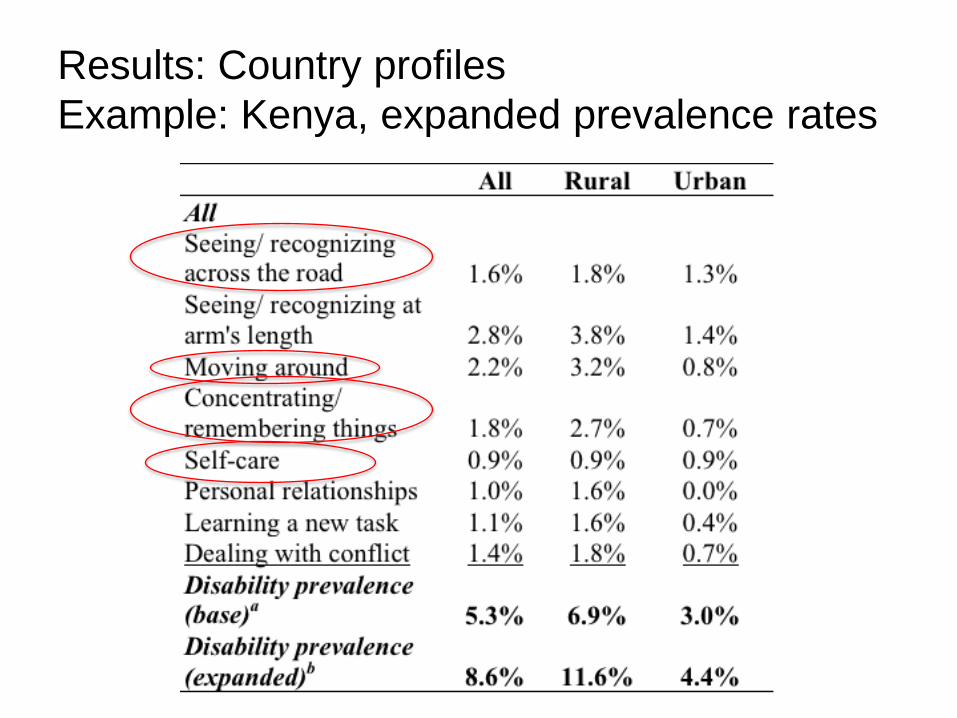
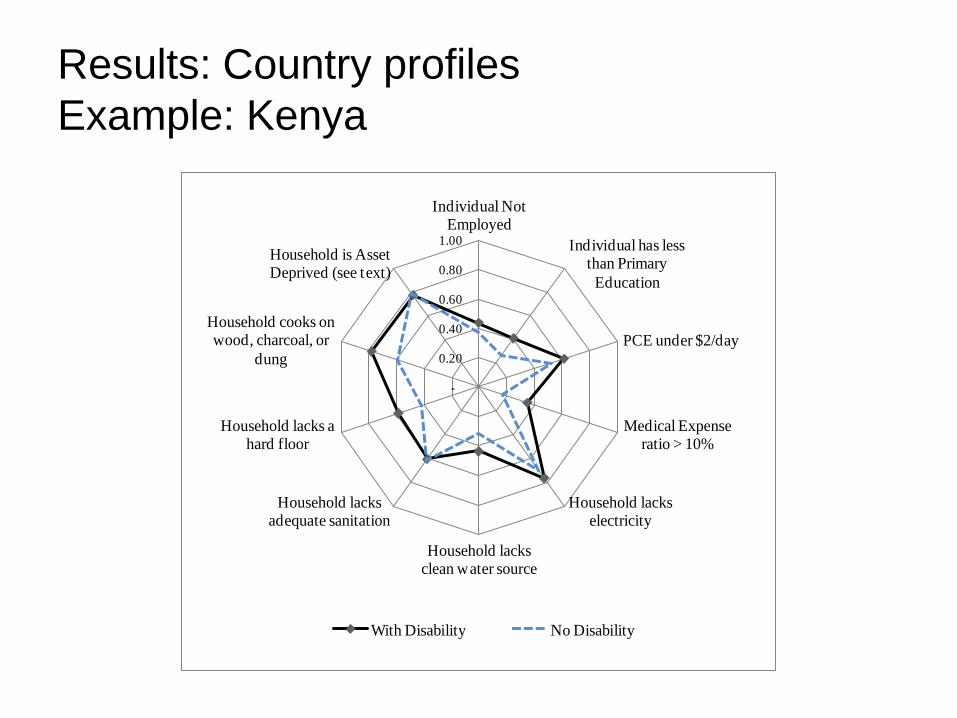
Results: Country profilesExample: Kenya, expanded prevalence rates
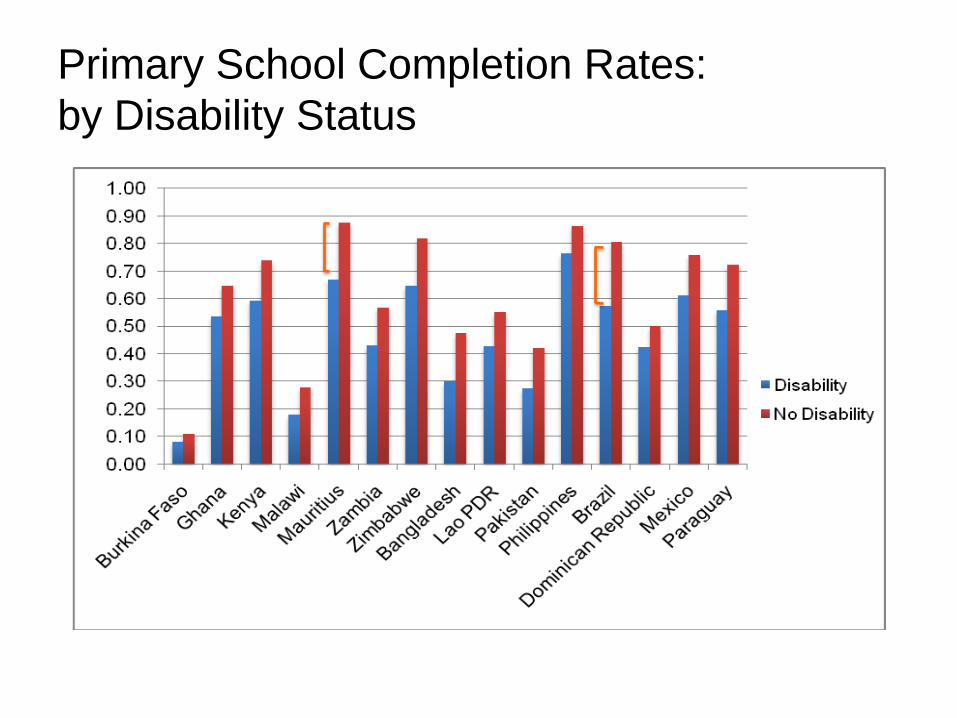
Primary School Completion Rates:by Disability Status
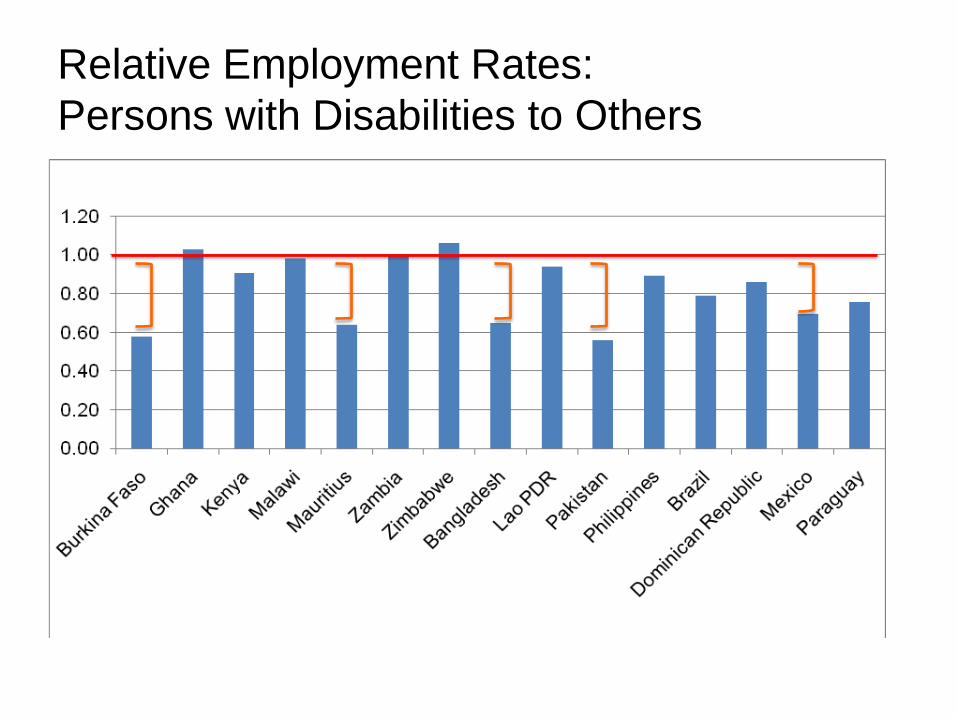
Relative Employment Rates:Persons with Disabilities to Others
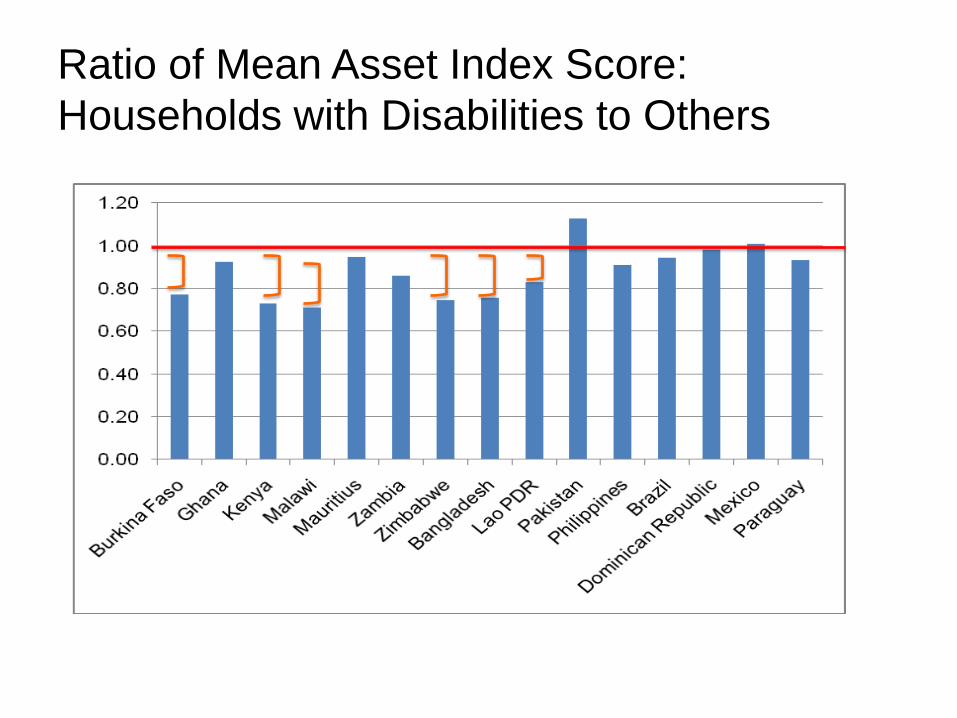
Ratio of Mean Asset Index Score: Households with Disabilities to Others
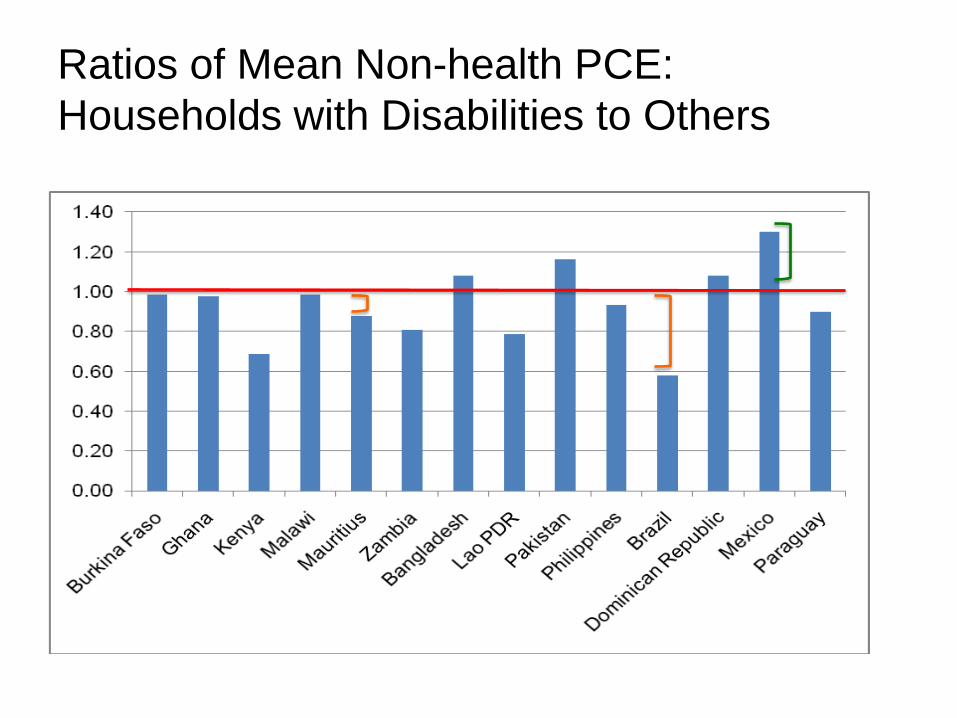
Ratios of Mean Non-health PCE: Households with Disabilities to Others
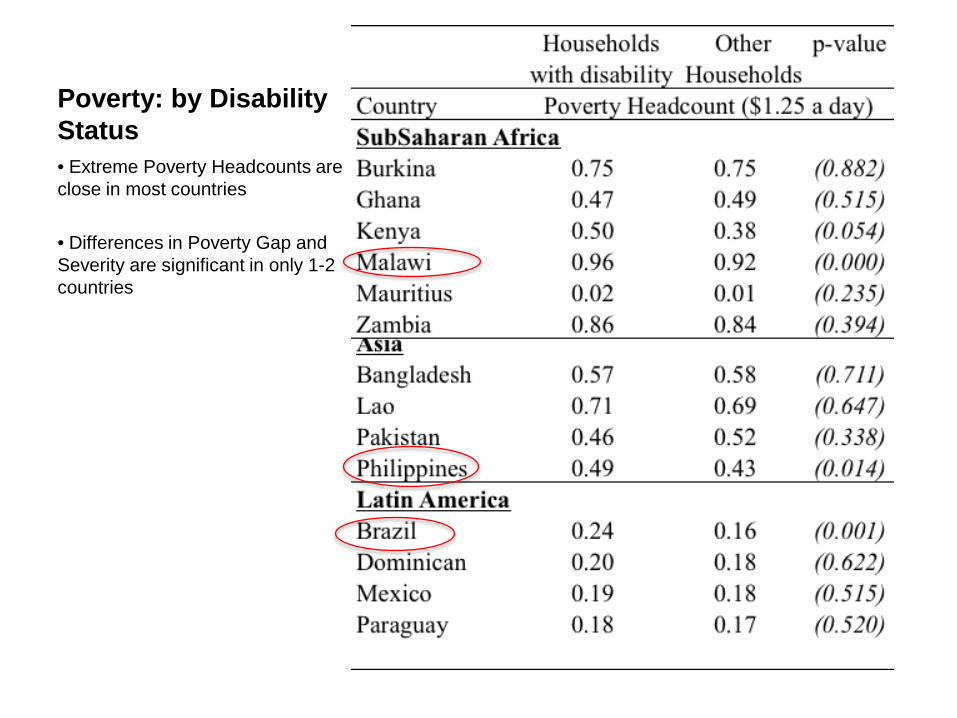
Poverty: by Disability Status• Extreme Poverty Headcounts are close in most countries
• Differences in Poverty Gap and Severity are significant in only 1-2 countries
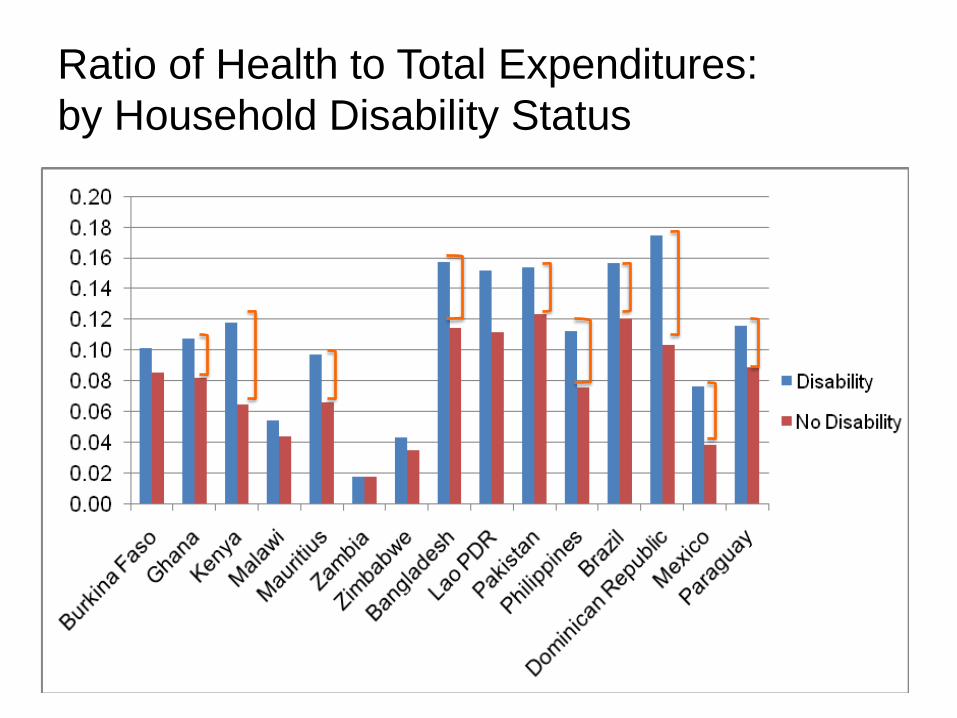
Ratio of Health to Total Expenditures:by Household Disability Status
-
0.20
0.40
0.60
0.80
1.00
Individual Not Employed
Individual has less than Primary Education
PCE under $2/day
Medical Expense ratio > 10%
Household lacks electricity
Household lacks clean water source
Household lacks adequate sanitation
Household lacks a hard floor
Household cooks on wood, charcoal, or
dung
Household is Asset Deprived (see text)
With Disability No Disability
Results: Country profilesExample: Kenya
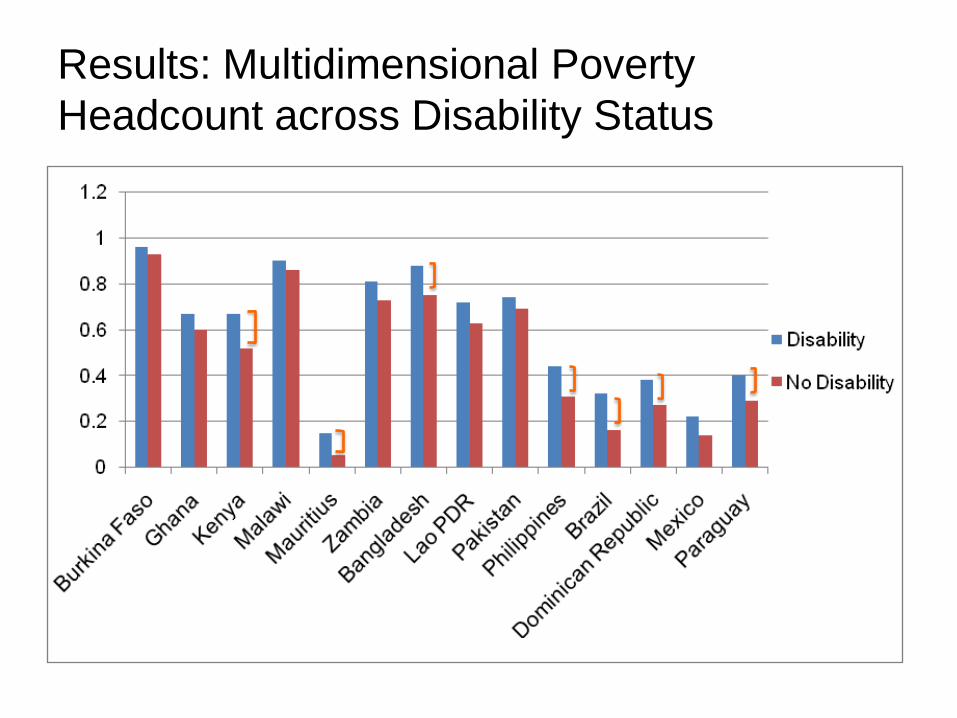
Results: Multidimensional Poverty Headcount across Disability Status
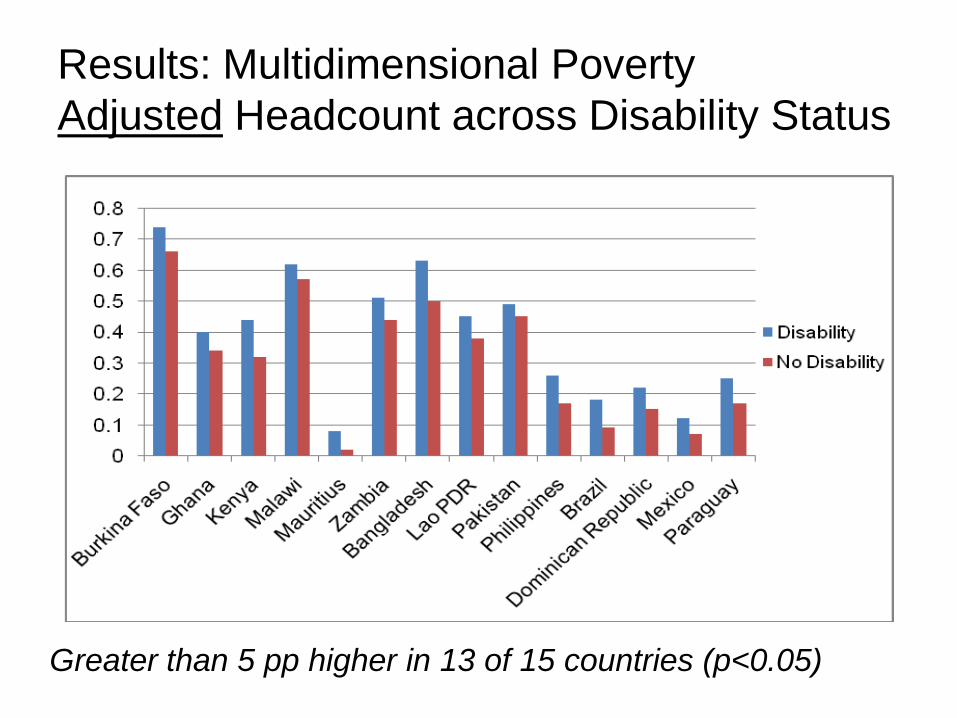
Results: Multidimensional Poverty Adjusted Headcount across Disability Status
Greater than 5 pp higher in 13 of 15 countries (p<0.05)
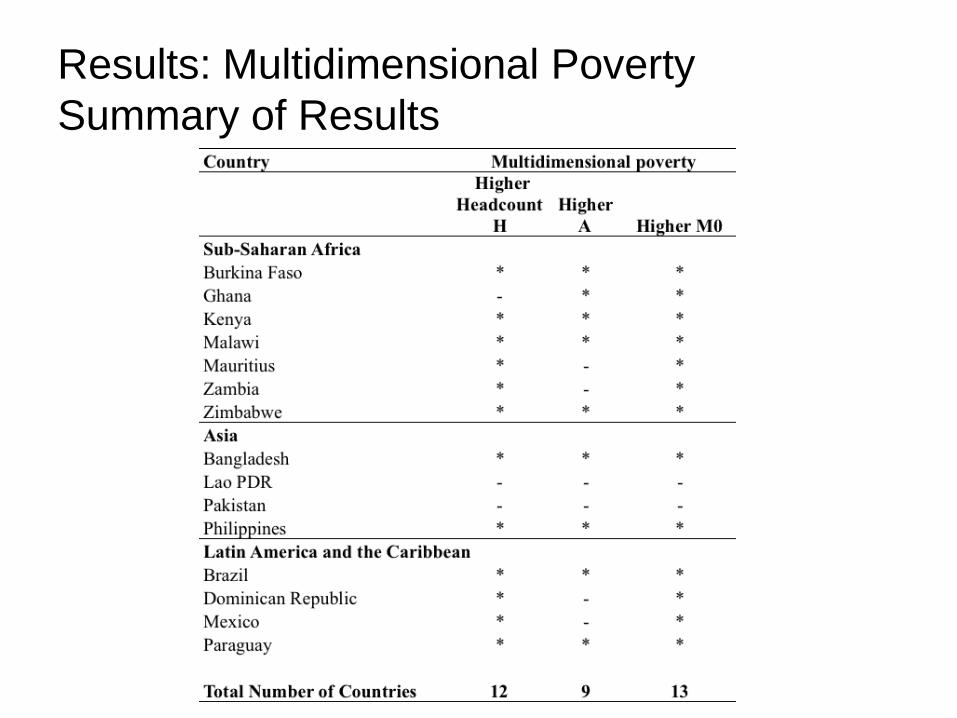
Results: Multidimensional Poverty Summary of Results
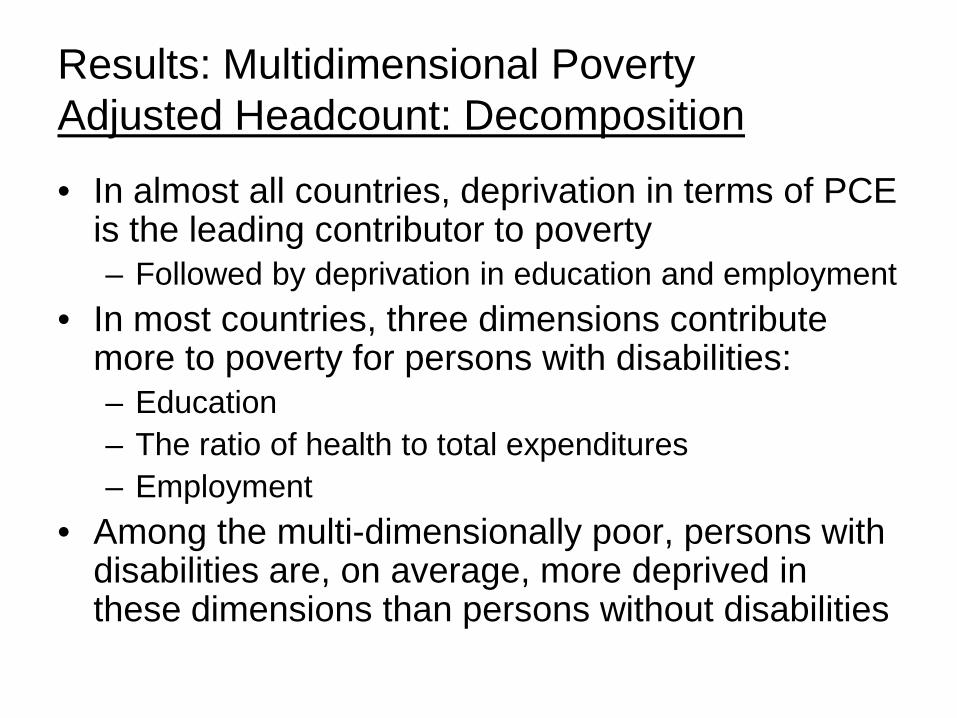
• In almost all countries, deprivation in terms of PCE is the leading contributor to poverty– Followed by deprivation in education and employment
• In most countries, three dimensions contribute more to poverty for persons with disabilities:– Education– The ratio of health to total expenditures– Employment
• Among the multi-dimensionally poor, persons with disabilities are, on average, more deprived in these dimensions than persons without disabilities
Results: Multidimensional Poverty Adjusted Headcount: Decomposition
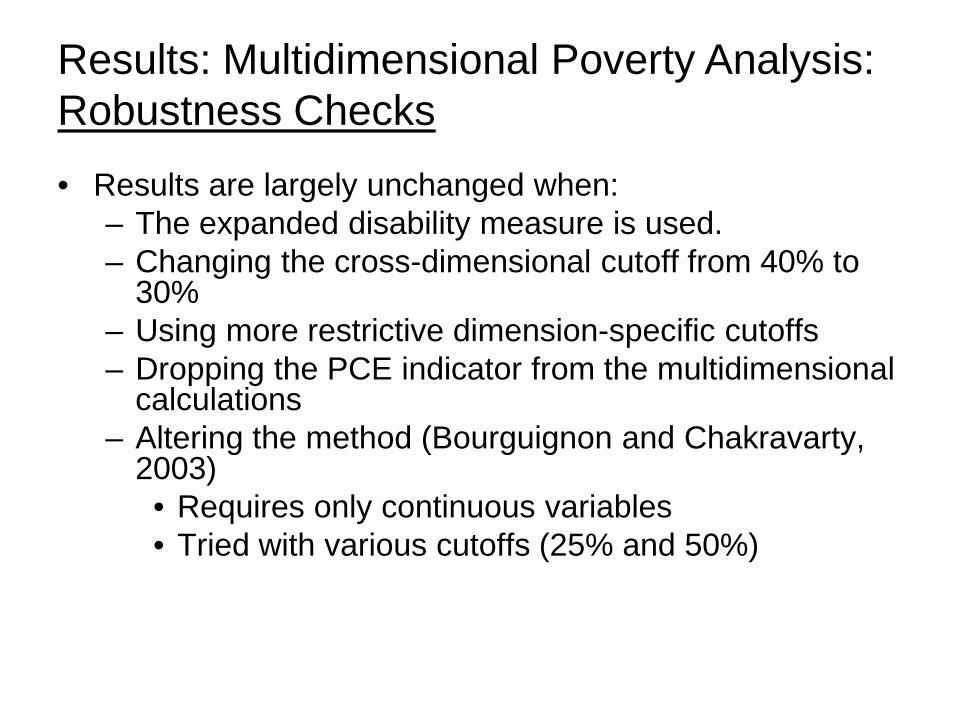
• Results are largely unchanged when:– The expanded disability measure is used.– Changing the cross-dimensional cutoff from 40% to
30%– Using more restrictive dimension-specific cutoffs– Dropping the PCE indicator from the multidimensional
calculations– Altering the method (Bourguignon and Chakravarty,
2003) • Requires only continuous variables• Tried with various cutoffs (25% and 50%)
Results: Multidimensional Poverty Analysis: Robustness Checks
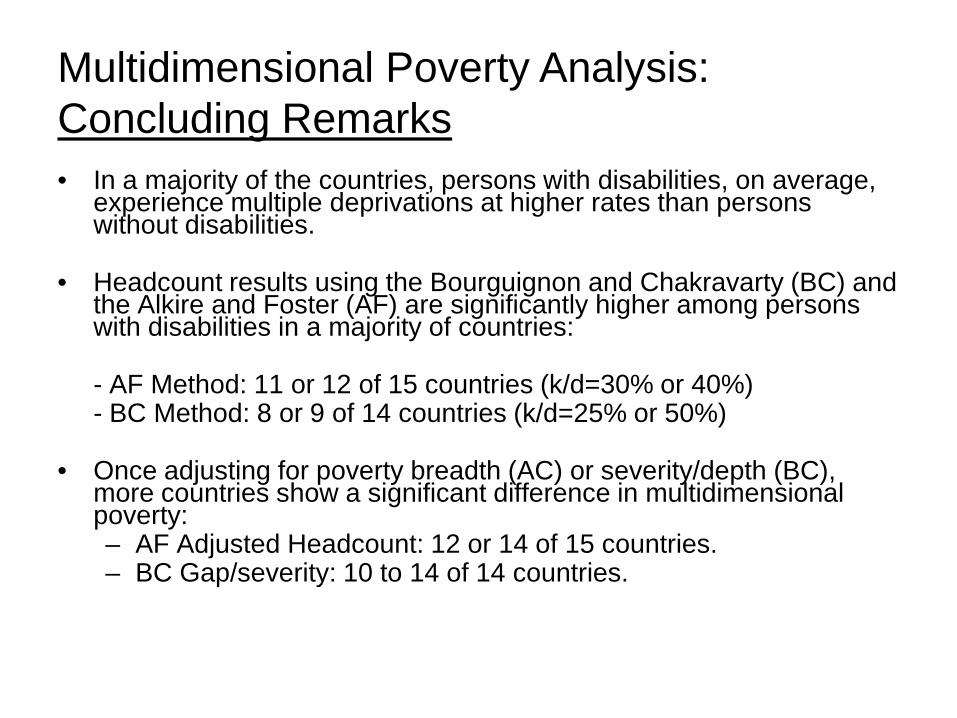
• In a majority of the countries, persons with disabilities, on average, experience multiple deprivations at higher rates than persons without disabilities.
• Headcount results using the Bourguignon and Chakravarty (BC) and the Alkire and Foster (AF) are significantly higher among persons with disabilities in a majority of countries:
- AF Method: 11 or 12 of 15 countries (k/d=30% or 40%)- BC Method: 8 or 9 of 14 countries (k/d=25% or 50%)
• Once adjusting for poverty breadth (AC) or severity/depth (BC), more countries show a significant difference in multidimensional poverty:– AF Adjusted Headcount: 12 or 14 of 15 countries.– BC Gap/severity: 10 to 14 of 14 countries.
Multidimensional Poverty Analysis: Concluding Remarks
1. First, disability prevalence is high (> 5%) in most of the 15 developing countries under study.
2. Looking across all five dimensions of economic well-being explored in this study, persons with disabilities as a group are significantly worse off in two or more dimensions in 14 out of 15 countries.
Conclusion: Main Findings (1)
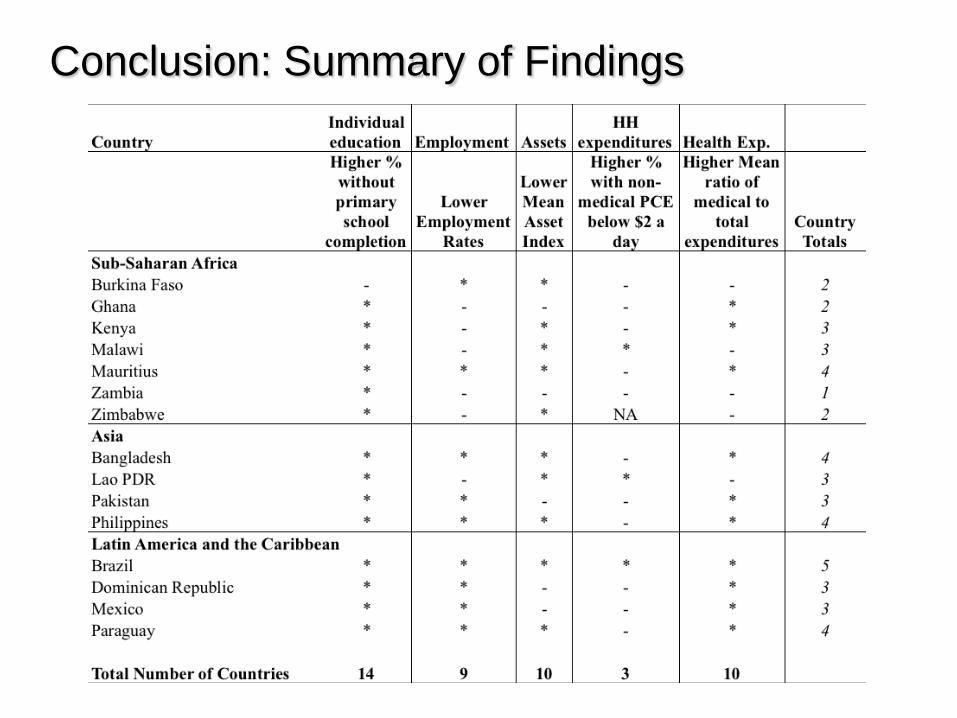
Conclusion: Summary of Findings
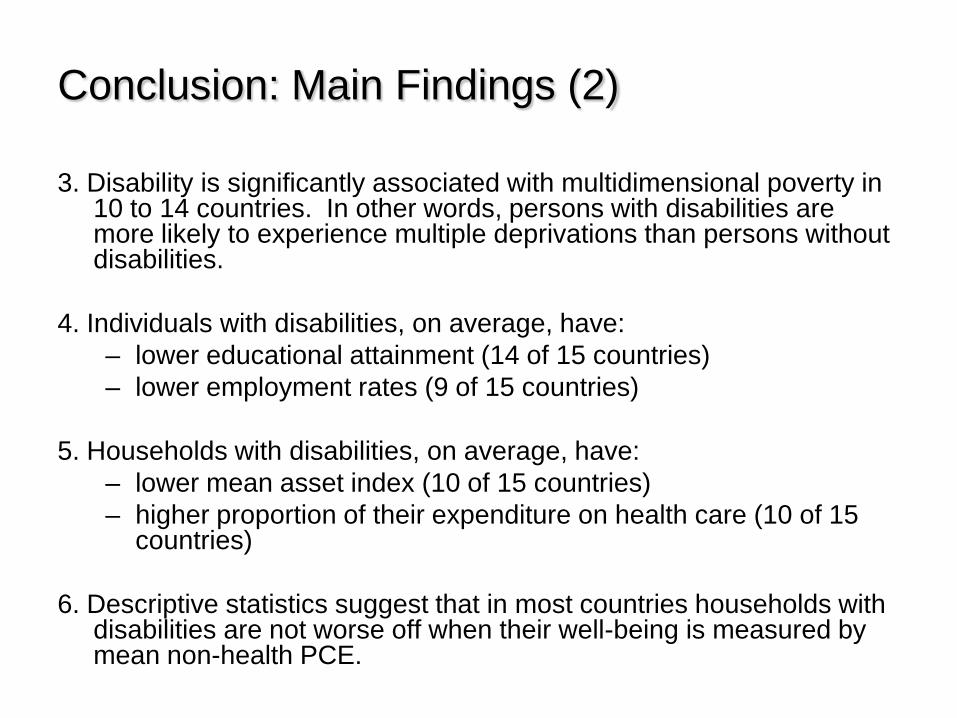
3. Disability is significantly associated with multidimensional poverty in 10 to 14 countries. In other words, persons with disabilities are more likely to experience multiple deprivations than persons without disabilities.
4. Individuals with disabilities, on average, have:– lower educational attainment (14 of 15 countries)– lower employment rates (9 of 15 countries)
5. Households with disabilities, on average, have: – lower mean asset index (10 of 15 countries)– higher proportion of their expenditure on health care (10 of 15
countries)
6. Descriptive statistics suggest that in most countries households with disabilities are not worse off when their well-being is measured by mean non-health PCE.
Conclusion: Main Findings (2)
• Persons with disabilities should be explicitly incorporated in poverty profiles, and more broadly in policymaking and research agendas related to poverty in developing countries.
• Policies and programs to improve the socioeconomic status of people with disabilities and their families need to be adapted to country specific contexts.
• Policies that promote access to education, health care and employment may be particularly important for the well-being of persons and households with disabilities.
Policy Implications
• Need for research to identify the causal links between disability and poverty, in particular on how disability may lead to poverty and in what developing country contexts.
• Need to assess the effects of economic empowerment and safety net programs (mainstream and targeted programs) on the economic status of persons with disabilities in different contexts.
Suggested Further Research