Embed Size (px)
Citation preview

Disclaimer
2
The information presented here is for educational and informational purposes only.
The inclusion of any specific securities detailed is for illustrative purposes only. No information contained in this presentation is intended to constitute a recommendation by
Recognia to buy, sell, or hold any stock, option, or securities.

3
Agenda
• Who is Recognia
• Event Driven Technical Analysis
• Types of Technical Events • Short-term patterns • Indicators and oscillators • Classic patterns
• Finding and Validating Ideas using Recognia
• Q & A

Corporate Overview
4 Recognia Envisioning Workshop
• Part of the Trading Central Group since 2015.
• Leaders in technical, fundamental and quantitative research worldwide.
• Major offices in London, Paris, New York, Hong Kong and Ottawa.
• Global coverage of stocks, ETFs, indices, options, FX and futures.
• Team of analysts based in Hong Kong, Paris and Ottawa.
• Automated analysis of 85,000 financial instruments daily.
• Services provisioned to 20M active traders and investors worldwide.

5
Basics of Technical Analysis
• Looking for patterns and relationships in price and volume history that identify attitudes of buyers and sellers
• Shifts in the balance of supply and demand
• To assist in making investment and trading decisions
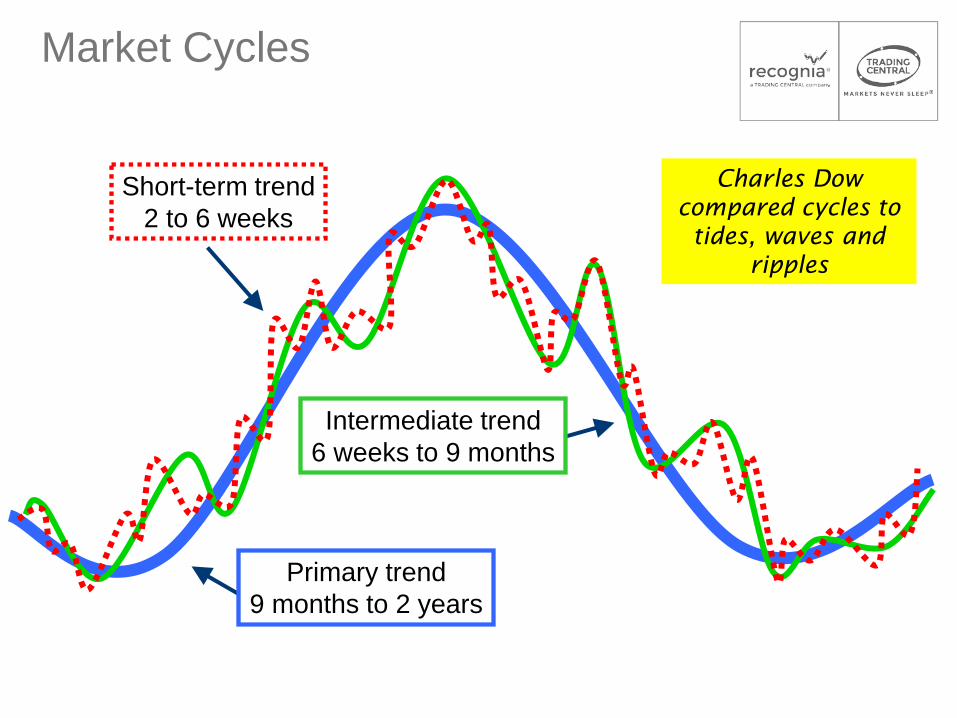
Market Cycles
Charles Dow compared cycles to
tides, waves and ripples
Intermediate trend 6 weeks to 9 months
Primary trend 9 months to 2 years
Short-term trend 2 to 6 weeks

7
“The market price reflects…the hopes and fears and guesses and moods, rational and irrational, of hundreds of potential buyers and sellers… Price is the only figure that counts.”
Why Study Price?

8
Prices move in trends until … Something changes to affect supply and demand
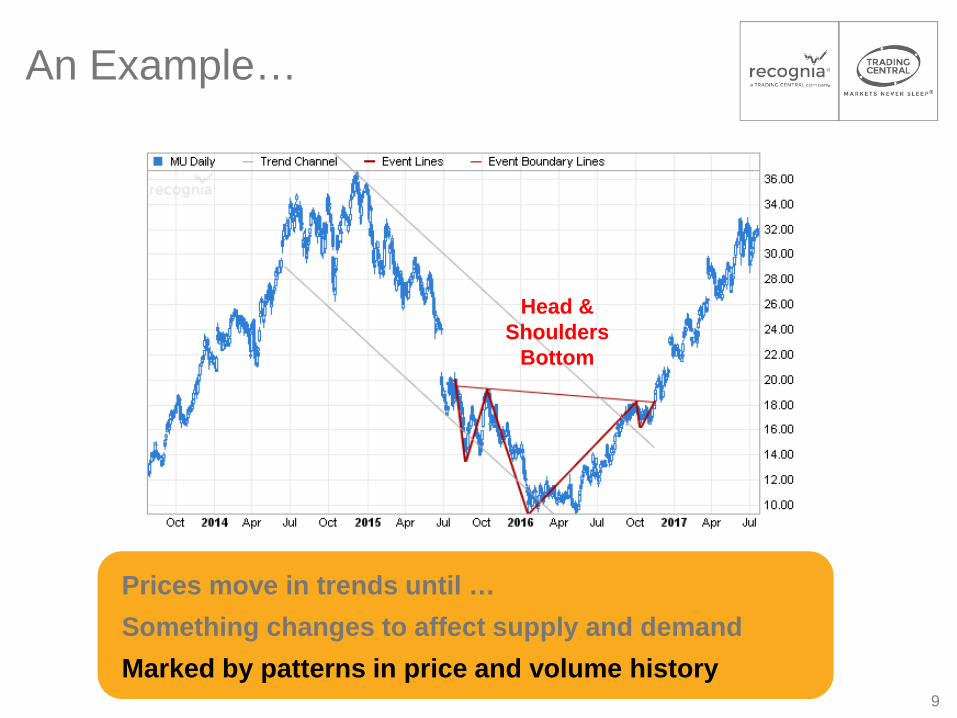
An Example…
9
Prices move in trends until … Something changes to affect supply and demand Marked by patterns in price and volume history
Head & Shoulders
Bottom
An Example…

10
Traditional Approach

11
12
13

14
15
16
My Watchlist
• AAPL • TSLA • NFLX • AMZN • GOOG • FB • BAC • C • GM • GPRO • SNAP
• WFC • CSCO • INTC • MSFT • F • LLL • V • MDLZ • TOL • UNP • NSC
• GLD • SPY • QQQ • IWM • VWO • XLF • MDY • XLV • XLK • SDY • XLY
And more…

17
An Event Driven Approach

18
Recognia Technical Events
Classic Chart Patterns • Head and shoulders tops and bottoms
• Symmetrical continuation triangles
• Double tops and bottoms • Ascending continuation triangles • Descending continuation triangles • Bottom triangles / wedges • Top triangles / wedges • Continuation diamonds • Continuation wedges • Diamond tops and bottoms • Megaphone tops and bottoms • Triple tops and bottoms • Upside/downside breakouts • And more…
Indicators and Oscillators • Price Crosses Moving Average
• Double moving average crossovers
• Triple moving average crossovers
• MACD (Moving average convergence divergence)
• Momentum • Relative strength indicator (RSI)
• Short-term KST • Intermediate-term KST • Long-term KST • And more…
Short-term Patterns • Hammers • Shooting stars • Gap ups and downs • Bullish engulfing line • Bearish engulfing lines • Gravestones • Hanging man • Inverted hammers • Island bottoms • Island tops • Shooting stars • And more…
Recognia automatically detects 60+ different Technical Events

19
Technical Event Types
• Short-term Patterns • Based on the shape and relationship of candlesticks or
price bars
• Indicators & Oscillators
• Classic Patterns
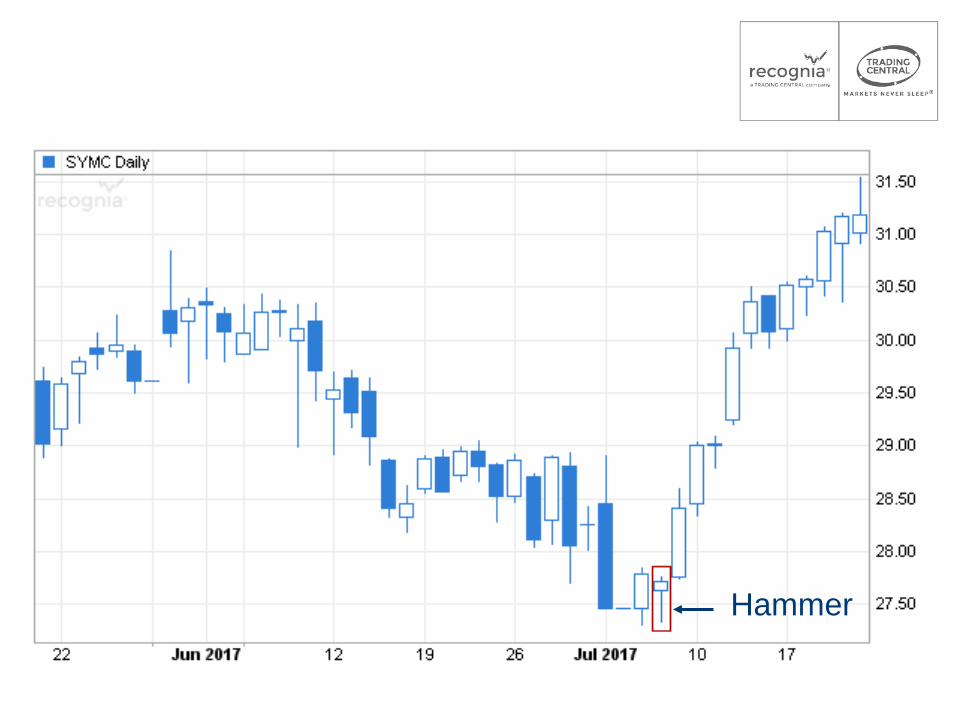
Hammer

Hammer
Hammer identified
Small real body and very long lower shadow
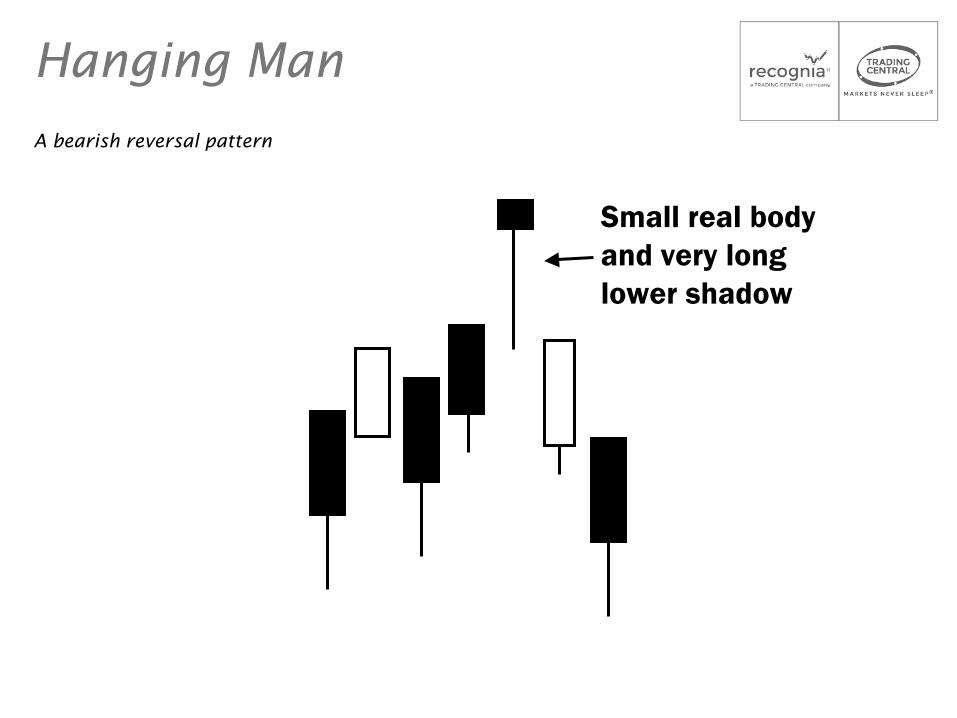
Hanging Man
A bearish reversal pattern

Hanging Man
Want a lower shadow at least twice the size of the real body

Hanging Man
Two hanging men; which is the more significant?
A B

Bearish Engulfing Pattern
Black candle’s real body completely “engulfs” the white one

Bullish Engulfing Pattern
Bullish Engulfing Pattern
White candle’s real body completely “engulfs” the black one
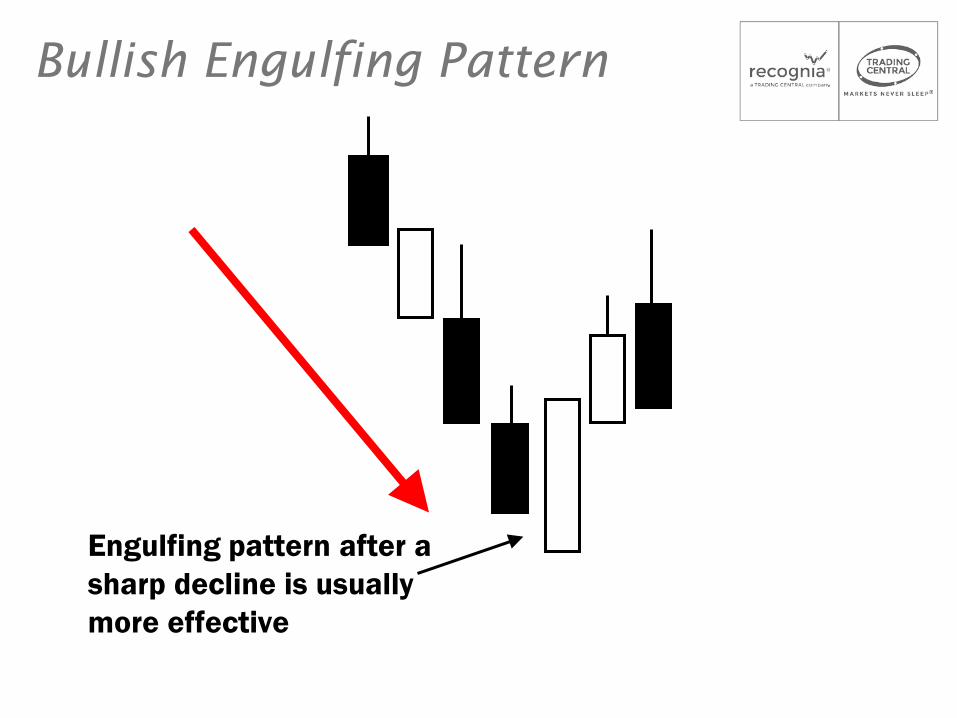
Bullish Engulfing Pattern
Engulfing pattern after a sharp decline is usually more effective

Bearish Engulfing Pattern
Engulfing pattern after a sharp rally is usually more effective

Engulfing Patterns
Stronger because it engulfs the real body and wicks

30
Technical Event Classes
• Short-term Patterns • Based on the shape and relationship of candlesticks or
price bars
• Indicators & Oscillators • Based on moving averages and various mathematical
functions
• Classic Patterns • Distinct price swings forming shape on chart
31
Various Types
• Trend following • Smooths price so trends can be seen as lines
• Momentum • Measures the speed or direction of price changes
• Stochastics • Measures the position of the close price relative to the
recent highs and lows

32
Moving Averages
• Simple Moving Average is defined to be the average price over last N days
• Also Exponential MA, Weighted MA, Adaptive MA, etc.
• Work best in trending markets
• Time frames are relative • 200 day moving average used in silver because Kodak
used it to monitor inventory levels • 4 month moving average used for soybeans because
that is the shelf life of margarine

33
200 day SMA
50 day SMA

34
200 day SMA
50 day SMA

35
Technical Event Classes
• Short-term Patterns • Based on the shape and relationship of candlesticks or
price bars
• Indicators & Oscillators
• Classic Patterns • Distinct price swings forming shape on chart
36
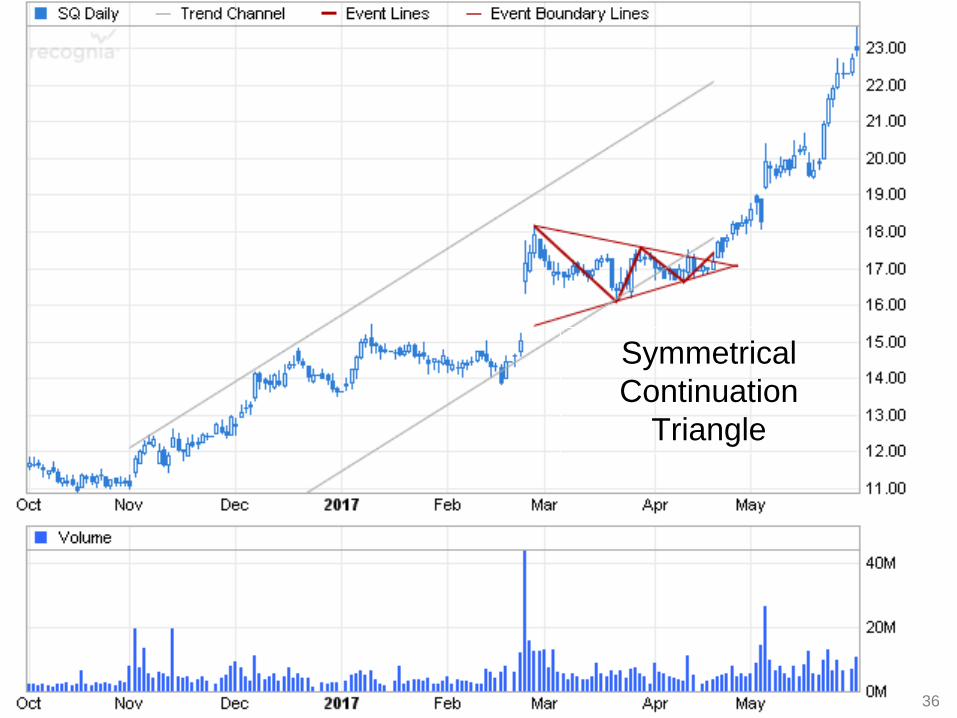
Symmetrical Continuation
Triangle
37
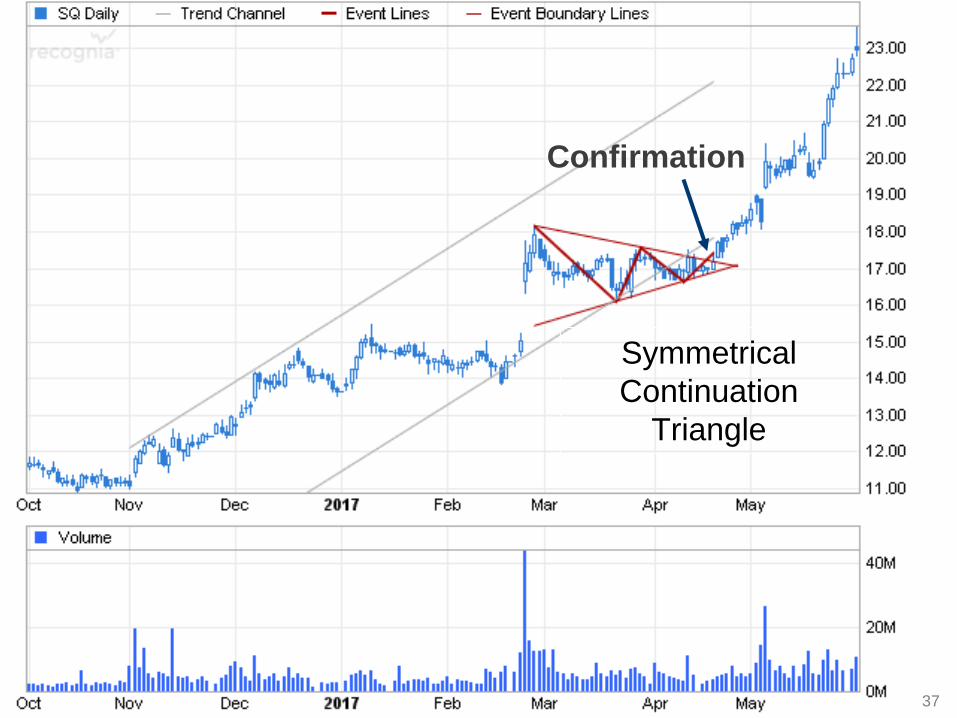
Symmetrical Continuation
Triangle
Confirmation

38
Pattern Height =
Expected Move

39
Pattern Duration =
Trading Horizon

40
Triple Bottoms / Tops
• The Triple Bottom starts with prices moving downward followed by three sharp lows
• Volume decreases with each successive low and finally bursts as the price rises above the highest high confirming a bullish price reversal
• Bearish counterpart is the Triple Top

41
Double Bottoms / Tops
• The Double Bottom pattern marks the reversal of a prior downtrend
• The price form two distinct lows are roughly the same level
• Price finally breaks upward above the highest high to confirm the bullish signal
• Bearish counterpart is the Double Top
42
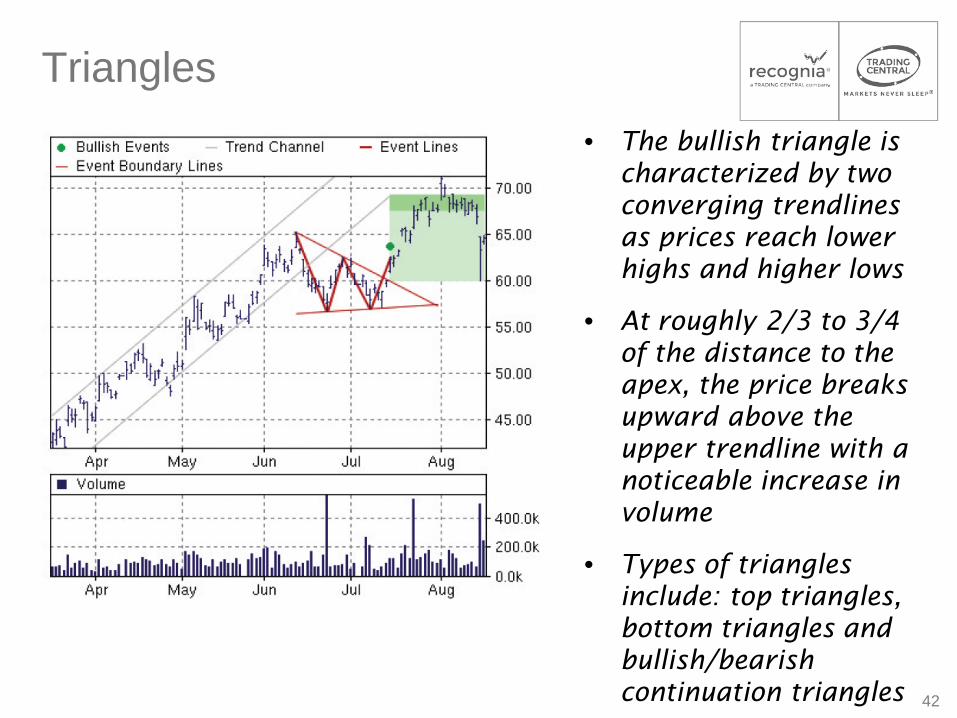
Triangles • The bullish triangle is
characterized by two converging trendlines as prices reach lower highs and higher lows
• At roughly 2/3 to 3/4 of the distance to the apex, the price breaks upward above the upper trendline with a noticeable increase in volume
• Types of triangles include: top triangles, bottom triangles and bullish/bearish continuation triangles

43
Upside / Downside Breakouts
• The Upside Breakout pattern occurs when the price breaks upward through the top of a trading range marked by horizontal trendlines
• This bullish pattern indicates a change in sentiment amongst traders
• Bearish counterpart is the Downside Breakout

44
Megaphone Bottom / Top
• The rare Megaphone Bottom (a.k.a. Broadening Pattern) is characterized by its successively higher highs and lower lows which form after a downward move
• The bullish pattern is confirmed when the price breaks upward above the highest high and fails to fall below this level again
• The bearish counterpart is the Megaphone Top

45
Diamonds • A bullish Diamond pattern is
characterized by prices forming higher high and lower lows in a broadening pattern. The trading range then narrows with lower highs and higher lows forming
• The price breaks upward above the upper trendline signaling the formation of a new trend
• Volume may remain high during the formation of a Diamond pattern
• Types of Diamonds include: Diamond Bottom, Diamond Top, Bullish/Bearish Continuation Diamond
46
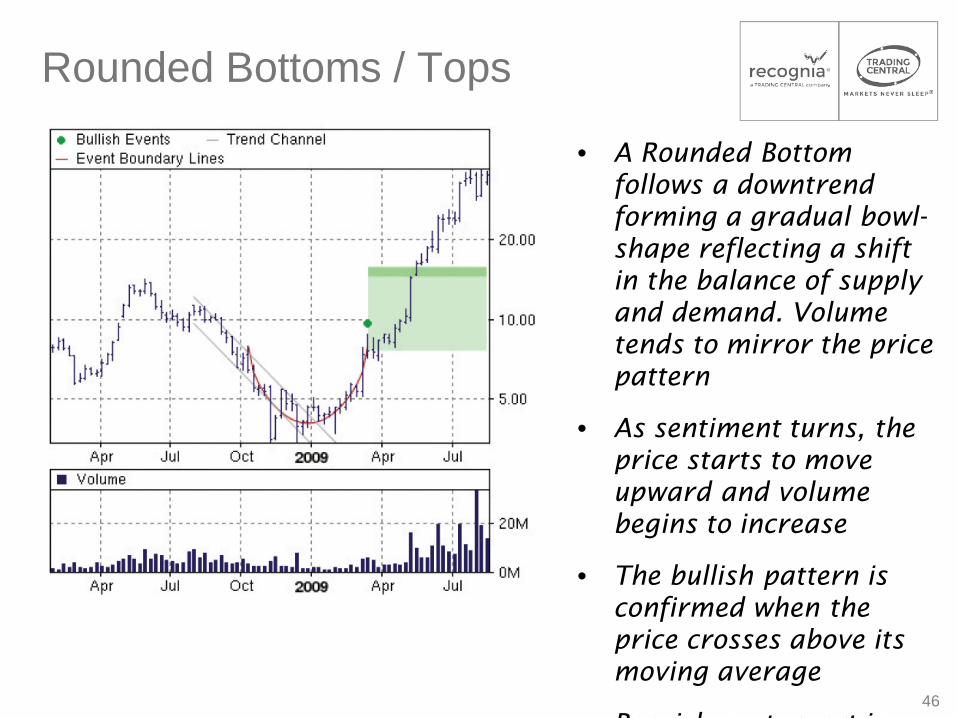
Rounded Bottoms / Tops
• A Rounded Bottom follows a downtrend forming a gradual bowl-shape reflecting a shift in the balance of supply and demand. Volume tends to mirror the price pattern
• As sentiment turns, the price starts to move upward and volume begins to increase
• The bullish pattern is confirmed when the price crosses above its moving average
Bearish conterpart is

Recognia ETF Newsletter

Recognia ETF Newsletter

To Subscribe…

To Subscribe…
https://site.recognia.com/ib_news/serve.shtml?page=add
https://goo.gl/hzMYxJ

51
Q & A