Embed Size (px)
Citation preview

저 시-비 리- 경 지 2.0 한민
는 아래 조건 르는 경 에 한하여 게
l 저 물 복제, 포, 전송, 전시, 공연 송할 수 습니다.
다 과 같 조건 라야 합니다:
l 하는, 저 물 나 포 경 , 저 물에 적 된 허락조건 명확하게 나타내어야 합니다.
l 저 터 허가를 면 러한 조건들 적 되지 않습니다.
저 에 른 리는 내 에 하여 향 지 않습니다.
것 허락규약(Legal Code) 해하 쉽게 약한 것 니다.
Disclaimer
저 시. 하는 원저 를 시하여야 합니다.
비 리. 하는 저 물 리 목적 할 수 없습니다.
경 지. 하는 저 물 개 , 형 또는 가공할 수 없습니다.
Master’s Thesis of Science in Agriculture
Effects of TMR and Separate Feeding
System on Ruminal Methane Production,
Total Digestibility, Rumen Metabolic
and Microbial Profile
February 2017
Graduate School of International Agricultural
Technology
Seoul National University
Rajaraman Bharanidharan
i
Abstract
Limited researches are available on effect of feeding total mixed ration (TMR)
and roughage and concentrate separately (SF) on ruminant methane production.
Two experiments were performed to study the difference in methane production
and ruminal characteristics between feeding methods at two different feed
intake levels. Each experiment was conducted using six male Holsteins with
BW ranging from 230–570 kg. Feed intakes for experimental animals were
adjusted to achieve average daily gains of 1.4 (experiment 1) and 0.7 kg
(experiment 2), and methane production was investigated by using a triplicated
2 × 2 Latin square design. Animals were provided either SF or TMR containing
73% concentrate and 27% forage, with the same ratio of same ingredients and
grasses, twice a day. No significant differences in methane emissions were
observed in animals fed diets at 2.4% of BW in experiment 1. Animals fed
TMR at 2% BW in experiment 2 emitted significantly more methane (138.5 vs.
118.2 L/d; P < 0.05) and lost more methane energy (3.98 vs. 3.49 %; P = 0.005)
compared to those fed SF. In experiment 2, ruminal fermentation characteristics
were largely affected by the feeding method. Cattle those received SF exhibited
significantly lower total VFA and NH3-N concentration, and propionate
percentage at 1.5h whereas higher after 4.5hr compared to those fed TMR. A
significantly (P < 0.05) lower acetate: propionate ratio at 4.5 h in those fed SF
depicts the H2 sink towards propionate synthesis when compared to TMR.
Significantly higher levels of isobutyrate and isovalerate (P < 0.05) were
observed in those fed SF compared to those fed TMR might increase microbial
protein synthesis and net consumption of H2. The ruminal pH and total tract
digestibility of CP, NDF, and OM were not affected by two different feeding
ii
systems. Overall, these results indicate that, compared to TMR, SF significantly
reduces methane emission from ruminants and increases VFA production
without affecting the total tract digestion.
Keywords: methane, rumen, separate feeding, TMR
Student Number: 2015-22097
iii
Table of contents
Abstract -------------------------------------------------------------------- i
List of tables and figures ------------------------------------------------ v
List of abbreviations and formula ---------------------------------- vii
1. Introduction
1.1 Study background -------------------------------------------------------------- 1
1.2 Aims of research --------------------------------------------------------------- 2
2. Literature review
2.1. Impact of ruminal methane on environment and animal productivity - 3
2.2. Dietary strategies to mitigate ruminal methane emission ---------------- 5
2.2.1. Feeding level, passage rate and digestibility ------------------------ 5
2.2.2. Inclusion of concentrate ------------------------------------------------ 6
2.2.3. Particle size distribution ------------------------------------------------ 6
2.2.4. TMR vs separate feeding of concentrate and forage ---------------- 8
2.3. Understanding rumen microbiology---------------------------------------- 10
3. Materials and Methods
3.1. Animal and experimental design -------------------------------------------- 15
3.2. Experimental diet and feeding ---------------------------------------------- 15
3.3. Methane emission measurement -------------------------------------------- 18
3.4. Digestion trial and rumen sampling ---------------------------------------- 19
3.5. Feed particle size measurement --------------------------------------------- 19
3.6. Chemical analyses ------------------------------------------------------------ 20
iv
3.7. Genomic DNA extraction and Quantification ---------------------------- 21
3.8. PCR amplification and library construction ------------------------------- 21
3.9. Microbial community diversity analysis ----------------------------------- 27
3.10. Statistical analysis ----------------------------------------------------------- 27
4. Results and discussions
4.1. Effect of Feeding system on methane emission -------------------------- 28
4.2. Effect of Feeding level on methane emission ----------------------------- 31
4.3. Effect of Particle size of roughage on methane emission --------------- 32
4.4. Effect of feeding system on ruminal pH, VFA and NH3 ---------------- 35
4.5. Effect of feeding system on rumen microbial diversity ----------------- 41
5. Conclusion ------------------------------------------------------------ 59
6. Bibliography --------------------------------------------------------- 61
7. Abstract in Korean -------------------------------------------------- 90
v
List of Tables and Figures
Table 1. Ingredients and chemical composition of basal diet -------------------- 17
Table 2. Average body weight and nutrient intake of animals ------------------- 17
Table 3. Barcode sequence used in bacterial V4 primer for multiplexing ----- 23
Table 4. Barcode sequence used in archaeal V6-V8 region ---------------------- 24
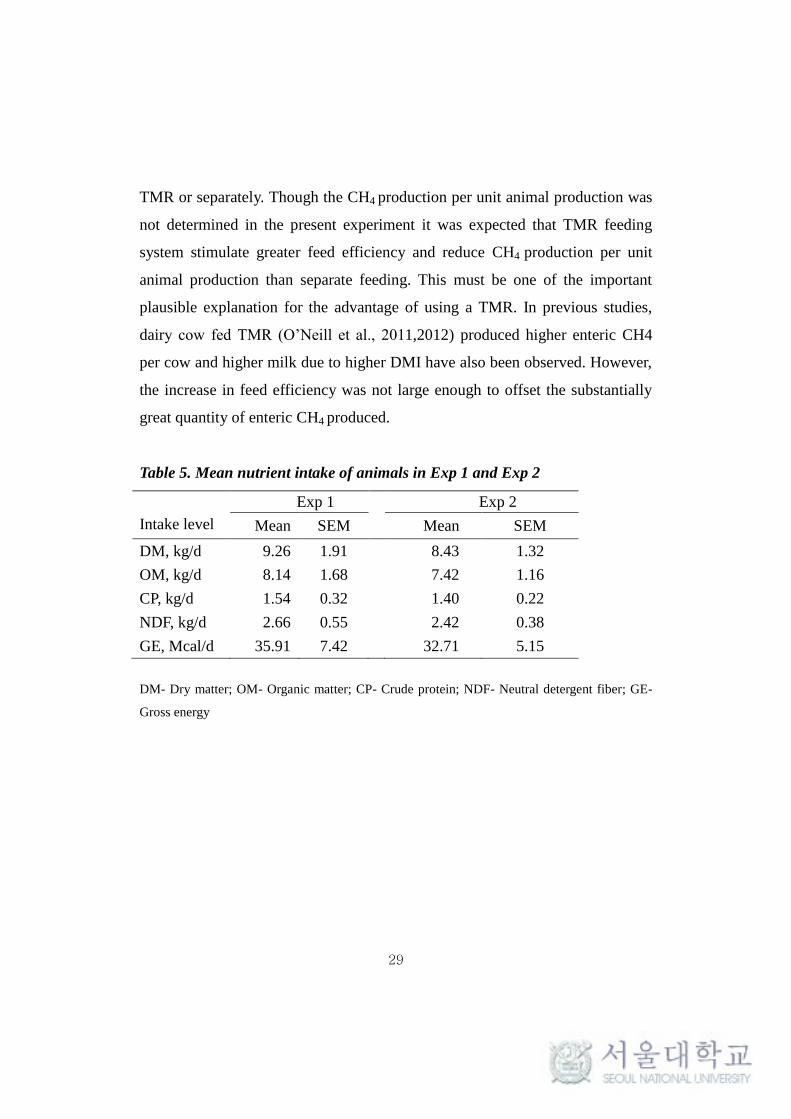
Table 5. Mean nutrient intake of animals in Exp 1 and Exp 2 ------------------- 28
Table 6. Methane production of feeding systems at different feeding level --- 30
Table 7. Feed particle size distribution between the feeding system ----------- 34
Table 8. Apparent digestibility of nutrients between the feeding systems ----- 34
Table 9. Effect of feeding system on ruminal fermentation characteristics ---- 40
Table 10. Total number of reads generated between feeding system ----------- 42
Table 11. Relative abundance of taxa in the two groups representing
> 0.1% of total sequences ------------------------------------------------- 54
Table 12. Relative abundance of taxa in the two groups representing
> 0.1% of total sequences that differ significantly (P < 0.1) -------- 58
vi
Fig 1. Relationship between total greenhouse gas emissions and output
per cow ---------------------------------------------------------------------------- 4
Fig 2. PCR amplification of bacterial V4 region of 16s rRNA ------------------ 25
Fig 3. PCR amplification of archaeal V6-V8 region of 16s rRNA ------------- 26
Fig 4. Diurnal variation of methane production between feeding systems
after evening feeding ----------------------------------------------------------- 30
Fig 5. Effect of DMI on methane production -------------------------------------- 32
Fig 6. Effect of TMR and SF on ruminal pH --------------------------------------- 35
Fig 7. Effect of feeding system on AP ratio ---------------------------------------- 37
Fig 8. Effect of feeding system on isofatty acid proportion ---------------------- 38
Fig 9. Effect of feeding system on ruminal ammonia production --------------- 41
Fig 10. The taxonomic profiles for the relative phylum-level abundance
of bacteria in each group classified by representation at > 0.5% of
total sequences----------------------------------------------------------------- 50
Fig 11. The taxonomic profiles for the relative genus-level (A) Bacteria
(B) Archaea abundance in each group classified by representation
at > 0.5% of total sequences ------------------------------------------------- 51
Fig 12. Relative abundance of genera in the two groups representing
>0.1% of total sequences that differ significantly (P < 0.1) ------------ 53
vii
List of abbreviations and formulas
ADF- Acid detergent fiber
ATP- Adenosine triphosphate
BW- Body weight
CF- Crude fiber
CP- Crude protein
DGGE- Denaturing gradient gel electrophoresis
DM- Dry matter
DMD- Dry matter digestibility
DMI- Dry matter intake
DNA- Deoxy ribonucleic acid
DOM- Digestible organic matter
FCE- Feed conversion efficiency
FCM- Fat corrected milk
FPCM- Fat protein corrected milk
GEI- Gross energy intake
GHG- Greenhouse gases
GWP- Global warming potential
IACUC- Institutional Animal Care and Use Committee
NADH- Nicotinamide Adenine Dinucleotide Hydrate
NDF- Neutral detergent fiber
NDFD- Neutral detergent fiber digestibility
NGS- Next generation sequencing
OM- Organic matter
OMI- Organic matter intake
viii
OTU- Operational taxonomic units
PSPSS- Penn State Particle Size Separator
QIIME- Quantitative Insights into Microbial Ecology
RNA- Ribonucleic acid
SAS- Statistical analysis software
SCFA- Short chain fatty acid
SF- Separate feeding
TMR- Total mixed ration
TRFLP- Terminal restriction length polymorphism
VFA- Volatile fatty acids
CH4- Methane
CO2- Carbon di oxide
H2 - Hydrogen
NH3- Ammonia
(NH4) HCO3- Ammonium bi carbonate
N2O- Nitrous oxide
1
1. Introduction
1.1. Study Background
The fermentation of feed macromolecules by microorganisms in the
rumen contributes to the production of CH4. Methanogenic archaea in the
rumen predominantly use H2 as energy source to reduce CO2 to CH4, which is
the last step of fermentation process in rumen. The methanogenesis process,
besides its negative impact on the environment, represents a loss of 2-15% of
gross energy intake of the animal and leads to an unproductive use of dietary
energy (Johnson et al., 2002). Also, greenhouse gas (GHG) emissions from
livestock production systems are expected to rise over the coming decades due
to the projected increase in demand for livestock products (FAO, 2009). Hence
increasing the productivity of cattle to reduce CH4 emission is a key area of
interest (Mills et al., 2009) because reducing the ruminant population being
farmed is not an option.
Advances in understanding the ruminant nutrition and rumen
microbiology have opened novel insights into the function of rumen
ecosystem relevant to methane formation. This has led several strategies to
reduce CH4 emission from rumen, which are of interest, only when they have no
negative impacts on animal and environment. Those strategies include the use
of chemical inhibitors like bromochloromethane (Immig et al., 1996; Lila et al.,
2004; Mitsumori et al., 2011; Knight et al., 2011), electron receptors like
fumarate, nitrates, sulfates, nitro ethane (Gutierrez-Banuelos et al., 2007;
Brown et al., 2011), Ionophores (Sauer et al., 1998; Van Vugt et al., 2005;
Waghorn et al., 2008a; Grainger et al., 2010) and plant bioactive compounds
like tannin and saponin (Woodward et al., 2001; Sliwinski et al., 2002; Zhou et
al., 2011; Staerfl et al., 2012). However, the use of these compounds as feed
2
additives was not promising due to several adverse effects, such as reduction in
fiber digestibility and feed intake, toxic to microbiome in the rumen, and
question of persistence of the effect (Johnson et al., 1972; Immig et al., 1996;
Leng et al., 2008; Waghorn et al., 2008; Grainger et al., 2009).
Alternatively, increased feed availability is expected to improve animal
production and it causes to decrease CH4 per unit animal products. The
nutritional advantages of feeding the animal with a total mixed ration (TMR) is
one of the strategies because this feeding system increases feed intake and
digestibility, minimizes choice feeding among individual feeds, maintains
sufficient fiber intake for supporting rumen health, such as stable ruminal pH,
lower A/P ratio when compared to animal fed the roughage and concentrates
components of the diet separately (Maekawa et al., 2002). Conversely, there are
also reports that feeding a TMR had no effect on animal performance or carcass
traits of steers (Caplis et al., 2005) and milk production and milk composition
(Renna et al., 2014). Based on the literatures, it might be postulated that feeding
a TMR would lead to not only more absolute amount of CH4 production
because of increased DM intake and ruminal pH but also less amount of CH4
per unit animal production. However, very little research (Holter et al., 1977) is
available on comparisons of separate and TMR feeding on CH4 production
from ruminant.
1.2. Aims of research
Reducing enteric CH4 production from livestock is one of the main
challenges in lowering the environmental impact from the agricultural sector.
The overall aim of this thesis was to evaluate the effect of TMR and Separate
Feeding (SF) system in ruminal CH4 emission, fermentation characteristics,
total digestibility and ruminal microbial profile.
3
2. Literature review
2.1. Impact of ruminal CH4 on environment and animal
productivity
In recent decades, the rising global temperatures and climate change
have been fueled by the increasing concentrations of greenhouse gases (GHG)
in the atmosphere. This climate change is most likely due to the human
activities (anthropogenic) (IPCC, 2013). In 2010, the total anthropogenic global
GHG emissions were recorded as 49 ± 4.5 Gt CO2-eq (IPCC, 2014), including
the 7.1 Gt CO2-eq per year from livestock sector (Gerber et al., 2013). Within
the livestock sector, enteric fermentation from ruminants is the largest source of
GHG (40%), followed by manure management. Livestock sector is estimated to
contribute to anthropogenic GHG emissions as 5% of CO2 emissions, 44% of
CH4 emissions and 53% of N2O emissions (IPCC, 2007). According to the
global warming potential (GWP) of these GHG, CH4 and N2O have 28 and 265
times higher GWP than CO2 (IPCC, 2013).
Apart from these environmental issues, CH4 emission has a serious
effect on the productivity of animals. According to Johnson and Johnson (1995),
cattle can produce 250–500 L of CH4 per day per animal and typically lose 2–
15% of their ingested energy as eructated CH4, which could be otherwise used
for milk production or other productivity mechanism. An increase in
productivity by reduction of CH4 production per kg products such as milk or
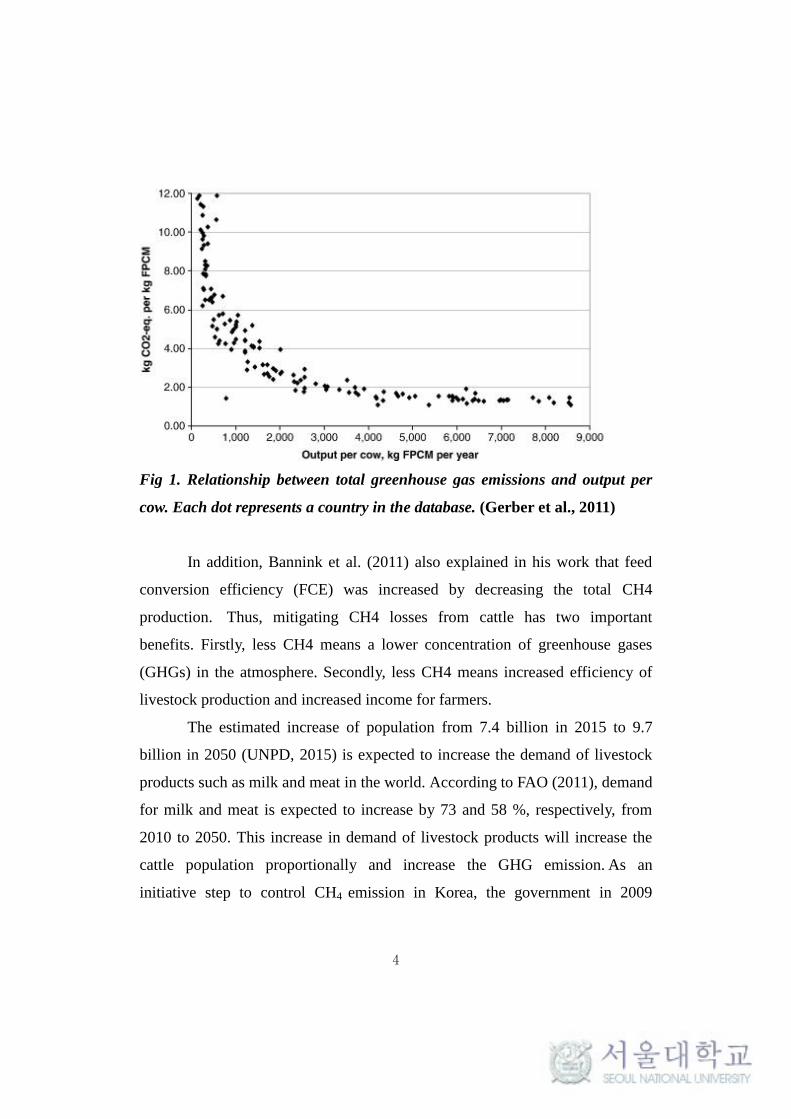
meat, has been a goal in animal agriculture sector. Gerber et al. (2011) analyzed
the relationship between productivity of dairy cows and emission intensity
(emission amount per unit of productivity) on a global scale (Fig 1) and pointed
that the most effective mitigation strategies are subjected to productivity level
and CH4 emission reduction in low productivity systems.
4
Fig 1. Relationship between total greenhouse gas emissions and output per
cow. Each dot represents a country in the database. (Gerber et al., 2011)
In addition, Bannink et al. (2011) also explained in his work that feed
conversion efficiency (FCE) was increased by decreasing the total CH4
production. Thus, mitigating CH4 losses from cattle has two important
benefits. Firstly, less CH4 means a lower concentration of greenhouse gases
(GHGs) in the atmosphere. Secondly, less CH4 means increased efficiency of
livestock production and increased income for farmers.
The estimated increase of population from 7.4 billion in 2015 to 9.7
billion in 2050 (UNPD, 2015) is expected to increase the demand of livestock
products such as milk and meat in the world. According to FAO (2011), demand
for milk and meat is expected to increase by 73 and 58 %, respectively, from
2010 to 2050. This increase in demand of livestock products will increase the
cattle population proportionally and increase the GHG emission. As an
initiative step to control CH4 emission in Korea, the government in 2009
5
announced the reduction of GHG emissions up to 30% nationwide and 5.2% in
livestock agriculture with active application of reduction methods.
2.2. Dietary strategies to mitigate ruminal CH4 emission:
2.2.1. Feeding level, passage rate and digestibility
As the feed additives are found to have lot of demerits and adverse
effects on animal productivity (Johnson et al., 1972; Immig et al., 1996; Leng et
al., 2008; Waghorn et al., 2008; Grainger et al., 2009), greater opportunities
exist in reducing enteric CH4 emissions from ruminants through nutrition,
feeding management and improvements in herd health and productivity than
with the use of feed additives as rumen modifiers (Waghorn and Hegarty, 2011).
A strong relationship of DMI with ruminal CH4 production has been
reported by Shibata et al. (2010) and Charmley et al. (2016). It is obvious that
total CH4 production (L/d or g/d) increases with increasing DMI because there
is more feed to be fermented. However, CH4 conversion rate (Ym value; CH4
energy as % of GEI) usually decreases as DMI increases above maintenance
since the GEI is very high (Blaxter and Clapperton, 1965; Moe and Tyrrell,
1979; Pinares-Patiño et al., 2009). Johnson and Johnson (1995) also stated that
the Ym decreased by about 1.6% per each increase in level of feed intake above
maintenance. The reason for decrease in Ym was related to decrease in DM
digestibility, majorly NDF (Huhtanen et al., 2009) and the associated increase
in passage rates at higher intakes (NRC, 2001; Boadi et al., 2004). There were
also reports that higher the digestibility, higher the CH4 produced (Blaxter and
Clapperton, 1965; Czerkawski et al., 1969; Moss et al., 1995; Kirkpatrick et al.,
1997; Pelchen and Peters, 1998; Hart et al., 2014). However, total tract NDF
digestibility has been studied more in terms of CH4 production, since the impact
6
on NDF digestibility is expected to be 2 to 5 times higher than hemicellulose
(Moe and Tyrrell, 1979). The relationships between digestibility, passage, and
DMI are complex and have a major impact on ruminal production of CH4.
2.2.2. Inclusion of concentrate
It has been reported that increase in the proportion of concentrate in the
diet decreases CH4 emissions linearly in lactating dairy cows and beef cattle
(Aguerre et al., 2011; McGeough et al., 2010). Sauvant and Giger-Reverdin
(2007) reported a curvilinear relationship between CH4 production and
proportion of concentrate in the diet; CH4 losses of 6-7% of GEI at 30–40%
concentrate levels and 2-3% at 80–90% concentrate levels. IPCC (2006) also
reported that dairy cows fed mixed ration showed emission factor 6.5%,
compared to 3% for cattle in feedlots fed commonly > 90% concentrate.
Replacing structural carbohydrates (cellulose, hemicellulose) from forage in the
diet with non-structural carbohydrates (starch and sugars) increased very
rapidly the amount of VFA production and shifted the profile of VFA from
acetate towards propionate, consequently decreasing the rumen pH, since
digestion of starch is faster than digestion of forage (Krizsan et al., 2010;
Cannas and Van Soest, 2000). However, negative effect on fiber digestibility by
such strategy had also been reported (Firkins, 1997; Nousiainen et al., 2009;
Agle et al., 2010; Ferraretto et al., 2013).
2.2.3. Particle size distribution of forage
Reducing the particle size distribution of the feed by feed processing is
another strategy to decrease CH4 emission since it alters the rates of
fermentation and passage rate of the particles (Maulfair et al., 2011). Passage
rate was found to be a major factor affecting the extent of digestion and patterns
of VFA formation as well as microbial growth rates and has been shown to
7
explain 28% of the variation in CH4 emissions (Okine et al., 1989). In a recent
study, Huhtanen et al. (2016) observed an inverse relationship between passage
rate of the feed and CH4 production. Particles that are too small was found to
pass the rumen undigested thereby decreasing the amount fermented (Russell
and Hespell, 1981). Processing forages by grinding, chopping, or pelleting was
also found to decrease rumen NDF digestibility and CH4 emissions as a result
of increased passage rate (Johnson et al., 1996; Moss et al., 2000) coupled with
decreased acetate: propionate ratios (Van Nevel and Demeyer, 1996). In
addition, it seems that the average size of forage necessary is 3 mm because of
maintaining the pH of rumen, the chewing activity, as well as the fat percentage
of milk (Shaver and Nylt, 1986). Therefore, the feeds which contained forage
with particles less than 3mm has been attributed to reduction of the fat
percentage of milk, the pH of rumen, and the chewing activity duration
(Mertens, 1997). Studies by Kononoff and Heinrichs (2003a) and Yang and
Beauchemin (2005) observed that increase in dry matter digestibility was
related to the increase in ration particle size. This depicted that increase in
ration particle size increases the retention time in rumen, but possibly
increasing CH4. One possible explanation was given by the study of Maulfair et
al. (2010) that chewing minutes per kilogram of DMI was increased for larger
particle size possibly (Owens and Isaacson, 1977) and NDFD was increase with
increasing ration particle size (Yang and Beauchemin, 2005). However, There
are conversial studies that ration particle size had no effect on NDFD (Krause et
al., 2002; Kononoff and Heinrichs, 2003a; Yang and Beauchemin, 2007).
Furthermore, fine grinding of forages has also been proven to be uneconomical
due to the greater risk of acidosis and decreased milk fat concentration (Boadi
et al., 2004). Overall, feed processing might be found to have mixed effects.
Processing forages alters rumen fermentation and decrease rumen NDF
8
digestibility, but if NDF is digested in the hindgut or in manure storage, no net
change in total CH4 emissions occur (Hinrichsen et al., 2005).
2.2.4. TMR vs separate feeding of concentrate and forage
The effect of feeding systems (Total mixed ration (TMR) vs. Separate
(SF) of concentrate and forage) on rumen CH4 production is the major
unexplored area (Hristov et al., 2013). TMR feeding system does not imply the
use of different feed ingredients from SF system but it normally includes some
extra processing of the diet ingredients, like chopping of forage, to enable the
ingredient to be fully incorporated into a uniform blended mixture that seemed
to give rise to an increase in daily DM intake in many studies. TMR has been
known to give benefits by increased meal frequency and feed intake, enhanced
fiber digestion and nitrogen utilization, and increased milk yield and milk fat
production (Owen, 1984). In a study on comparisons of different feeding
systems, Bargo et al. (2002) observed maximized total DMI and 19% increased
milk production coupled with increased body weight when the cattle were fed
TMR. In addition, Moseley et al. (1976), McGilliard et al. (1983) and Nock et
al. (1985) reported that TMR system helped to maintain rumen pH and improve
A/P ratio because TMR could provide more balanced ration with a uniform rate
of roughage and concentrate and increased DM intake. There were also studies
that showed feeding TMR increases digestion (Kim et al., 2012; Maskalova et
al., 2015). Comparing TMR and SF system in a recent study, Liu et al. (2016)
observed an increase in animal performance and dietary N utilization when
cattle received TMR rather than SF. It is well recognized that at low levels of
forage: concentrate ratio (below 40:60), mixing is considered advantageous so
as to spread the intake of forage and concentrates as evenly as possible. Also,
simplicity of management and full mechanization, coupled with economy of
9
feeding space, safety and flexibility for inclusion of a wide range of ingredients
are considered as the advantages of TMR.
However, Maekawa et al. (2002) did not report any differences in feed
intake or milk production and composition of dairy cows fed ingredients as a
TMR. Furthermore, earlier studies by Baxter et al. (1972) reported an increase
in milk production by Separate feeding system. Nocek et al. (1986) also
explained higher fat-corrected milk (FCM) feed efficiency with the separate
feeding system due to lower feed intake. This lower feed intake was observed
due to the increased particle size of the roughage. According to the research by
Manteca et al. (2008) investigating the effect of separate feeding on animal
welfare, when two or more feeds are offered separately at the same time, it was
observed that ruminants are able to develop recognition mechanisms for
favorable or adverse feed constituents and accordingly seemed to select diets
which meet their requirements (Görgülü et al., 1996) and a favorable rumen
environment (Cooper et al., 1995). Separate feeding system is also believed to
allow cattle select diet, corresponding to their physiological status, and
consume high amount of concentrate by balancing fiber intake in a
synchronized manner (Gorgulu et al., 1996; Fedele et al., 2002; Gorgulu et al.,
2003; Yurtseven and Gorgulu, 2004; Gorgulu et al., 2008). Furthermore, it has
been said that TMR preparation is tedious because mechanization include high
capital cost and risks of mechanical breakdown (Hironaka et al., 1996).
Irrespecive of the nutritional benefits of the TMR and SF, research on
their effects on CH4 production are too limited. Vander Nagel et al. (2003) in
the research on Lifecycle assessment (LCA) for TMR feeding and pasture
feeding cattle, showed that TMR exhibited high emission (1.53) relative to
pasture (0.84). Further, Yurtseven et al. (2009) observed Separate feeding
10
system produce less CH4 than TMR system. O’Neill et al. (2011) observed
TMR emit considerably high CH4 than pasture. However, in these experiments
the proportion of the feed ingredients and DMI differed considerably and no
reason was attributed towards the variation in CH4 emission. The only report
that compared the effect of TMR and SF system of same feed ingredients was
by Holter et al. (1977), which observed no change in CH4 production between
different feeding systems. Furthermore, through the literature, it is clear that the
particle size, passage rate and digestibility are thought to play an important role
in CH4 mitigation process by these different feeding systems since TMR were
found to have shorter forage length and SF found to have longer particle length.
In a study by Li et al. (2003), the TMR feeding system was found to exhibit
higher digestibility of NDF due to shorter particle length which could also be
related to CH4 production. However, more studies are needed to be conducted to
evaluate the effect of feeding system on ruminal CH4 production.
2.3. Understanding rumen microbiology
The rumen microorganisms with major population of bacteria (95% of
the total microbiota) play a vital role in the conversion of plant materials into
digestible compounds such as volatile fatty acids and bacterial proteins which
defines the quality and composition of milk and meat and their production
yields (Welkie et al., 2009; Sundset et al., 2009). The active bacterial population
mainly depends on different parameters such as animal, breed, type of feed,
composition of feed and many other factors (Agarwal et al., 2015). Furthermore,
each microbial species has special substrate preferences based on which they
are classified into fibrolytic (e.g., Ruminococcus albus, Ruminococcus
flavefaciens, Fibrobacter succinogenes, and Butyrivibrio fibrisolvens),
11
amylolytic (e.g., Selenomonas ruminantium, Streptococcus bovis), proteolytic
(e.g., Prevotella spp.), lipolytic (e.g., Anaerovibrio lipolytica), lactate producers
(e.g., Streptococcus bovis and Selenomonas ruminantium) and lactate
consumers (e.g., Megasphaera elsdenii) (Zhou et al., 2015). Compared with
bacteria, the diversity of rumen archaea which play major role in direct CH4
production is much less (Henderson et al., 2015) with seven known orders of
methanogens: Methanobacteriales, Methanomicrobiales, Methanococcales,
Methanocellales, Methanopyrales, Methanosarcinales and the recently
discovered order Methanomassiliicoccales (Oren and Garrity, 2014). So far, 120
species and 33 genera of methanogens have been identified in the rumen
(Cersosimo and Wright, 2015). However, the genus Methanobrevibacter of
order Methanobacteriales which is believed to be the major producer of CH4, is
the most abundant methanogen in the rumen (Jeyanathan et al., 2011; King et
al., 2011; St Pierre and Wright, 2012). Additionally, these microbes and their
symbiotic relationship are believed to play an important role in maintaining
host health, improving animal productivity and reducing environmental
pollution. However, there is still a lack of understanding of the mechanisms
governing microbe-microbe interactions and their colonization patterns based
on their feed type.
Methanogenesis, the CH4 production step, is where methanogens
generate their energy in the form of ATP (Ferry & Kaestad, 2007). Methane in
the rumen is produced by microorganisms called methanogens as a by-product
of anaerobic fermentation by the reduction of CO2 and H2 . Glucose equivalents
like cellulose, hemicellulose, pectin, starch, sucrose, fructans and pentosans
from animal feed stuffs are broken down into pyruvate by the ruminal
microorganisms. This pyruvate under anaerobic conditions undergoes oxidation
reaction to produce reduced co-factors such as NADH which is then re-oxidized
12
to NAD to complete the synthesis of volatile fatty acids (VFAs). Depending on
the amount and proportions of different VFAs produced, different amounts of
CH4 and CO2 are also produced. When acetate is produced, re-oxidation of
NADH is occurred by production of H2 that can be further used by
methanogenic archaea (methanogens) to reduce CO2 to CH4. According to the
electron donors used, three methanogenesis pathways have been described.
They are hydrogenotropic, that utilizes H2 , methylotropic, that utilizes
methanol and methylamines (Lang et al., 2015) and aceticlastic, that utilizes
acetate (Janssen and Kirs, 2008). Hydrogenotropic is the most common
pathway used by methanogens found in the ruminant livestock since majority of
known methanogens grow when H2 is used as the electron donor (Kim and
Gadd, 2008). Carbon dioxide is the major electron acceptor combines with H2
and reduces to form CH4. This eradication of H2 by methanogenesis helps in
reducing the partial pressure of H2 in the rumen favoring effective fermentation
(Moss et al., 2000). Further, it also helps in keeping the partial hydrogenase
activity favoring hydrogen production, thus avoiding the formation of lactate or
ethanol as major end products and allowing more acetate to be produced in the
rumen (Wolin and Miller, 1988). However, this CH4 emission has a serious
effect on environment and animal.
As a positive step towards understanding rumen microbiome, advances
in genomics technologies have provided new opportunities to analyze entire
microbial communities. Previously, culture-based methods to study rumen
microbiology (Hungate, 1966; Hespell et al., 1997) provided deep knowledge
on role of individual microbes and rumen dynamics (Whitford et al., 1998;
Tajima et al., 1999; Weimer et al., 1999; Tajima et al. 2000; Kocherginskaya et
al., 2001; Tajima et al., 2001; Whitford et al., 2001; Klieve et al., 2003; Larue et
al., 2005; McEwan et al., 2005; Michelland et al., 2009; Hook et al., 2009;
13
Welkie et al., 2009) which helped to understand the microbial diversity in the
rumen. However, these approaches were found to describe only fraction of
rumen microbial diversity (Amann et al., 1995; Pace, 1997). This limitation led
to emergence of advanced technologies like microarray technologies,
electrophoretic sizing techniques like DGGE and T-RFLP and a targeted
sequencing of amplicons that includes 454 pyrosequencing and Illumina
sequencing (Next Generation sequencing, NGS) (Deng et al., 2008). The latter
technologies are the current hotspot in studying microbial diversity in various
ecosystem. The invention of NGS has allowed a breakthrough in sequencing of
whole genomes, metagenomes and analysis due to their increased throughput
and decrease in costs of sequencing. This metagenomic approach analyses total
microbial DNA extracted directly from the environment and hence the
microbiome could be immediately investigated to yield large amount of raw
data. In addition, NGS technologies have allowed exploration of complex
communities like termite hindgut (Warnecke et al., 2007), human intestinal tract
(Turnbaugh et al., 2007), human saliva (Willner et al., 2011) and cow rumen
(Brulc et al., 2009) at higher throughput than Sanger based sequencing.
Furthermore, compared with 16S rRNA gene analysis techniques, metagenomic
sequencing by NGS has been shown to achieve high coverage that accurately
reflect the structure of the gut microbiome (Bhatt et al., 2013). To be precise, in
NGS, Illumina sequencing is considered as the best sequencing tool nowadays
than the 454 pyrosequencing due to the number of reads obtained that makes
this technology the most well suited to deep-coverage sequencing and also it is
less cost associated.
Many studies on the use of NGS technology in rumen studies have
reported fibre-associated rumen metagenome (Brulc et al., 2009) and on 16S
rRNA gene amplicon profiles (Callaway et al., 2010; Pitta et al., 2010). There
14
were also studies that compared the rumen microbial diversities across dairy
cows fed pasture or TMR (De Menezes et al., 2011), composition and similarity
of bovine rumen microbiota across individual animals (Jami and Mizrahi, 2012),
steers fed different dietary fiber (Thoetkiattikul et al., 2013), steers fed forage
and concentrate (Petri et al., 2013), different age groups of goats (Han et al.,
2015), steers differing in feed efficiency (Myer et al., 2015), feed restricted
cattle (McCabe et al., 2015), between omasum and reticulum (Peng et al., 2015),
high grain diet with dicarboxylic acids or polyphenols (De Nardi et al., 2016),
isoflavone enriched feed on dairy cows (Kasparovska et al., 2016), across dairy
cows (Indugu et al., 2016). There were also reports on methanogen diversities
in rumen related to CH4 formation evaluated by using NGS (Snelling et al.,
2014; Danielsson et al., 2014; Wallace et al., 2015). Though the effect of
feeding systems on total bacteria, fungi and protozoa have been reported by Li
et al. (2003), variation in microbial diversity related to animal performance and
CH4 formation at genera level has never been reported using NGS technology.
It was believed that countless nutritional strategies potentially create an equal
number of unique microbiomes that will enable a greater understanding of the
host–microbe relationship and its impact on animal performance and CH4
emissions. Lack of sufficient understanding of the ruminal microbiome will
hinder effective enhancement of animal productivity and CH4 mitigation.
Therefore, many studies on feeding systems on rumen microbial populations
has to be carried out.
15
3. Materials and methods
Two experiments were conducted at Seoul National University,
Pyeongchang, Republic of Korea from October to December, 2015. All animal-
related procedures were performed according to the guidelines of the
Institutional Animal Care and Use Committee (IACUC) of Seoul National
University, Republic of Korea. Animal feeds were processed and purchased
from a domestic feed mill company and all experimental chemicals were
obtained from Sigma-Aldrich Co. (St. Louis, MO).
3.1. Animal and experimental design
Six Holstein steers were used for two consicutive experiments, and were
divided into two group by similar BW and allocated into two pen equipped with
calan doors for 30 days’ adaption. A triplicated 2×2 Latin square design was
used with two different feeding system of same diet over two consecutive
periods of 17 days in experiment 1 including, 11 days for diet adaption in the
pen and 6 days for CH4 measurement in the indirect respiratory chamber.
Experiment 2 consisted of two consecutive periods of 22 days including 11 days
for diet adaption in the pen and 6 days for CH4 measurement in the indirect
respiratory chambers and 5 days for sample collection.
3.2. Experimental diet and feeding
Total mixed ration was prepared using 73% concentrates including
water, yeast culture, limestone, salt and molasses and 27% roughage on a fed-
basis (Table 1). The concentrates and TMR were packed in a 20 kg
polypropylene bags with one-way channels to emanate gas produced during
fermentation. TMR and concentrate exhibited weak fermentation on storage,
16
where the pH was found to be 5.49 and 5.29 and lactic acid concentrations were
observed to be 1.8 and 1.4% DM, respectively. Animals were fed experimental
diets at 2.4 (± 0.3) and 2.0 (± 0.4) % BW to achieve average daily gains of 1.4
kg and 0.7 kg in experiment 1 and 2, respectively (Table 2), twice a day in equal
amount at 0900 and 1800 h. The animals were weighed on the last day of each
experiment to determine their body weight for adjusting their feeding levels. In
TMR feeding system, the roughages were chopped and mixed thoroughly with
concentrate, whereas in SF the roughages were fed first without chopping and
then the concentrate was fed separately to prevent unnecessary drop of the pH
in initial ruminal fermentation. The animals were given full access to water and
mineral block for 24 hrs in a pen as well as in respiratory chamber. The samples
of the feed offered were collected and stored in a dry location to measure the
dry matter content and to perform other chemical analysis.
17
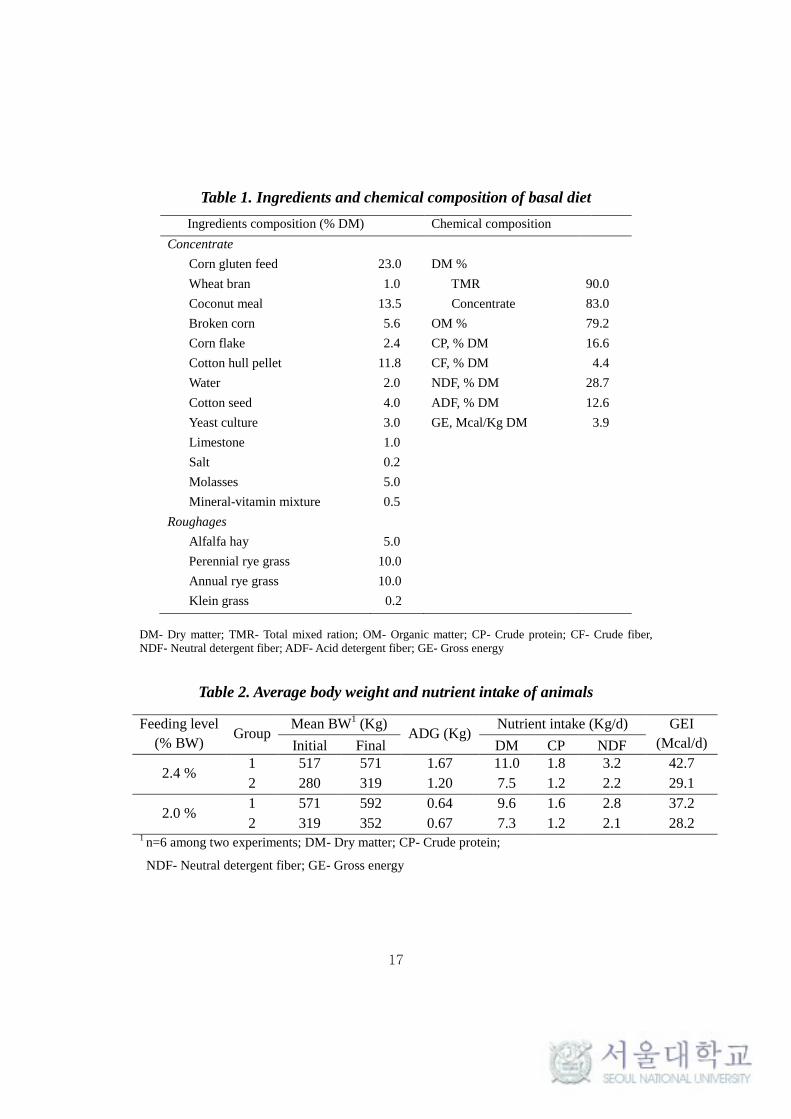
Table 1. Ingredients and chemical composition of basal diet
Ingredients composition (% DM) Chemical composition
Concentrate
Corn gluten feed 23.0 DM %
Wheat bran 1.0 TMR 90.0
Coconut meal 13.5 Concentrate 83.0
Broken corn 5.6 OM % 79.2
Corn flake 2.4 CP, % DM 16.6
Cotton hull pellet 11.8 CF, % DM 4.4
Water 2.0 NDF, % DM 28.7
Cotton seed 4.0 ADF, % DM 12.6
Yeast culture
3.0 GE, Mcal/Kg DM 3.9
Limestone 1.0
Salt 0.2
Molasses 5.0
Mineral-vitamin mixture
0.5
Roughages
Alfalfa hay 5.0
Perennial rye grass 10.0
Annual rye grass 10.0
Klein grass 0.2
DM- Dry matter; TMR- Total mixed ration; OM- Organic matter; CP- Crude protein; CF- Crude fiber,
NDF- Neutral detergent fiber; ADF- Acid detergent fiber; GE- Gross energy
Table 2. Average body weight and nutrient intake of animals
Feeding level
(% BW) Group
Mean BW1 (Kg)
ADG (Kg) Nutrient intake (Kg/d) GEI
(Mcal/d) Initial Final DM CP NDF
2.4 % 1 517 571 1.67 11.0 1.8 3.2 42.7
2 280 319 1.20 7.5 1.2 2.2 29.1
2.0 % 1 571 592 0.64 9.6 1.6 2.8 37.2
2 319 352 0.67 7.3 1.2 2.1 28.2 1 n=6 among two experiments; DM- Dry matter; CP- Crude protein;
NDF- Neutral detergent fiber; GE- Gross energy
18
3.3. Methane emission measurement
On days 12 - 14, first group of three animals were placed in three
chambers and CH4 productions were recorded, followed by 2nd
group on days
15 - 17. To avoid uncertainty in data, animals were placed in the same chamber
while measuring CH4 in period 2. Gas sampling for measuring CH4 was
performed using three Indirect open circuit respiratory chamber made of steel
frame and polycarbonate sheet (Miller and Koes, 1988). Each chamber (137cm
wide × 256cm deep × 200cm tall) was equipped with feeder, waterer, air
conditioner (Busung Co. Ltd., India, model ALFFIZ-WBCAI-015H) and
dehumidifier (Dryer Korea, model DK-C-150E) to maintain the temperature
and humidity, respectively. The gas analysis system consisted of gas sampling
pump (B.S Technolab INC., Korea), tunable diode LASER CH4 gas analyzer
(KINSCO Technology. Co. Ltd., Korea, model Airwell+7), data acquisition and
analysis unit. The respiration chamber was maintained at a controlled
temperature and humidity of 25°C and 50%, respectively. A flow meter
(Teledyne Technologies Inc., USA, model LS-3D) was used to record and
maintain the flow rate of air flowing out of the respiratory chamber to the
analyzer, which was 600 L/min throughout the experiment. The gas analyzer
was calibrated and recovery rate of each chamber was measured at the
beginning of each experiment using a standard calibration CH4 gas mixture (Air
Korea, 25% mol/mol). The temperature, humidity and aeration flow rate for the
experiment were decided by optimizing them for maximum recovery of
standard CH4 gas. Concentrations of CH4 in the inlet and outlet air of each
chamber were measured every 10 min. Some intrusions occurred every day
while cleaning the chamber floor and feeding and these intrusions had little
effect on measurement. However, these fluctuations were considered and
19
summed to derive the 24-h emission value. Finally, these emission values were
recalculated based on the recovery rate of each chamber.
3.4. Digestion trial and rumen sampling
In experiment 2, the effect of feeding system on total tract digestibility
of nutrients was studied using chromic oxide (Cr2O3) as an external marker.
Chromic Oxide was top-dressed twice daily onto the feed at 0.2% of daily feed
amount for TMR, whereas mixed with the concentrate for SF system. Fecal
samples (100 g of wet weight) were collected from the rectum of each animal
on days 18 - 21 of each period. Samples were taken at various times throughout
the day, to minimize the fluctuations in Cr concentration and these samples
were frozen at -20°C for further analysis.
Samples of ruminal fluid were collected 1.5, 3 and 4.5 h after feeding on
day 22 of each period of experiment 2 using a stomach tube as explained by
Beauchemin et al. (2014). Saliva contamination of the rumen fluid was checked
and the whole ruminal contents were squeezed through four layers of cheese
cloth and the pH was immediately measured using a pH meter (model AG
8603; Seven Easy pH, Mettler-Toledo, Schwerzenbach, Switzerland). The
ruminal fluid was centrifuged at 8,000 rpm for 10 min, and the supernatant was
transferred to a 50 ml centrifuge tube and stored at -20°C for further
determination of Ammonia-N, volatile fatty acid concentrations and microbial
diversity.
3.5. Feed particle size measurement
The particle size of the feed in both TMR and SF was determined using
the Penn State Particle Size Separator (PSPSS) with the technique explained by
20
Kononoff et al., 2003. Approximately 200 g of dried feed samples were placed
on the top sieve of pore size 19 mm stacked over a series of sieves of varying
pore size. This set up was shook horizontally in one direction five times. The
screens were then rotated a one quarter turn and shook another five times for a
total of 8 sets leading to 40 shakes. The material in each of the sieves and the
bottom pan were then weighed and percentage of the feed particles belonged to
a range of size was calculated.
3.6. Chemical analyses
The samples of feed and feces were dried in hot air oven at 65°C for 72 hours
and ground to pass through a 1 mm screen (Thomas Scientific Model 4, New
Jersey, USA) and then assayed for dry matter (DM), crude protein (CP), ash and
Cr by the method explained in AOAC (1990). Neutral detergent fiber (NDF)
content was estimated by the method of Van Soest (1991). The gross energy
(GE) of both feed and fecal samples were estimated using the bomb calorimeter
(Shimadzu CA-3, shimadzu corporation, Japan).
A 5.0 mL aliquot of rumen fluid was mixed with 0.05 mL saturated
HgCl2, 1.0 mL 25% HPO3, and 0.2 mL 2% pivalic acid to measure volatile fatty
acids (Erwin et al. 1961), and the mixture was subjected to gas chromatography
equipped with flame ionization detector and a FFAP CB column (25 m × 0.32
mm, 0.3 µm, Agilent Technologies, Santa Clara, CA, USA). Ammonia-N
concentration was determined using a modified colorimetric method (Chaney
and Marbach, 1962).
21
3.7. Genomic DNA extraction and Quantification
Genomic DNA was extracted from thawed rumen fluid samples using
the NucleoSpin soil kit (Macherey-Nagel, Düren, Germany), with minor
modifications. Briefly, 5 ml of thawed rumen fluid was centrifuged at 12,000
rpm using Centrifuge Smart 15 (Hanil Science Industrial, South Korea) and
supernatant was discarded. Three hundred and fifty µl of Lysis buffer and 75 µl
of enhancer was added to the pellet, and vortexed horizontally for 2 mins. The
liquid was transferred to the NucleoSpin® Bead Tube Type A containing the
ceramic beads and was vortexed using the taco™ Prep bead beater (GeneReach
Biotechnology Corp., Taiwan). The rest of the procedure was followed
according to the manufacturer’s instructions. Finally, the quantity and quality
of 100 µl of eluted DNA were determined by absorption spectroscopy, using a
Nanodrop spectrophotometer ND-1000 (Thermo Scientific Inc.). A 1.5 µl blank
of the elution buffer used for the extraction of the DNA sample was initially
used to zero the spectrophotometer before determining the absorbance at 260
nm (A260). The purity of the nucleic acid sample was estimated from the
A260/A280 ratio. The DNA sample was stored at -20°C until further use.
3.8. PCR amplification and library construction
In the present study, V4 domain of the bacterial 16S rRNA was selected
as target for interrogating the bacterial communities since the genus-level
coverage of this region was found to be high (Mizrahi-Man et al., 2013). For
amplification of this V4 hypervariable region, the primers ArBaF515 (5′-
CACGGTCGKCGGCGCCATT-3′) and ArBaR806 (5′-
GGACTACHVGGGTWTCTAAT-3′) was used, as this primer set was found to
be used extensively in studying rumen bacterial diversity (Webster et al., 2016;
22
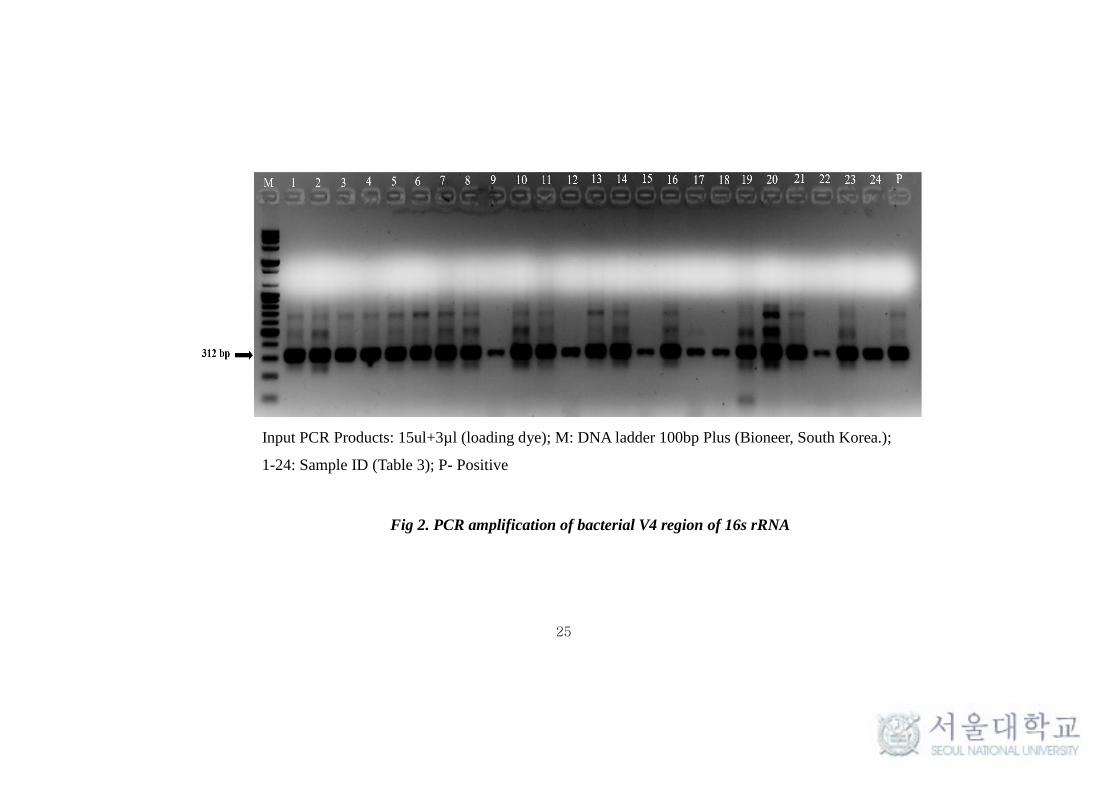
Meale et al., 2016). This primer set targets ~312 bp of the V4 hypervariable
regions can be fully covered by the Illumina MiSeq. For interrogating the
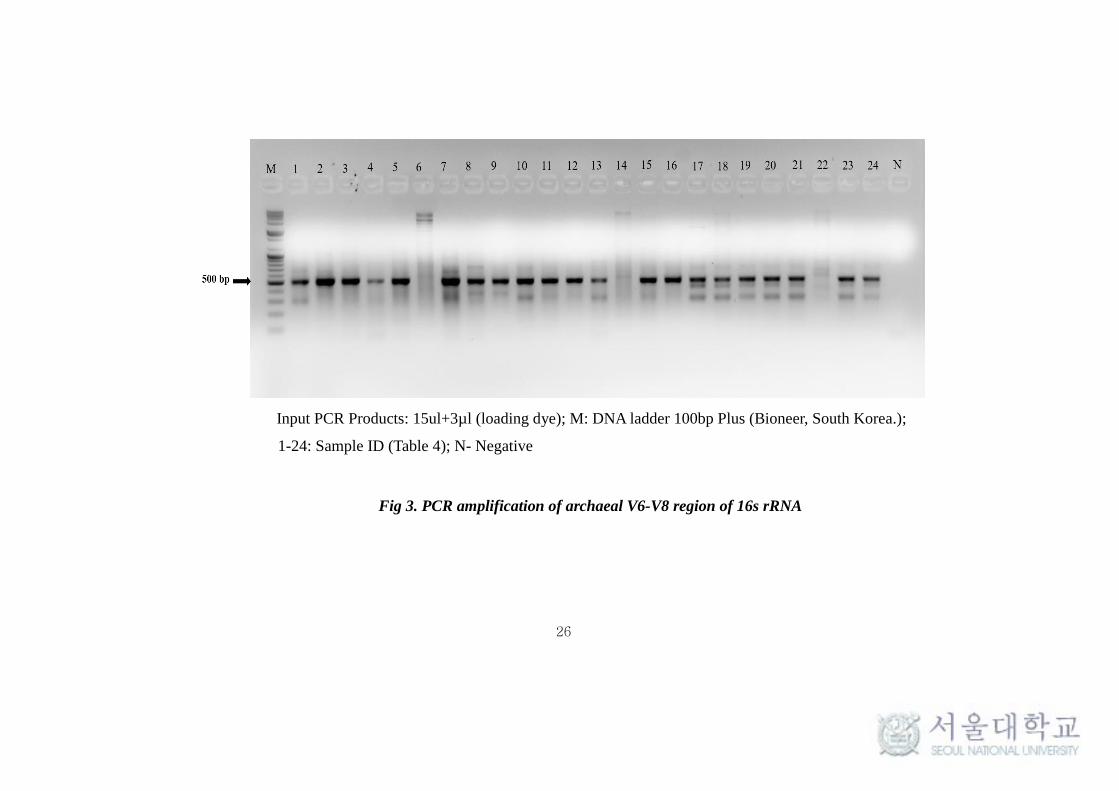
methanogen diversity, primer set Ar915aF (5′-
AGGAATTGGCGGGGGAGCAC-3′) and Ar1386R (5′-GCGGTGTGTG
AAGGAGC-3′) targeting the ~500 bp of the V6-V8 domain of archaeal 16S
rRNA was used since it mainly targets the methanogens (Skillman et al., 2004).
This primer set has been reported to study rumen methanogen diversity
(Henderson et al., 2015; Seedorf et al., 2015). Both the primer sets were
modified to contain an Illumina adapter and linker region for sequencing on the
Illumina MiSeq platform and, on the reverse primer, a 12-base barcode to
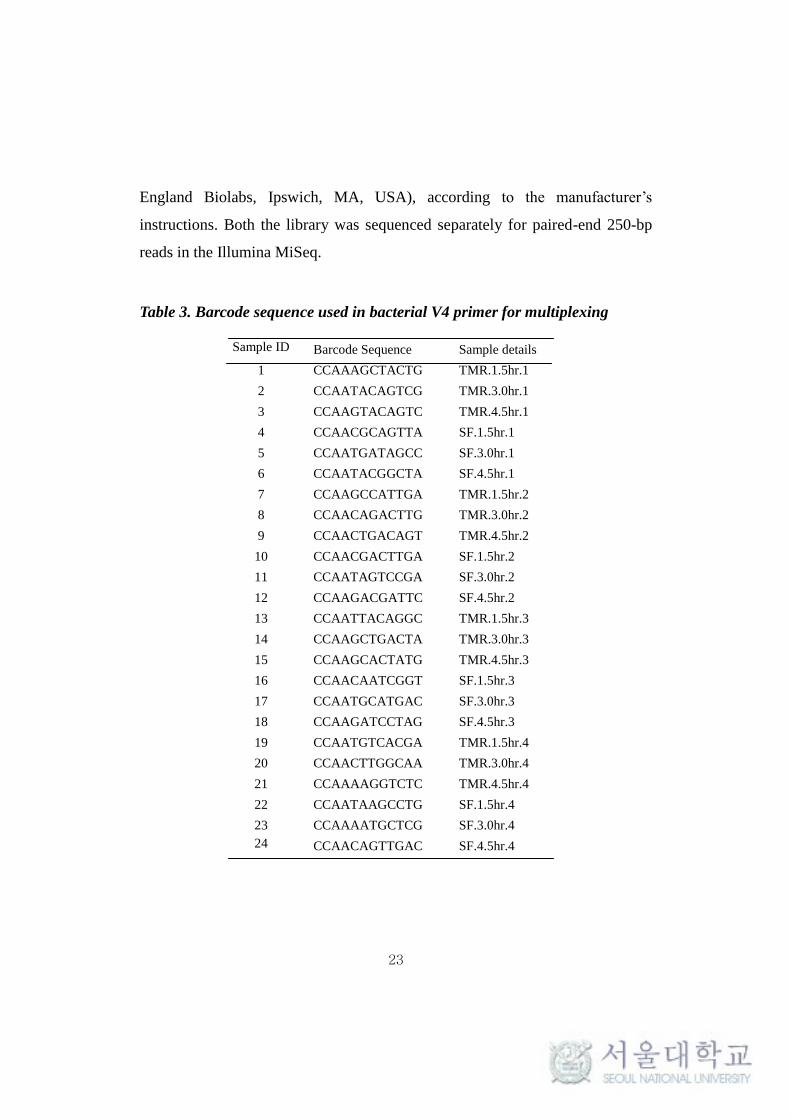
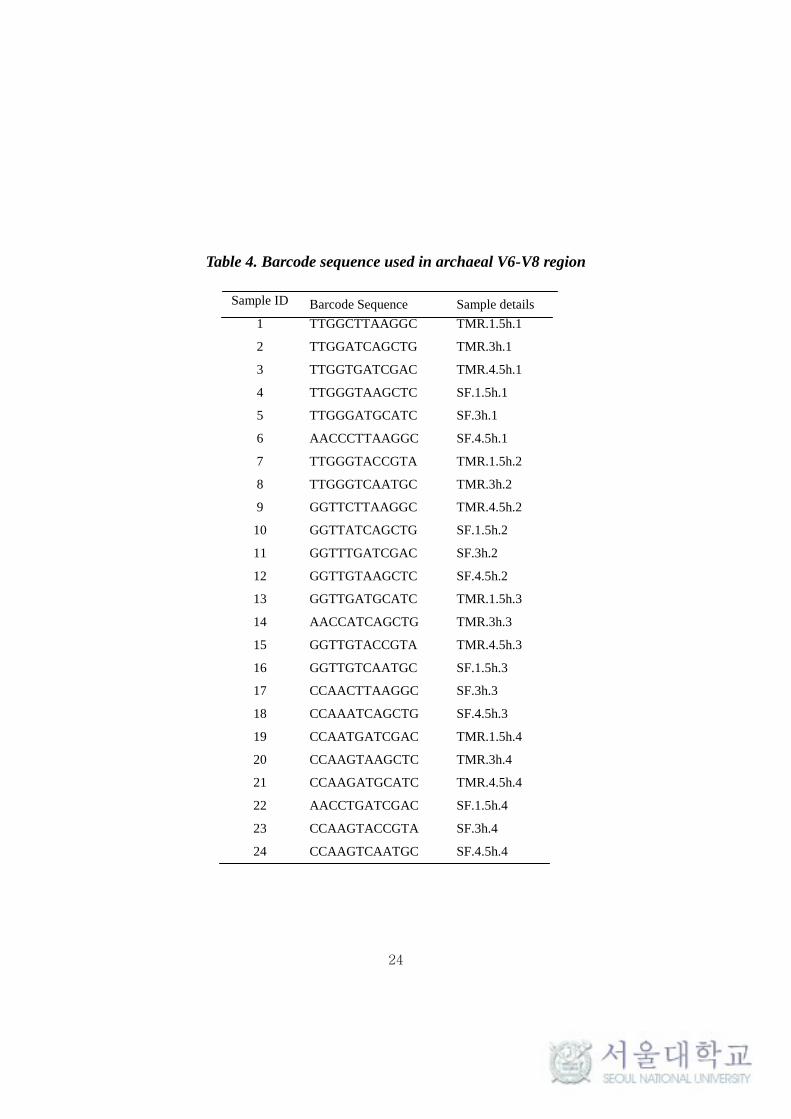
enable sample multiplexing. The list of barcode used for sample multiplexing in
both the primer sets is presented in Table 3 and 4. Briefly, the PCR reaction was
prepared using genomic DNA (5 ng), reaction buffer with 25 mM Mg2+, dNTP
(200 mM each), Ex Taq polymerase (0.75 units; Takara Bio, Shiga, Japan), and
5 pmol each of the barcoded primers. The PCR reaction for both bacterial V4
region and V6-V8 archaeal domain was carried out at 94°C for 3 min for initial
denaturation, 30 cycles of 45 s at 94°C, 1 min at 55°C, 90 s at 72°C for
amplification, and 72°C for 10 min for final extension. After amplification, the
correct sizes of PCR products were verified by 1.5% agarose gel electrophoresis
(Fig 2 and 3). Then, the PCR products of both the primer pair targeting bacteria
and archaea were quantified using the Quant-iT™ dsDNA Assay Kit, high
sensitivity. After quantification, all amplicons of two different target region
from the 24 DNA samples were pooled into two separate pools and loaded onto
a 1.5%-agarose gel. Bands were visualized and the target band was excised and
extracted using QIAquick Gel Extraction Kit (Qiagen, CA, USA). The extracted
DNA was used to construct the bacterial V4 and archaeal V6-V8 sequencing
library with the NEBNext Ultra DNA Library Prep Kit (cat. E7370S; New
23
England Biolabs, Ipswich, MA, USA), according to the manufacturer’s
instructions. Both the library was sequenced separately for paired-end 250-bp
reads in the Illumina MiSeq.
Table 3. Barcode sequence used in bacterial V4 primer for multiplexing
Sample ID Barcode Sequence Sample details
1 CCAAAGCTACTG TMR.1.5hr.1
2 CCAATACAGTCG TMR.3.0hr.1
3 CCAAGTACAGTC TMR.4.5hr.1
4 CCAACGCAGTTA SF.1.5hr.1
5 CCAATGATAGCC SF.3.0hr.1
6 CCAATACGGCTA SF.4.5hr.1
7 CCAAGCCATTGA TMR.1.5hr.2
8 CCAACAGACTTG TMR.3.0hr.2
9 CCAACTGACAGT TMR.4.5hr.2
10 CCAACGACTTGA SF.1.5hr.2
11 CCAATAGTCCGA SF.3.0hr.2
12 CCAAGACGATTC SF.4.5hr.2
13 CCAATTACAGGC TMR.1.5hr.3
14 CCAAGCTGACTA TMR.3.0hr.3
15 CCAAGCACTATG TMR.4.5hr.3
16 CCAACAATCGGT SF.1.5hr.3
17 CCAATGCATGAC SF.3.0hr.3
18 CCAAGATCCTAG SF.4.5hr.3
19 CCAATGTCACGA TMR.1.5hr.4
20 CCAACTTGGCAA TMR.3.0hr.4
21 CCAAAAGGTCTC TMR.4.5hr.4
22 CCAATAAGCCTG SF.1.5hr.4
23 CCAAAATGCTCG SF.3.0hr.4
24 CCAACAGTTGAC SF.4.5hr.4
24
Table 4. Barcode sequence used in archaeal V6-V8 region
Sample ID Barcode Sequence Sample details
1 TTGGCTTAAGGC TMR.1.5h.1
2 TTGGATCAGCTG TMR.3h.1
3 TTGGTGATCGAC TMR.4.5h.1
4 TTGGGTAAGCTC SF.1.5h.1
5 TTGGGATGCATC SF.3h.1
6 AACCCTTAAGGC SF.4.5h.1
7 TTGGGTACCGTA TMR.1.5h.2
8 TTGGGTCAATGC TMR.3h.2
9 GGTTCTTAAGGC TMR.4.5h.2
10 GGTTATCAGCTG SF.1.5h.2
11 GGTTTGATCGAC SF.3h.2
12 GGTTGTAAGCTC SF.4.5h.2
13 GGTTGATGCATC TMR.1.5h.3
14 AACCATCAGCTG TMR.3h.3
15 GGTTGTACCGTA TMR.4.5h.3
16 GGTTGTCAATGC SF.1.5h.3
17 CCAACTTAAGGC SF.3h.3
18 CCAAATCAGCTG SF.4.5h.3
19 CCAATGATCGAC TMR.1.5h.4
20 CCAAGTAAGCTC TMR.3h.4
21 CCAAGATGCATC TMR.4.5h.4
22 AACCTGATCGAC SF.1.5h.4
23 CCAAGTACCGTA SF.3h.4
24 CCAAGTCAATGC SF.4.5h.4
25
Input PCR Products: 15ul+3µl (loading dye); M: DNA ladder 100bp Plus (Bioneer, South Korea.);
1-24: Sample ID (Table 3); P- Positive
Fig 2. PCR amplification of bacterial V4 region of 16s rRNA
26
Input PCR Products: 15ul+3µl (loading dye); M: DNA ladder 100bp Plus (Bioneer, South Korea.);
1-24: Sample ID (Table 4); N- Negative
Fig 3. PCR amplification of archaeal V6-V8 region of 16s rRNA
27
3.9. Microbial community diversity analysis
The raw Illumina MiSeq reads were demultiplexed according to the
barcodes and the sequences were quality-filtered (>= Q20). The processed
paired reads were concatenated into a single read, and each single read was
screened for operational taxonomic unit (OTU) picking using the UCLUST
embedded within the QIIME 1.9.0 with the greengenes database (gg_otus-
13_8-release, 97% nucleotide identity). Alpha diversity was estimated using the
QIIME pipeline, and rarefaction curves were generated based on mean values
of 10 iterations with 10,000 reads per sample. Principal Component Analysis
(PCA) was performed using several genera with significantly different
abundance.
3.10. Statistical analysis
Data were analyzed as a Latin square using the general linear models
procedure (Version 9.1, SAS 2002); animal, period and treatment were the
effects in the model. Differences were considered to be significant when P <
0.05.
28
4. Results and Discussions
4.1. Effect of Feeding system on CH4 emission
There were no differences in DM and nutrient intakes between feeding
systems in experiment 1 and experiment 2 (Table 5). It seems likely to have
restricted their level of intake with observed mean DM intake in experiment 1
and experiment 2. When diets were fed at 2.4% BW in experiment 1, there were
no significant differences between feeding systems in CH4 production per day
and CH4 emission related to the amount of organic matter intake (OMI), and
CH4 as proportion of gross energy intake (GEI). The absence of treatments
effect on CH4 emission at feeding level of 2.4% BW have also been reported by
Holter et al. (1977) who compared the effect of mixed and separate feeding of
concentrate and silage fed at 2.5% BW. However, when feeding level decreased
from 2.4% to 2.0% BW, significantly higher CH4 production for TMR (P <
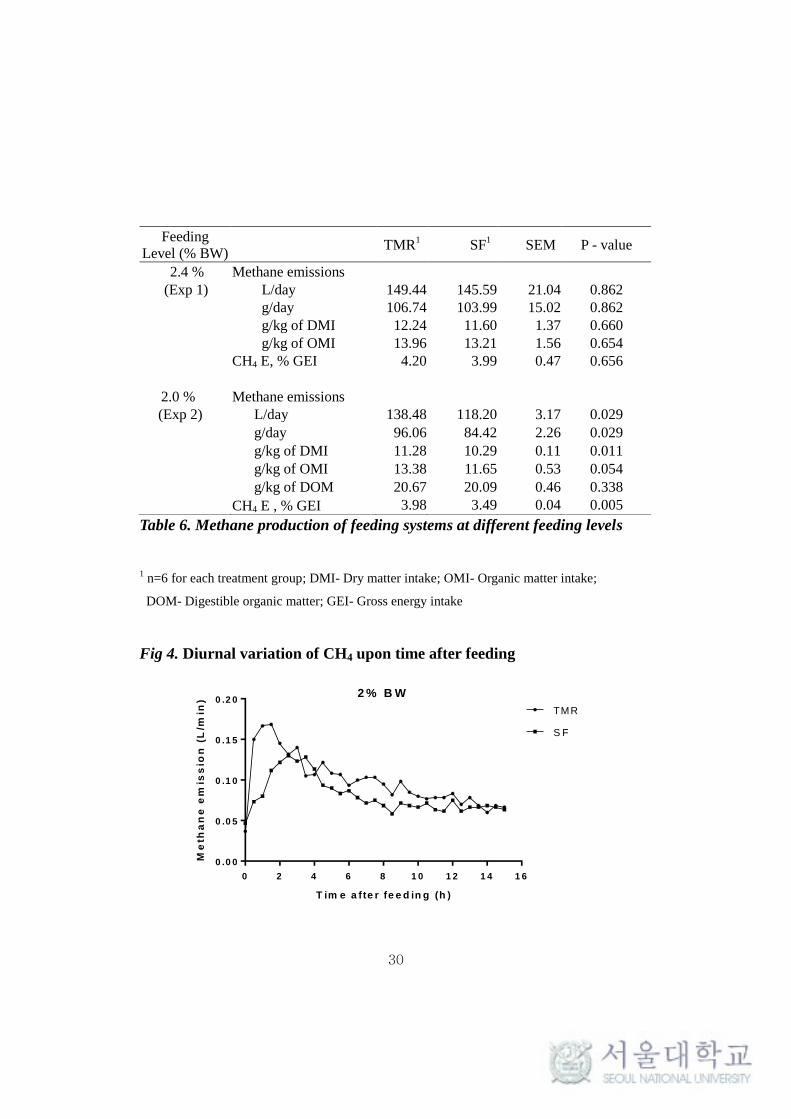
0.05) compared to SF was noted in experiment 2 (Table 6). The diurnal
variation of CH4 emission between the feeding system after evening feeding
clearly shows the higher CH4 emission level for TMR (Fig.4)
Numerous advantages like choice minimization among individual feeds,
reduction in labor and time required for feeding, similarity between consumed
and formulated diet, sufficient fiber intake to prevent milk fat depression, easier
to manage and reduced incidence of subclinical ruminal acidosis of using a
TMR have been reported (Maekawa et al., 2002). However, very few studies,
such as the present experiment and by Holter et al. (1977), have compared the
CH4 emissions of cattle fed same ingredients of forage and concentrates as a
29
TMR or separately. Though the CH4 production per unit animal production was
not determined in the present experiment it was expected that TMR feeding
system stimulate greater feed efficiency and reduce CH4 production per unit
animal production than separate feeding. This must be one of the important
plausible explanation for the advantage of using a TMR. In previous studies,
dairy cow fed TMR (O’Neill et al., 2011,2012) produced higher enteric CH4
per cow and higher milk due to higher DMI have also been observed. However,
the increase in feed efficiency was not large enough to offset the substantially
great quantity of enteric CH4 produced.
Table 5. Mean nutrient intake of animals in Exp 1 and Exp 2
Intake level
Exp 1 Exp 2
Mean SEM Mean SEM
DM, kg/d 9.26 1.91 8.43 1.32
OM, kg/d 8.14 1.68 7.42 1.16
CP, kg/d 1.54 0.32 1.40 0.22
NDF, kg/d 2.66 0.55 2.42 0.38
GE, Mcal/d 35.91 7.42 32.71 5.15
DM- Dry matter; OM- Organic matter; CP- Crude protein; NDF- Neutral detergent fiber; GE-
Gross energy
30
Table 6. Methane production of feeding systems at different feeding levels
1 n=6 for each treatment group; DMI- Dry matter intake; OMI- Organic matter intake;
DOM- Digestible organic matter; GEI- Gross energy intake
Fig 4. Diurnal variation of CH4 upon time after feeding
0 2 4 6 8 1 0 1 2 1 4 1 6
0 .0 0
0 .0 5
0 .1 0
0 .1 5
0 .2 02 % B W
T im e a fte r fe e d in g (h )
Me
tha
ne
em
iss
ion
(L
/min
)
TMR
S F
Feeding
Level (% BW) TMR
1 SF
1 SEM P - value
2.4 % Methane emissions
(Exp 1) L/day 149.44 145.59 21.04 0.862
g/day 106.74 103.99 15.02 0.862
g/kg of DMI 12.24 11.60 1.37 0.660
g/kg of OMI 13.96 13.21 1.56 0.654
CH4 E, % GEI 4.20 3.99 0.47 0.656
2.0 % Methane emissions
(Exp 2) L/day 138.48 118.20 3.17 0.029
g/day 96.06 84.42 2.26 0.029
g/kg of DMI 11.28 10.29 0.11 0.011
g/kg of OMI 13.38 11.65 0.53 0.054
g/kg of DOM 20.67 20.09 0.46 0.338
CH4 E , % GEI 3.98 3.49 0.04 0.005
31
4.2. Effect of Feeding level on CH4 emission
Methane gas emissions per day and those per % GE intake are a critical
factor determining the relationship between the dairy productivity and global
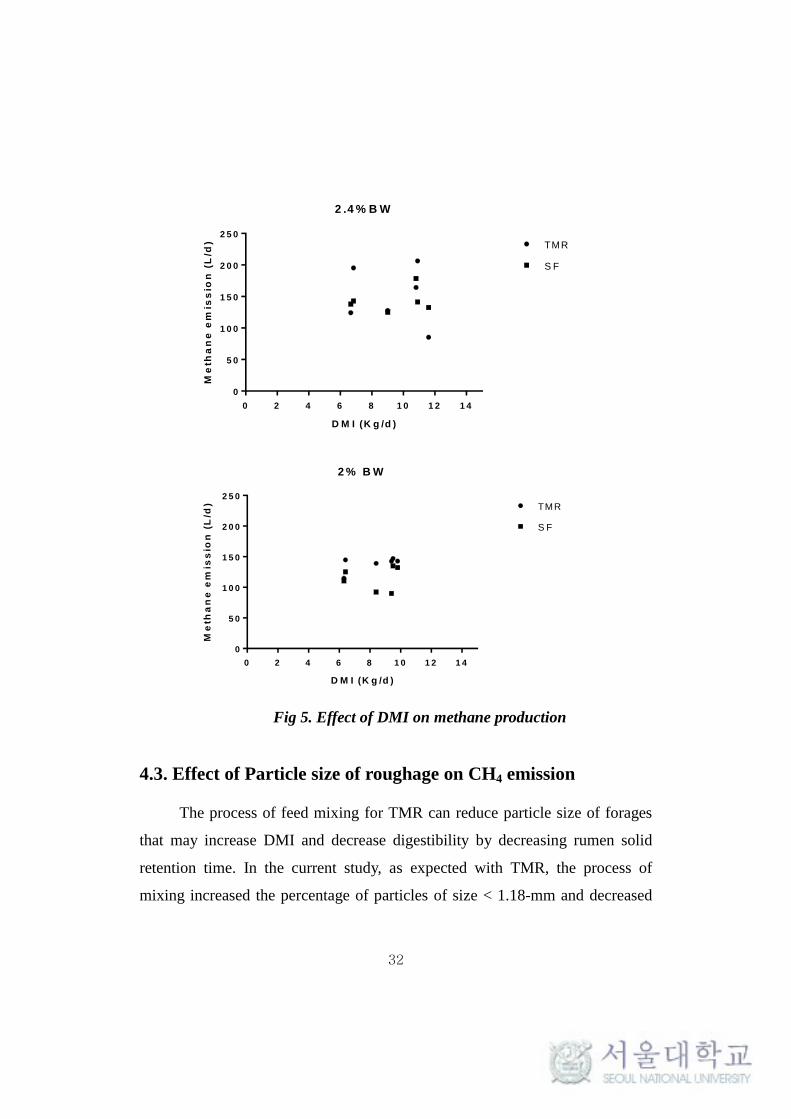
warming (Gerber et al., 2011). In the present study, irrespective of the feeding
system, CH4 emission was found to be higher for animals fed at 2.4% BW in
experiment 1 compared to animal fed at only 2.0% BW in experiment 2 (Table
4, Fig 5). It has been reported that there is a strong relationship between DMI
and enteric CH4 production per animal (Shibata et al., 2010; Charmley et al.,
2016). It indicated that increasing feeding level resulted in increased dry matter
intake (DMI) and greater intake of fermentable substrate, including both
structural and nonstructural carbohydrates (Moe and Tyrrell, 1980). However,
increasing feed intake, decreased CH4 emission rate (CH4/ Kg DMI and %
GEI) which was consistent with the observed results (Chaokaur et al., 2015;
Hammond et al., 2013, 2014). This effect on emission rate was attributed to the
decrease in digestibility of the feed at higher level of feeding which is explained
by accelerated turnover rate of feed particles out of the rumen leading to a less
residence time in rumen (Thornton and Minson, 1972; Owens and Goetsch,
1986). ARC (1980) also suggested that the decrease in emission rate was due to
the decrease in GE availability for digestion. In addition, Nicholson and Sutton
(1969) observed the same effect of decrease in digestibility of the feed coupled
with the decrease in emission rate at higher levels of feeding.
32
0 2 4 6 8 1 0 1 2 1 4
0
5 0
1 0 0
1 5 0
2 0 0
2 5 0
2 .4 % B W
D M I (K g /d )
Me
tha
ne
em
iss
ion
(L
/d) TMR
S F
0 2 4 6 8 1 0 1 2 1 4
0
5 0
1 0 0
1 5 0
2 0 0
2 5 0
2 % B W
D M I (K g /d )
Me
tha
ne
em
iss
ion
(L
/d) TMR
S F
Fig 5. Effect of DMI on methane production
4.3. Effect of Particle size of roughage on CH4 emission
The process of feed mixing for TMR can reduce particle size of forages
that may increase DMI and decrease digestibility by decreasing rumen solid
retention time. In the current study, as expected with TMR, the process of
mixing increased the percentage of particles of size < 1.18-mm and decreased
33
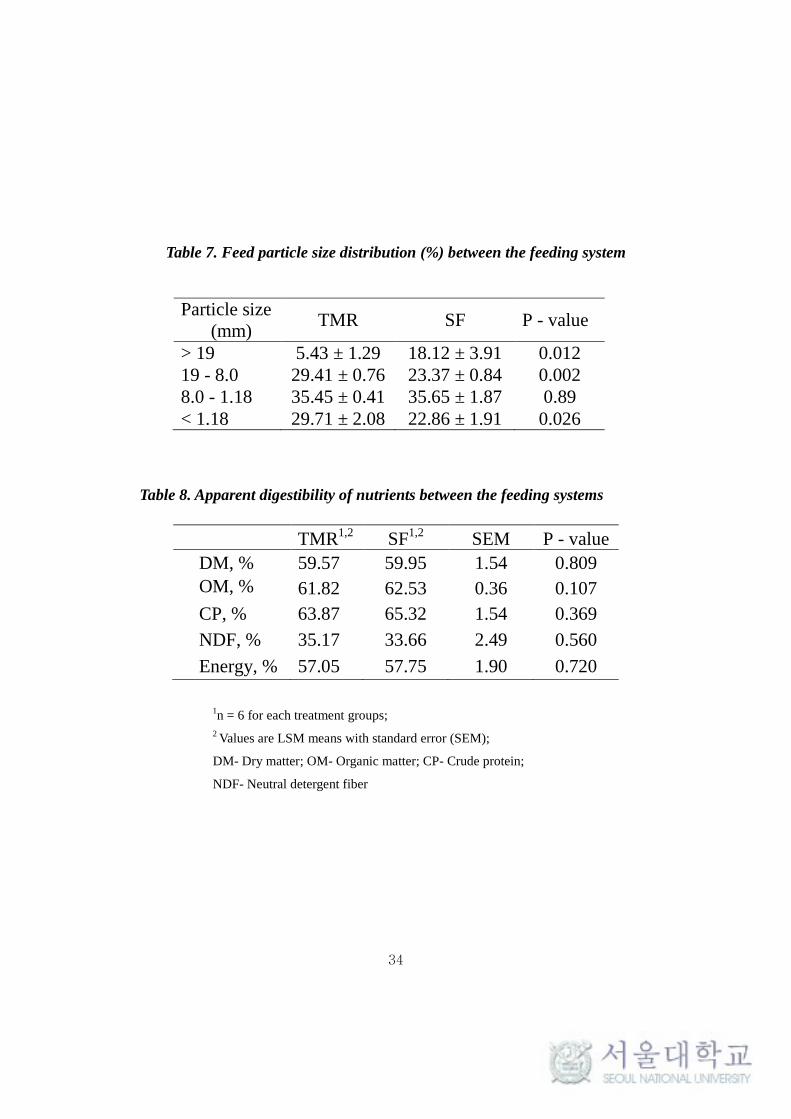
the percentages of particles of size > 19-mm. According to the survey by
Heinrichs et al., (1999), particle size greater than 19 mm corresponded typically
only 7.1% for TMR but 16 to 18% for various forages, which was consistent
with our observed result representing 5.4 and 18.1%, respectively (Table 7).
However, there was no difference (P > 0.05) in the total digestibility of DM,
OM, CP, NDF and intake energy between the feeding system influenced by the
different particle size (Table 8). Numerous previous studies have also shown no
significant differences in the nutrient digestibility between the two methods of
feeding (Holter et al., 1977; Yan et al., 1998; Huuskonen et al., 2014). But,
based on the reported advantages of TMR, positive ruminal fermentation
characteristics and ruminal nutrient digestibility favoring CH4 production might
be postulated. In a recent study on comparison of ruminal digestibility of TMR
and SF feeding system, Liu et al. (2016) reported that TMR feeding system had
more proportion of ruminal contents with particle size < 1.18 mm, which is the
critical size for the particle to pass the rumen (Maulfair et al., 2011). This
showed that TMR exhibited higher ruminal digestibility which was also
supported by the work of Kim et al. (2012), who observed increased
digestibility in fermented TMR. Furthermore, in a study comparing TMR and
SF system, Li et al. (2003) observed a significant increase in DM and NDF
digestibility in animals fed TMR which plays a key role in ruminal CH4
production (Blaxter and Clapperton, 1965; Takahashi , 2001) which could be
related to the difference in CH4 emission between feeding system at feeding
level of 2% BW.
34
Table 7. Feed particle size distribution (%) between the feeding system
Particle size
(mm) TMR SF P - value
> 19 5.43 ± 1.29 18.12 ± 3.91 0.012
19 - 8.0 29.41 ± 0.76 23.37 ± 0.84 0.002
8.0 - 1.18 35.45 ± 0.41 35.65 ± 1.87 0.89
< 1.18 29.71 ± 2.08 22.86 ± 1.91 0.026
Table 8. Apparent digestibility of nutrients between the feeding systems
1n = 6 for each treatment groups;
2 Values are LSM means with standard error (SEM);
DM- Dry matter; OM- Organic matter; CP- Crude protein;
NDF- Neutral detergent fiber
TMR1,2
SF1,2
SEM P - value
DM, % 59.57 59.95 1.54 0.809
OM, % 61.82 62.53 0.36 0.107
CP, % 63.87 65.32 1.54 0.369
NDF, % 35.17 33.66 2.49 0.560
Energy, % 57.05 57.75 1.90 0.720
35
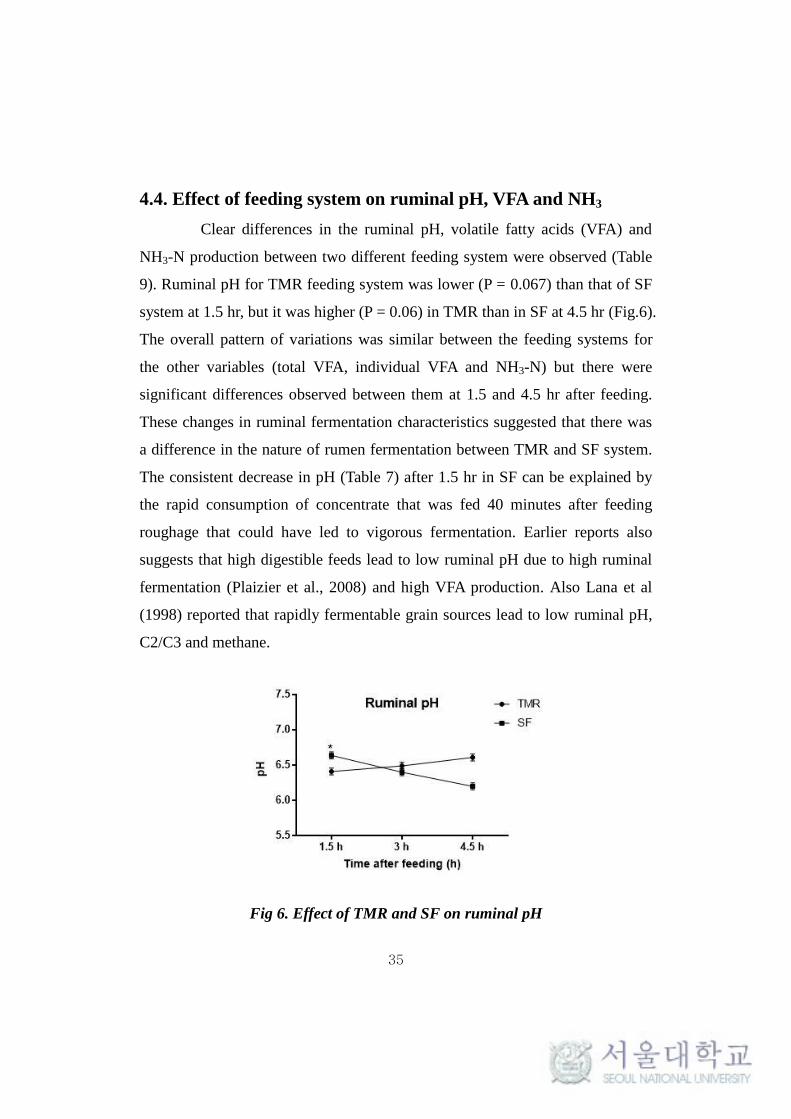
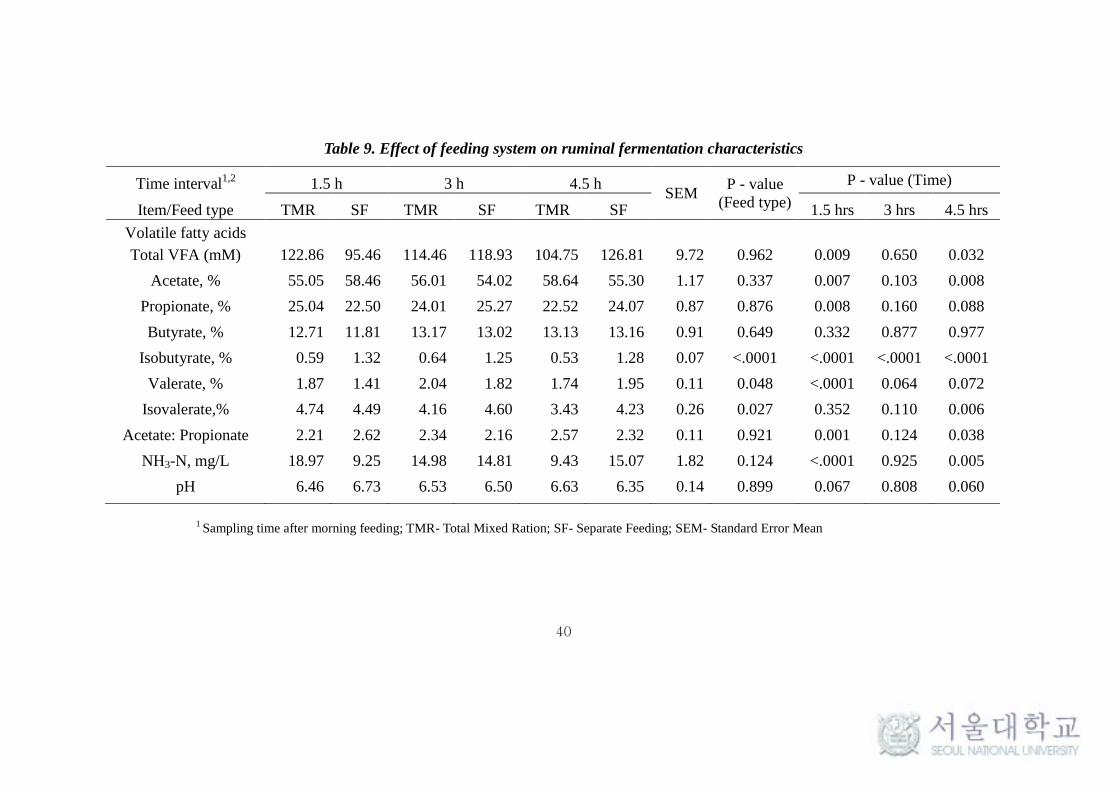
4.4. Effect of feeding system on ruminal pH, VFA and NH3
Clear differences in the ruminal pH, volatile fatty acids (VFA) and
NH3-N production between two different feeding system were observed (Table
9). Ruminal pH for TMR feeding system was lower (P = 0.067) than that of SF
system at 1.5 hr, but it was higher (P = 0.06) in TMR than in SF at 4.5 hr (Fig.6).
The overall pattern of variations was similar between the feeding systems for
the other variables (total VFA, individual VFA and NH3-N) but there were
significant differences observed between them at 1.5 and 4.5 hr after feeding.
These changes in ruminal fermentation characteristics suggested that there was
a difference in the nature of rumen fermentation between TMR and SF system.
The consistent decrease in pH (Table 7) after 1.5 hr in SF can be explained by
the rapid consumption of concentrate that was fed 40 minutes after feeding
roughage that could have led to vigorous fermentation. Earlier reports also
suggests that high digestible feeds lead to low ruminal pH due to high ruminal
fermentation (Plaizier et al., 2008) and high VFA production. Also Lana et al
(1998) reported that rapidly fermentable grain sources lead to low ruminal pH,
C2/C3 and methane.
Fig 6. Effect of TMR and SF on ruminal pH
36
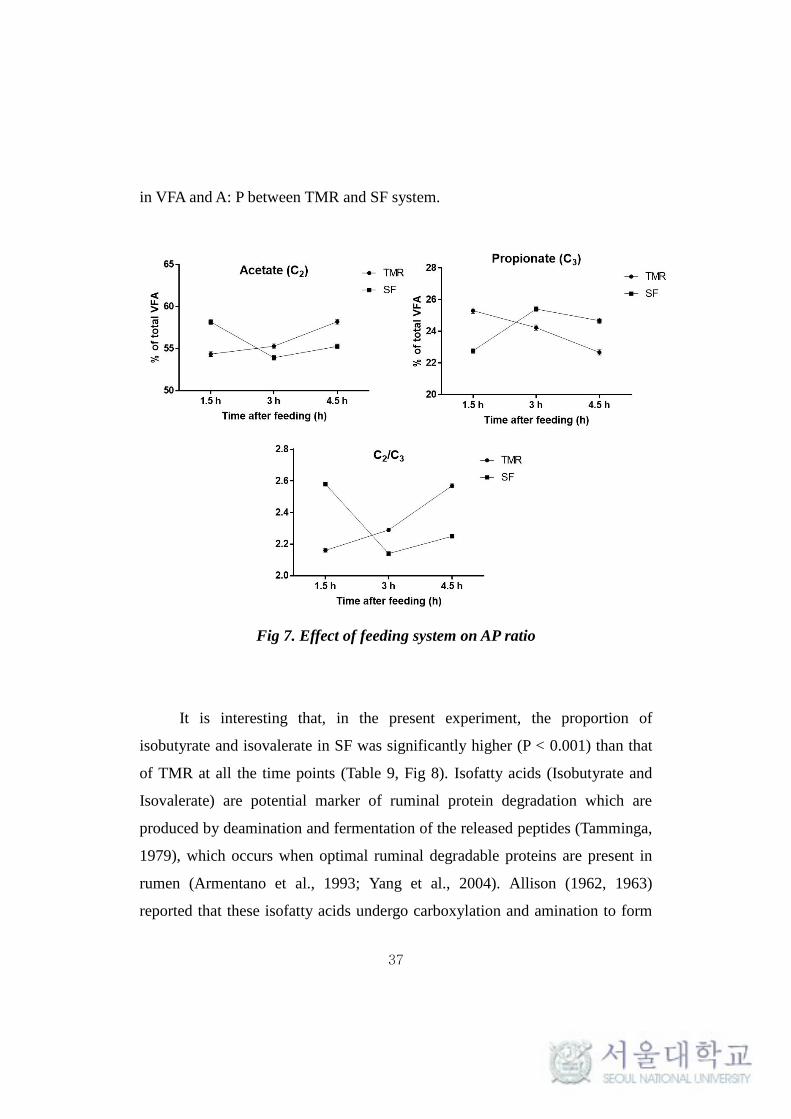
The proportion of acetate in total VFA in SF system was higher (P <
0.05) than in TMR system at 1.5 hr but it was found to be low (P < 0.05) in SF
than TMR at 4.5hr. In contrast, the proportion of propionate was found to be
lower (P < 0.05) in SF than in TMR at 1.5hr but it was observed to be high (P <
0.05 in SF than in TMR at 4.5 hr. Therefore, there was a significant (P < 0.05)
decrease in A: P ratio observed after 3 hr in the SF feeding system compared
with TMR feeding system (Table 9, Fig 7). However, the butyrate concentration
remained at lower levels for SF at 1.5 hr and was not found to vary between
feeding systems upon time. Synthesis of these short chain fatty acids (SCFA) in
the rumen influence the production of CH4. Moss et al., 2000 reported that
production of acetate from pyruvate is accompanied with production of H2
whereas butyrate and propionate production utilizes H2 which is the major
substrate for methanogenesis. The decrease in CH4 by SF system might be due
to a shift in metabolic H2 sink towards the production of propionate, whereas
the increase in CH4 in TMR system might be due to increase in acetate from
cellulose digestion (Fuller, 2004). The diurnal variation of CH4 reflects this inter
relation between VFA and CH4 at different time points. The observed increased
level of acetate and propionate at 4.5 hrs in TMR and SF respectively, correlates
with their respective increase and decrease in CH4 emission at 4.5 hr (Fig 4).
This was also supported by the work of Li et al. (2003), who observed increase
in xylanase activity in TMR feeding system, which is the most active fibrolytic
enzyme, as well as increase in protozoal population which is also involved in
fiber digestion (Bonhomme,1990; Williams and Coleman, 1991) and CH4
production (Morgavi et al., 2012). These results suggested that TMR feeding
system might have created a favorable rumen environment for CH4 production.
However, increased VFA production and decreased A: P for TMR in their study
contradicted with our report. Whereas, Liu et al. (2016) observed no difference
37
in VFA and A: P between TMR and SF system.
Fig 7. Effect of feeding system on AP ratio
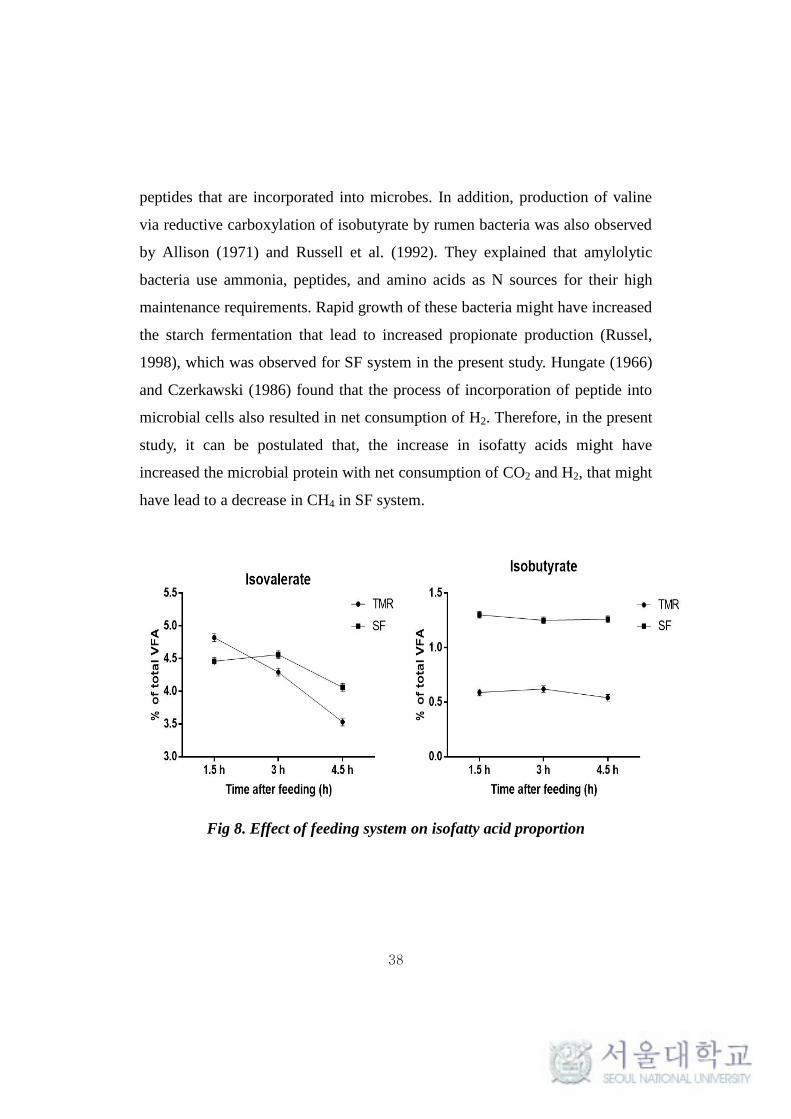
It is interesting that, in the present experiment, the proportion of
isobutyrate and isovalerate in SF was significantly higher (P < 0.001) than that
of TMR at all the time points (Table 9, Fig 8). Isofatty acids (Isobutyrate and
Isovalerate) are potential marker of ruminal protein degradation which are
produced by deamination and fermentation of the released peptides (Tamminga,
1979), which occurs when optimal ruminal degradable proteins are present in
rumen (Armentano et al., 1993; Yang et al., 2004). Allison (1962, 1963)
reported that these isofatty acids undergo carboxylation and amination to form
38
peptides that are incorporated into microbes. In addition, production of valine
via reductive carboxylation of isobutyrate by rumen bacteria was also observed
by Allison (1971) and Russell et al. (1992). They explained that amylolytic
bacteria use ammonia, peptides, and amino acids as N sources for their high
maintenance requirements. Rapid growth of these bacteria might have increased
the starch fermentation that lead to increased propionate production (Russel,
1998), which was observed for SF system in the present study. Hungate (1966)
and Czerkawski (1986) found that the process of incorporation of peptide into
microbial cells also resulted in net consumption of H2. Therefore, in the present
study, it can be postulated that, the increase in isofatty acids might have
increased the microbial protein with net consumption of CO2 and H2, that might
have lead to a decrease in CH4 in SF system.
Fig 8. Effect of feeding system on isofatty acid proportion
39
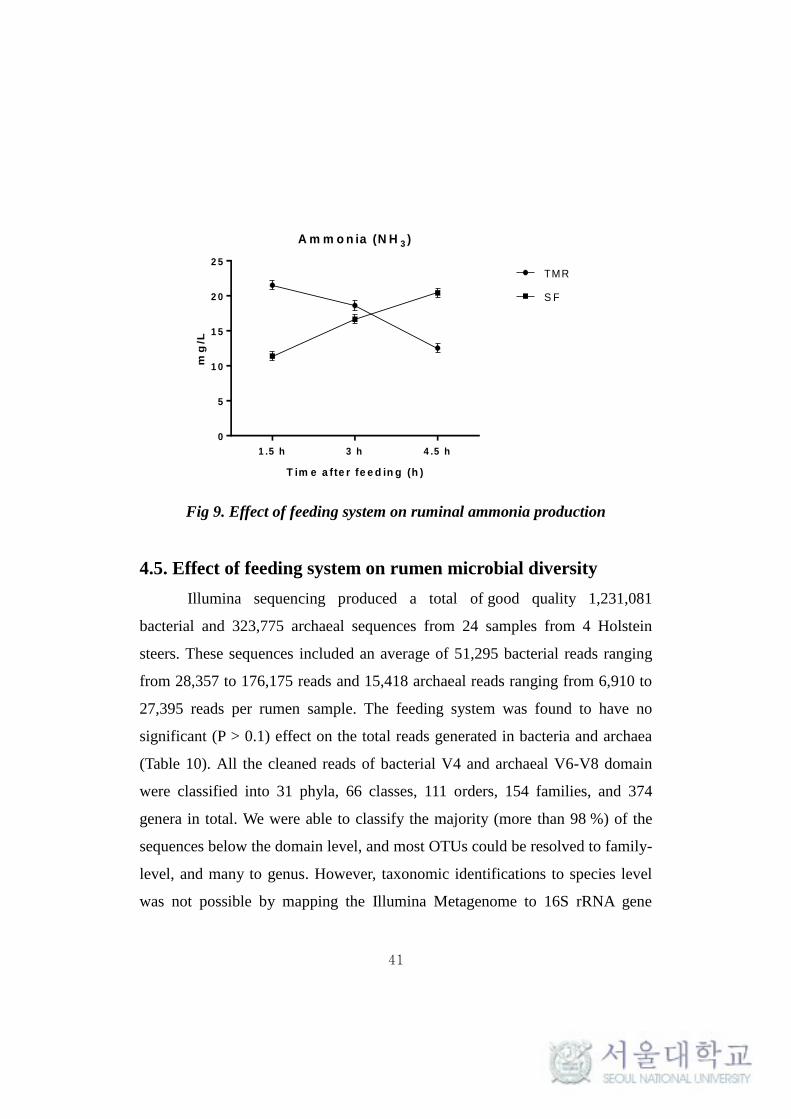
The concentration of NH3-N was found to gradually increase in SF
system and was significantly (P = 0.005) higher than TMR at 4.5 hrs after
feeding (Table 9, Fig 9). The production of NH3-N in rumen is also another
potential indicator of feed protein degradation which favors microbial protein
synthesis (Bach et al., 2005). The observed increase in NH3-N in SF system
might be related to the increase in digestibility of concentrate rich in protein
(Erdman et al., 1986). Liu et al. (2016) observed a similar pattern of increased
NH3-N in SF system, whereas Li et al. (2003) observed a contrasting result.
However, these contradictions might be due to the variation in protein content
of the feed. There were also reports suggesting that increase in ruminal crude
protein digestibility decreases CH4 production (Demeyer and Van Nevel, 1979;
Kirchgessner et al., 1994; Cone and van Gelder, 1999). From the work of Patra
et al. (2013), the reason for decrease in CH4 could be attributed to the formation
of (NH4) HCO3, where, NH3 as the result of rumen protein degradation could be
expected to combine with CO2 and H2, the substrate for CH4 production,
resulting in its lower production. Further, Mitsumori and Sun (2008) stated that
formation of NH3 in rumen was a result of nitrate reduction that consumed
4[2H] per mole of nitrate. As mentioned above, the increasing trend of NH3
production in SF after feeding suggested an increase in consumption of H2
leading to decrease in CH4. However, it is recognized that no further
explanation can be given since the researches on effect of mixed and separate
feeding system on rumen fermentation are limited.
40
Table 9. Effect of feeding system on ruminal fermentation characteristics
Time interval1,2
1.5 h 3 h 4.5 h SEM
P - value
(Feed type)
P - value (Time)
Item/Feed type TMR SF TMR SF TMR SF 1.5 hrs 3 hrs 4.5 hrs
Volatile fatty acids
Total VFA (mM) 122.86 95.46 114.46 118.93 104.75 126.81 9.72 0.962 0.009 0.650 0.032
Acetate, % 55.05 58.46 56.01 54.02 58.64 55.30 1.17 0.337 0.007 0.103 0.008
Propionate, % 25.04 22.50 24.01 25.27 22.52 24.07 0.87 0.876 0.008 0.160 0.088
Butyrate, % 12.71 11.81 13.17 13.02 13.13 13.16 0.91 0.649 0.332 0.877 0.977
Isobutyrate, % 0.59 1.32 0.64 1.25 0.53 1.28 0.07 <.0001 <.0001 <.0001 <.0001
Valerate, % 1.87 1.41 2.04 1.82 1.74 1.95 0.11 0.048 <.0001 0.064 0.072
Isovalerate,% 4.74 4.49 4.16 4.60 3.43 4.23 0.26 0.027 0.352 0.110 0.006
Acetate: Propionate 2.21 2.62 2.34 2.16 2.57 2.32 0.11 0.921 0.001 0.124 0.038
NH3-N, mg/L 18.97 9.25 14.98 14.81 9.43 15.07 1.82 0.124 <.0001 0.925 0.005
pH 6.46 6.73 6.53 6.50 6.63 6.35 0.14 0.899 0.067 0.808 0.060
1 Sampling time after morning feeding; TMR- Total Mixed Ration; SF- Separate Feeding; SEM- Standard Error Mean
41
1 .5 h 3 h 4 .5 h
0
5
1 0
1 5
2 0
2 5
A m m o n ia (N H 3 )
T im e a fte r fe e d in g (h )
mg
/L
TMR
S F
Fig 9. Effect of feeding system on ruminal ammonia production
4.5. Effect of feeding system on rumen microbial diversity
Illumina sequencing produced a total of good quality 1,231,081
bacterial and 323,775 archaeal sequences from 24 samples from 4 Holstein
steers. These sequences included an average of 51,295 bacterial reads ranging
from 28,357 to 176,175 reads and 15,418 archaeal reads ranging from 6,910 to
27,395 reads per rumen sample. The feeding system was found to have no
significant (P > 0.1) effect on the total reads generated in bacteria and archaea
(Table 10). All the cleaned reads of bacterial V4 and archaeal V6-V8 domain
were classified into 31 phyla, 66 classes, 111 orders, 154 families, and 374
genera in total. We were able to classify the majority (more than 98 %) of the
sequences below the domain level, and most OTUs could be resolved to family-
level, and many to genus. However, taxonomic identifications to species level
was not possible by mapping the Illumina Metagenome to 16S rRNA gene
42
references.
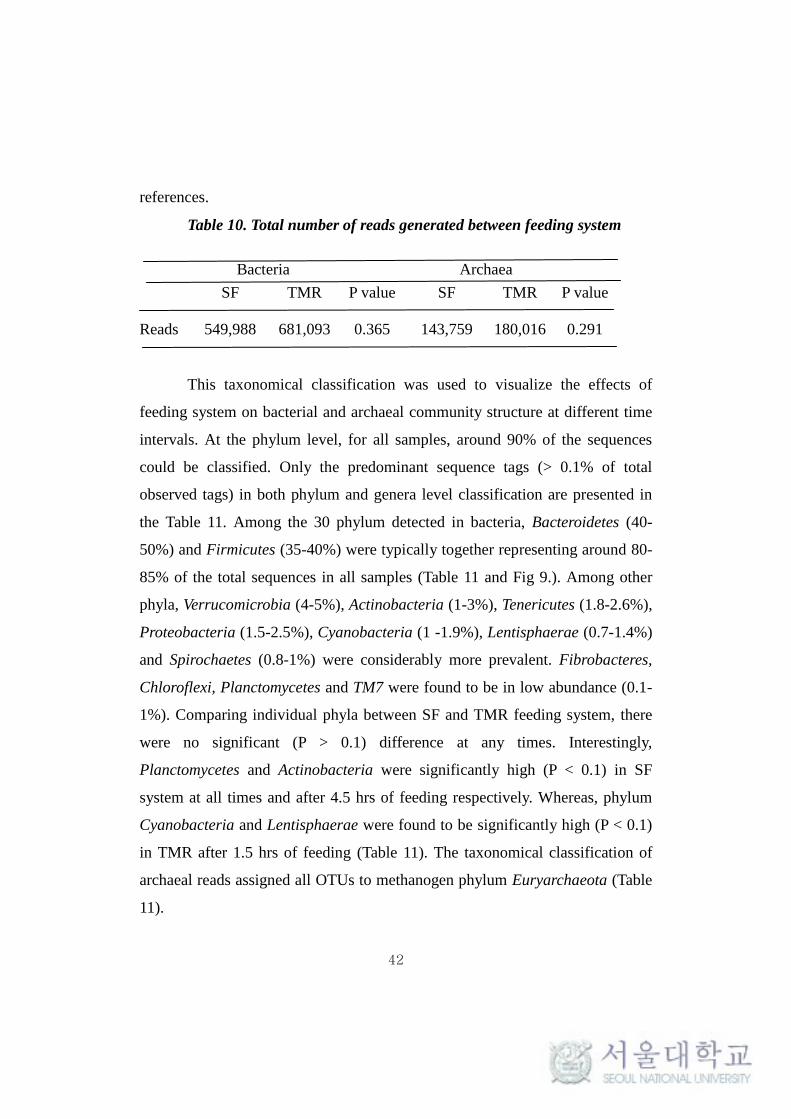
Table 10. Total number of reads generated between feeding system
This taxonomical classification was used to visualize the effects of
feeding system on bacterial and archaeal community structure at different time
intervals. At the phylum level, for all samples, around 90% of the sequences
could be classified. Only the predominant sequence tags (> 0.1% of total
observed tags) in both phylum and genera level classification are presented in
the Table 11. Among the 30 phylum detected in bacteria, Bacteroidetes (40-
50%) and Firmicutes (35-40%) were typically together representing around 80-
85% of the total sequences in all samples (Table 11 and Fig 9.). Among other
phyla, Verrucomicrobia (4-5%), Actinobacteria (1-3%), Tenericutes (1.8-2.6%),
Proteobacteria (1.5-2.5%), Cyanobacteria (1 -1.9%), Lentisphaerae (0.7-1.4%)
and Spirochaetes (0.8-1%) were considerably more prevalent. Fibrobacteres,
Chloroflexi, Planctomycetes and TM7 were found to be in low abundance (0.1-
1%). Comparing individual phyla between SF and TMR feeding system, there
were no significant (P > 0.1) difference at any times. Interestingly,
Planctomycetes and Actinobacteria were significantly high (P < 0.1) in SF
system at all times and after 4.5 hrs of feeding respectively. Whereas, phylum
Cyanobacteria and Lentisphaerae were found to be significantly high (P < 0.1)
in TMR after 1.5 hrs of feeding (Table 11). The taxonomical classification of
archaeal reads assigned all OTUs to methanogen phylum Euryarchaeota (Table
11).
Bacteria
Archaea
SF TMR P value SF TMR P value
Reads 549,988 681,093 0.365 143,759 180,016 0.291
43
At genus level, the more predominant population (> 0.5%) in the
Bacteroidetes phylum belonged to Prevotella (18-27%), Bacteroides (0.9-1.5%),
CF231 (0.6-0.9%) and YRC22 (0.3-0.9%). A number of taxa were not classified
to the genus level, but were present in great abundance. That includes Family
BS11 (2.7-4.7%), Family S24-7 (1.9-3.5%) and order Bacteroidales (9.5-13.7%)
(Fig 11a). Among the Bacteroidetes phylum, Parabacteroides was found to be
significantly high (P < 0.1) in SF system (Table 11). Among the Firmicutes,
Ruminococcus (2.4-3.9%), Butyrivibrio (1.15-3.38%), Lactobacillus (0.97-
2.19%), Oscillospira (0.51-0.68%), Streptococcus (0.38-1.03%),
Succiniclasticum (0.23-0.95%) and Leuconostoc (0.28-0.57%) were observed to
be in high abundance (> 0.5%). Several abundances within the order of
Clostridiales (7.95-10.45%), Family Ruminococcaceae (7.56-9.38%),
Lachnospiraceae (3.17-4.16%) and Christensenellaceae (0.86-1.63%) were
also prevalent (Fig 11a). More interestingly, Leuconostoc and RFN-20 were
found to be significantly high (P < 0.1) in TMR feeding system. On the other
hand, Coprococcus was found to be significantly high (P <0.005) in SF. SMB-
53 and Anaerovibrio were found to be high (P < 0.5) in TMR at 1.5h and 4.5h
respectively after feeding (Table 11). In addition, Desulfovibrio
(Proteobacteria) (0.54-0.75%) and Treponema (Spirochaetes) (0.8-1%) were
also found to be predominantly high in both the feeding system. In archaea, the
phylum Euryarchaeota majorly constituted of genera Methanobrevibacter
(85.77-90.96%), Methanosphaera (5.59-10.63%) and VadinCA11 (0.3-5.11%)
(Fig 11b). The methanogen population was not found to vary significantly (P >
0.1) between the feeding system.
As witnessed by the change in ruminal ferementation characteristics
between the feeding system, the results clearly suggested that there was a
microbial shift in the rumen influenced by different feeding system that was
44
further studied through the rumen microbiome analysis between the feeding
system. The concept of the microbiome (microbes, their genes and interactions
with the host/habitat) is currently being evaluated in many aspects of biological
science, and studies over the past decade have been dramatically advanced by
Next Generation Sequencing (NGS) technology (Morgavi et al., 2013;
Chaucheyras-Durand and Ossa, 2014). Bacteroidetes and Firmicutes were the
most abundant phylum in the present study, irrespective of the feeding system
and the results were found to be similar to that of several other studies (Jami
and Mizrahi, 2012; Petri et al., 2013; Kim and Yu, 2014). Although there were
no significant (P > 0.1) differences noted in the population of these phylum
between the feeding system, the ratio of abundances between Bacteroidetes and
Firmicutes were different between the feeding system. In SF system, the ratio
was found to be the same at different time intervals. On the other hand, the ratio
was found to vary at all observed times for cattle fed TMR (Table 11, Fig 10) .
This ratio has been shown to affect energy harvesting and were correlated with
increase of muscle fat (Jami et al., 2014) and alter productivity, which might
have an impact on CH4 production. It has also been reported that cattle with
naturally high and low feed conversion efficiency vary considerably in the
amounts of CH4 produced (Nkrumah et al., 2006). It is clear that the feeding
system plays an important role in the ratio of Firmicutes to Bacteroidetes.
While we do not know the implications of the ratio shift, the change in ratio of
Firmicutes to Bacteroidetes in stool samples has been associated with increases
in weight gain in humans (Ley et al., 2006). Further, Erbilgin et al. (2014)
provided evidence by a metabolic activity screen that Bacterial
Microcompartments (BMCs) present in Planctomycetes are involved in the
degradation of a number of plant cell wall sugars, namely L-fucose and L-
rhamnose. So, it is reasonable to find this phylum in rumen. Earlier study by
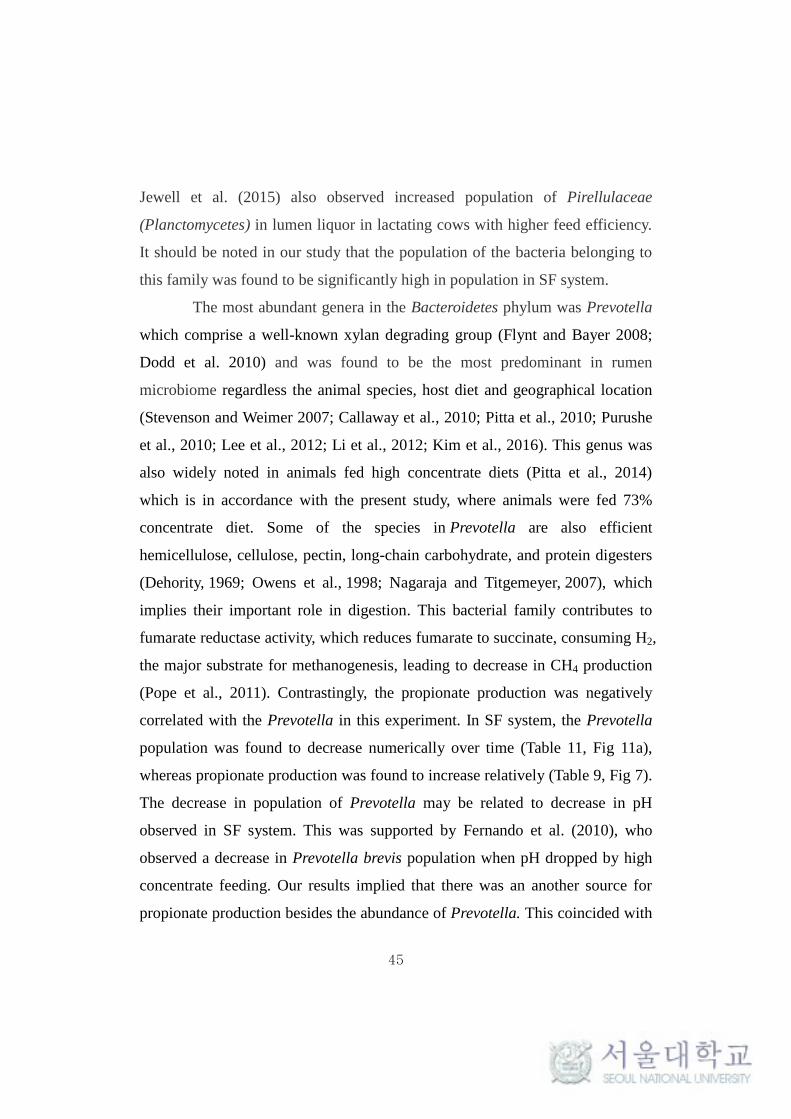
45
Jewell et al. (2015) also observed increased population of Pirellulaceae
(Planctomycetes) in lumen liquor in lactating cows with higher feed efficiency.
It should be noted in our study that the population of the bacteria belonging to
this family was found to be significantly high in population in SF system.
The most abundant genera in the Bacteroidetes phylum was Prevotella
which comprise a well-known xylan degrading group (Flynt and Bayer 2008;
Dodd et al. 2010) and was found to be the most predominant in rumen
microbiome regardless the animal species, host diet and geographical location
(Stevenson and Weimer 2007; Callaway et al., 2010; Pitta et al., 2010; Purushe
et al., 2010; Lee et al., 2012; Li et al., 2012; Kim et al., 2016). This genus was
also widely noted in animals fed high concentrate diets (Pitta et al., 2014)
which is in accordance with the present study, where animals were fed 73%
concentrate diet. Some of the species in Prevotella are also efficient
hemicellulose, cellulose, pectin, long-chain carbohydrate, and protein digesters
(Dehority, 1969; Owens et al., 1998; Nagaraja and Titgemeyer, 2007), which
implies their important role in digestion. This bacterial family contributes to
fumarate reductase activity, which reduces fumarate to succinate, consuming H2,
the major substrate for methanogenesis, leading to decrease in CH4 production
(Pope et al., 2011). Contrastingly, the propionate production was negatively
correlated with the Prevotella in this experiment. In SF system, the Prevotella
population was found to decrease numerically over time (Table 11, Fig 11a),
whereas propionate production was found to increase relatively (Table 9, Fig 7).
The decrease in population of Prevotella may be related to decrease in pH
observed in SF system. This was supported by Fernando et al. (2010), who
observed a decrease in Prevotella brevis population when pH dropped by high
concentrate feeding. Our results implied that there was an another source for
propionate production besides the abundance of Prevotella. This coincided with
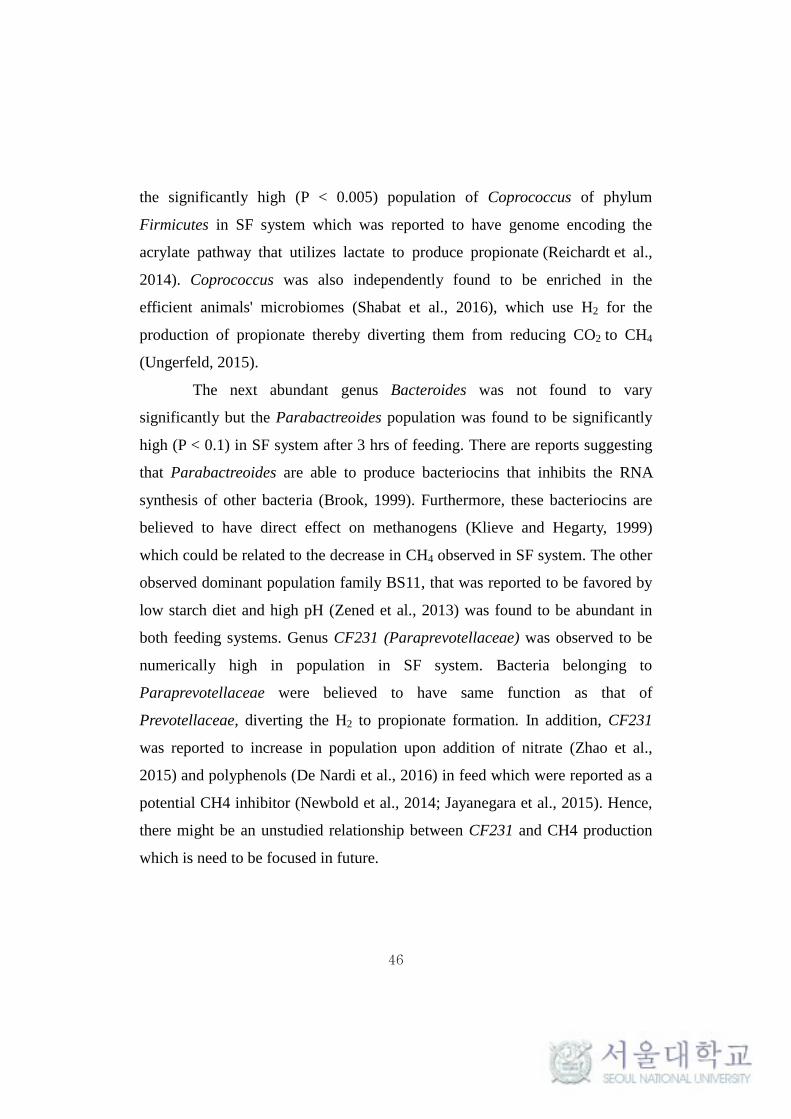
46
the significantly high (P < 0.005) population of Coprococcus of phylum
Firmicutes in SF system which was reported to have genome encoding the
acrylate pathway that utilizes lactate to produce propionate (Reichardt et al.,
2014). Coprococcus was also independently found to be enriched in the
efficient animals' microbiomes (Shabat et al., 2016), which use H2 for the
production of propionate thereby diverting them from reducing CO2 to CH4
(Ungerfeld, 2015).
The next abundant genus Bacteroides was not found to vary
significantly but the Parabactreoides population was found to be significantly
high (P < 0.1) in SF system after 3 hrs of feeding. There are reports suggesting
that Parabactreoides are able to produce bacteriocins that inhibits the RNA
synthesis of other bacteria (Brook, 1999). Furthermore, these bacteriocins are
believed to have direct effect on methanogens (Klieve and Hegarty, 1999)
which could be related to the decrease in CH4 observed in SF system. The other
observed dominant population family BS11, that was reported to be favored by
low starch diet and high pH (Zened et al., 2013) was found to be abundant in
both feeding systems. Genus CF231 (Paraprevotellaceae) was observed to be
numerically high in population in SF system. Bacteria belonging to
Paraprevotellaceae were believed to have same function as that of
Prevotellaceae, diverting the H2 to propionate formation. In addition, CF231
was reported to increase in population upon addition of nitrate (Zhao et al.,
2015) and polyphenols (De Nardi et al., 2016) in feed which were reported as a
potential CH4 inhibitor (Newbold et al., 2014; Jayanegara et al., 2015). Hence,
there might be an unstudied relationship between CF231 and CH4 production
which is need to be focused in future.
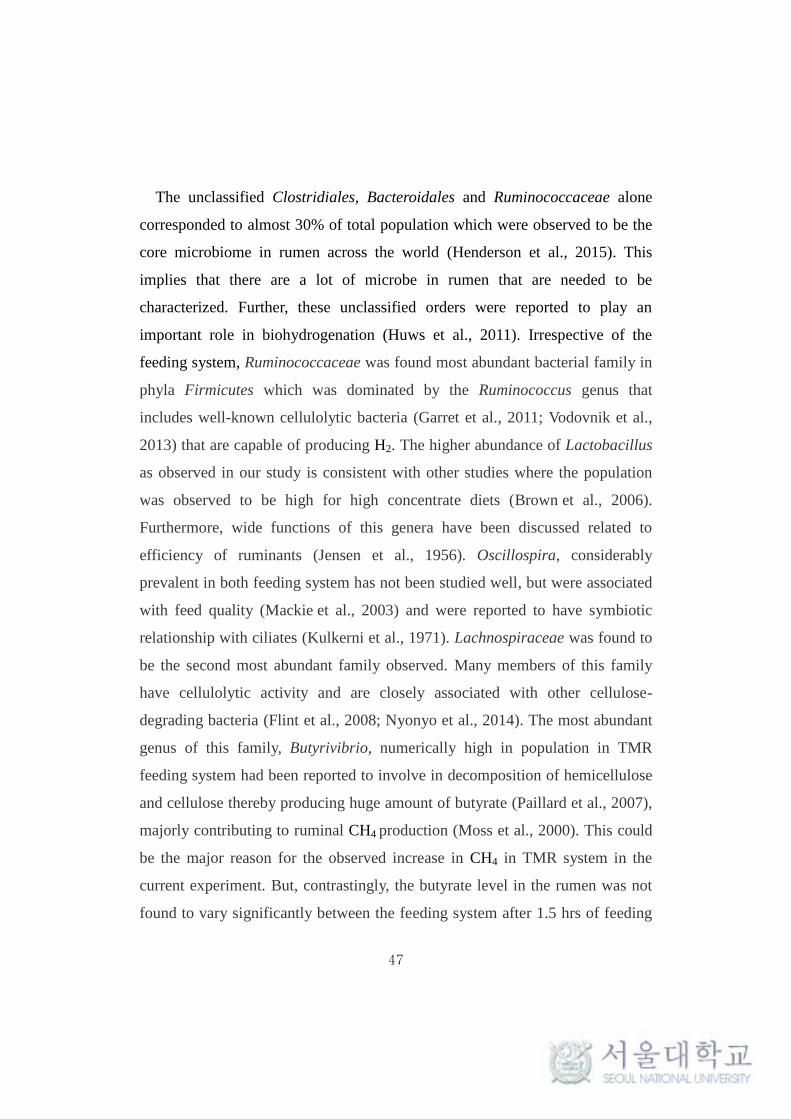
47
The unclassified Clostridiales, Bacteroidales and Ruminococcaceae alone
corresponded to almost 30% of total population which were observed to be the
core microbiome in rumen across the world (Henderson et al., 2015). This
implies that there are a lot of microbe in rumen that are needed to be
characterized. Further, these unclassified orders were reported to play an
important role in biohydrogenation (Huws et al., 2011). Irrespective of the
feeding system, Ruminococcaceae was found most abundant bacterial family in
phyla Firmicutes which was dominated by the Ruminococcus genus that
includes well-known cellulolytic bacteria (Garret et al., 2011; Vodovnik et al.,
2013) that are capable of producing H2. The higher abundance of Lactobacillus
as observed in our study is consistent with other studies where the population
was observed to be high for high concentrate diets (Brown et al., 2006).
Furthermore, wide functions of this genera have been discussed related to
efficiency of ruminants (Jensen et al., 1956). Oscillospira, considerably
prevalent in both feeding system has not been studied well, but were associated
with feed quality (Mackie et al., 2003) and were reported to have symbiotic
relationship with ciliates (Kulkerni et al., 1971). Lachnospiraceae was found to
be the second most abundant family observed. Many members of this family
have cellulolytic activity and are closely associated with other cellulose-
degrading bacteria (Flint et al., 2008; Nyonyo et al., 2014). The most abundant
genus of this family, Butyrivibrio, numerically high in population in TMR
feeding system had been reported to involve in decomposition of hemicellulose
and cellulose thereby producing huge amount of butyrate (Paillard et al., 2007),
majorly contributing to ruminal CH4 production (Moss et al., 2000). This could
be the major reason for the observed increase in CH4 in TMR system in the
current experiment. But, contrastingly, the butyrate level in the rumen was not
found to vary significantly between the feeding system after 1.5 hrs of feeding
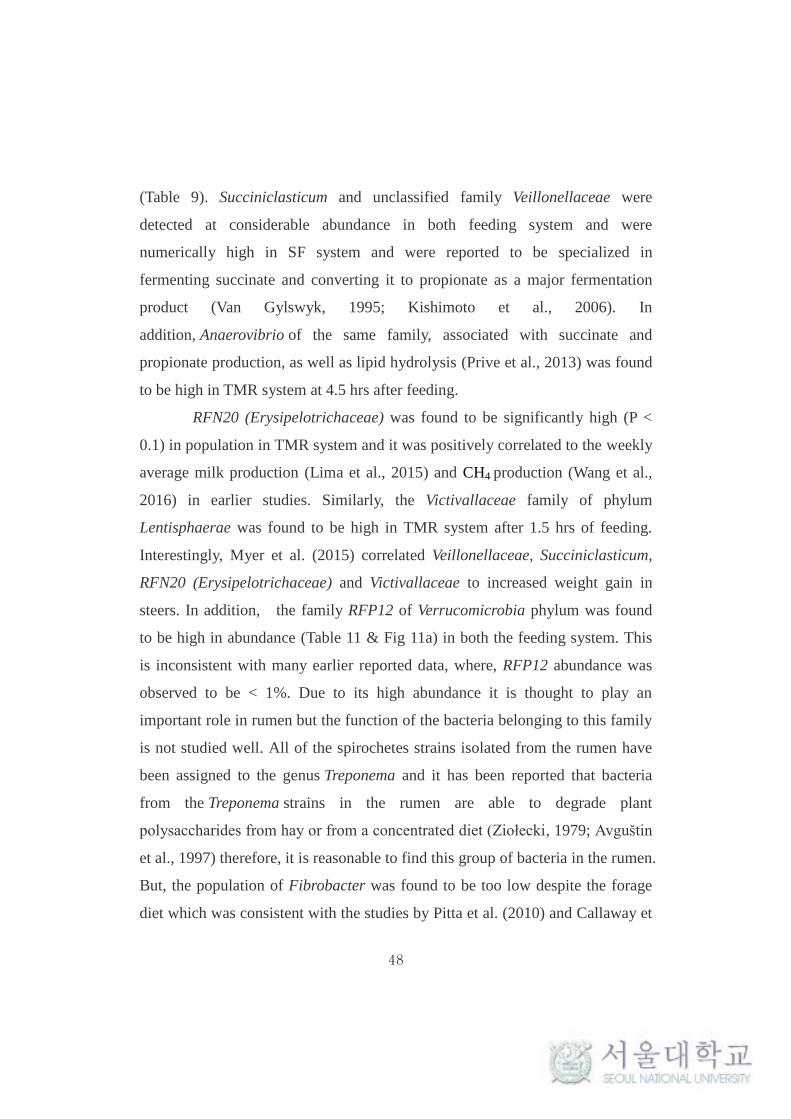
48
(Table 9). Succiniclasticum and unclassified family Veillonellaceae were
detected at considerable abundance in both feeding system and were
numerically high in SF system and were reported to be specialized in
fermenting succinate and converting it to propionate as a major fermentation
product (Van Gylswyk, 1995; Kishimoto et al., 2006). In
addition, Anaerovibrio of the same family, associated with succinate and
propionate production, as well as lipid hydrolysis (Prive et al., 2013) was found
to be high in TMR system at 4.5 hrs after feeding.
RFN20 (Erysipelotrichaceae) was found to be significantly high (P <
0.1) in population in TMR system and it was positively correlated to the weekly
average milk production (Lima et al., 2015) and CH4 production (Wang et al.,
2016) in earlier studies. Similarly, the Victivallaceae family of phylum
Lentisphaerae was found to be high in TMR system after 1.5 hrs of feeding.
Interestingly, Myer et al. (2015) correlated Veillonellaceae, Succiniclasticum,
RFN20 (Erysipelotrichaceae) and Victivallaceae to increased weight gain in
steers. In addition, the family RFP12 of Verrucomicrobia phylum was found
to be high in abundance (Table 11 & Fig 11a) in both the feeding system. This
is inconsistent with many earlier reported data, where, RFP12 abundance was
observed to be < 1%. Due to its high abundance it is thought to play an
important role in rumen but the function of the bacteria belonging to this family
is not studied well. All of the spirochetes strains isolated from the rumen have
been assigned to the genus Treponema and it has been reported that bacteria
from the Treponema strains in the rumen are able to degrade plant
polysaccharides from hay or from a concentrated diet (Ziołecki, 1979; Avguštin
et al., 1997) therefore, it is reasonable to find this group of bacteria in the rumen.
But, the population of Fibrobacter was found to be too low despite the forage
diet which was consistent with the studies by Pitta et al. (2010) and Callaway et
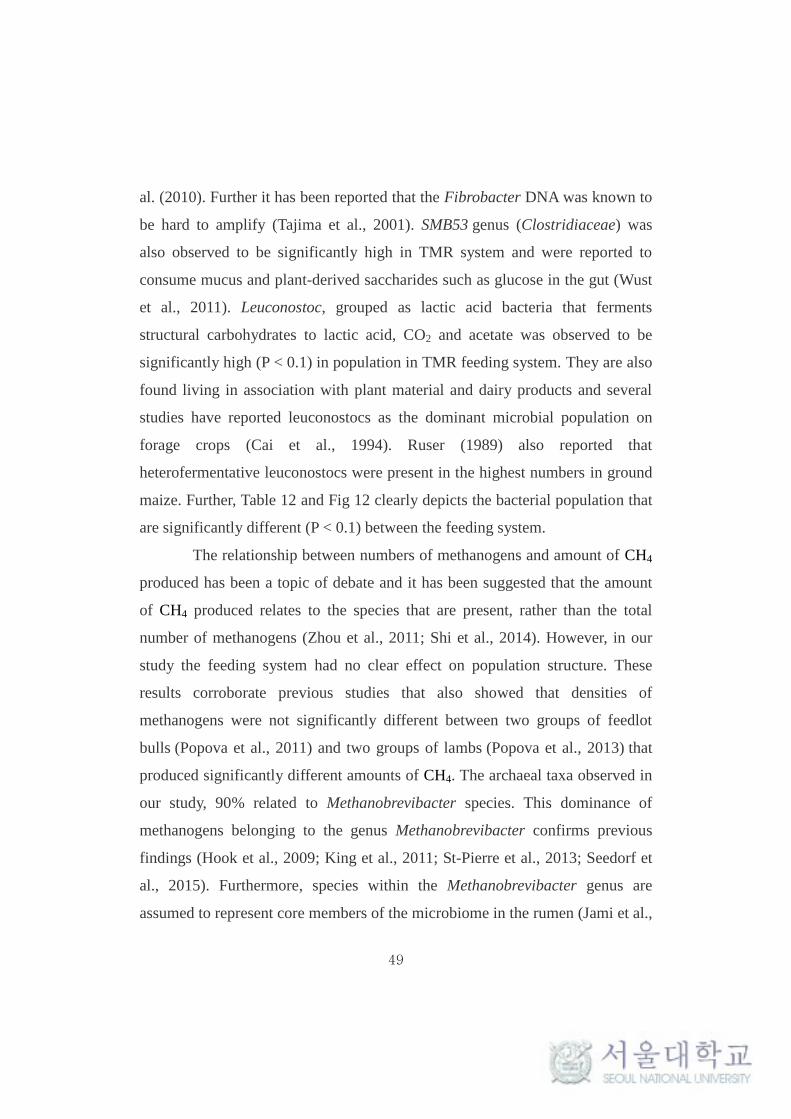
49
al. (2010). Further it has been reported that the Fibrobacter DNA was known to
be hard to amplify (Tajima et al., 2001). SMB53 genus (Clostridiaceae) was
also observed to be significantly high in TMR system and were reported to
consume mucus and plant-derived saccharides such as glucose in the gut (Wust
et al., 2011). Leuconostoc, grouped as lactic acid bacteria that ferments
structural carbohydrates to lactic acid, CO2 and acetate was observed to be
significantly high (P < 0.1) in population in TMR feeding system. They are also
found living in association with plant material and dairy products and several
studies have reported leuconostocs as the dominant microbial population on
forage crops (Cai et al., 1994). Ruser (1989) also reported that
heterofermentative leuconostocs were present in the highest numbers in ground
maize. Further, Table 12 and Fig 12 clearly depicts the bacterial population that
are significantly different (P < 0.1) between the feeding system.
The relationship between numbers of methanogens and amount of CH4
produced has been a topic of debate and it has been suggested that the amount
of CH4 produced relates to the species that are present, rather than the total
number of methanogens (Zhou et al., 2011; Shi et al., 2014). However, in our
study the feeding system had no clear effect on population structure. These
results corroborate previous studies that also showed that densities of
methanogens were not significantly different between two groups of feedlot
bulls (Popova et al., 2011) and two groups of lambs (Popova et al., 2013) that
produced significantly different amounts of CH4. The archaeal taxa observed in
our study, 90% related to Methanobrevibacter species. This dominance of
methanogens belonging to the genus Methanobrevibacter confirms previous
findings (Hook et al., 2009; King et al., 2011; St-Pierre et al., 2013; Seedorf et
al., 2015). Furthermore, species within the Methanobrevibacter genus are
assumed to represent core members of the microbiome in the rumen (Jami et al.,
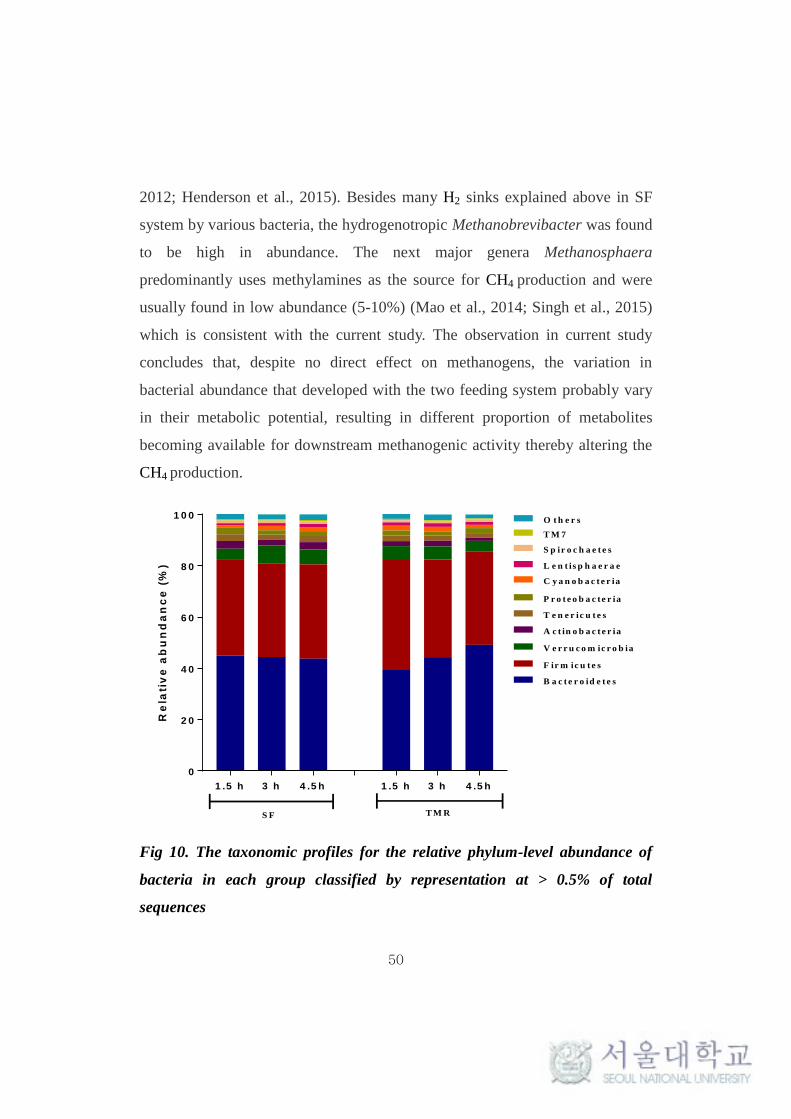
50
2012; Henderson et al., 2015). Besides many H2 sinks explained above in SF
system by various bacteria, the hydrogenotropic Methanobrevibacter was found
to be high in abundance. The next major genera Methanosphaera
predominantly uses methylamines as the source for CH4 production and were
usually found in low abundance (5-10%) (Mao et al., 2014; Singh et al., 2015)
which is consistent with the current study. The observation in current study
concludes that, despite no direct effect on methanogens, the variation in
bacterial abundance that developed with the two feeding system probably vary
in their metabolic potential, resulting in different proportion of metabolites
becoming available for downstream methanogenic activity thereby altering the
CH4 production.
1 .5 h 3 h 4 .5 h 1 .5 h 3 h 4 .5 h
0
2 0
4 0
6 0
8 0
1 0 0
Re
lati
ve
ab
un
da
nc
e (
%)
O t h e r s
T M 7
S p ir o c h a e t e s
L e n t is p h a e r a e
C y a n o b a c t e r ia
P r o t e o b a c te r ia
T e n e r ic u t e s
A c t in o b a c t e r ia
V e r r u c o m ic r o b ia
F ir m ic u t e s
B a c t e r o id e t e s
S F T M R
Fig 10. The taxonomic profiles for the relative phylum-level abundance of
bacteria in each group classified by representation at > 0.5% of total
sequences
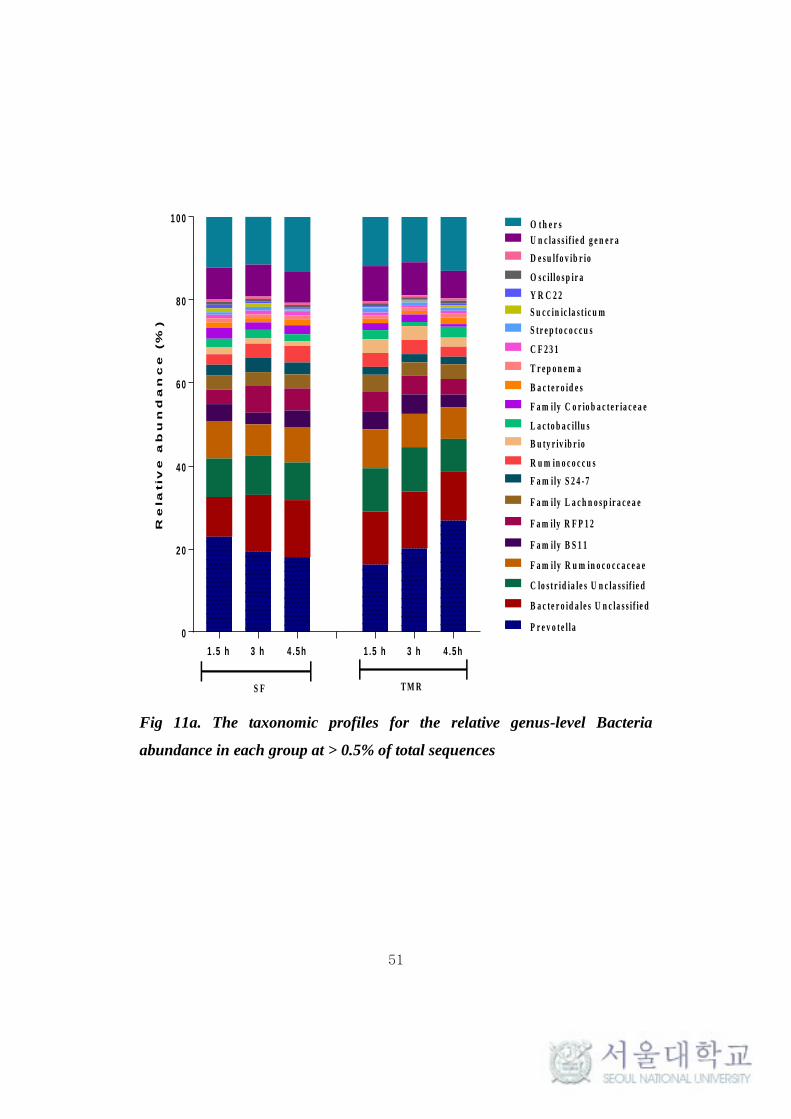
51
1 .5 h 3 h 4 .5 h 1 .5 h 3 h 4 .5 h
0
2 0
4 0
6 0
8 0
1 0 0
Re
la
tiv
e a
bu
nd
an
ce
(%
)
O t h e r s
U n c la s s i f ie d g e n e r a
D e s u l f o v ib r io
O s c i l lo s p ir a
Y R C 2 2
S u c c in ic la s t ic u m
S tr e p t o c o c c u s
C F 2 3 1
T r e p o n e m a
B a c t e r o id e s
F a m ily C o r io b a c t e r ia c e a e
L a c to b a c il lu s
B u ty r iv ib r io
R u m in o c o c c u s
F a m ily S 2 4 - 7
F a m ily L a c h n o s p ir a c e a e
F a m ily R F P 1 2
F a m ily B S 1 1
F a m ily R u m in o c o c c a c e a e
C lo s t r id ia le s U n c la s s if ie d
B a c te r o id a le s U n c la s s i f ie d
P r e v o t e l l a
S F T M R
Fig 11a. The taxonomic profiles for the relative genus-level Bacteria
abundance in each group at > 0.5% of total sequences
52
1 .5 h 3 h 4 .5 h 1 .5 h 3 h 4 .5 h
0
2 0
4 0
6 0
8 0
1 0 0
Re
la
tiv
e a
bu
nd
an
ce
(%
)
O t h e r s
M e t h a n o b a c t e r ia c e a e f a m ily
V a d in C A 1 1
M e th a n o s p h a e r a
M e t h a n o b r e v ib a c t e r
S F T M R
Fig 11b. The taxonomic profiles for the relative genus-level Archaea
abundance in each group classified by representation at > 0.5% of total
sequences.
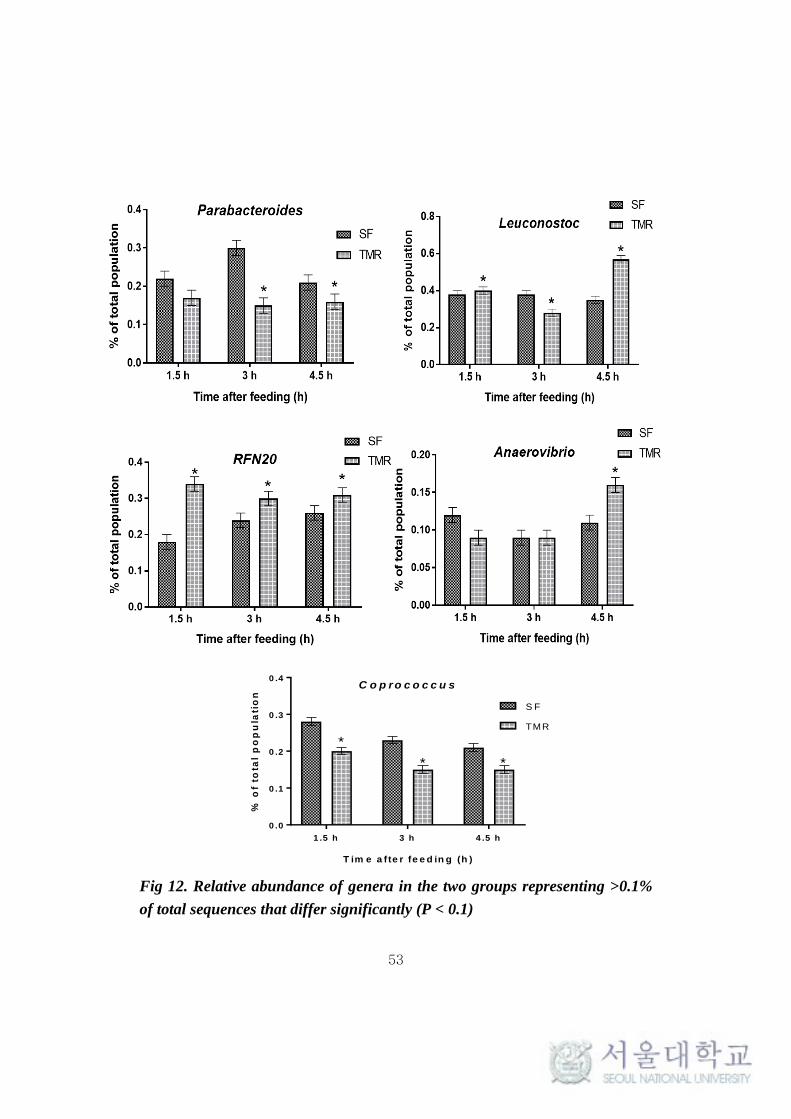
53
1 .5 h 3 h 4 .5 h
0 .0
0 .1
0 .2
0 .3
0 .4C o p r o c o c c u s
T im e a fte r fe e d in g (h )
% o
f to
tal
po
pu
lati
on
S F
TMR
* *
*
Fig 12. Relative abundance of genera in the two groups representing >0.1%
of total sequences that differ significantly (P < 0.1)
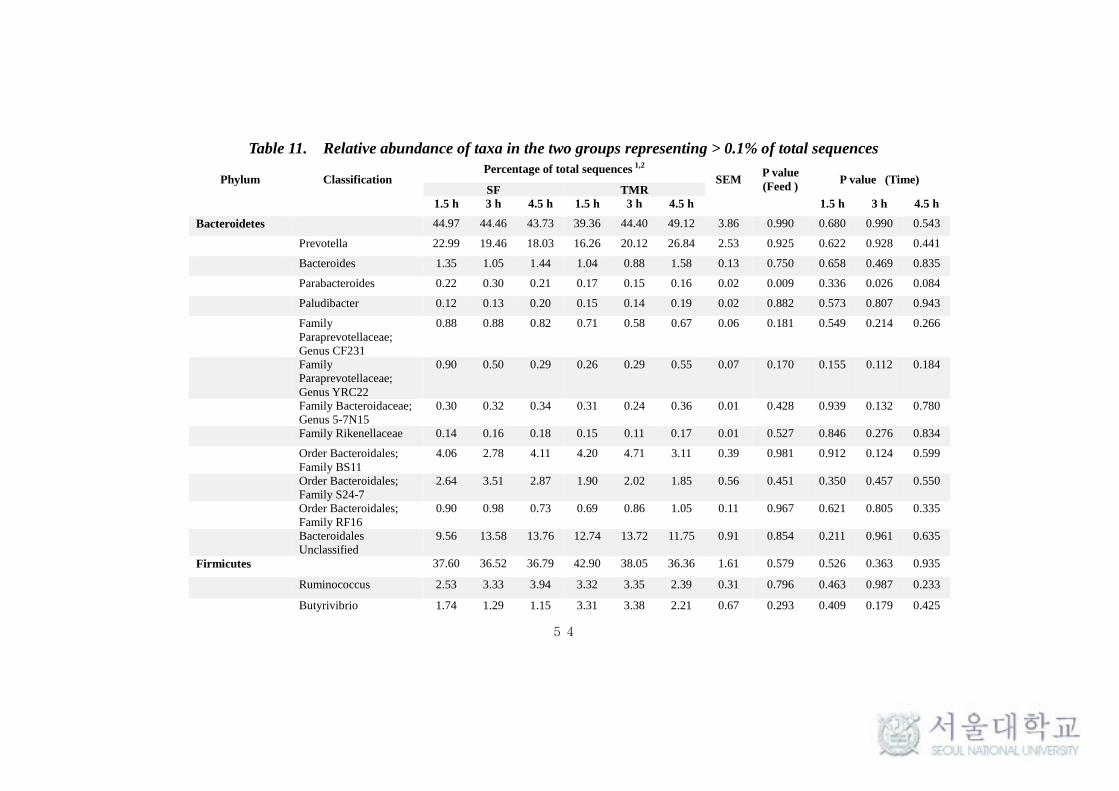
54
Table 11. Relative abundance of taxa in the two groups representing > 0.1% of total sequences
Phylum Classification Percentage of total sequences 1,2
SEM P value
(Feed ) P value (Time)
SF TMR
1.5 h 3 h 4.5 h 1.5 h 3 h 4.5 h 1.5 h 3 h 4.5 h
Bacteroidetes 44.97 44.46 43.73 39.36 44.40 49.12 3.86 0.990 0.680 0.990 0.543
Prevotella 22.99 19.46 18.03 16.26 20.12 26.84 2.53 0.925 0.622 0.928 0.441
Bacteroides 1.35 1.05 1.44 1.04 0.88 1.58 0.13 0.750 0.658 0.469 0.835
Parabacteroides 0.22 0.30 0.21 0.17 0.15 0.16 0.02 0.009 0.336 0.026 0.084
Paludibacter 0.12 0.13 0.20 0.15 0.14 0.19 0.02 0.882 0.573 0.807 0.943
Family
Paraprevotellaceae;
Genus CF231
0.88 0.88 0.82 0.71 0.58 0.67 0.06 0.181 0.549 0.214 0.266
Family
Paraprevotellaceae;
Genus YRC22
0.90 0.50 0.29 0.26 0.29 0.55 0.07 0.170 0.155 0.112 0.184
Family Bacteroidaceae;
Genus 5-7N15
0.30 0.32 0.34 0.31 0.24 0.36 0.01 0.428 0.939 0.132 0.780
Family Rikenellaceae 0.14 0.16 0.18 0.15 0.11 0.17 0.01 0.527 0.846 0.276 0.834
Order Bacteroidales;
Family BS11
4.06 2.78 4.11 4.20 4.71 3.11 0.39 0.981 0.912 0.124 0.599
Order Bacteroidales;
Family S24-7
2.64 3.51 2.87 1.90 2.02 1.85 0.56 0.451 0.350 0.457 0.550
Order Bacteroidales;
Family RF16
0.90 0.98 0.73 0.69 0.86 1.05 0.11 0.967 0.621 0.805 0.335
Bacteroidales
Unclassified
9.56 13.58 13.76 12.74 13.72 11.75 0.91 0.854 0.211 0.961 0.635
Firmicutes 37.60 36.52 36.79 42.90 38.05 36.36 1.61 0.579 0.526 0.363 0.935
Ruminococcus 2.53 3.33 3.94 3.32 3.35 2.39 0.31 0.796 0.463 0.987 0.233
Butyrivibrio 1.74 1.29 1.15 3.31 3.38 2.21 0.67 0.293 0.409 0.179 0.425
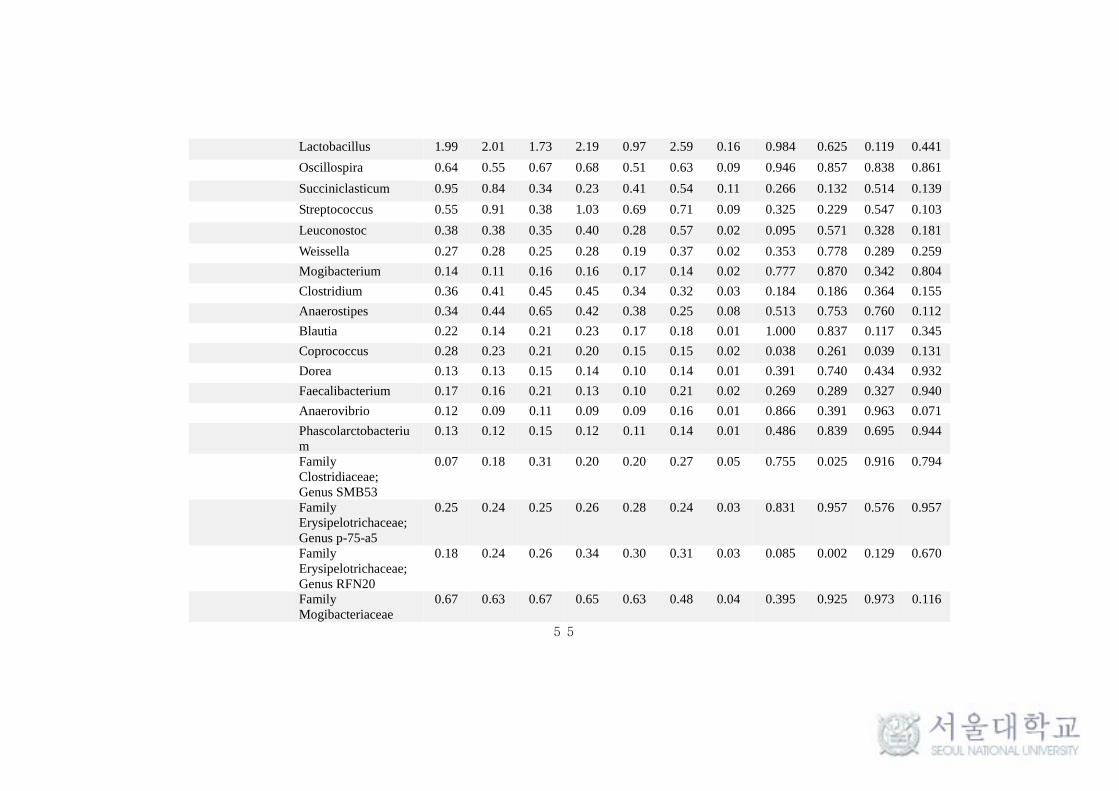
55
Lactobacillus 1.99 2.01 1.73 2.19 0.97 2.59 0.16 0.984 0.625 0.119 0.441
Oscillospira 0.64 0.55 0.67 0.68 0.51 0.63 0.09 0.946 0.857 0.838 0.861
Succiniclasticum 0.95 0.84 0.34 0.23 0.41 0.54 0.11 0.266 0.132 0.514 0.139
Streptococcus 0.55 0.91 0.38 1.03 0.69 0.71 0.09 0.325 0.229 0.547 0.103
Leuconostoc 0.38 0.38 0.35 0.40 0.28 0.57 0.02 0.095 0.571 0.328 0.181
Weissella 0.27 0.28 0.25 0.28 0.19 0.37 0.02 0.353 0.778 0.289 0.259
Mogibacterium 0.14 0.11 0.16 0.16 0.17 0.14 0.02 0.777 0.870 0.342 0.804
Clostridium 0.36 0.41 0.45 0.45 0.34 0.32 0.03 0.184 0.186 0.364 0.155
Anaerostipes 0.34 0.44 0.65 0.42 0.38 0.25 0.08 0.513 0.753 0.760 0.112
Blautia 0.22 0.14 0.21 0.23 0.17 0.18 0.01 1.000 0.837 0.117 0.345
Coprococcus 0.28 0.23 0.21 0.20 0.15 0.15 0.02 0.038 0.261 0.039 0.131
Dorea 0.13 0.13 0.15 0.14 0.10 0.14 0.01 0.391 0.740 0.434 0.932
Faecalibacterium 0.17 0.16 0.21 0.13 0.10 0.21 0.02 0.269 0.289 0.327 0.940
Anaerovibrio 0.12 0.09 0.11 0.09 0.09 0.16 0.01 0.866 0.391 0.963 0.071
Phascolarctobacteriu
m
0.13 0.12 0.15 0.12 0.11 0.14 0.01 0.486 0.839 0.695 0.944
Family
Clostridiaceae;
Genus SMB53
0.07 0.18 0.31 0.20 0.20 0.27 0.05 0.755 0.025 0.916 0.794
Family
Erysipelotrichaceae;
Genus p-75-a5
0.25 0.24 0.25 0.26 0.28 0.24 0.03 0.831 0.957 0.576 0.957
Family
Erysipelotrichaceae;
Genus RFN20
0.18 0.24 0.26 0.34 0.30 0.31 0.03 0.085 0.002 0.129 0.670
Family
Mogibacteriaceae
0.67 0.63 0.67 0.65 0.63 0.48 0.04 0.395 0.925 0.973 0.116
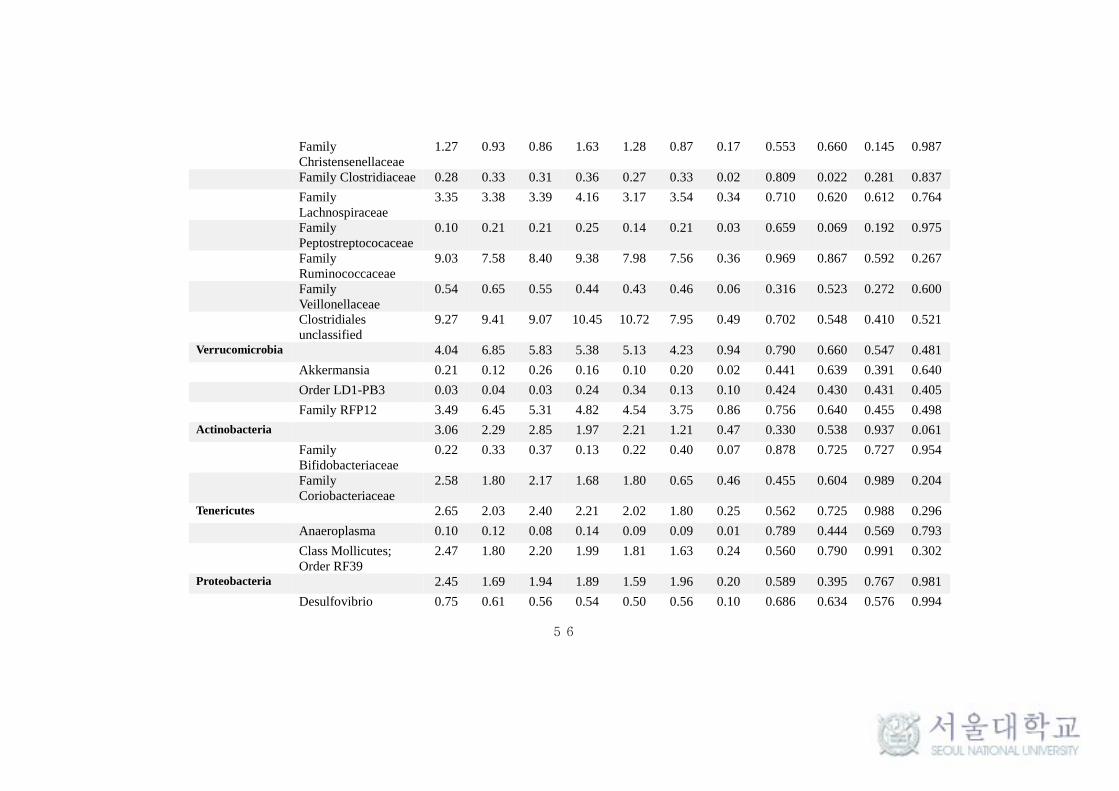
56
Family
Christensenellaceae
1.27 0.93 0.86 1.63 1.28 0.87 0.17 0.553 0.660 0.145 0.987
Family Clostridiaceae 0.28 0.33 0.31 0.36 0.27 0.33 0.02 0.809 0.022 0.281 0.837
Family
Lachnospiraceae
3.35 3.38 3.39 4.16 3.17 3.54 0.34 0.710 0.620 0.612 0.764
Family
Peptostreptococaceae
0.10 0.21 0.21 0.25 0.14 0.21 0.03 0.659 0.069 0.192 0.975
Family
Ruminococcaceae
9.03 7.58 8.40 9.38 7.98 7.56 0.36 0.969 0.867 0.592 0.267
Family
Veillonellaceae
0.54 0.65 0.55 0.44 0.43 0.46 0.06 0.316 0.523 0.272 0.600
Clostridiales
unclassified
9.27 9.41 9.07 10.45 10.72 7.95 0.49 0.702 0.548 0.410 0.521
Verrucomicrobia 4.04 6.85 5.83 5.38 5.13 4.23 0.94 0.790 0.660 0.547 0.481
Akkermansia 0.21 0.12 0.26 0.16 0.10 0.20 0.02 0.441 0.639 0.391 0.640
Order LD1-PB3 0.03 0.04 0.03 0.24 0.34 0.13 0.10 0.424 0.430 0.431 0.405
Family RFP12 3.49 6.45 5.31 4.82 4.54 3.75 0.86 0.756 0.640 0.455 0.498
Actinobacteria 3.06 2.29 2.85 1.97 2.21 1.21 0.47 0.330 0.538 0.937 0.061
Family
Bifidobacteriaceae
0.22 0.33 0.37 0.13 0.22 0.40 0.07 0.878 0.725 0.727 0.954
Family
Coriobacteriaceae
2.58 1.80 2.17 1.68 1.80 0.65
0.46 0.455 0.604 0.989 0.204
Tenericutes 2.65 2.03 2.40 2.21 2.02 1.80 0.25 0.562 0.725 0.988 0.296
Anaeroplasma 0.10 0.12 0.08 0.14 0.09 0.09 0.01 0.789 0.444 0.569 0.793
Class Mollicutes;
Order RF39
2.47 1.80 2.20 1.99 1.81 1.63 0.24 0.560 0.790 0.991 0.302
Proteobacteria 2.45 1.69 1.94 1.89 1.59 1.96 0.20 0.589 0.395 0.767 0.981
Desulfovibrio 0.75 0.61 0.56 0.54 0.50 0.56 0.10 0.686 0.634 0.576 0.994
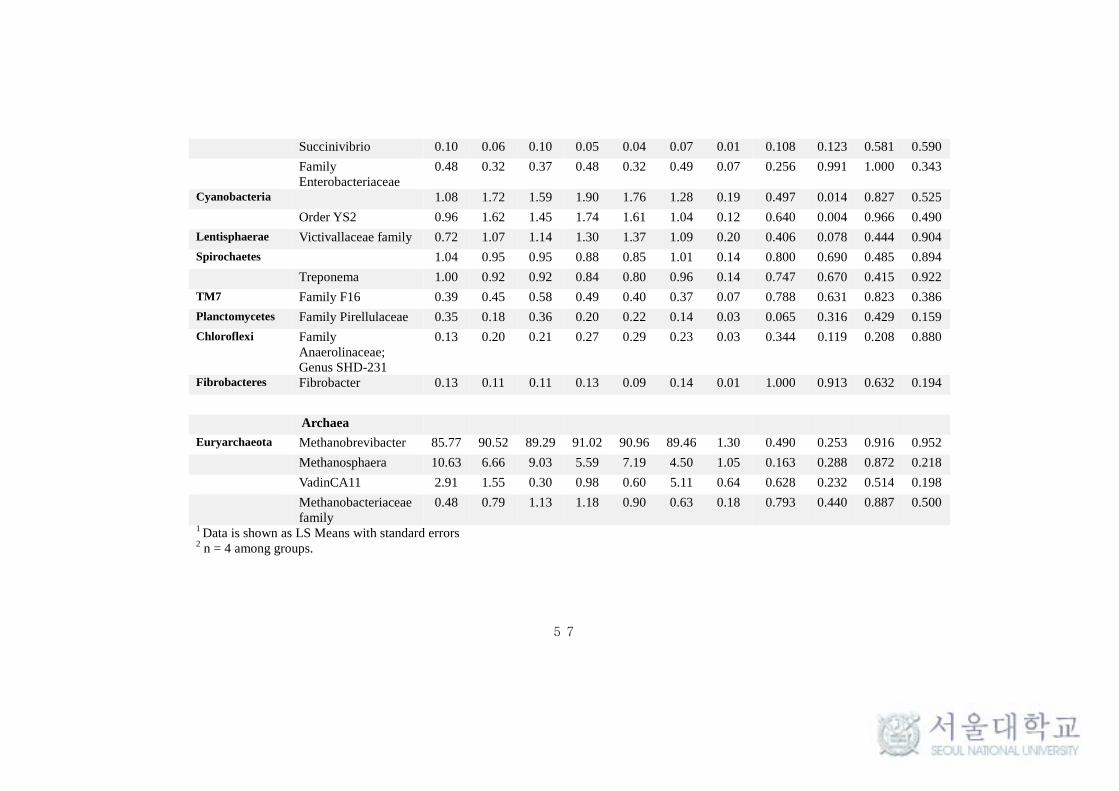
57
Succinivibrio 0.10 0.06 0.10 0.05 0.04 0.07 0.01 0.108 0.123 0.581 0.590
Family
Enterobacteriaceae
0.48 0.32 0.37 0.48 0.32 0.49 0.07 0.256 0.991 1.000 0.343
Cyanobacteria 1.08 1.72 1.59 1.90 1.76 1.28 0.19 0.497 0.014 0.827 0.525
Order YS2 0.96 1.62 1.45 1.74 1.61 1.04 0.12 0.640 0.004 0.966 0.490
Lentisphaerae Victivallaceae family 0.72 1.07 1.14 1.30 1.37 1.09 0.20 0.406 0.078 0.444 0.904
Spirochaetes 1.04 0.95 0.95 0.88 0.85 1.01 0.14 0.800 0.690 0.485 0.894
Treponema 1.00 0.92 0.92 0.84 0.80 0.96 0.14 0.747 0.670 0.415 0.922
TM7 Family F16 0.39 0.45 0.58 0.49 0.40 0.37 0.07 0.788 0.631 0.823 0.386
Planctomycetes Family Pirellulaceae 0.35 0.18 0.36 0.20 0.22 0.14 0.03 0.065 0.316 0.429 0.159
Chloroflexi Family
Anaerolinaceae;
Genus SHD-231
0.13 0.20 0.21 0.27 0.29 0.23 0.03 0.344 0.119 0.208 0.880
Fibrobacteres Fibrobacter 0.13 0.11 0.11 0.13 0.09 0.14 0.01 1.000 0.913 0.632 0.194
Archaea
Euryarchaeota Methanobrevibacter 85.77 90.52 89.29 91.02 90.96 89.46 1.30 0.490 0.253 0.916 0.952
Methanosphaera 10.63 6.66 9.03 5.59 7.19 4.50 1.05 0.163 0.288 0.872 0.218
VadinCA11 2.91 1.55 0.30 0.98 0.60 5.11 0.64 0.628 0.232 0.514 0.198
Methanobacteriaceae
family
0.48 0.79 1.13 1.18 0.90 0.63 0.18 0.793 0.440 0.887 0.500
1 Data is shown as LS Means with standard errors
2 n = 4 among groups.
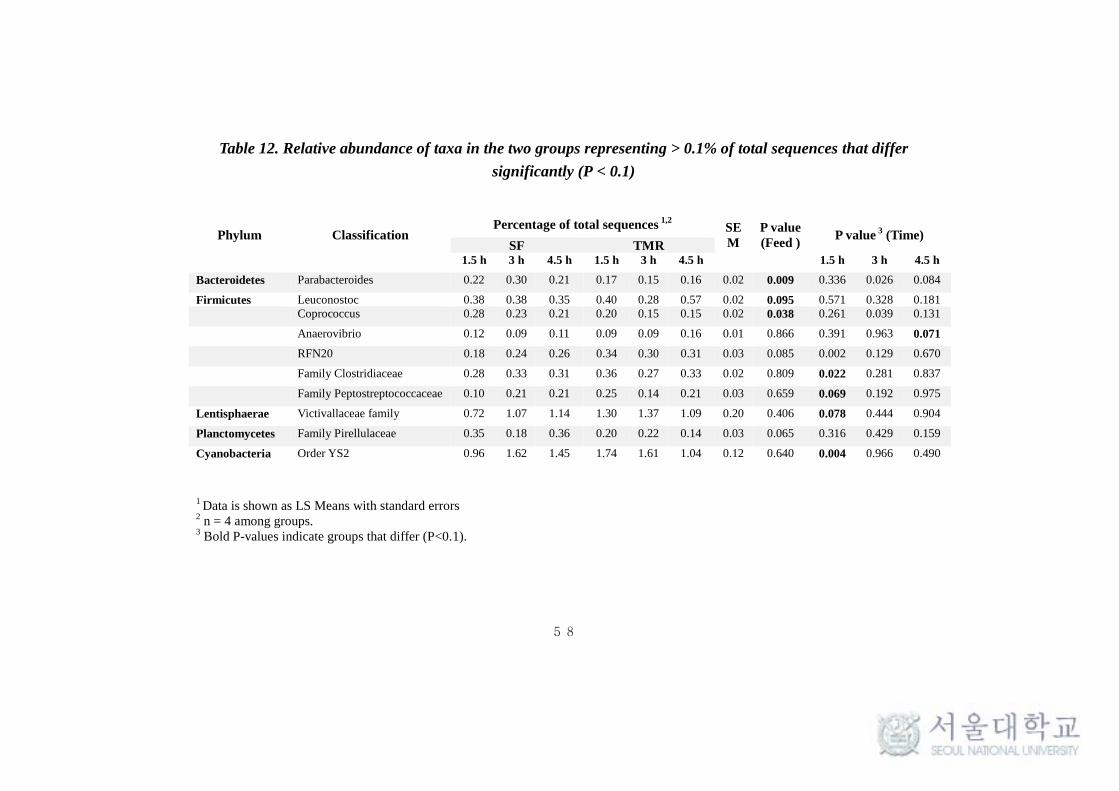
58
Table 12. Relative abundance of taxa in the two groups representing > 0.1% of total sequences that differ
significantly (P < 0.1)
Phylum Classification Percentage of total sequences
1,2 SE
M
P value
(Feed ) P value
3 (Time)
SF TMR
1.5 h 3 h 4.5 h 1.5 h 3 h 4.5 h 1.5 h 3 h 4.5 h
Bacteroidetes Parabacteroides 0.22 0.30 0.21 0.17 0.15 0.16 0.02 0.009 0.336 0.026 0.084
Firmicutes Leuconostoc 0.38 0.38 0.35 0.40 0.28 0.57 0.02 0.095 0.571 0.328 0.181
Coprococcus 0.28 0.23 0.21 0.20 0.15 0.15 0.02 0.038 0.261 0.039 0.131
Anaerovibrio 0.12 0.09 0.11 0.09 0.09 0.16 0.01 0.866 0.391 0.963 0.071
RFN20 0.18 0.24 0.26 0.34 0.30 0.31 0.03 0.085 0.002 0.129 0.670
Family Clostridiaceae 0.28 0.33 0.31 0.36 0.27 0.33 0.02 0.809 0.022 0.281 0.837
Family Peptostreptococcaceae 0.10 0.21 0.21 0.25 0.14 0.21 0.03 0.659 0.069 0.192 0.975
Lentisphaerae Victivallaceae family 0.72 1.07 1.14 1.30 1.37 1.09 0.20 0.406 0.078 0.444 0.904
Planctomycetes Family Pirellulaceae 0.35 0.18 0.36 0.20 0.22 0.14 0.03 0.065 0.316 0.429 0.159
Cyanobacteria Order YS2 0.96 1.62 1.45 1.74 1.61 1.04 0.12 0.640 0.004 0.966 0.490
1 Data is shown as LS Means with standard errors
2 n = 4 among groups.
3 Bold P-values indicate groups that differ (P<0.1).
59
Conclusion
The two different feeding system of feeding roughage and concentrate
separately or as TMR had no effect on the DMI. The total CH4 emission (L/d)
was high at higher feeding level (2.4% BW) and found to decrease at lower
feeding level (2% BW). At lower feeding level separate feeding system
exhibited low CH4 production (L/d) and emission rate (% GEI) when compared
to TMR. Neither ruminal pH nor the total nutrient digestibility were altered by
the feeding system. The total VFA production was increased by SF system and
the percentage of acetate and propionate increased and decreased respectively
upon time. The percentage of isofatty acids was high in SF system suggesting a
possibility of increase in microbial protein synthesis. Rumen NH3 concentration
was high in SF system. Bacterial genera like Coprococcus, involved in
propionate production and increasing productivity of animals were noted in
abundance in SF system. Likewise, Leuconostoc, CO2 and acetate producing
bacteria was found to be in abundance in TMR feeding system. Furthermore,
the feeding system was found to have no impact on the total methanogen
population.
In conclusion, this experiment suggests that the traditional way of
feeding the roughages and concentrates separately instead of high capital
requiring TMR feeding system would increase VFA production and reduce the
CH4 production without altering the efficiency of nutrient utilization thereby
reducing the GEI loss that could be otherwise used for other productive
mechanisms by the animals. However, the differences exhibited in microbial
diversity between the feeding system should be studied in detail in future to
figure out their role in increasing the productivity of animals that could assist in
60
the further understanding of rumen microbiology and also facilitate further
development of animal husbandry.
61
Bibliography
Agarwal, N., D. N. Kamra, and L. C. Chaudhary. 2015. Rumen Microbial Ecosystem
of Domesticated Ruminants. In Rumen Microbiology: From Evolution to
Revolution (pp. 17-30). Springer India.
Agle, M., A. N. Hristov, S. Zaman, C. Schneider, P. Ndegwa, and V. K. Vaddella. 2010.
Effect of dietary concentrate on rumen fermentation, digestibility, and
nitrogen losses in dairy cows. J. Dairy Sci. 93:4211–4222.
Agricultural Research Council (ARC). 1980. The nutrient requirements of ruminant
livestock. Commonwealth Agricultural Bureau, Farnham Royal.
Aguerre, M. J., M. A.Wattiaux, J. M. Powell, G. A. Broderick, and C. Arndt. 2011.
Effect of forage-to-concentrate ratio in dairy cow diets on emission of
methane, carbon dioxide, and ammonia, lactation performance, and manure
excretion. J. Dairy Sci. 94, 3081–3093
Allison, M. J., and M. P. Bryant. 1963. Biosynthesis of branched-chain amino acids
from branched-chain fatty acids by rumen bacteria. Arch. Biochem. Biophys.
101:269.
Allison, M. J., M. P. Bryant, and R. N. Doetsch. 1962. Studies on the metabolic
function of branched-chain volatile fatty acids, growth factors for
ruminococci. I. Incorporation of isovalerate into leucine. J. Bacteriol. 83:523.
Allison, M. J., and J. L. Peel. 1971. The biosynthesis of valine from isobutyrate
by Peptostreptococcus elsdenii and Bacteroides ruminicola. Biochem J. 121:
431–437.
Amann, R. I., W. Ludwig, and K. H. Schleifer. 1995. Phylogenetic identification and in
situ detection of individual microbial cells without cultivation. Microbiol Rev
59, 143– 169.
AOAC, 1990. Official Method of Analysis. 15th Edn., Association of Official
Analytical Chemists (AOAC), Washington, DC., USA.
62
Armentano, L. E., S. J. Bertics, and J. Riesterer. 1993. Lack of response to addition of
degradable protein to a low protein diet fed to midlactation dairy cows. J.
Dairy Sci. 76, 3755–3762.
Avguštin, G., R. J. Wallace, and H. J. Flint. 1997. Phenotypic diversity among ruminal
isolates of Prevotella ruminicola: proposal of Prevotella brevis sp. nov.,
Prevotella bryantii sp. nov., and Prevotella albensis sp. nov. and redefinition
of Prevotella ruminicola. Int J Syst Bacteriol. 47:284–288.
Bach, A., S. Calsamiglia, and M. D. Stern. 2005. Nitrogen metabolism in the rumen. J.
Dairy Sci. 88 (E. Suppl.), E9–E21.
Bannink, A., J. France, and J. Dijkstra. 2011. Modeling approaches to link various
levels of organization in animal physiology. Pages 191-214 in Systems
Biology in Livestock Science, Eds., F.W. te Pas, H. Woelders, A. Bannink.
Wiley & Blackwell, Chichester, UK.
Bargo, F., L. D. Muller, G. A. Varga, J. E. Delahoy, and T. W. Cassidy. 2002. Ruminal
Digestion and Fermentation of High-Producing Dairy Cows with Three
Different Feeding Systems Combining Pasture and Total Mixed Rations. J.
Dairy Sci. 85:2964–2973.
Baxter, H. D., J. R. Owen, M. J. Montgomery, C. H. Gordon, and J. T. Miles. 1972.
Comparison of corn silage and concentrate fed separately and mixed as a
complete ration. J. Dairy Sci. 55 (Suppl. 1):398. (Abstr.)
Beauchemin, K. A., S. M. McGinn, T. F. Martinez, and T. A. McAllister. 2014. Use of
condensed tannin extract from quebracho trees to reduce methane emissions
from cattle. J. Anim. Sci. 85:1990–1996.
Bhatt, V. D., S. S. Dande, N. V. Patil, and C. G. Joshi. 2013. Molecular analysis of the
bacterial microbiome in the forestomach fluid from the dromedary camel
(Camelus dromedarius). Mol Bio Rep, 40: 3363–3371.
Blaxter, K. L., and J. L. Clapperton. 1965. Prediction of the amount of methane
produced by ruminants. Br. J. Nutr. 19:511–522.
63
Boadi, D., C. Benchaar, J. Chiquette, and D. Masse. 2004. Mitigation strategies to
reduce enteric methane emissions from dairy cows: Update review. Can. J.
Anim. Sci. 84:319–335.
Bonhomme, A. 1990. Rumen ciliates: their metabolism and relationships with bacteria
and their hosts. Anim. Feed Sci. Technol. 30:203-266.
Brook, I. 1999. Bacterial Interference, Crit Rev Microbiol, 25:3, 155-172
Brown, E. G., R. C. Anderson, G. E. Carstens, H. Gutierrez-Banuelos, J. L.
McReynolds, L. J. Slay, T. R. Callaway, and D. J. Nisbet. 2011. Effects of
oral nitroethane administration on enteric methane emissions and ruminal
fermentation in cattle. Anim. Feed Sci. Technol. 166–167:275–281.
Brown, M. S., C. H. Ponce , and R. Pulikanti. 2006. Adaptation of beef cattle to high-
concentrate diets: performance and ruminal metabolism. J Anim
Sci 84 (Suppl): E25–E33
Brulc, J. M., D. A. Antonopoulos, M. E. Miller, M. K. Wilson, A. C. Yannarell, E. A.
Dinsdale, R. E. Edwards, E. D. Frank, J. B. Emerson, and P. Wacklin. 2009.
Gene-centric metagenomics of the fiber-adherent bovine rumen microbiome
reveals forage specific glycoside hydrolases. In Proceedings of the National
Academy of Sciences of the United States of America, 106:1948-195
Cai, Y., S. Ohmomo, S. Kumai . (1994). Distribution and lactate fermentation
characteristics of lactic acid bacteria on forage crops and grasses. J. Jpn. Soc.
Grassl. Sci. 39:420–428.
Callaway, T. R., S. E. Dowd, T. S. Edrington, R. C. Anderson, N. Krueger, N. Bauer, P.
J. Kononoff, and D. J. Nisbet. 2010. Evaluation of bacterial diversity in
rumen and feces of cattle fed different levels of dried distillers grains plus
solubles using bacterial tag encoded FLX amplicon pyrosequencing. J Anim
Sci 88:3977–3983
Cannas, A., P. J. Van Soest, J. P. McNamara, J. France, and D. E. Beever. 2000. Simple
allometric models to predict rumen feed passage rate in domestic ruminants.
Modelling nutrient utilization in farm animals, 49-62.
64
Caplis, J., M. G. Keane, A. P. Moloney and F. P. O'Mara. 2005. Effects of
Supplementary Concentrate Level with Grass Silage, and Separate or Total
Mixed Ration Feeding, on Performance and Carcass Traits of Finishing
Steers. Irish Journal of Agricultural and Food Research. Vol. 44, No. 1, pp.
27-43
Cersosimo, L.M. and A. D. G. Wright. 2015. Rumen Methanogens. In Rumen
Microbiology: From Evolution to Revolution (pp. 143-150). Springer India.
Chaney, A. L. and E. P. Marbach. 1962. Modified reagent for determination of urea and
ammonia. Clin. Chem. 8:130-132.
Chaokaur, A., T. Nishida, I. Phaowphaisal, and K. Sommart. 2015. Effects of feeding
level on methane emission and energy utilization of Brahman cattle in the
tropics. Agric. Ecosyst. Environ., 199: 225-230.
Charmley, E., S. R. O. Williams, P. J. Moate, R. S. Hegarty, R. M. Herd, V. H. Oddy, P .
Reyenga, K. M. Staunton, A . Anderson, and M. C. Hannah. 2016. A
universal equation to predict methane production of forage-fed cattle in
Australia. Animal Production Science 56, 169–180.
Chaucheyras-Durand, F., and F. Ossa. 2014. Review: The rumen microbiome:
Composition, abundance, diversity, and new investigative tools. The
Professional Animal Scientist 30: 1–12.
Cone, J. W., and A. H. Van Gelder. 1999. Influence of protein fermentation on gas
production profiles. Anim. Feed Sci. Technol. 76, pp. 251–264
Cooper, S. D. B., I. Kyriazakis, and J. V. Nolan, 1995. Diet selection in sheep: the role
of the rumen environment in the selection of a diet from two feeds that differ
in their energy density. Br. J. Nutr. 74, 39–54.
Czerkawski J. W. and Grace Breckenridge. 1969. Fermentation of various soluble
carbohydrates by rumen micro -organisms with particular reference to
methane production. Br. J. Nutr. (1969), 23, 925
65
Danielsson, R., A. Werner-Omazic, M. Ramin, A. Schnürer, M. J. Griinari,
Dicksved, and J. Bertilsson. 2014. Effects on enteric methane production and
bacterial and archaeal communities by the addition of cashew nut shell
extract or glycerol-An in vitro evaluation . J. Dairy Sci. 97 (9), pp. 5729-5741.
De Menezes, A. B., E. Lewis, M. O’Donovan, B. O’Neill, N. Clipson, and E. Doyle.
2011. Microbiome analysis of dairy cows fed pasture or total mixed ration
diets. FEMS Microbiol. Ecol., 78. pp. 256–265
De Nardi, R., G. Marchesini, S. Li, E. Khafipour, K. J. Plaizier, M. Gianesella, R.
Ricci, I . Andrighetto, and S. Segato. 2016. Metagenomic analysis of rumen
microbial population in dairy heifers fed a high grain diet supplemented with
dicarboxylic acids or polyphenols. BMC Veterinary Research 12, 29.
Dehority, B. A. Pectin-fermenting bacteria isolated from the bovine rumen. 1969. J
Bacteriol. 99:189–196.
Deighton, M. H., S. R. O. Williams, M. C. Hannah, R. J. Eckard, T. M. Boland, W. J.
Wales, and P. J. Moate. 2014. A modified sulphur hexafluoride tracer
technique enables accurate determination of enteric methane emissions from
ruminants. Anim. Feed Sci. Technol. 197, 47–63.
Demeyer, D., and C. Van Nevel. 1979. Protein fermentation and growth by rumen
microbes. Ann. Rech. v6t., 10, 275-279
Deng, W. D., D. M. Xi, H. M. Mao, and M. Wanapat. 2008. The use of molecular
techniques based on ribosomal RNA and DNA for rumen microbial
ecosystem studies: a review. Mol Bio Rep. 35:265-274.
Dodd, D., Y. H. Moon, K. Swaminathan, R. I. Mackie, and I. K. O. Cann. 2010.
Transcriptomic analysis of xylan degradation by Prevotella bryantii and
insights into energy acquisition by xylanolytic Bacteroidetes. J Biol Chem
285:30261–30273
Erdman, R. A., G. H. Proctor and J. H. Vandersall. 1986. Effect of rumen ammonia
concentration on in situ rate and extent of digestion of feedstuffs. J. Dairy Sci.
69:2312-2320.
66
Erbilgin O., K. L. McDonald, C. A. Kerfeld. (2014). Characterization of a
planctomycetal organelle: a novel bacterial microcompartment for the aerobic
degradation of plant saccharides. Appl. Environ. Microbiol. 80, 2193–2205
10.1128/AEM.03887-13
Erwin, E. S., G. J. Marco, and E. M. Emery. 1961. Volatile fatty acid analysis of blood
and rumen fluid by gas chromatography. J. Dairy Sci. 44, 1768–1771.
FAO. 2009. The State of Food and Agriculture — Livestock in the Balance. Food and
Agriculture Organization, Rome, Italy
FAO. 2011. World Livestock 2011 – Livestock in food security, FAO, Rome.
Fedele, V., S. Claps, R. Rubino, M. Calandrelli, and A. M. Pilla, 2002. Effect of Free
Choice and Traditional Feeding Systems on Goat Feeding Behaviour and
Intake. Livest Prod Sci, 74: 19-31.
Fernando, S. C., H. Purvis, F. Najar, L. Sukharnikov, and C. Krehbiel. 2010. Rumen
microbial population dynamics during adaptation to a high-grain diet. Appl
Environ Microbiol. 7482–7490.
Ferraretto, L. F., P. M. Crump, and R. D. Shaver. 2013. Effect of cereal grain type and
corn grain harvesting and processing methods on intake, digestion, and milk
production by dairy cows through meta-analysis. J. Dairy Sci. 96:533–550.
Ferry, J. G., and K. A. Kastead. 2007. Methanogenesis. In: Cavicchioli R (ed) Archaea:
molecular and cellular biology. ASM Press, Washington,DC, pp 288–314.
Firkins, J. L. 1997. Effects of feeding nonforage fiber sources on site of fiber digestion.
J. Dairy Sci. 80:1426–1437.
Flint, H. J., E. A. Bayer, M. T. Rincon, R. Lamed, and B. A. White. 2008.
Polysaccharide utilization by gut bacteria: potential for new insights from
genomic analysis. Nat Rev. 6: 121–131.
Flynt, H. J., and E. A. Bayer. 2008. Plant cell wall breakdown by anaerobic
microorganisms from the mammalian diggestive tract. Ann N Y Acad Sci
1125:280–288
67
Fuller, M. F. 2004. The Encyclopedia of Farm Animal Nutrition, CABI, Technology &
Engineering, ISBN 0851993699, 9780851993690
Garret, S., D. M. Stevenson, D. C. Bruce, Chertkov O, Copeland A, Cheng J-F, C .
Detter, J. C. Detter, L. A. Goodwin, C. S. Han, L. J. Hauser, N. N. Ivanova, N.
C. Kyrpides, M. L. Land, A. Lapidus, S. Lucas, G. Ovchinnikova, S. Pitluck,
R. Tapia, T. Woyke, J. Boyum, D. Mead, and P. J. Weimer. 2011. Complete
genome of the cellulolytic ruminal bacterium Ruminococcus albus 7. J
Bacteriol 193:5574–5575
Gerber, P. J., H. Steinfeld, B. Henderson, A. Mottet, C. Opio, J. Dijkman, A. Falcucci,
and G. Tempio. 2013. Tackling climate change through livestock: a global
assessment of emissions and mitigation opportunities. Food and Agriculture
Organization of the United Nations (FAO), Rome
Gerber, P., T. Vellinga, C. Opio, and H. Steinfeld. 2011. Productivity gains and
greenhouse gas emissions intensity in dairy systems. Livest. Sci., 139(1),100-
108.
Görgülü, M., H. R. Kutlu, E. Demir, O. Öztürkcan, and J. M. Forbes, 1996. Nutritional
Consequences or Free Choice among Feed Ingredient by Awassi Lambs.
Small Ruminant Research, 20: 23-29.
Görgülü, M., M. Boğa, A. Sahin, U. Serbester, H. R. Kutlu, and S. Sahinler, 2008. Diet
Selection and Eating Behaviour of Lactating Goats Subjected to Time
Restricted Feeding in Choice and Single Feeding System. Small Ruminant
Research, 78: 41–47
Görgülü, M., O. Güney, O. Torun, O. Özuyanik, and H. R. Kutlu. 2003. An Alternative
Feeding System for Dairy Goats: Effects of Free-Choice Feeding on Milk
Yield and Milk Composition of Lactating Suckling Damascus Goats. Journal
of Animal and Feed Science, 12: 35-46.
Grainger, C., R. Williams, R. J. Eckard, and M. C. Hannah. 2010. A high dose of
monensin does not reduce methane emissions of dairy cows offered pasture
supplemented with grain. J. Dairy Sci. 93:5300–5308.
68
Grainger, C., T. Clarke, M. J. Auldist, K. A. Beauchemin, S. M. McGinn, G. C.
Waghorn, and R. J. Eckard. 2009. Potential use of Acacia mearnsii condensed
tannins to reduce methane emissions and nitrogen excretion from grazing
dairy cows. Can. J. Anim. Sci. 89:241–251
Gutierrez-Banuelos, H., R. C. Anderson, G. E. Carstens, L. J. Slay, N. Ramlachan, S. M.
Horrocks, T. R. Callaway, T. S. Edrington, and D. J. Nisbet. 2007. Zoonotic
bacterial populations, gut fermentation characteristics and methane
production in feedlot steers during oral nitroethane treatment and after the
feeding of an experimental chlorate product. Anaerobe 13:21–31.
Hammond, K. J., S. Muetzel, G. C. Waghorn, C. S. Pinares-Patino, J. L. Burke, and S.
O. Hoskin. 2009. The variation in methane emissions from sheep and cattle is
not explained by the chemical composition of ryegrass. Proc. N.Z. Soc. Anim.
Prod. 69:174–178.
Hammond, K., D. Humphries, L. Crompton, P. Kirton, C. Green, and C. Reynolds.
2013. Methane emissions from growing dairy heifers estimated using an
automated head chamber (GreenFeed) compared to respiration chambers or
SF 6 techniques. Adv Anim Biosci 4:391
Hammond, K. J., D. Pacheco, J. L. Burke, J. P. Koolaard, S. Muetzel, and G. C.
Waghorn. 2014. The effects of fresh forages and feed intake level on digesta
kinetics and enteric methane emissions from sheep. Anim. Feed Sci.
Technol. 193, 32-43.
Han, X., Y. Yang, H. Yan, X. Wang, L. Qu, and Y. Chen. 2015. Rumen Bacterial
Diversity of 80 to 110-Day-Old Goats Using 16S rRNA Sequencing. PLoS
ONE 10(2): e0117811.
Hart, K. J., P. G. Martin, P. A. Foley, D. A. Kenny, and T. M. Boland. 2014. Effect of
sward dry matter digestibility on methane production, ruminal fermentation,
and microbial populations of zero-grazed beef cattle. J Anim Sci. Oct;
87(10):3342-50.
69
Hegarty, R. S. 1999. Mechanisms for competitively reducing ruminal methanogenesis.
Aust J Agric Res 50:1299–1306.
Heinrichs, J., and P. Kononoff. 2002. Evaluating particle size of forages and TMRs
using the New Penn State Forage Particle Separator. Pennsylvania State
University, College of Agricultural Sciences, Cooperative Extension DAS 02-
42.
Henderson, G., F. Cox, S. Ganesh, A. Jonker, W. Young, Global Rumen Census
Collaborators, and P.H. Janssen. 2015. Rumen microbial community
composition varies with diet and host, but a core microbiome is found across
a wide geographical range. Sci. Rep. 5:14567.
Hespell, R. B., D. E. Akin, and B. A. Dehority. 1997. Bacteria, fungi, and protozoa of
the rumen. In Gastrointestinal Microbiology: Gastrointestinal Ecosystems
and Fermentations ed. Mackie, R.I., White, B.A. and Isaacson, R.E. pp. 59–
141. New York: Chapman & Hall
Hironaka, R., G. W. Mathison, B. K. Kerrigan, and I. Vlach. 1996. The effect of
pelleting of alfalfa hay on methane production and digestibility by steers. Sci.
Total Environ. 180:221–227
Holter, J. B., W. E. Urban, Jr., H. H. Hayes, and H. A. Davis. 1977. Utilization of diet
components fed blended or separately to lactating cows. J. Dairy Sci. 60:1288.
Hook, S.E., K. S. Northwood, A. D. Wright, and B. W. McBride. 2009. Long-term
monensin supplementation does not significantly affect the quantity or 70
diversity of methanogens in the rumen of the lactating dairy cow. Appl
Environ Microbiol. 75(2), 374-380
Hristov, A. N., J. Oh, J. L. Firkins, J. Dijkstra, E. Kebreab, G. Waghorn, H. P. S.
Makkar, A. T. Adesogan, W. Yang, C. Lee, P. J. Gerber, B. Henderson, and J.
M. Tricarico. 2013. SPECIAL TOPICS — Mitigation of methane and nitrous
oxide emissions from animal operations: I. A review of enteric methane
mitigation options1. J. Anim. Sci. 91:5045-5069.
Huhtanen, P., M. Ramin, and E. H. Cabezas-Garcia. 2016. Effects of ruminal digesta
70
retention time on methane emissions: a modelling approach. Anim Prod Sci.
2016, 56, 501–506
Huhtanen, P., M. Rinne, and J. Nousiainen. 2009. A meta-analysis of feed digestion in
dairy cows. 2. The effects of feeding level and diet composition on
digestibility. J. Dairy Sci. 92:5031–5042.
Hungate, R. E. 1966.The Rumen and its Microbes, Academic Press, New York, NY
Huuskonen, A. K., M. Pesonen, and E. Joki-Tokola. 2014. Effects of supplementary
concentrate level and separate or total mixed ration feeding on performance
of growing dairy bulls. Agricultural and food science. 23: 257- 265
Huws, S. A., E. U. Kim, M. R. F. Lee, M. B. Scott, J. K. S. Tweed, E. Pinloche, R. J.
Wallace, and N. D. Scollan. 2011. As yet uncultured bacteria phylogenetically
classifiedas Prevotella, Lachnospiraceae incertaesedisandunclassified Bacter
oidales, Clostridiales and Ruminococcaceae may play a predominant role in
ruminal biohydrogenation. Environ. Microbiol., 13 , pp. 1500–1512
Immig, I., D. Demeyer, D. Fielder, L. Mbazamihigo, and C. Van Nevel, 1996. Attempts
to induce reductive acetogenesis into a sheep rumen. Archiv. Anim. Nutr. 49:
363–370.
Indugu N, K. Bittinger, S. Kumar, B. Vecchiarelli, and D. Pitta. 2016. A comparison of
rumen microbial profiles in dairy cows as retrieved by 454 Roche and Ion
Torrent (PGM) sequencing platforms. PeerJ 4:e1599
IPCC. 2006. IPCC guidelines for National Greenhouse Gas Inventories. In: Eggleston,
H.S.; Buendia, L.; Miwa, K.; Ngara, T.; Tanabe, K. (Ed) Agriculture, forestry
and other land use. Hayama: Institute for Global Environmental Strategies,
2006. v.4. Available at:
http://www.ipcc-nggip.iges.or.jp/public/2006gl/vol4.html.
IPCC. 2007. Climate Change 2007: Mitigation. Contribution of Working Group III to
the Fourth Assessment Report of the Intergovernmental Panel on Climate
Change Cambridge,United Kingdom and New York, NY, USA. (Available at:
71
http://www.ipcc.ch/publications_and_data/ar4/wg3/en/contents.html) [2016-
02-25].
IPCC. 2013. Climate Change 2013: The Physical Science Basis. Contribution of
Working Group I to the Fifth Assessment Report of the Intergovernmental
Panel on Climate Change. Cambridge University United Kingdom and New
York, NY, USA. (Available at: http://www.climatechange2013.org/report/)
[2016-02-25]. 71
Jami, E., and I. Mizrahi. 2012. Composition and similarity of bovine rumen microbiota
across individual animals. PLoS ONE 7:e33306.
Jami, E., B. A. White, and I. Mizrahi. 2014. Potential role of the bovine rumen
microbiome in modulating milk composition and feed efficiency. PLoS ONE.
9(1): e85423.
Janssen, P. H., and M. Kirs. 2008. Structure of the archaeal community of the rumen.
Appl Environ Microbiol. 74(12), 3619-3625.
Jayanegara, A., F. Leiber, and M. Kreuzer. 2012. Meta-analysis of the relationship
between dietary tannin level and methane formation in ruminants from in
vivo and in vitro experiments. J. Anim. Physiol. Anim. Nutr. (Berl.), 96, pp.
365–375
Jensen, R. G., K. L. Smith, J. E. Edmondson, and C. P. Merilan. 1956. THE
CHARACTERISTICS OF SOME RUMEN LACTOBACILLI. Journal of
Bacteriology, 72(2), 253–258.
Jewell, K. A., C. A. McCormick, C. L. Odt, P. J. Weimer, G. Suen. 2015. Ruminal
bacterial community composition in dairy cows is dynamic over the course of
two lactations and correlates with feed efficiency. Appl Environ Microbiol
81:4697–4710.
Jeyanathan, J., M. Kirs, R. S. Ronimus, S. O. Hoskin, and P. H. Janssen. 2011.
Methanogen community structure in the rumens of farmed sheep, cattle and
red deer fed different diets. FEMS Microbiol Ecol. 76(2),.311-326.
72
Johnson, D. E., and G. M. Ward. 1996. Estimates of animal methane
emissions. Environmental Monitoring and Assessment. 42(1-2):133–141.
Johnson, D. E., H. W. Phetteplace, and A. F. Seidl. 2002. Methane, nitrous oxide and
carbon dioxide emissions from ruminant livestock production systems. In
Greenhouse gases and animal agriculture. Proceeding of the 1st International
Conference on Greenhouse Gases and Animal Agriculture, Obihiro, Japan,
November 2001 (eds. J. Takahashi and B.A. Young), pp. 77-85
Johnson, E. D., A. S. Wood, J. B. Stone, and E. T. Moran Jr. 1972. Some effects of
methane inhibition in ruminants (steers). Can. J. Anim. Sci. 52:703–712.
Johnson, K. A., and D. E. Johnson.1995. Methane emissions from cattle J. Anim. Sci.,
73: pp. 2483–2492.
Kasparovska, J., M. Pecinkova, K. Dadakova, L. Krizova, S. Hadrova, M. Lexa, T.
Kasparovsky. 2016. Effects of Isoflavone-Enriched Feed on the Rumen
Microbiota in Dairy Cows. PLoS ONE, 11(4), e0154642.
Kim, B. H., and G. M. Gadd. 2008. Bacterial Physiology and Metabolism. Cambridge
University Press, Cambridge, U.K.
Kim, K. H., S. Arokiyaraj, J. Lee , Y. K. Oh, H. Y. Chung, G. D. Jin, E. B. Kim, E. K.
Kim, Y. Lee, and M. Baik. 2016. Effect of rhubarb (Rheum spp.) root on in
vitro and in vivo ruminal methane production and a bacterial community
analysis based on 16S rRNA sequence. Anim Prod Sci. 56, 402-408.
Kim, M., and Z. Yu. 2014. Variations in 16S rRNA-based microbiome profiling
between pyrosequencing runs and between pyrosequencing facilities. J.
Microbiol. 52, 355–365.
Kim, S. H , M. J. Alam, M. J. Gu, K. W. Park, C. O. Jeon, Jong K. Ha, K. K.
Cho, and S. S. Lee. 2012. Effect of Total Mixed Ration with Fermented Feed
on Ruminal In vitro Fermentation, Growth Performance and Blood
Characteristics of Hanwoo Steers. Asian-Australas J Anim Sci. 2012 Feb;
25(2): 213–223.
King, E. E., R. P. Smith, B. St-Pierre, and A. D. G. Wright. 2011. Differences in the
73
rumen methanogen populations of lactating Jersey and Holstein dairy cows
under the same diet regimen. Appl Environ Microbiol. 77(16), 5682-5687
Kirchgessner, M., M. Kreuzer, A. Machmuller, D.A. Roth-Maier. 1994. Evidence for a
high efficiency of bacterial protein synthesis in the digestive tract of adult
sows fed supplements of fibrous feedstuffs. Anim. Feed Sci. Technol., 46, pp.
293–306
Kirkpatrick, D. E., R. W. J. Steen, and E. F. Unsworth. 1997. The effect of differing
forage: concentrate ratio and restricting feed intake on the energy and
nitrogen utilization by beef cattle. Livest Prod Sci. 51 (1997) 151-164
Kishimoto, A., K. Ushida, G. O. Phillips, T. Ogasawara, and Y. Sasaki. 2006.
Identification of intestinal bacteria responsible for fermentation of gum arabic
in pig model. Curr Microbiol. 53: 173–177.
Klieve, A. V. and R. S. Hegarty. 1999. Opportunities for biological control of
methanogenesis. Aust. J. Agric. Res. 50: 1315–1319. Koch, R. M., Swiger, L.
A., Chambers, D. and Gregory, K. E. 1963. Efficiency of feed use in beef
cattle. J. Anim. Sci. 22: 486–494
Klieve, A. V., D. Hennessy, D. Ouwerkerk, R. J. Forster, R. I. Mackie, and G. T.
Attwood. 2003. Establishing populations of Megasphaera elsdenii YE 34 and
Butyrivibrio fibrisolvens YE 44 in the rumen of cattle fed high grain diets. J
Appl Microbiol 95, 621–630.
Knight, T., R. S. Ronimus, D. Dey, C. Tootill, G. Naylor, P. Evans, G. Molano, A. Smith,
M. Tavendale, C. S. Pinares-Patino, and H. Clark. 2011. Chloroform
decreases rumen methanogenesis and methanogen populations without
altering rumen function in cattle. Anim. Feed Sci. Technol. 166:101–112.
Kocherginskaya, S. A., R. I. Aminov, and B. A. White. 2001. Analysis of rumen
bacterial diversity under two different diet conditions using denaturing
gradient gel electrophoresis, random sequencing, and statistical ecology
approaches. Anaerobe 7, 119–134
Kononoff, P. J., A. J. Heinrichs, and D. R. Buckmaster. 2003. Modification of the Penn
74
State forage and total mixed ration particle separator and the effects of
moisture content on its measurements. J. Dairy Sci. 86:1858–1863
Kononoff, P. J., and A. J. Heinrichs. 2003a. The effect of corn silage particle size and
cottonseed hulls on cows in early lactation. J. Dairy Sci. 86:2438–2451.
Krause, K. M., D. K. Combs, and K. A. Beauchemin. 2002. Effects of forage particle
size and grain fermentability in midlactation cows.I. Milk production and diet
digestibility. J. Dairy Sci. 85:1936–1946.
Krizsan, S. J., S. Ahvenjärvi, and P. Huhtanen. 2010. A meta-analysis of passage rate
estimated by rumen evacuation with cattle and evaluation of passage rate
prediction models. J. Dairy Sci. 93(12), 5890-5901
Kulkerni, V. D., H. C. Pant, G. S. Rai, and J. S. Rawat. 1971. The seasonal variation in
the concentration of protozoa and Oscillospira guilliermondii organisms in
the rumen fluid of grazing buffalo. Indian Vet. J. 48:137–142
Lana, R. P., J. B. Russell, & M. E. Van Amburgh. 1998. The role of pH in regulating
ruminal methane and ammonia production. J. Anim. Sci. 76: 2190–2196.
Lang, K., J. Schuldes, A. Klingl, A. Poehlein, R. Daniel, and A. Brune. 2015. New
mode of energy metabolism in the seventh order of methanogens as revealed
by comparative genome analysis of “Candidatus Methanoplasma termitum”.
Appl Environ Microbiol. 1338-1352.
Larue, R., Z. Yu, V. A. Parisi, A. R. Egan, and M. Morrison. 2005. Novel microbial
diversity adherent to plant biomass in the herbivore gastrointestinal tract, as
revealed by ribosomal intergenic spacer analysis and rrs gene sequencing.
Environ Microbiol 7, 530–543
Lee, H. J., J. Y. Jung, Y. K. Oh, S. S. Lee, E. L. Madsen, and C. O. Jeon. 2012.
Comparative survey of rumen microbial communities and metabolites across
one caprine and three bovine groups, using bar-coded pyrosequencing and 1H
nuclear magnetic resonance spectroscopy. Appl Environ Microbiol. 78:5983–
5993
Leng, R. A. 2008. The potential of feeding nitrate to reduce enteric methane production
75
in ruminants. A report to the department of climate change. Commonwealth
Government of Australia, Canberra, Australia.
Ley, R. E., P. J. Turnbaugh, S. Klein, J. I. Gordon. 2006. Microbial ecology: human gut
microbes associated with obesity. Nature. 444:1022–1023.
Li, D. Y., S.L. Lee, N. J. Choi, S. Y. Lee, H. G. Sung, J. Y. Ko, S. G. Yun, and J. K. Ha.
2003. Effects of Feeding System on Rumen Fermentation Parameters and
Nutrient Digestibility in Holstein Steers. Asian-Aust. J. Anim. Sci. Vol 16, No.
10: 1482-1486.
Li, R. W., E. E. Connor, C. Li, R. Baldwin, M. E. Sparks. 2012. Characterization of the
rumen microbiota of pre-ruminant calvesusing metagenomic tools. Environ
Microbiol 14:129–139
Lila, Z. A., N. Mohammed, N. Tatsuoka, S. Kanda, Y. Kurokawa, and H. Itabashi. 2004.
Effect of cyclodextrin diallyl maleate on methane production, ruminal
fermentation and microbes in vitro and in vivo. Anim. Sci. J. 75:15–22.
Lima, F. S., G. Oikonomou, S. F. Lima, M. L, S. Bicalho, E. K. Ganda, J. C. de
Oliveira Filho, and R. C. Bicalho. 2015. Prepartum and Postpartum Rumen
Fluid Microbiomes: Characterization and Correlation with Production Traits
in Dairy Cows. Appl Environ Microbiol. 81(4), 1327–1337.
Liu, Y. F., F. F. Sun, F. C. Wan, H. B. Zhao, X. M. Liu, W. You, H. J. Cheng, G. F. Liu,
X. W. Tan, and E. L. Song. 2016. Effects of Three Feeding Systems on
Production Performance, Rumen Fermentation and Rumen Digesta Particle
Structure of Beef Cattle. Asian Australas. J. Anim. Sci. 29(5): 659-665.
Mackie, R. I., R. I. Aminov, W. Hu, V. Athol, D. Ouwerkerk, and M. A. Sundset.
2003. Ecology of uncultivated Oscillospira species in the rumen of cattle,
sheep, and reindeer as assessed by microscopy and molecular
approaches. Appl Environ Microbiol 69:6808–6815.
Maekawa, M., K. A. Beauchemin, and D. A. Christensen. 2002. Effect of concentrate
level and feeding management on chewing activities, saliva production, and
ruminal pH of lactating dairy cows. J Dairy Sci. 85(5):1165-75
76
Manteca, X., J. J. Villalba, S. B. Atwood, L. Dziba, and F. D. Provenza. 2008. Is
dietary choice important to animal welfare? J. Vet. Behav. 3, 229–239.
Mao, S. Y., W. J. Huo, and W. Y. Zhu. 2014. Microbiome-metabolome analysis reveals
unhealthy alterations in the composition and metabolism of ruminal
microbiota with increasing dietary grain in a goat model. Environ
Microbiol. 2016 Feb;18(2):525-41. J Appl Genet. 2015 Aug;56(3):411-26.
Maskalová, I., and V. Vajda. 2015. Digestibility of NDF and its effect on the level of
rumen fermentation of carbohydrates. Acta fytotechn. Zootechn. 18, 2015(4):
110–113
Maulfair, D. D., G. I. Zanton, M. Fustini, and A. J. Heinrichs. 2010. Effect of feed
sorting on chewing behavior, production, and rumen fermentation in lactating
dairy cows. J. Dairy Sci. 93:4791–4803.
Maulfair, D. D., M. Fustini, and A. J. Heinrichs. 2011. Effect of varying total mixed
ration particle size on rumen digesta and fecal particle size and digestibility
in lactating dairy cows. J. Dairy Sci. 94:3527-3536.
McCabe, M. S., P. Cormican, K. Keogh, A. O’Connor, E. O’Hara, and R. A. Palladino.
2015. Illumina MiSeq Phylogenetic Amplicon Sequencing Shows a Large
Reduction of an Uncharacterised Succinivibrionaceae and an Increase of
the Methanobrevibacter gottschalkii Clade in Feed Restricted Cattle. PLoS
ONE 10(7): e0133234.
McEwan, N. R., L. Abecia, M. Regensbogenova, C. L. Adam, P. A. Findlay, and C. J.
Newbold. 2005. Rumen microbial population dynamics in response to
photoperiod. Lett Appl Microbiol 41, 97–101
McGeough, E. J., P. O’Kiely, K. J. Hart, A. P. Moloney, T. M. Boland, and D. A. Kenny.
2010. Methane emissions, feed intake, performance, digestibility, and rumen
fermentation of finishing beef cattle offered whole-crop wheat silages
differing in grain content. J. Anim. Sci. 88:2703–2716
McGilliard, M. L., J. M. Swisher and R. E. James. 1983. Grouping lactating cows by
nutritional requirements for feeding. J. Dairy Sci. 66:1084-1093.
77
Meale, S. J., S. Li, P. Azevedo, H. Derakhshani, , E. Khafipour, and M. A. Steele. 2016.
Development of Ruminal and Fecal Microbiomes Are Affected by Weaning
But Not Weaning Strategy in Dairy Calves. Front. Microbiol. 7:582.
Mertens, D. R. 1997. Creating a system for meeting fiber requirements of dairy cattle.
J. Dairy Sci., 80: 1463-1482. methanogenesis in the rumen. Phytochemistry,
71, 1198–1222
Michelland, R. J., V. Monteils, A. Zened, S. Combes, L. Cauquil, T. Gidenne, J.
Hamelin, and L. Fortun-Lamothe. 2009. Spatial and temporal variations of
the bacterial community in the bovine digestive tract. J Appl Microbiol 107,
1642–1650.
Miller, W. H., and R. M. Koes. 1988. Construction and operation of an open-circuit
indirect calorimetry system for small ruminants. J. Anim. Sci. 66:1042
Mills, J. A. N., L. A. Crompton, A. Bannink, S. Tamminga, J. M. Moorby, C.
K. Reynolds. 2009. Predicting methane emissions and nitrogen excretion
from cattle. Proceedings of the forty-first meeting of the agricultural research
modelers’ group, Journal of Agricultural Science 147, 731–742.
Mitsumori, M., and W. Sun. 2008. Control of rumen microbial fermentation for
mitigating methane emissions from the rumen. Asian-Aust. J. Anim. Sci.
21:144-154.
Mitsumori, M., T. Shinkai, A. Takenaka, O. Enishi, K. Higuchi, Y. Kobayashi, I.
Nonaka, N. Asanuma, S. E. Denman, and C. S. McSweeney. 2011. Responses
in digestion, rumen fermentation and microbial populations to inhibition of
methane formation by a halogenated methane analogue. Br. J. Nutr. 8:1–10.
Mizrahi-Man, O., E. R. Davenport, and Y. Gilad. 2013. Taxonomic Classification of
Bacterial 16S rRNA Genes Using Short Sequencing Reads: Evaluation of
Effective StudyDesigns. PLoS ONE, 8(1), e53608.
Moe, P. W., and H. F. Tyrrell. 1979. Methane production in dairy cows. J. Dairy Sci.
62:1583–1586.
Moe, P. W., and H. F. Tyrrell. 1980: Methane production in dairy cows. In: L.E. Mount,
78
ed. ‘Energy metabolism.’ Butterworths, London, UK. Pp 59-62.
Morgavi, D. P., W. J. Kelly, P. H. Janssen, and G. T. Attwood. 2013. Rumen microbial
(meta)genomics and its application to ruminant production. Animal7:184-201.
Morgavi, D. P., C. Martin, J. P. Jouany, M. J. Ranilla. 2012. Rumen protozoa and
methanogenesis: not a simple cause-effect relationship. Br J Nutr.107(3):388-
97
Moseley, J. E., C. E. Coppok, and G. B. Lake. 1976. Abrupt change in the forage-
concentrate ratios of complete feeds fed ad libitum to dairy cow. J. Dairy Sci.
59:1471-1483.
Moss, A. R., D. I. Givens, and P. C. Garnsworthy. 1995. The effect of supplementing
grass silage with barley on digestibility, in sacco degradability, rumen
fermentation and methane production in sheep at two levels of intake. Anim.
Feed Sci. Technol. 55 (1995) 9-33
Moss, A. R., J. P. Jouany, and J. Newbold. 2000. Methane production by ruminants: its
contribution to global warming. Ann. Zootech. 49:231–253.
Myer, P. R., T. P. L. Smith, J. E. Wells, L. A. Kuehn, and H. C. Freetly. 2015. Rumen
Microbiome from Steers Differing in Feed Efficiency. PLoS ONE 10(6):
e0129174.
Nagaraja, T. G., and E. C. Titgemeyer. Ruminal acidosis in beef cattle: the current
microbiological and nutritional outlook. 2007. J Dairy Sci. 90: E17–E38.
Newbold, J. R., S. M. van Zijderveld, R. B. A. Hulshof, W. B. Fokkink, R. A. Leng,
and P. Terencio. 2014. The effect of incremental levels of dietary nitrate on
methane emissions in Holstein steers and performance in Nelore bulls. J.
Anim. Sci. 92 5032–5040
Nicholson, J. W. G., and J. D. Sutton. 1969. The effect of diet composition and level of
feeding on digestion in the stomach and intestines of sheep. Br. J. Nutr.23,
585.
Nkrumah, J., E. K. Okine, G. W. Mathison, K. Schmid, C. Li. 2006. Relationships of
feedlot feed efficiency, performance, and feeding behavior with metabolic
79
rate, methane production, and energy partitioning in beef cattle. J. Anim.
Sci. 84: 145–153.
Nocek, J. E., R. L. Steele, and D. G. Braund. 1986. Performance of dairy cows fed
forage and grain separately versus a total mixed ration. J. Dairy Sci. 69:2140–
2147.
Nock, J. E. R., L. Steele, and D. G. Braund. 1985. Effect of mixed ration nutrient
density on milk of cows transferred from high production group. J. Dairy Sci.
68:133-139.
Nousiainen, J., M. Rinne, and P. Huhtanen. 2009. A meta-analysis of feed digestion in
dairy cows. 1. The effects of forage and concentrate factors on total diet
digestibility. J. Dairy Sci. 92:5019–5030.
NRC. 2001. Nutritional Requirements of Dairy Cattle. 7th ed. National Academy Press,
Washington, DC
Nyonyo, T., T. Shinkai, and M. Mitsumori. 2014. Improved culturability of cellulolytic
rumen bacteria and phylogenetic diversity of culturable cellulolytic and
xylanolytic bacteria newly isolated from the bovine rumen. FEMS Microbiol
Ecol. 88(3): 528–537.
O’Neill, B. F., M. H. Deighton, B. M. O’Loughlin, F. J. Mulligan, T. M. Boland, M.
O’Donovan, and E. Lewis. 2011. Effects of a perennial ryegrass diet or total
mixed ration diet offered to spring-calving Holstein-Friesian dairy cows on
methane emissions, dry matter intake, and milk production. J. Dairy Sci.
94:1941–1951
O’Neill, B. F., M. H. Deighton, B. M. O’Loughlin, N. Galvin, M. O’Donovan, and E.
Lewis. 2012. The effects of supplementing grazing dairy cows with partial
mixed ration on enteric methane emissions and milk production during mid to
late lactationJ. Dairy Sci., 95, pp. 6582–6590
Okine, E. K., G.W. Mathison, and R.T. Hardin. 1989. Effects of changes in frequency
of reticular contractions on fluid and particulate passage rates in cattle. J.
Anim. Sci., 67, pp. 3388–3396
80
Oren, A., and G. M. Garrity. 2014. Then and now: a systematic review of the
systematics of prokaryotes in the last 80 years. Antonie Van Leeuwenhoek,
106(1), 43-56.
Owen, J. B. 1984. Complete-diet feeding for cattle. Livest. Prod. Sci. 11:269-285.
Owens, F. N., and A. L. Goetsch. 1986. Digesta passage and microbial protein
synthesis. in: L.P. Milligan, W.L. Grovum, A. Dobson (Eds.) Control of
Digestion and Metabolism in Ruminants. Prentice-Hall, Englewood Cliffs,
NJ; 196
Owens, F. N., and H. R. Isaacson. 1977. Ruminal microbial yields: Factors influencing
synthesis and bypass. Fed. Proc. 36:198–202.
Owens, F. N., D. S. Secrist, W. J. Hill, and D. R. Gill. 1998. Acidosis in cattle: a review.
J Anim Sci. 76:275–286.
Pace, N. R. 1997. A molecular view of microbial diversity and the biosphere. Science
276, 734–740.
Paillard, D., N. McKain, L. Chaudhary, N. Walker, F. Pizette, I. Koppova, N. McEwan,
J. Kopečný, P. Vercoe, P. Louis, and R. J. Wallace. 2007. Relation between
phylogenetic position, lipid metabolism and butyrate production by different
Butyrivibrio-like bacteria from the rumen. Antonie Van Leeuwenhoek 91:
417- 422.
Patra, A. K, and Z. Yu. 2013. Effects of gas composition in headspace and bicarbonate
concentrations in media on gas and methane production, degradability, and
rumen fermentation using in vitro gas production techniques. J. Dairy Sci.,
96 , pp. 4592–4600
Pelchen and Peters. 1998. Methane emissions from sheep. Small Ruminant Research
27 (1998) 137-150
Peng, S., J. Yin, X. Liu, B. Jia, Z. Chang, H. Lu, and Q. Chen 2015. First insights into
the microbial diversity in the omasum and reticulum of bovine using Illumina
sequencing. J Appl Genet. 56(3), 393–401.
Petri, R. M., T. Schwaiger, G. B. Penner, K. A. Beauchemin, and R. J. Forster. 2013.
81
Characterization of the Core Rumen Microbiome in Cattle during Transition
from Forage to Concentrate as Well as during and after an Acidotic Challenge.
PLoS ONE 8(12): e83424.
Pinares-Patiño, C. S., G. C. Waghorn, A. Machmüller, B. Vlaming, G. Molano, A.
Cavanagh, and H. Clark. 2007. Methane emissions and digestive physiology
of non-lactating dairy cows fed pasture forage. Can. J. Anim. Sci. 87:601–
613
Pinares-Patiño, C. S., G. C. Waghorn, R. S. Hegarty, and S. O. Hoskin. 2009. Effects of
intensification of pastoral farming on greenhouse gas emissions in New
Zealand. N. Z. Vet. J. 57:252–261.
Pitta, D. W, S. Kumar, B. Veiccharelli, N. Parmar, B. Reddy, and C. G. Joshi. 2014.
Bacterial diversity associated with feeding dry forage at different dietary
concentrations in the rumen contents of Mehshana buffalo (Bubalus bubalis)
using 16S pyrotags. Anaerobe 25:31–41
Pitta, D. W., W. E. Pinchak, and S. E. Dowd. 2010. Rumen bacterial diversity dynamics
associated with changing from bermudagrass hay to grazed winter wheat
diets. Microb Ecol 59: 511–522.
Plaizier, J. C., D. O. Krause, G. N. Gozho, and B. W. McBride. 2008. Subacute ruminal
acidosis in dairy cows: the physiological causes, incidence and
consequences. The Veterinary Journal, 176:21–31.
Pope, P. B., W. Smith, S. E. Denman, S. G. Tringe, K. Barry, P. Hugenholtz, C. S.
McSweeney, A. C. McHardy, and M. Morrison. 2011. Isolation of
Succinivibrionaceae implicated in low methane emissions from Tammar
wallabies. Science 333:646–648
Popova, M., C. Martin, M. Eugène, M. M. Mialon, and M. Doreau. 2011. Effect of
fibre- and starch-rich finishing diets on methanogenic Archaea diversity and
activity in the rumen of feedlot bulls. Anim. Feed Sci. Technol.166–167:
113–121.
Popova, M., D. P. Morgavi, C. Martin. 2013. Methanogens and methanogenesis in the
82
rumens and ceca of lambs fed two different high-grain-content diets. Appl
Environ Microbiol . 79: 1777–1786
Prive, F., N. N. Kaderbhai, S. Girdwood, H. J. Worgan, E. Pinloche, and N. D. Scollan.
2013. Identification and Characterization of Three Novel Lipases Belonging
to Families II and V from Anaerovibrio lipolyticus 5ST. PLoS ONE. 28(8):
e69076.
Purushe, J., D. E. Fouts, M. Morrison, B. A. White, R. I. Mackie, North American
Consortium for Rumen Bacteria, P. M. Coutinho, B. Henrissat, and K. E.
Nelson. 2010. Comparative genome analysis of Prevotella
ruminicola and Prevotella bryantii: insights into their environmental niche.
Microb Ecol 60:721–729
Reichardt, N., S. H. Duncan, P. Young, A. Belenguer, C. Mcwilliam Leitch, and K. P.
Scott. 2014. Phylogenetic distribution of three pathways for propionate
production within the human gut microbiota. ISME J 8: 1323–1335.
Renna, M., P. Cornale, C. Lussiana, L. M. Battaglini, G. Turille, and A. Momosi. 2014.
Milk yield, gross composition and fatty acid profile of dual-purpose Aosta
Red Pied cows fed separate concentrate-forage versus total mixed ration.
Anim Sci J. 85: 37-45.
Robertson, L. J., and G. C. Waghorn. 2002. Dairy industry perspectives on methane
emissions and production from cattle fed pasture or total mixed rations in
New Zealand. Proc. N.Z. Soc. Anim. Prod., 62 (2002), pp. 213–218
Ruser, B. (1989). Erfassung und Identifizierung des epiphytischen
Milchsaurebakterienbesatzes auf Gras und Mais in abhangigkeit von Standort,
Sorte, Entwicklungsstadium sowie Ernte- und Klimaeinflussen. Ph.D.
Dissertation. (Institute of Grassland and Forage Research, Braunschweig,
Germany).
Russell, J. B., and R. B. Hespell. 1981. Microbial rumen fermentation. J. Dairy Sci.
64:1153–1169.
Russell, J. B., J. D. O’Connor, D. G. Fox, P. J. Van Soest, and C. J. Sniffen. 1992. A net
83
carbohydrate and protein system for evaluating cattle diets: I. Ruminal
fermentation. J. Anim. Sci. 70:3551–3561
Sauer, F. D., V. Fellner, R. Kinsman, J. K. Kramer, H. A. Jackson, A. J. Lee, and S.
Chen. 1998. Methane output and lactation response in Holstein cattle with
monensin or unsaturated fat added to the diet. J. Anim. Sci. 76:906–914.
Sauvant, D., and S. Giger-Reverdin. 2007. “Empirical modelling meta-analysis of
digestive interactions and CH4 production in ruminants,” in Energy and
Protein Metabolism and Nutrition, I. Ortigues-Marty, N. Miraux, and W.
Brand-Williams, Eds., pp. 561–563, Wageningen Academic, Wageningen,
The Netherlands.
Seedorf, H., S. Kittelmann, P. H. Janssen. 2015. Few highly abundant operational
taxonomic units dominate within rumen methanogenic archaeal species in
New Zealand sheep and cattle. Appl Environ Microbiol 81:986 –995.
Shabat, S., G. Sasson, A. Doron-Faigenboim, T. Durman, S. Yaacoby, M. Miller, B.
White, N. Shterzer, and I. Mizrahi. 2016. Specific microbiome-dependent
mechanisms underlie the energy harvest efficiency of ruminants. The ISME
Journal 10.1038/ismej.2016.62
Shaver, R. D., and L. D. Nylt. 1986. Influence of amount of feed intake and forage
form on digestion and passage of pre bloom alfalfa forage in dairy cows. J.
Dairy Sci., 69, 1545-1559.
Shi, W., C. D. Moon, S. C. Leahy, D. Kang, J. Froula, S. Kittelmann, C. Fan, S.
Deutsch, D. Gagic, H. Seedorf, and W. J. Kelly. 2014. Methane yield
phenotypes linked to differential gene expression in the sheep rumen
microbiome. Genome research, 24(9), 1517-1525.
Shibata, M., and T. Terada. 2010. Factors Affecting Methane Production and Mitigation
in Ruminants. Anim Sci J. 81, 2-10.
Singh, K. M., A. K. Patel, R. K. Shah, B. Reddy, and C. G. Joshi. 2015. Potential
functional gene diversity involved in methanogenesis and methanogenic
community structure in Indian buffalo (Bubalus bubalis) rumen. J Appl
84
Genet. 2015 Aug; 56(3):411-26.
Skillman, L. C., P. N. Evans, G. E. Naylor, B. Morvan, and G. N. Jarvis. 2004. 16S
ribosomal DNA-directed PCR primers for ruminal methanogens and
identification of methanogens colonising young lambs. Anaerobe10: 277–285.
Sliwinski, B. J., M. Kreuzer, H. R. Wettstein, and A. Machmuller. 2002. Rumen
fermentation and nitrogen balance of lambs fed diets containing plant extracts
rich in tannins and saponins and associated emissions of nitrogen and
methane. Arch. Anim. Nutr. 56:379–392.
Snelling, T. J., B. Genç, N. McKain, M. Watson, S. M. Waters, and C. J. Creevey. 2014.
Diversity and Community Composition of Methanogenic Archaea in the
Rumen of Scottish Upland Sheep Assessed by Different Methods. PLoS ONE
9(9): e106491.
Staerfl, S. M., S. L. Amelchanka, T. Kälber, C. R. Soliva, M. Kreuzer, and J. O. Zeitz.
2012. Effect of feeding dried high-sugar ryegrass (‘AberMagic’) on methane
and urinary nitrogen emissions of primiparous cows. Livest. Sci. 150:293–
301.
Stevenson, D. M, and P. J. Weimer. 2007. Dominance of Prevotella and low abundance
of classical ruminal bacterial species in the bovine rumen revealed by relative
quantification real-time PCR. Appl Microbiol Biotechnol 75:165–174
St-Pierre, B. and Wright, A.D. 2013. Diversity of gut methanogens in herbivorous
animals. Animal, 7(s1), 49-56
Sundset, M. A., J. E. Edwards, Y. F. Cheng, R. S. Senosiain, M. N. Fraile. 2009.
Molecular diversity of the rumen microbiome of Norwegian reindeer on
natural summer pasture. Microb Ecol. 57:335–348.
Tajima, K., R. I. Aminov, T. Nagamine, K. Ogata, M. Nakamura, H. Matsui, and Y.
Benno. 1999. Rumen bacterial diversity as determined by sequence analysis
of 16S rDNA libraries. FEMS Microbiol Ecol 29, 159–169.
Tajima, K., S. Arai, K. Ogata, T. Nagamine, H. Matsui, M. Nakamura, R. I. Aminov,
and Y. Benno. 2000. Rumen bacterial community transition during adaptation
85
to high-grain diet. Anaerobe 6, 273–284.
Tajima, K., T. Nagamine, H. Matsui, M. Nakamura, and R. I. Aminov. 2001.
Phylogenetic analysis of archaeal 16S rRNA libraries from the rumen
suggests the existence of a novel group of archaea not associated with known
methanogens. FEMS Microbiol Lett 200, 67–72
Takahashi, J., A. S. Chaudhry, R. G. Beneke, and B. A. Young. 1997. Modification of
methane emission in sheep by cysteine and a microbial preparation. Sci. Total
Environ. 204: 117–123.
Tamminga, S. 1979. Protein degradation in the forestomachs of ruminants. J. Anim. Sci.
49:1615–1630.
Thoetkiattikul, H., W. Mhuantong, T. Laothanachareon, S. Tangphatsornruang, V.
Pattarajinda, L. Eurwilaichitr, and V. Champreda. 2013. Comparative analysis
of microbial profiles in cow rumen fed with different dietary fiber by tagged
16S rRNA gene pyrosequencing Curr. Microbiol., 67, pp. 130–137
Thornton, R. F., and D. J. Minson. 1972. The relationship between voluntary intake and
mean apparent retention time in the rumen. Aust. J. Agric. Res. 23:871–877
Turnbaugh, P. J., R. E. Ley, M. Hamady, C. M. Fraser-Liggett, R. Knight, and J. I.
Gordon. 2007. The human microbiome project. Nature, 449:804-810.
Ungerfeld, E. M. 2015. Shifts in metabolic hydrogen sinks in the methanogenesis-
inhibited ruminal fermentation: a meta-analysis. Front Microbiol 6: 37.
UNPD (United Nations Population Division). 2015. Population Division of the
Department of Economic and Social Affairs of the United Nations Secretariat,
World Population Prospects. See http://esa. un.org/unpp
Van der Nagel, L. S., G. C. Waghorn, and V. E. Forgie. 2003. Methane and carbon
emissions from conventional pasture and grain-based total mixed rations for
dairying, Proc. N.Z. Soc. Anim. Prod., 6,: 128
Van Gylswyk, N. O. 1995. Succiniclasticum ruminis gen. nov. sp. nov., a rumen
bacterium converting succinate to propionate as sole energy yielding
mechanism. Int. J Syst Bacteriol. 45: 297–300.
86
Van Nevel, C. J. and D. I. Demeyer. 1996. Control of rumen methanogenesis. Environ.
Monit. Assess. 42: 3–97
Van Soest, P. J., J. B. Robertson, and B. A. Lewis. 1991. Methods for dietary fiber,
neutral-detergent fiber and nonstarch polysaccharides in relation to animal
nutrition. J. Dairy Sci., 74: 3583-3597.
Van Vugt, S. J., G. C. Waghorn, D. A. Clark, and S. L. Woodward. 2005. Impact of
monensin on methane production and performance of cows fed forage diets.
Proc. N.Z. Soc. Anim. Prod. 65:362–366
Vodovnik, M., S. H. Duncan, M. D. Reid, L. Cantlay, K. Turner, J. Parkhill, R. Lamed,
C. J. Yeoman, M. E. B. Miller, B. A. White, E. A. Bayer, R. Marinsek-Logar,
and H. J. Flint. 2013. Expression of cellulosome components and type IV pili
within the extracellular proteome of Ruminococcus flavefaciens007. PLoS
ONE 8: e65333
Waghorn, G. C. 2008. Beneficial and detrimental effects of dietary condensed tannins
for sustainable sheep and goat production – Progress and challenges. Anim.
Feed Sci. Technol. 147:116–139.
Waghorn, G. C., and R. S. Hegarty. 2011. Lowering Ruminant Methane Emissions
through Improved Feed Conversion Efficiency. Anim. Feed Sci. Technol.
166-167, 291-301.
Waghorn, G. C., H. Clark, V. Taufa, and A. Cavanagh. 2008a. Monensin controlled-
release capsules for methane mitigation in pasture-fed dairy cows. Aust. J.
Exp. Agric. 48:65–68.
Wallace, R. J., J. Rooke, N. McKain, C. A. Duthie, J. J. Hyslop, and D. W. Ross. 2015.
The rumen microbial metagenome associated with high methane production
in cattle. BMC Genomics. 2015;16: 839.
Wang, J., M. Liu, Y. Wu, L. Wang, J. Liu, L. Jiang, and Z. Yu. 2016. Medicinal herbs as
a potential strategy to decrease methane production by rumen microbiota: a
systematic evaluation with a focus on Perilla frutescens seed extract. Appl
Microbiol Biotechnol .2016. 100:9757–9771
87
Warnecke, F., P. Luginbuhl, N. Ivanova, M. Ghassemian, T. H. Richardson, J. T. Stege,
M. Cayouette, A. C. McHardy, G. Djordjevic, and N. Aboushadi. 2007.
Metagenomic and functional analysis of hindgut microbiota of a wood-
feeding higher termite. Nature, 450: 560-U517.
Webster, T. M., A. L. Smith, R. R. Reddy, A. J. Pinto, K. F. Hayes, and L. Raskin. 2016.
Anaerobic microbial community response to methanogenic inhibitors
2‐ bromoethanesulfonate and propynoic acid. MicrobiologyOpen, 5(4), 537–
550.
Weimer, P. J., G. C. Waghorn, C. L. Odt, and D. R. Mertens. 1999. Effect of diet on
populations of three species of ruminal cellulolytic bacteria in lactating dairy
cows. J Dairy Sci 82, 122–134.
Welkie, D. G., D. M. Stevenson, P. J. Weimer. 2009. ARISA analysis of ruminal
bacterial community dynamics in lactating dairy cows during the feeding
cycle. Anaerobe. 16:94–100.
Whitford, M. F., R. J. Forster, C. E. Beard, J. Gong, and R. M. Teather. 1998.
Phylogenetic analysis of rumen bacteria by comparative sequence analysis of
cloned 16S rRNA genes. Anaerobe 4, 153–163.
Whitford, M. F., R. M. Teather, and R. J. Forster. 2001. Phylogenetic analysis of
methanogens from the bovine rumen. BMC Microbiology 1, 5.
Williams, A. G. and G. S. Coleman. 1991. The rumen protozoa. Springer-Verlag, New
York.
Willner, D., M. Furlan, R. Schmieder, J. A. Grasis, D. T. Pride, D. A. Relman, F. E.
Angly, T. McDole, R. P. Mariella, and F. Rohwer. 2011. Metagenomic
detection of phage-encoded platelet-binding factors in the human oral cavity.
In Proceedings of the National Academy of Sciences of the United States of
America, 108(Suppl. 1):4547-4553.
Wolin, M. J., and T. L. Miller. 1988. Microbe interactions in the rumen microbial
ecosystem. In: P. N. Hobson (Ed.). The Rumen Ecosystem. Elsevier Applied
Science, New York
88
Woodward, S. L., G. C. Waghorn, M. J. Ulyatt, and K. R. Lassey. 2001. Early
indications that feeding Lotus will reduce methane emissions from ruminants.
Proc. N.Z. Soc. Anim. Prod. 61:23–26.
Wust, P. K., M. A. Horn, H. L. Drake. 2011. Clostridiaceae and Enterobacteriaceae as
active fermenters in earthworm gut content. ISME J. 5 92–106.
10.1038/ismej.2010.99
Yan, T., D. C. Patterson and F. J. Gordon. 1998. The effect of two methods of feeding
the concentrate supplement to dairy cows of high genetic merit. Animal
Science, 67, pp 395-403
Yang, W. Z., and K. A. Beauchemin. 2005. Effects of physically effective fiber on
digestion and milk production by dairy cows fed diets based on corn silage. J.
Dairy Sci. 88:1090–1098.
Yang, W. Z., and K. A. Beauchemin. 2007. Altering physically effective fiber intake
through forage proportion and particle length: Digestion and milk production.
J. Dairy Sci. 90:3410–3421.
Yang, W. Z., K. A. Beauchemin, D. D. Vedres, G. R. Ghorbani, D. Colombatto, and D.
P. Morgavi. 2004. Effects of direct-fed microbial supplementation on ruminal
acidosis, digestibility, and bacterial protein synthesis in continuous culture.
Anim. Feed Sci. Technol. 114, 179–193.
Yurtseven, S. and M. Görgülü, 2004. Effects of Grain Sources and Feeding Methods,
Free Choice vs Total Mixed Ration, on Milk Yield and Composition of
German Fawn × Hair Crossbred Goats in Mid Lactation. Journal of Animal
and Feed Sciences, 13: 417-428.
Yurtseven, S., M. Cetin, I. Ozturk, A. Can, M. Boga, T. Sahin, and H. Turkoglu. 2009.
Effect of different feeding method on methane and carbon dioxide emissions,
milk yield and composition of lactating Awassi sheep. Asian J Anim Vet Adv
4:278-287.
Zened, A., S. Combes, L. Cauquil, J. Mariette, C. Klopp, and O. Bouchez. 2013.
Microbial ecology of the rumen evaluated by 454 GS FLX pyrosequencing is
89
affected by starch and oil supplementation of diets. FEMS Microbiol Ecol.
83(2):504–14.
Zhao, L., Q. Meng, L. Ren, W. Liu, X. Zhang, Y. Huo, and Z. Zhou. 2015. Effects of
Nitrate Addition on Rumen Fermentation, Bacterial Biodiversity and
Abundance. Asian-Australas J Anim Sci, 28(10), 1433–1441.
Zhou, M., Y. Chen, and L. L. Guan. 2015. Rumen Bacteria. In Rumen Microbiology:
From Evolution to Revolution (pp. 79-95). Springer India.
Zhou, Y. Y., H. L. Mao, F. Jiang, J. K. Wang, J. X. Liu, and C. S. Mc- Sweeney. 2011.
Inhibition of rumen methanogenesis by tea saponins with reference to
fermentation pattern and microbial communities in Hu sheep. Anim. Feed Sci.
Technol. 166–167:93–100
Ziołecki, A. 1979. Isolation and characterization of large treponemes from the bovine
rumen. Appl Environ Microbiol. 37:131–135
90
요 약
조사료와 농후사료를 각각 급여하는 분리급여(SF; Separate
feeding)와 이들 사료를 혼합(TMR; Total mixed ration)하여 급여하
는 방법이 반추가축 장내발효 메탄생산에 어떤 영향을 주는지는 거의
연구된 바가 없다. 따라서 본 연구에서는 6두의 홀스타인 육우(체중
230∼570kg)를 공시하여 각각 1일 사료급여량을 체중의 2.4(실험 1)
그리고 2.0%(실험 2) 급여하는 Latin square design의 실험을 연속해
서 수행하였다. 공시사료의 조사료와 농후사료 비율은 73 : 27이었으
며, 모든 사료원료 구성이 동일하였다. 사료를 체중의 2.4%을 섭취한
실험 1에서는 메탄 생산량의 유의적 차이가 없었지만(P > 0.1), 체중
의 2.0%를 섭취한 실험 2에서는 SF 방법이 TMR 방법 보다 1일 메
탄 생산량(114.2 vs. 138.5 L/d; P < 0.005) 그리고 메탄에너지 손
실 비율(3.39 vs. 4.08%; P < 0.005)에서 유의성있게 낮은 값을 보
였다. 또한 SF 방법은 TMR 방법과 비교하여 낮은 반추위 pH (P <
0.05), 높은 ammonia-N과 total VFA 농도(P <0.05)를 보였다. 특히
SF 방법에서 acetate:propionate 비율 (2.2 vs 2.6; P < 0.05)이 유의
성있게 낮았던 것은 SF 방법이 메탄생성보다는 propionate 생성을

91
위해에 더 많은 수소를 기질로 이용하였다는 것을 설명해주고 있다.
반추위 미생물 16SrRNA 분석 결과는 TMR 방법에서 Leuconostoc
과 RFN20 population, SF 방법에서 Coprococcus 비율이 높아지는
경향을 보였다. 본 논문은 SF 방법이 TMR 급여 방법보다 메탄생산
량이 적다는 첫번째 보고이지만, 보다 정확한 결론을 위해서는 추가
연구가 수행되어야 할 것으로 생각된다.
주요어: 메탄, 반추위, 분리급여, 혼합급여
학 번: 2015-22097