Embed Size (px)
Citation preview

저 시-비 리- 경 지 2.0 한민
는 아래 조건 르는 경 에 한하여 게
l 저 물 복제, 포, 전송, 전시, 공연 송할 수 습니다.
다 과 같 조건 라야 합니다:
l 하는, 저 물 나 포 경 , 저 물에 적 된 허락조건 명확하게 나타내어야 합니다.
l 저 터 허가를 면 러한 조건들 적 되지 않습니다.
저 에 른 리는 내 에 하여 향 지 않습니다.
것 허락규약(Legal Code) 해하 쉽게 약한 것 니다.
Disclaimer
저 시. 하는 원저 를 시하여야 합니다.
비 리. 하는 저 물 리 목적 할 수 없습니다.
경 지. 하는 저 물 개 , 형 또는 가공할 수 없습니다.
A DISSERTATION FOR THE MASTER DEGREE OF FOREST SCIENCES
Characteristics of Wintering Bird Communities in
Different Habitat Types in the Moeyungyi
Wetland Wildlife Sanctuary, Myanmar
미얀마 모엔지 습지 야생동물 보호구역의
서식지 유형과 월동 조류 군집의 특성
By
HSU SANDAR AUNG
DEPARTMENT OF FOREST SCIENCES
GRADUATE SCHOOL
SEOUL NATIONAL UNIVERSITY
AUGUST 2015
A DISSERTATIO FOR TilE MASTER DEGREE OF FOREST SCIE CES
Characteristics of Wintering Bird Communities in Different Habitat Types in
the Moeyungyi Wetland Wildlife Sanctuary, Myanmar
0 1 ~0} .£ ~?;1 fr?;l 0~"'§%% .!i!.~-=jL~ ~
~~~*·~~~·%~*~~~~~
UNDER THE SUPERVISION OF ADVISOR
PROFESSOR WOO-SHIN LEE
SUBMITTED TO THE FACULTY OF THE GRADUATE SCHOOL OF SEOUL NATIONAL UNIVERSITY
MAJOR IN FOREST ENVIRONMENTAL SCIENCE
AUGUST 2015
APPROVED AS A QUALIFIED DISSERT ATIO OF
HSU SANDAR AUNG
JULY 2015
FOR THE DEGREE OF MASTER OF SCIENCE
BY THE EXAMINING COMMITTEE
CHAIR:
VICE CHAIR:
MEMBER:
PILSUNPARK
WOO-SHIN LEE
SHIN-JAE RHIM
Abstract
Understanding the bird communities in different habitat types is
essential for the conservation of important habitats. Wetlands possess different
types of habitats, are important for wintering waterbird community. However,
there is only a handful of studies, dealing habitat-bird relationship, done in the
wetlands of tropical Southeast Asia. The aim of this study is to compare bird
community characteristics at different habitat types and find the relationships
between bird community composition and environment characters at different
habitat types at Moeyungyi wetlands, and conduct species analysis to identify
indicator species for each representative habitat types in Moeyungyi wetland.
Bird and habitat data collection was made among five representative habitat
types (short grasslands, tall grasslands, lotus fields, open water areas, and rice
fields) during December, January, and the first week of February of 2014-15,
at the Moeyungyi Wetland Wildlife Sanctuary, Myanmar.. A total of 52
different bird species belonging to 11971 total individuals were encountered
during the survey season with 50 point count stations of 7 minutes observation
per plot. Natural wetlands hosted high species richness, abundances and
diversity of birds while rice fields showed lowest species richness,
abundances and diversity of birds. The canonical correspondence analysis
revealed the habitat preferences of each bird species.Marsh Sandpipers
(Tringa stagnatilis) and Oriental Darters (Anhinga melanogaster) were
strongly related to short grasslands. Purple Herons (Ardea purpurea) and
Purple Swamphens (Porphyrio porphyrio) preferred tall grasslands while
i
Bronze-winged Jacanas (Metopidius indicus) and Garganeys (Anas
querquedula) tend to occur at lotus fields. Little Terns (Sternula albifrons) and
White-winged Terns (Chlidonias leucopterus) were widely distributed in open
water areas, and Pacific Golden Plovers (Pluvialis fulva) and Pintail Snipes
(Gallinago stenura) belonged rice fields. Among the 52 bird species observed
during the survey, 35 species were recognized as indicator species for each
five habitat types, which was in accordance with canonical correspondence
analysis results that supported with the relationships between each
representative habitat types. In conclusion, The composition of bird
communities was different between five habitats and more importantly, that
the rice fields had lower indices for bird communities than any other natural
habitat types. Natural marshes were more beneficial in maintaining of high
species richness, abundances and diversity of waterbirds than in rice fields
during the wintering period. Thus, the further management strategies should
target the conservation of natural marshes, as an important habitat for the
conservation of wintering waterbird communities at Moeyungyi Wetland.
Also. indicator species found in this study can be a useful measure for the
management of Moyungyi wetland, and even can be applied to broader
geographic region including tropical South and Southeast Asia which holds
similar wetland habitats and waterbird communities during winter.
Keywords: indicator species analysis, natural marshes, rice fields, tropical
Southeast Asia, waterbirds
Student ID: 2013-23874 ii
Table of Contents
Abstract……………………………………………………………… i
Table of Contents……………………………………………………. iii
List of Tables………………………………………………………… v
List of Figures ……………………………………………………….. vi
I. Introduction ……………………………………………………….. 1
II. Literature Review ………………………………………………… 5
1. Relationship between bird communities and habitats…………... 5
2. Review on Asian Waterbird Census and other bird surveys in
Myanmar ………………………………………………………... 8
3. Indicator species ……………………………………………….. 10
III. Materials and Methods ………………………………………….. 11
1. Study Area ……………………………………………………… 11
2. Habitat Surveys ………………………………………………… 16
3. Bird Surveys ……………………………………………………. 19
4. Data Analysis …………………………………………………… 21
4.1 Community analysis ………………………………………… 21
4.1.1 Dominance index ……………………………………… 21
4.1.2 Species richness and abundances ……………………… 21
4.1.3 Species diversity ……………………………………….. 22
4.1.4 Species evenness ………………………………………. 22
4.2 Indicator species analysis ………………………………….. 23
5. Statistical Analysis …………………………………………….. 25
iii
IV. Results ………………………………………………………….. 26
1. Comparison of habitat variables among different habitats ……… 26
2. Comparison of species richness, abundances and diversity of
birds among different habitats ………………………………….. 36
3. Relationship between bird communities and habitat variables ….. 51
4. Indicator species results ………………………………………… 56
V. Discussion …………………………………………………………. 60
1. Species richness, abundances and diversity of birds among
different habitats ………………………………………………… 60
2. Relationships between bird species and their habitat variables
and indicator species ……………………………………………. 64
VI. Conclusions and Management Implications ……………………. 69
VII. References …………………………………………………….... 72
Abstract in Korean ………………………………………………….. 82
Acknowledgements …………………………………………………… 84
iv
List of Tables
Table 1. Plant species and dominant cover percentage (DCP) detected in short
grassland habitats at Moeyungyi Wetland, Myanmar ……………………... 27
Table 2. Plant species and dominant cover percentage (DCP) detected in tall
grassland habitats at Moeyungyi Wetland, Myanmar ……………………… 28
Table 3. Plant species and dominant cover percentage (DCP) detected in lotus
field habitats at Moeyungyi Wetland, Myanmar…………………………… 29
Table 4. Bird species and relative abundance (%) recorded in rice field habitat at
Moeyungyi Wetland, Myanmar from Dec 2014 to Feb 2015 ……………… 38
Table 5. Bird species and relative abundance (%) recorded in short grassland
habitat at Moeyungyi Wetland, Myanmar from Dec 2014 to Feb 2015 …….39
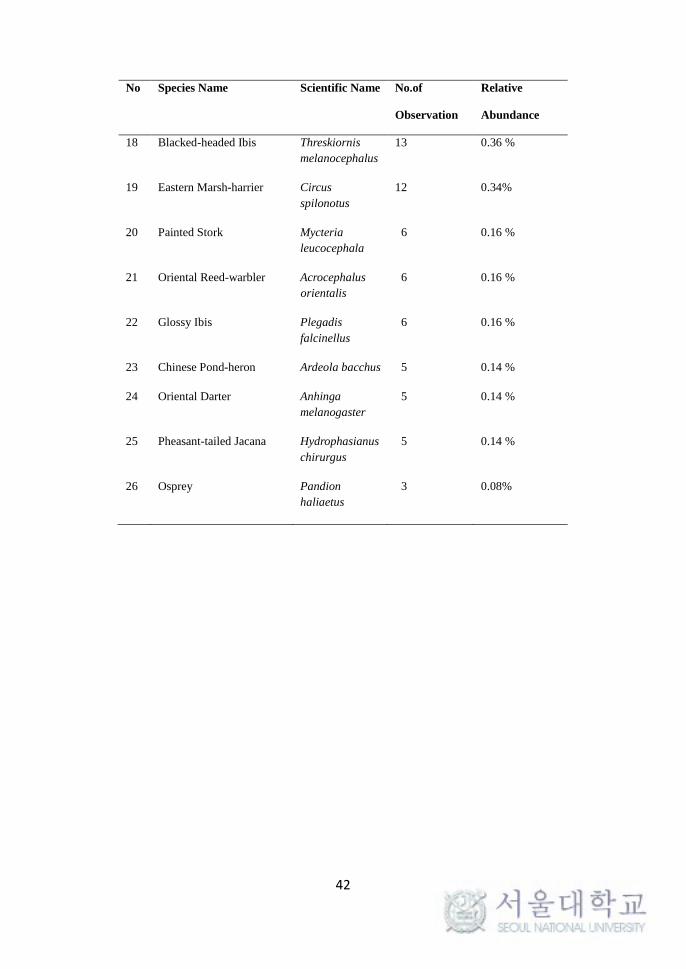
Table 6. Bird species and relative abundance (%) recorded in tall grassland
habitat at Moeyungyi Wetland, Myanmar from Dec 2014 to Feb 2015 …… 41
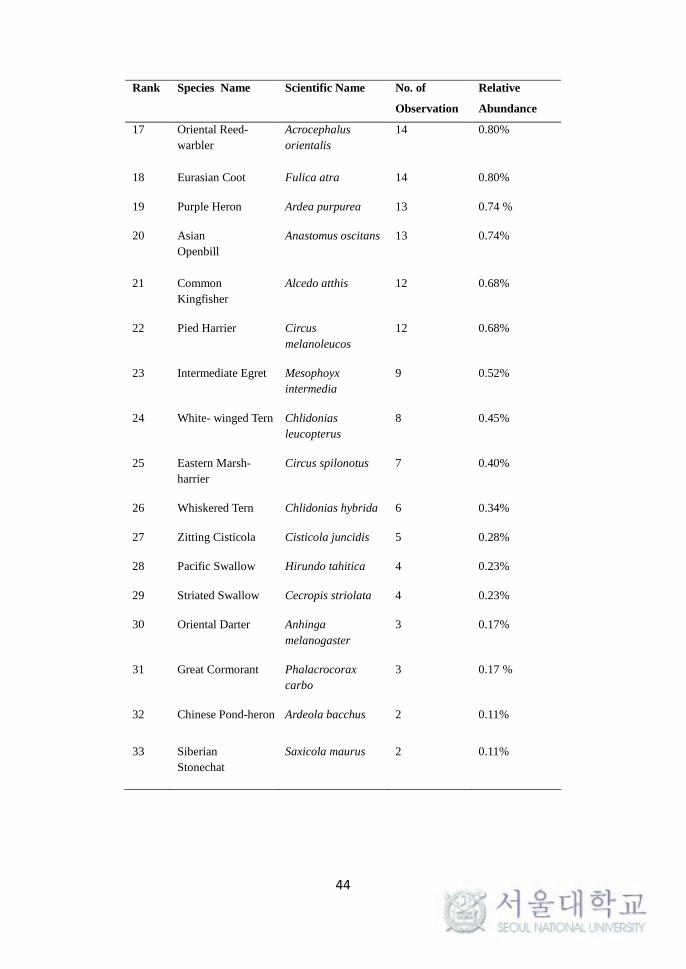
Table 7. Bird species and relative abundance (%) recorded in lotus field habitat at
Moeyungyi Wetland, Myanmar from Dec 2014 to Feb 2015 …… …….. 43
Table 8. Bird species and relative abundance (%) recorded in open water habitat
at Moeyungyi Wetland, Myanmar from Dec 2014 to Feb 2015 …… ………45
Table 9. Correlation with canonical axes showing correlation coefficient with
each CCA explanatory axis (p<0.05) ………………………………………. 53
Table 10. Indicator species in five habitat types of Moeyungyi Wetland in
Myanmar (Dufrene and Legendre’s method)………..………………………58
v
List of Figures
Figure 1. Map of Moeyungyi Wetland Wildlife Sanctuary ………………… 13
Figure 2. Area estimation of major habitat types in Moeyungyi Wetland in
winter (SG:short grassland, TG:tall grassland, LF:lotus field, OW:open
water, PT:planted tree, RF:rice field) (Moeyungyi Office-unpublished
data).………………………………………………………………….. 14
Figure 3. Habitat types in Moeyungyi Wetland (a) short grassland, (b) tall
grassland, (c) lotus field, (d) open water area (e) planted tree and (f) rice
field. ……….…………………………...………………………………. 15
Figure 4. Design for bird survey plots (circle) and habitat survey plots (box) at
each habitat type. Distance between each bird survey plot was 300 m at
least to avoid double counting of the same birds …………….................. 17
Figure 5. Habitat survey at Moeyungyi Wetland, Myanmar (December, 2014):
(a) marking the center of the plot with a bamboo pole, (b) vegetation
survey with point quadrat frame, (c) measuring water depth at tall
grassland and (d) measuring water depth at lotus field …….................... 18
Figure 6. Result of post hoc test (Bonferroni) in vegetation cover (percentage)
among different habitat types (RF:rice field, SG:short grassland, TG:tall
grassland, LF:lotus field) ……………………….. ………………………31
Figure 7. Result of post hoc test (Bonferroni) in vegetation density (number)
among different habitat types (RF:rice field, SG:short grassland, TG:tall
grassland, LF: lotus field)……………………………………………….. 32
vi
Figure 8. Result of post hoc test (Bonferroni) in vegetation height (cm) among
different habitat types (RF:rice field, SG:short grassland, TG: tall
grassland, LF:lotus field ) ……………………….……………………… 33
Figure 9. Result of post hoc test (Bonferroni) in plant species diversity
(number) among different habitat types (SG:short grassland, TG:tall
grassland, LF:lotus field) ………………..……………………………… 34
Figure 10. Result of post hoc test (Bonferroni) in water depth (cm) among
different habitat types (RF:rice field, SG:short grassland, TG:tall grassland,
LF:lotus field, OW:open water)………….……………………………… 35
Figure 11. Result of post hoc test (Bonferroni) in avian species richness
among different habitat types (RF:rice field, SG:short grassland, TG: tall
grassland, LF:lotus field, OW:open water).. ……………………………. 47
Figure 12. Result of post hoc test (Bonferroni) in avian species abundance
among different habitat types (RF:rice field, SG:short grassland, TG: tall
grassland, LF:lotus field, OW:open water) ..…………………………… 48
Figure 13. Result of post hoc test (Bonferroni) in avian species diversity
among different habitat types (RF:rice field, SG:short grassland, TG: tall
grassland, LF:lotus field, OW:open water). ……………………………. 49
Figure 14. Result of post hoc test (Bonferroni) in avian species evenness
among different habitat types (RF:rice field, SG:short grassland, TG: tall
grassland, LF:lotus field, OW: open water) …………………………...... 50
vii
Figure 15. Ordination diagrams of canonical correspondence analysis. Sites as
a linear combination of habitat measures. The abbreviation, such as lotus
(lotus field habitat), rice (rice field habitat), sg (short grassland habitat), tg
(tall grassland habitat), water (open water area) represents points within
each site (n=10 for each site). Arrows represent the direction of highest
change of habitat measures and are positioned toward the direction of the
highest increase of the variable. The length of the arrow describes the
significance of the habitat variable in the ideal, the direction of the arrow
explains how well the habitat variable is correlated with the various axes,
the angle between arrows points out the correlation between variables (a
small angle says high correlation) and the situation of a site score
corresponding to arrows shows the habitat characteristics of the site
………………………............................................................................... 54
Figure 16. Canonical Correspondence Analysis ordination diagram with bird
species and habitat variables measures (arrows). First axis is horizontal and
second axis is vertical. Arrows indicate the direction of highest change of
habitat variables measures. The location of a species score relative to
arrows denote the habitat preferences of the species
…………………………………………………………………............... 55
viii
I. Introduction
Wetlands are areas of marsh, fen, peatland or water, whether natural
or artificial, permanent or temporary, with water that is static or flowing, fresh,
brackish or salt, including areas of marine water, the depth of which at low
tide does not exceed six meters (Ramsar 1971). Wetlands can highly provide
biological diversity and possess ecological values. One of the best known
functions of wetlands is to provide habitats for birds (Wetland International
2013, Isola et al. 2000). Furthermore, many of the globally threatened avian
species depend on wetlands (Green 1996).
The global wetland areas are generally estimated to be 7 to 9 millions
km2 (4-6 percent of the land surface of the earth) (Mitsch and Gosselink 2000,
Dahl 1990). Waterbird populations are adversely affected due to wetland
degradation and losses. Providing high quality habitats are quite important for
waterbird conservation and it is a difficult issue how to provide high quality
habitat through effective management practices (Weber and Haig 1996, Erwin
2002). Human activities can cause wetland degradation and losses. Extension
of agricultural practices and development activities can have an affect on
wetland areas and wetlands’ quality (Barbier 1993, Barbier 1994).
1
Bird species utilize different resources and microhabitats in available
ways throughout the wetlands, depending on their feeding niches. Some
waterfowl, such as grebes, have adapted to wetlands to such an extent that
their survival as individual species depends on the availability of certain types
of wetlands within their geographic range (Nudds et al. 1994, Green 1998,
Isola et al. 2000).
Species richness, abundance and diversity of birds in each habitat type
are basic information used to identify the characteristics of bird communities
(Ma et al. 2007). Studies of the relationships between birds and their habitats
are needed to formulate management strategies, especially for globally
threatened bird species (Green 1996). And also, there is a need for the
identification of indicator species for monitoring, conservation and
management of areas and target species (Caceres and Legendre 2009). If one
habitat has more individuals of indicator species with higher indicator value,
this habitat is more likely to belong to a particular group (Dufrene and
Legendre 1997). The indicator value method is important to conservation
biology because it allows researchers to identify bioindicators for any habitat
types or areas (McGeoch and Chown 1998).
In Myanmar, Moeyungyi Wetland Wildlife Sanctuary is an important
bird area, the first and the only Ramsar site, and a Flyway Network Site of the
East Asian- Australasian Flyway Partnership (EAAFP) in Myanmar. From
October to March, it hosts over 20,000 migratory waterbirds. These include
the globally threatened Baer’s Pochard (Aythya baeri), Sarus Crane (Grus
2
antigone), Greater Spotted Eagle (Clanga clanga) and more than one percent
of the regional population of Northern Pintail (Anas acuta) (Thaw 2013). 70
species of migratory birds (both land birds and waterbirds) and 59 species of
resident birds are recorded in the Moeyungyi area by Forest Department (FD
2013).
Migratory birds reach Myanmar from October to May along two
flyways, the Central Asian Flyway and the East Asian Australasian Flyway.
Wetlands in Myanmar attract migratory birds from the Arctic Region for
wintering, which provide a good indicator of site significance (Thaw 2013).
Understanding of the relationships between bird communities and their
habitats is quite important for the conservation and management activities
(Chettri et al. 2005).
In Myanmar, construction of dams and harmful agricultural practices
(e.g., use of chemical fertilizers and pesticides) can cause negative impacts on
the regular flow of water into wetlands. Increased depositions of silt in
wetlands are due to inappropriate land use methods in upland areas (FD
2013). Furthermore, at Moeyungyi Wetland, illegal hunting of waterbirds by
the local people, supply of fresh water to agriculture by the Irrigation
Department and extension of agricultures by local people may be harmful for
the long term existence of wetlands and bird communities (FD 2013). The
drying parts of wetland are used for growing rice and this leads to degradation
of the natural marshland vegetation in the Moeyungyi area (Davies et al.
2004). Studies on bird communities and their habitats are quite important to
protect and conserve Moeyungyi Wetland and associated bird communities. 3

Nevertheless, at Moeyungyi Wetland, there are no previous studies
about the characteristics of community of wintering birds in different habitat
types. No information about the relationship between the bird communities
and their habitats is available either. Consequently, the main objectives of my
studies are;
a) to compare species richness, abundances and diversity of birds in
different habitat types;
b) to identify the relationships between bird communities and their habitats
and
c) to identify indicator species representing each habitat type at Moeyungyi
Wetland, Myanmar.
4
II. Literature Review
1. Relationship between bird communities and habitats
Birds are the valuable indicators of ecosystem changes because they
often respond to both direct and indirect environmental influences (Adamus
and Brandt 1990, Sekercioglu 2006). Birds have been also considered as good
predictors of habitat quality (Chettri et al. 2001, Raman 2001, Chettri et al.
2005). Habitat fragmentation or other habitat parameters affect the
distribution of many bird communities (O’Connell et al. 2000) since birds
commonly respond to altered habitat structures (MacArthur and MacArthur
1961, MacArthur et al. 1966,), changes in vegetation patterns and structures
(Mills et al. 1991) and also water depth (Colwell and Taft 2000).
Generally, the vertical diversity, canopy height, cover, and total
vegetation volume explain the avian richness and diversity (Finch 1989, Mills
et al. 1991). MacArthur and MacArthur (1961) found that bird species
diversity was positively related to vertical diversity of vegetation and Losito
and Baldassarre (1995) stated that there were strong correlations between
vegetation structures and bird diversity. Vegetation height and species
composition were major structural habitats to explain the habitat selection of
grassland birds (Bryan and Best 1991). Vegetation height, as an important
structural feature, influences habitat selection by grassland birds that can
change the suitability of a particular area over time (Wiens 1969, Bryan
1990). Mills et al. (1991) mentioned that an index of total vegetation volume
5
was strongly correlated with breeding bird density in shrub and desert
habitats.
Similar to these cases in terrestrial environments, the use of wetland
habitats by waterbirds were affected by multiple environmental components
such as vegetation and water level (Velasquez 1992, Colwell and Taft 2000).
Rajpar and Zakaria (2011) found that the dynamics of aquatic vegetation
composition such as emergent, submerged and grasses were affected by the
water level directly and indirectly, as well as the relative abundance and
distribution of ducks, swamphen, crakes, herons, jacanas and moorhens. The
distribution of waterbirds were influenced by fluctuation in water level such
as from drought to flooding (Kushlan 1986, Pyrovetis and Papastergiadou
1992).
Hattori and Mae (2001) showed that the highest species richness and
density of waterbirds occurred in the reed beds of aquatic vegetation, where
the water level is 20-60 cm in depth. Hattori and Mae (2001) described also
that the reed bed habitats with shallow water (<1 m depth) may be crucial in
the determination of high waterbird diversity. Kushlan (1986) reported that
wading birds (Ciconiiformes) may use diverse strategies to cope with the
seasonal fluctuations of water level characteristics of large tropical wetlands.
Along with the diversity and density, the most notable interspecific
differences in habitat use, that characterize communities (Wiens 1992) is the
use of different water depth among waterbirds (e.g., waterfowls and
shorebirds). Interspecific patterns of habitat use by waterfowls and shorebirds 6
were mostly related to water depth and these patterns were also correlated
with species’ morphologies. Larger species with longer necks, bills and legs
feed in deeper habitats than smaller taxa (Baker 1979, Colwell and Oring
1988, Colwell and Taft 2000).
The other factors including wetland size and distribution, vegetation
structures, and water chemistry also affect bird distribution and species
composition in wetlands. For instance, multi-species duck communities have
shown niche separation between species in horizontal dimensions with
different habitat characteristics such as wetland size, vegetation, and water
chemistry (Nudds et al. 1994). Bryan and Best (1991) reported that temporal
patterns in bird abundance were attributed primarily to aspects of the
waterways and surrounding cropland that changed overtime, such as
vegetation height. These environmental components are not independent, for
example, water depth and vegetation structure were frequently correlated in
wetlands (Nudds et al 1994).
7
2. Review on Asian Waterbird Census and other bird surveys in
Myanmar
Monitoring the status of waterbird populations, their distribution and
the status of wetlands in Asia was initiated by the Asian Waterbird Census
(AWC) in 1987. AWC is an integral part of the international waterbird census
and has been coordinated by Wetland International (Li and Mundkur 2007).
The AWC provides the most comprehensive monitoring programs for
waterbirds in the Asia-Pacific region.
More than 6,100 sites in 27 countries have been counted at least once
by AWC. The thousands of active volunteers are involved in AWC (Wetland
International 2014). For waterbirds and wetland conservation, a strategy to
guide for the development of AWC have been developed during the period
2004-2006 (Wetland International 2013).
A total of 408 sites in Southeast Asia (Brunei Darussalam, Cambodia,
Indonesia, Loa PDR, Malaysia, the Philippines, Singapore, Thailand, Timor
Leste and Vietnam) including Myanmar was counted at least once (Li and
Mundkur 2007). As a part of AWC, 122 species of waterbirds comprising 19
families were recorded in Myanmar between 2000 and 2003. Twenty-one
globally threatened species (2 endangered, 9 vulnerable and 10 near-
threatened) were recorded in Myanmar (Davies et al. 2004). Many of
Myanmar's globally threatened bird species were characteristics of wetland
ecosystems and included some of the most threatened bird species in the
8
country (MOECAF 2014). Habitat loss was suggested as the main threats for
most globally threatened bird species (Birdlife International 2003).
The nationwide comprehensive census had not been possible due to
the lack of resources, bird surveys have been regularly conducted in wetland
protected areas in Myanmar. There were no dramatic changes in bird numbers
between 2012 and 2013 in two protected wetland areas, Inlay Lake and
Moeyungyi Wetland Wildlife Sanctuary. Indeed the number of migratory
birds increased in 2013 at Inlay Lake, while resident birds increased at
Moeyungyi Wetland Sanctuary over the same period (MOECAF 2014).
9
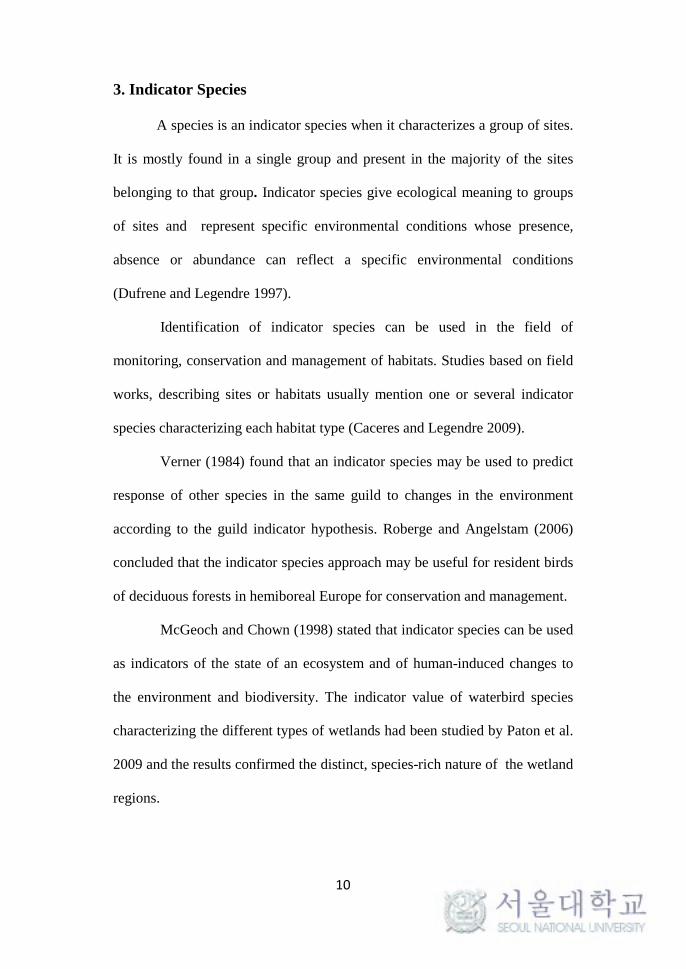
3. Indicator Species
A species is an indicator species when it characterizes a group of sites.
It is mostly found in a single group and present in the majority of the sites
belonging to that group. Indicator species give ecological meaning to groups
of sites and represent specific environmental conditions whose presence,
absence or abundance can reflect a specific environmental conditions
(Dufrene and Legendre 1997).
Identification of indicator species can be used in the field of
monitoring, conservation and management of habitats. Studies based on field
works, describing sites or habitats usually mention one or several indicator
species characterizing each habitat type (Caceres and Legendre 2009).
Verner (1984) found that an indicator species may be used to predict
response of other species in the same guild to changes in the environment
according to the guild indicator hypothesis. Roberge and Angelstam (2006)
concluded that the indicator species approach may be useful for resident birds
of deciduous forests in hemiboreal Europe for conservation and management.
McGeoch and Chown (1998) stated that indicator species can be used
as indicators of the state of an ecosystem and of human-induced changes to
the environment and biodiversity. The indicator value of waterbird species
characterizing the different types of wetlands had been studied by Paton et al.
2009 and the results confirmed the distinct, species-rich nature of the wetland
regions.
10
III. Materials and Methods
1. Study Area Moeyungyi Wetland was originally created as a man-made dam
constructed in 1885. For the last 100 years, it has gradually changed into a
natural wetland area. It extends for an area of 103.6 km2 (10359 hectares). It
is located at 17◦ 32 ' 57″ N and 96◦ 36' 58″ E in Bago and Wow township,
Bago Region (Figure 1). Moeyungyi Wetland Wildlife Sanctuary (MWWS)
was notified as a gazette protected area by the Forest Department, Ministry of
Environmental Conservation and Forestry in 1988 (FD 2013).
The Moeyungyi Wetland falls within the tropic and temperate region
throughout the year with a mean annual temperature of 26.95◦C. The mean
monthly temperature is the highest in April with 30.5 ◦C and the lowest
temperature in January with 23.72 ◦C and with the annual rainfall of 3543.05
mm (FD 2013).
Five major wetland types are generally recognized by the Ramsar
Classification System for classification of wetland types (Cowardin et al.
1979). The wetland type of Moeyungyi Wetland is palustrine dominated by
herbaceous plants such as grasses, reeds and rushes.
11
Habitat types within Moeyungyi Wetland are tall grasslands, short
grasslands, lotus fields, open water areas, planted trees and seasonal rice fields
(figure 2-3). Tall grassland is dominated by Wild Rice (Oryza minuta), and
the height of vegetation is ranged from 80 cm to 130 cm. The height of short
grassland dominated by Water Snowflake (Nymphoides indicum) and
Umbrella Canegrass (Leptochloa neesii) is ranged from 15 cm to 33 cm. The
lotus fields are covered by Indian Lotus (Nelumbo nucifera) while rice fields
at Moeyungyi areas are dominated by irrigated and seasonal crop rices.
12
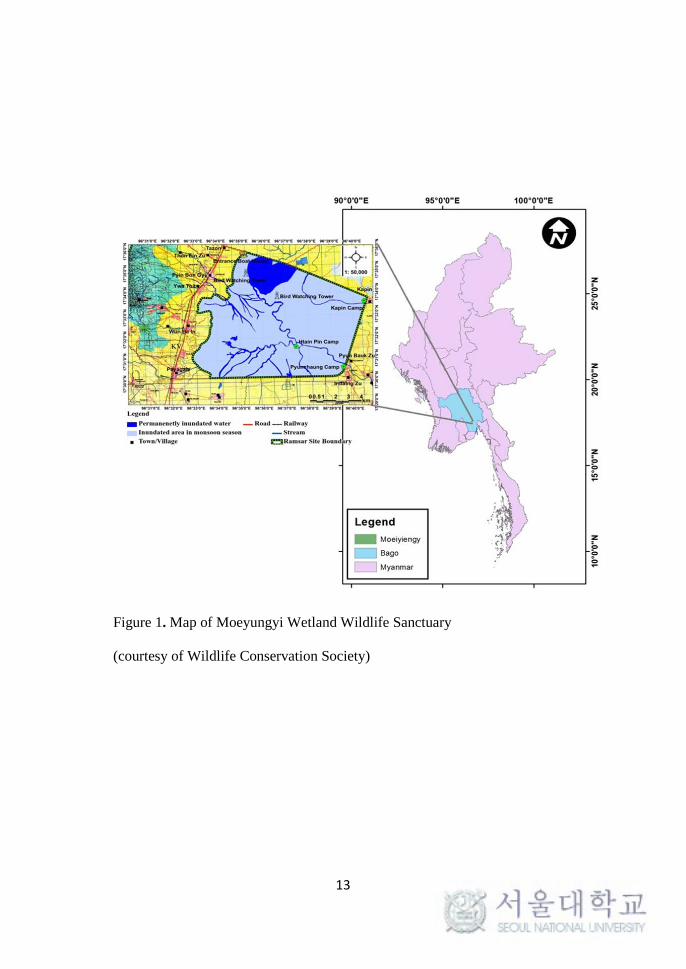
Figure 1. Map of Moeyungyi Wetland Wildlife Sanctuary
(courtesy of Wildlife Conservation Society)
13
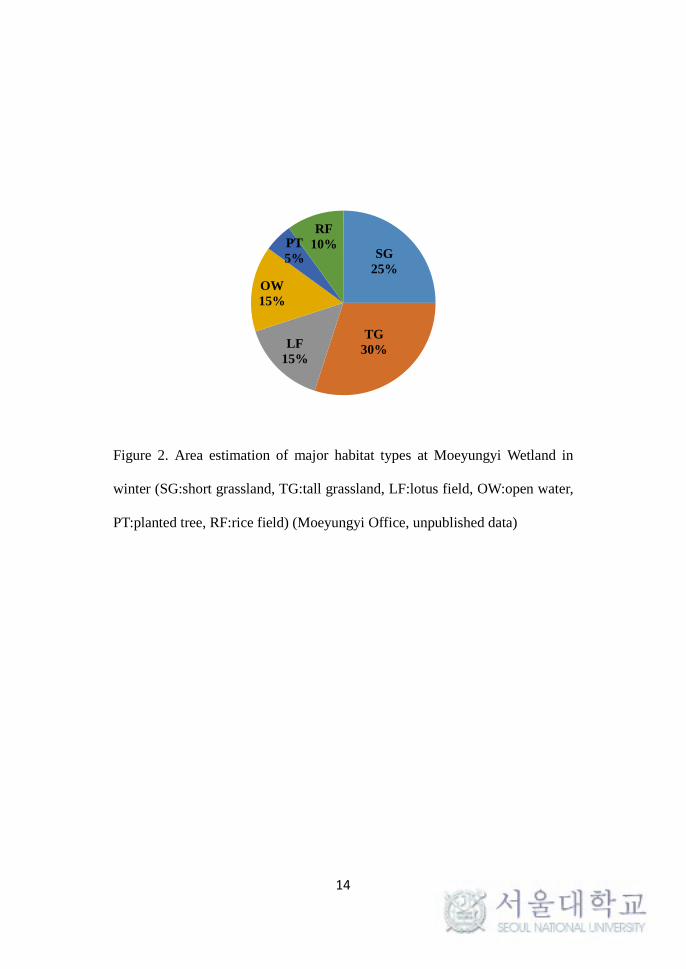
Figure 2. Area estimation of major habitat types at Moeyungyi Wetland in
winter (SG:short grassland, TG:tall grassland, LF:lotus field, OW:open water,
PT:planted tree, RF:rice field) (Moeyungyi Office, unpublished data)
SG 25%
TG 30% LF
15%
OW 15%
PT 5%
RF 10%
14
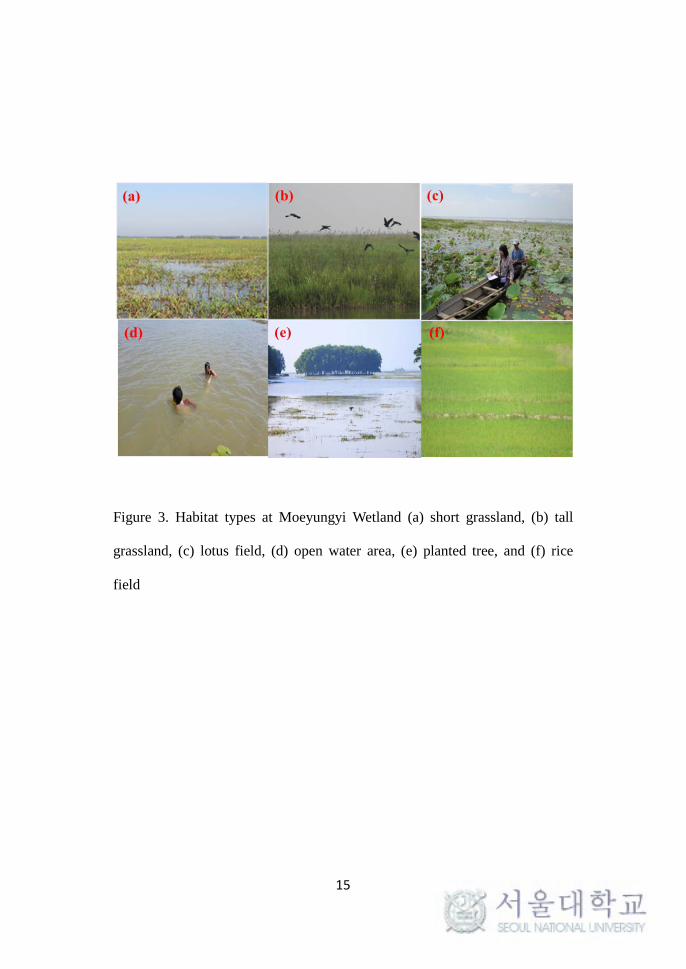
Figure 3. Habitat types at Moeyungyi Wetland (a) short grassland, (b) tall
grassland, (c) lotus field, (d) open water area, (e) planted tree, and (f) rice
field
15
2. Habitat surveys
I used the point quadrat method (Cockayne 1926, Brown 1954,
Goodall 1952) for habitat studies in December, 2014. The size of one plot for
vegetation survey was 1×1 m2. I took five plots within each bird sample plot
(Figure 4). A total of 200 plots were selected for vegetation surveys in short
grassland, tall grassland, lotus field and rice field habitat. I counted the
number of individuals of each plant species and also measured water depth
(cm), vegetation height (cm) and vegetation cover (percentage) (Figure 5). In
open water areas, vegetation species were not recorded because the vegetation
was not above the water surface. I measured only water depth in open water
area. In the rice field, species diversity was not recorded since all rice fields in
the Moeyungyi area are monoculture. The positions of each vegetation plot
were marked with a Global Positioning System device (GPS map 62S,
Garmin). Dominant plant species, vegetation cover, vegetation density,
vegetation height, plant species diversity and average water depth were
calculated during March, 2015.
16
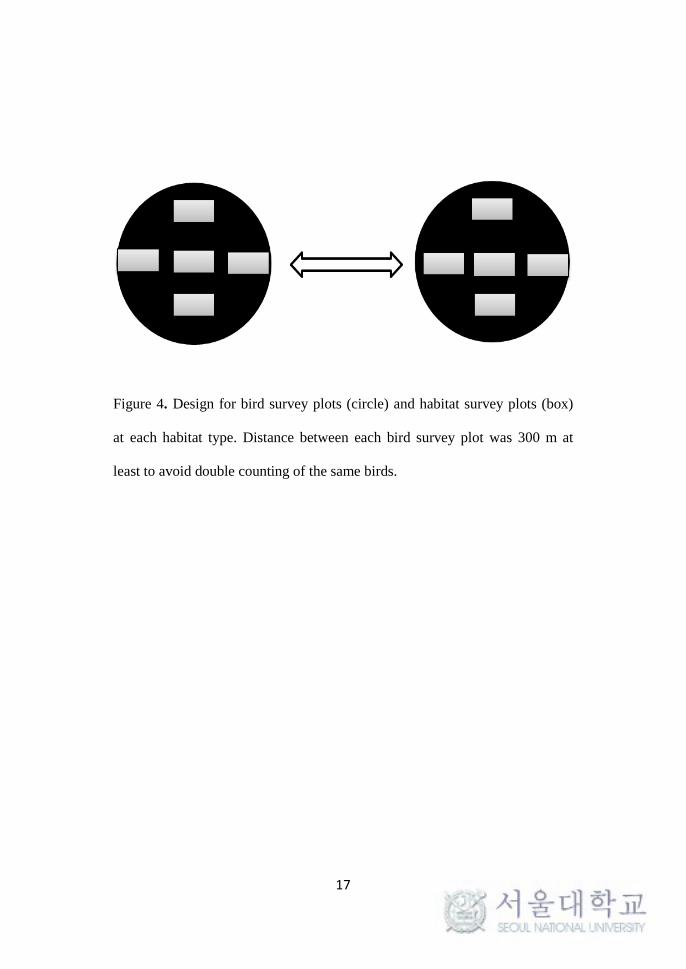
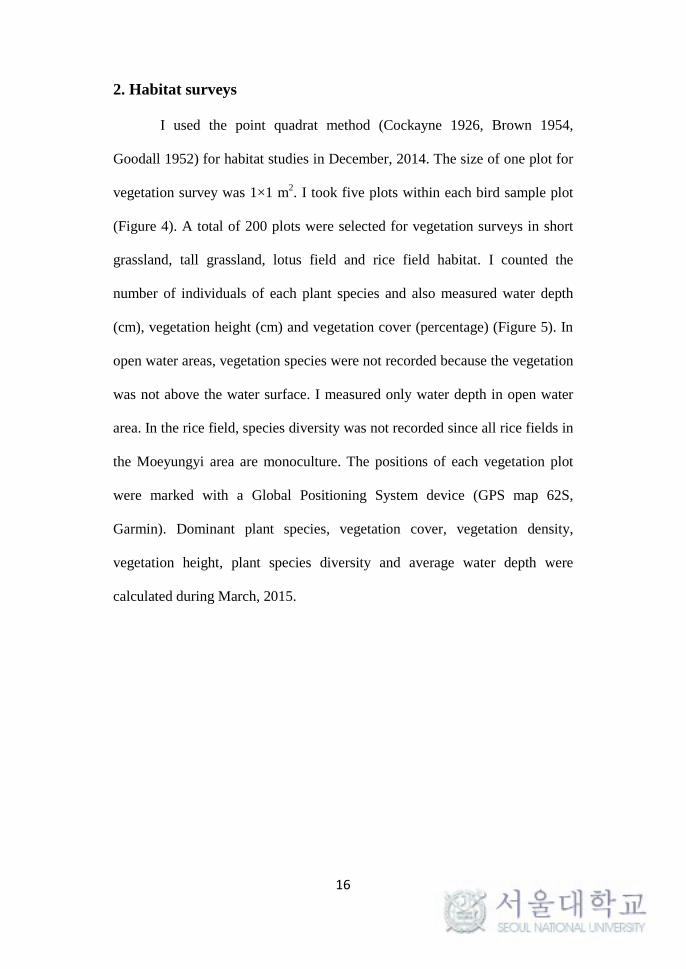
Figure 4. Design for bird survey plots (circle) and habitat survey plots (box)
at each habitat type. Distance between each bird survey plot was 300 m at
least to avoid double counting of the same birds.
17
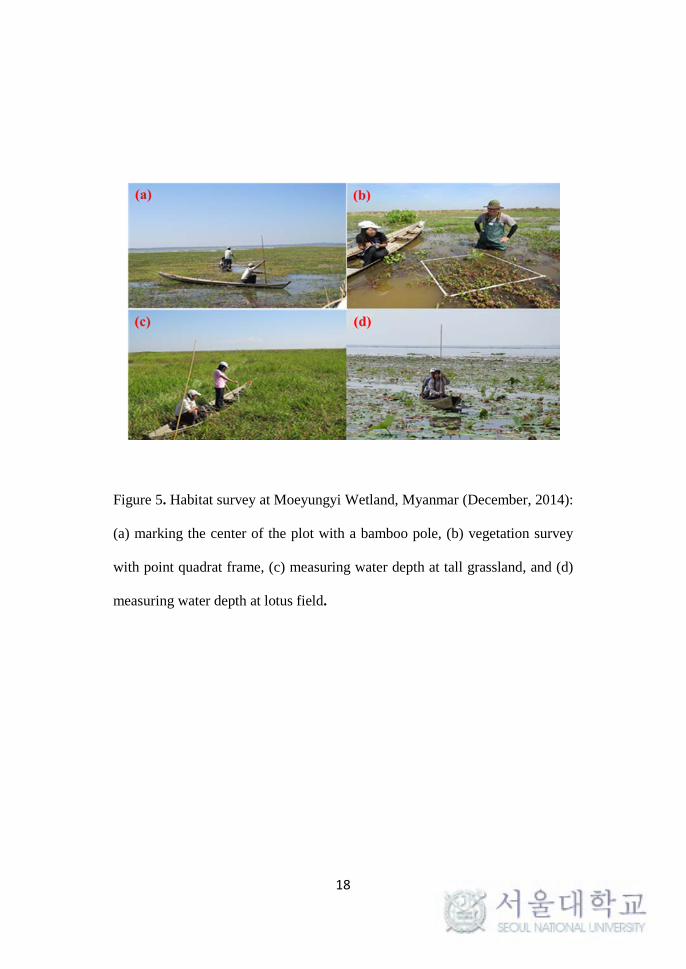
Figure 5. Habitat survey at Moeyungyi Wetland, Myanmar (December, 2014):
(a) marking the center of the plot with a bamboo pole, (b) vegetation survey
with point quadrat frame, (c) measuring water depth at tall grassland, and (d)
measuring water depth at lotus field.
18
3. Bird Surveys
I selected five different habitat types according to habitat
classification of the Moeyungyi office. These habitats are tall grasslands
(height 80-130 cm), short grasslands (height 15-33 cm), lotus fields, open
water areas and rice fields, and these are different habitat types for bird
communities. Grasslands, lotus fields and open water areas are natural
habitats for birds whereas rice fields are artificial habitats. Bird surveys were
conducted from December 2014 to the first week of February 2015 in
Myanmar. The point count method (Ralph and Sauer 1995, Hostetler and
Main 2001) was used for bird surveys.
I set up 50 meter radius plots at each habitat type first and marked the
center of each plot with a bamboo pole, marking tapes and measuring tapes. I
took 10 sample plots for rice fields, 10 sample plots for short grasslands, 10
sample plots for tall grasslands and 10 sample plots for lotus fields. But, I
took only 9 sample plots for open water areas according to field conditions
(small housing within the wetland). Therefore, a total of 49 point count plots
at five different habitat types were consequently selected (Figure 5).The
distance between each plot was at least 300 meters to avoid double counting
of the same birds. I used binoculars (Nikon 10 × 42) for bird identification
and counts, and all bird counts were done outside the plots (at least 100
meters distance from birds) to minimize disturbances from an observer, we
thus avoided disturbing birds and usually completed counts before the birds
flew away as much as possible.
19
The survey was done in the morning from 7:00 AM to 12:00 PM. Bird
counting lasted for 7 minutes at each plot, and 20-23 plots were surveyed per
day. Each bird plot was visited 21 times. I visited bird survey plots and habitat
types with different spatial and temporal schedules to avoid potential bias
from time and date. Bird data were collected by recording the number of
individuals of each species and the number of species (species richness). We
did not conduct bird surveys in bad weather conditions (days with rain, mist
and strong wind).
20
4. Data Analysis
4.1 Community analysis
4.1.1. Dominance index
To express dominant species, ecologists estimate species’ percent
cover in herbaceous plant communities. Percent cover in 1 m2 plot (% of plot
covered by species) is easily and reliably estimated (Kercher et al. 2003). The
dominant cover percentage of plant species is calculated by the following
formula.
Average Percent Cover= (𝐜𝐜𝐜𝐜𝐜𝐜𝐜𝐜𝐜𝐜 𝐢𝐢𝐢𝐢 𝐩𝐩𝐩𝐩𝐜𝐜𝐩𝐩 𝟏𝟏)+(𝐜𝐜𝐜𝐜𝐜𝐜𝐜𝐜𝐜𝐜 𝐢𝐢𝐢𝐢 𝐩𝐩𝐩𝐩𝐜𝐜𝐩𝐩 𝟐𝟐)+(𝐜𝐜𝐜𝐜𝐜𝐜𝐜𝐜𝐜𝐜 𝐢𝐢𝐢𝐢 𝐩𝐩𝐩𝐩𝐜𝐜𝐩𝐩 𝐗𝐗 )
𝐩𝐩𝐜𝐜𝐩𝐩𝐭𝐭𝐩𝐩 𝐢𝐢𝐧𝐧𝐧𝐧𝐧𝐧𝐜𝐜𝐜𝐜 𝐜𝐜𝐨𝐨 𝐩𝐩𝐩𝐩𝐜𝐜𝐩𝐩𝐩𝐩
4.1.2 Species richness and abundances
Species abundance is the number of individuals per species (MacArthur
1960). Species richness (Menhinick’s index D) is a measure of the number of
species found in a sample (Gotelli and Colwell 2001, Davari et al. 2011). In a
larger sample, we would expect to find more species, therefore, the number of
species can be divided by the square root of the number of individuals in the
sample as an index of species richness to account for sample size.
D= 𝒔𝒔√𝑵𝑵
where s equals the numbers of different species represented in the sample and
N equals the total number of individual organisms in the sample.
21
4.1.3 Species diversity
The Shannon-Weaver index is used to characterize species diversity in
a community (Shannon and Weaver 1949, MacArthur and MacArthur 1961)
and also accounts for both abundance and evenness of the species present.
The index is calculated from the below formula:
𝐇𝐇′ = −�𝒑𝒑𝒑𝒑 × 𝐩𝐩𝐢𝐢𝒑𝒑𝒑𝒑 𝒑𝒑
𝒏𝒏
Where pi is the relative abundance of each species. (Pi = ni /N); ni denoted the
total number of the organization belong to i-th species; N, denoted the total
number of organizations of all species.
4.1.4 Species evenness
The Evenness index is used to measure biodiversity which quantifies
how equal the population is. The index was denoted by the letter J. The
formula is:
J= H'/ H' max
Where H' is the number derived from the Shannon- Weaver index and H'max =
ln (s), which is the natural logarithm of the number of species’s, occurs when
all species are present in equal numbers.
22
4.2 Indicator species analysis
The Dufrene and Legendre (1997) method of calculating indicator
species value was used for indicator species analysis. The Indicator value
(IndVal) combined a species’s relative abundance (specificity) with its
relative frequency of occurrence in a group of sites (fidelity) referred to as an
“area”. These two components were included because an indicator species
that is defined as most characteristic of one area must be found mostly in this
area and be present in the majority of the sites belonging to that area.
To take into account this duality, IndVal were calculated for each
species j and for each area k according to the following formula (Dufrene and
Legendre 1997).
IndVal Group k, Species j = 100× Akj × Bkj
In that equation, Akj is a measure of specificity and Bkj is a measure of
fidelity.
According to the formula:
IndValj = max [ IndVal kj]
Akj = Nindividualskj/ Nindividuals+k
Bkj = Nsiteskj/ Nsites+k
In the formula for specificity (Akj), Nindividualskj is the mean
abundance of species j across the sites pertaining to cluster k. Nindividuals+k
is the sum of the mean abundances of species j within the various clusters. Akj
is maximum when species j is present in cluster k only.
23
Bkj is a measure of fidelity. In the formula for fidelity (Bkj), Nsiteskj is
the number of sites in cluster k where species j is present. N sites+k is the total
number of sites in that cluster. Bkj is maximum when species j is present at all
sites of cluster k.
The indicator value of species j for a partition of sites is the largest
value of IndValkj observed over all clusters k of that partition: IndValj = max
[IndValkj]. The significance of the indicator value of each species is assessed
by a randomization procedure. A random permutation procedure of the sites
among the site groups is used to test the significance of IndValj. The index
can be computed for a given partition of the sites or for all levels of a
hierarchical classification of the sites. I performed indicator species analysis
in R software with the package ‘ labdsv’ (Robert 2015).
24
5. Statistical Analysis
The Kruskal-Wallis (non- parametric test) (Kruskal and Wallis 1952)
was used to compare species richness, abundances and diversity of birds
between different habitat types. Habitat variables (vegetation cover,
vegetation density, vegetation height, plant species diversity and water depth)
at five different habitat types were also compared by using the Kruskal-Wallis
test. If significant, a post hoc test (Bonferroni, pairwise comparisons) was
used for multiple comparisons in SPSS 21 software.
Canonical Correspondence Analysis (CCA) was performed to reveal
the relationships between bird communities and their habitat variables by
using R software (3.2.0) with vegan package. CCA is a multivariate method to
elucidate the relationships between biological assemblages of species and
their environments. The method is designed to extract synthetic environmental
gradients from ecological data sets. The gradients are the basis for succinctly
describing and visualizing the differential habitat preferences (niches) of taxa
via an ordination diagram (Ter Braak 1986, Ter Braak and Verdonschot 1995,
Blair 1996). A Monte Carlo permutation (999 repeats) was run to test the
significance of the relationship between bird communities and their habitats.
The 5 % level of significance (p < 0.05) was considered to be statistically
significant.
25
IV. Results
1. Comparison of habitat variables among different habitats
During the vegetation survey in December, 2014, I collected 24
plant species of 17 families characterizing three habitat types: short
grassland, tall grassland and lotus field. I detected 15 plant species in
short grassland and the areas were densely covered by Water Snowflake
Nymphoides indium (15.90%), Umbrella Canegrass Leptochloa neesii
(14.16%), Grass Saccolepis interrupta (13.00%) and Wild Rice Oryza
minuta (10.80 %) (Table 1). Totally, 11 plant species were found in tall
grassland, three plant species, namely, Wild Rice Oryza minuta
(34.94%) ,Umbrella Canegrass Leptochloa neesii (24.70%) and
Torpedograss Panicum repens (4.96%) were dominant species in tall
grassland (Table 2). Fifteen plant species were recorded in lotus field by
using point quadrat method. The water surface was dominated by Indian
Lotus Nelumbo nucifera (53.40%), Sea Purslane Sesuvium
portulacastrum (7.60%) and Water Snowflake Nymphoides indicum
(6.70%) in lotus field (Table 3).
26
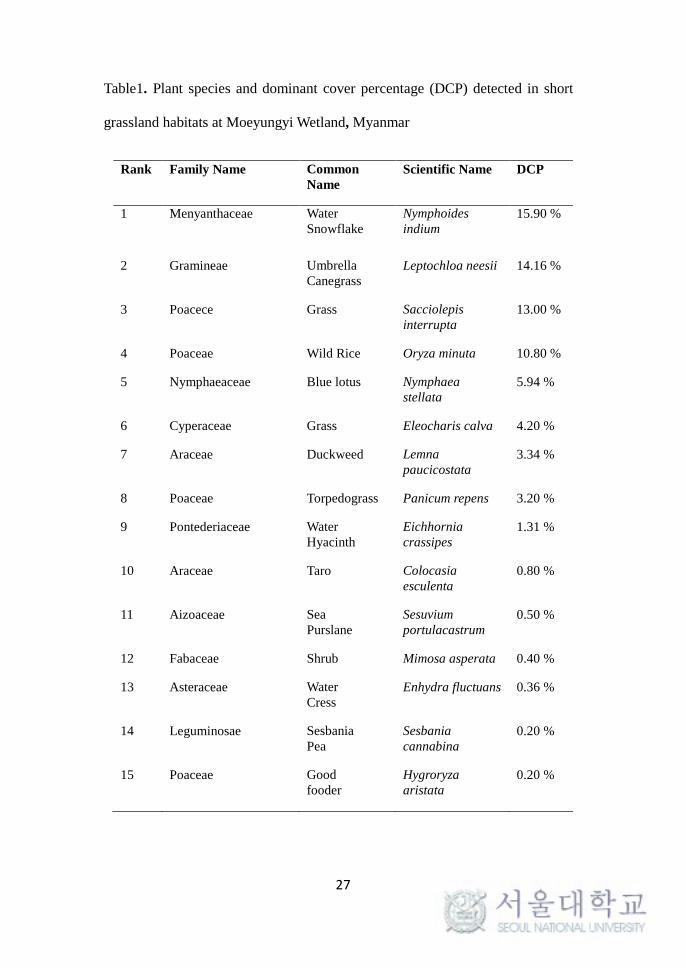
Table1. Plant species and dominant cover percentage (DCP) detected in short
grassland habitats at Moeyungyi Wetland, Myanmar
Rank Family Name Common Name
Scientific Name DCP
1 Menyanthaceae Water Snowflake
Nymphoides indium
15.90 %
2 Gramineae Umbrella Canegrass
Leptochloa neesii 14.16 %
3 Poacece Grass Sacciolepis interrupta
13.00 %
4 Poaceae Wild Rice Oryza minuta 10.80 %
5 Nymphaeaceae Blue lotus Nymphaea stellata
5.94 %
6 Cyperaceae Grass Eleocharis calva 4.20 %
7 Araceae Duckweed Lemna paucicostata
3.34 %
8 Poaceae Torpedograss Panicum repens 3.20 %
9 Pontederiaceae Water Hyacinth
Eichhornia crassipes
1.31 %
10 Araceae Taro Colocasia esculenta
0.80 %
11 Aizoaceae Sea Purslane
Sesuvium portulacastrum
0.50 %
12 Fabaceae Shrub Mimosa asperata 0.40 %
13 Asteraceae Water Cress
Enhydra fluctuans 0.36 %
14 Leguminosae Sesbania Pea
Sesbania cannabina
0.20 %
15 Poaceae Good fooder
Hygroryza aristata
0.20 %
27
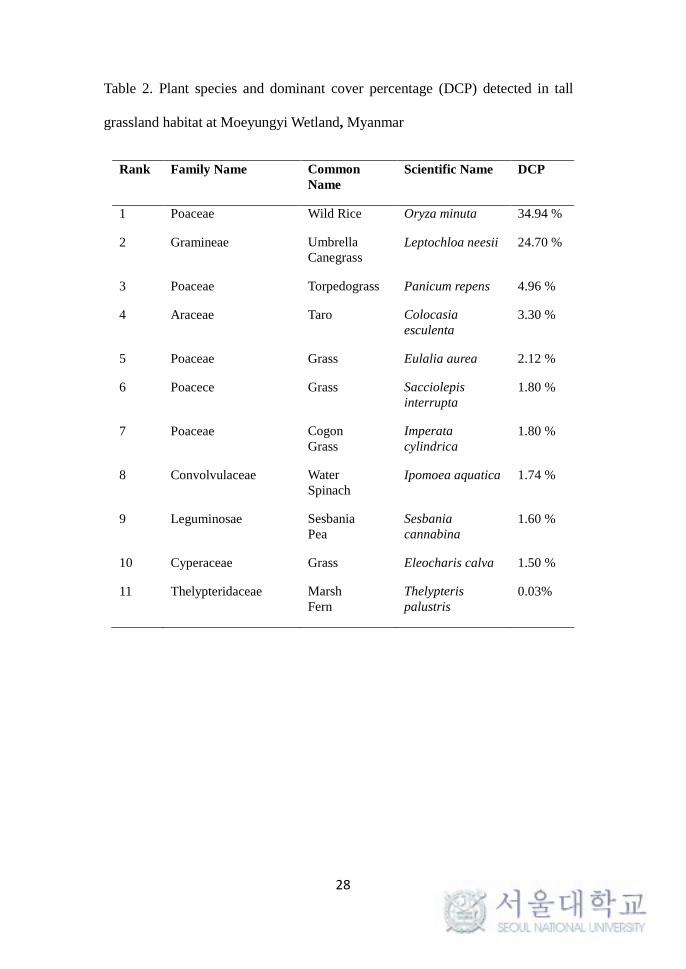
Table 2. Plant species and dominant cover percentage (DCP) detected in tall
grassland habitat at Moeyungyi Wetland, Myanmar
Rank Family Name Common Name
Scientific Name DCP
1 Poaceae Wild Rice Oryza minuta 34.94 %
2 Gramineae Umbrella Canegrass
Leptochloa neesii 24.70 %
3 Poaceae Torpedograss Panicum repens 4.96 %
4 Araceae Taro Colocasia esculenta
3.30 %
5 Poaceae Grass Eulalia aurea 2.12 %
6 Poacece Grass Sacciolepis interrupta
1.80 %
7 Poaceae Cogon Grass
Imperata cylindrica
1.80 %
8 Convolvulaceae Water Spinach
Ipomoea aquatica 1.74 %
9 Leguminosae Sesbania Pea
Sesbania cannabina
1.60 %
10 Cyperaceae Grass Eleocharis calva 1.50 %
11 Thelypteridaceae Marsh Fern
Thelypteris palustris
0.03%
28
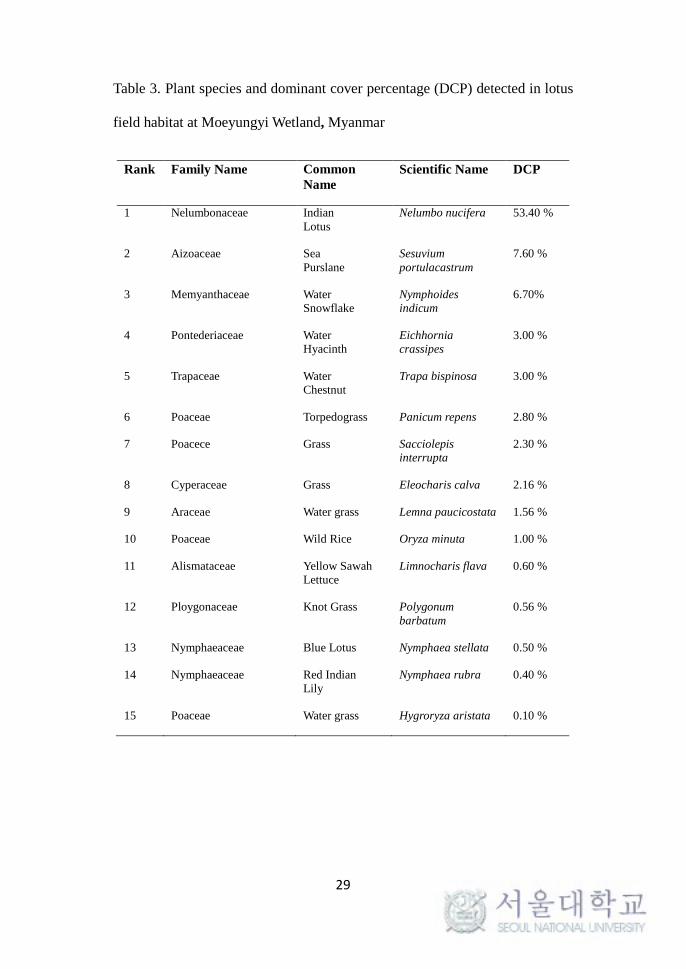
Table 3. Plant species and dominant cover percentage (DCP) detected in lotus
field habitat at Moeyungyi Wetland, Myanmar
Rank Family Name Common Name
Scientific Name DCP
1 Nelumbonaceae Indian Lotus
Nelumbo nucifera 53.40 %
2 Aizoaceae Sea Purslane
Sesuvium portulacastrum
7.60 %
3 Memyanthaceae Water Snowflake
Nymphoides indicum
6.70%
4 Pontederiaceae Water Hyacinth
Eichhornia crassipes
3.00 %
5 Trapaceae Water Chestnut
Trapa bispinosa 3.00 %
6 Poaceae Torpedograss Panicum repens 2.80 %
7 Poacece Grass Sacciolepis interrupta
2.30 %
8 Cyperaceae Grass Eleocharis calva 2.16 %
9 Araceae Water grass Lemna paucicostata 1.56 %
10 Poaceae Wild Rice Oryza minuta 1.00 %
11 Alismataceae Yellow Sawah Lettuce
Limnocharis flava 0.60 %
12 Ploygonaceae Knot Grass Polygonum barbatum
0.56 %
13 Nymphaeaceae Blue Lotus Nymphaea stellata 0.50 %
14 Nymphaeaceae Red Indian Lily
Nymphaea rubra 0.40 %
15 Poaceae Water grass Hygroryza aristata 0.10 %
29
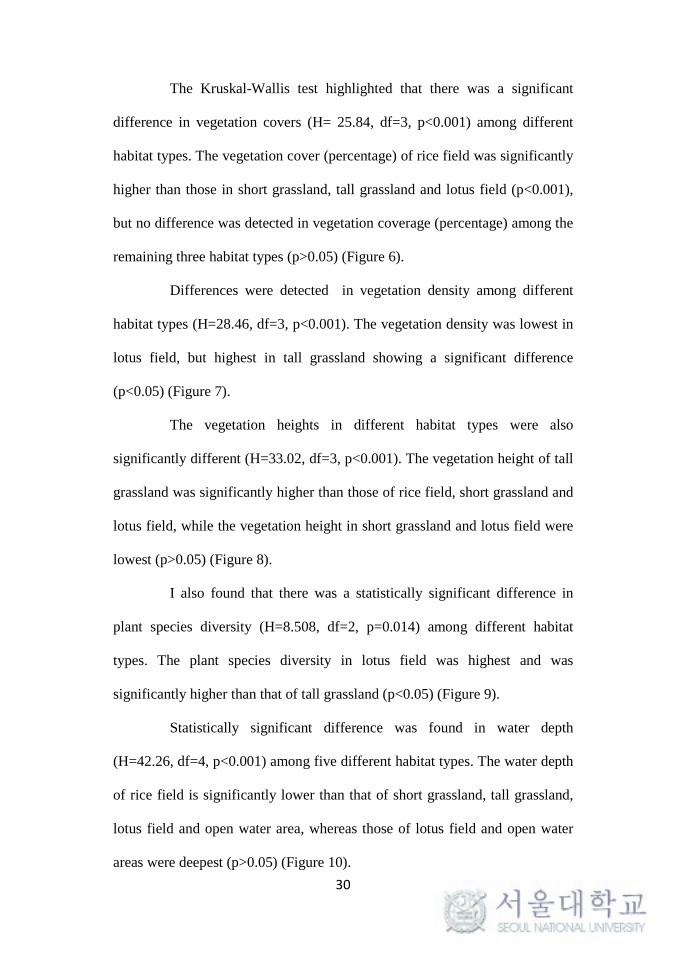
The Kruskal-Wallis test highlighted that there was a significant
difference in vegetation covers (H= 25.84, df=3, p<0.001) among different
habitat types. The vegetation cover (percentage) of rice field was significantly
higher than those in short grassland, tall grassland and lotus field (p<0.001),
but no difference was detected in vegetation coverage (percentage) among the
remaining three habitat types (p>0.05) (Figure 6).
Differences were detected in vegetation density among different
habitat types (H=28.46, df=3, p<0.001). The vegetation density was lowest in
lotus field, but highest in tall grassland showing a significant difference
(p<0.05) (Figure 7).
The vegetation heights in different habitat types were also
significantly different (H=33.02, df=3, p<0.001). The vegetation height of tall
grassland was significantly higher than those of rice field, short grassland and
lotus field, while the vegetation height in short grassland and lotus field were
lowest (p>0.05) (Figure 8).
I also found that there was a statistically significant difference in
plant species diversity (H=8.508, df=2, p=0.014) among different habitat
types. The plant species diversity in lotus field was highest and was
significantly higher than that of tall grassland (p<0.05) (Figure 9).
Statistically significant difference was found in water depth
(H=42.26, df=4, p<0.001) among five different habitat types. The water depth
of rice field is significantly lower than that of short grassland, tall grassland,
lotus field and open water area, whereas those of lotus field and open water
areas were deepest (p>0.05) (Figure 10). 30
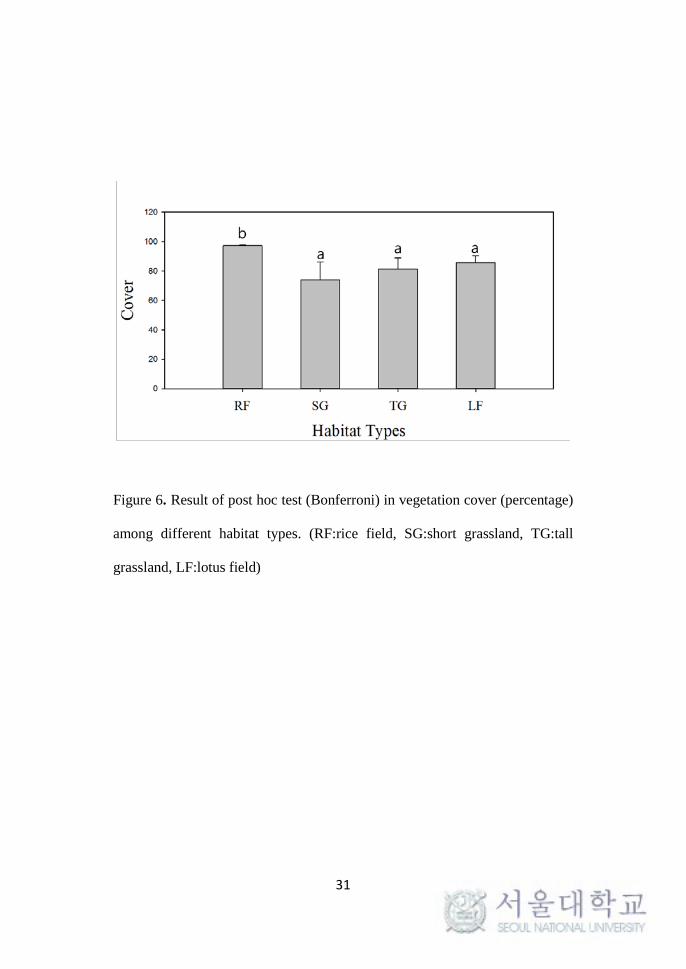
Figure 6. Result of post hoc test (Bonferroni) in vegetation cover (percentage)
among different habitat types. (RF:rice field, SG:short grassland, TG:tall
grassland, LF:lotus field)
31
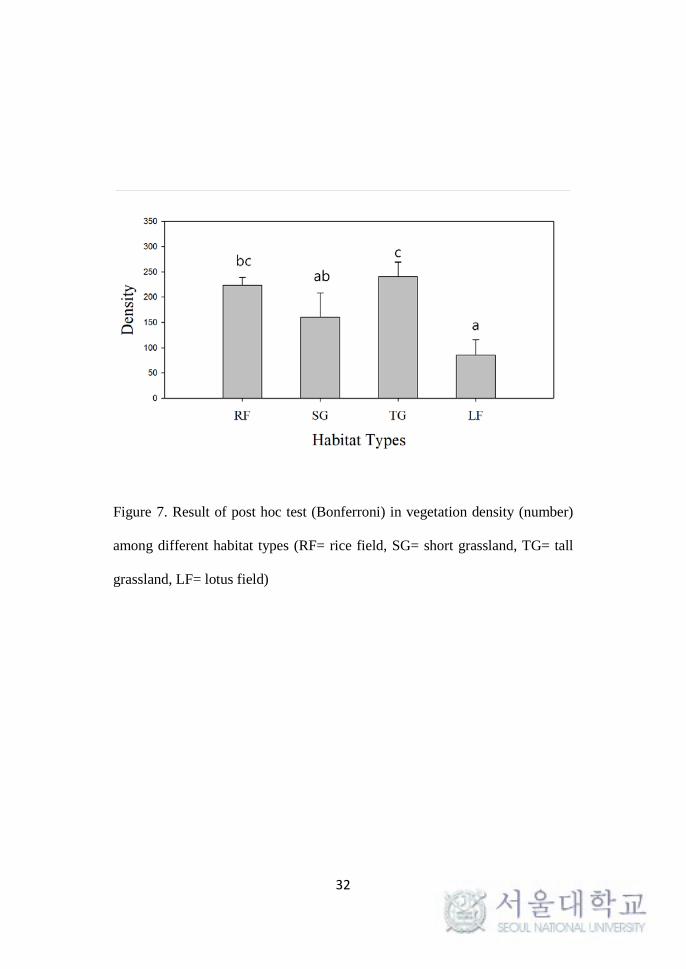
Figure 7. Result of post hoc test (Bonferroni) in vegetation density (number)
among different habitat types (RF= rice field, SG= short grassland, TG= tall
grassland, LF= lotus field)
32
Figure 8. Result of post hoc test (Bonferroni) in vegetation height (cm) among
different habitat types. (RF= rice field, SG= short grassland, TG= tall
grassland, LF= lotus field)
33
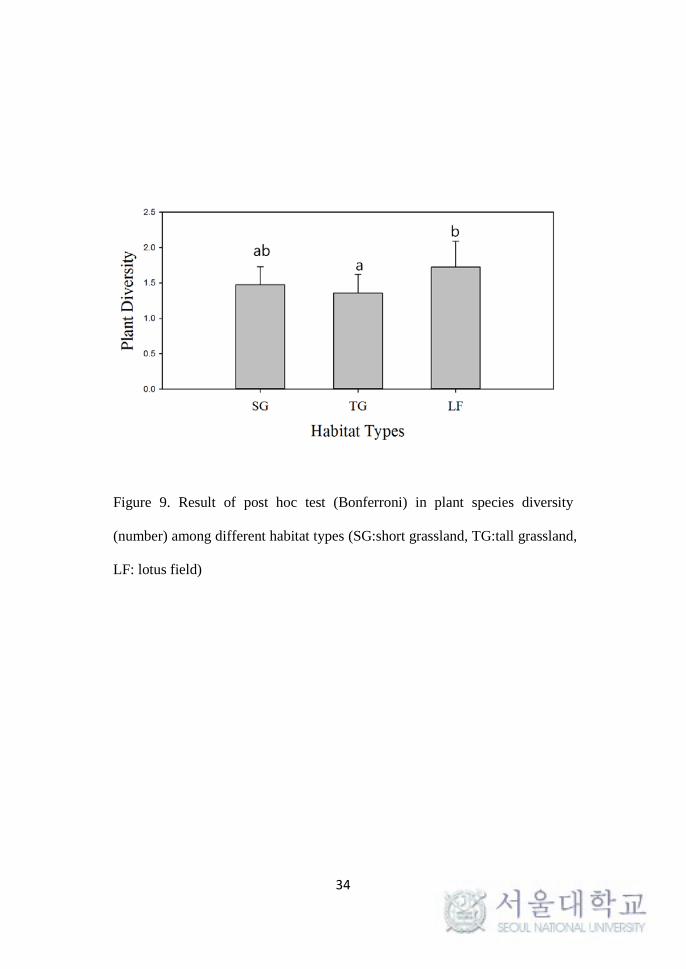
Figure 9. Result of post hoc test (Bonferroni) in plant species diversity
(number) among different habitat types (SG:short grassland, TG:tall grassland,
LF: lotus field)
34
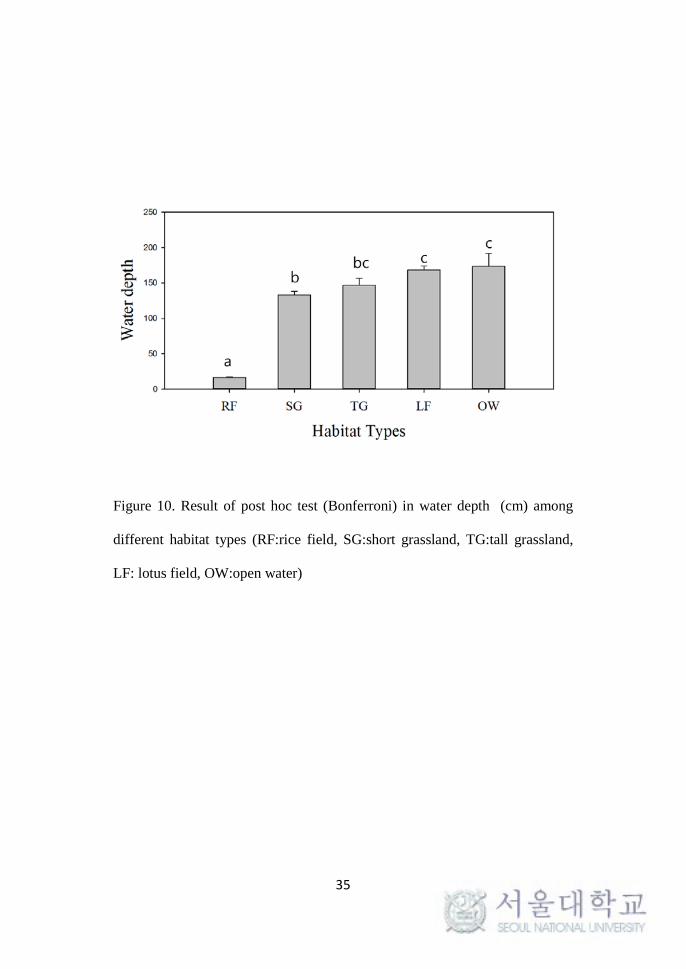
Figure 10. Result of post hoc test (Bonferroni) in water depth (cm) among
different habitat types (RF:rice field, SG:short grassland, TG:tall grassland,
LF: lotus field, OW:open water)
35
2. Comparison of species richness, abundances and diversity of
birds among different habitats
A total of 11971 individuals comprised of 52 bird species were
encountered during the survey. The globally threatened wetland bird species
such as Black-headed Ibis (Threskiornis melanocephalus), Painted Stork
(Mycteria leucocephala) and Oriental Darter (Anhinga melanogaster) were
also found during this survey.
Rice fields hosted 13 different bird species and 1348 total individuals.
Little Egret Egretta garzetta (68.10 %), Cattle Egret Bubulcus ibis (11.79 %),
Intermediate Egret Mesophoyx intermedia (10.31 %) and Great Egret Ardea
alba (4.23 %) were the most dominant species in rice field habitat (Table 4).
In short grassland, 30 different bird species belonging to 3229 total
individuals were found. The most dominant species in short grassland habitat
were Lesser Whistling-duck Dendrocygna javanica (20.38%), Little Egret
Egretta garzetta (15.32%), Cattle Egret Bubulcus ibis (12.60%) and Cotton
Pygmy-goose Nettapus coromandelianus (9.04%) (Table 5).
In tall grassland, 26 different bird species and 3535 total individuals
were recorded. Purple Swamphen Porphyrio porphyria (31.34%), Cattle Egret
Bubulcus ibis (12.70%), Asian Openbill Anastomus oscitans (12.24%) and
Little Egret Egretta garzetta (11.20%) were the four most dominant species
in tall grassland habitat (Table 6).
36
In lotus field, 33 different bird species and 1741 total individuals were
observed. Lesser Whistling-duck Dendrocygna javanica (21.99%), Cotton
Pygmy-goose Nettapus coromandelianus (18.03%), Pheasant-tailed Jacana
Hydrophasianus chirurgus (9.65%), Barn Swallow Hirundo rustica (6.49) and
Bronze-winged Jacana Metopidius indicus (5.11%) were the most dominant
speices in lotus field habitat (Table 7).
In open water areas, 15 different bird species and 2118 total
individuals were surveyed. Lesser Whistling-duck Dendrocygna javanica
(34.37%), Northern Pintail Anas acuta (31.35%), Little Cormorant
Phalacrocorax niger (10.62%) and Little Grebe Tachybaptus ruficollis
(5.85%) were the most dominant species (Table 8).
37
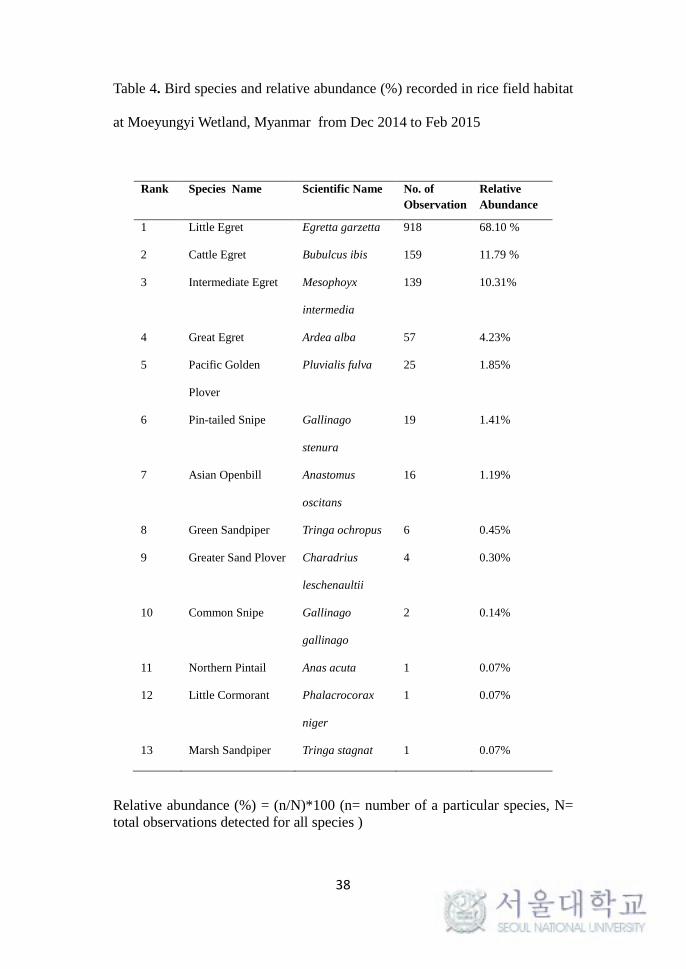
Table 4. Bird species and relative abundance (%) recorded in rice field habitat
at Moeyungyi Wetland, Myanmar from Dec 2014 to Feb 2015
Rank Species Name Scientific Name No. of Observation
Relative Abundance
1 Little Egret Egretta garzetta 918 68.10 %
2 Cattle Egret Bubulcus ibis 159 11.79 %
3 Intermediate Egret Mesophoyx
intermedia
139 10.31%
4 Great Egret Ardea alba 57 4.23%
5 Pacific Golden
Plover
Pluvialis fulva 25 1.85%
6 Pin-tailed Snipe Gallinago
stenura
19 1.41%
7 Asian Openbill Anastomus
oscitans
16 1.19%
8 Green Sandpiper Tringa ochropus 6 0.45%
9 Greater Sand Plover Charadrius
leschenaultii
4 0.30%
10 Common Snipe Gallinago
gallinago
2 0.14%
11 Northern Pintail Anas acuta 1 0.07%
12 Little Cormorant Phalacrocorax
niger
1 0.07%
13 Marsh Sandpiper Tringa stagnat 1 0.07%
Relative abundance (%) = (n/N)*100 (n= number of a particular species, N= total observations detected for all species )
38
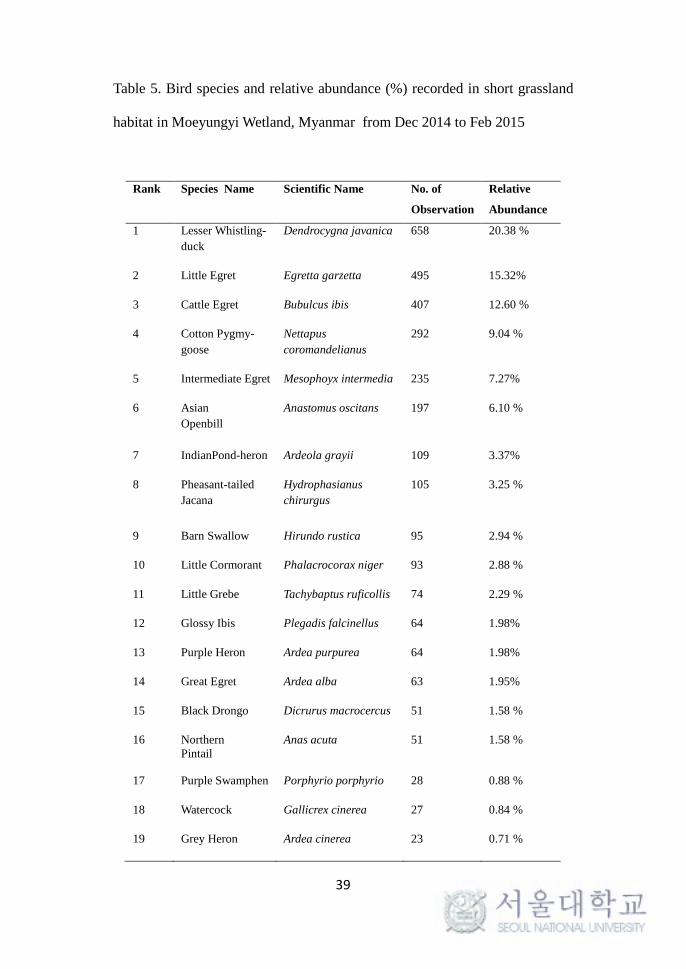
Table 5. Bird species and relative abundance (%) recorded in short grassland
habitat in Moeyungyi Wetland, Myanmar from Dec 2014 to Feb 2015
Rank Species Name Scientific Name No. of
Observation
Relative
Abundance
1 Lesser Whistling-duck
Dendrocygna javanica 658 20.38 %
2 Little Egret Egretta garzetta 495 15.32%
3 Cattle Egret Bubulcus ibis 407 12.60 %
4 Cotton Pygmy- goose
Nettapus coromandelianus
292 9.04 %
5 Intermediate Egret Mesophoyx intermedia 235 7.27%
6 Asian Openbill
Anastomus oscitans 197 6.10 %
7 IndianPond-heron Ardeola grayii 109 3.37%
8 Pheasant-tailed Jacana
Hydrophasianus chirurgus
105 3.25 %
9 Barn Swallow Hirundo rustica 95 2.94 %
10 Little Cormorant Phalacrocorax niger 93 2.88 %
11 Little Grebe Tachybaptus ruficollis 74 2.29 %
12 Glossy Ibis Plegadis falcinellus 64 1.98%
13 Purple Heron Ardea purpurea 64 1.98%
14 Great Egret Ardea alba 63 1.95%
15 Black Drongo Dicrurus macrocercus 51 1.58 %
16 Northern Pintail
Anas acuta 51 1.58 %
17 Purple Swamphen Porphyrio porphyrio 28 0.88 %
18
19
Watercock
Grey Heron
Gallicrex cinerea
Ardea cinerea
27
23
0.84 %
0.71 %
39
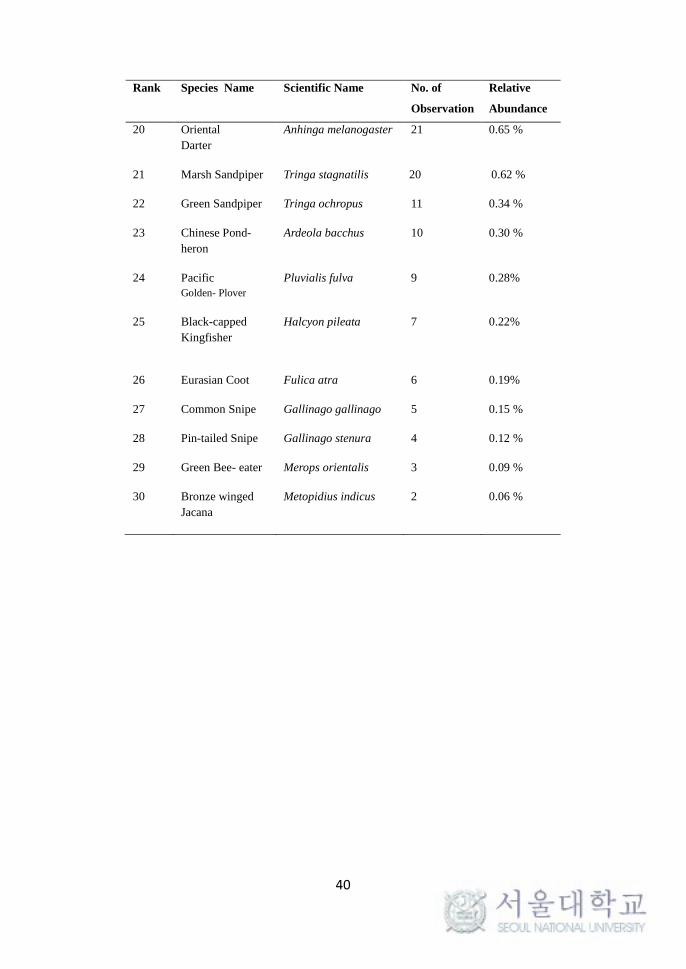
Rank Species Name Scientific Name No. of
Observation
Relative
Abundance
20 Oriental Darter
Anhinga melanogaster 21 0.65 %
21 Marsh Sandpiper Tringa stagnatilis 20 0.62 %
22 Green Sandpiper Tringa ochropus 11 0.34 %
23 Chinese Pond-heron
Ardeola bacchus 10 0.30 %
24 Pacific Golden- Plover
Pluvialis fulva 9 0.28%
25 Black-capped Kingfisher
Halcyon pileata 7
0.22%
26 Eurasian Coot Fulica atra 6 0.19%
27 Common Snipe Gallinago gallinago 5 0.15 %
28 Pin-tailed Snipe Gallinago stenura 4 0.12 %
29 Green Bee- eater Merops orientalis 3 0.09 %
30 Bronze winged Jacana
Metopidius indicus 2 0.06 %
40
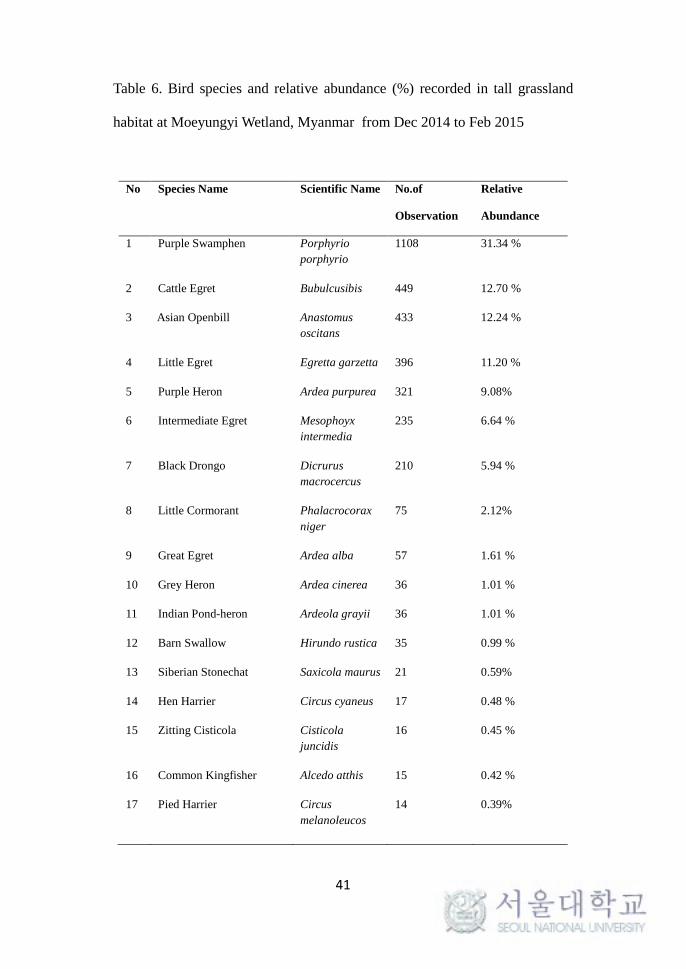
Table 6. Bird species and relative abundance (%) recorded in tall grassland
habitat at Moeyungyi Wetland, Myanmar from Dec 2014 to Feb 2015
No Species Name Scientific Name No.of
Observation
Relative
Abundance
1 Purple Swamphen Porphyrio porphyrio
1108 31.34 %
2 Cattle Egret Bubulcusibis 449 12.70 %
3 Asian Openbill Anastomus oscitans
433 12.24 %
4 Little Egret Egretta garzetta 396 11.20 %
5 Purple Heron Ardea purpurea 321 9.08%
6 Intermediate Egret Mesophoyx intermedia
235 6.64 %
7 Black Drongo Dicrurus macrocercus
210 5.94 %
8 Little Cormorant Phalacrocorax niger
75 2.12%
9 Great Egret Ardea alba 57 1.61 %
10 Grey Heron Ardea cinerea 36 1.01 %
11 Indian Pond-heron Ardeola grayii 36 1.01 %
12 Barn Swallow Hirundo rustica 35 0.99 %
13 Siberian Stonechat Saxicola maurus 21 0.59%
14 Hen Harrier Circus cyaneus 17 0.48 %
15 Zitting Cisticola Cisticola juncidis
16 0.45 %
16 Common Kingfisher Alcedo atthis 15 0.42 %
17 Pied Harrier Circus melanoleucos
14 0.39%
41
No Species Name Scientific Name No.of
Observation
Relative
Abundance
18 Blacked-headed Ibis Threskiornis melanocephalus
13 0.36 %
19 Eastern Marsh-harrier Circus spilonotus
12 0.34%
20 Painted Stork Mycteria leucocephala
6 0.16 %
21 Oriental Reed-warbler Acrocephalus orientalis
6 0.16 %
22 Glossy Ibis Plegadis falcinellus
6 0.16 %
23 Chinese Pond-heron Ardeola bacchus 5 0.14 %
24 Oriental Darter Anhinga melanogaster
5 0.14 %
25 Pheasant-tailed Jacana Hydrophasianus chirurgus
5 0.14 %
26 Osprey Pandion haliaetus
3 0.08%
42
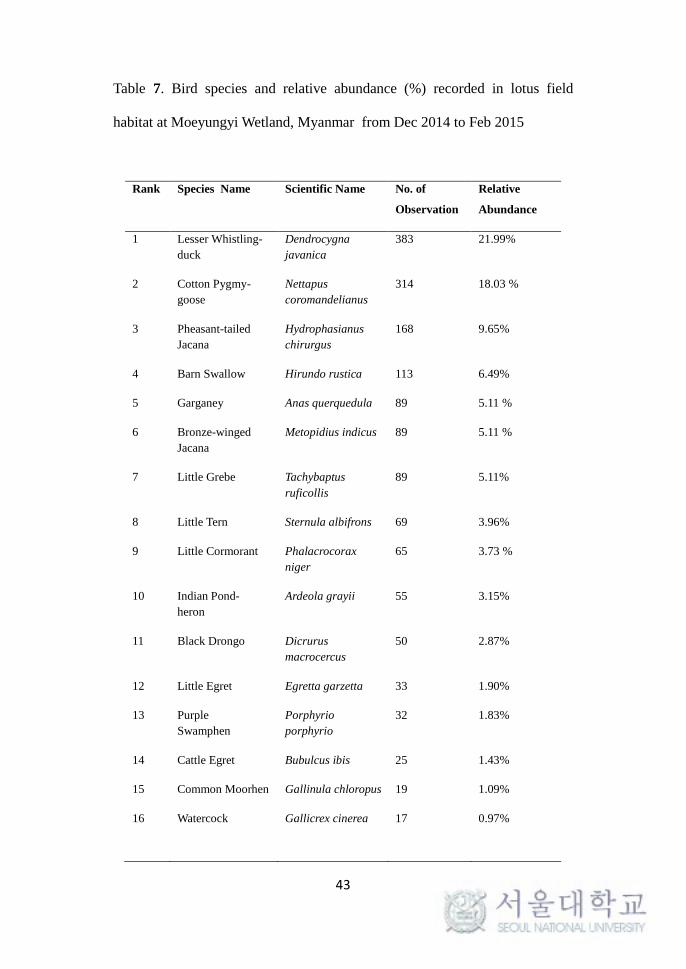
Table 7. Bird species and relative abundance (%) recorded in lotus field
habitat at Moeyungyi Wetland, Myanmar from Dec 2014 to Feb 2015
Rank Species Name Scientific Name No. of
Observation
Relative
Abundance
1 Lesser Whistling-duck
Dendrocygna javanica
383 21.99%
2 Cotton Pygmy- goose
Nettapus coromandelianus
314 18.03 %
3 Pheasant-tailed Jacana
Hydrophasianus chirurgus
168 9.65%
4 Barn Swallow Hirundo rustica 113 6.49%
5 Garganey Anas querquedula 89 5.11 %
6 Bronze-winged Jacana
Metopidius indicus 89 5.11 %
7 Little Grebe Tachybaptus ruficollis
89 5.11%
8 Little Tern Sternula albifrons 69 3.96%
9 Little Cormorant Phalacrocorax niger
65 3.73 %
10 Indian Pond-heron
Ardeola grayii 55 3.15%
11 Black Drongo Dicrurus macrocercus
50 2.87%
12 Little Egret Egretta garzetta 33 1.90%
13 Purple Swamphen
Porphyrio porphyrio
32 1.83%
14 Cattle Egret Bubulcus ibis 25 1.43%
15 Common Moorhen Gallinula chloropus 19 1.09%
16 Watercock Gallicrex cinerea 17 0.97%
43
Rank Species Name Scientific Name No. of
Observation
Relative
Abundance
17 Oriental Reed-warbler
Acrocephalus orientalis
14 0.80%
18 Eurasian Coot Fulica atra 14 0.80%
19 Purple Heron Ardea purpurea 13 0.74 %
20 Asian Openbill
Anastomus oscitans 13 0.74%
21 Common Kingfisher
Alcedo atthis 12 0.68%
22 Pied Harrier Circus melanoleucos
12 0.68%
23 Intermediate Egret Mesophoyx intermedia
9 0.52%
24 White- winged Tern Chlidonias leucopterus
8 0.45%
25 Eastern Marsh-harrier
Circus spilonotus 7 0.40%
26 Whiskered Tern Chlidonias hybrida 6 0.34%
27 Zitting Cisticola Cisticola juncidis 5 0.28%
28 Pacific Swallow Hirundo tahitica 4 0.23%
29 Striated Swallow Cecropis striolata 4 0.23%
30 Oriental Darter Anhinga melanogaster
3 0.17%
31 Great Cormorant Phalacrocorax carbo
3 0.17 %
32 Chinese Pond-heron Ardeola bacchus 2 0.11%
33 Siberian Stonechat
Saxicola maurus 2 0.11%
44
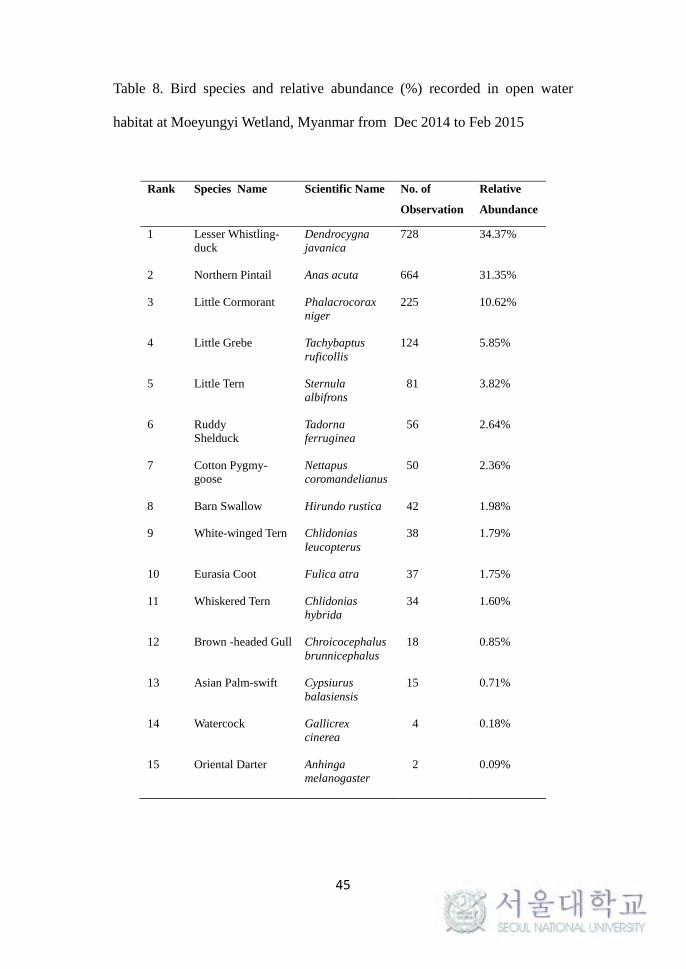
Table 8. Bird species and relative abundance (%) recorded in open water
habitat at Moeyungyi Wetland, Myanmar from Dec 2014 to Feb 2015
Rank Species Name Scientific Name No. of
Observation
Relative
Abundance
1 Lesser Whistling-duck
Dendrocygna javanica
728 34.37%
2 Northern Pintail Anas acuta 664 31.35%
3 Little Cormorant Phalacrocorax niger
225 10.62%
4 Little Grebe Tachybaptus ruficollis
124 5.85%
5 Little Tern Sternula albifrons
81 3.82%
6 Ruddy Shelduck
Tadorna ferruginea
56 2.64%
7 Cotton Pygmy- goose
Nettapus coromandelianus
50 2.36%
8 Barn Swallow Hirundo rustica 42 1.98%
9 White-winged Tern Chlidonias leucopterus
38 1.79%
10 Eurasia Coot Fulica atra 37 1.75%
11 Whiskered Tern Chlidonias hybrida
34 1.60%
12 Brown -headed Gull Chroicocephalus brunnicephalus
18 0.85%
13 Asian Palm-swift Cypsiurus balasiensis
15 0.71%
14 Watercock Gallicrex cinerea
4 0.18%
15 Oriental Darter Anhinga melanogaster
2 0.09%
45
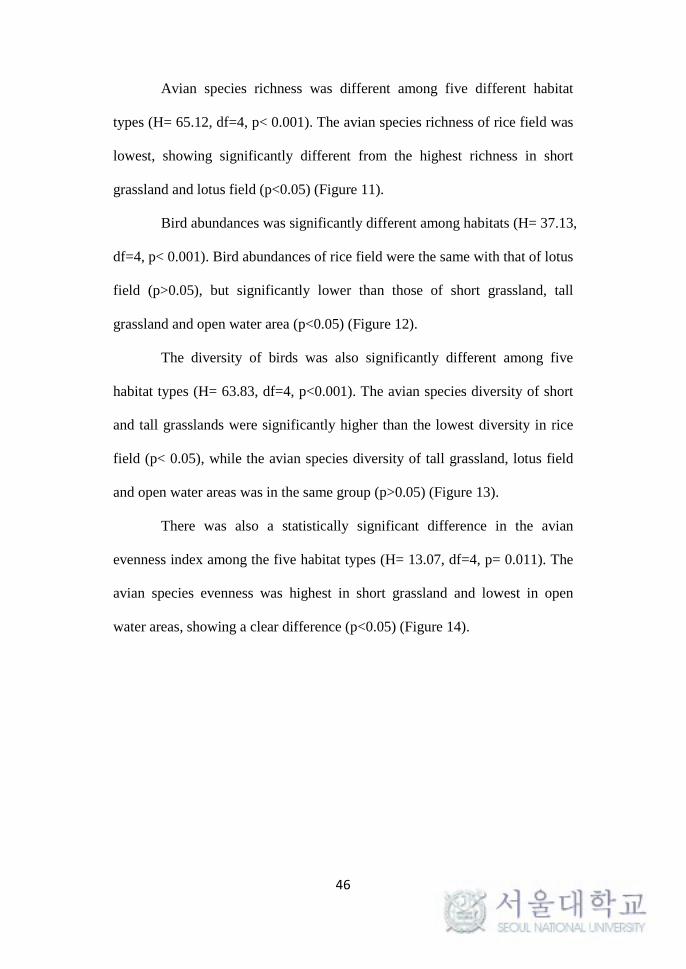
Avian species richness was different among five different habitat
types (H= 65.12, df=4, p< 0.001). The avian species richness of rice field was
lowest, showing significantly different from the highest richness in short
grassland and lotus field (p<0.05) (Figure 11).
Bird abundances was significantly different among habitats (H= 37.13,
df=4, p< 0.001). Bird abundances of rice field were the same with that of lotus
field (p>0.05), but significantly lower than those of short grassland, tall
grassland and open water area (p<0.05) (Figure 12).
The diversity of birds was also significantly different among five
habitat types (H= 63.83, df=4, p<0.001). The avian species diversity of short
and tall grasslands were significantly higher than the lowest diversity in rice
field (p< 0.05), while the avian species diversity of tall grassland, lotus field
and open water areas was in the same group (p>0.05) (Figure 13).
There was also a statistically significant difference in the avian
evenness index among the five habitat types (H= 13.07, df=4, p= 0.011). The
avian species evenness was highest in short grassland and lowest in open
water areas, showing a clear difference (p<0.05) (Figure 14).
46
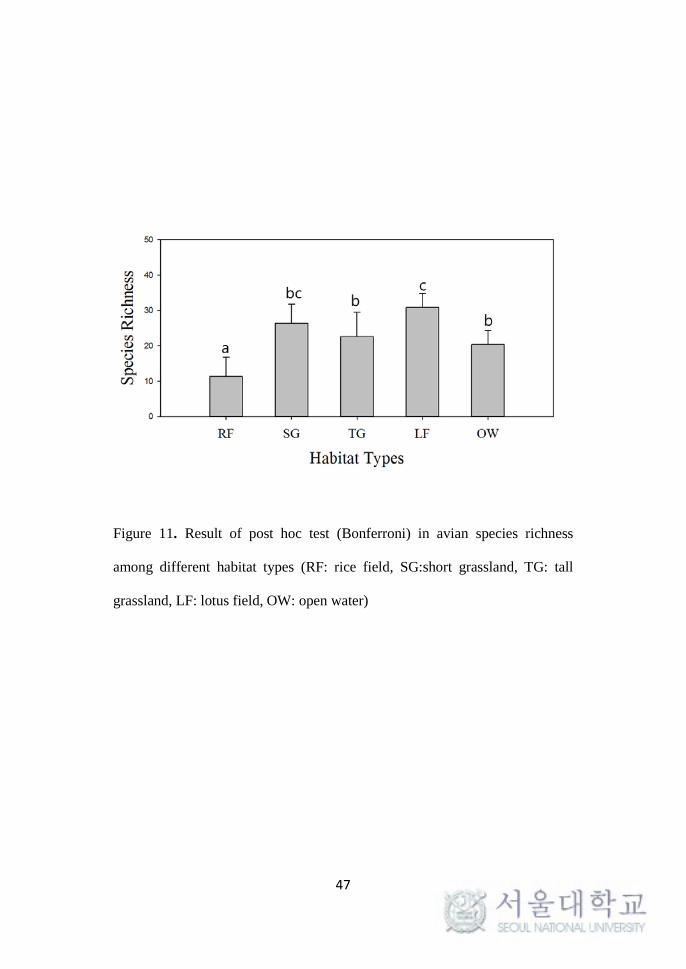
Figure 11. Result of post hoc test (Bonferroni) in avian species richness
among different habitat types (RF: rice field, SG:short grassland, TG: tall
grassland, LF: lotus field, OW: open water)
47
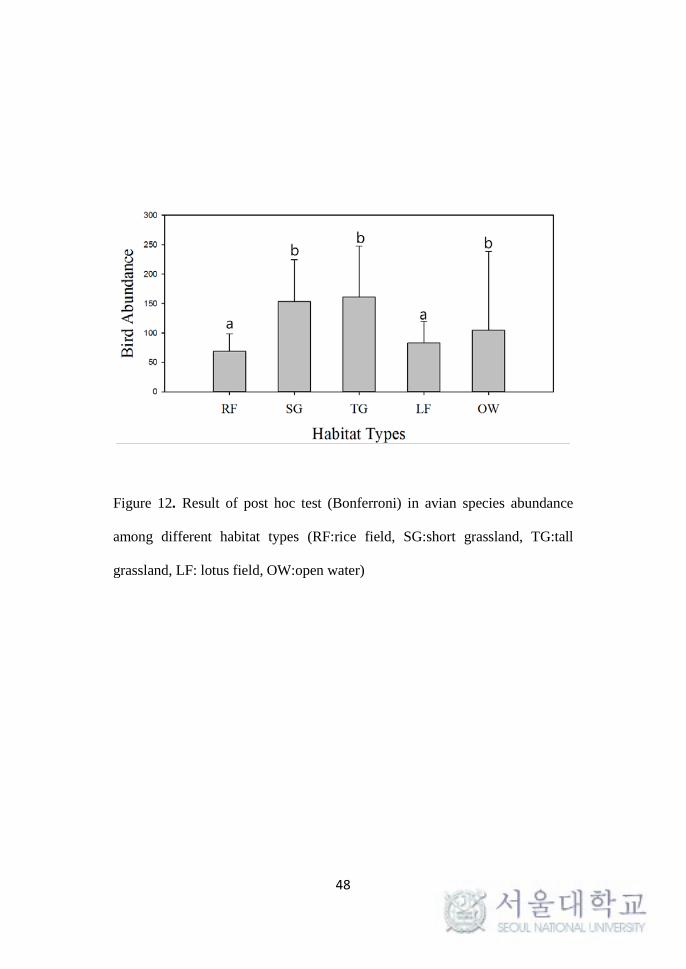
Figure 12. Result of post hoc test (Bonferroni) in avian species abundance
among different habitat types (RF:rice field, SG:short grassland, TG:tall
grassland, LF: lotus field, OW:open water)
48
Figure 13. Result of post hoc test (Bonferroni) in avian species diversity
among different habitat types (RF:rice field, SG:short grassland, TG:tall
grassland, LF:lotus field, OW:open water)
49
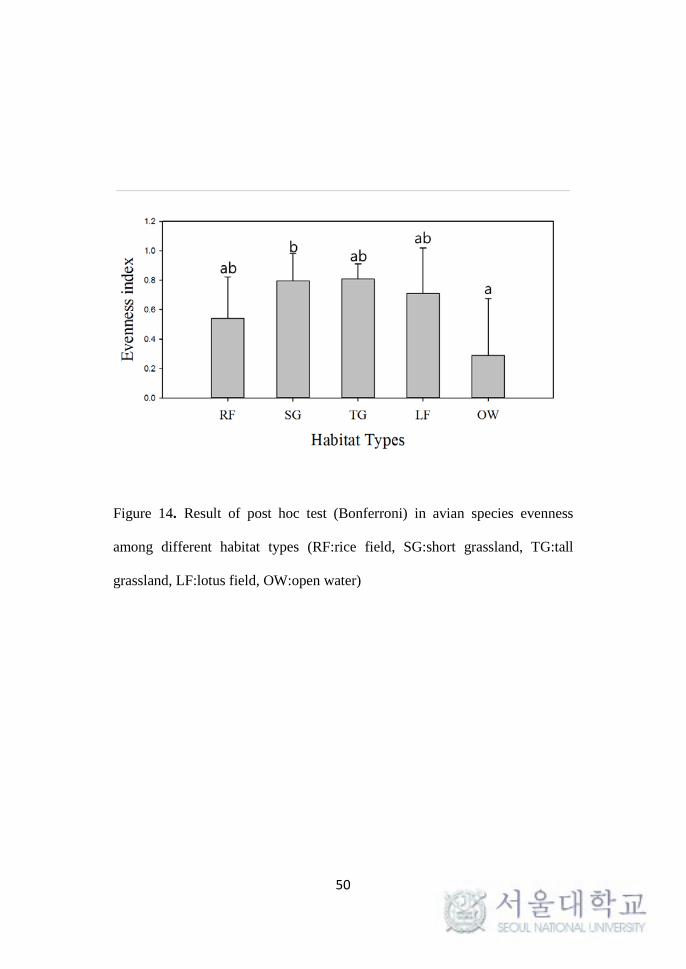
Figure 14. Result of post hoc test (Bonferroni) in avian species evenness
among different habitat types (RF:rice field, SG:short grassland, TG:tall
grassland, LF:lotus field, OW:open water)
50
3. Relationship between bird communities and habitat variables
Canonical Correspondence Analysis (CCA), a multivariate
statistical technique, was used to interpret the relationship between bird
communities and habitat variables (vegetation coverage, vegetation density,
vegetation height, water depth and plant species diversity). The habitat
variables were used as the predictor (independent variables) and bird
communities were used as a response (dependent variables). At the 5%
significance level for all statistical tests, there was a statistically significant
correlation between bird communities and their habitat variables at the
individual sampling points.
The result of CCA was shown in Table 9. For species-habitat
relationship, 18.91% and 10.93% of the variation were explained by axis 1
(horizontal axis) and axis 2 (vertical axis). The first two axes showed
canonical eigenvalues of 0.5702 and 0.3249 in comparison to the
eigenvalues of 1.690 which was the sum of all unconstrained eigenvalues.
The CCA generates bird species, habitat variables and sample plots of
different scales. Figure 15-16 demonstrate the results of this CCA analysis in
two biplots: one of habitat variables arrows and sites (Figure 15) and one of
habitat variables arrows and species (Figure 16). The arrows for habitat
variables in Figure 15-16, together with the bird species’ place, account for
43.03 % of the variance in the weighted averages of the bird species in
connection with each of the habitat variables on the first axis and 24.86 % of
the variance on the second axis.
51
Species-habitat variable correlations find out how well the extracted
variation in community composition can be described by the habitat variables
and how the variation is equal to the correlation between the site scores that
are weighted average species and sites scores that are linear combinations of
the habitat variables.
A Monte Carlo technique using 999 permutations found that the
overall analysis and the two axes were significant (CCA; Axis I, p<0.001;
Axis II, p<0.001). The most effective habitat variables for differentiating the
sites and their bird communities were the amount of vegetation height,
vegetation density, vegetation coverage and plant species diversity (Figure 15-
16). They also indicate that the area covered by water depth is redundant
measures.
52
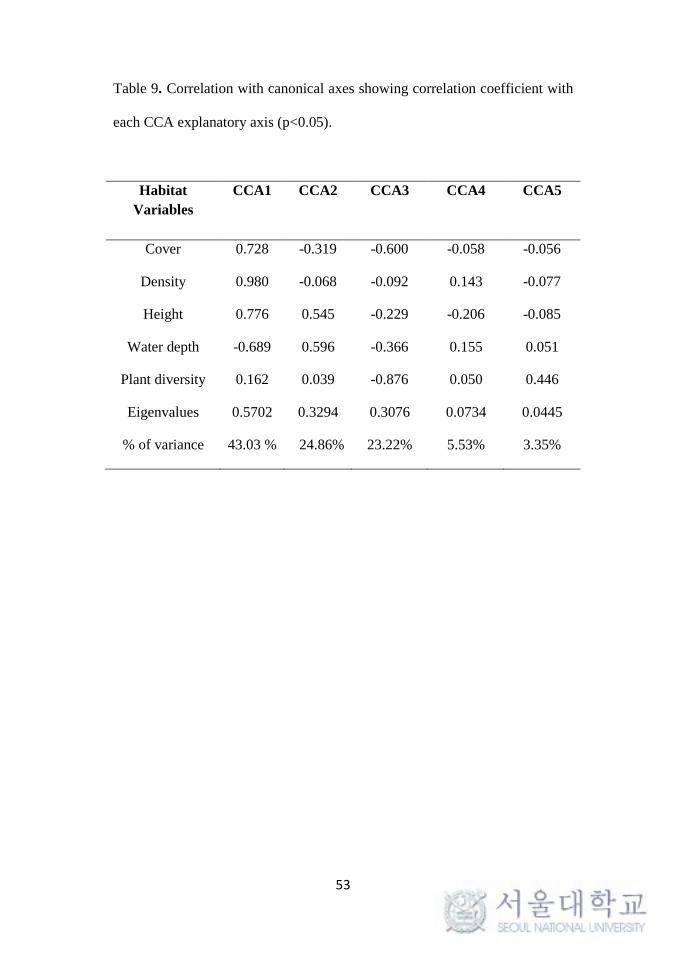
Table 9. Correlation with canonical axes showing correlation coefficient with
each CCA explanatory axis (p<0.05).
Habitat Variables
CCA1 CCA2 CCA3 CCA4 CCA5
Cover 0.728 -0.319 -0.600 -0.058 -0.056
Density 0.980 -0.068 -0.092 0.143 -0.077
Height 0.776 0.545 -0.229 -0.206 -0.085
Water depth -0.689 0.596 -0.366 0.155 0.051
Plant diversity 0.162 0.039 -0.876 0.050 0.446
Eigenvalues 0.5702 0.3294 0.3076 0.0734 0.0445
% of variance 43.03 % 24.86% 23.22% 5.53% 3.35%
53
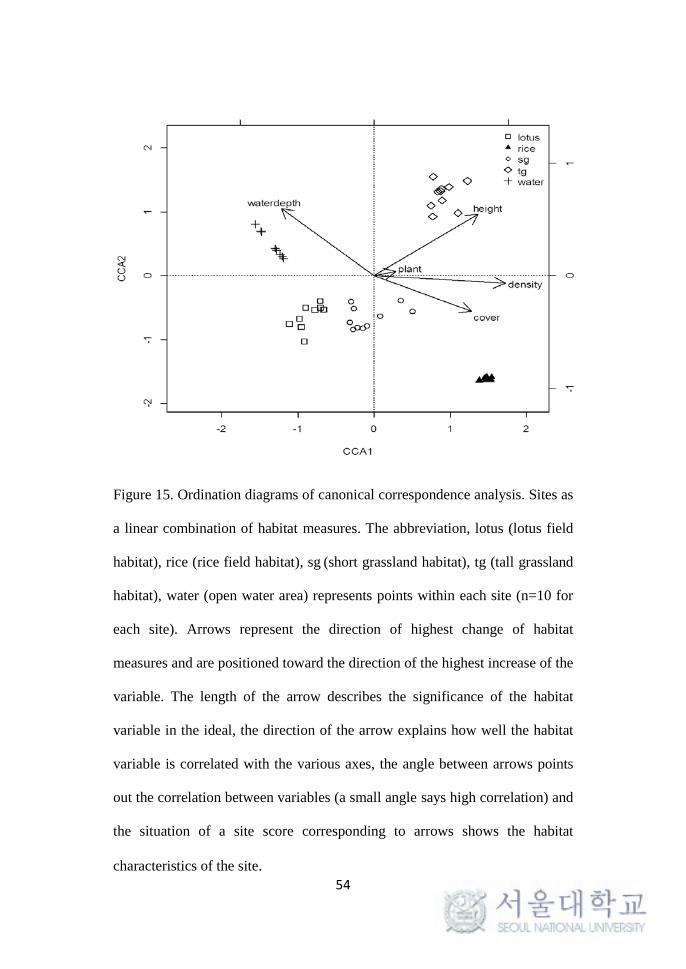
Figure 15. Ordination diagrams of canonical correspondence analysis. Sites as
a linear combination of habitat measures. The abbreviation, lotus (lotus field
habitat), rice (rice field habitat), sg (short grassland habitat), tg (tall grassland
habitat), water (open water area) represents points within each site (n=10 for
each site). Arrows represent the direction of highest change of habitat
measures and are positioned toward the direction of the highest increase of the
variable. The length of the arrow describes the significance of the habitat
variable in the ideal, the direction of the arrow explains how well the habitat
variable is correlated with the various axes, the angle between arrows points
out the correlation between variables (a small angle says high correlation) and
the situation of a site score corresponding to arrows shows the habitat
characteristics of the site. 54
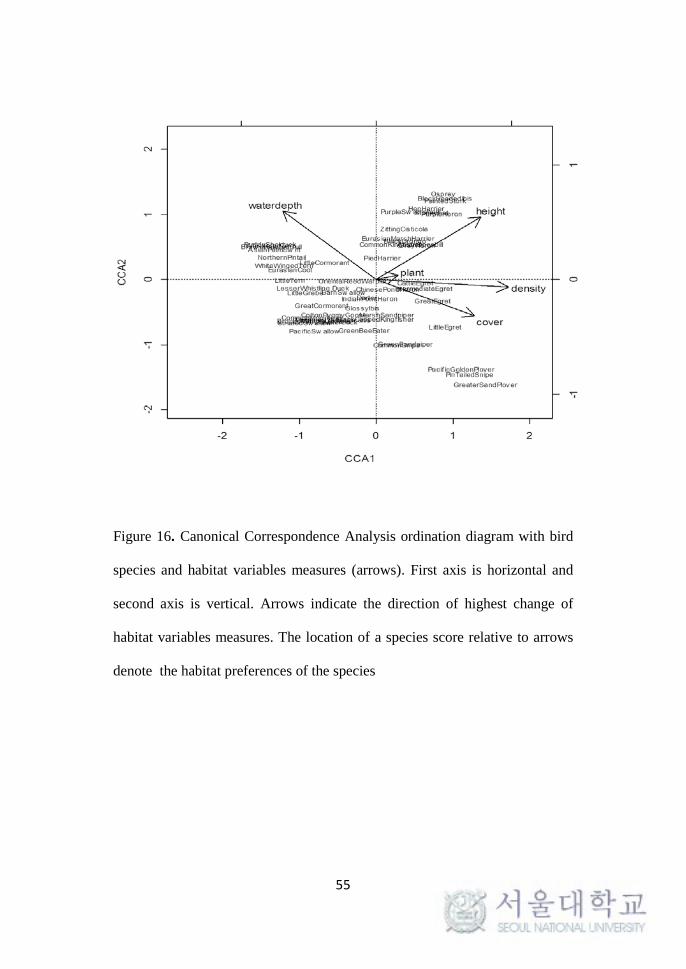
Figure 16. Canonical Correspondence Analysis ordination diagram with bird
species and habitat variables measures (arrows). First axis is horizontal and
second axis is vertical. Arrows indicate the direction of highest change of
habitat variables measures. The location of a species score relative to arrows
denote the habitat preferences of the species
55
4. Indicator species results
Among the 52 detected bird species during field survey, 35 species
are recognized as indicator species (Table 10). I found eight indicator species
in short grassland, ten indicator species in tall grasslands, five indicator
species in lotus field, eight indicator species in open water areas and four
indicator species in rice field.
Indicator species of short grassland habitat were Marsh Sandpiper
(Tringa stagnatilis), Oriental Darter (Anhinga melanogaster), Black-capped
Kingfisher (Halcyon pileata), Indian Pond-heron (Ardeola grayii),
Intermediate Egret (Mesophoyx intermedia), Glossy Ibis (Plegadis falcinellus),
Chinese Pond-heron (Ardeola bacchus) and Green Sandpiper (Tringa
ochropus).
Indicator species of tall grassland habitat were Purple Heron (Ardea
purpurea), Purple Swamphen (Porphyrio porphyrio), Asian Openbill
(Anastomus oscitans), Hen Harrier (Circus cyaneus), Blacked-headed Ibis
(Threskiornis melanocephalus), Grey Heron (Ardea cinerea), Cattle Egret
(Bubulcus ibis), Painted Stork (Mycteria leucocephala), Pied Harrier (Circus
melanoleucos) and Common Kingfisher (Alcedo atthis).
Indicator species of lotus field habitat were Bronze-winged Jacana
(Metopidius indicus), Garganey (Anas querquedula), Pheasant-tailed Jacana
(Hydrophasianus chirurgus), Common Moorhen (Gallinula chloropus) and
Cotton Pigmy-goose (Nettapus coromandelianus).
56
Indicator species in open water areas were Little Tern (Sternula
albifrons), White-winged Tern (Chlidonias leucopterus), Ruddy Shelduck
(Tadorna ferruginea), Brown-headed Gull (Chroicocephalus brunnicephalus),
Eurasian Coot (Fulica atra), Little Cormorant (Phalacrocorax niger),
Whiskered Tern (Chlidonias hybrid) and Little Grebe (Tachybaptus ruficollis).
Lastly, Pacific Golden Plover (Pluvialis fulva), Pin-tailed Snipe
(Gallinago stenura), Little Egret (Egretta garzetta) and Great Egret (Egretta
alba) were indicator species of rice field habitat.
57
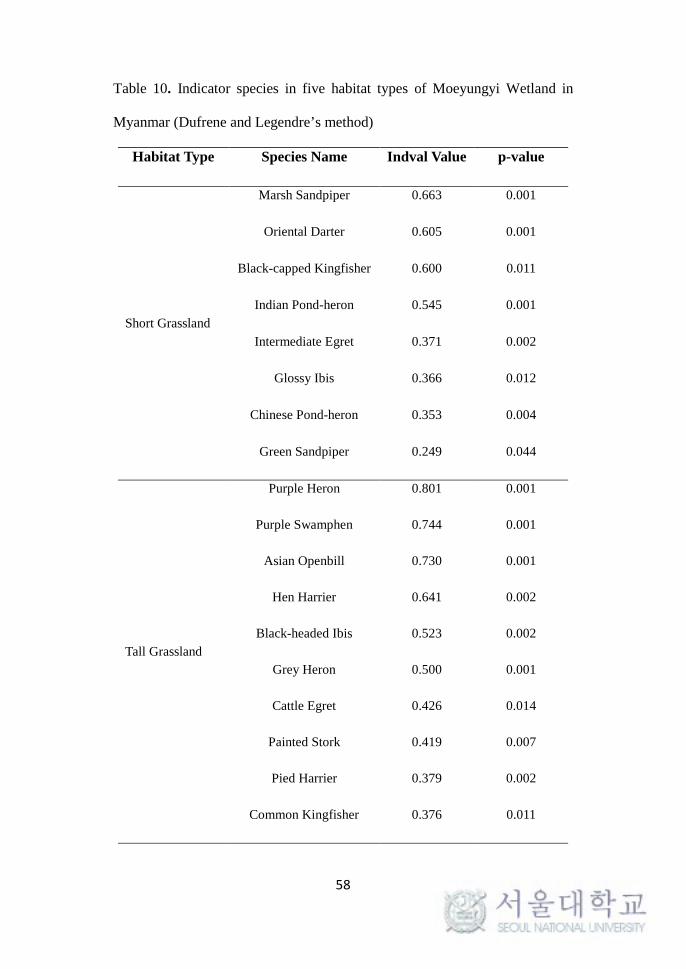
Table 10. Indicator species in five habitat types of Moeyungyi Wetland in
Myanmar (Dufrene and Legendre’s method)
Habitat Type Species Name Indval Value p-value
Short Grassland
Marsh Sandpiper 0.663 0.001
Oriental Darter 0.605 0.001
Black-capped Kingfisher 0.600 0.011
Indian Pond-heron 0.545 0.001
Intermediate Egret 0.371 0.002
Glossy Ibis 0.366 0.012
Chinese Pond-heron 0.353 0.004
Green Sandpiper 0.249 0.044
Tall Grassland
Purple Heron 0.801 0.001
Purple Swamphen 0.744 0.001
Asian Openbill 0.730 0.001
Hen Harrier 0.641 0.002
Black-headed Ibis 0.523 0.002
Grey Heron 0.500 0.001
Cattle Egret 0.426 0.014
Painted Stork 0.419 0.007
Pied Harrier 0.379 0.002
Common Kingfisher 0.376 0.011
58

Habitat Type Species Name Indval Value p-value
Lotus Field
Bronze-winged Jacana 0.978 0.001
Garganey 0.900 0.001
Pheasant-tailed Jacana 0.604 0.001
Common Moorhen 0.600 0.001
Cotton Pigmy-goose 0.475 0.003
Open Water
Little Tern 0.667 0.001
White-winged Tern 0.566 0.001
Ruddy Shelduck 0.561 0.001
Brown-headed Gull 0.551 0.001
Eurasian Coot 0.523 0.001
Little Cormorant 0.522 0.001
Whiskered Tern 0.479 0.005
Little Grebe 0.407 0.008
Rice Field
Pacific Golden Plover 0.679 0.001
Pin-tailed Snipe 0.672 0.001
Little Egret 0.523 0.001
Great Egret 0.343 0.024
59
V. Discussion
1. Species richness, abundances and diversity of bird among
different habitats
The results of bird survey indicated that short grassland habitat had
highest bird diversity, high bird species richness and high bird abundances.
Tall grassland habitat hosted high bird diversity, high bird species richness
and high bird abundances. High bird diversity, highest species richness and
low bird abundance were found in lotus field. The open water areas showed
high bird diversity, high species richness and abundances. On the other hand,
rice field habitat showed the lowest bird diversity, lowest species richness and
lowest bird abundances. Consequently, these results can be summarized into
two major findings that the composition of bird communities was different
among five habitats and, more importantly, that rice field may have lower
indices for bird communities than any other habitat types in my study area.
The latter suggests that natural marshes are more beneficial for maintaining of
high species richness, abundances and diversity of birds than rice field habitat
during wintering seasons in my study area.
This study supports multiple previous studies about rice fields as a
worse habitat than natural marshes due to the disturbance. Especially in Asia
and in some parts of Europe, the rice fields could not fully replace natural
wetlands in the context of bird conservation and management, since the most
bird species were strongly depended on natural marshes for foraging, roosting
60
and nesting sites (Elphick 2000, Czech and Parsons 2002, Elphick and Oring
2003, Elphick 2004, Gopi Sundar 2006). The importance of grasslands have
long been recognized for waterfowl (Gilmer et al. 1982) and shorebirds
(Hunter et al. 1991; Shuford et al 1993, 1994). The presence of globally
threatened avian species Black-headed Ibis (Threskiornis melanocephalus),
Painted Stork (Mycteria leucocephala) and Oriental Darter (Anhinga
melanogaster), in natural marshes, emphasize the significance marshy
grassland habitat for the conservation of these threatened species and other
waterbid communities
However, there are some exceptions, for instance, in Neotropic, and
Mediterranean Europe, where the use of rice fields by waterbirds is higher
than natural habitats in other regions as the natural wetlands of the
Mediterranean regions have been reduced to some extent due to human
populations and land use changes and rice field habitat can replace the loss of
habitats for waterbirds (Falosa 1986, Falosa and Ruiz 1996, Blanco et al.
2006). Other studies also stated that rice fields may provide suitable habitat
for waterbirds during wintering and migration (e.g. Treca 1994, Elphick and
Oring 1998) and rice fields are also important foraging habitat for several bird
species of Camargue, France (Tourenq et al. 2001).
At Moeyungyi wetland, rice fields were greatly used by only egrets,
snipes and plovers. However, the numbers of observation were not too much.
Generally, in terms of vegetation species, rice field supported only one
dominant vegetation species of rice while grasslands and lotus fields
supported more vegetation species. The least species richness, abundances 61
and diversity of birds in rice fields may be due to the components of
vegetation species in a rice field. The high species richness, abundances and
diversity of birds in grasslands and lotus fields may be due to high vegetation
species’s components. Not only that, Wild Rice (Oryza minuta) bears many
fruits in grassland habitats during the winter and it is one of the reasons that
natural marshes can attract more birds during the winter. The Indian Lotus,
Nelumbium speciosum grows in thick groups and these lotus fields are good
habitats for some waterbirds such as Bronze-winged Jacana (Metopidius
indicus), Pheasant-tailed Jacana (Hydrophasianus chirurgus) and so on.
Species richness and abundances of some bird individuals were probably
influenced by the aspects of vegetation species compositions, diversity,
density and vegetation heights. Bryan and Best (1991) also mentioned this
finding that the vegetation height and vegetation species composition are a
major structural habitat, which is widely accepted to interpret the habitat
selection of grassland birds.
The effects of human disturbances may encourage birds to move to
other sites. Human activities disturb birds and individual bird species respond
to human disturbances in some ways (Nisbet 2000, Pease et al 2005).
Unfortunately, the early period of winter is busy season for farmers to plant
and manage rice. Thus, higher disturbance and habitat change (ploughing)
may influence on low number of birds at rice field habitats. Some researchers
have mentioned that flooded rice fields are quite important habitats for
waterbirds and can substitute for the losses of natural wetland habitats
(Remsen et al.1991, Treca 1994, Tourenq et al. 2001). However, rice fields of 62
my study site are irrigated seasonal rice fields and the water level is the lowest
in rice fields when compared with other natural wetland areas (see water
depth result).
Therefore, rice fields of my study site may not be good habitats for
waterbirds in winter. The use of chemical fertilizers and pesticides in rice
fields may also affect the habitat use of waterbird communities. Chemical
fertilizers should be replaced with organic fertilizers to reduce side effects.
However, rice fields are valuable as the control site of Moeyungyi Wetland.
The water source of Moeyungyi Wetland depend on monsoon rain, so the
wetland area is flooded in the rainy season and then, the water level is falling
down in the dry season. When the water level is falling down, rice fields are
more expanding into the wetland areas by the local people. Rice field areas
should not be expanded more and more into the wetland areas to conserve the
value of natural marshes of Moeyungyi Wetland and its bird communities.
63
2. Relationships between bird species and their habitat variables
and indicator species
A significant correlation was found between bird species and habitat
variables. CCA results (Figure 15-16) showed that the highest vegetation
height, the most dense vegetation and the least plant species diversity were
recorded in tall grasslands. The vegetation cover was the highest in rice field
habitat, and the water depth was the deepest in open water areas. All habitat
variables such as vegetation density, vegetation coverage, vegetation height,
plant species diversity and water depth were associated with the occurrence of
bird communities.
CCA results (Figure 16) show that the water depth is related to some
diving birds such as cormorants, ducks, terns, etc. The water depth of open
water areas is the deepest of all other habitats (see water depth result). So, I
can suppose that diving birds prefer deep open water areas (Figure 15-16).
The maintenance of open water areas with deep water depth is important for
diving birds at the Moeyungyi Wetland.
The Moeyungyi wetland is flooded during the rainy season. Every
year in February, water is withdrawn by the Irrigation Department through the
sluice-gates to irrigate rice fields. The wetland area becomes progressively
dry during the dry season. Every season, the effects of water level changes
may negatively impact the waterbird populations that are present at the site
during that time of the year. The proper water level should be maintained for
64
the habitats of waterbirds. Therefore, water level management is urgently
needed at Moeyungyi Wetland in all seasons.
The results of many studies also indicated that the water level is
probably the major factor that influence habitat use of individual waterbirds
species (Elphick and Oring 1998). Waterbirds that forage in the water without
diving (except diving birds) depends on the length of theirs necks and leg in
selecting the maximum water depth of feeding sites and usually feed in water
depth deeper than 25 cm (Ntiamoa-Baidu et al. 1998, Colwell and Taft 2000,
Hattori and Mae 2001; Traill and Brook 2011). In India, Black-necked Stork
(Ephippiorhynchus asiaticus) avoided high water levels (> 60 cm) even
though the patch had high prey density (Maheswaran and Rahmani 2001). In
China, Siberian Cranes (Grus leucogeranus) move to other places when water
levels are > 50 cm due to difficulties in accessing tubers and for Wattled
Crane, water level > 35 cm would be difficult to wade and dig tubers (ICF
2012). Colwell and Oring 1988, Isola et al. 2000, Colwell and Taft 2000 also
found that variation in the use of water depth at the foraging location
increased with the size of species for example, small shorebirds use the water
depth of (<5cm), large shorebirds use the water depth between (5-11 cm), teal
use the water depth between (10-15 cm) and large dabbling ducks use the
water depth of (>20 cm). Maintaining appropriate patterns of water
fluctuations were essential for the management of wetlands and bird
communities (Kushlan 1986).
65
CCA results in this study showed the habitat preferences of individual
bird species (Figure 16). According to CCA results, different bird
assemblages had distinct habitat preferences for habitats. Habitat suitability is
one of the important factors affecting bird communities (Hattori and Mae
2001). The result of CCA was also concordant with indicator species results.
For example, CCA results revealed that Little Cormorant, Little Grebe,
Eurasian Coot, Little Tern, White-winged Tern, Ruddy Shelduck preferred
deep water and non vegetated areas. The indicator species analysis also
showed that these waterbird species are indicator species of open water areas.
In the same way, CCA results showed that waterbirds such as Asian
Openbill, Purple Swamphen, Black-headed Ibis, Painted Stork, Hen Harrier
prefer to tall grassland habitat with high vegetation height and much
vegetation density. Indicator species results showed that these waterbird
species are indicator species of tall grassland habitat. Therefore, the results of
CCA was concordant with indicator species results. Relationships between
vegetation height selection and bird species had been shown by other studies.
Birds prefer to select lower vegetation height to allow more visual cues to
discover prey items (Eiserer 1980, Berchard 1982). For instance, Shoebills
and Wattled Cranes selected short sparse vegetation for foraging but tall and
emergent macrophytes neighboring foraging sites could be important for
roosting and nesting of both species (John et al. 2012).
66
CCA (Figure 15-16) results also confirmed that waterbird species
such as Pacific Golden Plover, Pin-tailed Snipe and Greater Sand Plover
prefer to use rice field habitat with very shallow water depth, thick vegetation
cover, much vegetation density but with the shortest vegetation height.
Indicator species results also confirmed that Pacific Golden Plover and Pin
Tailed Snipe are indicator species of rice field. My CCA results showed the
ecological preferences of these waterbird species.
Bryan and Best (1991) also mentioned that the vegetation height and
vegetation species composition were a major structural habitat, which was
widely used to explain habitat selection of grassland birds. These observations
suggest that bird communities were significantly associated with plant species
diversity, confirming the finding of Winternitz (1976) and James and Wamer
(1982). However, the relationships differed at the spatial and temporal scales,
which made interpretation to be difficult, but the variations were possibly due
to seasonality in migrants and phenological events of plant species (Raman
2001).
The habitat use of waterbird species differs from one species to
another species. Species richness and density of waterbirds that feed in water
depended largely on the water depth but individual species usually had a
preferred water depth for feeding (Colwell and Taft 2000). In the grassland of
the USA, shallow wetlands with average depths of 10-20 cm support high
waterbird richness because of the diverse feeding sites available, which vary
from exposed mud to deeper water with submerged aquatic plants (Colwell
and Taft 2000). For waterfowl and shorebirds, water depth at foraging sites 67
varies with species morphologies; birds were limited by size to forage in
habitats where food is available to them (Poysa 1983), for example, large-
bodied, long-necked waterfowl forage in deeper water than small species
(Poysa 1983). Among shorebirds, foraging depths were correlated with
culmen and tarsus lengths (Baker 1979). No study on the foraging habitat
selection of waterbird species as well as land birds found a Moeyungyi
Wetland areas is available, therefore further studies are needed.
Since the study was only conducted during wintering period, therefore,
seasonal and year-round survey are required. Long term studies and
monitoring to understand the temporal and spatial dynamics of waterbird
communities are required for effective management of wetlands and their bird
communities.
68
VI. Conclusions and Management Implications
There was significant differences in the waterbird community
structure and composition between five habitat types. Natural marshes held
greater number and diversity of birds than the rice field. Therefore, natural
marshes should be managed for the conservation of Moeyungyi Wetland
Wildlife Sanctuary, according to its higher biodiversity and the conservation
of threatened waterbird species. Rice field at Moeyungyi Wetland
demonstrated lower ecological indices of the avian community. Currently, the
encroachment of rice fields and increased grazing activities , such as duck
farming and ranching of domestic water buffalos. The monitoring and
management of these activities should be considered to maintain sufficient
natural marsh area for healthy wetland ecosystem . Especially, three globally
theatend species found during this study were all dependent on grass wetland
habitat types. Thus, conservation and management of short grasslands and tall
grasslands should be critical to conserve these endangered bird’s habitat.
From correlation analysis, we found that the vegetation height, cover and
density, and weter depth, are important habitat characteristics for wintering
waterbird community and these variables can be managed by anthropogenic
influences greatly.
Indicator species found in this study can be a useful measure for the
management of Moeyungyi Wetland, and even can be applied to broader
geographic region including tropical South and Southeast Asia which holds
similar wetland habitats and waterbird communities during winter.
69
During the winter, local people grow rice within and around wetlands.
Rice fields around the wetland areas are useful as the control site of this areas.
Rice fields of the Moeyungyi area are irrigated seasonal rice fields. Some
farmers start growing rice in the middle or at the end of January. Rice fields
are usually harvested during April and May. Growing rice within wetland
areas is an encroachment by the local people. These are a cause of conflict
between the Forest Department and the local people. Chemical fertilizers and
pesticides are used in rice fields in order to improve the agricultural products.
The livelihoods of local people heavily depend on the growing of rice and
fishing activities. It might cause severe effects to our wetland ecosystem.
There are additional anthropogenic effects on wetland habitats at
Moeyungyi. Reed plants are used as fuel by local people. The effects of
grazing by domestic ducks and buffaloes at Moeyungyi Wetland have not
studied yet.
The previous study in other countries showed that most waterbird
species use rice fields as breeding sites rather than foraging sites. My study
was conducted only during the winter season (but not the whole winter season)
and could not reflect all farming practices and seasonal changes at the rice
fields as well as at the natural marshes. Further surveys are needed in
Moeyungyi areas seasonally to understand the habitat condition changes for
bird communities.
70
Moreover, further studies would be needed to understand the
influence of using rice fields by bird communities at different stages of rice
cultivation (for example the earlier stage of growing rice, middle stage or
green and mature stage of rice and post-harvest stage). Research is needed for
detailed analysis of food resources for bird communities.
In the same way, grassland habitats would also need to be included
when conducting surveys at the same time with rice cultivated stages in order
to get more information on bird diversity and species richness among different
habitats. We can use this information to help wildlife managers and
agriculturalists to understand the importance of habitat types for the effective
management of bird conservation in the Moeyungyi area. Wildlife managers
need to know when and how to implement habitat manipulation such as water
level manipulation, plant species diversity, vegetation coverages, vegetation
density and vegetation height.
So long as these wetlands and their environments are kept in good
condition, the birds will repeatedly visit and spend a comfortable time in
Myanmar. Long term studies and monitoring are needed to understand the
temporal and spatial dynamics of water bird communities. This will be very
helpful in the design and implementation of effective management of
wetlands and their bird communities. This information can then be used to
draw management planning for future actions.
71
VII. References
Adamus, P. R., and Brandt, K. H. 1990. Impacts on quality of inland wetlands of the
United States: A survey of indicators, techniques, and applications of
community-level biomonitoring data, Environmental Protection Agency
Research Laboratory, Corvalis, Oregon, USA.
Baker, M. C. 1979. Morphological correlates of habitat selection in a community of
shorebirds (Charadriiformes). Oikos 33: 121-126.
Barbier, E. B. 1993. Sustainable use of wetlands valuing tropical wetland benefits:
economic methodologies and applications. Geographical Journal 159: 22-32.
Barbier, E. B.1994. Valuing environmental functions: tropical wetlands. Land
economics 70: 155-173.
Bechard, M. J. 1982. Effect of vegetative cover on foraging site selection by
Swainson's Hawk. Condor 84: 153-159.
Birdlife International. 2003. Saving Asia’s threatened birds: a guide for government
and civil society, Cambridge, U.K. Birdlife International.
Blair, R. B. 1996. Land use and avian species diversity along an urban
gradient. Ecological applications 6: 506-519.
Blanco, D. E., López-Lanús, B., Dias, R. A., Azpìroz, A., and Rilla, F. 2006. Use of
rice fields by migratory shorebirds in southern South America: implications
for conservation and management. Wetlands International. Buenos Aires,
Argentina.
Brown, D.1954. Methods of surveying and measuring vegetation. Common Wealth
Bur. Pasture and Field Crops, Bull. 42, Bradley and Sons Ltd., Reading,
England.
72
Bryan, G.G. 1990. Species abundance patterns and productivity of birds using
grassed waterways in Iowa rowcrop fields, M.Sc. Thesis, Iowa State
University.
Bryan, G. G., and Best, L. B. 1991. Bird abundance and species richness in grassed
waterways in Iowa rowcrop fields. American Midland Naturalist 126: 90-102.
Cáceres, M. D., and Legendre, P. 2009. Associations between species and groups of
sites: indices and statistical inference. Ecology 90: 3566-3574.
Chettri, N., Sharma, E., and Deb, D. C. 2001. Bird community structure along a
trekking corridor of Sikkim Himalaya: a conservation perspective. Biological
Conservation 102: 1-16.
Chettri, N., Deb, D. C., Sharma, E., and Jackson, R. 2005. The relationship between
bird communities and habitat: A study along a trekking corridor in the Sikkim
Himalaya. Mountain Research and Development 25: 235-243.
Cockayne, A. H. 1926. Aims and methods in the study of vegetation. Tansley and
Chipp, Crown Agents for the Colonies, Landon.
Colwell, M. A., and Oring, L. W. 1988. Habitat use by breeding and migrating
shorebirds in south central Saskatchewan. The Wilson Bulletin 100: 554-566.
Colwell, M. A., and Taft, O. W. 2000. Waterbird communities in managed wetlands
of varying water depth. International journals of Waterbirds Biology 23: 45-
55.
Cowardin, L.M., Francis C. G and Edward T.L. 1979. Classification of wetlands and
deepwater habitats of the United States. Available on http://www.fws.gov/wetl
ands/documents/ classification-of- wetlands-and-deepwater-habitats-of-the-uni
ted-states. pdf. Accessed on February 2015.
Czech, H. A., and Parsons, K. C. 2002. Agricultural wetlands and waterbirds: a
review. International journal of Waterbirds Biology 25: 56-65.
73
Dahl, T. E. 1990. Wetland losses in the United States, 1780's to 1980's. Fish and
Wildlife Service, Washington, DC, USA.
Davari, N. E. G. A. R., Jouri, M.H., and Ariapour, A. 2011. Comparison of
measurement indices of diversity, richness, dominance and evenness in
rangeland ecosystem (Case study: Jvzherdeh Ramesar). Journal of Rangeland
Science 2: 389-398.
Davies, J., Sebastain, A.C. and Chan, S. 2004. A Wetland Inventory for Myanmar.
Ministry of Environment. Japan.
Dufrêne, M., and Legendre, P. 1997. Species assemblages and indicator species: the
need for a flexible asymmetrical approach. Ecological Monographs 67: 345-
366.
Eiserer, L. A. 1980. Effects of grass length and mowing on foraging behavior of the
American Robin (Turdus migratorius). Auk 97: 576-580.
Elphick, C. S. 2000. Functional equivalency between rice fields and seminatural
wetland habitats. Conservation biology 14: 181-191.
Elphick, C.S., and Oring, .W. 1998. Winter management of California rice fields for
waterbirds. Journals of Applied Ecology 35: 95-108.
Elphick, C. S., and Oring, L. W. 2003. Conservation implications of flooding rice
fields on winter waterbird communities. Agriculture, Ecosystems and
Environment 94: 17-29.
Elphick, C. S. 2004. Assessing conservation trade-offs: identifying the effects of
flooding rice fields for waterbirds on non-target bird species. Biological
Conservation 117: 105-110.
Erwin, R. M. 2002. Integrated management of waterbirds: beyond the
conventional. International journal of Waterbird Biology 25: 5-12.
74
Fasola, M. 1986. Resource use of foraging herons in agricultural and nonagricultural
habitats in Italy. Colonial Waterbirds 9: 139-148.
Fasola, M., and Ruiz, X. 1996. The value of rice fields as substitutes for natural
wetlands for waterbirds in the Mediterranean region. Colonial Waterbirds 19:
122-128.
Finch, D. M. 1989. Habitat use and habitat overlap of riparian birds in three
elevational zones. Ecology 70: 866-880.
FD: Forest Department. 2013. Handbook of Moeyungyi Wetland Wildlife Sanctuary,
Myanmar
Gilmer, D. S., Miller, M. R., Bauer, R. D., and LeDonne, J. R. 1982. California's
Central Valley wintering waterfowl: concerns and challenges. Transactions of
the North American Wildlife and Natural Resources Conferences 47: 441-452
Goodall, D. W. 1952. Some considerations in the use of point quadrats for the
analysis of vegetation. Australian Journal of Biological Sciences 5: 1-41.
Gopi Sundar, K. S. 2006. Flock size, density and habitat selection of four large
waterbirds species in an agricultural landscape in Uttar Pradesh, India:
implications for management. Waterbirds 29: 365-374.
Gotelli, N. J., and Colwell, R. K. 2001. Quantifying biodiversity: procedures and
pitfalls in the measurement and comparison of species richness. Ecology
letters 4: 379-391.
Green, A. J. 1996. Analyses of globally threatened Anatidae in relation to threats,
distribution, migration patterns, and habitat use. Conservation Biology 10:
1435-1445.
Green, A. J.1998. Comparative feeding behavior and niche organization in a
Mediterranean duck community. Canadian Journal of Zoology 76: 500-507.
75
Hattori, A., and Mae, S. 2001. Habitat use and diversity of waterbirds in a coastal
lagoon around Lake Biwa, Japan. Ecological Research 16: 543-553.
Hostetler, M. E., and Main, M. B. 2001. Florida monitoring program: point count
method to survey birds. University of Florida Cooperative Extension Service,
Institute of Food and Agriculture Sciences.
Hunter, L., Canevari, P., Myers, J. P., and Payne, L. X. 1991. Shorebird and wetland
conservation in the Western Hemisphere. International Council Bird
Preservation Technical Publication 12: 279-290.
ICF- 2012. Siberia crane wetland project: Poyang Lake Ecology Study. International
Crane Foundation (ICF). Available on http://www.savingcranes.org/poyang-
lake-ecology-study-html. Accessed on April 2015.
Isola, C. R., Colwell, M. A., Taft, O. W., and Safran, R. J. 2000. Interspecific
differences in habitat use of shorebirds and waterfowl foraging in managed
wetlands of California's San Joaquin Valley. International journal of Waterbird
Biology 23: 196-203.
James, F. C., and Wamer, N. O. 1982. Relationships between temperate forest bird
communities and vegetation structure. Ecology 63: 159-171.
John, J. R., Nahonyo, C. L., Lee, W. S., and Msuya, C. A. 2012. Observations on
nesting of shoebill Balaeniceps rex and wattled crane Bugeranus carunculatus
in Malagarasi wetlands, western Tanzania. African Journal of Ecology 51:
184-187.
Kercher, S. M., Frieswyk, C. B., and Zedler, J. B. 2003. Effects of sampling teams
and estimation methods on the assessment of plant cover. Journal of
Vegetation Science 14: 899-906.
Kruskal, W. H., and Wallis, W. A. 1952. Use of ranks in one-criterion variance
analysis. Journal of the American statistical Association 47: 583-621.
76
Kushlan, J. A. 1986. Responses of wading birds to seasonally fluctuating water
levels: strategies and their limits. Colonial Waterbirds 9: 155-162.
Li, Z.W.D. and Mundkur, T. 2007. Numbers of distribution of waterbirds and
wetlands in the Asia-Pacific region. Results of the Asian Waterbird Census:
2002-2004. Wetlands International, Kuala Lumpur, Malaysis.
Losito, M. P., and Baldassarre, G. A. 1995. Wetland use by breeding and
postbreeding female mallards in the St. Lawrence river valley. The Wilson
Bulletin 107:55-63.
MacArthur, R. 1960. On the relative abundance of species. American Naturalist 94:
25-36.
MacArthur, R. H., and MacArthur, J. W. 1961. On bird species diversity.
Ecology 42 : 594-598.
MacArthur, R., Recher, H., and Cody, M. 1966. On the relation between habitat
selection and species diversity. American Naturalist 100: 319-332.
Ma, Z., Gan, X., Choi, C., Jing, K., Tang, S., Li, B., and Chen, J. 2007. Wintering
bird communities in newly-formed wetland in the Yangtze River
estuary. Ecological research 22: 115-124.
Maheswaran, G., and Rahmani, A. R. 2001. Effects of water level changes and
wading bird abundance on the foraging behaviour of blacknecked storks
Ephippiorhynchus asiaticus in Dudwa National Park, India. Journal of
biosciences 26: 373-382.
McGeoch, M.A. and Chown, S.L. 1998. Scaling up the value of bioindicators.
Trends in Ecology and Evolution 13: 46-47.
Mills, G. S., Dunning Jr, J. B., and Bates, J. M. 1991. The relationship between
breeding bird density and vegetation volume. Wilson Bulletin 103: 468-479.
77
MOECAF. Ministry of Environmental Conservation and Forestry. 2014. Fifth
National Report to the Convention on Biological Diversity. Available on
https://www.cbd.int/doc/world/mm/mm-nr-05-en.pdf. Accessed on April 2015.
Mitsch, W. J., and Gosselink, J. G. 2000. The value of wetlands: importance of scale
and landscape setting. Ecological Economics 35: 25-33.
Nisbet, I. C. 2000. Disturbance, habituation, and management of waterbird
colonies. International journal of waterbird biology 23: 312-332.
Ntiamoa-Baidu, Y., Piersma, T., Wiersma, P., Poot, M., Battley, P., and Gordon, C.
1998. Water depth selection, daily feeding routines and diets of waterbirds in
coastal lagoons in Ghana. Ibis, 140: 89-103.
Nudds, T. D., Sjöberg, K., and Lundberg, P. 1994. Ecomorphological relationships
among Palearctic dabbling ducks on Baltic coastal wetlands and a comparison
with the Nearctic. Oikos 69: 295-303.
O'Connell, T. J., Jackson, L. E., and Brooks, R. P. 2000. Bird guilds as indicators of
ecological condition in the central Appalachians. Ecological Applications, 10:
1706-1721.
Paton, D. C., Rogers, D. J., Hill, B. M., Bailey, C. P., and Ziembicki, M. 2009.
Temporal changes to spatially stratified waterbird communities of the
Coorong, South Australia: implications for the management of heterogenous
wetlands. Animal Conservation 12: 408-417.
Pease, M. L., Rose, R. K., and Butler, M. J. 2005. Effects of human disturbances on
the behavior of wintering ducks. Wildlife Society Bulletin 33: 103-112.
Pöysä, H. 1983. Resource utilization pattern and guild structure in a waterfowl
community. Oikos 40: 295-307.
Pyrovetsi, M., and Papastergiadou, E. 1992. Biological conservation implications of
water-level fluctuations in a wetland of international importance: Lake
Kerkini, Macedonia, Greece. Environmental Conservation 19: 235-244. 78
Rajpar, M. N., and Zakaria, M. 2011. Effects of water level fluctuation on waterbirds
distribution and aquatic vegetation composition at natural wetland reserve,
Peninsular Malaysia. International Scholarly Research Notice Ecology 2011:
324038-324038.
Ralph, C. J., and Sauer, J. R. 1995. Monitoring bird populations by point counts.
USDA Forest Service, Albany, USA.
Ramsar, I. 1971. Convention on Wetlands of International Importance, Especially as
Waterfowl Habitat. UN Treaty Series.
Raman, T. R. 2001. Effect of Slash-and-Burn Shifting Cultivation on Rainforest
Birds in Mizoram, Northeast India. Conservation Biology 15: 685-698.
Remsen, J. V., Swan, M. M., Cardiff, S. W., and Rosenberg, K. V. 1991. The
importance of the rice-growing region of south-central Louisiana to winter
populations of shorebirds, raptors, waders, and other birds. Journal of
Louisiana Ornithology 1: 35-47.
Roberge, J. M., and Angelstam, P. 2006. Indicator species among resident forest
birds–across-regional evaluation in northern Europe. Biological
Conservation 130:134-147.
Robert, D.W. 2015. Ordination and multivariate analysis for ecology. Available on
http://cran.r-project.org/web/packages/labdsv/labdsv.pdf. Accessed on May
2015.
Sekercioglu, C. H. 2006. Increasing awareness of avian ecological function. Trends
in ecology and evolution 21: 464-471.
Shannon, C.E., and Weaver, W., 1949, The mathematical theory of communication,
University of Illinois press. Urbana.
Shuford, W. D., Page, G. W., and Kjelmyr, J. E. 1993. Distribution, abundance and
habitat use of shorebirds in California’s Central Valley in winter 1992-1993.
Point Reyes Bird Observatory, Stinson Beach, CA. 79
Shuford, W. D., Page, G. W., Kjelmyr, J. E., and Hickey, C. M. 1994. Seasonal
abundance and habitat use of shorebirds in California's Central Valley,
November 1993 to August 1994. Point Reyes Bird Observatory, Stinson
Beach, CA.
Ter Braak, C. J.1986. Canonical correspondence analysis: a new eigenvector
technique for multivariate direct gradient analysis. Ecology 67: 1167-1179.
Ter Braak, C. J., and Verdonschot, P. F. 1995. Canonical correspondence analysis
and related multivariate methods in aquatic ecology. Aquatic sciences 57: 255-
289.
Thaw, W. N. 2013. Information sheet on Ramsar wetlands (RIS) Available on
http://www. ram sar.org /ris/key_ris_index-htm. Accessed on February 2015.
Tourenq, C., Bennetts, R. E., Kowalski, H., Vialet, E., Lucchesi, J. L., Kayser, Y.,
and Isenmann, P. 2001. Are rice fields a good alternative to natural marshes for
waterbird communities in the Camargue, southern France. Biological
Conservation 100: 335-343.
Traill, L. W., and Brook, B. W. 2011. An aggregative response of the tropical
Australian magpie goose (Anseranas semipalmata) to seasonal floodplains.
Journal of Tropical Ecology 27: 171-180.
Tréca, B. 1994. The diet of Ruffs and Blacktailed Godwits in Senegal. Ostrich, 65:
256-263.
Velasquez, C. R. 1992. Managing artificial saltpans as a waterbird habitat: species'
responses to water level manipulation. Colonial Waterbirds 15: 43-55.
Verner, J. 1984. The guild concept applied to management of bird populations.
Environmental Management 8: 1-13.
Weber, L. M., and Haig, S. M. 1996. Shorebird use of South Carolina managed and
natural coastal wetlands. Journal of wildlife management 60: 73-82.
80
Wetland International. 2013. Annual reports and accounts. Available on http:// www.
wetlands.org/Portals/0/publications/Annual%20Review/Wetlands%20Internati
onal%20Annual%20Report%202013_LOW%20RESL.pdf. Accessed on April.
2015.
Wetland International. 2014. New Delhi. India. Wetlands International South Asia.
Accessed on July. 2015. http://south-asia.wetlands.org/WhatWeDo/Asian
WaterbirdCensus / BackgroundInformation/tabid/2893/Default.aspx
Wiens, J. A. 1969. An approach to the study of ecological relationships among
grassland birds. Ornithological Monographs 8: 1-93.
Wiens, J. A. 1992. The ecology of bird communities (Vol. 1). Cambridge University
Press. Cambridge.
Winternitz, B. L. 1976. Temporal change and habitat preference of some montane
breeding birds. Condor 78: 383-393.
81
Abstract in Korean
조류 서식지의 보전과 관리에 있어 서식지 유형에 따른 조류 군집의
특성에 대한 이해는 필수적으로 선행되어야 한다. 특히 다양한 서식지
로 이뤄진 열대 동남아시아 지역의 습지는 중앙아시아, 동아시아 철새
이동경로내의 월동지로서, 물새 보전에 있어 매우 중요한 지역이다. 그
러나 아직까지 열대 동남아시아 지역에서 서식지와 물새 군집의 관계
에 대한 연구는 거의 이뤄지지 않은 상황이다. 본 연구는 미얀마의 모
엔지 습지에서 서식지 유형별 조류군집의 특성을 비교하고, 각 서식지
의 환경적 특징과 조류 군집 구조간의 관계를 파악하며, 지표종 분석
(indicator anlaysis)을 통하여 각 서식지를 대표하는 지표종을 선정하
는 것을 목적으로 하였다. 2014년 1월에서 2015년 2월 까지 서식지
유형별 월동기 조류 군집 특성과 와 환경 요인 조사를 실시하였다. 이
를 위해 모엔지 습지를 대표하는 5개 서식지 유형( 짧은 초습지 (short
grassland), 키가 큰 초습지(tall grassland), 연밭(lotus field), 개방수
역(open water area), 논(rice field)) 에서 각각 조사구를 선정하였다.
각 49개의 조사구에서 7분씩 6번의 정점 조사를 실시한 결과, 국제적
멸종위기종인 Black-headed Ibis (Threskiornis melanocephalus),
Painted Stork (Mycteria leucocephala), Oriental Dater (Anhinga
melanogaster )를 포함하여, 총 52종 11971개체가 확인되었다. 서식
지 간 조류군집지표(종풍부도(species richness), 수도(species
abundance), 종다양도(species diversity))를 비교한 결과, 논의 종풍
부도, 수도, 종다양도 모두 다른 자연습지에 비해 매우 낮은 것으로 나
타났다. 이는 본 연구의 조사 시기가 논 농사가 시작하는 시기라는 점
에서 자연습지에 비해 논에서 사람에 의한 교란이 높았기 때문으로 예
상되며, 이 외에 다른 서식지에 비해 낮은 식생다양도와 수위 등의 환
경요인도 영향을 미쳤을 것으로 판단된다. 환경 요인과 종간의 관계를
82
파악하기 위해 정준상관분석(Canonical correspondence analysis)을
실시한 결과, 식생면적, 밀도, 높이 및 수위가 중요한 환경 요인으로 나
타났으며, Marsh Sandpiper (Tringa stagna )와 Oriental Dater는 짧
은 초습지, Puple Herons (Ardea purpurea)과 Puple Swamphen
(Ardea purpurea)은 키가 큰 초습지, Bronze-winged Jacana
(Metopidius indicus)와 Garganey (Anas querquedula) 는 연밭을 선
호하는 것으로 나타났다. Little Tern (Sternula albifrons)과 White-
winged Tern (Chlidonias leucopterus) 과 같은 잠수성 조류의 경우
식생이 없고 수심이 깊은 개방수역을 선호하는 것으로 나타났으며,
Pacific Golden Plover(Pluvialis fulva)과 Pintail snipe (Gallinago
stenura)는 수위가 낮고 식생 면적과 밀도가 높은 논을 선호하는 것으
로 나타났다. 지표종 분석결과 5개의 서식지 유형에 대해 총 35종이 지
표종으로 선정되었으며, 정준상관분석결과 또한 각 지표종과 서식지유
형과의 관계를 지지하였다. 종합적으로, 모엔지 습지에서 월동하는 조
류군집은 각 서식지 별로 다른 구조를 가지며, 특히 자연 습지가 조류
군집에게 더 중요한 역할을 하는 것으로 판단된다. 따라서 향후 모엔지
습지에서 월동하는 조류군집의 보전을 위해서는 자연 습지의 보호와
관리가 매우 중요하며, 특히 멸종위기종인 Black-headed Ibis,
Painted Stork, Oriental Dater가 지표종으로 선정된 짧은 초습지와
키가 큰 초습지에 대한 보전 및 관리가 중요하다고 생각된다. 향후 본
연구를 통해 선정된 지표종은 모엔지 습지의 서식지 관리에서 유용한
지표로 사용될 수 있으며, 더 나아가 본 연구 대상지와 유사한 습지 환
경이 나타나는 남아시아 및 동남아시아 열대지역에서의 월동기 물새
서식지 관리에 확대 적용할 수 있을 것으로 판단된다.
주요어: 논, 물새 군집, 열대 동남아시아, 지표종분석, 자연 습지,
학번: 2013-23874
83

![GeneralizedBayesian Canonical Correlation Analysis ...openaccess.thecvf.com/content_ECCVW_2018/papers/... · 3.2 Semi Canonical Correlation Analysis Semi CCA [13] is a method that](https://img.pdfslide.tips/doc/110x75/5f6c4d5d3572aa0fb1165380/generalizedbayesian-canonical-correlation-analysis-32-semi-canonical-correlation.jpg)