Embed Size (px)
Citation preview
P/N 702748-5
DMET™ Console 1.3 User Manual
Affymetrix® DMET™ Console 1.3 User Manual 2
For research use only.
Not for use in diagnostic procedures.
Trademarks
Affymetrix®,
®, GeneChip
®, HuSNP
®, GenFlex
®, Flying Objective™, CustomExpress
®, CustomSeq™,
NetAffx™, Tools To Take You As Far As Your Vision®, The Way Ahead™, Powered by Affymetrix™, GeneChip-
compatible™, and Command Console® are trademarks of Affymetrix, Inc.
All other trademarks are the property of their respective owners.
Limited License Notice
Limited License. Subject to the Affymetrix terms and conditions that govern your use of Affymetrix products, Affymetrix grants you a non-exclusive, non-transferable, non-sublicensable license to use this Affymetrix product only in accordance with the manual and written instructions provided by Affymetrix. You understand and agree that except as expressly set forth in the Affymetrix terms and conditions, that no right or license to any patent or other intellectual property owned or licensable by Affymetrix is conveyed or implied by this Affymetrix product. In particular, no right or license is conveyed or implied to use this Affymetrix product in combination with a product not provided, licensed or specifically recommended by Affymetrix for such use.
Affymetrix, Inc. authorizes you to use the DMET™ Plus Software ("Software") and any files used or generated by the software ("Files"), including but not limited to the content of the marker annotations file, the genotype-to-haplotype translation table and any other files used or generated by the software, only for uses not related to the commercial development of genotyping products for genotyping more than 100 polymorphisms analyzed by the Software or described in the Files (“Prohibited Commercial Purposes”), provided that you retain all copyright and other proprietary notices contained in the original Software and Files (together the "Materials") on any copies of the Materials. You may not modify the Materials in any way or reproduce, distribute or otherwise use them for any Prohibited Commercial Purpose. The Materials are copyrighted and any unauthorized use of the Materials may violate copyright, trademark, and other laws. If you breach any of these Terms, your authorization to use the Materials automatically terminates.
Patents
Software products may be covered by one or more of the following patents: U.S. Patent Nos. 5,733,729; 5,795,716; 5,974,164; 6,066,454; 6,090,555; 6,185,561; 6,188,783; 6,223,127; 6,228,593; 6,229,911; 6,242,180; 6,308,170; 6,361,937; 6,420,108; 6,484,183; 6,505,125; 6510,391; 6,532,462; 6,546,340; 6,687,692; 6,607,887; 7,062,092 and other U.S. or foreign patents.
Copyright
© 2012 Affymetrix, Inc. All Rights Reserved.

Affymetrix® DMET™ Console 1.3 User Manual 3
Table of Contents
TECHNICAL SUPPORT .................................................................................................................................................... 5
CHAPTER 1: BEFORE YOU BEGIN ....................................................................................................................... 6
ABOUT DMET™ CONSOLE............................................................................................................................................ 6
SYSTEM REQUIREMENTS ............................................................................................................................................... 8
INSTALLING THE DMET™ TEMPLATE WITH AGCC ........................................................................................................... 8
INSTALLING DMET™ CONSOLE ................................................................................................................................... 10
DMET™ UPDATES AND GENERAL INFORMATION ........................................................................................................... 10
CHAPTER 2: GETTING STARTED ....................................................................................................................... 12
STARTING DMET™ CONSOLE ..................................................................................................................................... 12
CREATING & MANAGING USER PROFILES ...................................................................................................................... 13
SETTING THE LIBRARY FOLDER .................................................................................................................................... 15
ACCESSING THE INTERNET USING A PROXY SERVER ....................................................................................................... 17
OBTAINING ANALYSIS FILES ......................................................................................................................................... 18
SELECTING SPECIFIC MARKER ANNOTATION & TRANSLATION FILES ................................................................................. 20
CHAPTER 3: WORKSPACES & DATA ................................................................................................................. 23
MANAGING WORKSPACES ............................................................................................................................................ 23
CREATING A DATA SET & ADDING DATA TO THE DATA SET.............................................................................................. 25
REMOVING DATA......................................................................................................................................................... 30
MANAGING CUSTOM FILE GROUPS IN A DATA SET .......................................................................................................... 32
EDITING SAMPLE ATTRIBUTES ...................................................................................................................................... 34
LOCATING MISSING DATA ............................................................................................................................................ 36
SHARING DATA ........................................................................................................................................................... 38
VIEWING DATA TABLES ................................................................................................................................................ 41
CHAPTER 4: GENOTYPING ANALYSIS .............................................................................................................. 44
GENOTYPING CONFIGURATIONS ................................................................................................................................... 44
GENOTYPING ANALYSIS ............................................................................................................................................... 45
SAMPLE QUALITY CONTROL CHECK .............................................................................................................................. 49
REVIEWING GENOTYPE RESULTS.................................................................................................................................. 51
MANAGING GENOTYPE RESULTS .................................................................................................................................. 62
CONCORDANCE CHECK & REPORT ............................................................................................................................... 66
EXPORTING GENOTYPE RESULTS ................................................................................................................................. 75
CHAPTER 5: TRANSLATION ANALYSIS............................................................................................................. 86
ABOUT TRANSLATION ANALYSIS ................................................................................................................................... 86
PERFORMING TRANSLATIONS ....................................................................................................................................... 86
TRANSLATION REPORTS .............................................................................................................................................. 90
PERFORMING TRANSLATION WITH CALL OVERRIDE ......................................................................................................... 97
CHAPTER 6: MARKER LISTS ............................................................................................................................ 101
VIEWING A MARKER LIST ........................................................................................................................................... 101
Affymetrix® DMET™ Console 1.3 User Manual 4
EXPORTING A MARKER LIST ....................................................................................................................................... 103
CREATE & IMPORT A CUSTOM MARKER LIST ................................................................................................................ 104
CHAPTER 7: TABLES ......................................................................................................................................... 105
LAYOUTS .................................................................................................................................................................. 105
DATA TABLE TOOLBAR .............................................................................................................................................. 107
DATA TABLE SHORTCUT MENU ................................................................................................................................... 108
SELECTING TABLE CELLS........................................................................................................................................... 109
CREATING A CUSTOM DATA TABLE VIEW ..................................................................................................................... 111
CHAPTER 8: LINE GRAPHS ............................................................................................................................... 113
VIEWING A LINE GRAPH ............................................................................................................................................. 113
WORKING WITH LINE GRAPHS .................................................................................................................................... 114
APPENDIX A: ABOUT ALLELE TRANSLATION ................................................................................................. 117
GENE TABLE LAYOUT FOR HAPLOTYPING .................................................................................................................... 117
BIOLOGICAL ANNOTATIONS IN TRANSLATION REPORTS ................................................................................................. 119
IMPACT OF PHASE AMBIGUITY IN HAPLOTYPING ............................................................................................................ 119
DIPLOTYPE TO PHENOTYPE TRANSLATION ................................................................................................................... 120
CREATING A CUSTOM METABOLIZER LIBRARY FILE ....................................................................................................... 121
METABOLIZER LIBRARY FILE FORMAT.......................................................................................................................... 122
REFERENCE DATABASES USED IN TRANSLATION DATA CURATION ................................................................................. 123
APPENDIX B: RESTRICTING CONFIGURATION CHANGES ............................................................................. 124
HOW TO PREVENT ANALYSIS CONFIGURATION CHANGES .............................................................................................. 124
RESTRICTED OPERATIONS ......................................................................................................................................... 124
ADDITIONAL SECURITY PRECAUTIONS ......................................................................................................................... 124
APPENDIX C: ALIAS ALLELE NAMES AND AM_13024 .................................................................................... 126
APPENDIX D: TROUBLESHOOTING ................................................................................................................... 127
SOFTWARE ISSUES.................................................................................................................................................... 127
DATA QUALITY ISSUES ............................................................................................................................................... 128
HOW TO DETECT MPCR FAILURE ............................................................................................................................... 130
APPENDIX E: DESCRIPTION OF GENOTYPING METHODS ............................................................................. 132
DYNAMIC VERSUS FIXED BOUNDARIES ........................................................................................................................ 132
RECOMMENDED PROCEDURE FOR DYNAMIC BOUNDARY GENOTYPING ........................................................................... 134
FREQUENTLY ASKED QUESTIONS ............................................................................................................................... 135
Affymetrix® DMET™ Console 1.3 User Manual 5
Technical Support
Affymetrix provides technical support to all licensed users via phone or E-mail. To contact Affymetrix Technical Support:
AFFYMETRIX, INC.
3420 Central Expressway
Santa Clara, CA 95051 USA
Tel: 1-888-362-2447 (1-888-DNA-CHIP)
Fax: 1-408-731-5441
AFFYMETRIX UK Ltd.,
Voyager, Mercury Park,
Wycombe Lane, Wooburn Green,
High Wycombe HP10 0HH
United Kingdom
UK and Others Tel: +44 (0) 1628 552550
France Tel: 0800919505
Germany Tel: 01803001334
Fax: +44 (0) 1628 552585
AFFYMETRIX JAPAN K.K.
ORIX Hamamatsucho Bldg, 7F
1-24-8 Hamamatsucho, Minato-ku
Tokyo 105-0013 Japan
Tel. +81-3-6430-4020
Fax. +81-3-6430-4021
P/N 702748-5
Chapter 1: Before You Begin
About DMET™ Console
System Requirements
Installing the DMET™ Template with AGCC
Creating a Template for DMET Sample Attributes
Installing DMET™
Console
Uninstalling DMET Console
DMET™ Updates and General Information
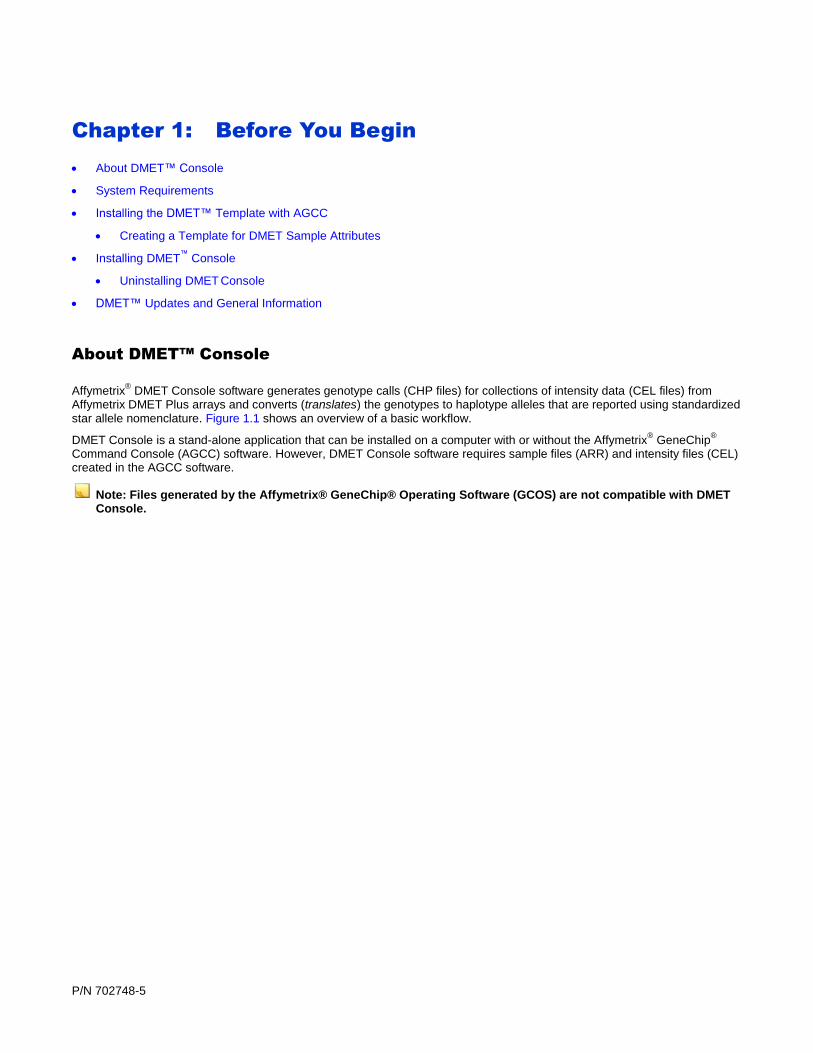
About DMET™ Console
Affymetrix® DMET Console software generates genotype calls (CHP files) for collections of intensity data (CEL files) from
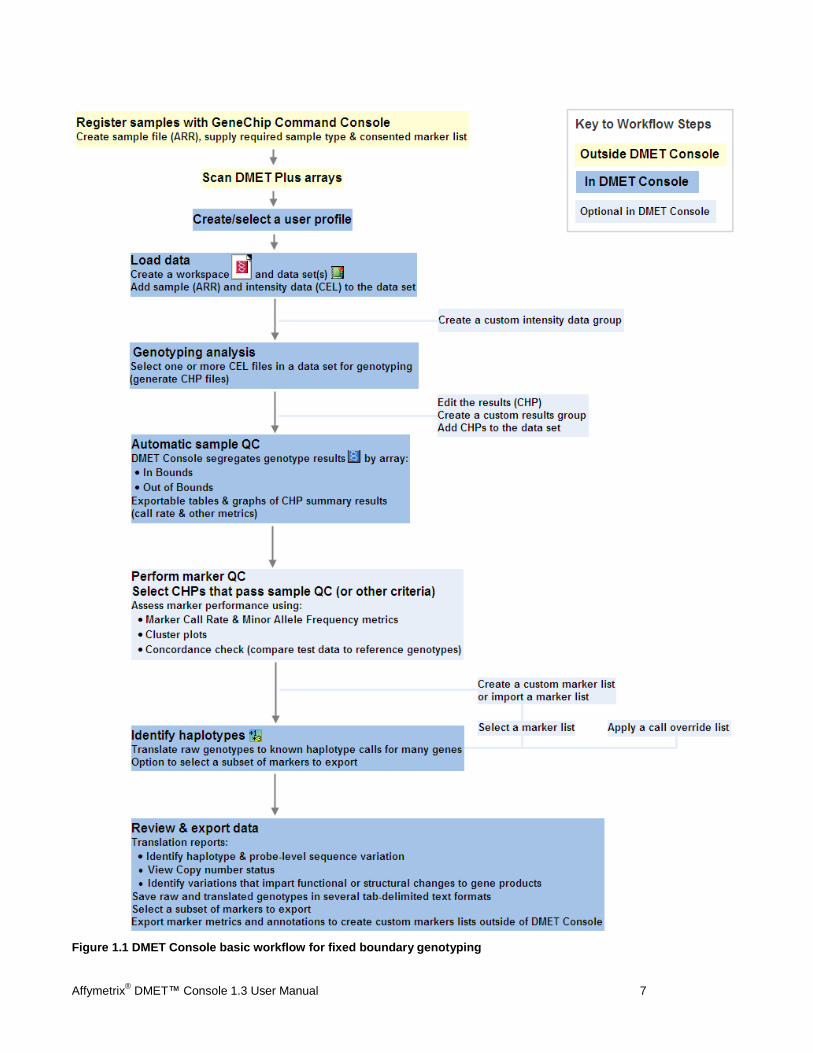
Affymetrix DMET Plus arrays and converts (translates) the genotypes to haplotype alleles that are reported using standardized star allele nomenclature. Figure 1.1 shows an overview of a basic workflow.
DMET Console is a stand-alone application that can be installed on a computer with or without the Affymetrix® GeneChip
®
Command Console (AGCC) software. However, DMET Console software requires sample files (ARR) and intensity files (CEL) created in the AGCC software.
Note: Files generated by the Affymetrix® GeneChip® Operating Software (GCOS) are not compatible with DMET
Console.
Affymetrix® DMET™ Console 1.3 User Manual 7
Figure 1.1 DMET Console basic workflow for fixed boundary genotyping

Affymetrix® DMET™ Console 1.3 User Manual 8
System Requirements
Table 1.1 shows the operating systems that DMET™ Console has been verified on and the recommended minimum requirements.
Table 1.1 Verified operating systems & minimum recommended requirements for DMET Console
Operating System Speed Memory (RAM)
Available Disk Space
Microsoft Windows 7 Professional
32bit (Service Pack 1), 64bit (Service Pack 1)
2 GHz Pentium Processor
2 GB 100 GB
Microsoft Windows XP 32bit (Service Pack 3), 64bit (Service Pack 2)
2 GHz Pentium Processor
2 GB 100 GB
Installing the DMET™ Template with AGCC
IMPORTANT! Affymetrix strongly recommends batch registering your arrays with Affymetrix® GeneChip
® Command
Console (AGCC) before washing and scanning your arrays. If you accidentally wash and scan your arrays without first batch registering them, the sample files (ARR) will not include two user attributes required by DMET Console. The CEL files cannot be genotyped until the sample files are edited to include the required information.
Creating a Template for DMET Sample Attributes
Option 1: Obtain the file DMET.TEMPLATE. Copy this file to the Templates folder used by Affymetrix GeneChip Command Console (AGCC), which is usually located at C:\Command_Console\Templates.
Option 2: Manually create or edit a template
1. On a computer with AGCC, open the Launcher, and select AGCC Portal. This will open the application in your web
browser.
2. From the Administration section, select Templates New.
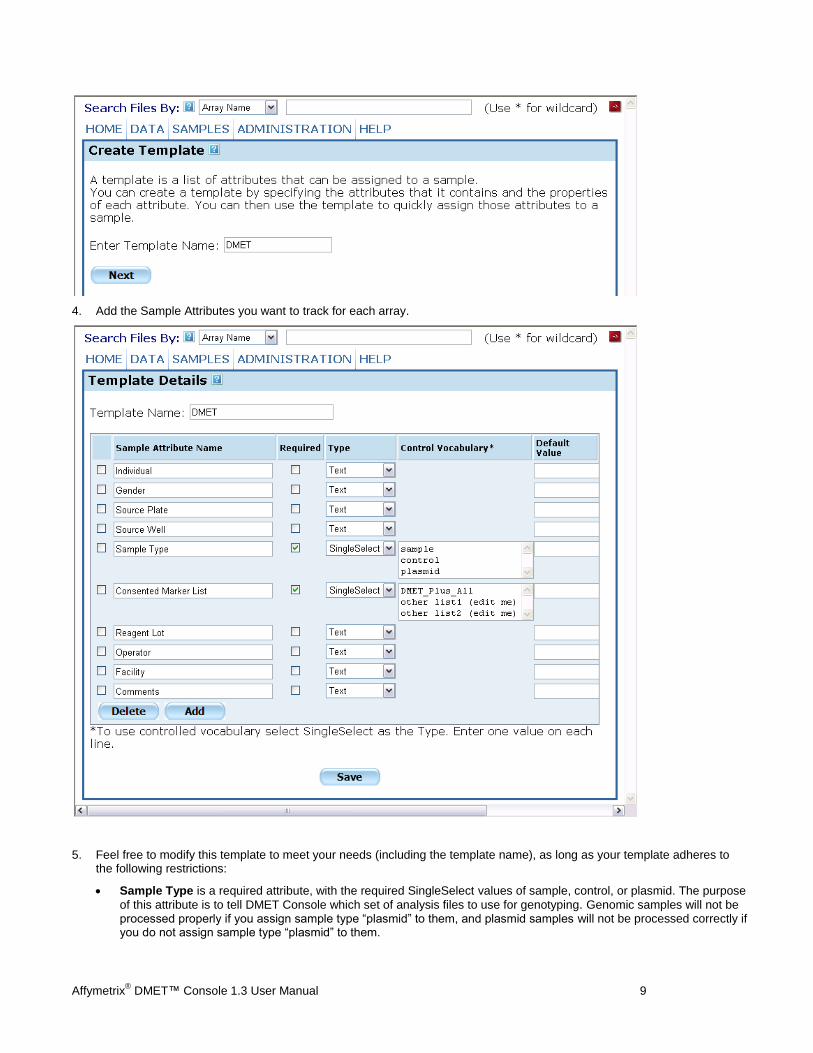
3. Enter a name for your template, for example “DMET”. Click Next.
Affymetrix® DMET™ Console 1.3 User Manual 9
4. Add the Sample Attributes you want to track for each array.
5. Feel free to modify this template to meet your needs (including the template name), as long as your template adheres to the following restrictions:
Sample Type is a required attribute, with the required SingleSelect values of sample, control, or plasmid. The purpose
of this attribute is to tell DMET Console which set of analysis files to use for genotyping. Genomic samples will not be processed properly if you assign sample type “plasmid” to them, and plasmid samples will not be processed correctly if you do not assign sample type “plasmid” to them.
Affymetrix® DMET™ Console 1.3 User Manual 10
Consented Marker List is a required attribute. The selected name must exactly match a Marker List that appears in a
DMET Console workspace; otherwise the data will not be genotyped. DMET Console uses this attribute to determine which subset of markers to genotype. Markers not in this list will be masked as NotAvailable in the CHP files.
Because DMET Console also supports filtering out markers after CHP files are created, we recommend that you select DMET_Plus_All. This allows all markers to be genotyped. Select a more restricted marker list only if you are certain that you will never want to access results from the markers that are excluded.
Note: You should remove marker lists you do not expect to use so that you do not accidentally select them.
6. You may add a custom Consented Marker List of your own, as long as you import a Marker List with this exact name into each of your DMET Console workspaces. See Marker Lists for more information. You may also want to create a marker list containing only verified or validated markers. Documentation describing the marker validation procedure, and the lists of validated or verified markers, are available.
7. Save the template.
Installing DMET™ Console
1. Obtain a copy of DMET Console software.
2. Unzip the downloaded software package. This includes the installation program and release notes.
3. Double-click DmetSetup.exe.
4. Follow the directions provided by the installer.
Note: The setup process installs the required Microsoft components, which includes the .NET 4.0 framework.
Uninstalling DMET Console
1. On the Windows Start menu, select Start Settings Control Panel.
2. In the Control Panel, double-click Add or Remove Programs .
3. Select DMET Console in the programs list and click Remove.
DMET™ Updates and General Information
The Update button on the main tool bar in DMET Console enables you to check for new information about Affymetrix software,
including DMET, uploaded to Affymetrix.com. If your computer is online, click the Update button to start a web browser that shows the software information available at Affymetrix.com.
Affymetrix® DMET™ Console 1.3 User Manual 11
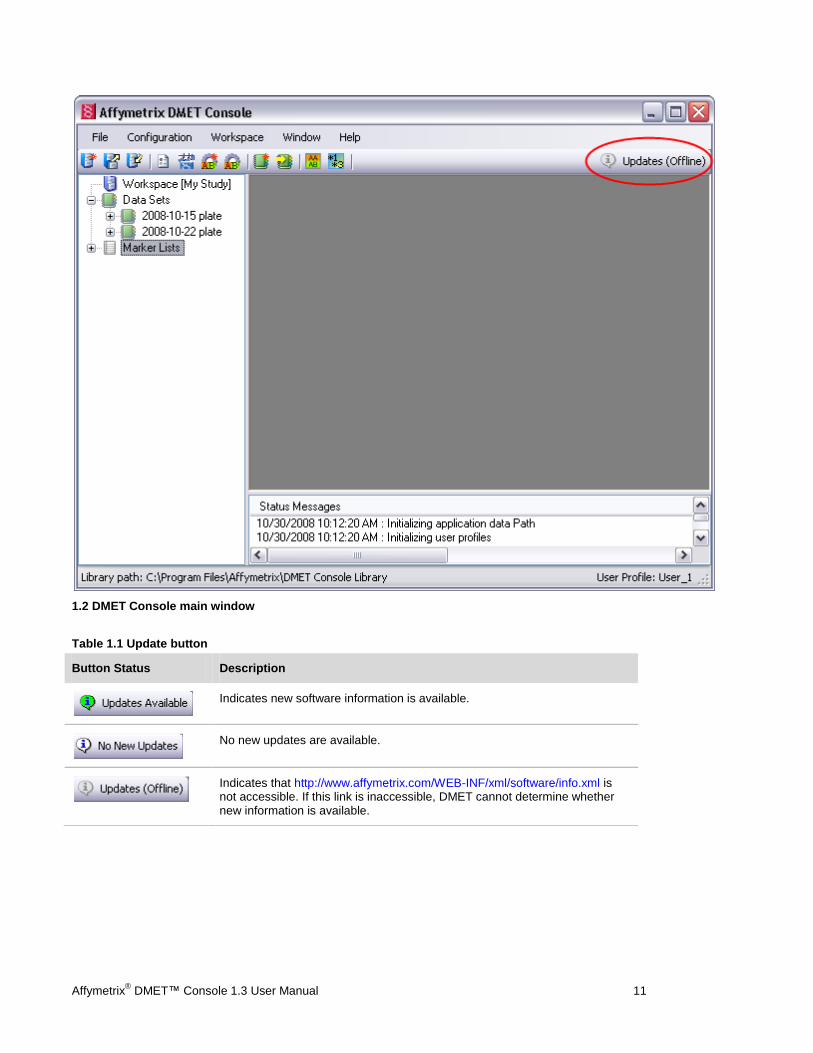
1.2 DMET Console main window
Table 1.1 Update button
Button Status Description
Indicates new software information is available.
No new updates are available.
Indicates that http://www.affymetrix.com/WEB-INF/xml/software/info.xml is not accessible. If this link is inaccessible, DMET cannot determine whether new information is available.
Affymetrix® DMET™ Console 1.3 User Manual 12
Chapter 2: Getting Started
This chapter explains how to start the DMET™ Console software and the initial setup steps that are required to begin using the software.
Starting DMET™ Console
Creating & Managing User Profiles
Setting the Library Folder
Accessing the Internet using a Proxy Server
Obtaining Analysis Files
Selecting Specific Marker Annotation & Translation File
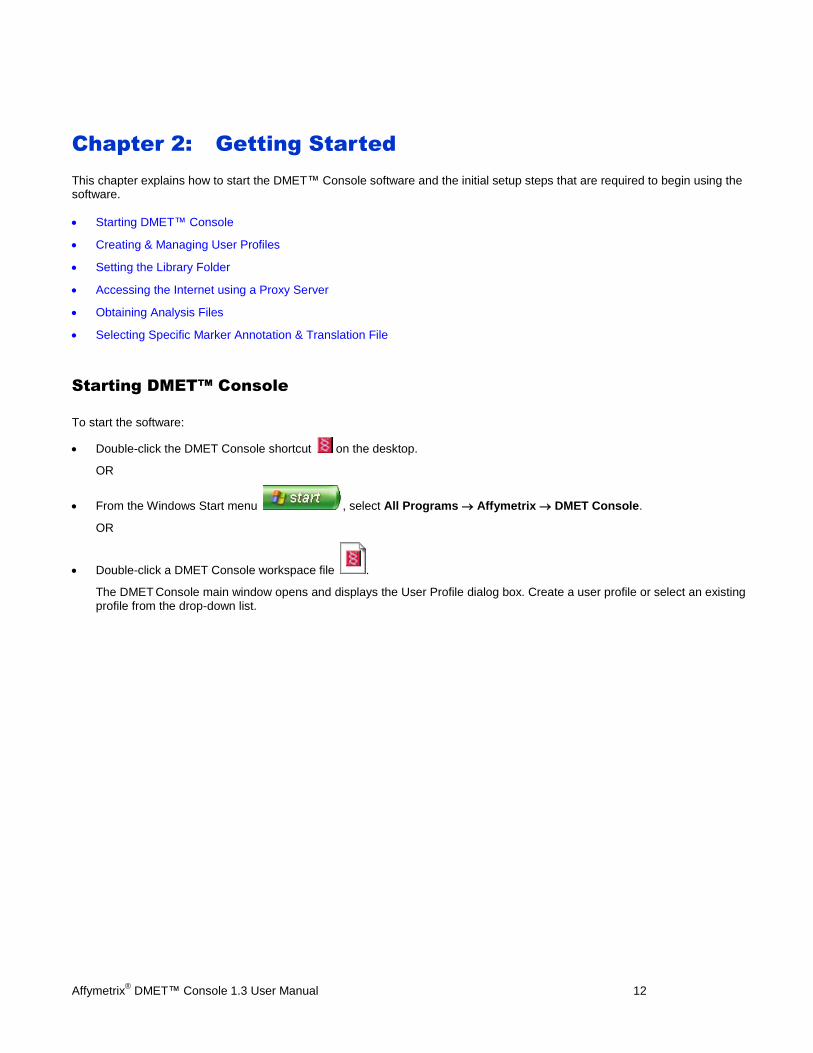
Starting DMET™ Console
To start the software:
Double-click the DMET Console shortcut on the desktop.
OR
From the Windows Start menu , select All Programs Affymetrix DMET Console.
OR
Double-click a DMET Console workspace file .
The DMET Console main window opens and displays the User Profile dialog box. Create a user profile or select an existing profile from the drop-down list.
Affymetrix® DMET™ Console 1.3 User Manual 13
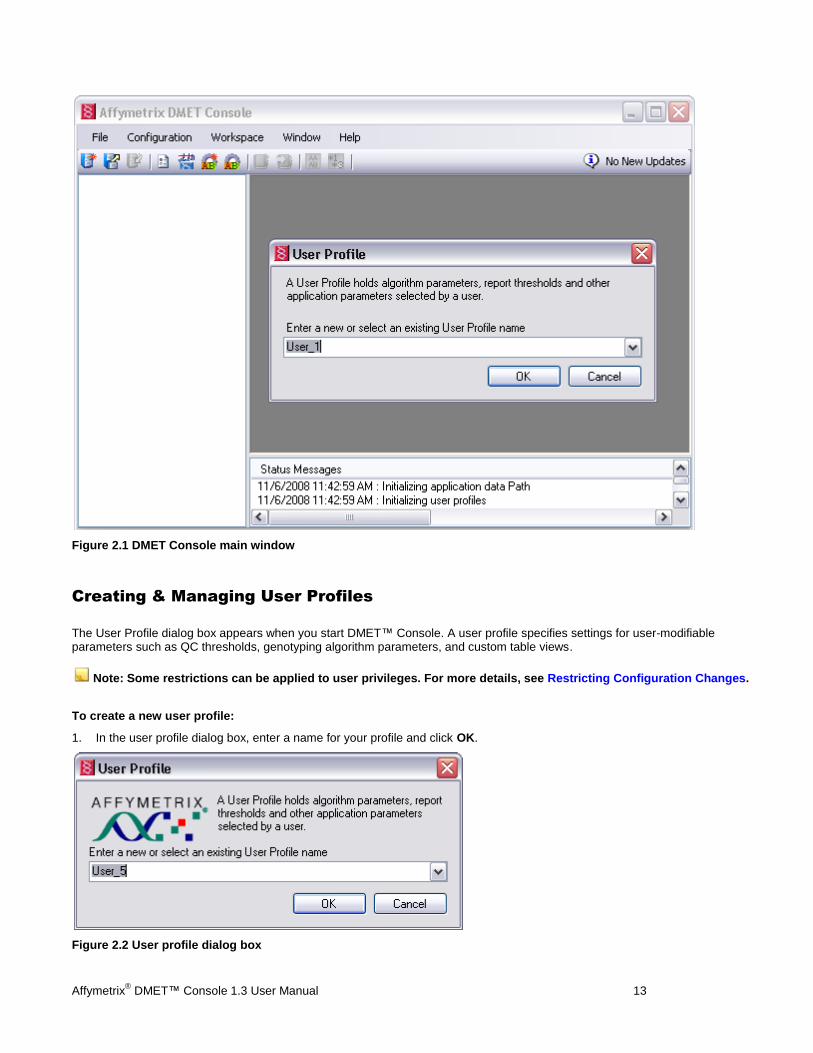
Figure 2.1 DMET Console main window
Creating & Managing User Profiles
The User Profile dialog box appears when you start DMET™ Console. A user profile specifies settings for user-modifiable parameters such as QC thresholds, genotyping algorithm parameters, and custom table views.
Note: Some restrictions can be applied to user privileges. For more details, see Restricting Configuration Changes.
To create a new user profile:
1. In the user profile dialog box, enter a name for your profile and click OK.
Figure 2.2 User profile dialog box
Affymetrix® DMET™ Console 1.3 User Manual 14
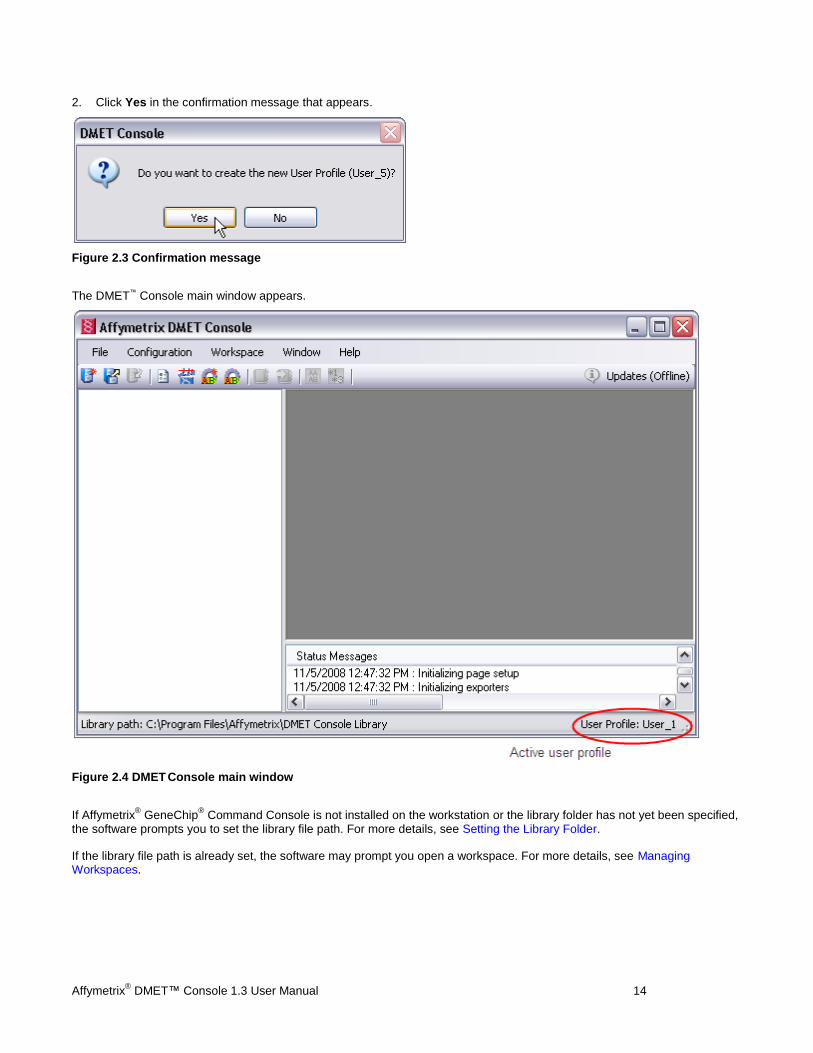
2. Click Yes in the confirmation message that appears.
Figure 2.3 Confirmation message
The DMET™ Console main window appears.
Figure 2.4 DMET Console main window
If Affymetrix® GeneChip
® Command Console is not installed on the workstation or the library folder has not yet been specified,
the software prompts you to set the library file path. For more details, see Setting the Library Folder.
If the library file path is already set, the software may prompt you open a workspace. For more details, see Managing Workspaces.

Affymetrix® DMET™ Console 1.3 User Manual 15
To change the user profile:
Note: You can select a different user profile or create a new profile without closing the application. However, the user profile cannot be changed if a workspace is open. To close the workspace, click the Close Workspace toolbar
button . Alternately, select File Close Workspace on the menu bar.
1. Select Configuration Change User Profile on the menu bar.
2. In the dialog box that appears, click the arrow and select a user profile from the drop-down list. Alternately, enter a new profile name and click OK.
Figure 2.5 User profile dialog box
To delete a user profile(s):
1. Select Configuration Delete User Profiles on the menu bar.
2. In the dialog box that appears, select the user profile(s) that you want to delete and click OK.
Figure 2.6 User profiles in the system
Setting the Library Folder
DMET™ Console requires information stored in analysis files to analyze the CEL files generated by the Affymetrix GeneChip®
Command Console™ (AGCC) software. Analysis files can be downloaded within DMET Console. DMET Console downloads only the files that are required for analysis. However, these files are not registered with GeneChip
® Command Console and are
not sufficient to scan arrays.
Note: If DMET Console software is installed on a workstation that has GeneChip® Command Console, the library
path is automatically set to the library path used by Command Console. You may still change the folder used for the DMET Console library files.
Note: When you delete a user profile from the system, the associated parameter files are also removed from the system.
Affymetrix® DMET™ Console 1.3 User Manual 16
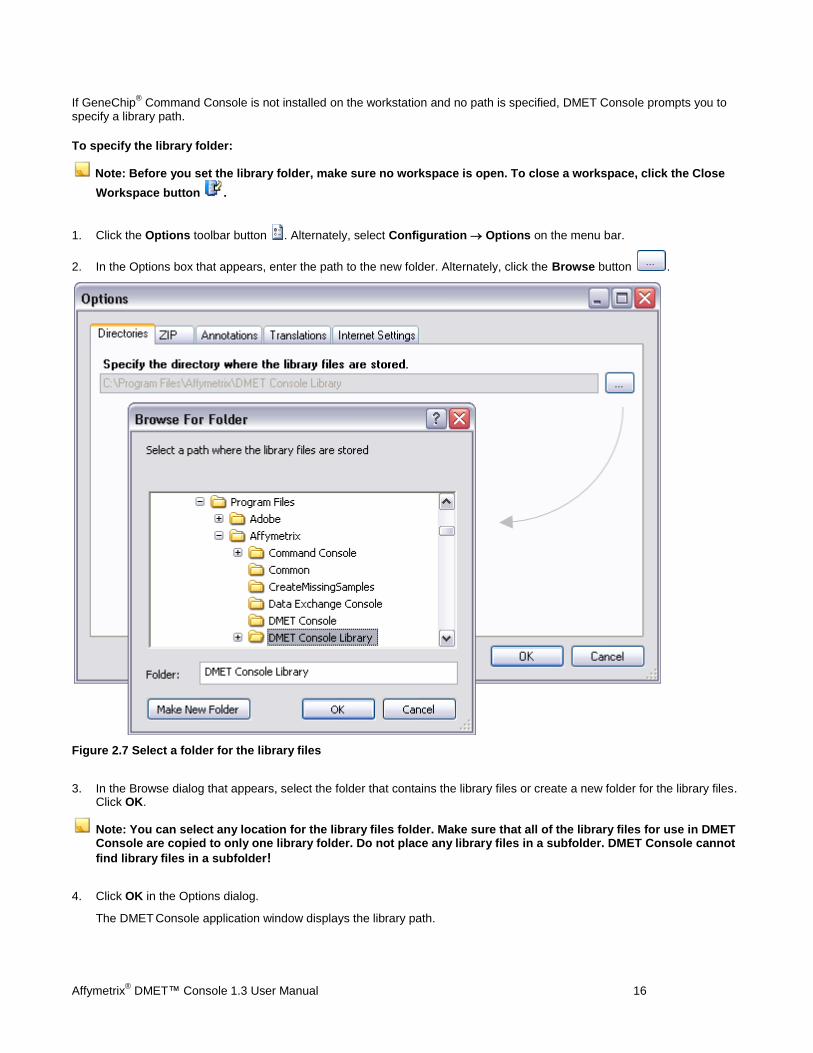
If GeneChip® Command Console is not installed on the workstation and no path is specified, DMET Console prompts you to
specify a library path.
To specify the library folder:
Note: Before you set the library folder, make sure no workspace is open. To close a workspace, click the Close
Workspace button .
1. Click the Options toolbar button . Alternately, select Configuration Options on the menu bar.
2. In the Options box that appears, enter the path to the new folder. Alternately, click the Browse button .
Figure 2.7 Select a folder for the library files
3. In the Browse dialog that appears, select the folder that contains the library files or create a new folder for the library files. Click OK.
Note: You can select any location for the library files folder. Make sure that all of the library files for use in DMET Console are copied to only one library folder. Do not place any library files in a subfolder. DMET Console cannot
find library files in a subfolder!
4. Click OK in the Options dialog.
The DMET Console application window displays the library path.
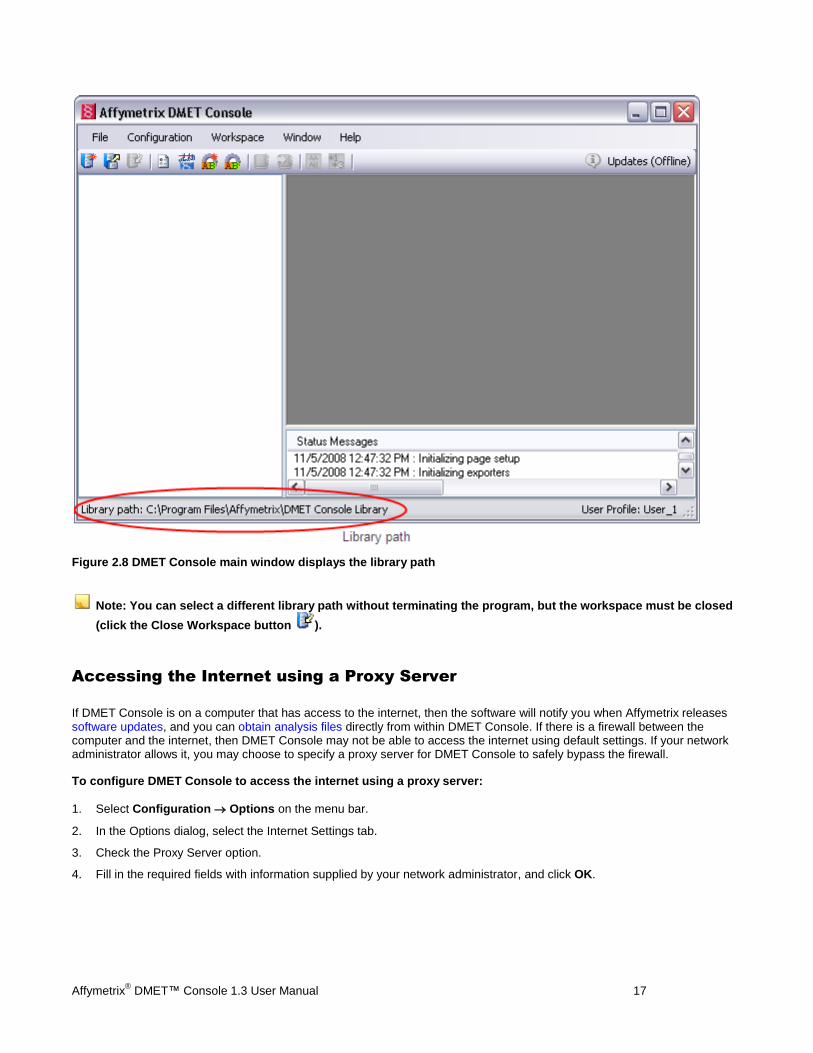
Affymetrix® DMET™ Console 1.3 User Manual 17
Figure 2.8 DMET Console main window displays the library path
Note: You can select a different library path without terminating the program, but the workspace must be closed
(click the Close Workspace button ).
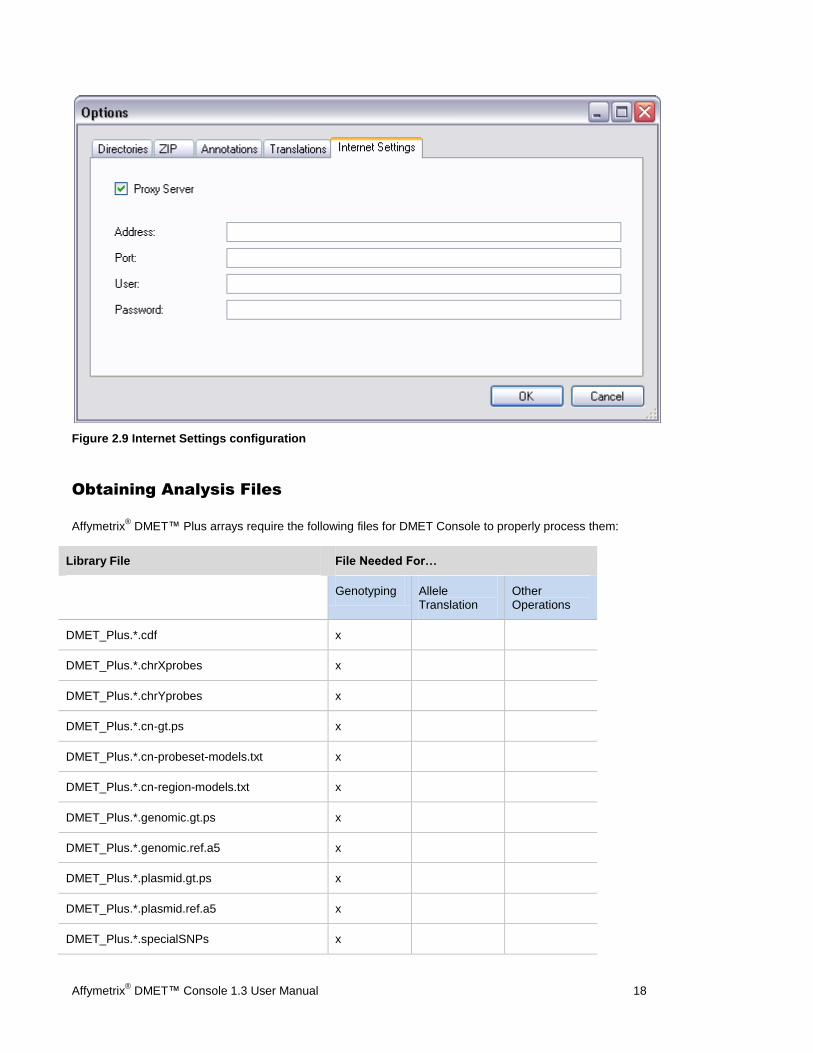
Accessing the Internet using a Proxy Server
If DMET Console is on a computer that has access to the internet, then the software will notify you when Affymetrix releases software updates, and you can obtain analysis files directly from within DMET Console. If there is a firewall between the computer and the internet, then DMET Console may not be able to access the internet using default settings. If your network administrator allows it, you may choose to specify a proxy server for DMET Console to safely bypass the firewall.
To configure DMET Console to access the internet using a proxy server:
1. Select Configuration Options on the menu bar.
2. In the Options dialog, select the Internet Settings tab.
3. Check the Proxy Server option.
4. Fill in the required fields with information supplied by your network administrator, and click OK.
Affymetrix® DMET™ Console 1.3 User Manual 18
Figure 2.9 Internet Settings configuration
Obtaining Analysis Files
Affymetrix® DMET™ Plus arrays require the following files for DMET Console to properly process them:
Library File File Needed For…
Genotyping Allele Translation
Other Operations
DMET_Plus.*.cdf x
DMET_Plus.*.chrXprobes x
DMET_Plus.*.chrYprobes x
DMET_Plus.*.cn-gt.ps x
DMET_Plus.*.cn-probeset-models.txt x
DMET_Plus.*.cn-region-models.txt x
DMET_Plus.*.genomic.gt.ps x
DMET_Plus.*.genomic.ref.a5 x
DMET_Plus.*.plasmid.gt.ps x
DMET_Plus.*.plasmid.ref.a5 x
DMET_Plus.*.specialSNPs x
Affymetrix® DMET™ Console 1.3 User Manual 19
Library File File Needed For…
Genotyping Allele Translation
Other Operations
DMET_Plus.dc_analysis_configuration † x
DMET_Plus.dc_array_set † x
DMET_Plus.dc_qc_thresholds † x
DMET_Plus.**.dc_annot.csv x x
DMET_Plus.**.translation x
DMET_Plus.**.metabolizer x
* denotes text that can vary with different versions of the files
† denotes files that are installed by DMET Console
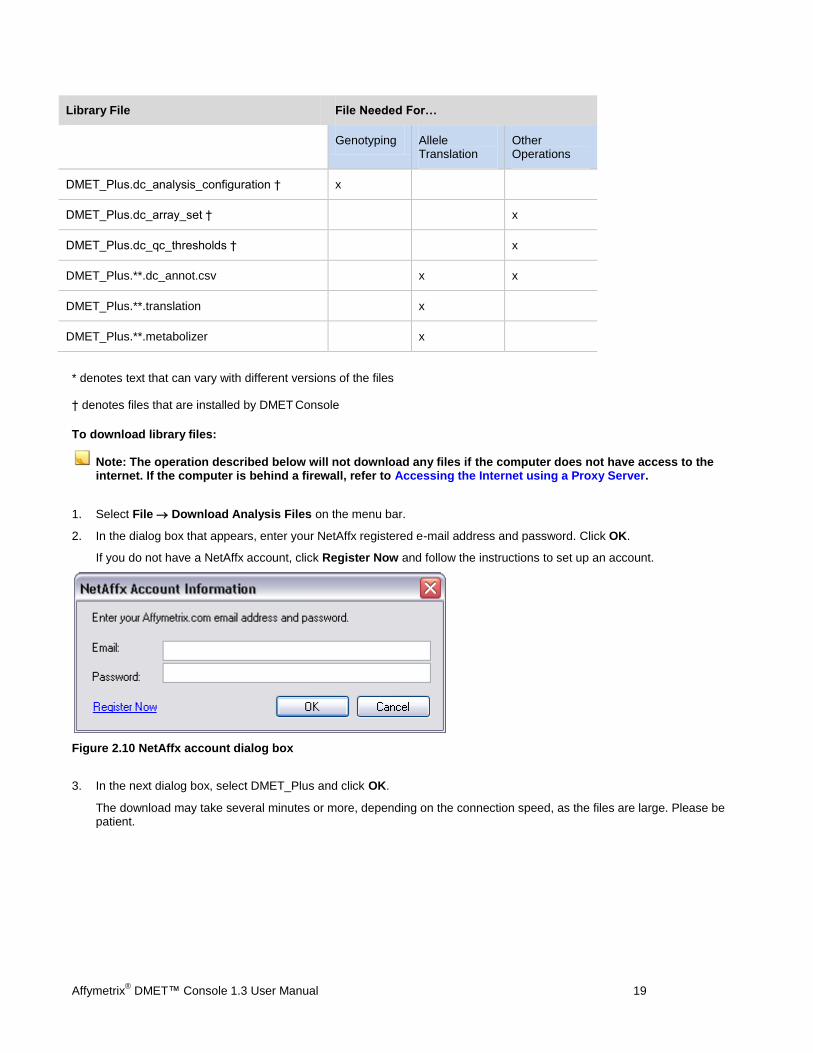
To download library files:
Note: The operation described below will not download any files if the computer does not have access to the internet. If the computer is behind a firewall, refer to Accessing the Internet using a Proxy Server.
1. Select File Download Analysis Files on the menu bar.
2. In the dialog box that appears, enter your NetAffx registered e-mail address and password. Click OK.
If you do not have a NetAffx account, click Register Now and follow the instructions to set up an account.
Figure 2.10 NetAffx account dialog box
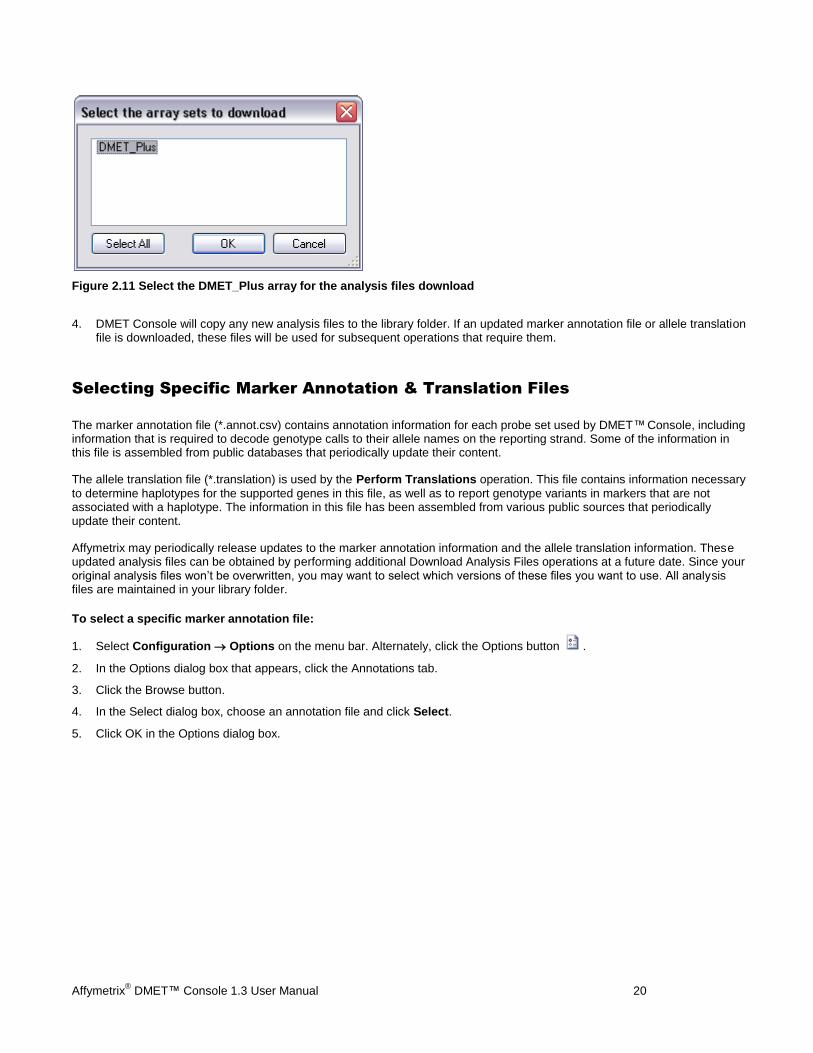
3. In the next dialog box, select DMET_Plus and click OK.
The download may take several minutes or more, depending on the connection speed, as the files are large. Please be patient.
Affymetrix® DMET™ Console 1.3 User Manual 20
Figure 2.11 Select the DMET_Plus array for the analysis files download
4. DMET Console will copy any new analysis files to the library folder. If an updated marker annotation file or allele translation file is downloaded, these files will be used for subsequent operations that require them.
Selecting Specific Marker Annotation & Translation Files
The marker annotation file (*.annot.csv) contains annotation information for each probe set used by DMET™ Console, including information that is required to decode genotype calls to their allele names on the reporting strand. Some of the information in this file is assembled from public databases that periodically update their content.
The allele translation file (*.translation) is used by the Perform Translations operation. This file contains information necessary
to determine haplotypes for the supported genes in this file, as well as to report genotype variants in markers that are not associated with a haplotype. The information in this file has been assembled from various public sources that periodically update their content.
Affymetrix may periodically release updates to the marker annotation information and the allele translation information. These updated analysis files can be obtained by performing additional Download Analysis Files operations at a future date. Since your original analysis files won’t be overwritten, you may want to select which versions of these files you want to use. All analysis files are maintained in your library folder.
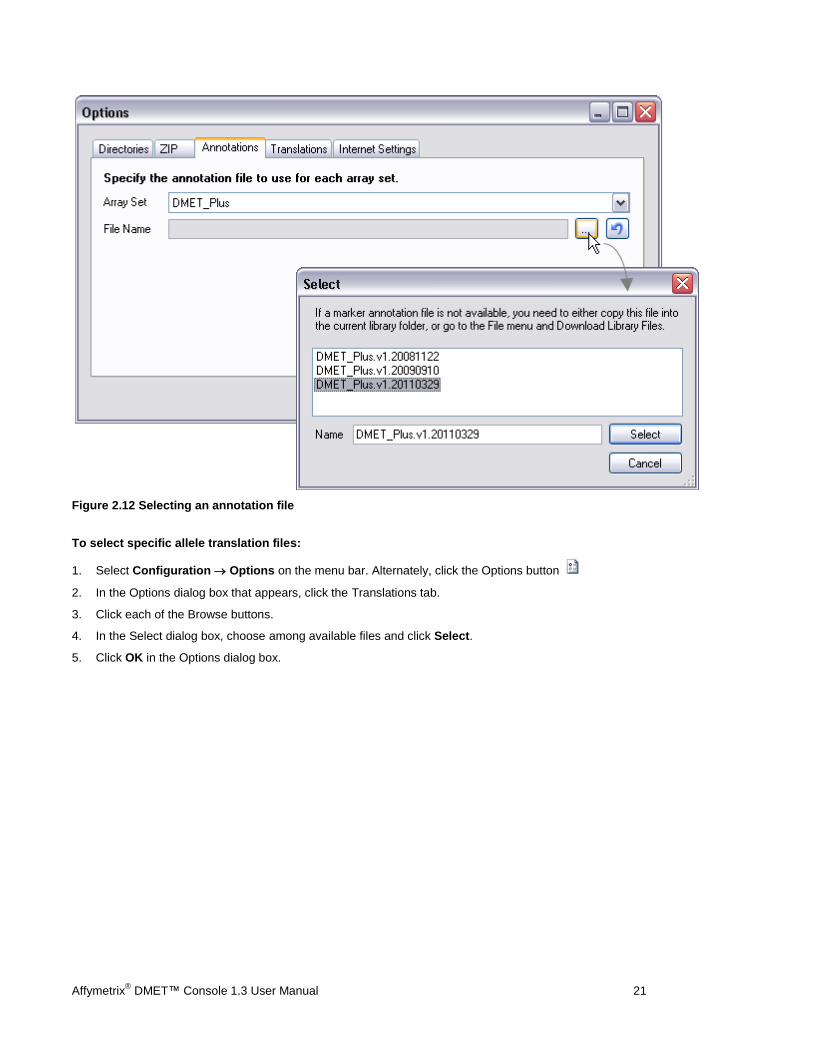
To select a specific marker annotation file:
1. Select Configuration Options on the menu bar. Alternately, click the Options button .
2. In the Options dialog box that appears, click the Annotations tab.
3. Click the Browse button.
4. In the Select dialog box, choose an annotation file and click Select.
5. Click OK in the Options dialog box.
Affymetrix® DMET™ Console 1.3 User Manual 21
Figure 2.12 Selecting an annotation file
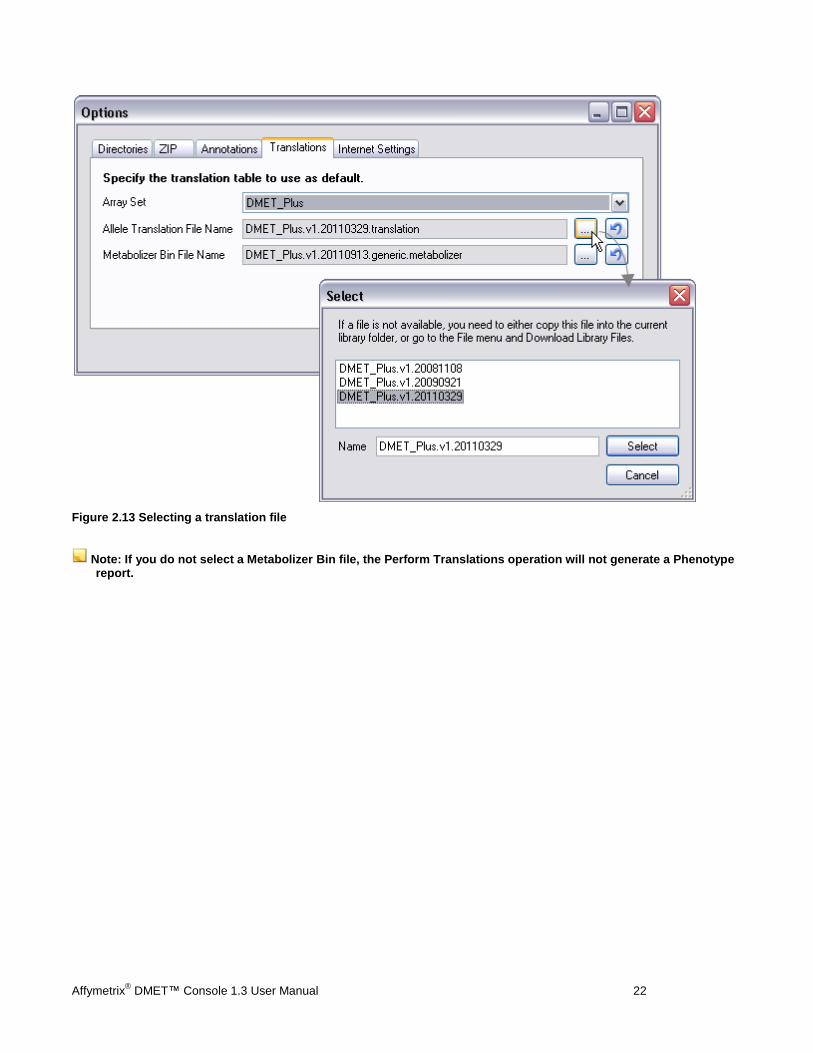
To select specific allele translation files:
1. Select Configuration Options on the menu bar. Alternately, click the Options button
2. In the Options dialog box that appears, click the Translations tab.
3. Click each of the Browse buttons.
4. In the Select dialog box, choose among available files and click Select.
5. Click OK in the Options dialog box.
Affymetrix® DMET™ Console 1.3 User Manual 22
Figure 2.13 Selecting a translation file
Note: If you do not select a Metabolizer Bin file, the Perform Translations operation will not generate a Phenotype report.
Affymetrix® DMET™ Console 1.3 User Manual 23
Chapter 3: Workspaces & Data
Managing Workspaces
Creating a Data Set & Adding Data to the Data Set
Adding More Data Sets to a Workspace
Adding More Data to a Data Set
Removing Data
Managing Custom File Groups in a Data Set
Editing Sample Attributes
Locating Missing Data
Sharing Data
Viewing Data Tables
Managing Workspaces
To start analyzing data in DMET™ Console, first create a workspace and add one or more data sets to the workspace. A data set points to a collection of sample files (ARR), intensity files (CEL), and genotyping files (CHP). A workspace can be opened by only one user at a time. If multiple users want to access the same data files, you can distribute a copy of the workspace file (that points to the same files), or use the Zip Workspace operation to create a zip package containing the workspace file and the referenced data files. For more details see Sharing Data.
Note: The workspace stores the locations of the data files, not a copy of the data files themselves. You may encounter errors if two users try to simultaneously access the same ARR, CEL, or CHP files.
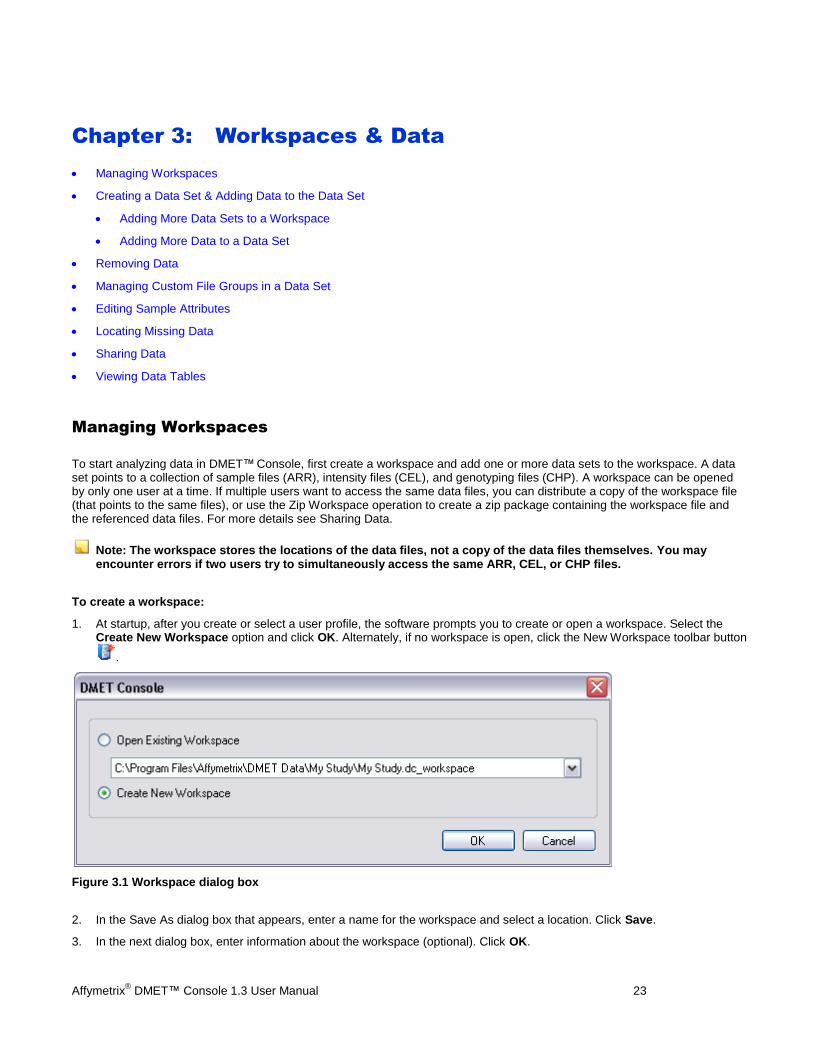
To create a workspace:
1. At startup, after you create or select a user profile, the software prompts you to create or open a workspace. Select the Create New Workspace option and click OK. Alternately, if no workspace is open, click the New Workspace toolbar button
.
Figure 3.1 Workspace dialog box
2. In the Save As dialog box that appears, enter a name for the workspace and select a location. Click Save.
3. In the next dialog box, enter information about the workspace (optional). Click OK.
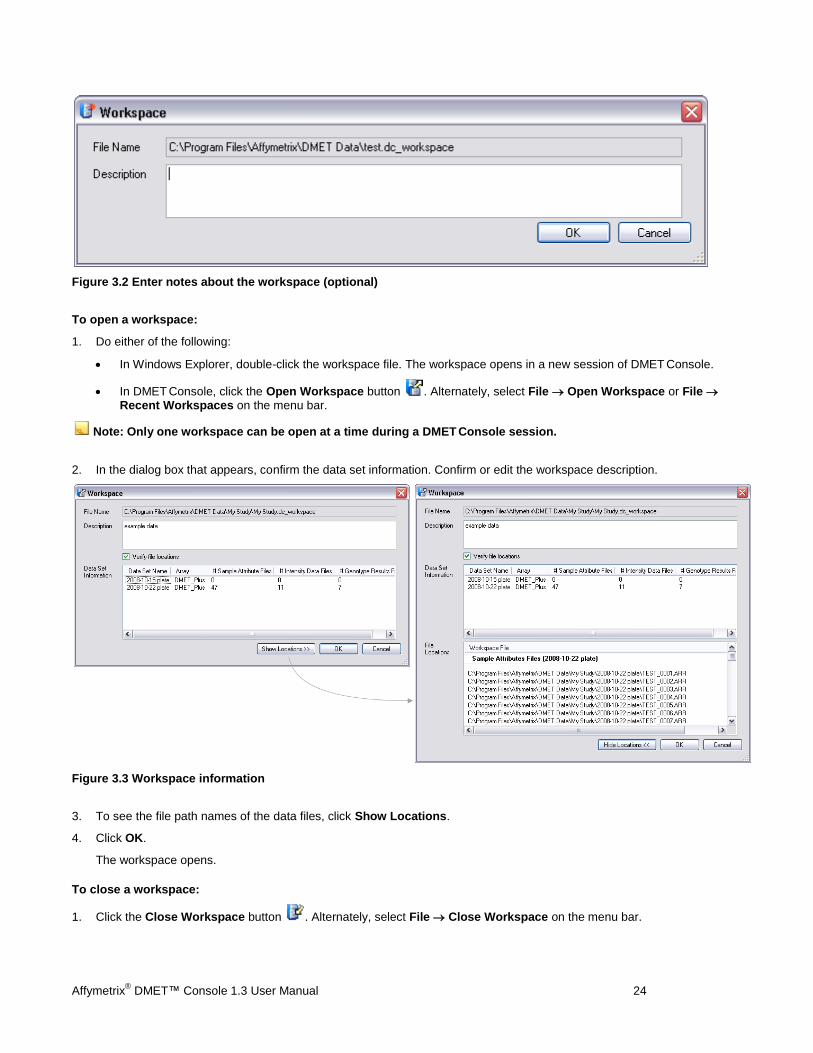
Affymetrix® DMET™ Console 1.3 User Manual 24
Figure 3.2 Enter notes about the workspace (optional)
To open a workspace:
1. Do either of the following:
In Windows Explorer, double-click the workspace file. The workspace opens in a new session of DMET Console.
In DMET Console, click the Open Workspace button . Alternately, select File Open Workspace or File Recent Workspaces on the menu bar.
Note: Only one workspace can be open at a time during a DMET Console session.
2. In the dialog box that appears, confirm the data set information. Confirm or edit the workspace description.
Figure 3.3 Workspace information
3. To see the file path names of the data files, click Show Locations.
4. Click OK.
The workspace opens.
To close a workspace:
1. Click the Close Workspace button . Alternately, select File Close Workspace on the menu bar.
Affymetrix® DMET™ Console 1.3 User Manual 25
To delete a workspace:
1. In Windows Explorer, find the workspace that you want to delete.
2. Right-click the workspace and select Delete on the shortcut menu.
Note: The data files and reports referenced by this workspace are not deleted.
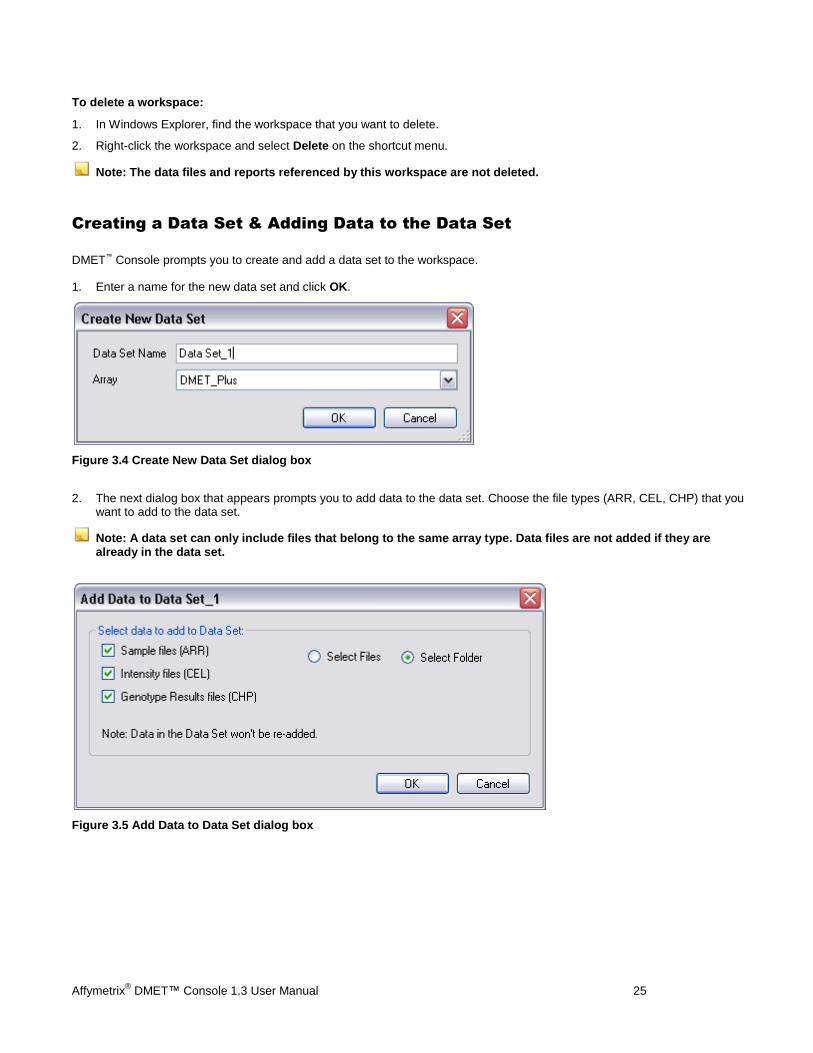
Creating a Data Set & Adding Data to the Data Set
DMET™ Console prompts you to create and add a data set to the workspace.
1. Enter a name for the new data set and click OK.
Figure 3.4 Create New Data Set dialog box
2. The next dialog box that appears prompts you to add data to the data set. Choose the file types (ARR, CEL, CHP) that you want to add to the data set.
Note: A data set can only include files that belong to the same array type. Data files are not added if they are already in the data set.
Figure 3.5 Add Data to Data Set dialog box
Affymetrix® DMET™ Console 1.3 User Manual 26
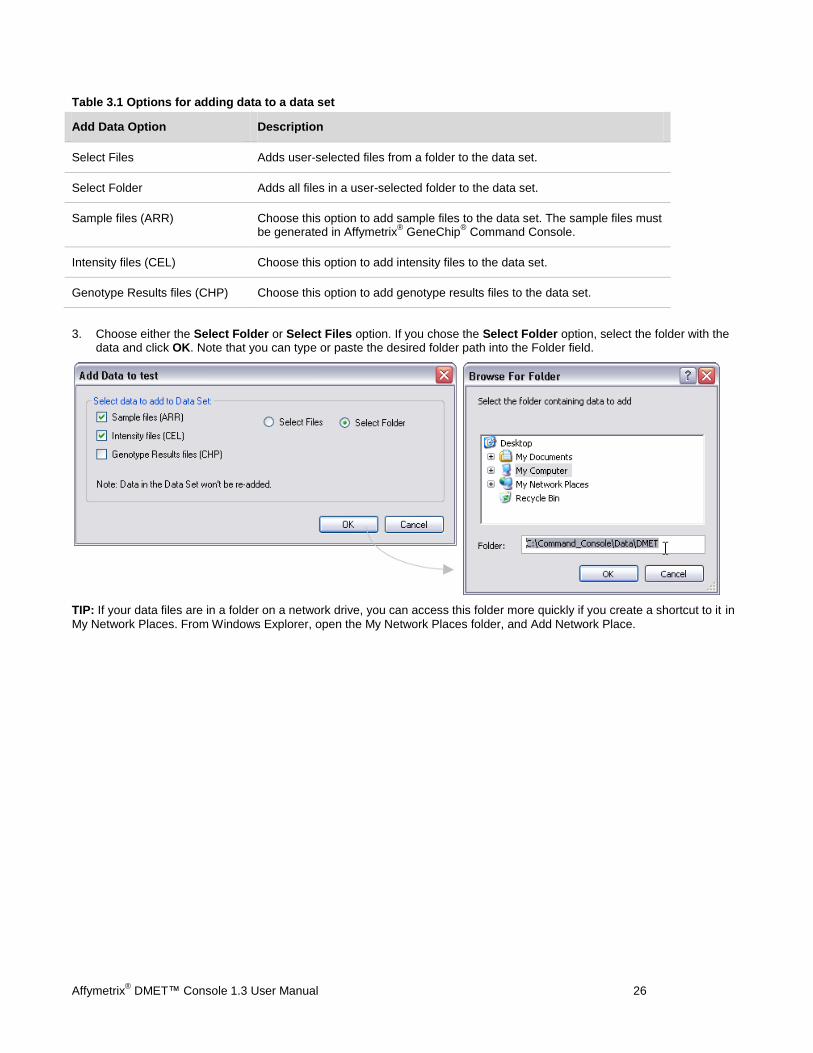
Table 3.1 Options for adding data to a data set
Add Data Option Description
Select Files Adds user-selected files from a folder to the data set.
Select Folder Adds all files in a user-selected folder to the data set.
Sample files (ARR) Choose this option to add sample files to the data set. The sample files must be generated in Affymetrix
® GeneChip
® Command Console.
Intensity files (CEL) Choose this option to add intensity files to the data set.
Genotype Results files (CHP) Choose this option to add genotype results files to the data set.
3. Choose either the Select Folder or Select Files option. If you chose the Select Folder option, select the folder with the data and click OK. Note that you can type or paste the desired folder path into the Folder field.
TIP: If your data files are in a folder on a network drive, you can access this folder more quickly if you create a shortcut to it in
My Network Places. From Windows Explorer, open the My Network Places folder, and Add Network Place.
Affymetrix® DMET™ Console 1.3 User Manual 27
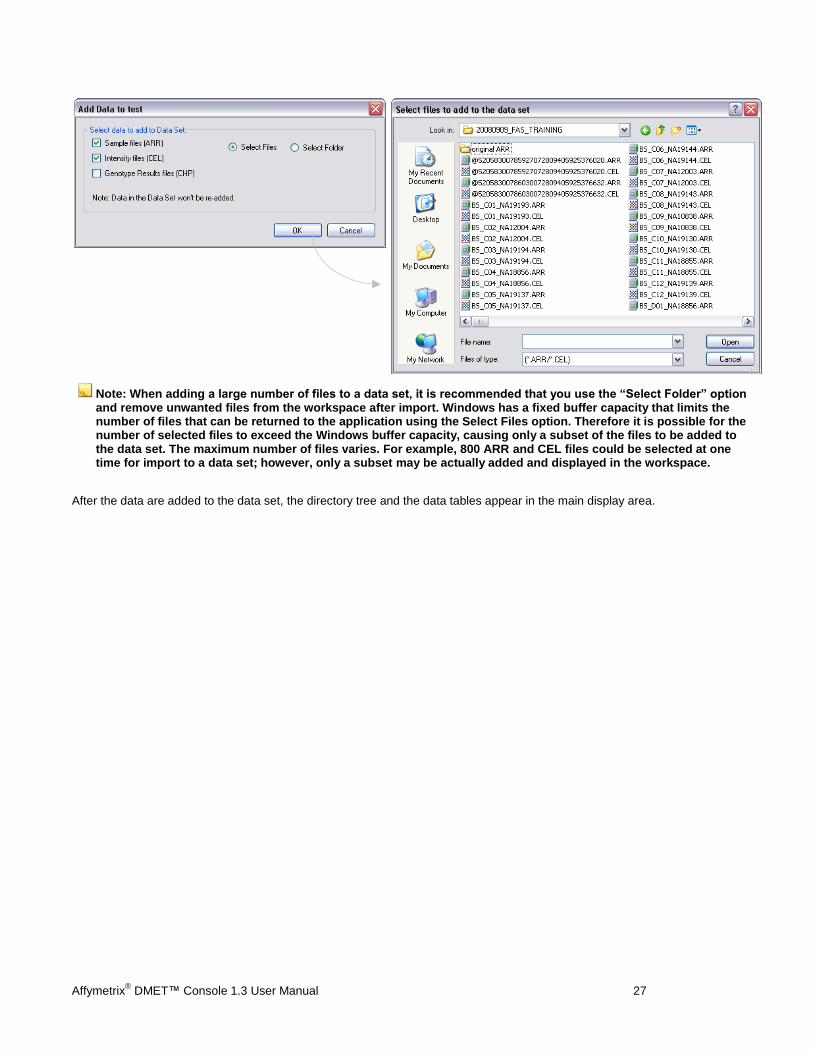
Note: When adding a large number of files to a data set, it is recommended that you use the “Select Folder” option and remove unwanted files from the workspace after import. Windows has a fixed buffer capacity that limits the number of files that can be returned to the application using the Select Files option. Therefore it is possible for the number of selected files to exceed the Windows buffer capacity, causing only a subset of the files to be added to the data set. The maximum number of files varies. For example, 800 ARR and CEL files could be selected at one time for import to a data set; however, only a subset may be actually added and displayed in the workspace.
After the data are added to the data set, the directory tree and the data tables appear in the main display area.
Affymetrix® DMET™ Console 1.3 User Manual 28
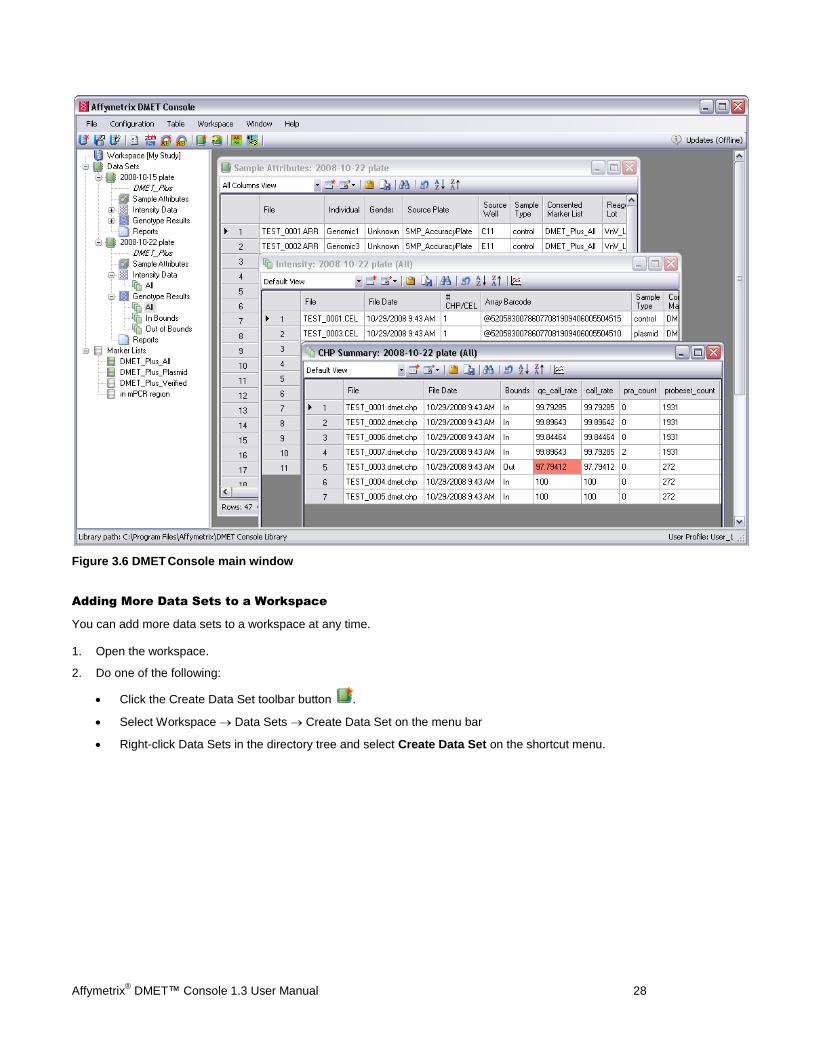
Figure 3.6 DMET Console main window
Adding More Data Sets to a Workspace
You can add more data sets to a workspace at any time.
1. Open the workspace.
2. Do one of the following:
Click the Create Data Set toolbar button .
Select Workspace Data Sets Create Data Set on the menu bar
Right-click Data Sets in the directory tree and select Create Data Set on the shortcut menu.
Affymetrix® DMET™ Console 1.3 User Manual 29
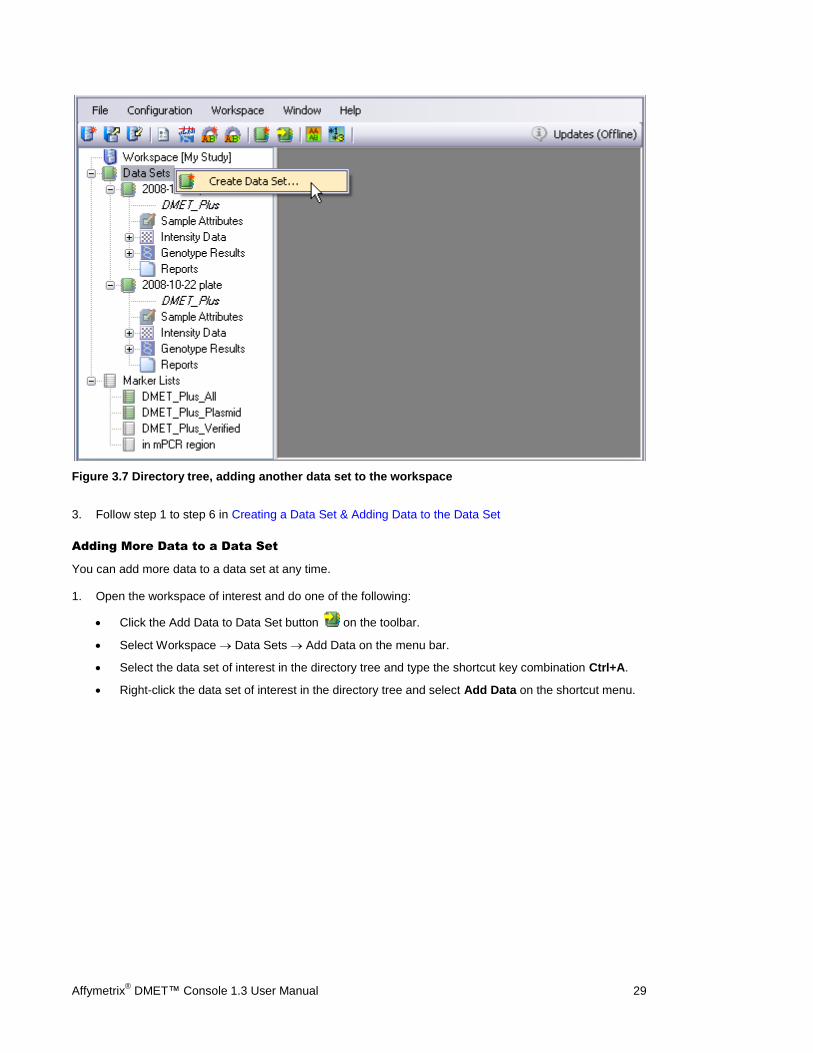
Figure 3.7 Directory tree, adding another data set to the workspace
3. Follow step 1 to step 6 in Creating a Data Set & Adding Data to the Data Set
Adding More Data to a Data Set
You can add more data to a data set at any time.
1. Open the workspace of interest and do one of the following:
Click the Add Data to Data Set button on the toolbar.
Select Workspace Data Sets Add Data on the menu bar.
Select the data set of interest in the directory tree and type the shortcut key combination Ctrl+A.
Right-click the data set of interest in the directory tree and select Add Data on the shortcut menu.
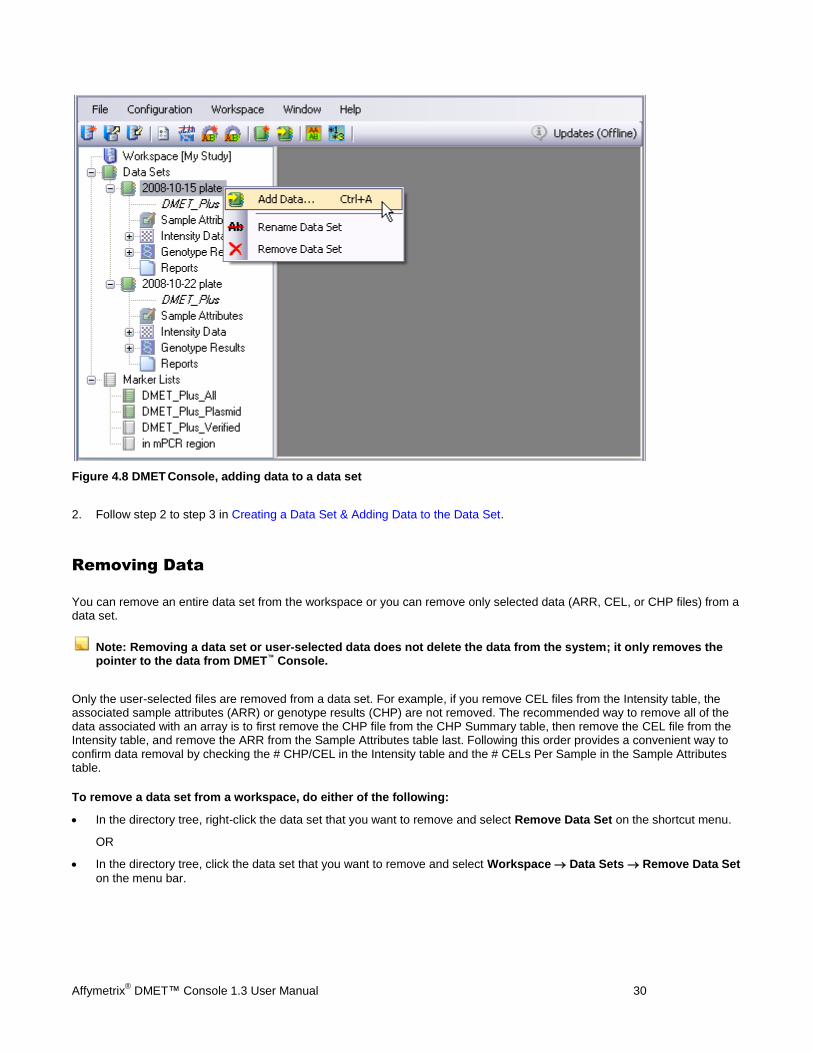
Affymetrix® DMET™ Console 1.3 User Manual 30
Figure 4.8 DMET Console, adding data to a data set
2. Follow step 2 to step 3 in Creating a Data Set & Adding Data to the Data Set.
Removing Data
You can remove an entire data set from the workspace or you can remove only selected data (ARR, CEL, or CHP files) from a data set.
Note: Removing a data set or user-selected data does not delete the data from the system; it only removes the pointer to the data from DMET™ Console.
Only the user-selected files are removed from a data set. For example, if you remove CEL files from the Intensity table, the associated sample attributes (ARR) or genotype results (CHP) are not removed. The recommended way to remove all of the data associated with an array is to first remove the CHP file from the CHP Summary table, then remove the CEL file from the Intensity table, and remove the ARR from the Sample Attributes table last. Following this order provides a convenient way to confirm data removal by checking the # CHP/CEL in the Intensity table and the # CELs Per Sample in the Sample Attributes table.
To remove a data set from a workspace, do either of the following:
In the directory tree, right-click the data set that you want to remove and select Remove Data Set on the shortcut menu.
OR
In the directory tree, click the data set that you want to remove and select Workspace Data Sets Remove Data Set
on the menu bar.
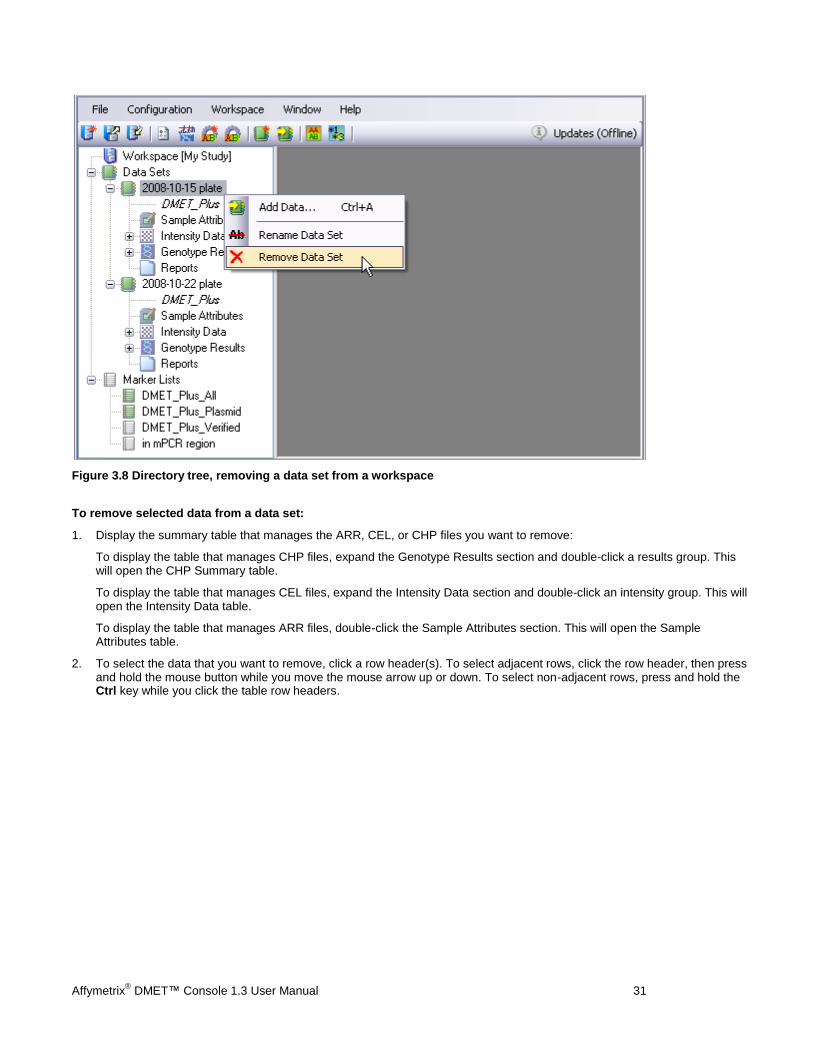
Affymetrix® DMET™ Console 1.3 User Manual 31
Figure 3.8 Directory tree, removing a data set from a workspace
To remove selected data from a data set:
1. Display the summary table that manages the ARR, CEL, or CHP files you want to remove:
To display the table that manages CHP files, expand the Genotype Results section and double-click a results group. This will open the CHP Summary table.
To display the table that manages CEL files, expand the Intensity Data section and double-click an intensity group. This will open the Intensity Data table.
To display the table that manages ARR files, double-click the Sample Attributes section. This will open the Sample Attributes table.
2. To select the data that you want to remove, click a row header(s). To select adjacent rows, click the row header, then press and hold the mouse button while you move the mouse arrow up or down. To select non-adjacent rows, press and hold the Ctrl key while you click the table row headers.
Affymetrix® DMET™ Console 1.3 User Manual 32
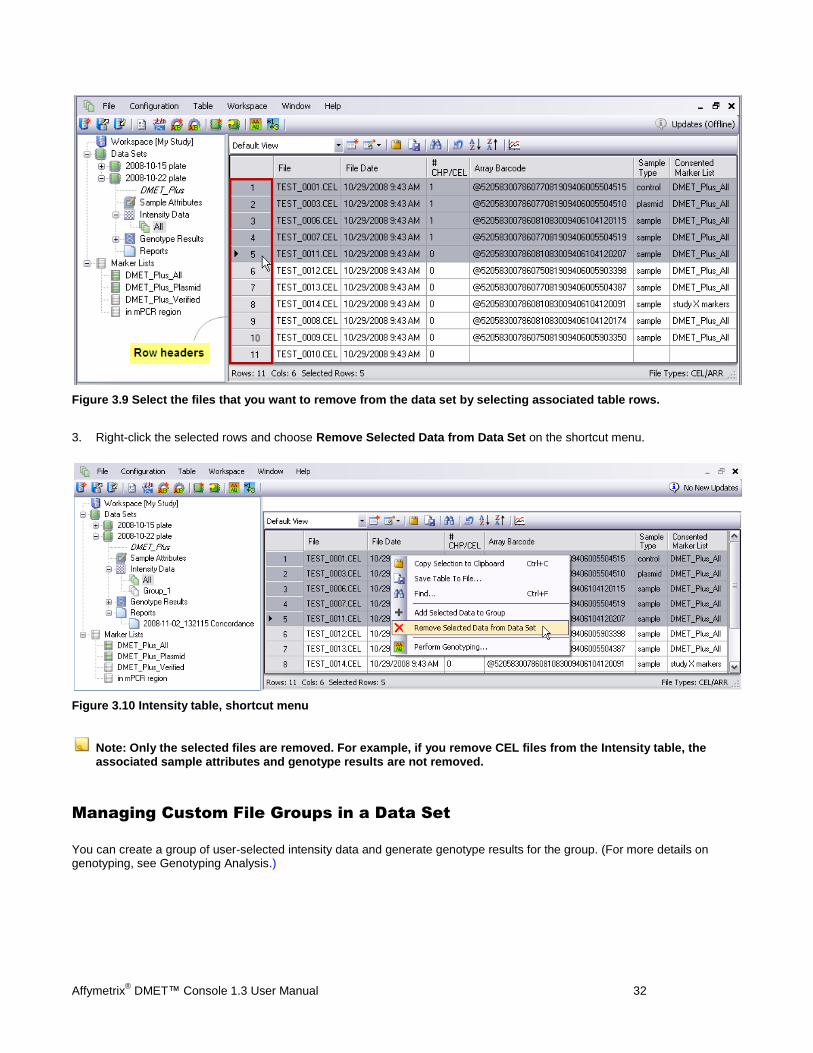
Figure 3.9 Select the files that you want to remove from the data set by selecting associated table rows.
3. Right-click the selected rows and choose Remove Selected Data from Data Set on the shortcut menu.
Figure 3.10 Intensity table, shortcut menu
Note: Only the selected files are removed. For example, if you remove CEL files from the Intensity table, the associated sample attributes and genotype results are not removed.
Managing Custom File Groups in a Data Set
You can create a group of user-selected intensity data and generate genotype results for the group. (For more details on genotyping, see Genotyping Analysis.)
Affymetrix® DMET™ Console 1.3 User Manual 33
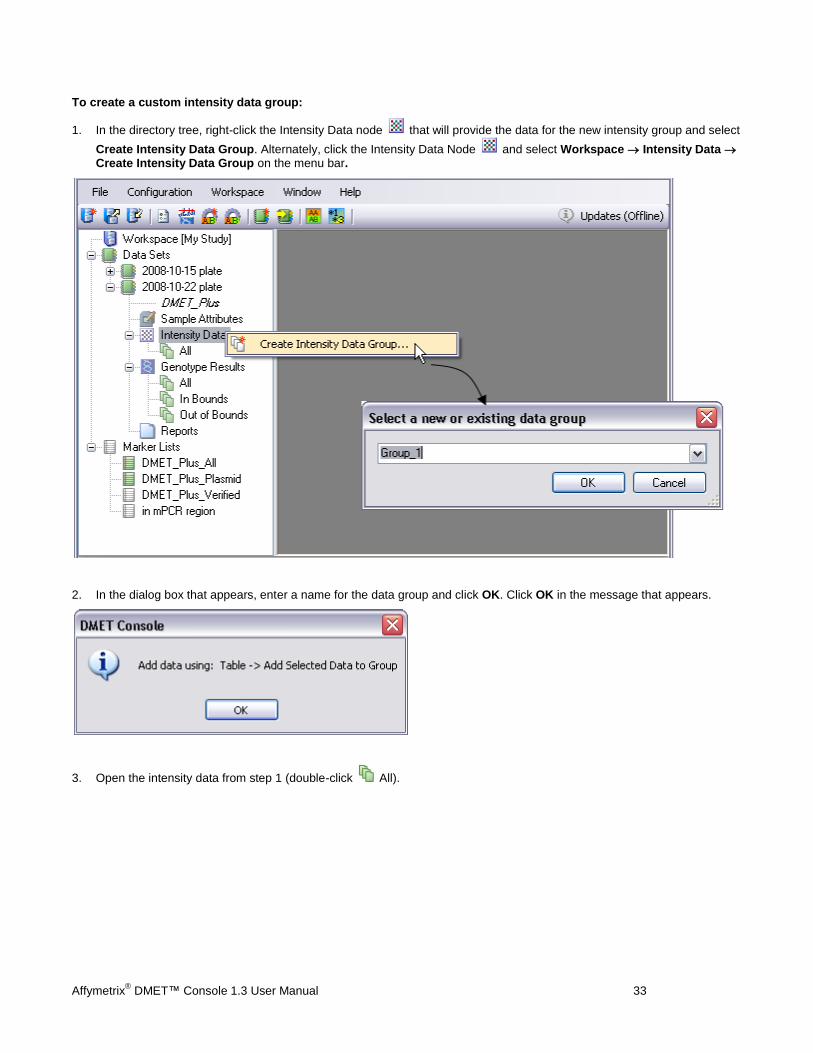
To create a custom intensity data group:
1. In the directory tree, right-click the Intensity Data node that will provide the data for the new intensity group and select
Create Intensity Data Group. Alternately, click the Intensity Data Node and select Workspace Intensity Data Create Intensity Data Group on the menu bar.
2. In the dialog box that appears, enter a name for the data group and click OK. Click OK in the message that appears.
3. Open the intensity data from step 1 (double-click All).
Affymetrix® DMET™ Console 1.3 User Manual 34
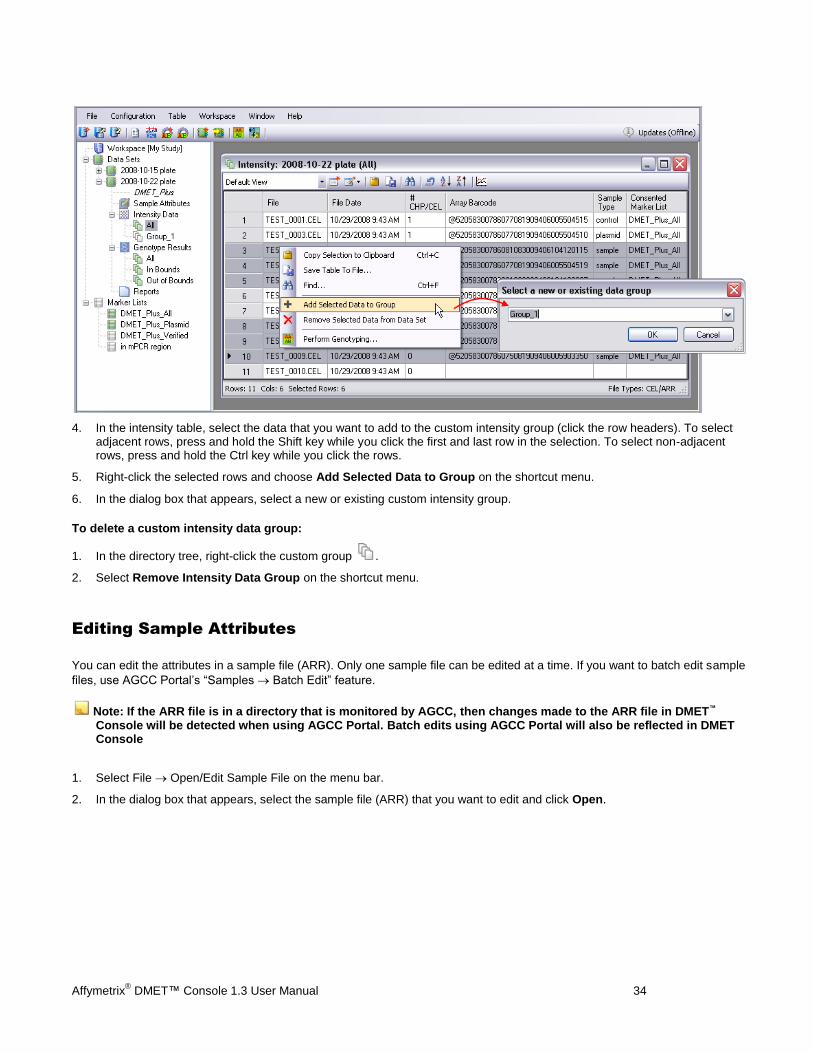
4. In the intensity table, select the data that you want to add to the custom intensity group (click the row headers). To select adjacent rows, press and hold the Shift key while you click the first and last row in the selection. To select non-adjacent rows, press and hold the Ctrl key while you click the rows.
5. Right-click the selected rows and choose Add Selected Data to Group on the shortcut menu.
6. In the dialog box that appears, select a new or existing custom intensity group.
To delete a custom intensity data group:
1. In the directory tree, right-click the custom group .
2. Select Remove Intensity Data Group on the shortcut menu.
Editing Sample Attributes
You can edit the attributes in a sample file (ARR). Only one sample file can be edited at a time. If you want to batch edit sample
files, use AGCC Portal’s “Samples Batch Edit” feature.
Note: If the ARR file is in a directory that is monitored by AGCC, then changes made to the ARR file in DMET™ Console will be detected when using AGCC Portal. Batch edits using AGCC Portal will also be reflected in DMET
Console
1. Select File Open/Edit Sample File on the menu bar.
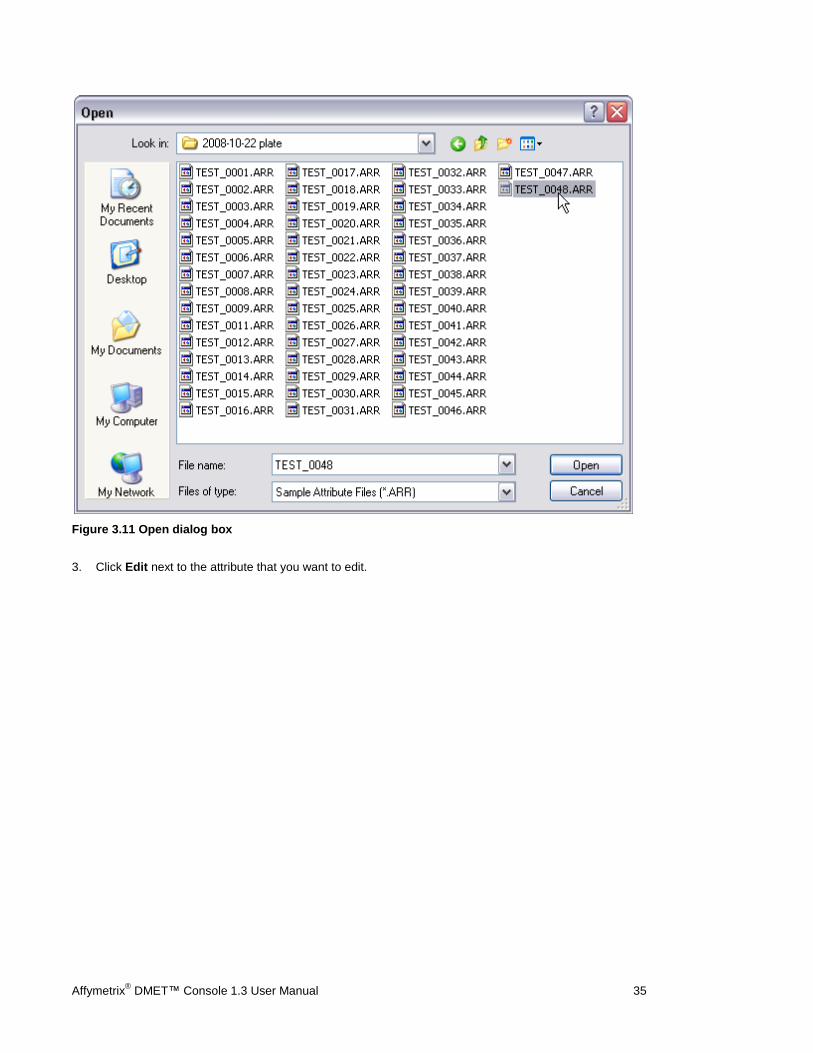
2. In the dialog box that appears, select the sample file (ARR) that you want to edit and click Open.
Affymetrix® DMET™ Console 1.3 User Manual 35
Figure 3.11 Open dialog box
3. Click Edit next to the attribute that you want to edit.

Affymetrix® DMET™ Console 1.3 User Manual 36
Figure 3.12 Edit the user-selected sample file (ARR)
4. In the dialog box that appears, enter a new attribute value. If the attribute is a controlled value, select a value from the drop-down list. Click OK.
Figure 3.13 Attribute Value dialog box
Locating Missing Data
When you open a workspace, DMET™
Console confirms the locations for all of the files in the workspace, including the workspace file itself. If a file has been moved or deleted, DMET
Console prompts you to choose one of the following options:

Affymetrix® DMET™ Console 1.3 User Manual 37
Figure 3.14 Find missing data dialog box
Directory search - Locate the directory that contains the missing file
File search - Locate the file itself
Ignore - Ignore the file and open the workspace without it. The file is flagged as missing until it is deleted from the workspace or the path is corrected.
Ignore all - Ignore all missing files. You are not prompted to locate the missing files. The software ignores the missing files.
To locate a directory:
1. In the Find box, choose the Directory search option and click OK.
Figure 3.15 Find missing data dialog box, directory search option selected
2. In the dialog box that appears, browse to the folder with the missing file and click OK.
Note: DMET Console looks for the missing file in the selected folder. If the folder contains other files that are missing from the current workspace, their paths are also updated.
Affymetrix® DMET™ Console 1.3 User Manual 38
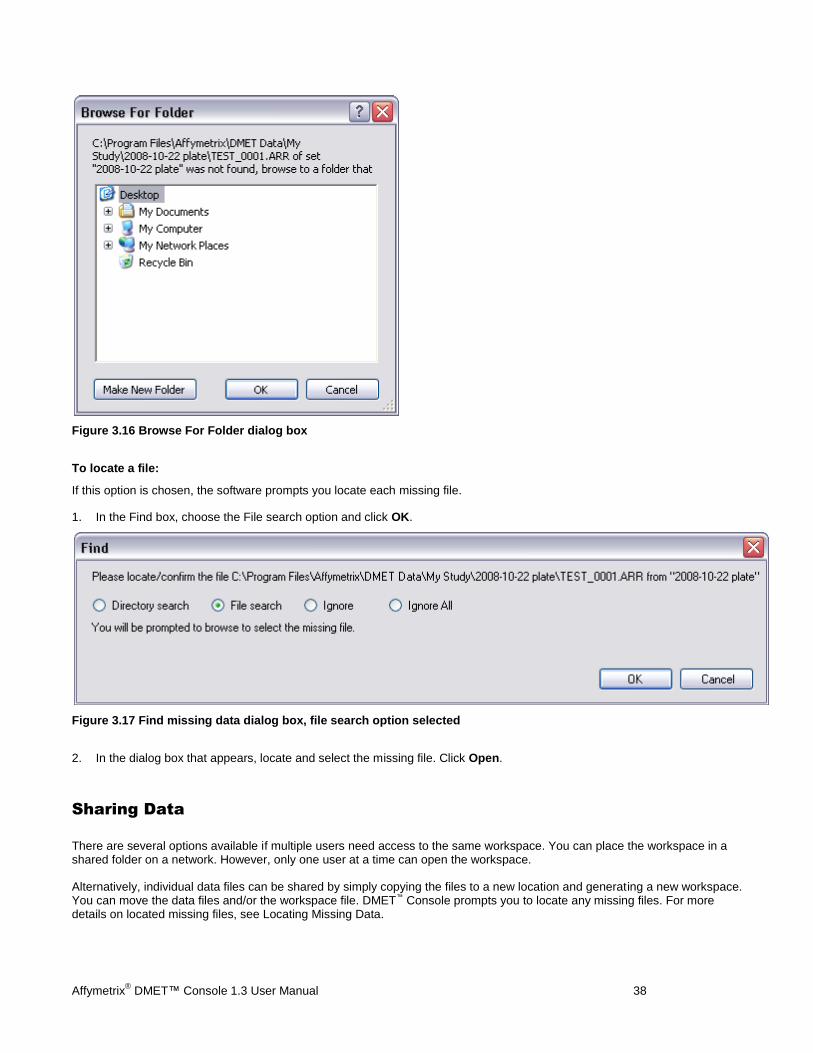
Figure 3.16 Browse For Folder dialog box
To locate a file:
If this option is chosen, the software prompts you locate each missing file.
1. In the Find box, choose the File search option and click OK.
Figure 3.17 Find missing data dialog box, file search option selected
2. In the dialog box that appears, locate and select the missing file. Click Open.
Sharing Data
There are several options available if multiple users need access to the same workspace. You can place the workspace in a shared folder on a network. However, only one user at a time can open the workspace.
Alternatively, individual data files can be shared by simply copying the files to a new location and generating a new workspace. You can move the data files and/or the workspace file. DMET™ Console prompts you to locate any missing files. For more details on located missing files, see Locating Missing Data.
Affymetrix® DMET™ Console 1.3 User Manual 39
The Zip Workspace operation provides a convenient way to copy a workspace. The tool gathers and compresses (zips) a workspace and the associated files into a single package file that is copied to a user-specified location. When you unzip the workspace package, DMET Console updates the data file locations. This makes it easy to share or archive a workspace.
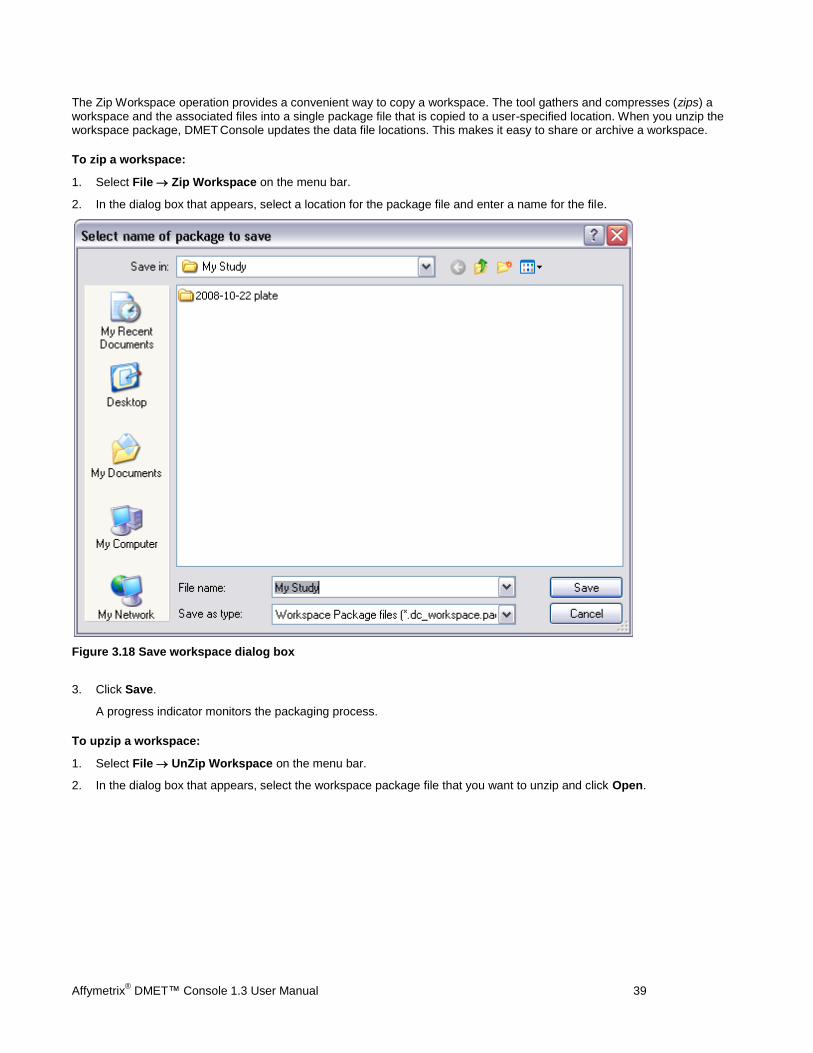
To zip a workspace:
1. Select File Zip Workspace on the menu bar.
2. In the dialog box that appears, select a location for the package file and enter a name for the file.
Figure 3.18 Save workspace dialog box
3. Click Save.
A progress indicator monitors the packaging process.
To upzip a workspace:
1. Select File UnZip Workspace on the menu bar.
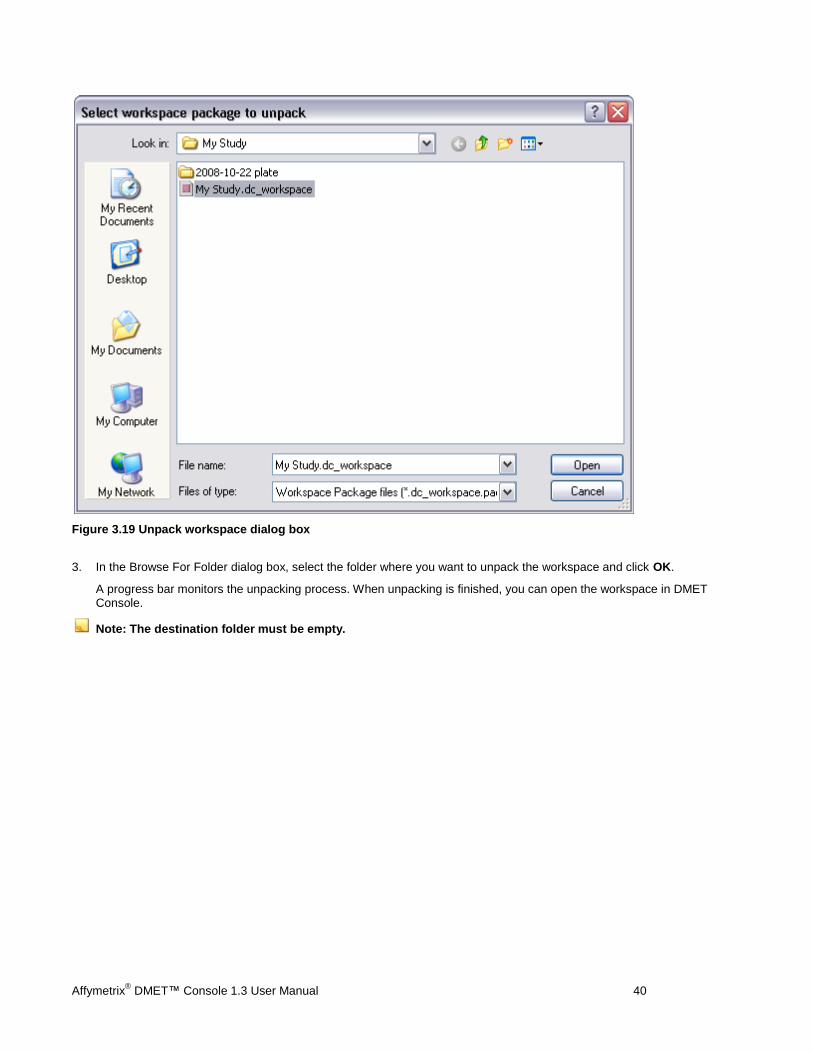
2. In the dialog box that appears, select the workspace package file that you want to unzip and click Open.
Affymetrix® DMET™ Console 1.3 User Manual 40
Figure 3.19 Unpack workspace dialog box
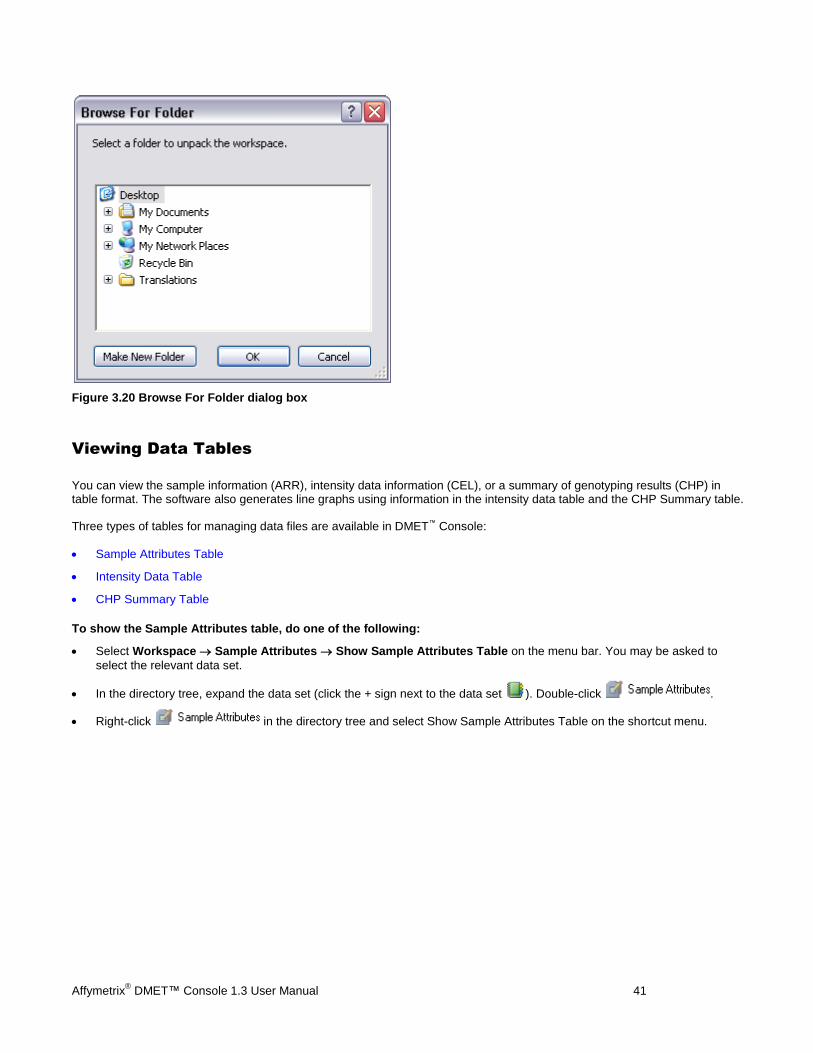
3. In the Browse For Folder dialog box, select the folder where you want to unpack the workspace and click OK.
A progress bar monitors the unpacking process. When unpacking is finished, you can open the workspace in DMET
Console.
Note: The destination folder must be empty.
Affymetrix® DMET™ Console 1.3 User Manual 41
Figure 3.20 Browse For Folder dialog box
Viewing Data Tables
You can view the sample information (ARR), intensity data information (CEL), or a summary of genotyping results (CHP) in table format. The software also generates line graphs using information in the intensity data table and the CHP Summary table.
Three types of tables for managing data files are available in DMET™ Console:
Sample Attributes Table
Intensity Data Table
CHP Summary Table
To show the Sample Attributes table, do one of the following:
Select Workspace Sample Attributes Show Sample Attributes Table on the menu bar. You may be asked to
select the relevant data set.
In the directory tree, expand the data set (click the + sign next to the data set ). Double-click .
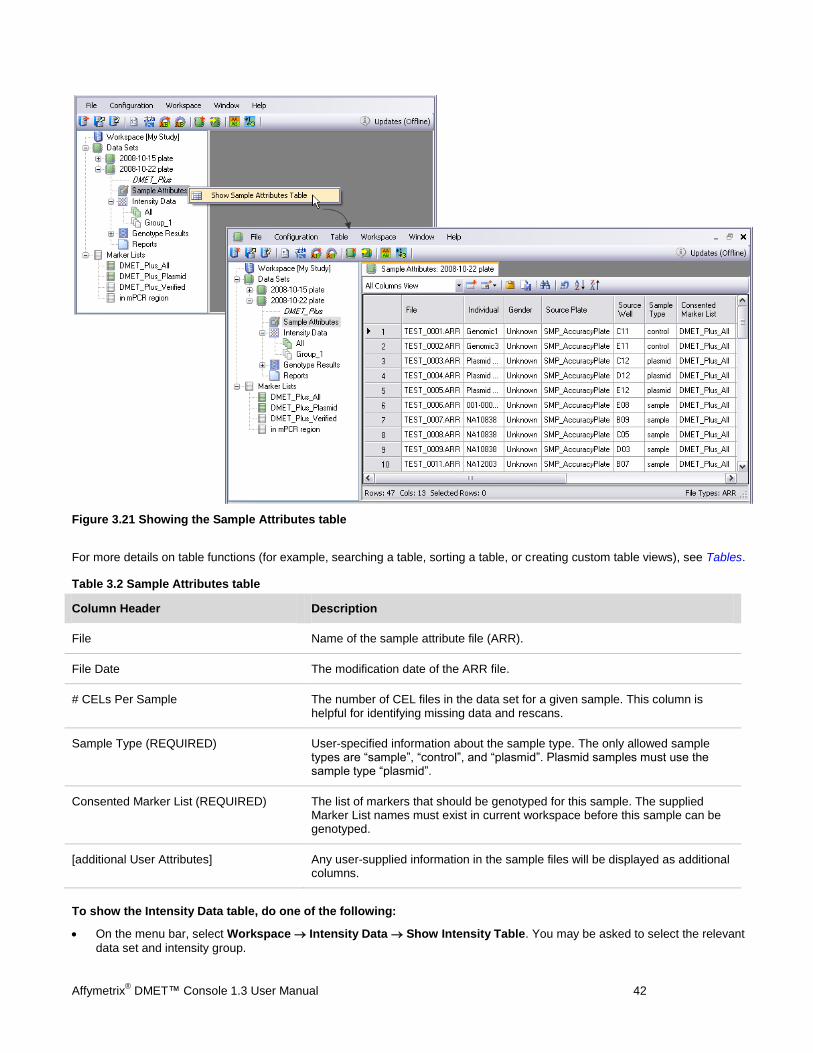
Right-click in the directory tree and select Show Sample Attributes Table on the shortcut menu.
Affymetrix® DMET™ Console 1.3 User Manual 42
Figure 3.21 Showing the Sample Attributes table
For more details on table functions (for example, searching a table, sorting a table, or creating custom table views), see Tables.
Table 3.2 Sample Attributes table
Column Header Description
File Name of the sample attribute file (ARR).
File Date The modification date of the ARR file.
# CELs Per Sample The number of CEL files in the data set for a given sample. This column is helpful for identifying missing data and rescans.
Sample Type (REQUIRED) User-specified information about the sample type. The only allowed sample types are “sample”, “control”, and “plasmid”. Plasmid samples must use the sample type “plasmid”.
Consented Marker List (REQUIRED) The list of markers that should be genotyped for this sample. The supplied Marker List names must exist in current workspace before this sample can be genotyped.
[additional User Attributes] Any user-supplied information in the sample files will be displayed as additional columns.
To show the Intensity Data table, do one of the following:
On the menu bar, select Workspace Intensity Data Show Intensity Table. You may be asked to select the relevant
data set and intensity group.
Affymetrix® DMET™ Console 1.3 User Manual 43
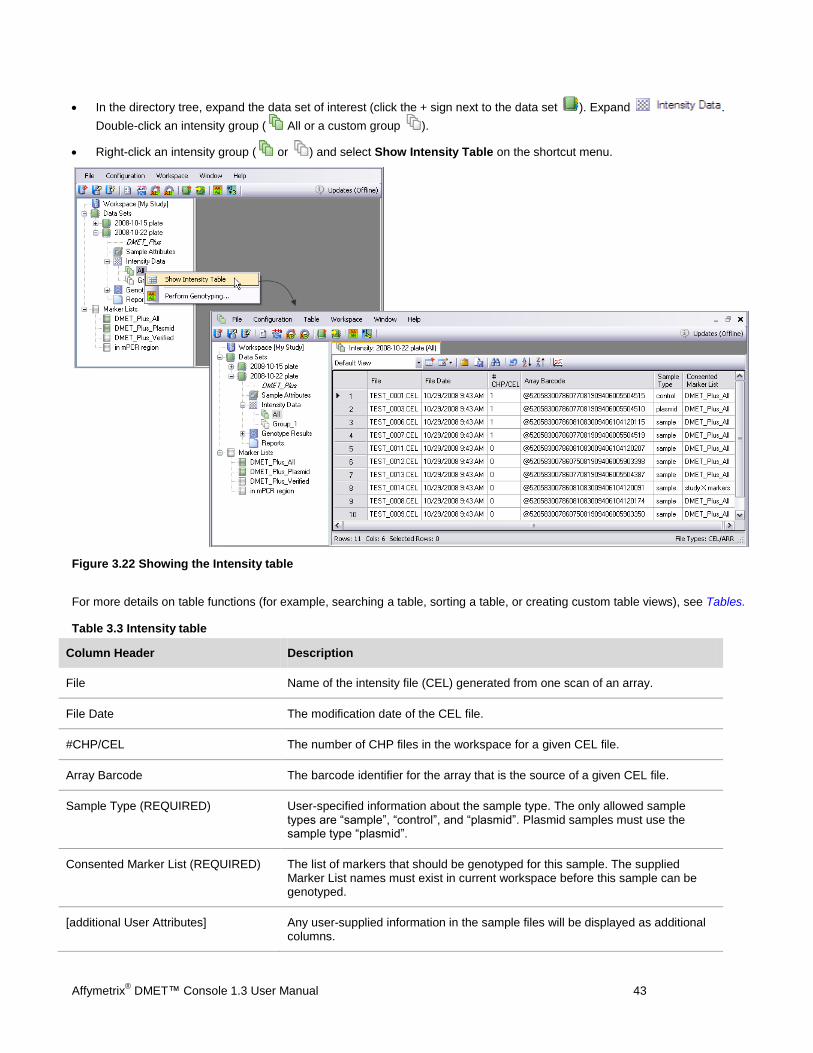
In the directory tree, expand the data set of interest (click the + sign next to the data set ). Expand .
Double-click an intensity group ( All or a custom group ).
Right-click an intensity group ( or ) and select Show Intensity Table on the shortcut menu.
Figure 3.22 Showing the Intensity table
For more details on table functions (for example, searching a table, sorting a table, or creating custom table views), see Tables.
Table 3.3 Intensity table
Column Header Description
File Name of the intensity file (CEL) generated from one scan of an array.
File Date The modification date of the CEL file.
#CHP/CEL The number of CHP files in the workspace for a given CEL file.
Array Barcode The barcode identifier for the array that is the source of a given CEL file.
Sample Type (REQUIRED) User-specified information about the sample type. The only allowed sample types are “sample”, “control”, and “plasmid”. Plasmid samples must use the sample type “plasmid”.
Consented Marker List (REQUIRED) The list of markers that should be genotyped for this sample. The supplied Marker List names must exist in current workspace before this sample can be genotyped.
[additional User Attributes] Any user-supplied information in the sample files will be displayed as additional columns.
Affymetrix® DMET™ Console 1.3 User Manual 44
Chapter 4: Genotyping Analysis
The DMET™ Console software analyzes the intensity data (CEL) from Affymetrix® DMET Plus arrays and determines the
genotype for each marker. The software summarizes the genotyping results in tables and graphs.
Genotyping Configurations
Genotyping Analysis
Sample Quality Control Check
Sample (CHP) Summary Table
Marker Summary
Copy Number Summary
Managing Genotype Results
Concordance Check & Report
Concordance Report
Managing Concordance Reports
Exporting Genotype Results
Export File Formats
Genotyping Configurations
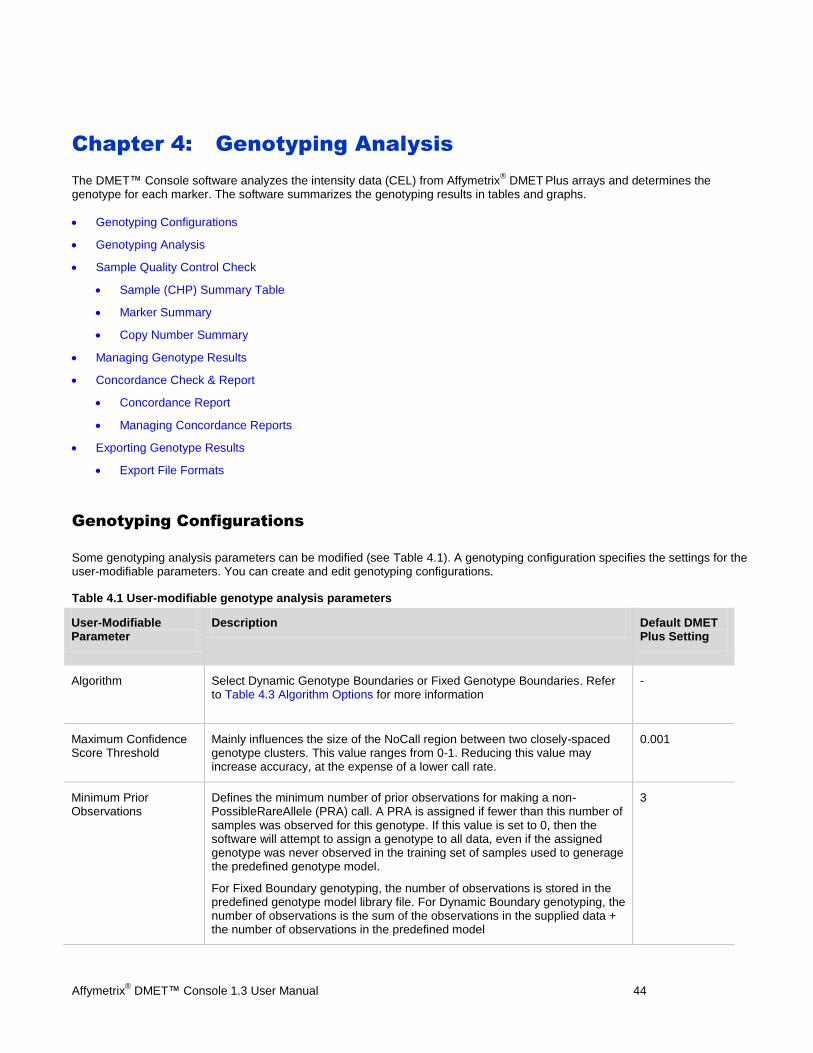
Some genotyping analysis parameters can be modified (see Table 4.1). A genotyping configuration specifies the settings for the user-modifiable parameters. You can create and edit genotyping configurations.
Table 4.1 User-modifiable genotype analysis parameters
User-Modifiable Parameter
Description Default DMET
Plus Setting
Algorithm Select Dynamic Genotype Boundaries or Fixed Genotype Boundaries. Refer to Table 4.3 Algorithm Options for more information
-
Maximum Confidence Score Threshold
Mainly influences the size of the NoCall region between two closely-spaced genotype clusters. This value ranges from 0-1. Reducing this value may increase accuracy, at the expense of a lower call rate.
0.001
Minimum Prior Observations
Defines the minimum number of prior observations for making a non-PossibleRareAllele (PRA) call. A PRA is assigned if fewer than this number of samples was observed for this genotype. If this value is set to 0, then the software will attempt to assign a genotype to all data, even if the assigned genotype was never observed in the training set of samples used to generage the predefined genotype model.
For Fixed Boundary genotyping, the number of observations is stored in the predefined genotype model library file. For Dynamic Boundary genotyping, the number of observations is the sum of the observations in the supplied data + the number of observations in the predefined model
3
Affymetrix® DMET™ Console 1.3 User Manual 45
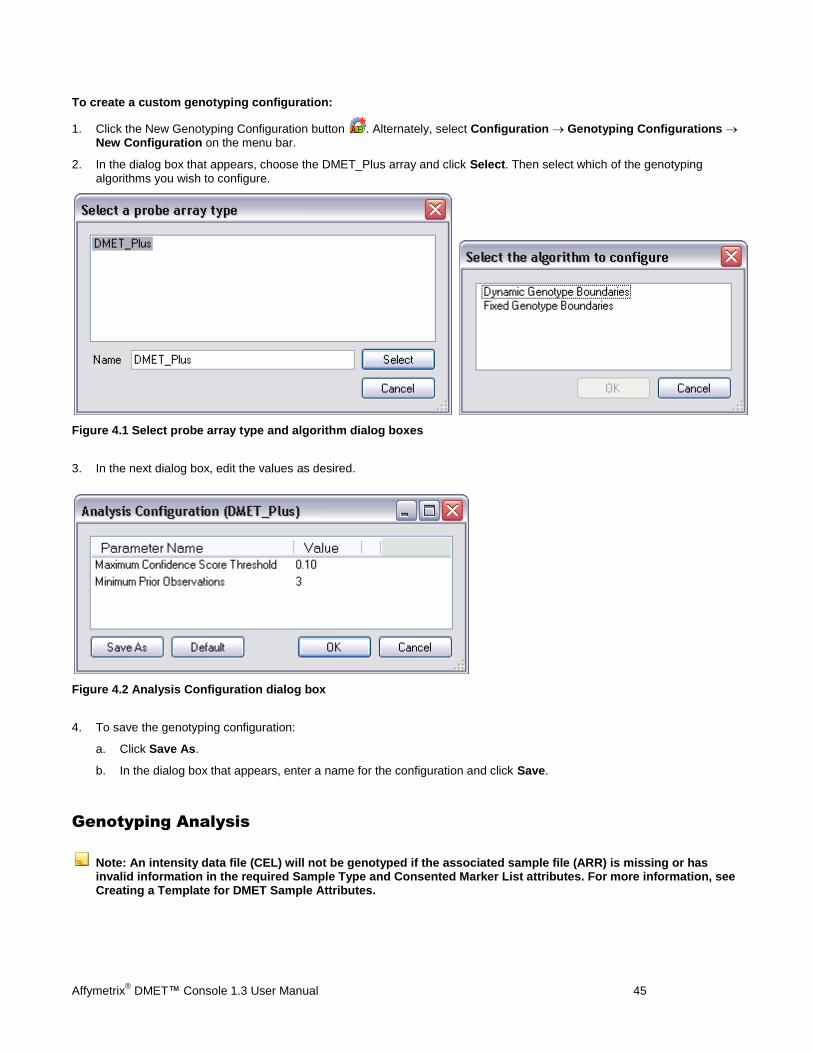
To create a custom genotyping configuration:
1. Click the New Genotyping Configuration button . Alternately, select Configuration Genotyping Configurations New Configuration on the menu bar.
2. In the dialog box that appears, choose the DMET_Plus array and click Select. Then select which of the genotyping
algorithms you wish to configure.
Figure 4.1 Select probe array type and algorithm dialog boxes
3. In the next dialog box, edit the values as desired.
Figure 4.2 Analysis Configuration dialog box
4. To save the genotyping configuration:
a. Click Save As.
b. In the dialog box that appears, enter a name for the configuration and click Save.
Genotyping Analysis
Note: An intensity data file (CEL) will not be genotyped if the associated sample file (ARR) is missing or has invalid information in the required Sample Type and Consented Marker List attributes. For more information, see Creating a Template for DMET Sample Attributes.
Affymetrix® DMET™ Console 1.3 User Manual 46
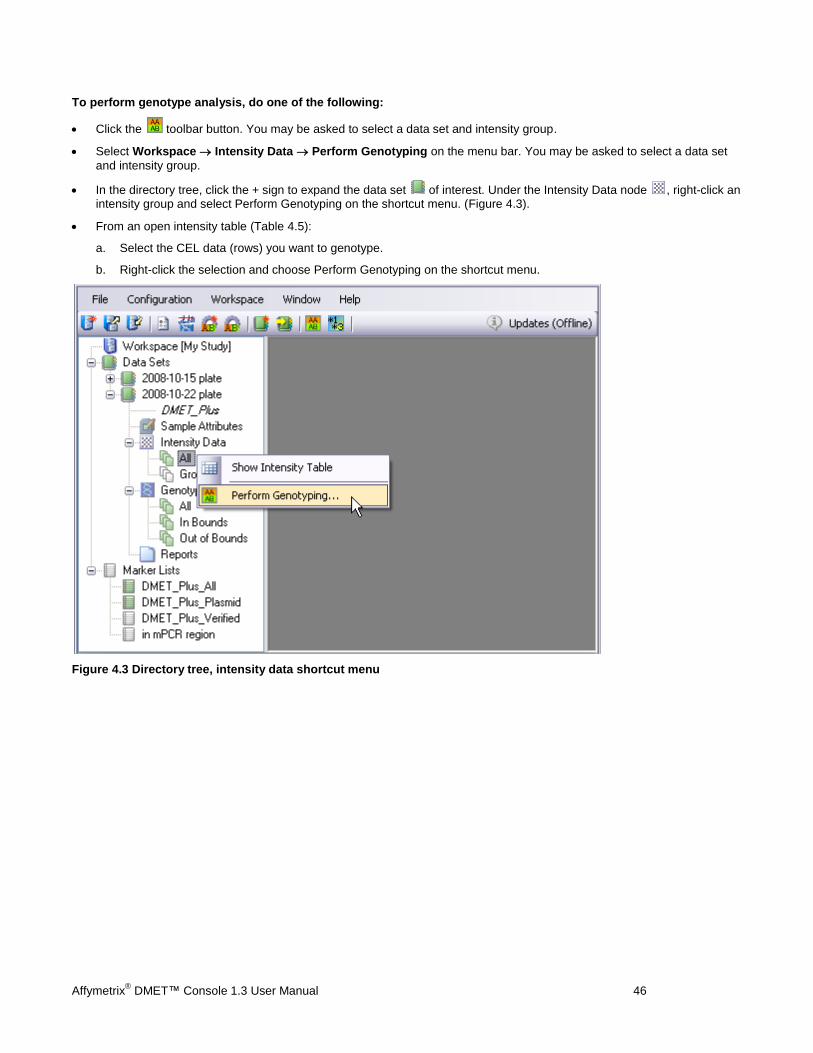
To perform genotype analysis, do one of the following:
Click the toolbar button. You may be asked to select a data set and intensity group.
Select Workspace Intensity Data Perform Genotyping on the menu bar. You may be asked to select a data set
and intensity group.
In the directory tree, click the + sign to expand the data set of interest. Under the Intensity Data node , right-click an intensity group and select Perform Genotyping on the shortcut menu. (Figure 4.3).
From an open intensity table (Table 4.5):
a. Select the CEL data (rows) you want to genotype.
b. Right-click the selection and choose Perform Genotyping on the shortcut menu.
Figure 4.3 Directory tree, intensity data shortcut menu
Affymetrix® DMET™ Console 1.3 User Manual 47
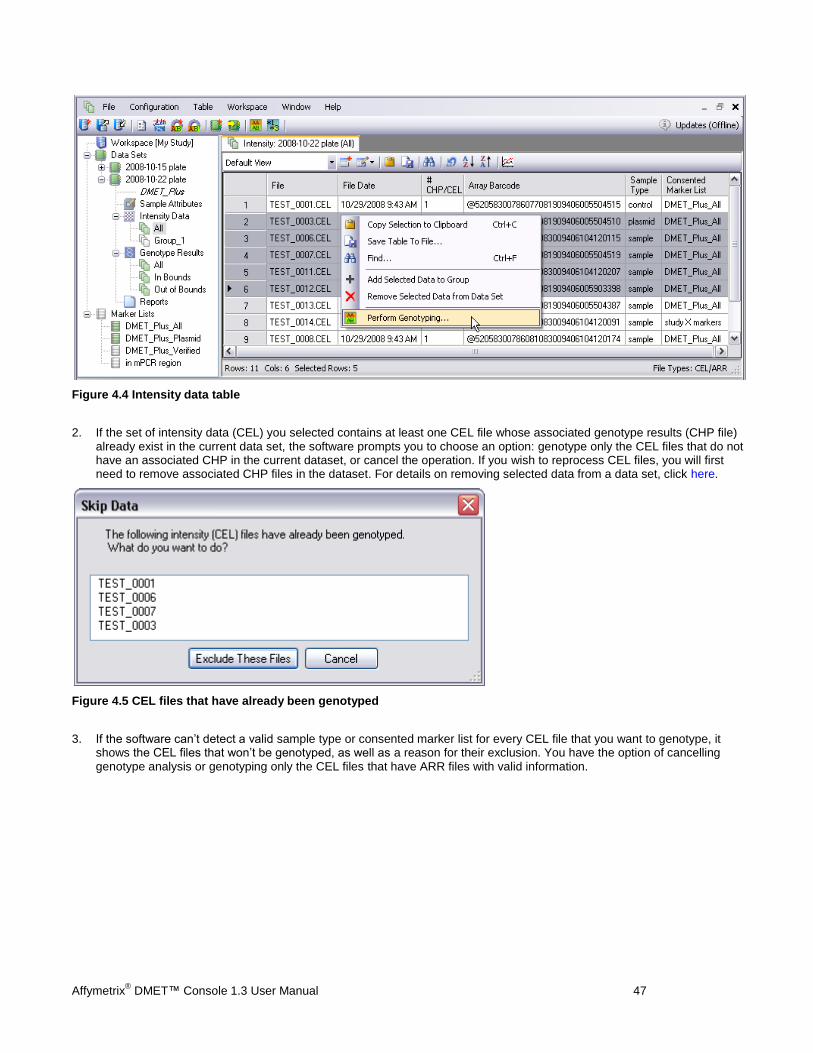
Figure 4.4 Intensity data table
2. If the set of intensity data (CEL) you selected contains at least one CEL file whose associated genotype results (CHP file) already exist in the current data set, the software prompts you to choose an option: genotype only the CEL files that do not have an associated CHP in the current dataset, or cancel the operation. If you wish to reprocess CEL files, you will first need to remove associated CHP files in the dataset. For details on removing selected data from a data set, click here.
Figure 4.5 CEL files that have already been genotyped
3. If the software can’t detect a valid sample type or consented marker list for every CEL file that you want to genotype, it shows the CEL files that won’t be genotyped, as well as a reason for their exclusion. You have the option of cancelling genotype analysis or genotyping only the CEL files that have ARR files with valid information.
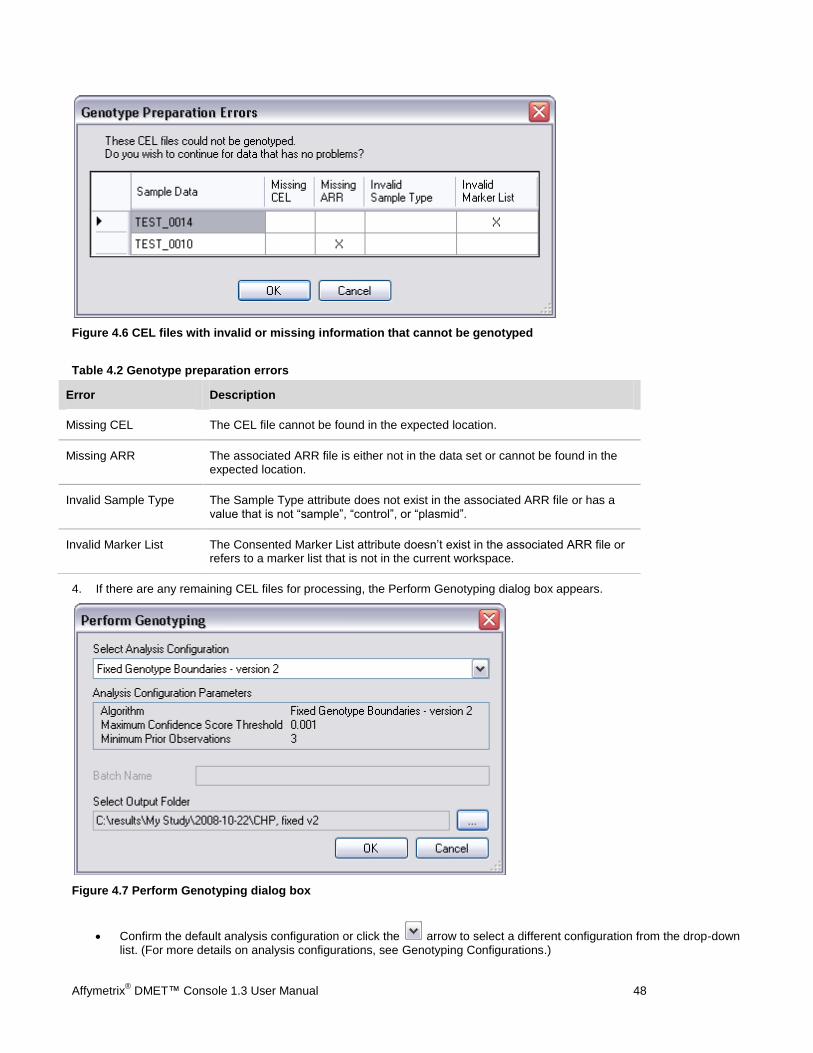
Affymetrix® DMET™ Console 1.3 User Manual 48
Figure 4.6 CEL files with invalid or missing information that cannot be genotyped
Table 4.2 Genotype preparation errors
Error Description
Missing CEL The CEL file cannot be found in the expected location.
Missing ARR The associated ARR file is either not in the data set or cannot be found in the expected location.
Invalid Sample Type The Sample Type attribute does not exist in the associated ARR file or has a value that is not “sample”, “control”, or “plasmid”.
Invalid Marker List The Consented Marker List attribute doesn’t exist in the associated ARR file or refers to a marker list that is not in the current workspace.
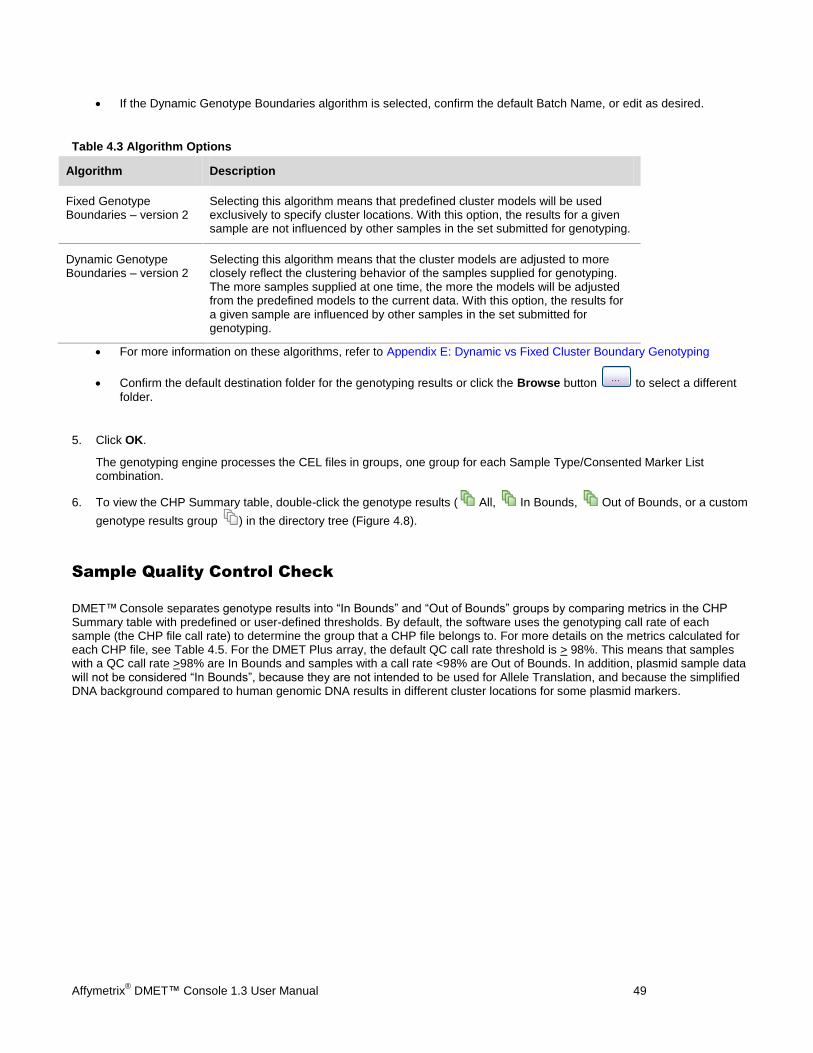
4. If there are any remaining CEL files for processing, the Perform Genotyping dialog box appears.
Figure 4.7 Perform Genotyping dialog box
Confirm the default analysis configuration or click the arrow to select a different configuration from the drop-down list. (For more details on analysis configurations, see Genotyping Configurations.)
Affymetrix® DMET™ Console 1.3 User Manual 49
If the Dynamic Genotype Boundaries algorithm is selected, confirm the default Batch Name, or edit as desired.
Table 4.3 Algorithm Options
Algorithm Description
Fixed Genotype Boundaries – version 2
Selecting this algorithm means that predefined cluster models will be used exclusively to specify cluster locations. With this option, the results for a given sample are not influenced by other samples in the set submitted for genotyping.
Dynamic Genotype Boundaries – version 2
Selecting this algorithm means that the cluster models are adjusted to more closely reflect the clustering behavior of the samples supplied for genotyping. The more samples supplied at one time, the more the models will be adjusted from the predefined models to the current data. With this option, the results for a given sample are influenced by other samples in the set submitted for genotyping.
For more information on these algorithms, refer to Appendix E: Dynamic vs Fixed Cluster Boundary Genotyping
Confirm the default destination folder for the genotyping results or click the Browse button to select a different
folder.
5. Click OK.
The genotyping engine processes the CEL files in groups, one group for each Sample Type/Consented Marker List combination.
6. To view the CHP Summary table, double-click the genotype results ( All, In Bounds, Out of Bounds, or a custom
genotype results group ) in the directory tree (Figure 4.8).
Sample Quality Control Check
DMET™ Console separates genotype results into “In Bounds” and “Out of Bounds” groups by comparing metrics in the CHP Summary table with predefined or user-defined thresholds. By default, the software uses the genotyping call rate of each sample (the CHP file call rate) to determine the group that a CHP file belongs to. For more details on the metrics calculated for each CHP file, see Table 4.5. For the DMET Plus array, the default QC call rate threshold is > 98%. This means that samples with a QC call rate >98% are In Bounds and samples with a call rate <98% are Out of Bounds. In addition, plasmid sample data will not be considered “In Bounds”, because they are not intended to be used for Allele Translation, and because the simplified DNA background compared to human genomic DNA results in different cluster locations for some plasmid markers.

Affymetrix® DMET™ Console 1.3 User Manual 50
Figure 4.8 CHP Summary table
The directory tree shows genotype results sorted by call rate. Metrics that do not meet the sample QC thresholds are
highlighted in the CHP Summary table. The Bounds column indicates whether samples are In Bounds or Out of Bounds. represents a user-specified results group (for more details on creating a custom results group click here).
To modify the sample QC thresholds:
1. Select Configuration QC Thresholds on the menu bar, or click the toolbar button.
2. To change the operator, click the arrow and make a selection from the drop-down list.
3. To change the threshold comparison value, double-click the value and enter a new number.
Figure 4.9 QC Thresholds dialog box
4. To add an additional metric to use for QC, click Add. Enter the name of the metric exactly as it appears in the column
header of the CHP Summary Table.
Affymetrix® DMET™ Console 1.3 User Manual 51
TIP: QC Thresholds can be used to segregate data on sample attributes as well, as long as they appear in the CHP summary table.
5. To remove a QC metric, click Remove next to the metric that you do not want to use for QC.
6. To reset the sample QC threshold to the default settings for the selected array, click Defaults.
7. To save changes, click OK.
Note: If no there are no defined thresholds or the supplied metric names do not appear in the CHP Summary table, the CHP files will not be displayed in the In Bounds or Out of Bounds groups.
Reviewing Genotype Results
The genotype results are accessible in three predefined genotype results groups (Figure 4.8)
All – all genotype result files (CHP) in the data set
In Bounds – genotype result files whose metrics meet QC thresholds
Out of Bounds – genotype result files whose metrics do not meet QC thresholds
For more details on the QC metrics and their thresholds, see Sample Quality Control Check.
You can also create a custom results group with only the CHP files you choose to include. For more details, click here.
The DMET™ Console software presents the genotyping results in the CHP Summary, Marker Summary, and Copy Number Summary tables.
Table 4.4 Genotype results tables
Type Description
Sample (CHP) Summary Table Summarizes genotype results for each CHP file in a particular results group
Marker Summary Summarizes genotypes results for each marker in a particular results group
Copy Number Summary Summarizes copy number results for each supported copy number region in a particular results group
Sample (CHP) Summary Table
The CHP Summary displays summary metrics for each sample’s genotype results file (CHP) in the specified result group, in both table and graph format. It also includes user-specified attributes from the associated sample files (ARR).
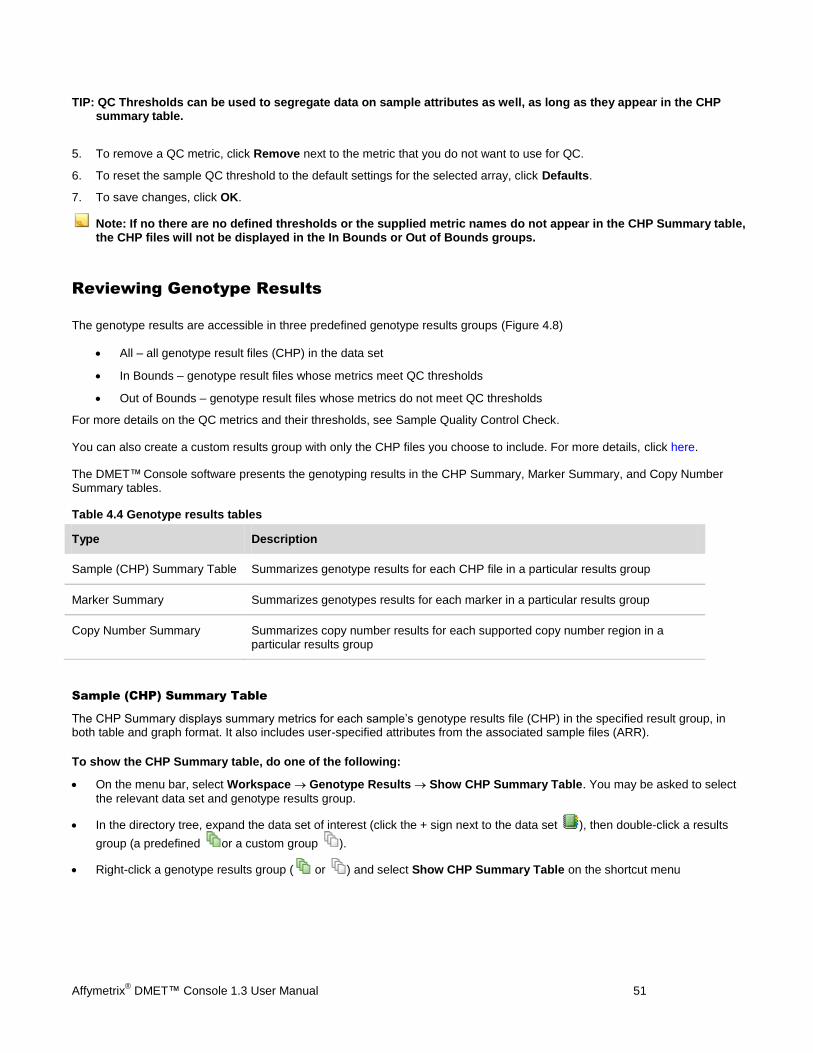
To show the CHP Summary table, do one of the following:
On the menu bar, select Workspace Genotype Results Show CHP Summary Table. You may be asked to select
the relevant data set and genotype results group.
In the directory tree, expand the data set of interest (click the + sign next to the data set ), then double-click a results
group (a predefined or a custom group ).
Right-click a genotype results group ( or ) and select Show CHP Summary Table on the shortcut menu
Affymetrix® DMET™ Console 1.3 User Manual 52
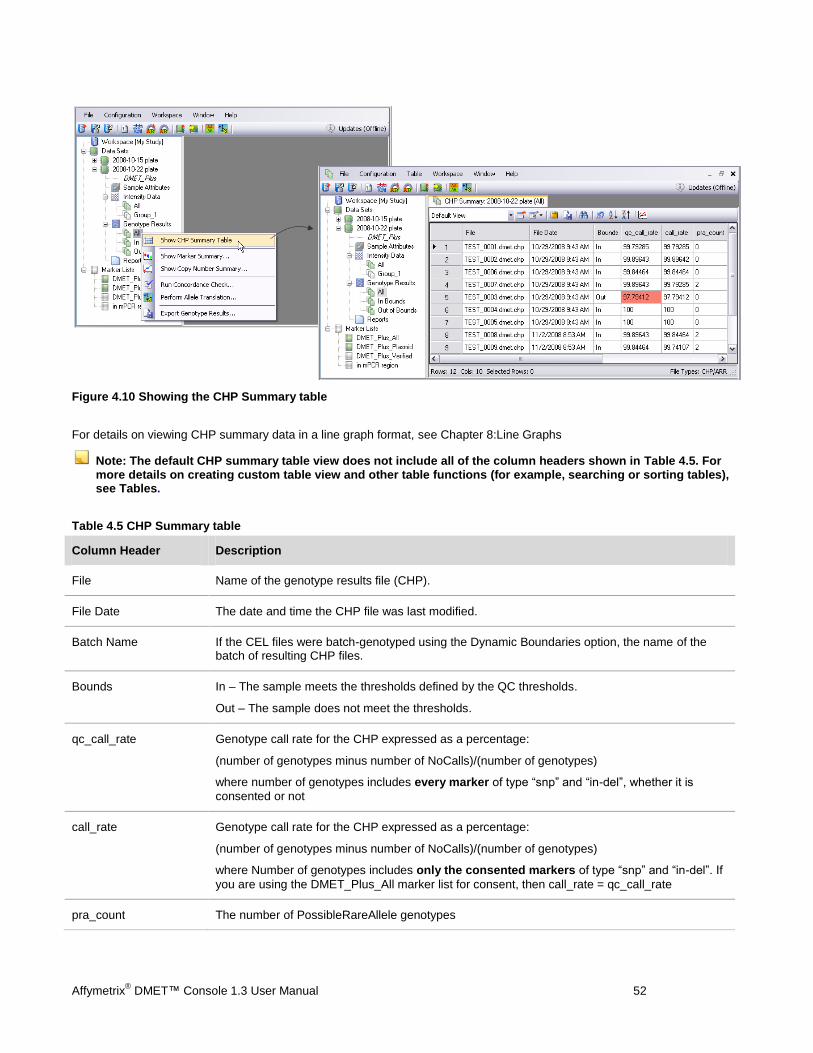
Figure 4.10 Showing the CHP Summary table
For details on viewing CHP summary data in a line graph format, see Chapter 8:Line Graphs
Note: The default CHP summary table view does not include all of the column headers shown in Table 4.5. For more details on creating custom table view and other table functions (for example, searching or sorting tables), see Tables.
Table 4.5 CHP Summary table
Column Header Description
File Name of the genotype results file (CHP).
File Date The date and time the CHP file was last modified.
Batch Name If the CEL files were batch-genotyped using the Dynamic Boundaries option, the name of the batch of resulting CHP files.
Bounds In – The sample meets the thresholds defined by the QC thresholds.
Out – The sample does not meet the thresholds.
qc_call_rate Genotype call rate for the CHP expressed as a percentage:
(number of genotypes minus number of NoCalls)/(number of genotypes)
where number of genotypes includes every marker of type “snp” and “in-del”, whether it is
consented or not
call_rate Genotype call rate for the CHP expressed as a percentage:
(number of genotypes minus number of NoCalls)/(number of genotypes)
where Number of genotypes includes only the consented markers of type “snp” and “in-del”. If
you are using the DMET_Plus_All marker list for consent, then call_rate = qc_call_rate
pra_count The number of PossibleRareAllele genotypes
Affymetrix® DMET™ Console 1.3 User Manual 53
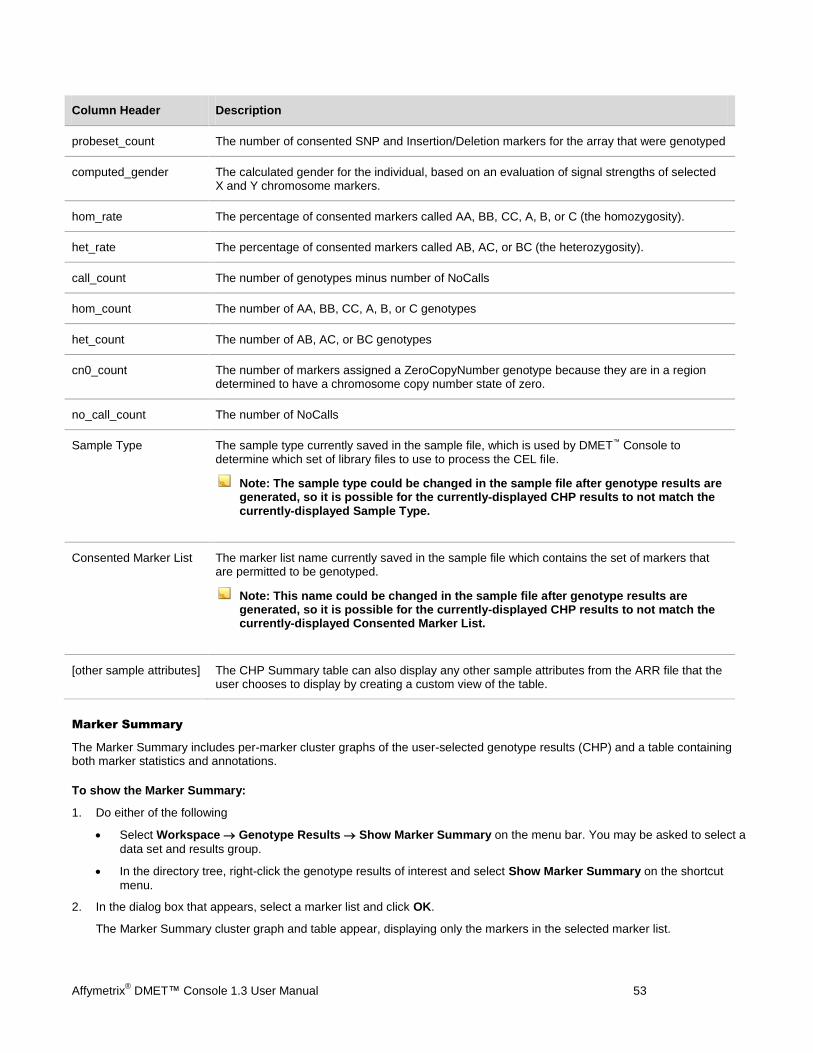
Column Header Description
probeset_count The number of consented SNP and Insertion/Deletion markers for the array that were genotyped
computed_gender The calculated gender for the individual, based on an evaluation of signal strengths of selected X and Y chromosome markers.
hom_rate The percentage of consented markers called AA, BB, CC, A, B, or C (the homozygosity).
het_rate The percentage of consented markers called AB, AC, or BC (the heterozygosity).
call_count The number of genotypes minus number of NoCalls
hom_count The number of AA, BB, CC, A, B, or C genotypes
het_count The number of AB, AC, or BC genotypes
cn0_count The number of markers assigned a ZeroCopyNumber genotype because they are in a region determined to have a chromosome copy number state of zero.
no_call_count The number of NoCalls
Sample Type The sample type currently saved in the sample file, which is used by DMET™ Console to determine which set of library files to use to process the CEL file.
Note: The sample type could be changed in the sample file after genotype results are generated, so it is possible for the currently-displayed CHP results to not match the currently-displayed Sample Type.
Consented Marker List The marker list name currently saved in the sample file which contains the set of markers that are permitted to be genotyped.
Note: This name could be changed in the sample file after genotype results are generated, so it is possible for the currently-displayed CHP results to not match the currently-displayed Consented Marker List.
[other sample attributes] The CHP Summary table can also display any other sample attributes from the ARR file that the user chooses to display by creating a custom view of the table.
Marker Summary
The Marker Summary includes per-marker cluster graphs of the user-selected genotype results (CHP) and a table containing both marker statistics and annotations.
To show the Marker Summary:
1. Do either of the following
Select Workspace Genotype Results Show Marker Summary on the menu bar. You may be asked to select a
data set and results group.
In the directory tree, right-click the genotype results of interest and select Show Marker Summary on the shortcut
menu.
2. In the dialog box that appears, select a marker list and click OK.
The Marker Summary cluster graph and table appear, displaying only the markers in the selected marker list.
Affymetrix® DMET™ Console 1.3 User Manual 54
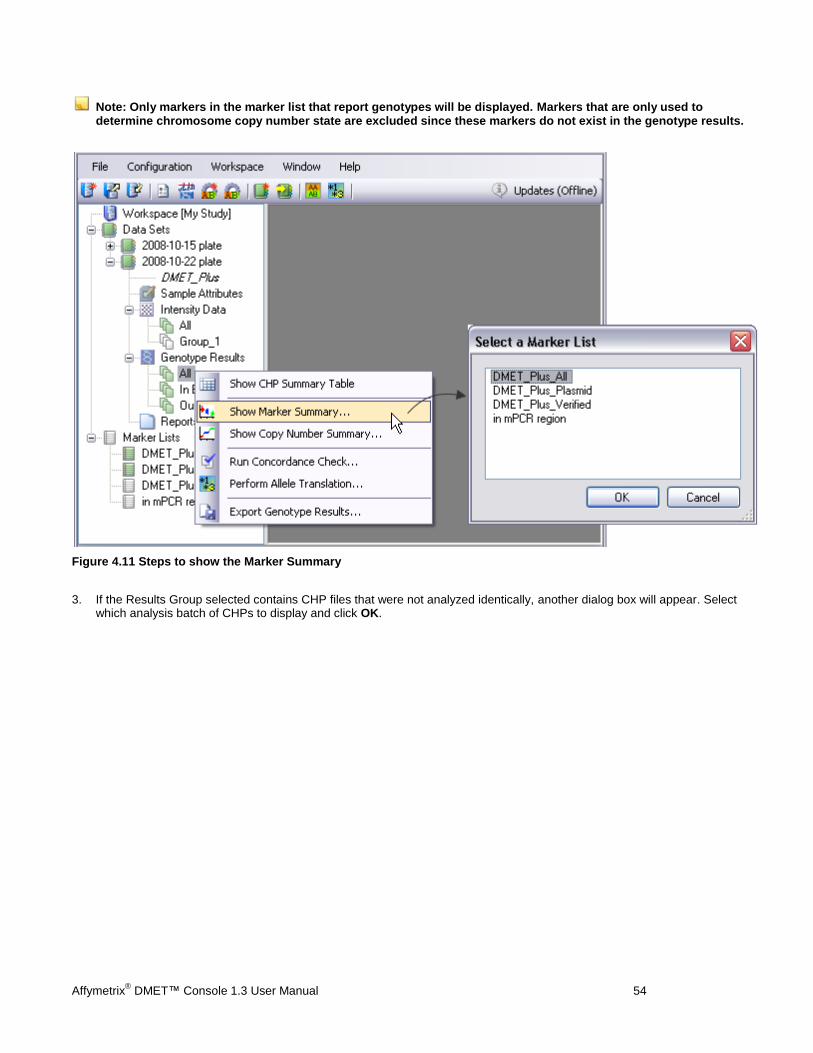
Note: Only markers in the marker list that report genotypes will be displayed. Markers that are only used to determine chromosome copy number state are excluded since these markers do not exist in the genotype results.
Figure 4.11 Steps to show the Marker Summary
3. If the Results Group selected contains CHP files that were not analyzed identically, another dialog box will appear. Select which analysis batch of CHPs to display and click OK.
Affymetrix® DMET™ Console 1.3 User Manual 55
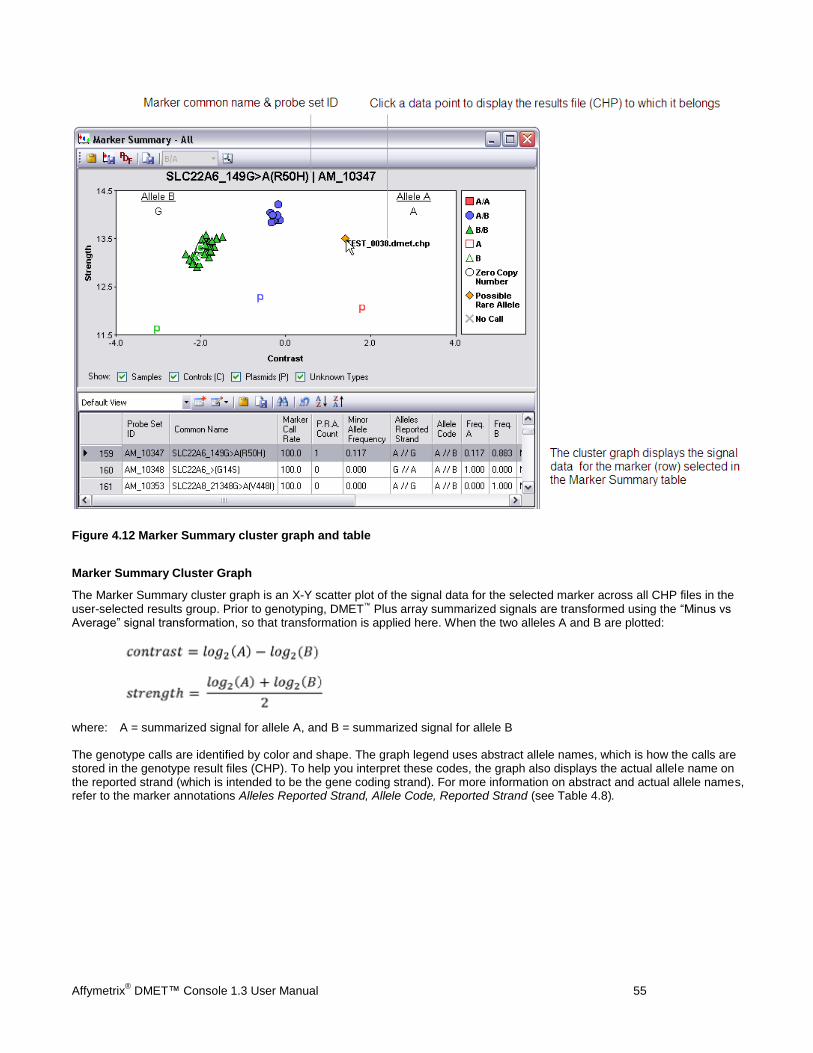
Figure 4.12 Marker Summary cluster graph and table
Marker Summary Cluster Graph
The Marker Summary cluster graph is an X-Y scatter plot of the signal data for the selected marker across all CHP files in the user-selected results group. Prior to genotyping, DMET™ Plus array summarized signals are transformed using the “Minus vs Average” signal transformation, so that transformation is applied here. When the two alleles A and B are plotted:
where: A = summarized signal for allele A, and B = summarized signal for allele B
The genotype calls are identified by color and shape. The graph legend uses abstract allele names, which is how the calls are stored in the genotype result files (CHP). To help you interpret these codes, the graph also displays the actual allele name on the reported strand (which is intended to be the gene coding strand). For more information on abstract and actual allele names, refer to the marker annotations Alleles Reported Strand, Allele Code, Reported Strand (see Table 4.8).

Affymetrix® DMET™ Console 1.3 User Manual 56
Table 4.6 Marker Summary Cluster graph, displayed call codes
Call Description
AA, BB, CC Homozygous call for the respective allele, in which the algorithm applied a two copy number model.
AB, AC, BC Heterozygous call for the respective alleles, in which the algorithm applied a two copy number model.
A, B Hemizygous call for the respective allele, in which the algorithm applied a one copy number model. For the DMET™ Plus array, these calls are only made for males on the X chromosome.
Zero Copy Number The algorithm determined that this marker is in a chromosome region that does not exist in this sample’s DNA (zero copies of this marker).
PossibleRareAllele The algorithm assigns this call to a genotype that was either never observed or very rarely observed in the training data that was used to derive the predefined genotype models. A PossibleRareAllele call is made when the number of observations of the genotype in the training data is below the minimum number of prior observations specified in the analysis configuration used for genotyping.
Note: Possible rare alleles with a confidence score outside the confidence threshold are not reset to NoCall.
NoCall The further a data point drifts from the expected cluster location, the less confidence there is that the call is correct. If the confidence of a call is outside the confidence threshold specified in the analysis configuration used for genotyping, the call is reset to NoCall.
The ”Show” check boxes below the graph enable you to select the data to plot (Figure 4.12). If the sample file (ARR) specifies a sample type = “control”, a “C” label is used, color-coded by the call. Samples of type “plasmid” are labeled with “P”. Since plasmid controls are not available for all markers, plasmid calls are sometimes absent. If the sample file is unavailable or the sample type is an unexpected value, the Unknown Type check box toggles the display of the associated data.
When you select a triallelic marker in the table, the software plots the two alleles with the highest frequency in your data. If calls exist in the allele not shown, a message appears below the graph informing you of this. Use the allele pair selector described in Table 4.7 to select other allele pairs to display.
Note: In a given allele pair plot, only the subset of data relevant to that plot is displayed. For example, samples called homozygous “BB” will not have their associated A and C allele signals plotted in the “C/A” allele pair plot.
Note: Data from markers that are not in the Consented Marker List for a given genotype result file (CHP) are flagged as “NotAvailable”, and are not displayed. If the displayed marker is not consented for any selected samples, no data is plotted.
Table 4.7 Marker Cluster graph toolbar
Item Description
Copies an image of the graph to the system clipboard.
Opens a Save As dialog box that enables you to save an image of the graph to a PNG file.
Affymetrix® DMET™ Console 1.3 User Manual 57
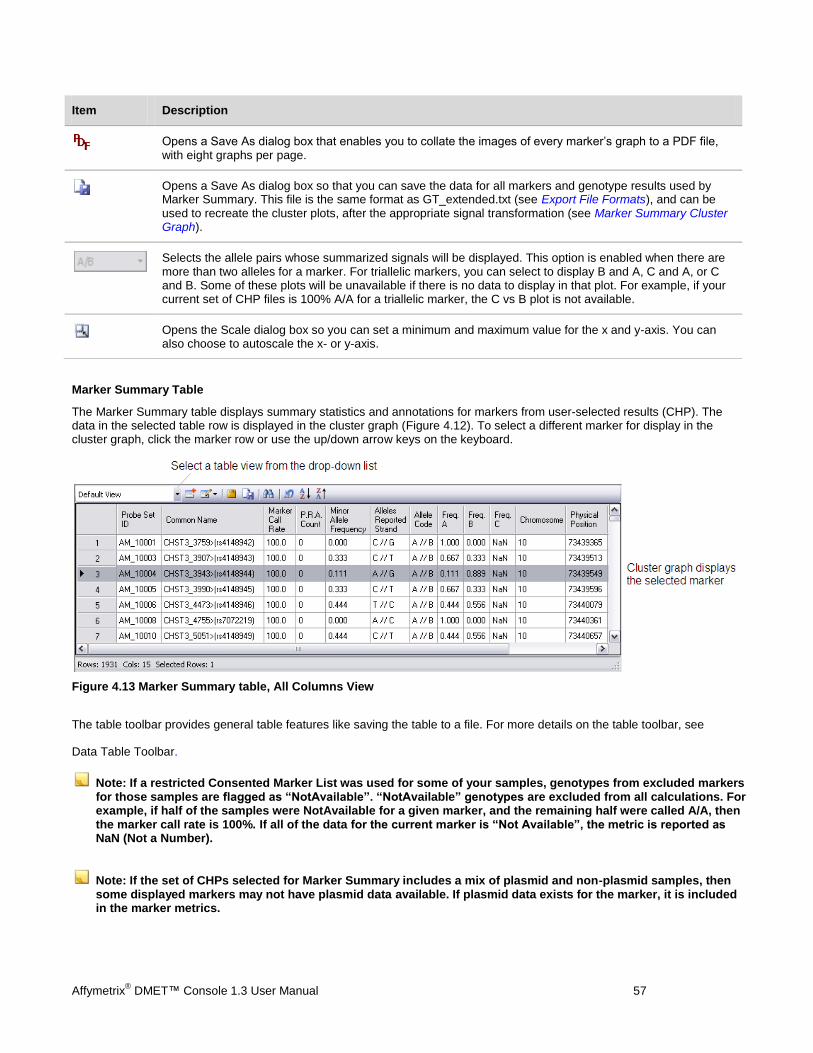
Item Description
Opens a Save As dialog box that enables you to collate the images of every marker’s graph to a PDF file, with eight graphs per page.
Opens a Save As dialog box so that you can save the data for all markers and genotype results used by Marker Summary. This file is the same format as GT_extended.txt (see Export File Formats), and can be used to recreate the cluster plots, after the appropriate signal transformation (see Marker Summary Cluster Graph).
Selects the allele pairs whose summarized signals will be displayed. This option is enabled when there are more than two alleles for a marker. For triallelic markers, you can select to display B and A, C and A, or C and B. Some of these plots will be unavailable if there is no data to display in that plot. For example, if your current set of CHP files is 100% A/A for a triallelic marker, the C vs B plot is not available.
Opens the Scale dialog box so you can set a minimum and maximum value for the x and y-axis. You can also choose to autoscale the x- or y-axis.
Marker Summary Table
The Marker Summary table displays summary statistics and annotations for markers from user-selected results (CHP). The data in the selected table row is displayed in the cluster graph (Figure 4.12). To select a different marker for display in the cluster graph, click the marker row or use the up/down arrow keys on the keyboard.
Figure 4.13 Marker Summary table, All Columns View
The table toolbar provides general table features like saving the table to a file. For more details on the table toolbar, see
Data Table Toolbar.
Note: If a restricted Consented Marker List was used for some of your samples, genotypes from excluded markers for those samples are flagged as “NotAvailable”. “NotAvailable” genotypes are excluded from all calculations. For example, if half of the samples were NotAvailable for a given marker, and the remaining half were called A/A, then the marker call rate is 100%. If all of the data for the current marker is “Not Available”, the metric is reported as NaN (Not a Number).
Note: If the set of CHPs selected for Marker Summary includes a mix of plasmid and non-plasmid samples, then some displayed markers may not have plasmid data available. If plasmid data exists for the marker, it is included in the marker metrics.
Affymetrix® DMET™ Console 1.3 User Manual 58
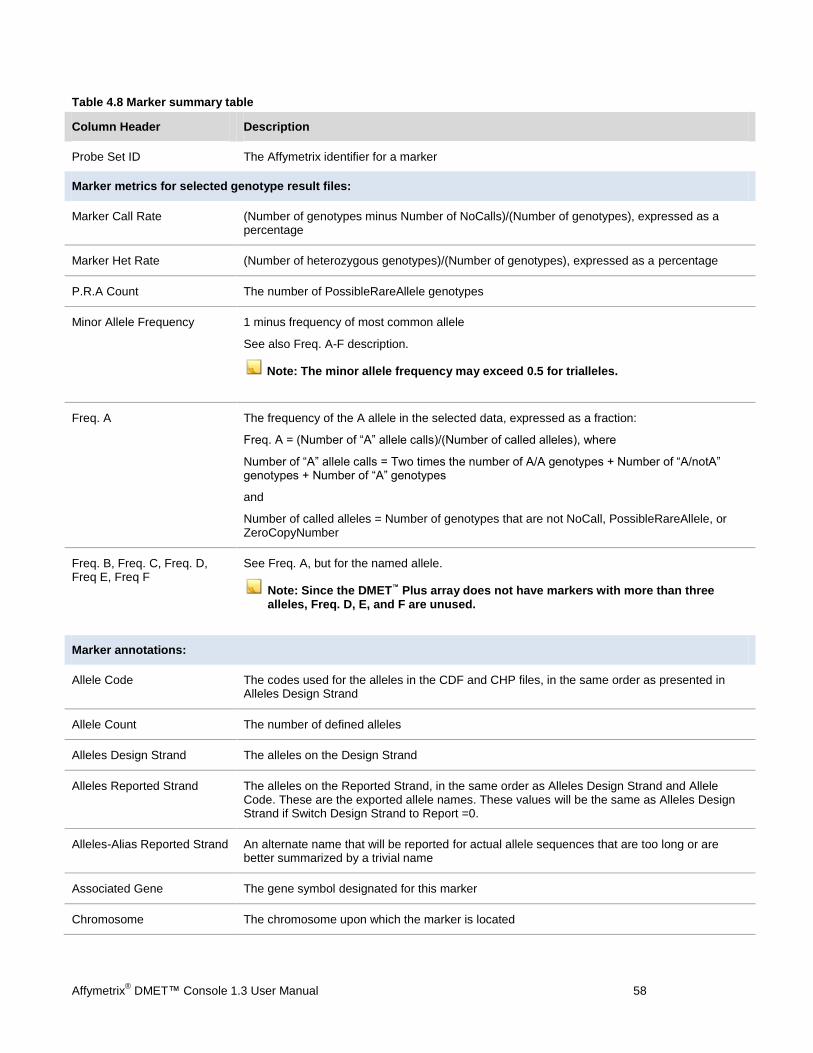
Table 4.8 Marker summary table
Column Header Description
Probe Set ID The Affymetrix identifier for a marker
Marker metrics for selected genotype result files:
Marker Call Rate (Number of genotypes minus Number of NoCalls)/(Number of genotypes), expressed as a percentage
Marker Het Rate (Number of heterozygous genotypes)/(Number of genotypes), expressed as a percentage
P.R.A Count The number of PossibleRareAllele genotypes
Minor Allele Frequency 1 minus frequency of most common allele
See also Freq. A-F description.
Note: The minor allele frequency may exceed 0.5 for trialleles.
Freq. A The frequency of the A allele in the selected data, expressed as a fraction:
Freq. A = (Number of “A” allele calls)/(Number of called alleles), where
Number of “A” allele calls = Two times the number of A/A genotypes + Number of “A/notA” genotypes + Number of “A” genotypes
and
Number of called alleles = Number of genotypes that are not NoCall, PossibleRareAllele, or ZeroCopyNumber
Freq. B, Freq. C, Freq. D, Freq E, Freq F
See Freq. A, but for the named allele.
Note: Since the DMET™ Plus array does not have markers with more than three alleles, Freq. D, E, and F are unused.
Marker annotations:
Allele Code The codes used for the alleles in the CDF and CHP files, in the same order as presented in Alleles Design Strand
Allele Count The number of defined alleles
Alleles Design Strand The alleles on the Design Strand
Alleles Reported Strand The alleles on the Reported Strand, in the same order as Alleles Design Strand and Allele Code. These are the exported allele names. These values will be the same as Alleles Design Strand if Switch Design Strand to Report =0.
Alleles-Alias Reported Strand An alternate name that will be reported for actual allele sequences that are too long or are better summarized by a trivial name
Associated Gene The gene symbol designated for this marker
Chromosome The chromosome upon which the marker is located
Affymetrix® DMET™ Console 1.3 User Manual 59
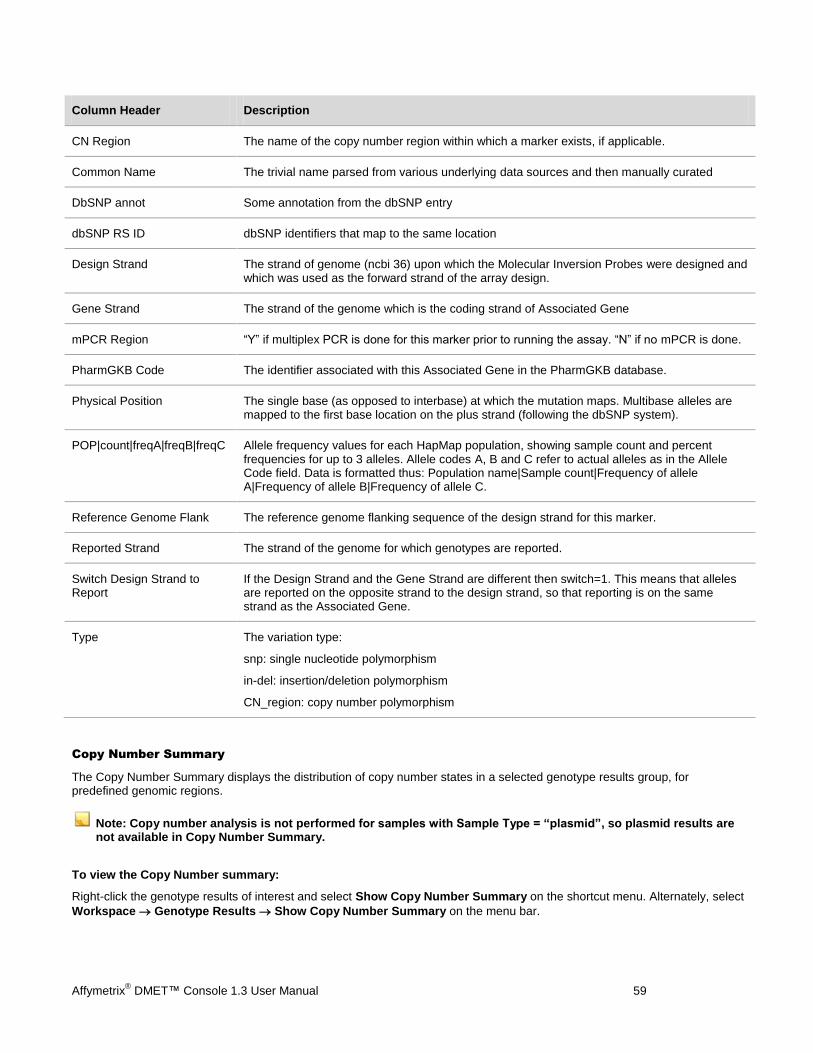
Column Header Description
CN Region The name of the copy number region within which a marker exists, if applicable.
Common Name The trivial name parsed from various underlying data sources and then manually curated
DbSNP annot Some annotation from the dbSNP entry
dbSNP RS ID dbSNP identifiers that map to the same location
Design Strand The strand of genome (ncbi 36) upon which the Molecular Inversion Probes were designed and which was used as the forward strand of the array design.
Gene Strand The strand of the genome which is the coding strand of Associated Gene
mPCR Region “Y” if multiplex PCR is done for this marker prior to running the assay. “N” if no mPCR is done.
PharmGKB Code The identifier associated with this Associated Gene in the PharmGKB database.
Physical Position The single base (as opposed to interbase) at which the mutation maps. Multibase alleles are mapped to the first base location on the plus strand (following the dbSNP system).
POP|count|freqA|freqB|freqC Allele frequency values for each HapMap population, showing sample count and percent frequencies for up to 3 alleles. Allele codes A, B and C refer to actual alleles as in the Allele Code field. Data is formatted thus: Population name|Sample count|Frequency of allele A|Frequency of allele B|Frequency of allele C.
Reference Genome Flank The reference genome flanking sequence of the design strand for this marker.
Reported Strand The strand of the genome for which genotypes are reported.
Switch Design Strand to Report
If the Design Strand and the Gene Strand are different then switch=1. This means that alleles are reported on the opposite strand to the design strand, so that reporting is on the same strand as the Associated Gene.
Type The variation type:
snp: single nucleotide polymorphism
in-del: insertion/deletion polymorphism
CN_region: copy number polymorphism
Copy Number Summary
The Copy Number Summary displays the distribution of copy number states in a selected genotype results group, for predefined genomic regions.
Note: Copy number analysis is not performed for samples with Sample Type = “plasmid”, so plasmid results are not available in Copy Number Summary.
To view the Copy Number summary:
Right-click the genotype results of interest and select Show Copy Number Summary on the shortcut menu. Alternately, select
Workspace Genotype Results Show Copy Number Summary on the menu bar.

Affymetrix® DMET™ Console 1.3 User Manual 60
Figure 4.14 Directory tree, shortcut menu
If the Results Group selected contains CHP files that were not analyzed identically, another dialog box will appear. Select which analysis batch of CHPs to display and click OK.

Affymetrix® DMET™ Console 1.3 User Manual 61
Copy Number Summary Graph
Figure 4.15 Example Copy Number summary
Each point on the graph corresponds to the copy number call for one region of one genotype result file (CHP). The copy number results in the graph are sorted left to right by increasing value of the estimated copy number, a continuous value used to determine the copy number call. Points are colored by copy number call:
CN=0 Measured copy number state is zero
CN>=1 Measured copy number state is greater than or equal to one
NoCall The copy number state could not be determined
Note: Data from copy number regions that are not in the Consented Marker List that was used for a given genotype result file (CHP) are flagged as “NotAvailable” and are not displayed. If the displayed copy number region is not consented for any selected samples, no data is plotted. For tips on how to create a custom consented marker list see Create & Import a Custom Marker List.

Affymetrix® DMET™ Console 1.3 User Manual 62
Table 4.9 Copy Number Summary graph toolbar
Item Description
Copies an image of the graph to the system clipboard.
Opens a Save As dialog box that enables you to save an image of the graph to a PNG file.
Opens a Save As dialog box that enables you to collate the images of every region’s graph to a PDF file, with eight graphs per page.
Opens a Save As dialog box so that you can save the data for all copy number regions used by Copy Number Summary. This file is the same format as CN_extended.txt and can be used to recreate the copy number plots,
Opens the Scale dialog box so you can set a minimum and maximum value for the x and y-axis. You can also choose to autoscale the x- or y-axis.
Copy Number Summary Table
The Copy Number Summary table displays summary statistics and annotations for copy number regions from user-selected results (CHP).
Table 4.10 Copy Number Summary Table, Default View
Column Header Description
Probe Set ID The name of the Affymetrix probe set for a marker.
CN Call Rate The copy number call rate for all selected genotype results that are consented for this region, expressed as a percentage.
CN Call Rate = (number of consented CHP files – number of NoCalls)/number of consented CHP files
Common Name The trivial name parsed from various underlying data sources and then manually curated
Associated Gene The gene symbol designated for this marker
Chromosome The chromosome upon which the marker is located
Physical Position The first base location of this region on the plus strand (following the dbSNP system).
PharmGKB Code The identifier associated with this Associated Gene in the PharmGKB database.
Note: Switching the table View to display all annotations will display some annotations that are only relevant for individual markers, not copy number regions. Therefore, some annotations for these regions will be displayed as N/A (not applicable).
Managing Genotype Results
You can:
Add CHP files to a results group (see Adding More Data to a Data Set)
Create CHP files (see Genotyping Analysis)

Affymetrix® DMET™ Console 1.3 User Manual 63
Remove CHP files from a data set (see Removing Data from a Data Set)
Create a custom results group
Add CHP files to a custom results group
Remove CHP files from a custom results group
Rename a custom results group
Remove a custom results group
You can create a custom group of user-selected genotype results. A custom genotype results group is a useful way to subcategorize results from a data set or group together results from different data sets.
To create a genotype results group:
1. In the directory tree, right-click the Genotype Results node and select Create Genotype Results Group on the shortcut
menu. Alternately, select Workspace Genotype Results Create Genotype Results Group on the menu bar.
2. In the dialog box that appears, enter a name for the group and click OK.
— The new group appears in the directory tree.
Figure 4.16 Shortcut menu command to create or select a custom genotype results group
To add results to a custom results group:
1. In the directory tree, double-click the results group ( or ) with the data that you want to add to the custom group.
— The CHP Summary table appears.
2. In the CHP Summary table, select the data of interest. Right-click the highlighted rows and choose Add Selected Data to Results Group on the shortcut menu.

Affymetrix® DMET™ Console 1.3 User Manual 64
Figure 4.17 CHP Summary table, shortcut menu
3. In the dialog box that appears, confirm the group for the results or click the arrow and make a selection from the drop-down list. To create a new custom group, enter a new name. Click OK.
— The genotype results are added to the selected group.
To remove genotype results from a custom results group:
1. In the directory tree, double-click the results group that you want to edit ( or ).
— The CHP Summary table appears.
2. In the table, select the data (rows) that you want to remove. Right-click the selection and choose Remove Selected Data from Results Group on the shortcut menu.
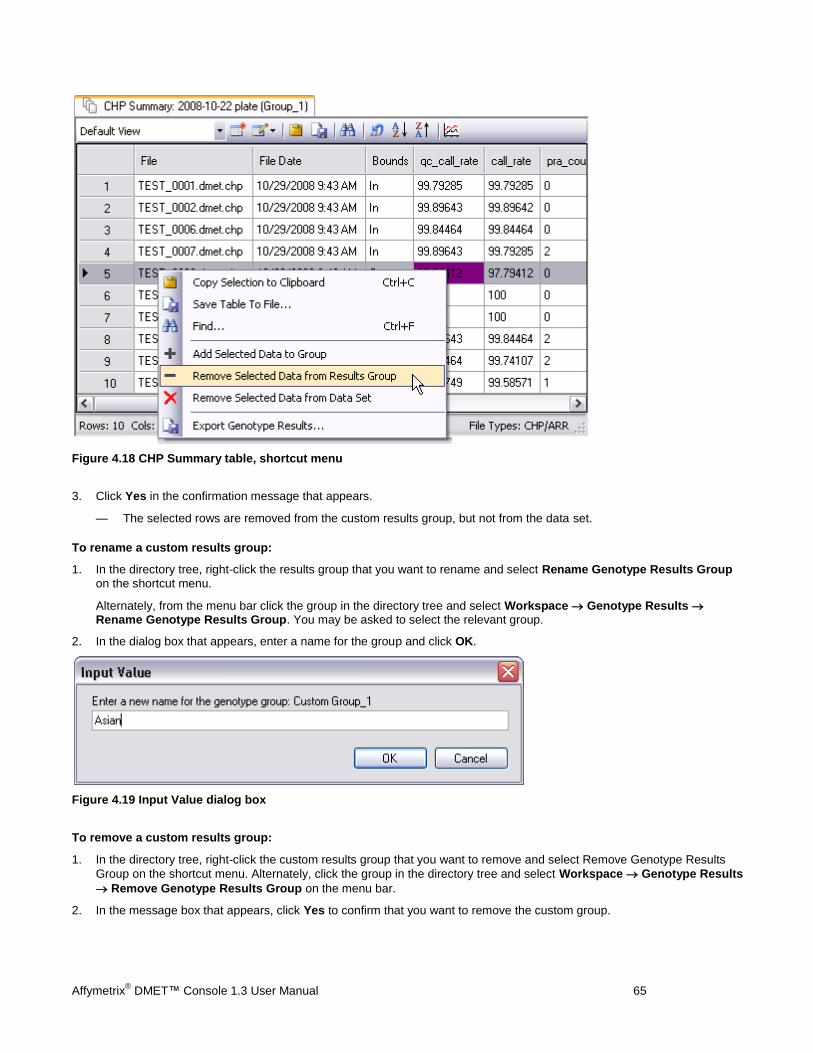
Affymetrix® DMET™ Console 1.3 User Manual 65
Figure 4.18 CHP Summary table, shortcut menu
3. Click Yes in the confirmation message that appears.
— The selected rows are removed from the custom results group, but not from the data set.
To rename a custom results group:
1. In the directory tree, right-click the results group that you want to rename and select Rename Genotype Results Group
on the shortcut menu.
Alternately, from the menu bar click the group in the directory tree and select Workspace Genotype Results Rename Genotype Results Group. You may be asked to select the relevant group.
2. In the dialog box that appears, enter a name for the group and click OK.
Figure 4.19 Input Value dialog box
To remove a custom results group:
1. In the directory tree, right-click the custom results group that you want to remove and select Remove Genotype Results
Group on the shortcut menu. Alternately, click the group in the directory tree and select Workspace Genotype Results
Remove Genotype Results Group on the menu bar.
2. In the message box that appears, click Yes to confirm that you want to remove the custom group.
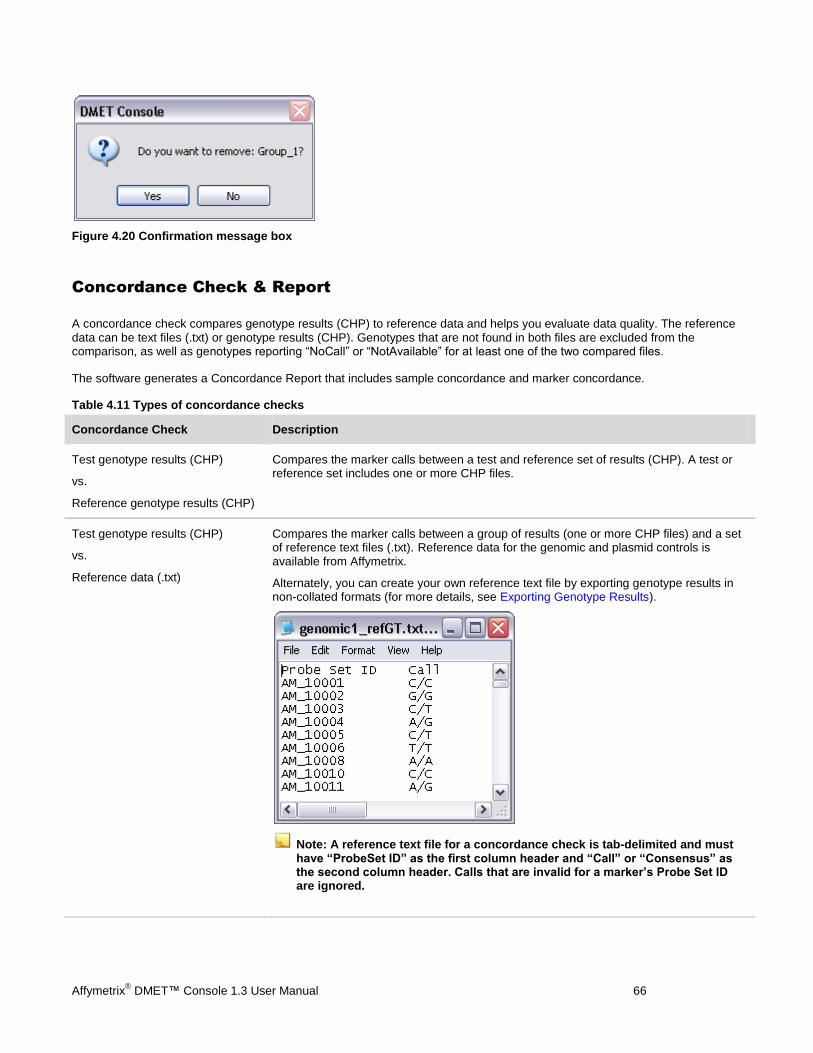
Affymetrix® DMET™ Console 1.3 User Manual 66
Figure 4.20 Confirmation message box
Concordance Check & Report
A concordance check compares genotype results (CHP) to reference data and helps you evaluate data quality. The reference data can be text files (.txt) or genotype results (CHP). Genotypes that are not found in both files are excluded from the comparison, as well as genotypes reporting “NoCall” or “NotAvailable” for at least one of the two compared files.
The software generates a Concordance Report that includes sample concordance and marker concordance.
Table 4.11 Types of concordance checks
Concordance Check Description
Test genotype results (CHP)
vs.
Reference genotype results (CHP)
Compares the marker calls between a test and reference set of results (CHP). A test or reference set includes one or more CHP files.
Test genotype results (CHP)
vs.
Reference data (.txt)
Compares the marker calls between a group of results (one or more CHP files) and a set of reference text files (.txt). Reference data for the genomic and plasmid controls is available from Affymetrix.
Alternately, you can create your own reference text file by exporting genotype results in non-collated formats (for more details, see Exporting Genotype Results).
Note: A reference text file for a concordance check is tab-delimited and must have “ProbeSet ID” as the first column header and “Call” or “Consensus” as the second column header. Calls that are invalid for a marker’s Probe Set ID are ignored.
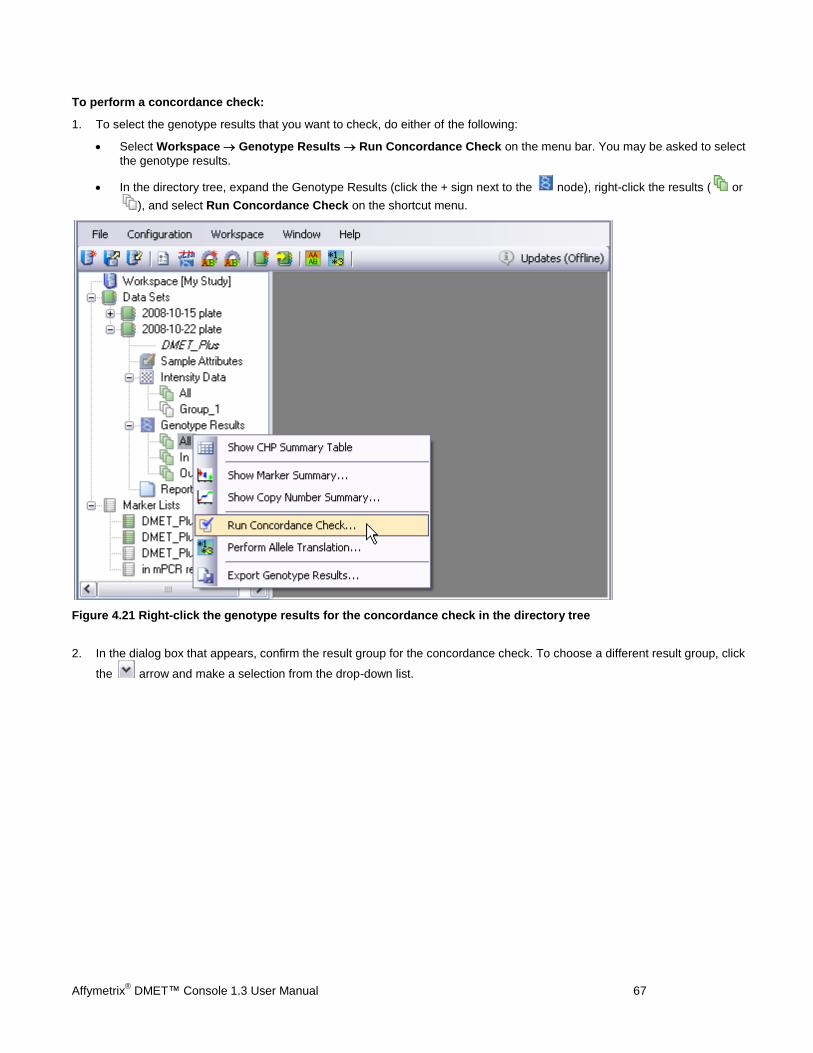
Affymetrix® DMET™ Console 1.3 User Manual 67
To perform a concordance check:
1. To select the genotype results that you want to check, do either of the following:
Select Workspace Genotype Results Run Concordance Check on the menu bar. You may be asked to select
the genotype results.
In the directory tree, expand the Genotype Results (click the + sign next to the node), right-click the results ( or
), and select Run Concordance Check on the shortcut menu.
Figure 4.21 Right-click the genotype results for the concordance check in the directory tree
2. In the dialog box that appears, confirm the result group for the concordance check. To choose a different result group, click
the arrow and make a selection from the drop-down list.
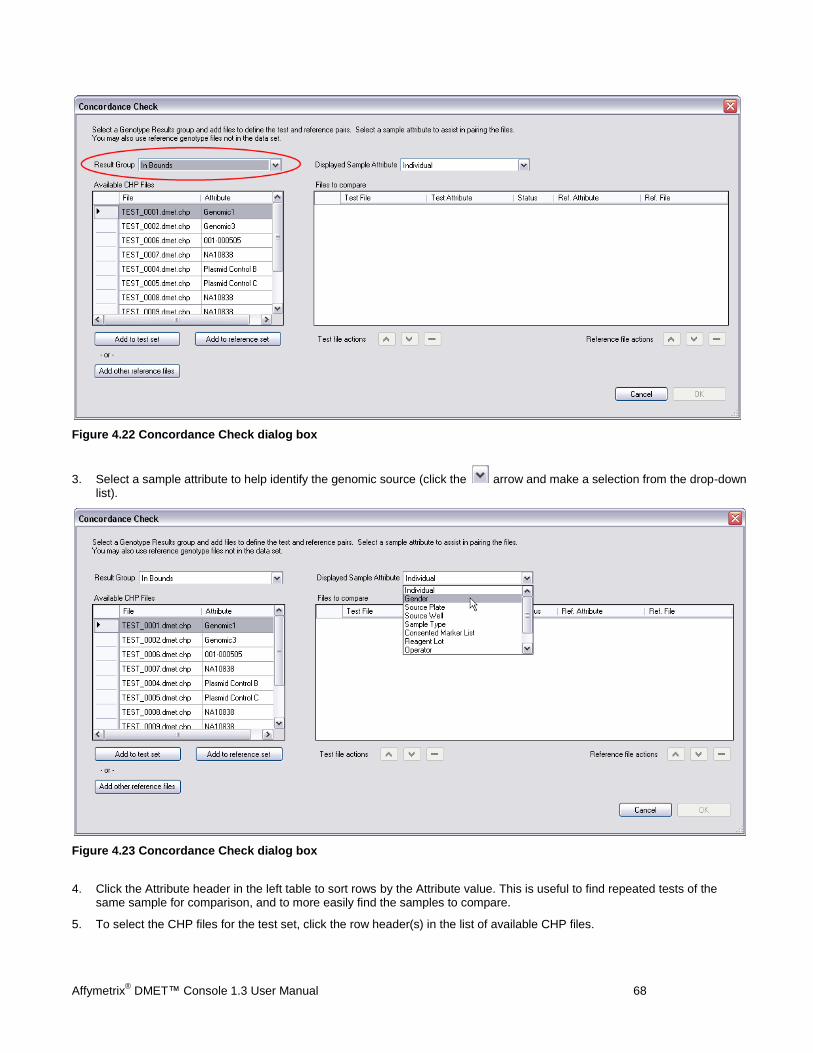
Affymetrix® DMET™ Console 1.3 User Manual 68
Figure 4.22 Concordance Check dialog box
3. Select a sample attribute to help identify the genomic source (click the arrow and make a selection from the drop-down list).
Figure 4.23 Concordance Check dialog box
4. Click the Attribute header in the left table to sort rows by the Attribute value. This is useful to find repeated tests of the same sample for comparison, and to more easily find the samples to compare.
5. To select the CHP files for the test set, click the row header(s) in the list of available CHP files.
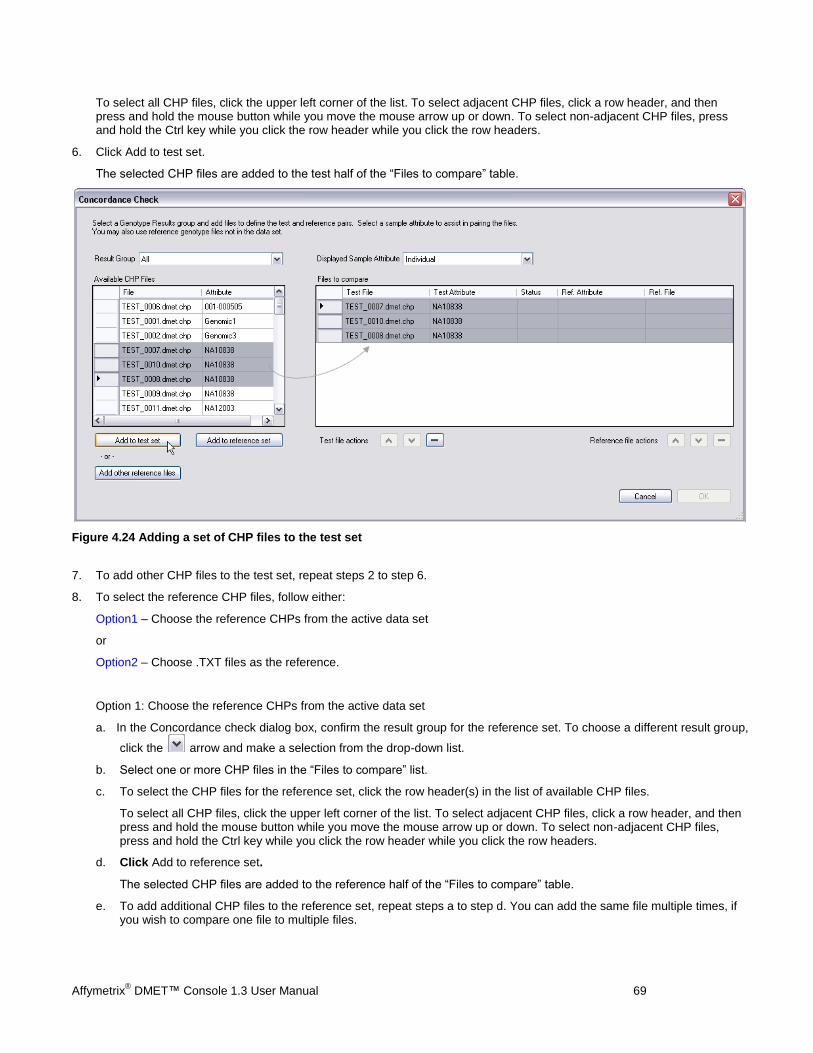
Affymetrix® DMET™ Console 1.3 User Manual 69
To select all CHP files, click the upper left corner of the list. To select adjacent CHP files, click a row header, and then press and hold the mouse button while you move the mouse arrow up or down. To select non-adjacent CHP files, press and hold the Ctrl key while you click the row header while you click the row headers.
6. Click Add to test set.
The selected CHP files are added to the test half of the “Files to compare” table.
Figure 4.24 Adding a set of CHP files to the test set
7. To add other CHP files to the test set, repeat steps 2 to step 6.
8. To select the reference CHP files, follow either:
Option1 – Choose the reference CHPs from the active data set
or
Option2 – Choose .TXT files as the reference.
Option 1: Choose the reference CHPs from the active data set
a. In the Concordance check dialog box, confirm the result group for the reference set. To choose a different result group,
click the arrow and make a selection from the drop-down list.
b. Select one or more CHP files in the “Files to compare” list.
c. To select the CHP files for the reference set, click the row header(s) in the list of available CHP files.
To select all CHP files, click the upper left corner of the list. To select adjacent CHP files, click a row header, and then press and hold the mouse button while you move the mouse arrow up or down. To select non-adjacent CHP files, press and hold the Ctrl key while you click the row header while you click the row headers.
d. Click Add to reference set.
The selected CHP files are added to the reference half of the “Files to compare” table.
e. To add additional CHP files to the reference set, repeat steps a to step d. You can add the same file multiple times, if you wish to compare one file to multiple files.
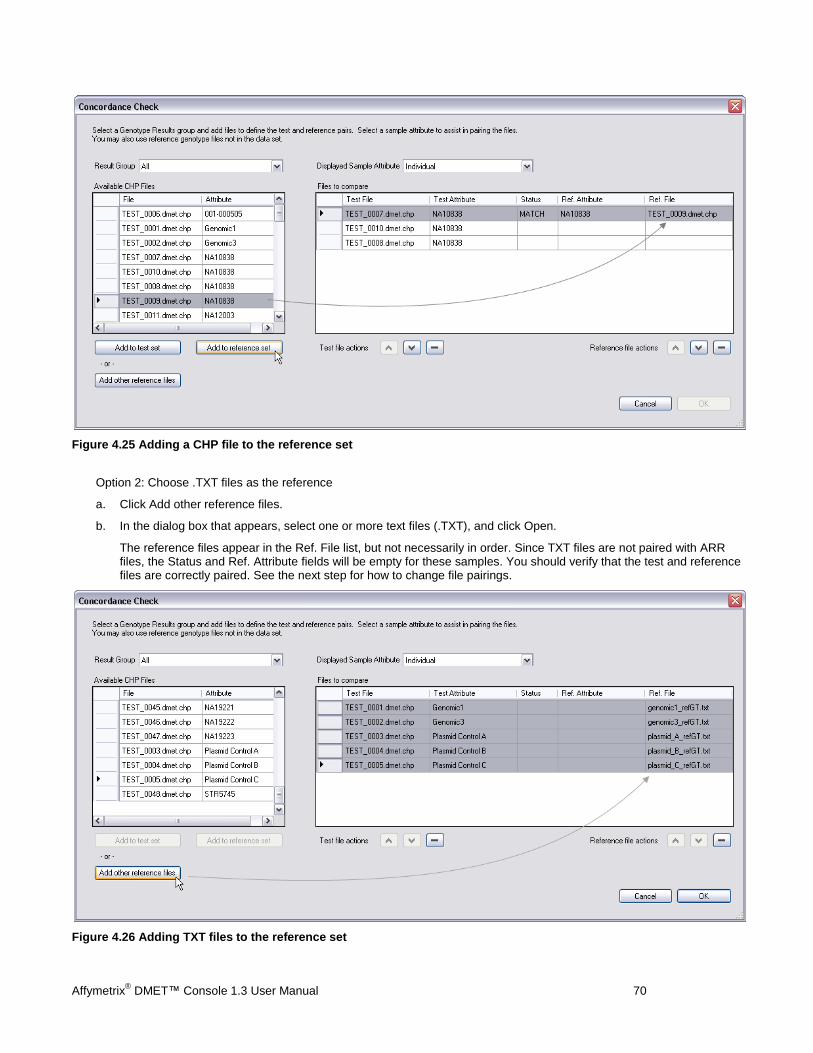
Affymetrix® DMET™ Console 1.3 User Manual 70
Figure 4.25 Adding a CHP file to the reference set
Option 2: Choose .TXT files as the reference
a. Click Add other reference files.
b. In the dialog box that appears, select one or more text files (.TXT), and click Open.
The reference files appear in the Ref. File list, but not necessarily in order. Since TXT files are not paired with ARR files, the Status and Ref. Attribute fields will be empty for these samples. You should verify that the test and reference files are correctly paired. See the next step for how to change file pairings.
Figure 4.26 Adding TXT files to the reference set
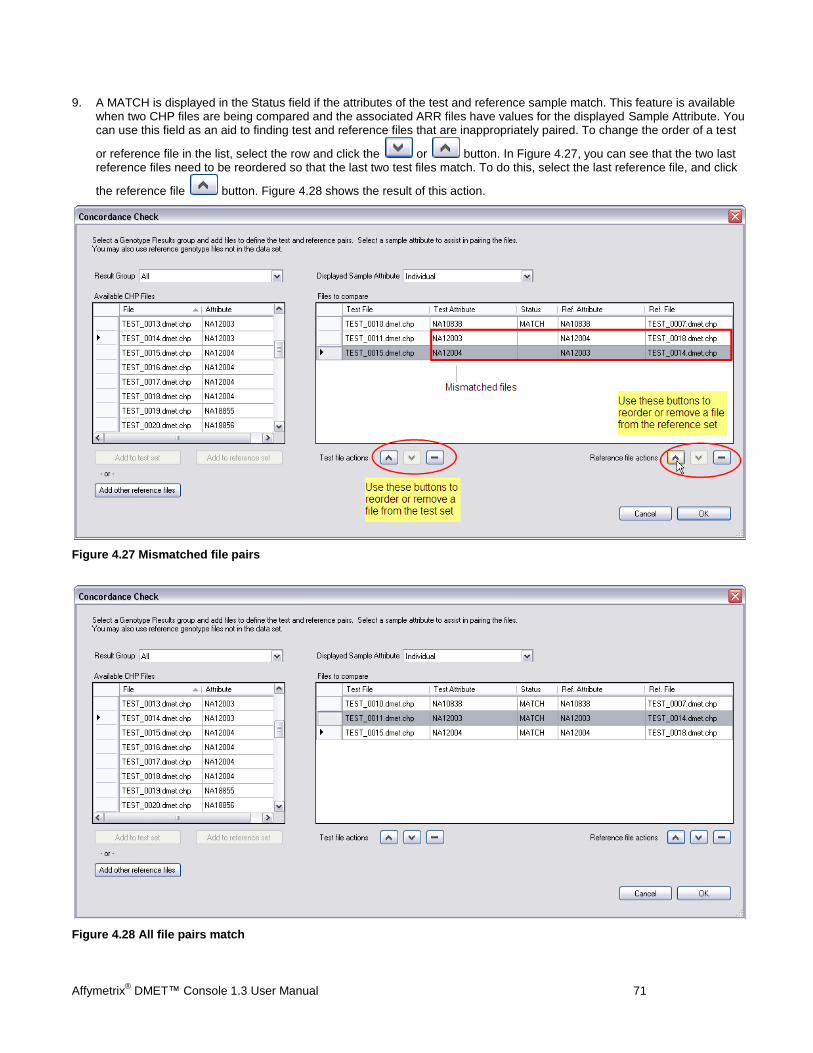
Affymetrix® DMET™ Console 1.3 User Manual 71
9. A MATCH is displayed in the Status field if the attributes of the test and reference sample match. This feature is available when two CHP files are being compared and the associated ARR files have values for the displayed Sample Attribute. You can use this field as an aid to finding test and reference files that are inappropriately paired. To change the order of a test
or reference file in the list, select the row and click the or button. In Figure 4.27, you can see that the two last reference files need to be reordered so that the last two test files match. To do this, select the last reference file, and click
the reference file button. Figure 4.28 shows the result of this action.
Figure 4.27 Mismatched file pairs
Figure 4.28 All file pairs match
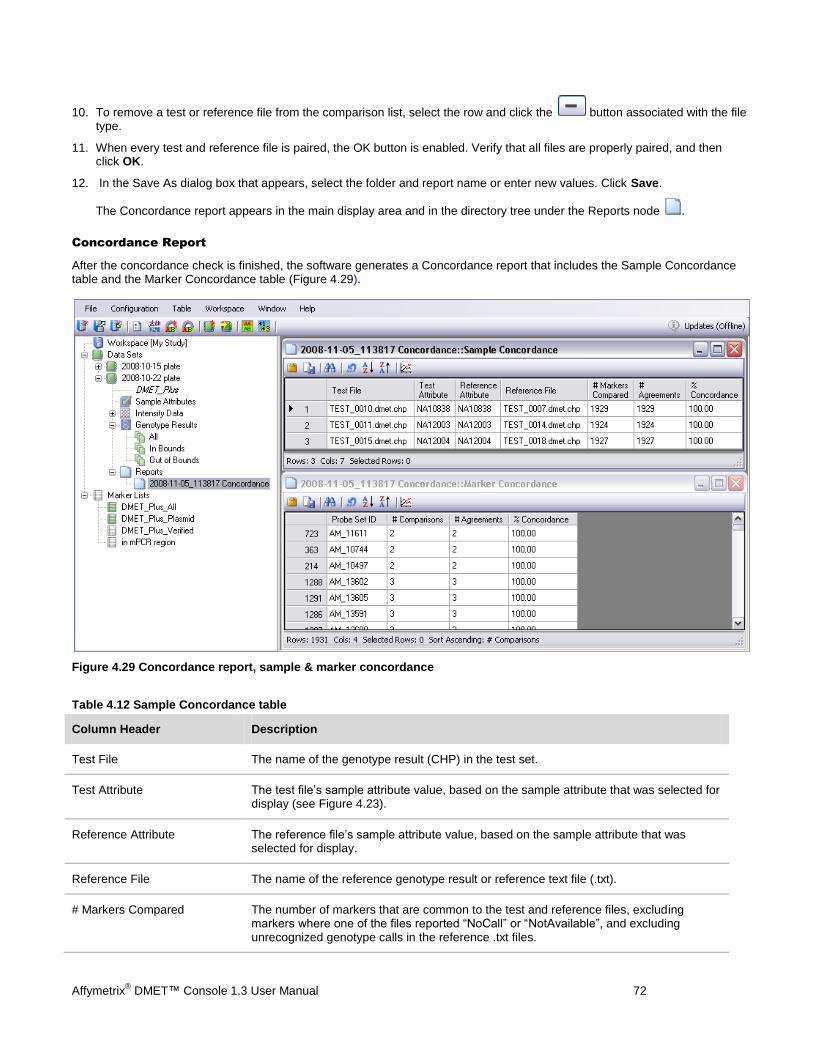
Affymetrix® DMET™ Console 1.3 User Manual 72
10. To remove a test or reference file from the comparison list, select the row and click the button associated with the file type.
11. When every test and reference file is paired, the OK button is enabled. Verify that all files are properly paired, and then click OK.
12. In the Save As dialog box that appears, select the folder and report name or enter new values. Click Save.
The Concordance report appears in the main display area and in the directory tree under the Reports node .
Concordance Report
After the concordance check is finished, the software generates a Concordance report that includes the Sample Concordance table and the Marker Concordance table (Figure 4.29).
Figure 4.29 Concordance report, sample & marker concordance
Table 4.12 Sample Concordance table
Column Header Description
Test File The name of the genotype result (CHP) in the test set.
Test Attribute The test file’s sample attribute value, based on the sample attribute that was selected for display (see Figure 4.23).
Reference Attribute The reference file’s sample attribute value, based on the sample attribute that was selected for display.
Reference File The name of the reference genotype result or reference text file (.txt).
# Markers Compared The number of markers that are common to the test and reference files, excluding markers where one of the files reported “NoCall” or “NotAvailable”, and excluding unrecognized genotype calls in the reference .txt files.
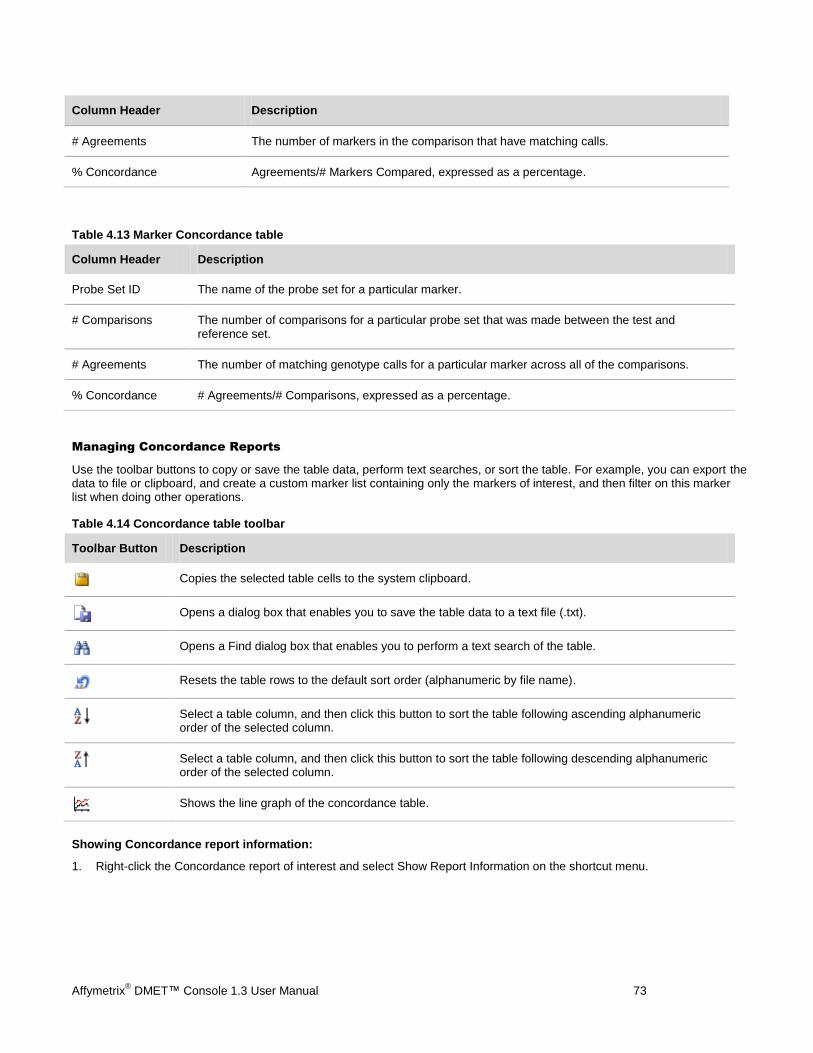
Affymetrix® DMET™ Console 1.3 User Manual 73
Column Header Description
# Agreements The number of markers in the comparison that have matching calls.
% Concordance Agreements/# Markers Compared, expressed as a percentage.
Table 4.13 Marker Concordance table
Column Header Description
Probe Set ID The name of the probe set for a particular marker.
# Comparisons The number of comparisons for a particular probe set that was made between the test and reference set.
# Agreements The number of matching genotype calls for a particular marker across all of the comparisons.
% Concordance # Agreements/# Comparisons, expressed as a percentage.
Managing Concordance Reports
Use the toolbar buttons to copy or save the table data, perform text searches, or sort the table. For example, you can export the data to file or clipboard, and create a custom marker list containing only the markers of interest, and then filter on this marker list when doing other operations.
Table 4.14 Concordance table toolbar
Toolbar Button Description
Copies the selected table cells to the system clipboard.
Opens a dialog box that enables you to save the table data to a text file (.txt).
Opens a Find dialog box that enables you to perform a text search of the table.
Resets the table rows to the default sort order (alphanumeric by file name).
Select a table column, and then click this button to sort the table following ascending alphanumeric order of the selected column.
Select a table column, and then click this button to sort the table following descending alphanumeric order of the selected column.
Shows the line graph of the concordance table.
Showing Concordance report information:
1. Right-click the Concordance report of interest and select Show Report Information on the shortcut menu.
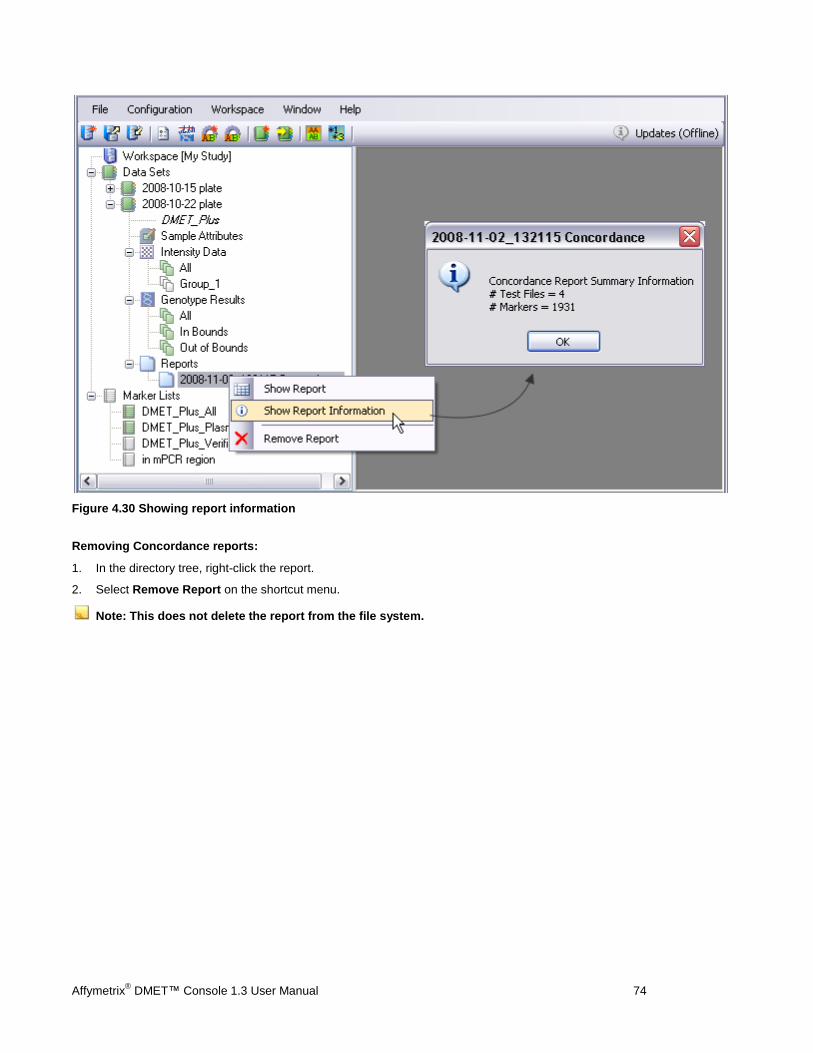
Affymetrix® DMET™ Console 1.3 User Manual 74
Figure 4.30 Showing report information
Removing Concordance reports:
1. In the directory tree, right-click the report.
2. Select Remove Report on the shortcut menu.
Note: This does not delete the report from the file system.
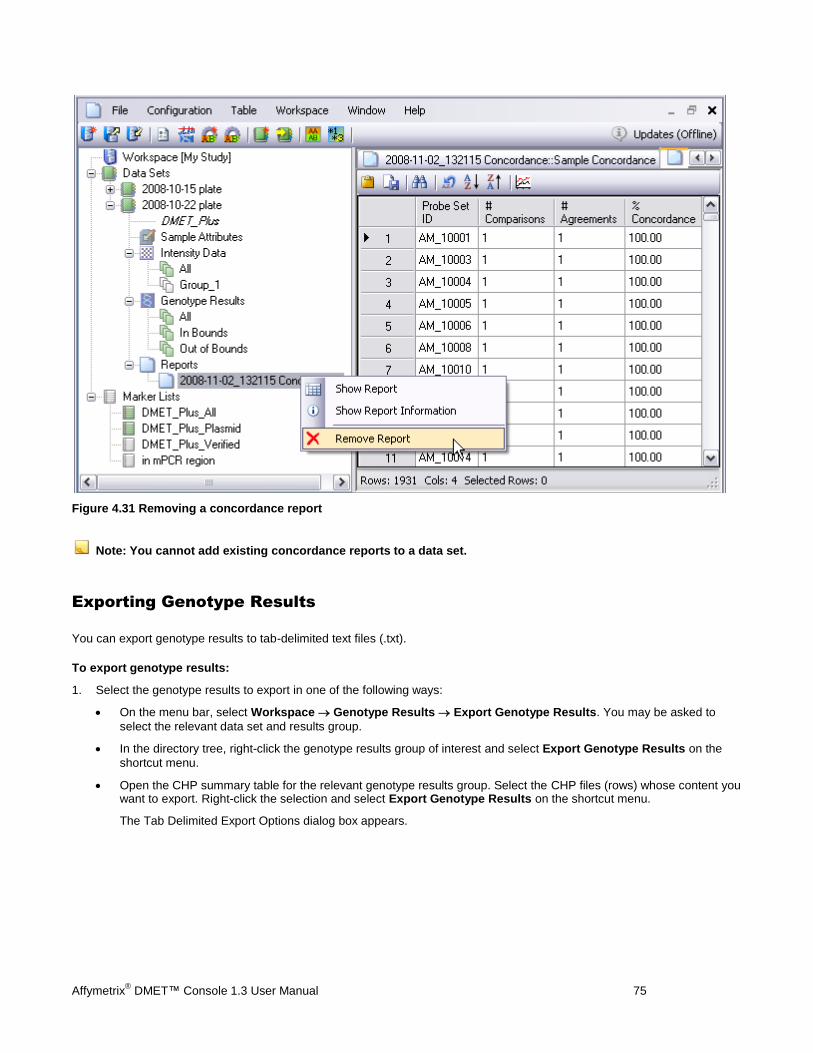
Affymetrix® DMET™ Console 1.3 User Manual 75
Figure 4.31 Removing a concordance report
Note: You cannot add existing concordance reports to a data set.
Exporting Genotype Results
You can export genotype results to tab-delimited text files (.txt).
To export genotype results:
1. Select the genotype results to export in one of the following ways:
On the menu bar, select Workspace Genotype Results Export Genotype Results. You may be asked to
select the relevant data set and results group.
In the directory tree, right-click the genotype results group of interest and select Export Genotype Results on the
shortcut menu.
Open the CHP summary table for the relevant genotype results group. Select the CHP files (rows) whose content you want to export. Right-click the selection and select Export Genotype Results on the shortcut menu.
The Tab Delimited Export Options dialog box appears.

Affymetrix® DMET™ Console 1.3 User Manual 76
Figure 4.32 CHP Summary table, exporting genotype results
Note: A warning dialog box will appear if you select a set of CHP files for export that belong to more than one dynamic boundary batch, or are from a mix of dynamic boundary and fixed boundary analyses.
2. To select a folder for the export:
a. Click the Browse button .
b. In the dialog box that appears, select a folder and click OK.

Affymetrix® DMET™ Console 1.3 User Manual 77
Figure 4.33 Browse dialog box
3. Select the export options and click OK.
Figure 4.34 Export options
Note: You will not be able to export data unless you have selected at least one data type to export (Export Genotype Results or Export Copy Number Results). Additionally, if you select the Collate Results option, you will also need to enter an Export File Name.
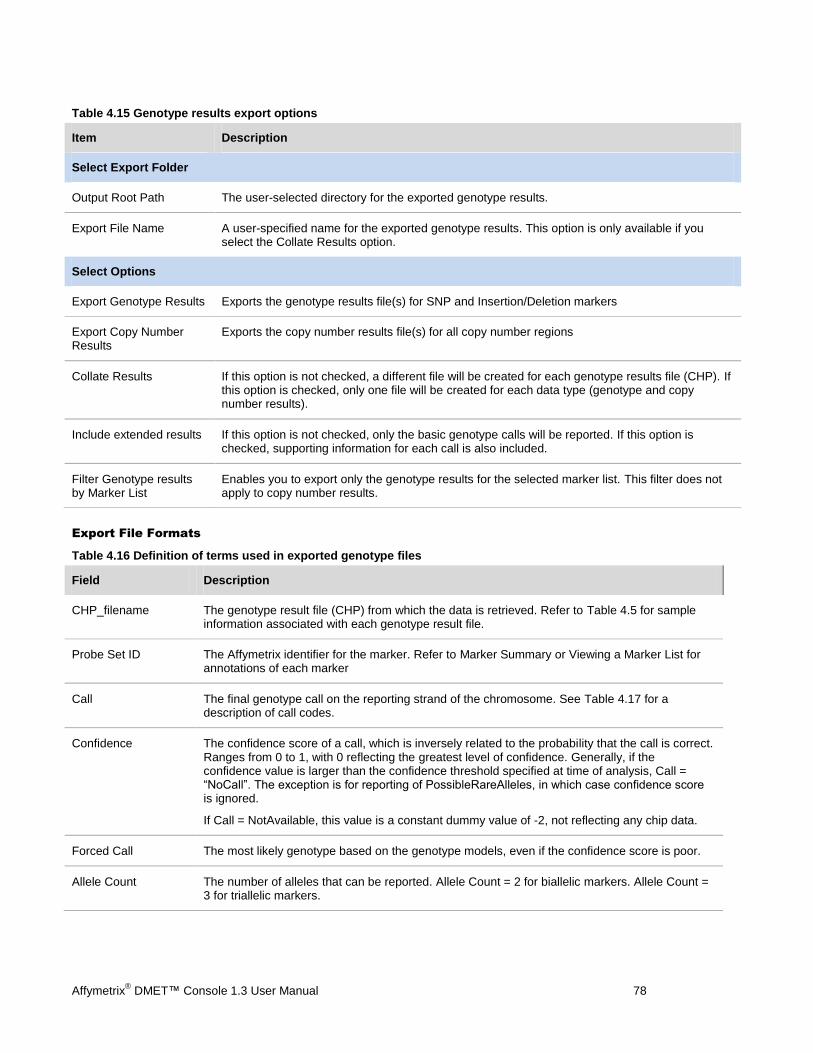
Affymetrix® DMET™ Console 1.3 User Manual 78
Table 4.15 Genotype results export options
Item Description
Select Export Folder
Output Root Path The user-selected directory for the exported genotype results.
Export File Name A user-specified name for the exported genotype results. This option is only available if you select the Collate Results option.
Select Options
Export Genotype Results Exports the genotype results file(s) for SNP and Insertion/Deletion markers
Export Copy Number Results
Exports the copy number results file(s) for all copy number regions
Collate Results If this option is not checked, a different file will be created for each genotype results file (CHP). If this option is checked, only one file will be created for each data type (genotype and copy number results).
Include extended results If this option is not checked, only the basic genotype calls will be reported. If this option is checked, supporting information for each call is also included.
Filter Genotype results by Marker List
Enables you to export only the genotype results for the selected marker list. This filter does not apply to copy number results.
Export File Formats
Table 4.16 Definition of terms used in exported genotype files
Field Description
CHP_filename The genotype result file (CHP) from which the data is retrieved. Refer to Table 4.5 for sample information associated with each genotype result file.
Probe Set ID The Affymetrix identifier for the marker. Refer to Marker Summary or Viewing a Marker List for annotations of each marker
Call The final genotype call on the reporting strand of the chromosome. See Table 4.17 for a description of call codes.
Confidence The confidence score of a call, which is inversely related to the probability that the call is correct. Ranges from 0 to 1, with 0 reflecting the greatest level of confidence. Generally, if the confidence value is larger than the confidence threshold specified at time of analysis, Call = “NoCall”. The exception is for reporting of PossibleRareAlleles, in which case confidence score is ignored.
If Call = NotAvailable, this value is a constant dummy value of -2, not reflecting any chip data.
Forced Call The most likely genotype based on the genotype models, even if the confidence score is poor.
Allele Count The number of alleles that can be reported. Allele Count = 2 for biallelic markers. Allele Count = 3 for triallelic markers.

Affymetrix® DMET™ Console 1.3 User Manual 79
Field Description
Signal A The summarized signal of the allele whose allele code is “A”. This signal is used as one of the inputs in the determination of the genotype call. Refer to the annotation file fields “Allele Code” and “Alleles Reported Strand” to map the allele codes to the allele names used in the Call and Forced Call fields.
If Call = NotAvailable, this value is a constant dummy value of -2, not reflecting any chip data.
Signal B, C, D, E, F See Signal A. Signal C will only be available for triallelic markers (markers having Allele Count = 3). Signals D-F are unused for DMET™ Plus array data.
Table 4.17 Genotype call descriptions
Call Type Description
X/X A call assuming two alleles exist, where allele X can be one or more or the following characters:
A: Adenine
C: Cytosine
G: Guanine
T: Thymine
…or X can be “-“, indicating a deletion of one or more bases.
X A call assuming one allele exists, where X can have the same values as described above.
ZeroCopyNumber When the copy number state of the region containing this marker is determined to be zero, this call is made.
NoCall Due to poor confidence in assigning the data to the most likely genotype, no call is attempted.
PossibleRareAllele Due to the data being assigned to a genotype rarely or never observed in the data set used to determine the genotype models, the assignment is less reliable. Therefore, this data is flagged as possibly being heterozygous or homozygous for the rare allele.
NotAvailable Genotype results for this marker for this sample are not available, since this marker was not in the Consented Marker List assigned to this sample at the time the genotype result files (CHP) were created, or cannot be genotyped. For example, most of the DMET_Plus markers are NotAvailable for plasmid controls, as synthetic DNA target for those markers does not exist in the plasmid control mixes.
Table 4.18 Copy number export file field descriptions
Copy Number Results Description
CHP_filename The genotype result file (CHP) from which the data is retrieved. Refer to Sample (CHP) Summary Table for sample information associated with each genotype result file.
Probe Set ID The Affymetrix identifier for the marker. Refer to Table 4.10 or Viewing a Marker List for annotations of each copy number region
CN Call The final predicted copy number state for this region, which is derived from CN_Force and CN Confidence. See Table 4.19 for a description of the call codes.
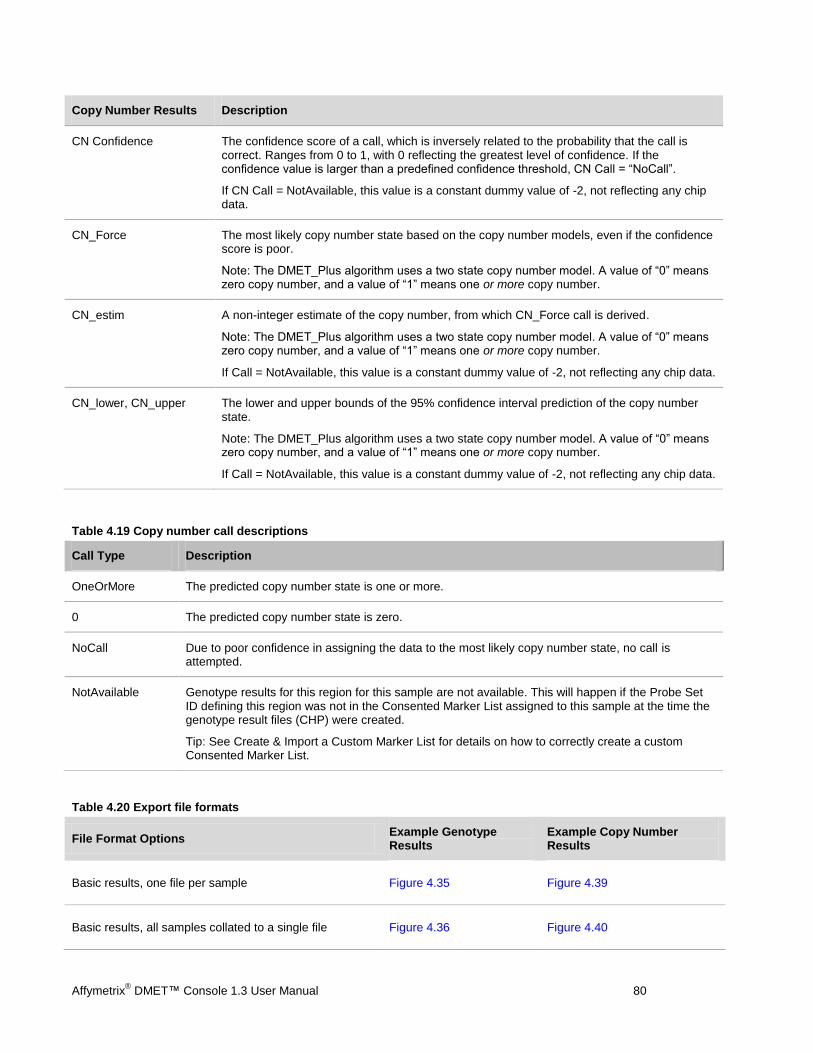
Affymetrix® DMET™ Console 1.3 User Manual 80
Copy Number Results Description
CN Confidence The confidence score of a call, which is inversely related to the probability that the call is correct. Ranges from 0 to 1, with 0 reflecting the greatest level of confidence. If the confidence value is larger than a predefined confidence threshold, CN Call = “NoCall”.
If CN Call = NotAvailable, this value is a constant dummy value of -2, not reflecting any chip data.
CN_Force The most likely copy number state based on the copy number models, even if the confidence score is poor.
Note: The DMET_Plus algorithm uses a two state copy number model. A value of “0” means zero copy number, and a value of “1” means one or more copy number.
CN_estim A non-integer estimate of the copy number, from which CN_Force call is derived.
Note: The DMET_Plus algorithm uses a two state copy number model. A value of “0” means zero copy number, and a value of “1” means one or more copy number.
If Call = NotAvailable, this value is a constant dummy value of -2, not reflecting any chip data.
CN_lower, CN_upper The lower and upper bounds of the 95% confidence interval prediction of the copy number state.
Note: The DMET_Plus algorithm uses a two state copy number model. A value of “0” means zero copy number, and a value of “1” means one or more copy number.
If Call = NotAvailable, this value is a constant dummy value of -2, not reflecting any chip data.
Table 4.19 Copy number call descriptions
Call Type Description
OneOrMore The predicted copy number state is one or more.
0 The predicted copy number state is zero.
NoCall Due to poor confidence in assigning the data to the most likely copy number state, no call is attempted.
NotAvailable Genotype results for this region for this sample are not available. This will happen if the Probe Set ID defining this region was not in the Consented Marker List assigned to this sample at the time the genotype result files (CHP) were created.
Tip: See Create & Import a Custom Marker List for details on how to correctly create a custom Consented Marker List.
Table 4.20 Export file formats
File Format Options Example Genotype Results
Example Copy Number Results
Basic results, one file per sample Figure 4.35 Figure 4.39
Basic results, all samples collated to a single file Figure 4.36 Figure 4.40
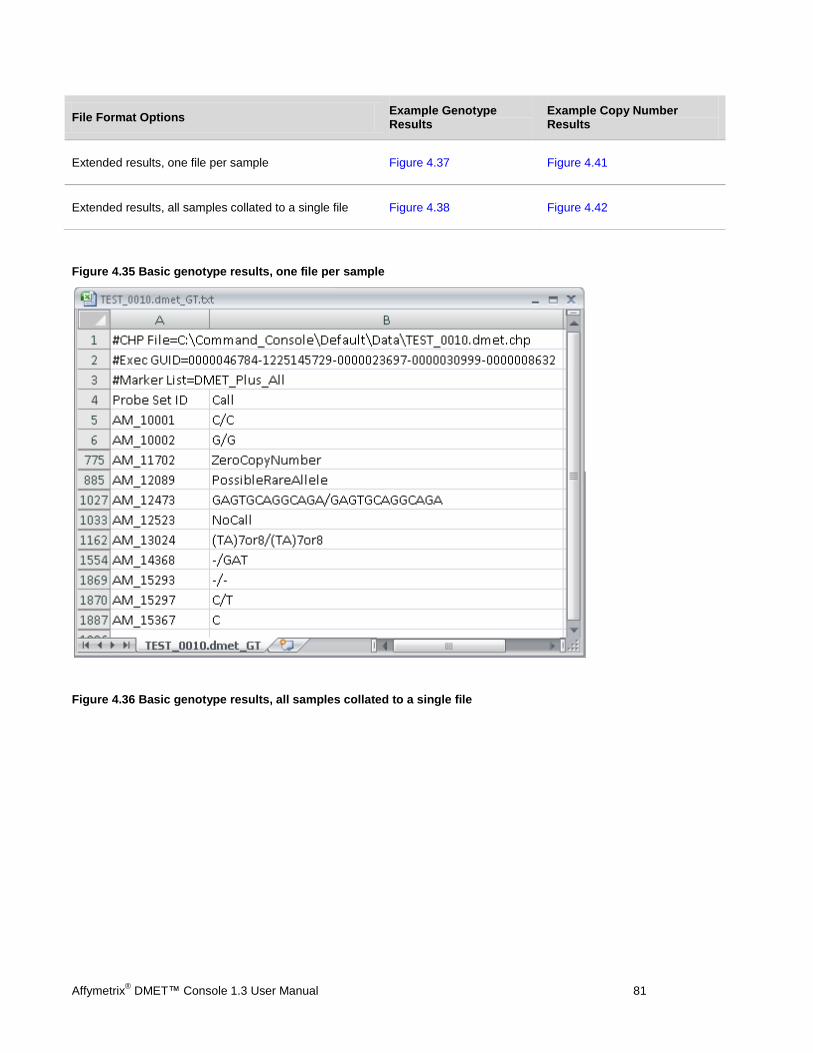
Affymetrix® DMET™ Console 1.3 User Manual 81
File Format Options Example Genotype Results
Example Copy Number Results
Extended results, one file per sample Figure 4.37 Figure 4.41
Extended results, all samples collated to a single file Figure 4.38 Figure 4.42
Figure 4.35 Basic genotype results, one file per sample
Figure 4.36 Basic genotype results, all samples collated to a single file
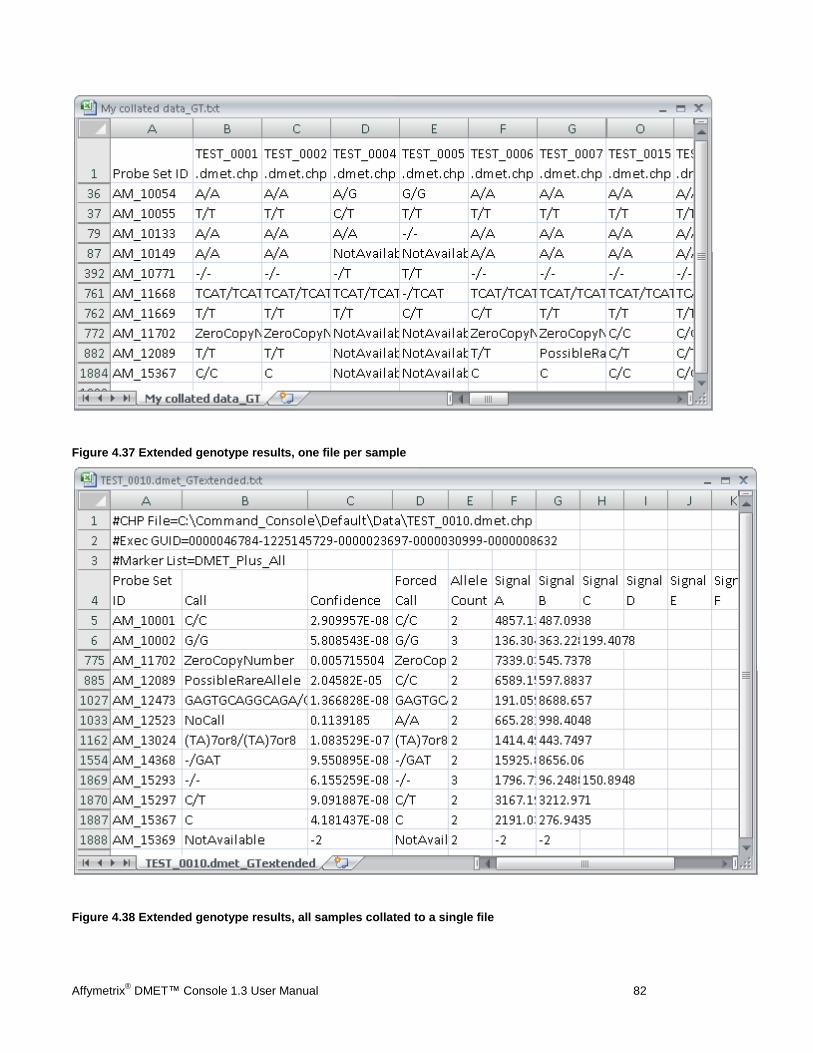
Affymetrix® DMET™ Console 1.3 User Manual 82
Figure 4.37 Extended genotype results, one file per sample
Figure 4.38 Extended genotype results, all samples collated to a single file

Affymetrix® DMET™ Console 1.3 User Manual 83
Figure 4.39 Basic copy number results, one file per sample
Figure 4.40 Basic copy number results, all samples collated to a single file
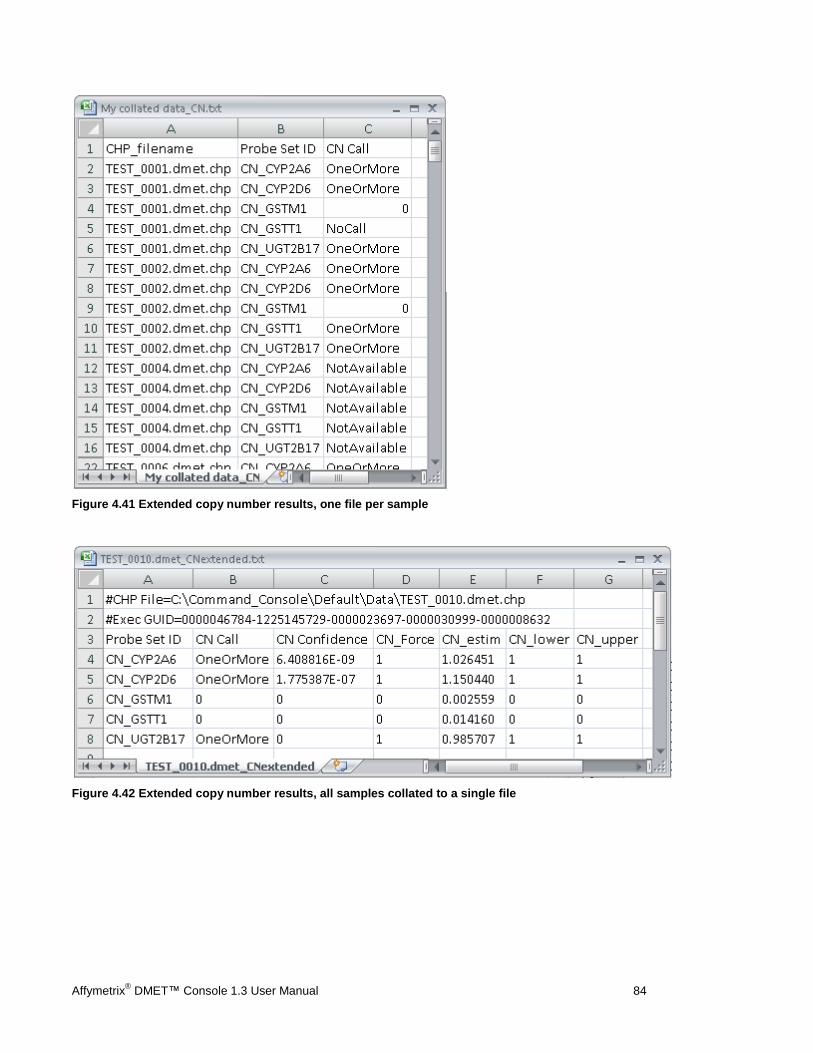
Affymetrix® DMET™ Console 1.3 User Manual 84
Figure 4.41 Extended copy number results, one file per sample
Figure 4.42 Extended copy number results, all samples collated to a single file
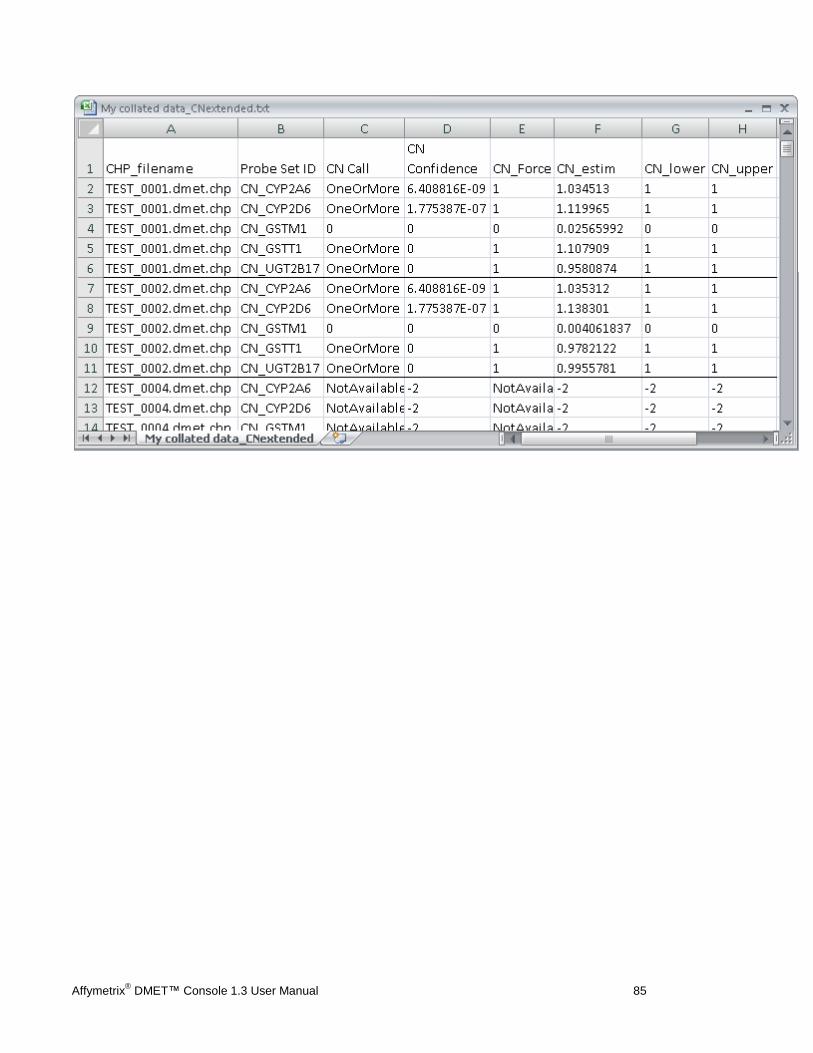
Affymetrix® DMET™ Console 1.3 User Manual 85

Affymetrix® DMET™ Console 1.3 User Manual 86
Chapter 5: Translation Analysis
About Translation
Performing Translations
Translation Reports
Performing Translation with Call Override
About Translation Analysis
The DMET™ Console software converts (translates) the genotype calls (reported in CHP files) of an important subset of markers to functional allele calls using standardized nomenclature wherever possible. The software enables you to:
Quickly identify possible rare alleles or missing data
Identify haplotype and probe-level sequence variation in the test samples relative to a standard reference sequence
Identify variation at other genes in the panel that impart functional or structural changes to the gene product
Annotate the reported genotypes across probes to indicate genomic, mRNA, or peptide changes resulting from any observed variation in the analyzed samples
Extract known functional or structural variants in a DMET profile to identify and summarize genes of potential altered activity
Predict general gene activity based on detected diplotypes
Integrate missing data into final study summary reports with the use of an Override Report
Both marker level and haplotype-based variants are annotated.
The University of Utah Genetic Science Learning Center website has a useful primer on haplotyping which provides excellent background for understanding allele translation: http://learn.genetics.utah.edu/units/pharma/phsnipping. Refer to Appendix A: About Allele Translation for more information.
Performing Translations
To perform only Phenotype Translation using a pre-existing comprehensive report:
Select Tools Metabolizer Phenotype Translation… on the menu bar.
In the file dialog that appears, select the comprehensive.rpt file from which you would like to generate a Phenotype Translation report.
To perform all translations using CHP files as input:
1. Do one of the following:
Click the toolbar button. You may be asked to select a data set and genotype results group.
Select Workspace Genotype Results Perform Translations on the menu bar. You may be asked to select a
data set and genotype results group.
In the directory tree, click the + sign to expand the data set of interest. Under the Genotype Results node , right-click the relevant results group, then select Perform Translations on the shortcut menu.
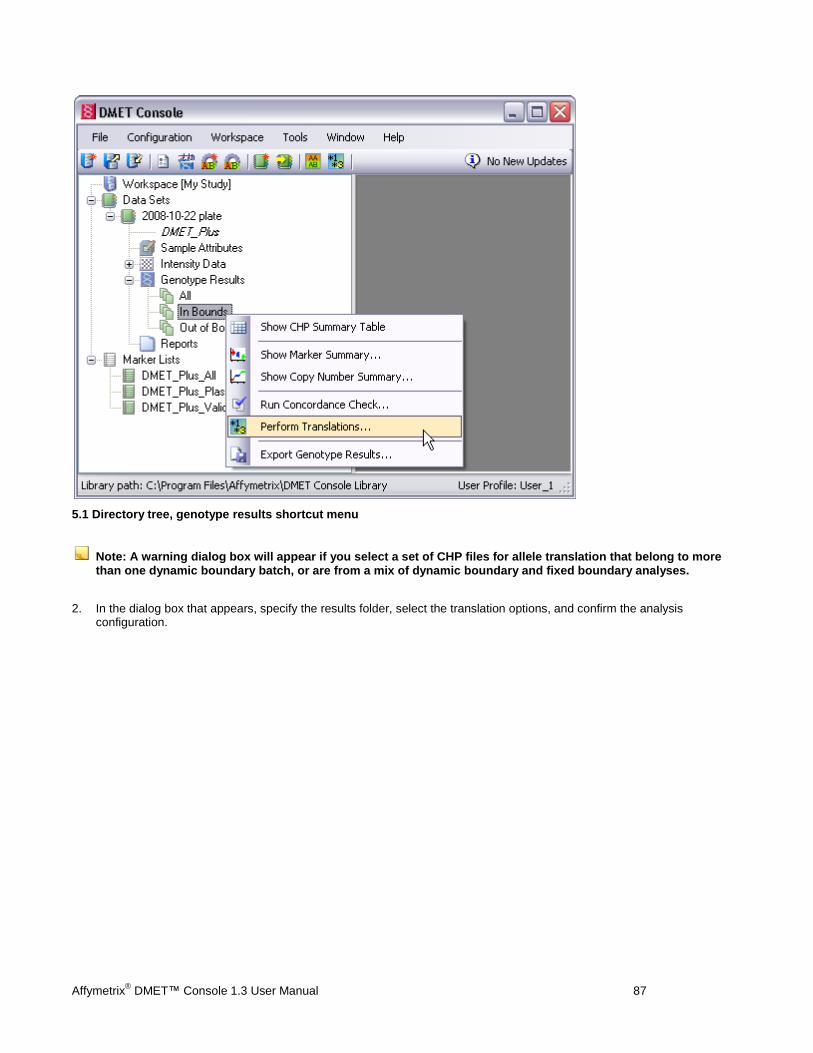
Affymetrix® DMET™ Console 1.3 User Manual 87
5.1 Directory tree, genotype results shortcut menu
Note: A warning dialog box will appear if you select a set of CHP files for allele translation that belong to more than one dynamic boundary batch, or are from a mix of dynamic boundary and fixed boundary analyses.
2. In the dialog box that appears, specify the results folder, select the translation options, and confirm the analysis configuration.
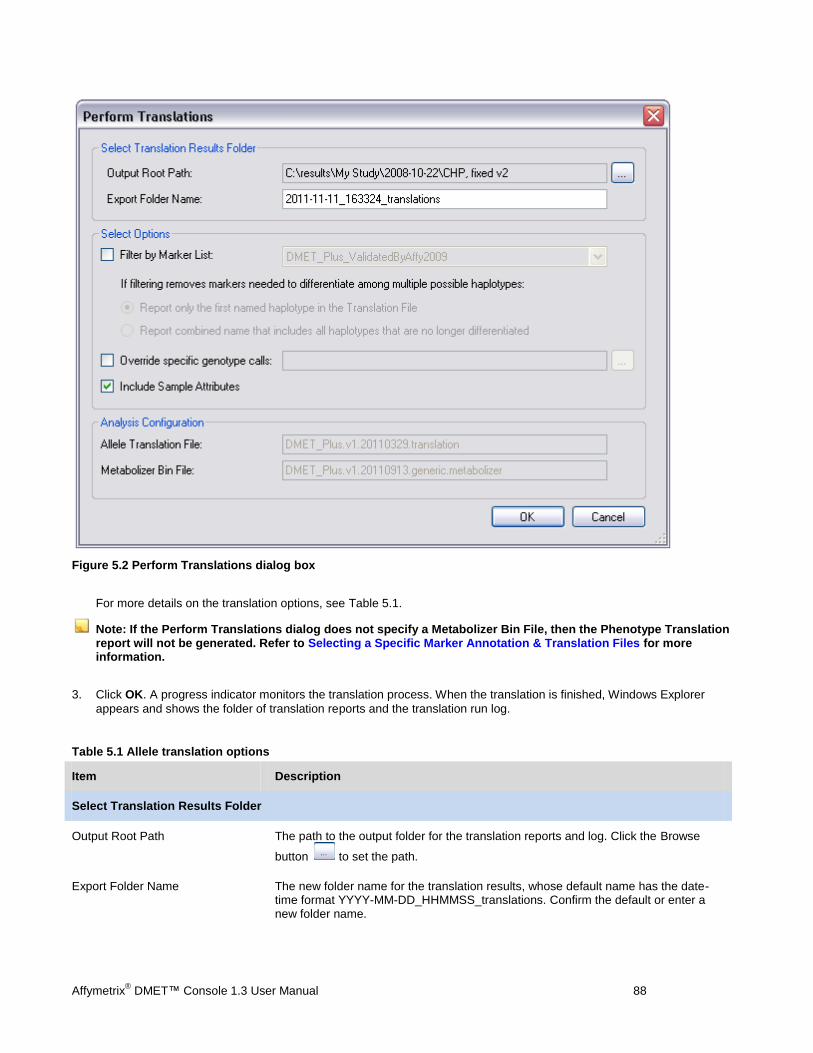
Affymetrix® DMET™ Console 1.3 User Manual 88
Figure 5.2 Perform Translations dialog box
For more details on the translation options, see Table 5.1.
Note: If the Perform Translations dialog does not specify a Metabolizer Bin File, then the Phenotype Translation report will not be generated. Refer to Selecting a Specific Marker Annotation & Translation Files for more information.
3. Click OK. A progress indicator monitors the translation process. When the translation is finished, Windows Explorer
appears and shows the folder of translation reports and the translation run log.
Table 5.1 Allele translation options
Item Description
Select Translation Results Folder
Output Root Path The path to the output folder for the translation reports and log. Click the Browse
button to set the path.
Export Folder Name The new folder name for the translation results, whose default name has the date-time format YYYY-MM-DD_HHMMSS_translations. Confirm the default or enter a new folder name.
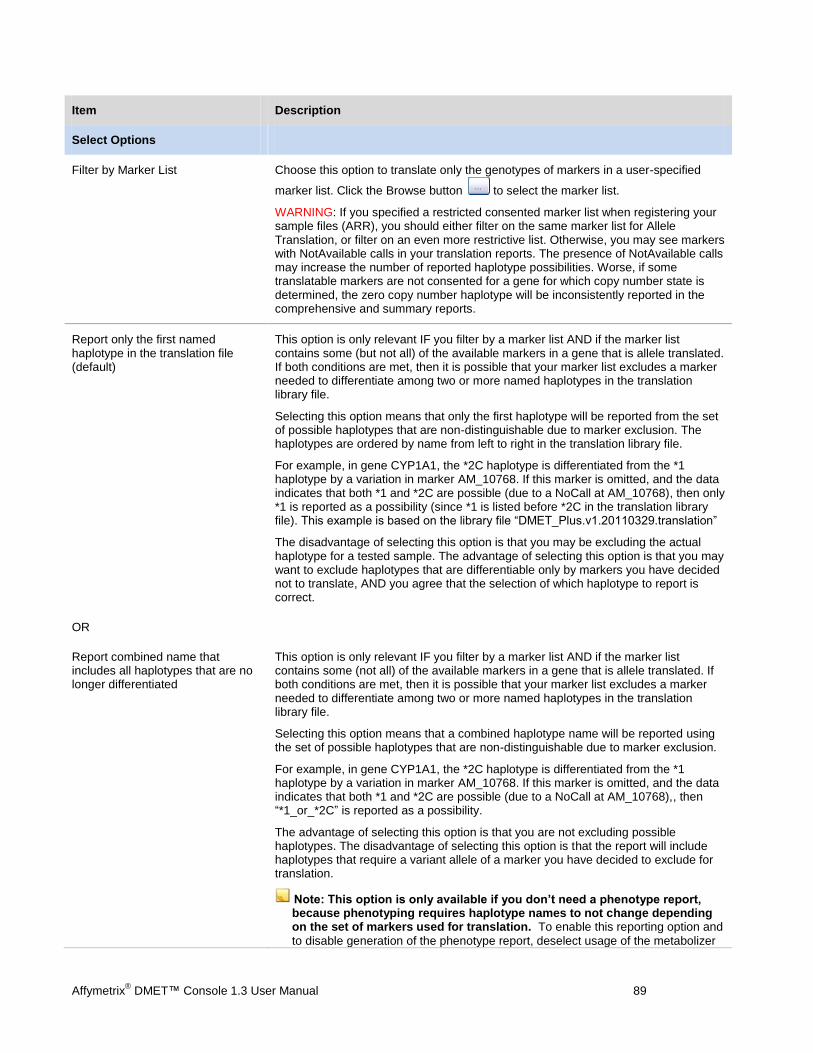
Affymetrix® DMET™ Console 1.3 User Manual 89
Item Description
Select Options
Filter by Marker List Choose this option to translate only the genotypes of markers in a user-specified
marker list. Click the Browse button to select the marker list.
WARNING: If you specified a restricted consented marker list when registering your sample files (ARR), you should either filter on the same marker list for Allele Translation, or filter on an even more restrictive list. Otherwise, you may see markers with NotAvailable calls in your translation reports. The presence of NotAvailable calls may increase the number of reported haplotype possibilities. Worse, if some translatable markers are not consented for a gene for which copy number state is determined, the zero copy number haplotype will be inconsistently reported in the comprehensive and summary reports.
Report only the first named haplotype in the translation file (default)
This option is only relevant IF you filter by a marker list AND if the marker list contains some (but not all) of the available markers in a gene that is allele translated. If both conditions are met, then it is possible that your marker list excludes a marker needed to differentiate among two or more named haplotypes in the translation library file.
Selecting this option means that only the first haplotype will be reported from the set of possible haplotypes that are non-distinguishable due to marker exclusion. The haplotypes are ordered by name from left to right in the translation library file.
For example, in gene CYP1A1, the *2C haplotype is differentiated from the *1 haplotype by a variation in marker AM_10768. If this marker is omitted, and the data indicates that both *1 and *2C are possible (due to a NoCall at AM_10768), then only *1 is reported as a possibility (since *1 is listed before *2C in the translation library file). This example is based on the library file “DMET_Plus.v1.20110329.translation”
The disadvantage of selecting this option is that you may be excluding the actual haplotype for a tested sample. The advantage of selecting this option is that you may want to exclude haplotypes that are differentiable only by markers you have decided not to translate, AND you agree that the selection of which haplotype to report is correct.
OR
Report combined name that includes all haplotypes that are no longer differentiated
This option is only relevant IF you filter by a marker list AND if the marker list contains some (not all) of the available markers in a gene that is allele translated. If both conditions are met, then it is possible that your marker list excludes a marker needed to differentiate among two or more named haplotypes in the translation library file.
Selecting this option means that a combined haplotype name will be reported using the set of possible haplotypes that are non-distinguishable due to marker exclusion.
For example, in gene CYP1A1, the *2C haplotype is differentiated from the *1 haplotype by a variation in marker AM_10768. If this marker is omitted, and the data indicates that both *1 and *2C are possible (due to a NoCall at AM_10768),, then “*1_or_*2C” is reported as a possibility.
The advantage of selecting this option is that you are not excluding possible haplotypes. The disadvantage of selecting this option is that the report will include haplotypes that require a variant allele of a marker you have decided to exclude for translation.
Note: This option is only available if you don’t need a phenotype report, because phenotyping requires haplotype names to not change depending on the set of markers used for translation. To enable this reporting option and
to disable generation of the phenotype report, deselect usage of the metabolizer

Affymetrix® DMET™ Console 1.3 User Manual 90
Item Description
library file. To do this, click the Reset button to the right of the selected Metabolizer Bin File Name, from the Configuration menu > Options > Translations.
Override specific genotype calls
Choose this option to select an Override file that has genotype calls to be used instead of the original calls in the supplied CHP files. A copy of the uncalled report (*_uncalled.rpt file) produced by Allele Translation can be edited with new “Basecalls” and used as an override file.
Include Sample Attributes Choose this option to include sample attributes from the .ARR files in the translation reports.
Translation Reports
DMET™ Console generates a number of files:
Comprehensive Translation report – Displays one row per translated marker for each CHP. Provides information on each marker in additional to haplotype calls.
Summary Translation report – An abbreviated version of the Comprehensive report, which displays at least one row for every translated gene for each CHP file. Also includes rows for every genotype where the translation identifies a variant call. Also includes rows listing markers with missing data. In the summary report only, if no markers responsible for functional changes report a variant allele, then information for those markers is replaced with a comment to this effect. If a copy number state of zero is indicated, then information for markers in that gene is replaced with a comment to this effect, and the copy number haplotype code is reported in the Known Call field.
Phenotype Translation report – Displays one row per phenotyped gene for each CHP, based on the diplotypes from the source Comprehensive Translation report
Uncalled report – A list of NoCall, PossibleRareAllele, and NotAvailable genotype calls from markers used for translation. This report is useful for:
- Identifying samples for follow up genotyping
- Creating an override file so that missing data can be “filled in” for subsequent translation reports
MD5 report – An electronic signature that can be used to verify that the comprehensive and phenotype reports have not been modified. Interested users can contact [email protected] for information on accessing tools to verify the integrity of the translation results files.
Log file – A running list of messages generated by the software as the data is processed. This file is useful for troubleshooting errors.
Translation Report Organization
The simplified diagram in Figure 5.3 shows how data are organized in the Comprehensive and Summary Translation reports.
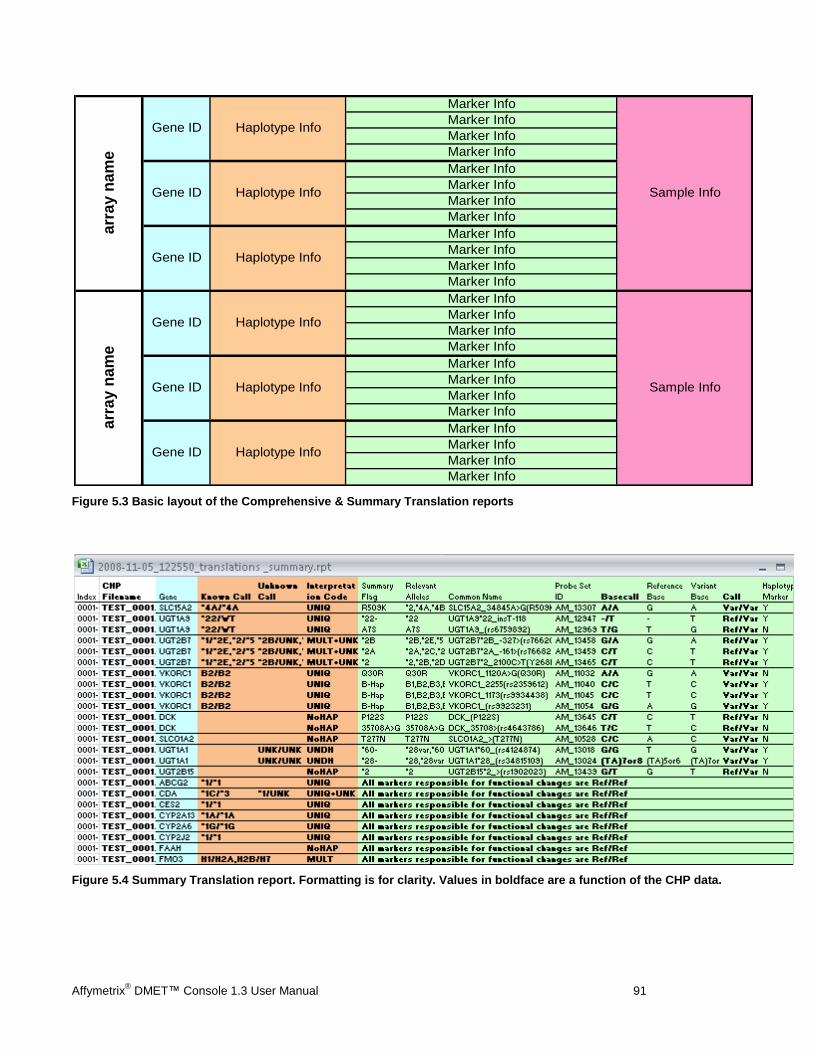
Affymetrix® DMET™ Console 1.3 User Manual 91
Figure 5.3 Basic layout of the Comprehensive & Summary Translation reports
Figure 5.4 Summary Translation report. Formatting is for clarity. Values in boldface are a function of the CHP data.
Marker Info
Marker Info
Marker Info
Marker Info
Sample Info
Marker Info
Marker Info
Marker Info
Marker Info
arr
ay
na
me
arr
ay
na
me
Gene ID Haplotype Info
Gene ID Haplotype Info
Gene ID Haplotype Info
Marker Info
Marker Info
Marker Info
Marker Info
Gene ID Haplotype Info
Marker Info
Marker Info
Marker Info
Marker Info
Sample Info
Marker Info
Marker Info
Marker Info
Marker Info
Gene ID Haplotype Info
Gene ID Haplotype Info
Marker Info
Marker Info
Marker Info
Marker Info
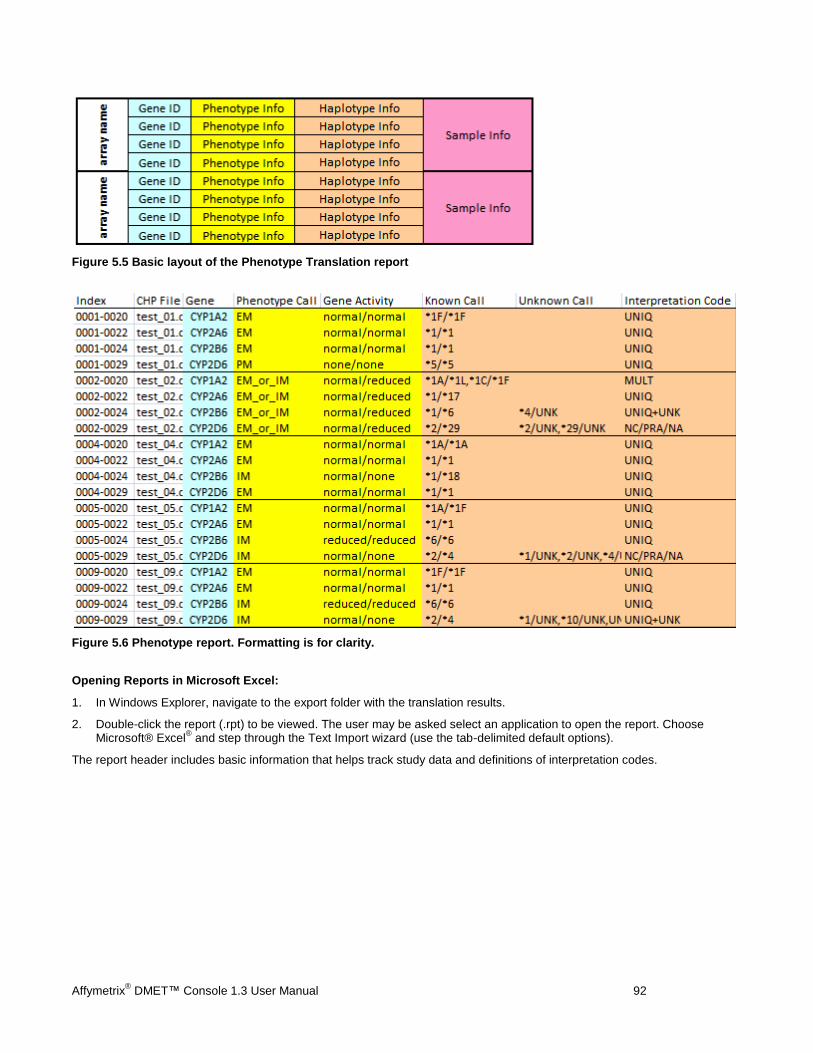
Affymetrix® DMET™ Console 1.3 User Manual 92
Figure 5.5 Basic layout of the Phenotype Translation report
Figure 5.6 Phenotype report. Formatting is for clarity.
Opening Reports in Microsoft Excel:
1. In Windows Explorer, navigate to the export folder with the translation results.
2. Double-click the report (.rpt) to be viewed. The user may be asked select an application to open the report. Choose Microsoft® Excel
® and step through the Text Import wizard (use the tab-delimited default options).
The report header includes basic information that helps track study data and definitions of interpretation codes.

Affymetrix® DMET™ Console 1.3 User Manual 93
Figure 5.7 Header for Comprehensive and Summary reports
Table 5.2 shows the fields in the Array portion of the translation reports.
Table 5.2 Array tracking fields in the reports
Item Description
Index A row index in the format: [CHP index]-[gene index within CHP]-[Probe Set ID index within gene]. This field can be parsed for sorting or row filtering. For the phenotype report, the index is shortened to [CHP index]-[gene index within CHP]
CHP Filename Name of the CHP file.
Table 5.3 explains the gene-specific fields in the translation reports.
Note: Haplotypes are not reported for genes whose Interpretation Code is NoHap. The fields described in Table 5.3 will therefore be empty for these genes. The exception is if the gene reports a double gene deletion, in which case the associated haplotype names are reported.
Table 5.3 Gene-specific field definitions
Item Description
Associated Gene Gene symbol
Phenotype Call In the Phenotype report, the predicted phenotype given the supplied Known Call diplotypes. Multiple comma-separated phenotypes are reported when multiple Known Call diplotypes are associated with different phenotypes. Most genes use the following terminology when Affymetrix’s metabolizer library file is selected:
UM: ultrarapid metabolizer
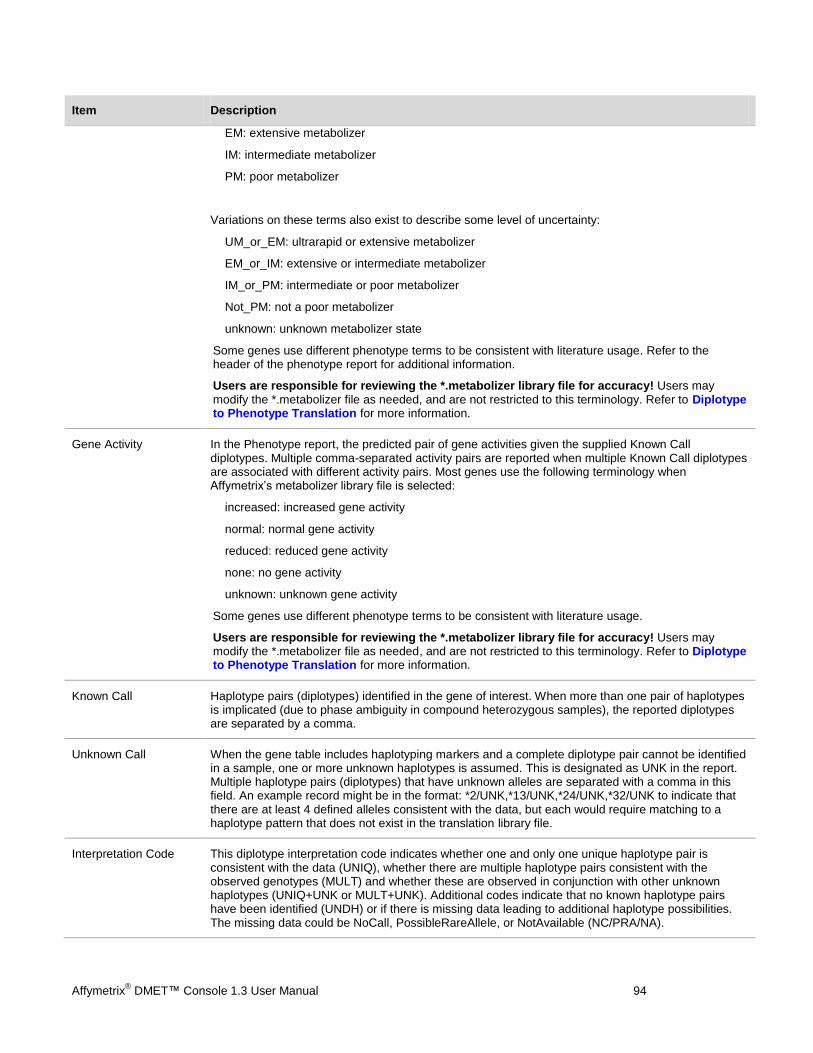
Affymetrix® DMET™ Console 1.3 User Manual 94
Item Description
EM: extensive metabolizer
IM: intermediate metabolizer
PM: poor metabolizer
Variations on these terms also exist to describe some level of uncertainty:
UM_or_EM: ultrarapid or extensive metabolizer
EM_or_IM: extensive or intermediate metabolizer
IM_or_PM: intermediate or poor metabolizer
Not_PM: not a poor metabolizer
unknown: unknown metabolizer state
Some genes use different phenotype terms to be consistent with literature usage. Refer to the header of the phenotype report for additional information.
Users are responsible for reviewing the *.metabolizer library file for accuracy! Users may modify the *.metabolizer file as needed, and are not restricted to this terminology. Refer to Diplotype to Phenotype Translation for more information.
Gene Activity In the Phenotype report, the predicted pair of gene activities given the supplied Known Call diplotypes. Multiple comma-separated activity pairs are reported when multiple Known Call diplotypes are associated with different activity pairs. Most genes use the following terminology when Affymetrix’s metabolizer library file is selected:
increased: increased gene activity
normal: normal gene activity
reduced: reduced gene activity
none: no gene activity
unknown: unknown gene activity
Some genes use different phenotype terms to be consistent with literature usage.
Users are responsible for reviewing the *.metabolizer library file for accuracy! Users may modify the *.metabolizer file as needed, and are not restricted to this terminology. Refer to Diplotype to Phenotype Translation for more information.
Known Call Haplotype pairs (diplotypes) identified in the gene of interest. When more than one pair of haplotypes is implicated (due to phase ambiguity in compound heterozygous samples), the reported diplotypes are separated by a comma.
Unknown Call When the gene table includes haplotyping markers and a complete diplotype pair cannot be identified in a sample, one or more unknown haplotypes is assumed. This is designated as UNK in the report. Multiple haplotype pairs (diplotypes) that have unknown alleles are separated with a comma in this field. An example record might be in the format: *2/UNK,*13/UNK,*24/UNK,*32/UNK to indicate that there are at least 4 defined alleles consistent with the data, but each would require matching to a haplotype pattern that does not exist in the translation library file.
Interpretation Code This diplotype interpretation code indicates whether one and only one unique haplotype pair is consistent with the data (UNIQ), whether there are multiple haplotype pairs consistent with the observed genotypes (MULT) and whether these are observed in conjunction with other unknown haplotypes (UNIQ+UNK or MULT+UNK). Additional codes indicate that no known haplotype pairs have been identified (UNDH) or if there is missing data leading to additional haplotype possibilities. The missing data could be NoCall, PossibleRareAllele, or NotAvailable (NC/PRA/NA).
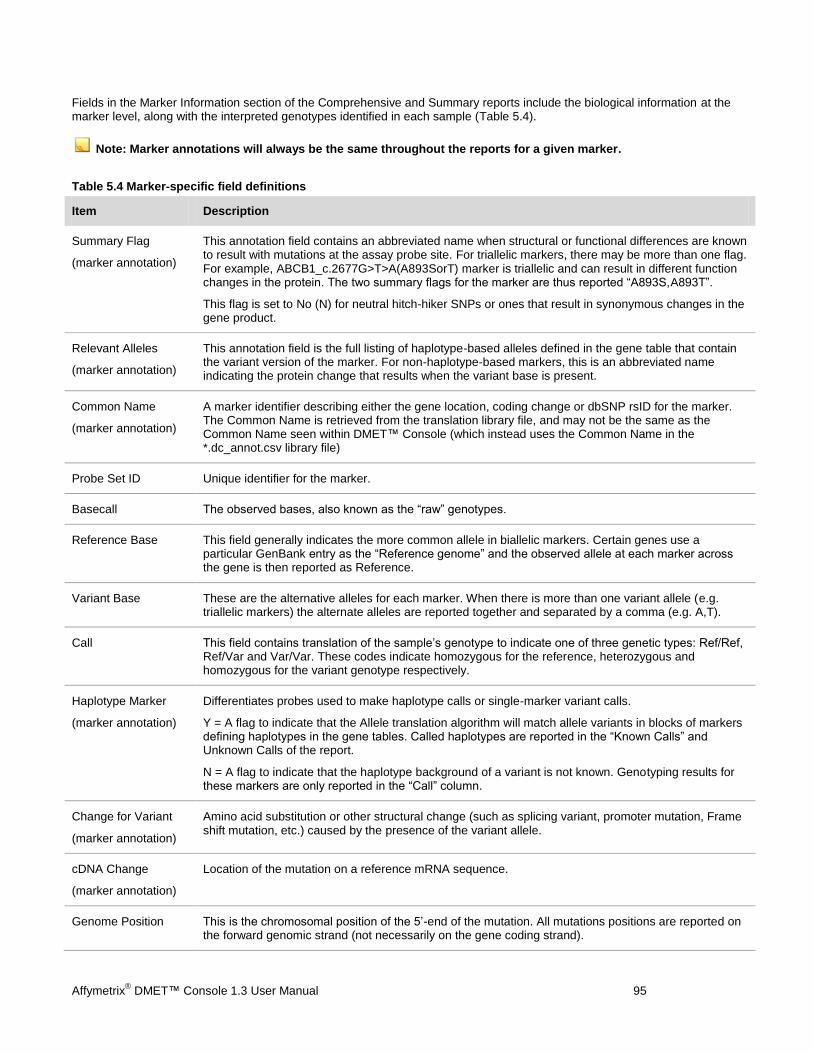
Affymetrix® DMET™ Console 1.3 User Manual 95
Fields in the Marker Information section of the Comprehensive and Summary reports include the biological information at the marker level, along with the interpreted genotypes identified in each sample (Table 5.4).
Note: Marker annotations will always be the same throughout the reports for a given marker.
Table 5.4 Marker-specific field definitions
Item Description
Summary Flag
(marker annotation)
This annotation field contains an abbreviated name when structural or functional differences are known to result with mutations at the assay probe site. For triallelic markers, there may be more than one flag. For example, ABCB1_c.2677G>T>A(A893SorT) marker is triallelic and can result in different function changes in the protein. The two summary flags for the marker are thus reported “A893S,A893T”.
This flag is set to No (N) for neutral hitch-hiker SNPs or ones that result in synonymous changes in the gene product.
Relevant Alleles
(marker annotation)
This annotation field is the full listing of haplotype-based alleles defined in the gene table that contain the variant version of the marker. For non-haplotype-based markers, this is an abbreviated name indicating the protein change that results when the variant base is present.
Common Name
(marker annotation)
A marker identifier describing either the gene location, coding change or dbSNP rsID for the marker. The Common Name is retrieved from the translation library file, and may not be the same as the Common Name seen within DMET™ Console (which instead uses the Common Name in the *.dc_annot.csv library file)
Probe Set ID Unique identifier for the marker.
Basecall The observed bases, also known as the “raw” genotypes.
Reference Base This field generally indicates the more common allele in biallelic markers. Certain genes use a particular GenBank entry as the “Reference genome” and the observed allele at each marker across the gene is then reported as Reference.
Variant Base These are the alternative alleles for each marker. When there is more than one variant allele (e.g. triallelic markers) the alternate alleles are reported together and separated by a comma (e.g. A,T).
Call This field contains translation of the sample’s genotype to indicate one of three genetic types: Ref/Ref, Ref/Var and Var/Var. These codes indicate homozygous for the reference, heterozygous and homozygous for the variant genotype respectively.
Haplotype Marker
(marker annotation)
Differentiates probes used to make haplotype calls or single-marker variant calls.
Y = A flag to indicate that the Allele translation algorithm will match allele variants in blocks of markers defining haplotypes in the gene tables. Called haplotypes are reported in the “Known Calls” and Unknown Calls of the report.
N = A flag to indicate that the haplotype background of a variant is not known. Genotyping results for these markers are only reported in the “Call” column.
Change for Variant
(marker annotation)
Amino acid substitution or other structural change (such as splicing variant, promoter mutation, Frame shift mutation, etc.) caused by the presence of the variant allele.
cDNA Change
(marker annotation)
Location of the mutation on a reference mRNA sequence.
Genome Position This is the chromosomal position of the 5’-end of the mutation. All mutations positions are reported on the forward genomic strand (not necessarily on the gene coding strand).

Affymetrix® DMET™ Console 1.3 User Manual 96
Item Description
(marker annotation)
dbSNP RS ID
(marker annotation)
The dbSNP identifier for the marker.
Fields for tracking genotyping changes made by the user (Table 5.5) are recorded in the Change Tracking portion of the translation reports (located immediately before the User Defined Sample Information section of the report).
Table 5.5 Fields for tracking external genotype calls that are replaced via an Override report
Item Description
Original Basecall This field reports the genotype in the CHP file. The field is not empty when an override file supplies a valid genotype.
Override Comment User-specified text that can be used for basic audit tracking of the override genotyping calls. For example, reference genotyping methods, laboratory notebook position or other interpretative information can be entered into the Comment field in the Override.txt file, and this information will be added to the translation reports.
These two columns contain information only if you have selected to convert a missing data report into an override report for replacing specific CHP genotypes in the translation reports. This offers a basic audit trail for combining external genotyping results with the CHP genotype calls.
Sample Information fields are user-defined. Example uses of this portion of the translation reports include the fields shown in Table 5.6.
Table 5.6 Example user-defined sample annotation fields
Item Description
Individual User-specified name of the analyzed sample.
Sample Type Used to indicate whether the DNA is a Plasmid sample (only a subset of the DMET™ Plus markers are analyzed), a Control DNA or Sample (test DNA).
Consented Marker List
A flag to indicate whether the marker is to be included in DMET™ Plus genotyping. Non-consented markers are flagged and reported NotAvailable in output reports.
Condition Text field that can be used to annotate clinical group (case/control, responder/non-responder) or to store quantitative trait information on samples for downstream analysis. These data (all fields beyond the Override Comment field are included in translation output.
Protocol Version Optional field for tracking laboratory variables such as the assay protocol used or run dates.
Group This attribute could be used to differentiate Responder vs. non-responder class, gender, treatment group or other test variable that users may want to correlate to translate calls.
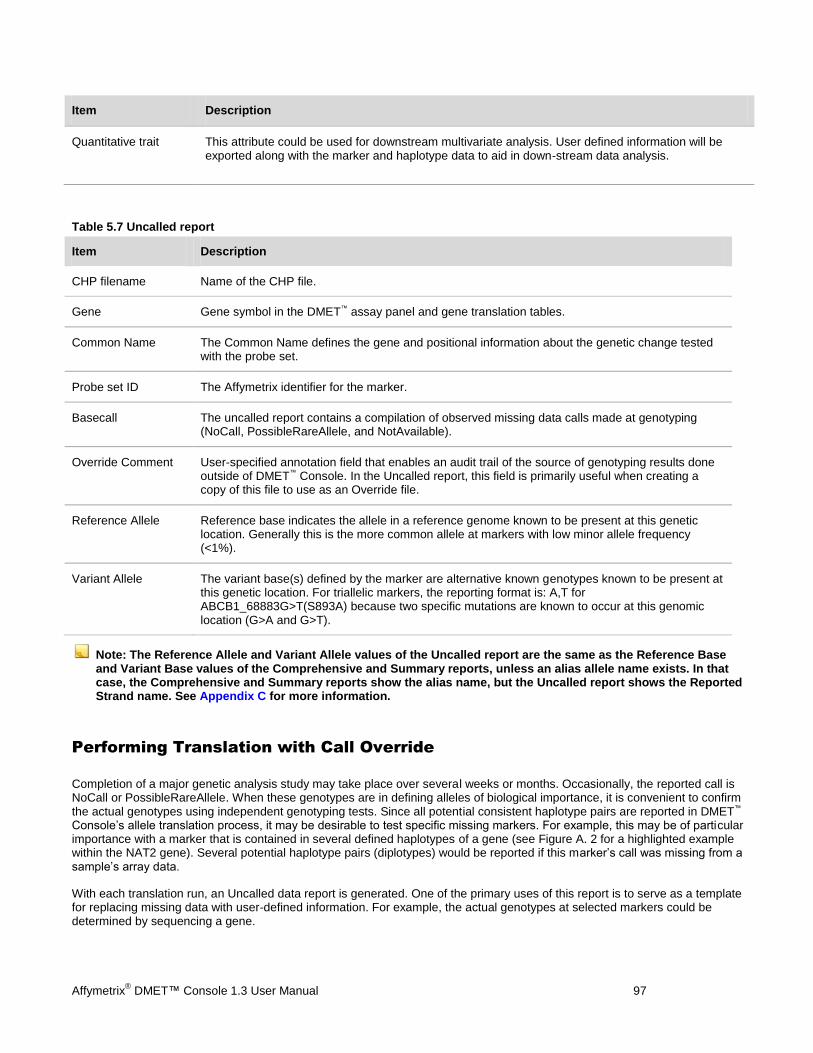
Affymetrix® DMET™ Console 1.3 User Manual 97
Item Description
Quantitative trait This attribute could be used for downstream multivariate analysis. User defined information will be exported along with the marker and haplotype data to aid in down-stream data analysis.
Table 5.7 Uncalled report
Item Description
CHP filename Name of the CHP file.
Gene Gene symbol in the DMET™ assay panel and gene translation tables.
Common Name The Common Name defines the gene and positional information about the genetic change tested with the probe set.
Probe set ID The Affymetrix identifier for the marker.
Basecall The uncalled report contains a compilation of observed missing data calls made at genotyping (NoCall, PossibleRareAllele, and NotAvailable).
Override Comment User-specified annotation field that enables an audit trail of the source of genotyping results done outside of DMET™ Console. In the Uncalled report, this field is primarily useful when creating a copy of this file to use as an Override file.
Reference Allele Reference base indicates the allele in a reference genome known to be present at this genetic location. Generally this is the more common allele at markers with low minor allele frequency (<1%).
Variant Allele The variant base(s) defined by the marker are alternative known genotypes known to be present at this genetic location. For triallelic markers, the reporting format is: A,T for ABCB1_68883G>T(S893A) because two specific mutations are known to occur at this genomic location (G>A and G>T).
Note: The Reference Allele and Variant Allele values of the Uncalled report are the same as the Reference Base and Variant Base values of the Comprehensive and Summary reports, unless an alias allele name exists. In that case, the Comprehensive and Summary reports show the alias name, but the Uncalled report shows the Reported Strand name. See Appendix C for more information.
Performing Translation with Call Override
Completion of a major genetic analysis study may take place over several weeks or months. Occasionally, the reported call is NoCall or PossibleRareAllele. When these genotypes are in defining alleles of biological importance, it is convenient to confirm the actual genotypes using independent genotyping tests. Since all potential consistent haplotype pairs are reported in DMET™ Console’s allele translation process, it may be desirable to test specific missing markers. For example, this may be of particular importance with a marker that is contained in several defined haplotypes of a gene (see Figure A. 2 for a highlighted example within the NAT2 gene). Several potential haplotype pairs (diplotypes) would be reported if this marker’s call was missing from a sample’s array data.
With each translation run, an Uncalled data report is generated. One of the primary uses of this report is to serve as a template for replacing missing data with user-defined information. For example, the actual genotypes at selected markers could be determined by sequencing a gene.
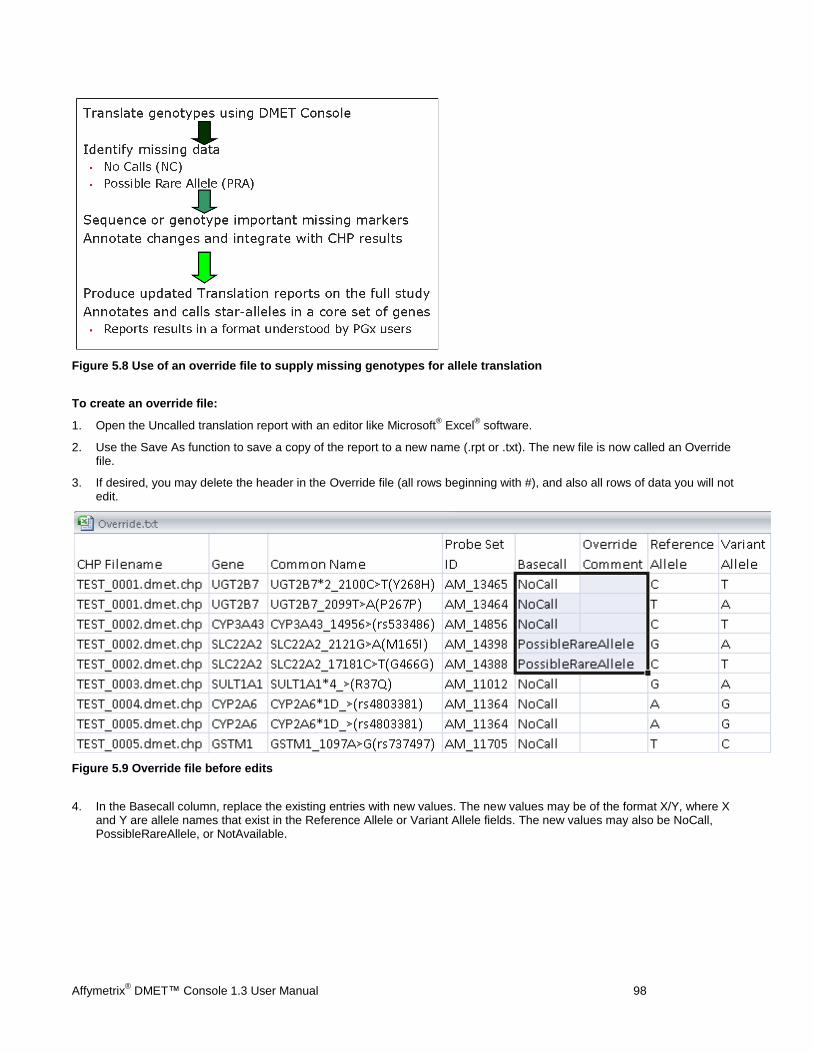
Affymetrix® DMET™ Console 1.3 User Manual 98
Figure 5.8 Use of an override file to supply missing genotypes for allele translation
To create an override file:
1. Open the Uncalled translation report with an editor like Microsoft® Excel
® software.
2. Use the Save As function to save a copy of the report to a new name (.rpt or .txt). The new file is now called an Override file.
3. If desired, you may delete the header in the Override file (all rows beginning with #), and also all rows of data you will not edit.
Figure 5.9 Override file before edits
4. In the Basecall column, replace the existing entries with new values. The new values may be of the format X/Y, where X and Y are allele names that exist in the Reference Allele or Variant Allele fields. The new values may also be NoCall, PossibleRareAllele, or NotAvailable.

Affymetrix® DMET™ Console 1.3 User Manual 99
Figure 5.10 Override file after edits
5. Optionally, add annotation information for tracking the source of the external genotyping results (for example, DNA sequencing, Taqman, manual call).
6. Save the report.
Note: Each row of override file must have valid values in every one of the fields, or the row is ignored when the file is read as part of Allele Translation.
To perform translation with override:
1. Follow step 1 to step 2 from Performing Translation.
2. In the Perform Translations dialog box, choose the “Override specific genotype calls” option and click the Browse button
.

Affymetrix® DMET™ Console 1.3 User Manual 100
Figure 5.11 Performing allele translation with override
3. In the dialog box that appears, select the override file (.rpt or .txt) and click Open.
4. Click OK in the Perform Translations dialog box.
5. In the Comprehensive and Summary reports, the override genotypes, original CHP genotypes, and override comments can be found as follows:
Information Shown in the…
Override genotypes Basecall field
Original CHP genotypes Original Basecall field
Override comments Override Comment field
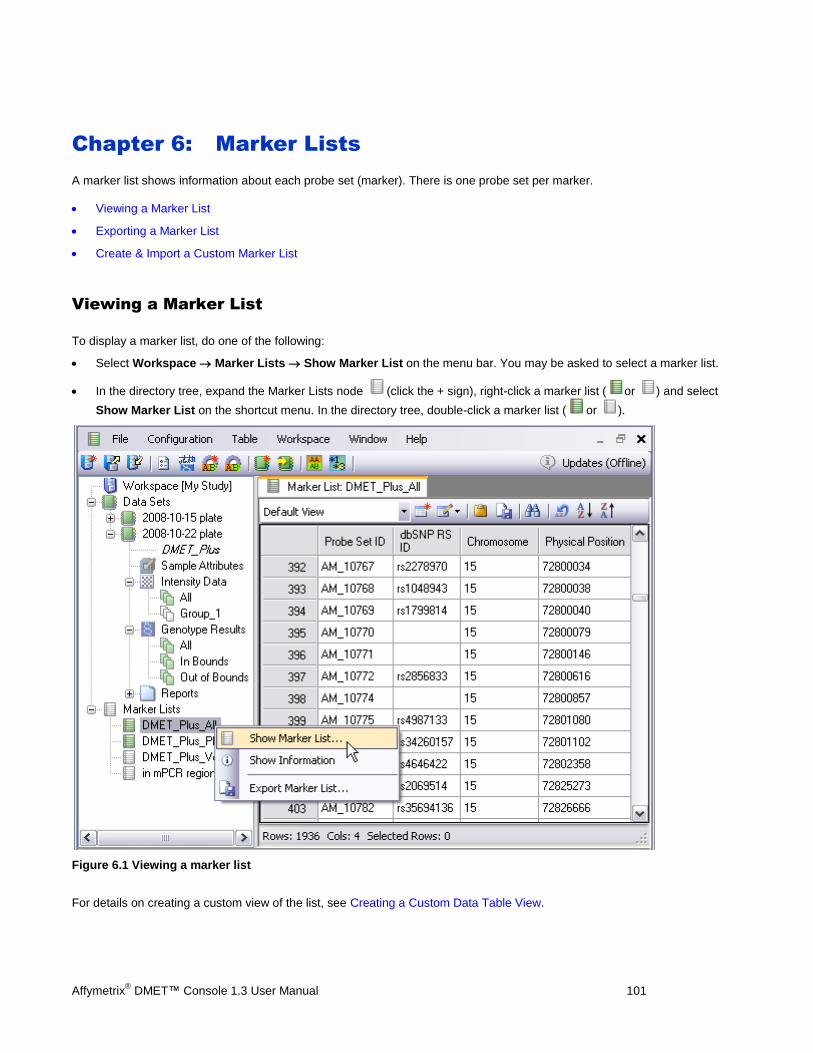
Affymetrix® DMET™ Console 1.3 User Manual 101
Chapter 6: Marker Lists
A marker list shows information about each probe set (marker). There is one probe set per marker.
Viewing a Marker List
Exporting a Marker List
Create & Import a Custom Marker List
Viewing a Marker List
To display a marker list, do one of the following:
Select Workspace Marker Lists Show Marker List on the menu bar. You may be asked to select a marker list.
In the directory tree, expand the Marker Lists node (click the + sign), right-click a marker list ( or ) and select
Show Marker List on the shortcut menu. In the directory tree, double-click a marker list ( or ).
Figure 6.1 Viewing a marker list
For details on creating a custom view of the list, see Creating a Custom Data Table View.
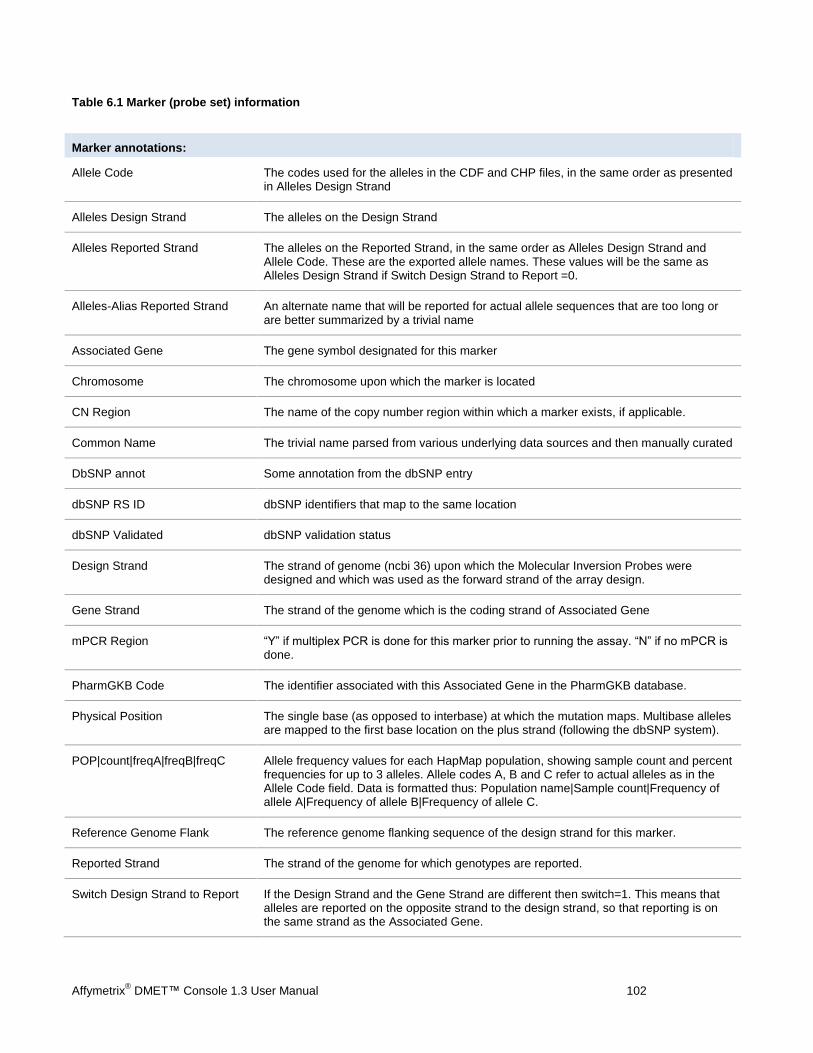
Affymetrix® DMET™ Console 1.3 User Manual 102
Table 6.1 Marker (probe set) information
Marker annotations:
Allele Code The codes used for the alleles in the CDF and CHP files, in the same order as presented in Alleles Design Strand
Alleles Design Strand The alleles on the Design Strand
Alleles Reported Strand The alleles on the Reported Strand, in the same order as Alleles Design Strand and Allele Code. These are the exported allele names. These values will be the same as Alleles Design Strand if Switch Design Strand to Report =0.
Alleles-Alias Reported Strand An alternate name that will be reported for actual allele sequences that are too long or are better summarized by a trivial name
Associated Gene The gene symbol designated for this marker
Chromosome The chromosome upon which the marker is located
CN Region The name of the copy number region within which a marker exists, if applicable.
Common Name The trivial name parsed from various underlying data sources and then manually curated
DbSNP annot Some annotation from the dbSNP entry
dbSNP RS ID dbSNP identifiers that map to the same location
dbSNP Validated dbSNP validation status
Design Strand The strand of genome (ncbi 36) upon which the Molecular Inversion Probes were designed and which was used as the forward strand of the array design.
Gene Strand The strand of the genome which is the coding strand of Associated Gene
mPCR Region “Y” if multiplex PCR is done for this marker prior to running the assay. “N” if no mPCR is done.
PharmGKB Code The identifier associated with this Associated Gene in the PharmGKB database.
Physical Position The single base (as opposed to interbase) at which the mutation maps. Multibase alleles are mapped to the first base location on the plus strand (following the dbSNP system).
POP|count|freqA|freqB|freqC Allele frequency values for each HapMap population, showing sample count and percent frequencies for up to 3 alleles. Allele codes A, B and C refer to actual alleles as in the Allele Code field. Data is formatted thus: Population name|Sample count|Frequency of allele A|Frequency of allele B|Frequency of allele C.
Reference Genome Flank The reference genome flanking sequence of the design strand for this marker.
Reported Strand The strand of the genome for which genotypes are reported.
Switch Design Strand to Report If the Design Strand and the Gene Strand are different then switch=1. This means that alleles are reported on the opposite strand to the design strand, so that reporting is on the same strand as the Associated Gene.
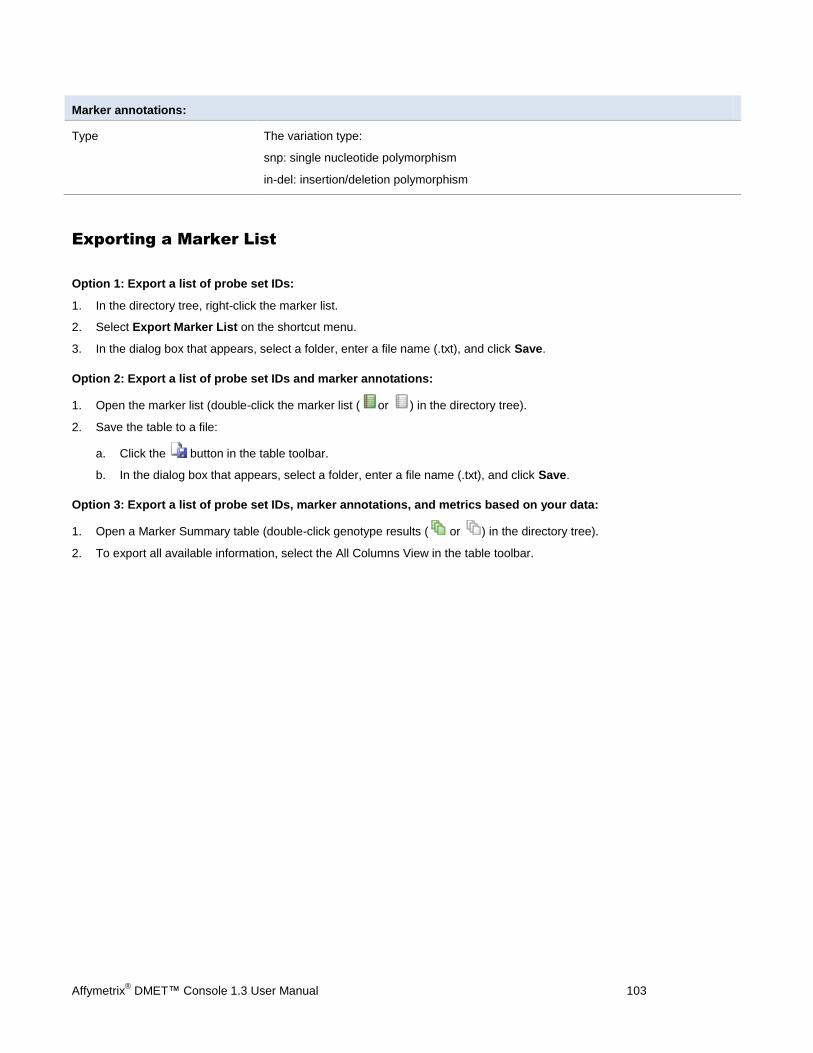
Affymetrix® DMET™ Console 1.3 User Manual 103
Marker annotations:
Type The variation type:
snp: single nucleotide polymorphism
in-del: insertion/deletion polymorphism
Exporting a Marker List
Option 1: Export a list of probe set IDs:
1. In the directory tree, right-click the marker list.
2. Select Export Marker List on the shortcut menu.
3. In the dialog box that appears, select a folder, enter a file name (.txt), and click Save.
Option 2: Export a list of probe set IDs and marker annotations:
1. Open the marker list (double-click the marker list ( or ) in the directory tree).
2. Save the table to a file:
a. Click the button in the table toolbar.
b. In the dialog box that appears, select a folder, enter a file name (.txt), and click Save.
Option 3: Export a list of probe set IDs, marker annotations, and metrics based on your data:
1. Open a Marker Summary table (double-click genotype results ( or ) in the directory tree).
2. To export all available information, select the All Columns View in the table toolbar.
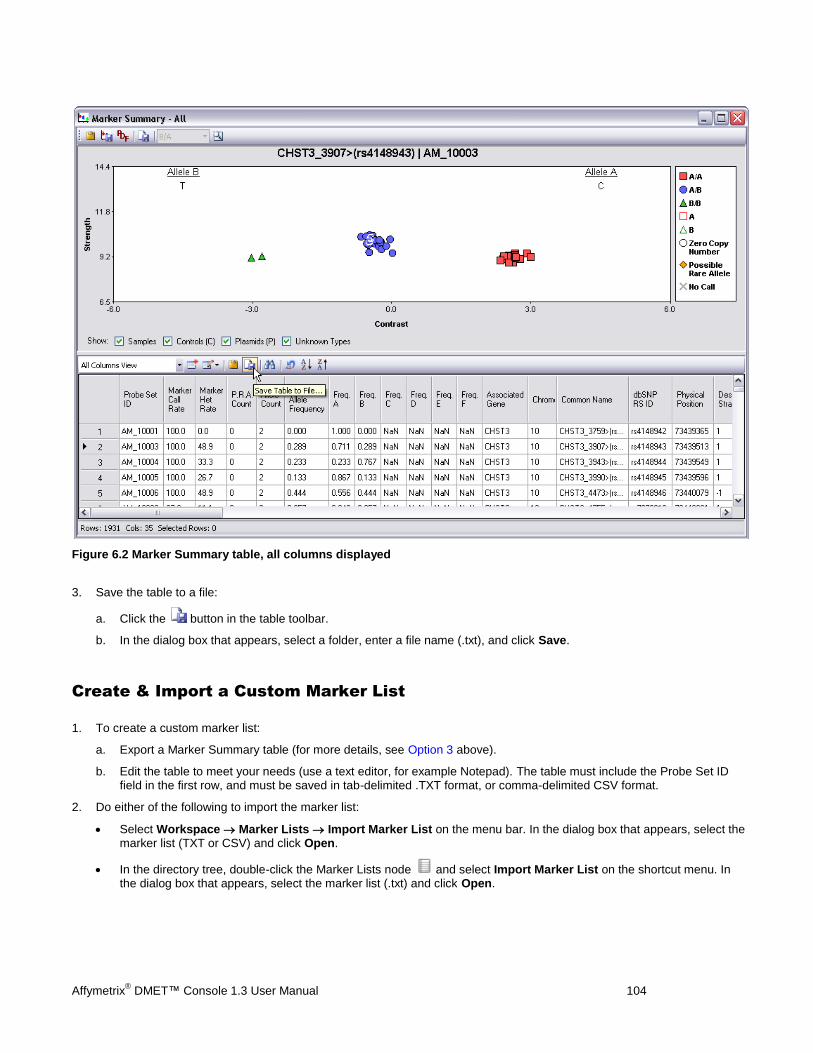
Affymetrix® DMET™ Console 1.3 User Manual 104
Figure 6.2 Marker Summary table, all columns displayed
3. Save the table to a file:
a. Click the button in the table toolbar.
b. In the dialog box that appears, select a folder, enter a file name (.txt), and click Save.
Create & Import a Custom Marker List
1. To create a custom marker list:
a. Export a Marker Summary table (for more details, see Option 3 above).
b. Edit the table to meet your needs (use a text editor, for example Notepad). The table must include the Probe Set ID field in the first row, and must be saved in tab-delimited .TXT format, or comma-delimited CSV format.
2. Do either of the following to import the marker list:
Select Workspace Marker Lists Import Marker List on the menu bar. In the dialog box that appears, select the marker list (TXT or CSV) and click Open.
In the directory tree, double-click the Marker Lists node and select Import Marker List on the shortcut menu. In the dialog box that appears, select the marker list (.txt) and click Open.
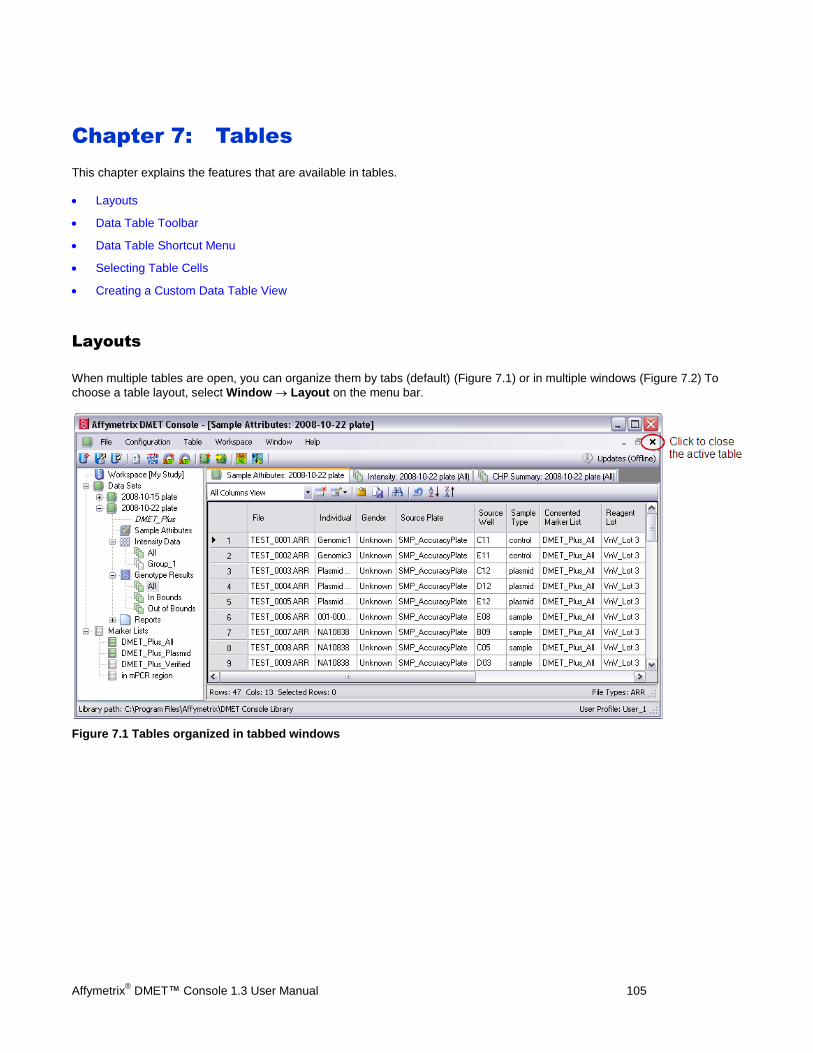
Affymetrix® DMET™ Console 1.3 User Manual 105
Chapter 7: Tables
This chapter explains the features that are available in tables.
Layouts
Data Table Toolbar
Data Table Shortcut Menu
Selecting Table Cells
Creating a Custom Data Table View
Layouts
When multiple tables are open, you can organize them by tabs (default) (Figure 7.1) or in multiple windows (Figure 7.2) To
choose a table layout, select Window Layout on the menu bar.
Figure 7.1 Tables organized in tabbed windows
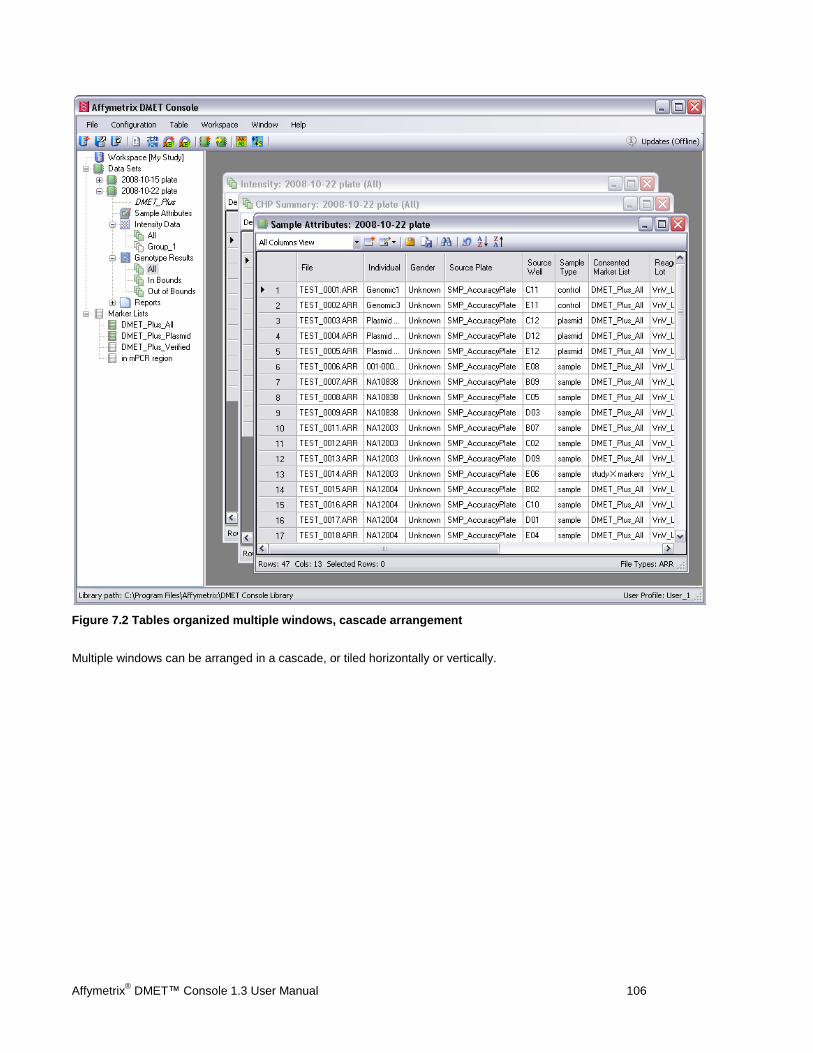
Affymetrix® DMET™ Console 1.3 User Manual 106
Figure 7.2 Tables organized multiple windows, cascade arrangement
Multiple windows can be arranged in a cascade, or tiled horizontally or vertically.
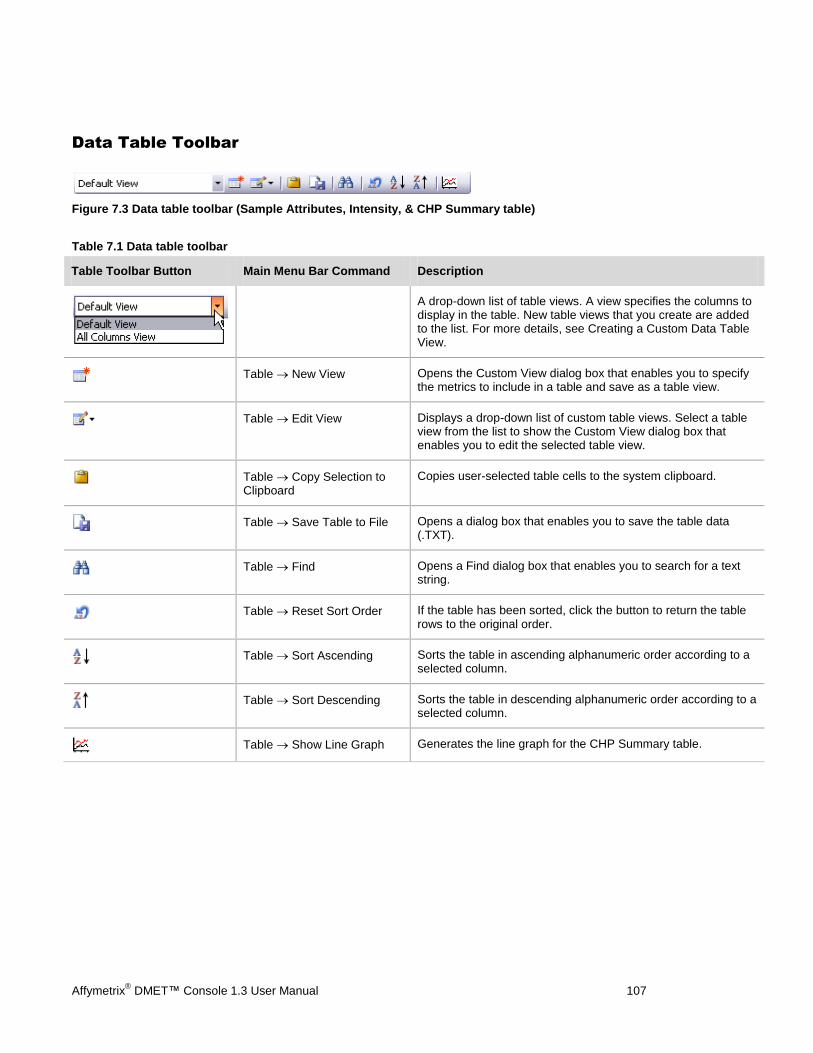
Affymetrix® DMET™ Console 1.3 User Manual 107
Data Table Toolbar
Figure 7.3 Data table toolbar (Sample Attributes, Intensity, & CHP Summary table)
Table 7.1 Data table toolbar
Table Toolbar Button Main Menu Bar Command Description
A drop-down list of table views. A view specifies the columns to display in the table. New table views that you create are added to the list. For more details, see Creating a Custom Data Table View.
Table New View Opens the Custom View dialog box that enables you to specify the metrics to include in a table and save as a table view.
Table Edit View Displays a drop-down list of custom table views. Select a table view from the list to show the Custom View dialog box that enables you to edit the selected table view.
Table Copy Selection to Clipboard
Copies user-selected table cells to the system clipboard.
Table Save Table to File Opens a dialog box that enables you to save the table data (.TXT).
Table Find Opens a Find dialog box that enables you to search for a text string.
Table Reset Sort Order If the table has been sorted, click the button to return the table rows to the original order.
Table Sort Ascending Sorts the table in ascending alphanumeric order according to a selected column.
Table Sort Descending Sorts the table in descending alphanumeric order according to a selected column.
Table Show Line Graph Generates the line graph for the CHP Summary table.
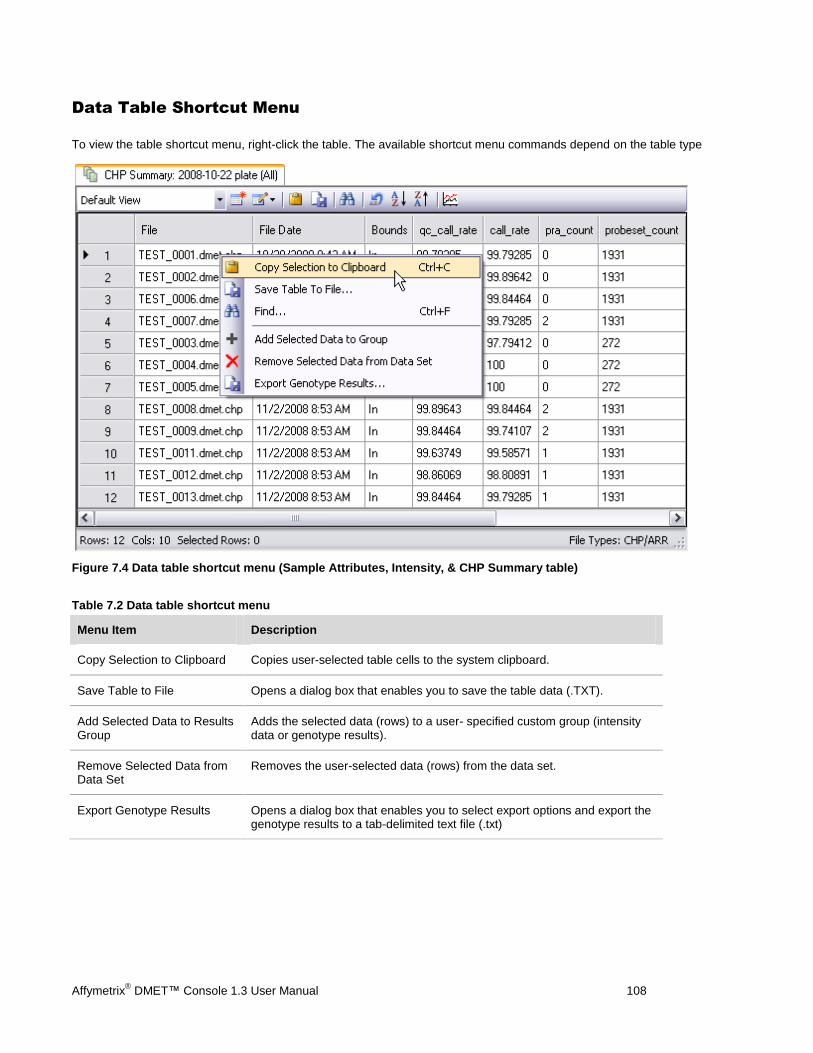
Affymetrix® DMET™ Console 1.3 User Manual 108
Data Table Shortcut Menu
To view the table shortcut menu, right-click the table. The available shortcut menu commands depend on the table type
.
Figure 7.4 Data table shortcut menu (Sample Attributes, Intensity, & CHP Summary table)
Table 7.2 Data table shortcut menu
Menu Item Description
Copy Selection to Clipboard Copies user-selected table cells to the system clipboard.
Save Table to File Opens a dialog box that enables you to save the table data (.TXT).
Add Selected Data to Results Group
Adds the selected data (rows) to a user- specified custom group (intensity data or genotype results).
Remove Selected Data from Data Set
Removes the user-selected data (rows) from the data set.
Export Genotype Results Opens a dialog box that enables you to select export options and export the genotype results to a tab-delimited text file (.txt)
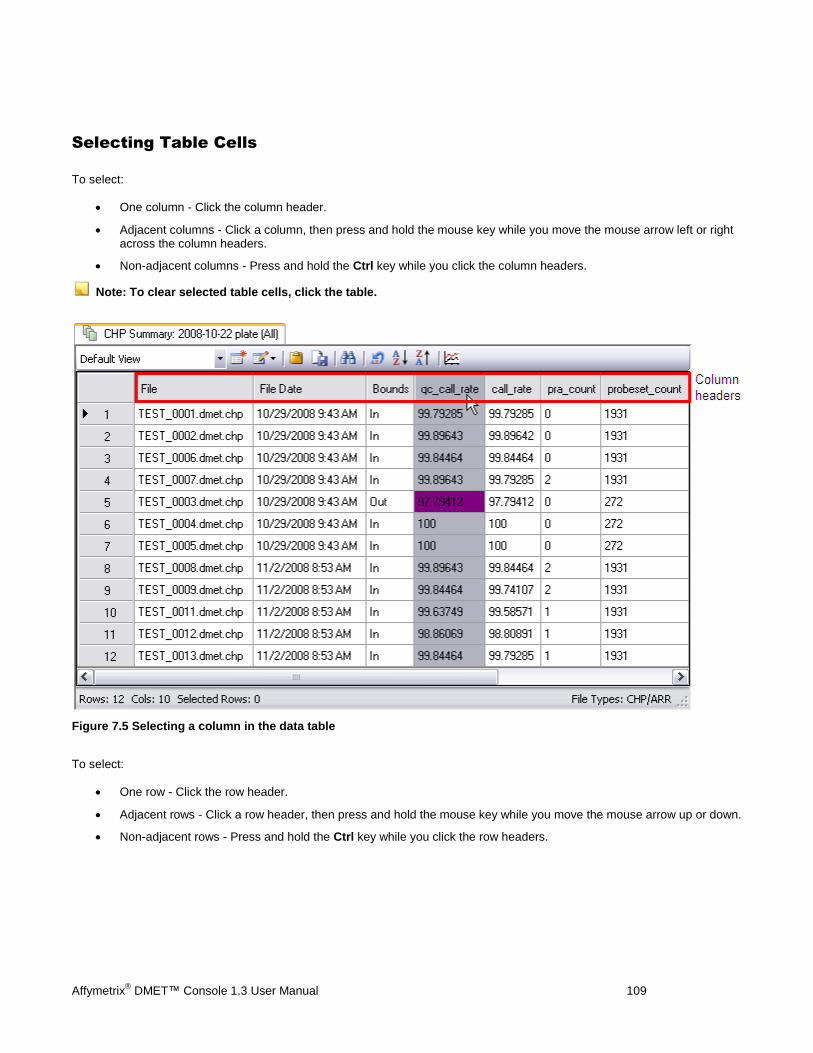
Affymetrix® DMET™ Console 1.3 User Manual 109
Selecting Table Cells
To select:
One column - Click the column header.
Adjacent columns - Click a column, then press and hold the mouse key while you move the mouse arrow left or right across the column headers.
Non-adjacent columns - Press and hold the Ctrl key while you click the column headers.
Note: To clear selected table cells, click the table.
Figure 7.5 Selecting a column in the data table
To select:
One row - Click the row header.
Adjacent rows - Click a row header, then press and hold the mouse key while you move the mouse arrow up or down.
Non-adjacent rows - Press and hold the Ctrl key while you click the row headers.

Affymetrix® DMET™ Console 1.3 User Manual 110
Figure 7.6 Selecting rows in the data table
To select all table cells, click the upper left corner of the table.

Affymetrix® DMET™ Console 1.3 User Manual 111
Figure 7.7 Selecting all table data
Creating a Custom Data Table View
A table view specifies the metrics to include in a table. You can create a custom table view for the CHP Summary or Intensity table.
1. Open the table of interest.
2. Click the New View button .
3. In the dialog box that appears, put a check mark next to the column headers that you want to include in the table. Remove the check mark next to the column headers that you want to exclude from the table.

Affymetrix® DMET™ Console 1.3 User Manual 112
Figure 7.8 Custom View dialog box shows the available column headers in a data table
Note: The column headers that are available depend on the type of table that is active.
4. If you want to change the order of the columns in the table, select a column header of interest and click Up or Down.
5. To save the table view without overwriting the current table view:
a. Click Save As.
b. In the Save dialog box that appears, enter a new name for the table view and click Save.
6. To save and overwrite the current table view, click Save.
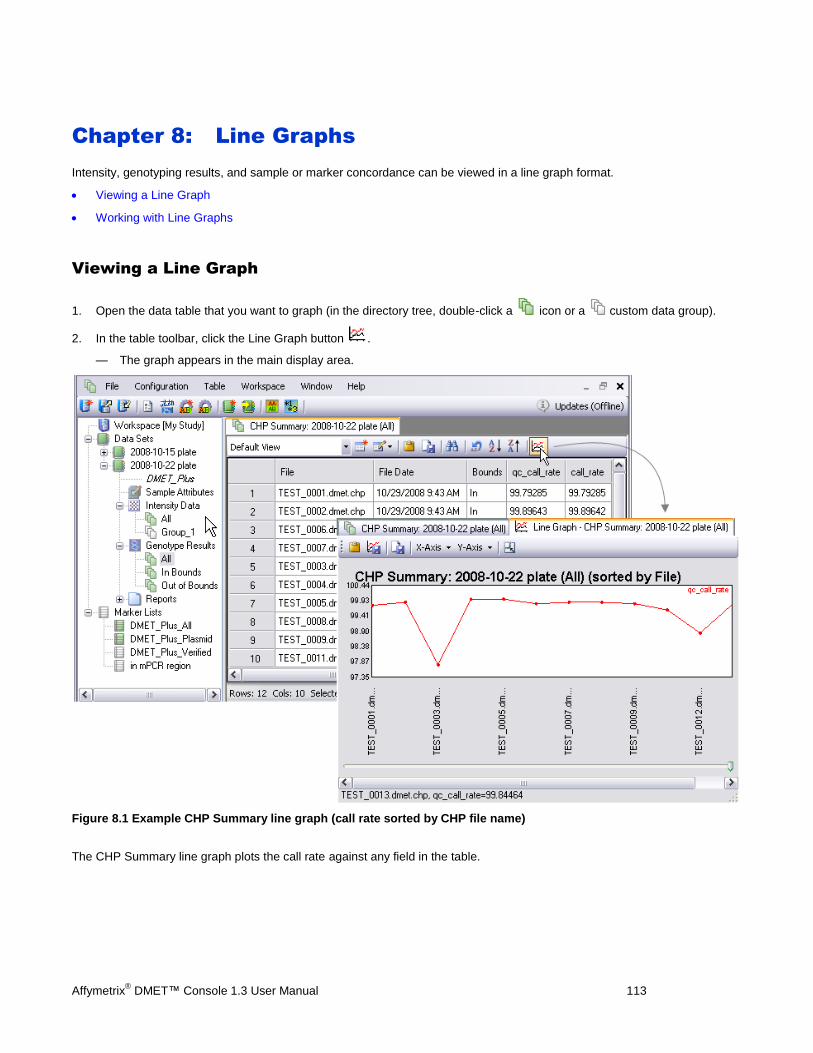
Affymetrix® DMET™ Console 1.3 User Manual 113
Chapter 8: Line Graphs
Intensity, genotyping results, and sample or marker concordance can be viewed in a line graph format.
Viewing a Line Graph
Working with Line Graphs
Viewing a Line Graph
1. Open the data table that you want to graph (in the directory tree, double-click a icon or a custom data group).
2. In the table toolbar, click the Line Graph button .
— The graph appears in the main display area.
Figure 8.1 Example CHP Summary line graph (call rate sorted by CHP file name)
The CHP Summary line graph plots the call rate against any field in the table.
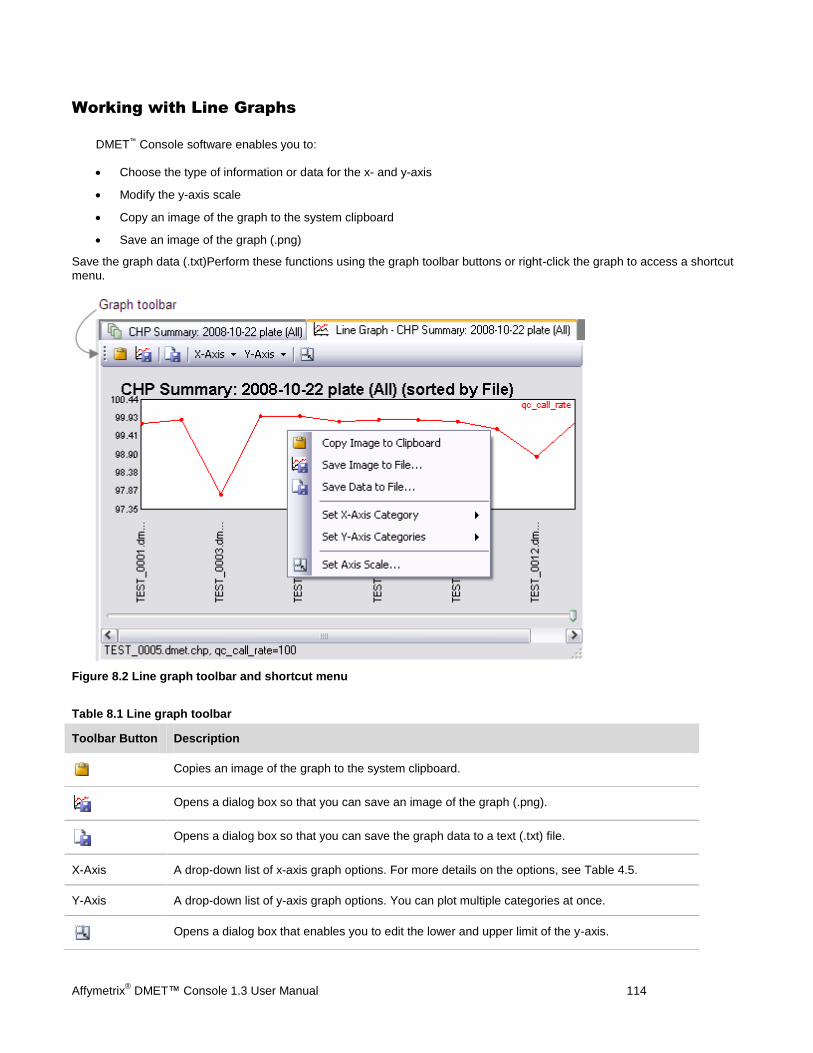
Affymetrix® DMET™ Console 1.3 User Manual 114
Working with Line Graphs
DMET™ Console software enables you to:
Choose the type of information or data for the x- and y-axis
Modify the y-axis scale
Copy an image of the graph to the system clipboard
Save an image of the graph (.png)
Save the graph data (.txt)Perform these functions using the graph toolbar buttons or right-click the graph to access a shortcut menu.
Figure 8.2 Line graph toolbar and shortcut menu
Table 8.1 Line graph toolbar
Toolbar Button Description
Copies an image of the graph to the system clipboard.
Opens a dialog box so that you can save an image of the graph (.png).
Opens a dialog box so that you can save the graph data to a text (.txt) file.
X-Axis A drop-down list of x-axis graph options. For more details on the options, see Table 4.5.
Y-Axis A drop-down list of y-axis graph options. You can plot multiple categories at once.
Opens a dialog box that enables you to edit the lower and upper limit of the y-axis.
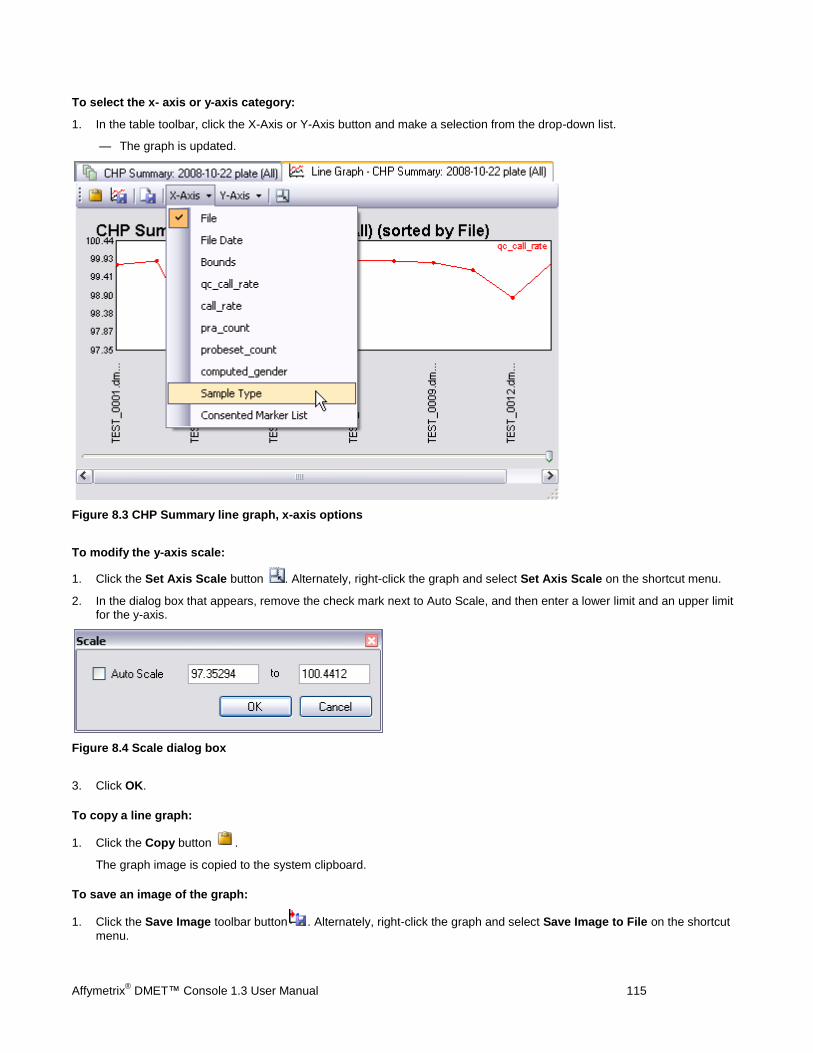
Affymetrix® DMET™ Console 1.3 User Manual 115
To select the x- axis or y-axis category:
1. In the table toolbar, click the X-Axis or Y-Axis button and make a selection from the drop-down list.
— The graph is updated.
Figure 8.3 CHP Summary line graph, x-axis options
To modify the y-axis scale:
1. Click the Set Axis Scale button . Alternately, right-click the graph and select Set Axis Scale on the shortcut menu.
2. In the dialog box that appears, remove the check mark next to Auto Scale, and then enter a lower limit and an upper limit for the y-axis.
Figure 8.4 Scale dialog box
3. Click OK.
To copy a line graph:
1. Click the Copy button .
The graph image is copied to the system clipboard.
To save an image of the graph:
1. Click the Save Image toolbar button . Alternately, right-click the graph and select Save Image to File on the shortcut
menu.

Affymetrix® DMET™ Console 1.3 User Manual 116
2. In the dialog box that appears, select a file location and enter a file name. Click Save.
To save the graph data:
1. Click the Save Data toolbar button . Alternately, right-click the graph and select Save Data to File on the shortcut
menu.
2. In the dialog box that appears, select a file location and enter a file name. Click Save.
Affymetrix® DMET™ Console 1.3 User Manual 117
Appendix A: About Allele Translation
This appendix explains the features in the DMET™ Console Allele Translation reports. It also describes how allele translation operates and the translation logic.
Gene Table Layout for Haplotyping
Biological Annotations in Translation Reports
Impact of Phase Ambiguity in Haplotyping
Diplotype to Phenotype Translation
Creating a Custom Metabolizer Library File
Metabolizer Library File Format
Reference Databases Used in Translation Data Curation
Human genome sequence variation, which includes both single nucleotide polymorphisms (SNPs) as well as more complex structural variation in the form of insertions, duplications and deletions, underlies each individual’s response to drugs. The DMET product is designed to enable comprehensive and accurate genotyping of specific polymorphisms involved in Drug-Metabolizing Enzymes and Transporters. The DMET Console software enables data visualization and conversion of genotype calls to clinically-recognized star nomenclature via Allele Translation. This section explains the organization of the translation reports to help you interpret the translation data. Key concepts such as phase ambiguity and the impact of missing data on haplotype-based allele calling are described.
The University of Utah Genetic Science Learning Center website has a good primer describing haplotyping:
http://learn.genetics.utah.edu/units/pharma/phsnipping
Gene Table Layout for Haplotyping
To appreciate how haplotyping operates, it is essential to describe the organization of the gene tables in the translation library file (*.translation). Figure A.1 shows an example gene table.
Note: The content of the translation library file is subject to change. The examples in the following section are for illustrative purposes only.
Note: In addition to the *.translation file used by Allele Translation, a more accessible copy of this information is provided in a companion Microsoft Excel workbook.
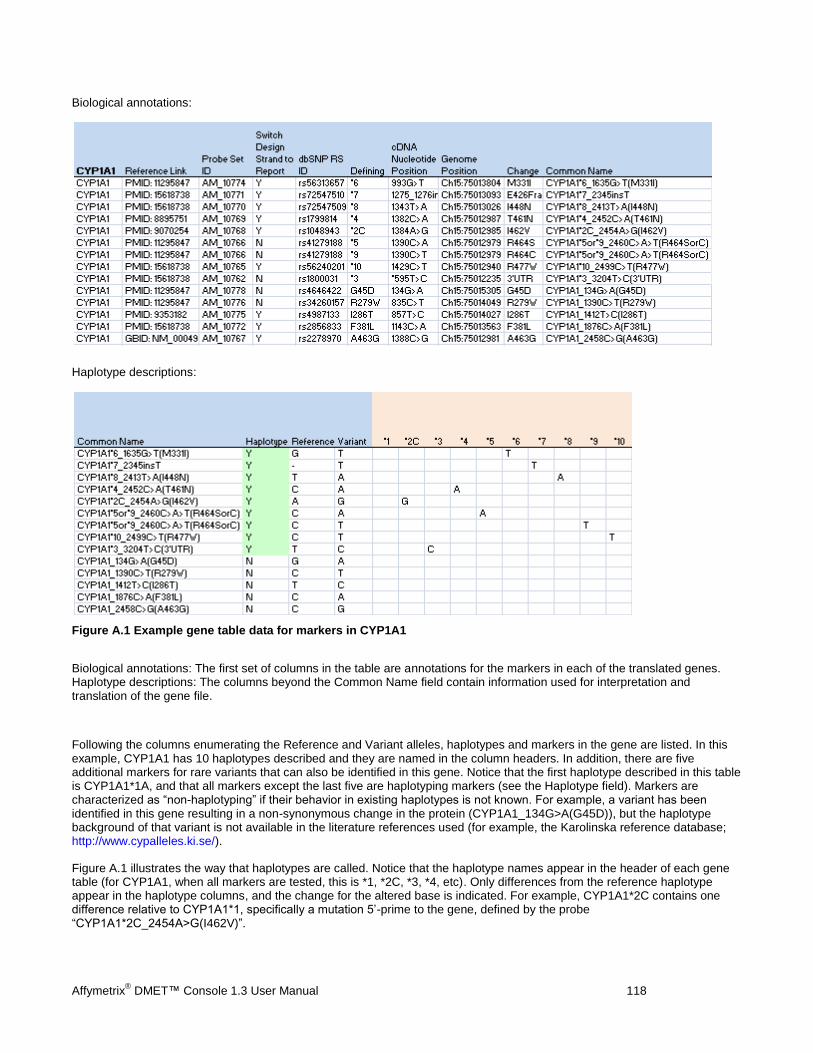
Affymetrix® DMET™ Console 1.3 User Manual 118
Biological annotations:
Haplotype descriptions:
Figure A.1 Example gene table data for markers in CYP1A1
Biological annotations: The first set of columns in the table are annotations for the markers in each of the translated genes. Haplotype descriptions: The columns beyond the Common Name field contain information used for interpretation and translation of the gene file.
Following the columns enumerating the Reference and Variant alleles, haplotypes and markers in the gene are listed. In this example, CYP1A1 has 10 haplotypes described and they are named in the column headers. In addition, there are five additional markers for rare variants that can also be identified in this gene. Notice that the first haplotype described in this table is CYP1A1*1A, and that all markers except the last five are haplotyping markers (see the Haplotype field). Markers are characterized as “non-haplotyping” if their behavior in existing haplotypes is not known. For example, a variant has been identified in this gene resulting in a non-synonymous change in the protein (CYP1A1_134G>A(G45D)), but the haplotype background of that variant is not available in the literature references used (for example, the Karolinska reference database; http://www.cypalleles.ki.se/).
Figure A.1 illustrates the way that haplotypes are called. Notice that the haplotype names appear in the header of each gene table (for CYP1A1, when all markers are tested, this is *1, *2C, *3, *4, etc). Only differences from the reference haplotype appear in the haplotype columns, and the change for the altered base is indicated. For example, CYP1A1*2C contains one difference relative to CYP1A1*1, specifically a mutation 5’-prime to the gene, defined by the probe “CYP1A1*2C_2454A>G(I462V)”.
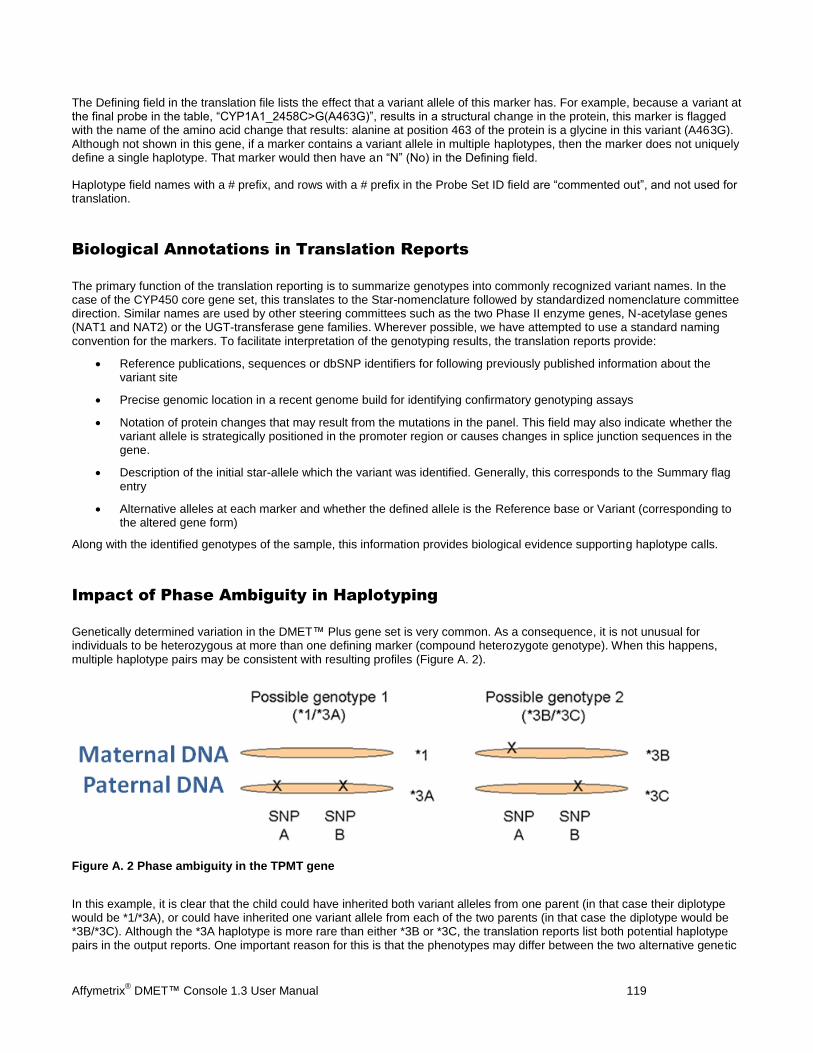
Affymetrix® DMET™ Console 1.3 User Manual 119
The Defining field in the translation file lists the effect that a variant allele of this marker has. For example, because a variant at the final probe in the table, “CYP1A1_2458C>G(A463G)”, results in a structural change in the protein, this marker is flagged with the name of the amino acid change that results: alanine at position 463 of the protein is a glycine in this variant (A463G). Although not shown in this gene, if a marker contains a variant allele in multiple haplotypes, then the marker does not uniquely define a single haplotype. That marker would then have an “N” (No) in the Defining field.
Haplotype field names with a # prefix, and rows with a # prefix in the Probe Set ID field are “commented out”, and not used for translation.
Biological Annotations in Translation Reports
The primary function of the translation reporting is to summarize genotypes into commonly recognized variant names. In the case of the CYP450 core gene set, this translates to the Star-nomenclature followed by standardized nomenclature committee direction. Similar names are used by other steering committees such as the two Phase II enzyme genes, N-acetylase genes (NAT1 and NAT2) or the UGT-transferase gene families. Wherever possible, we have attempted to use a standard naming convention for the markers. To facilitate interpretation of the genotyping results, the translation reports provide:
Reference publications, sequences or dbSNP identifiers for following previously published information about the variant site
Precise genomic location in a recent genome build for identifying confirmatory genotyping assays
Notation of protein changes that may result from the mutations in the panel. This field may also indicate whether the variant allele is strategically positioned in the promoter region or causes changes in splice junction sequences in the gene.
Description of the initial star-allele which the variant was identified. Generally, this corresponds to the Summary flag entry
Alternative alleles at each marker and whether the defined allele is the Reference base or Variant (corresponding to the altered gene form)
Along with the identified genotypes of the sample, this information provides biological evidence supporting haplotype calls.
Impact of Phase Ambiguity in Haplotyping
Genetically determined variation in the DMET™ Plus gene set is very common. As a consequence, it is not unusual for individuals to be heterozygous at more than one defining marker (compound heterozygote genotype). When this happens, multiple haplotype pairs may be consistent with resulting profiles (Figure A. 2).
Figure A. 2 Phase ambiguity in the TPMT gene
In this example, it is clear that the child could have inherited both variant alleles from one parent (in that case their diplotype would be *1/*3A), or could have inherited one variant allele from each of the two parents (in that case the diplotype would be *3B/*3C). Although the *3A haplotype is more rare than either *3B or *3C, the translation reports list both potential haplotype pairs in the output reports. One important reason for this is that the phenotypes may differ between the two alternative genetic
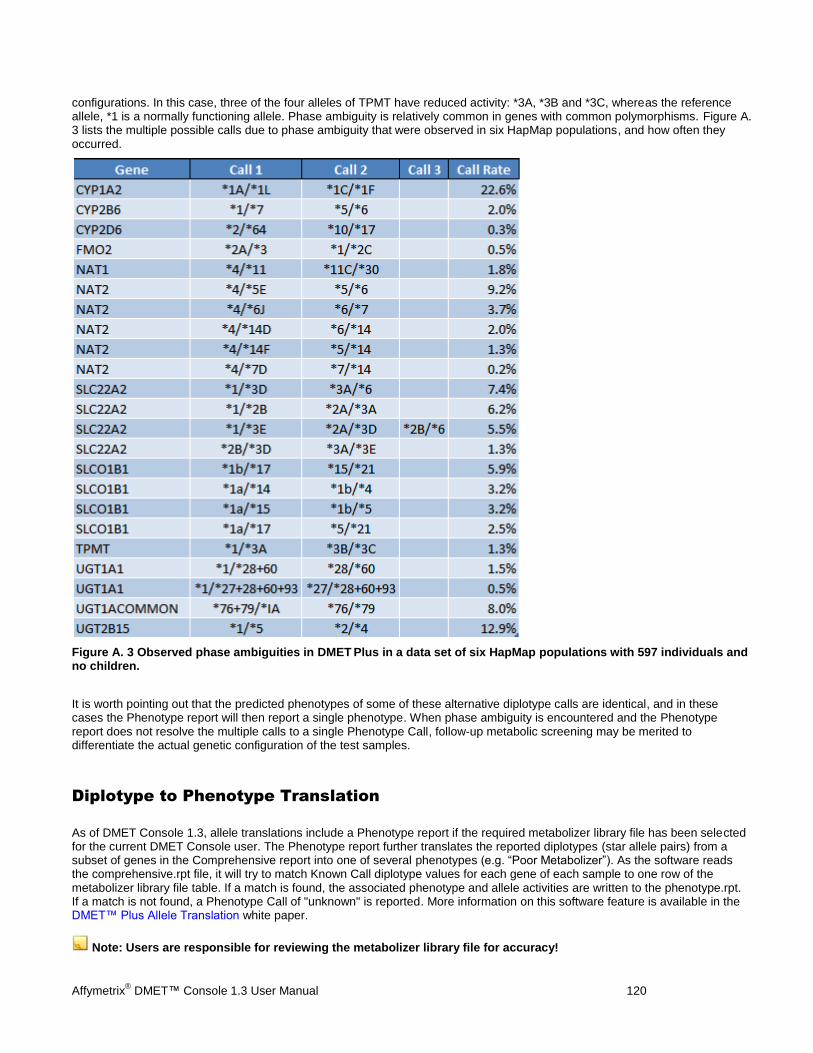
Affymetrix® DMET™ Console 1.3 User Manual 120
configurations. In this case, three of the four alleles of TPMT have reduced activity: *3A, *3B and *3C, whereas the reference allele, *1 is a normally functioning allele. Phase ambiguity is relatively common in genes with common polymorphisms. Figure A. 3 lists the multiple possible calls due to phase ambiguity that were observed in six HapMap populations, and how often they occurred.
Figure A. 3 Observed phase ambiguities in DMET Plus in a data set of six HapMap populations with 597 individuals and
no children.
It is worth pointing out that the predicted phenotypes of some of these alternative diplotype calls are identical, and in these cases the Phenotype report will then report a single phenotype. When phase ambiguity is encountered and the Phenotype report does not resolve the multiple calls to a single Phenotype Call, follow-up metabolic screening may be merited to differentiate the actual genetic configuration of the test samples.
Diplotype to Phenotype Translation
As of DMET Console 1.3, allele translations include a Phenotype report if the required metabolizer library file has been selected for the current DMET Console user. The Phenotype report further translates the reported diplotypes (star allele pairs) from a subset of genes in the Comprehensive report into one of several phenotypes (e.g. “Poor Metabolizer”). As the software reads the comprehensive.rpt file, it will try to match Known Call diplotype values for each gene of each sample to one row of the metabolizer library file table. If a match is found, the associated phenotype and allele activities are written to the phenotype.rpt. If a match is not found, a Phenotype Call of "unknown" is reported. More information on this software feature is available in the DMET™ Plus Allele Translation white paper.
Note: Users are responsible for reviewing the metabolizer library file for accuracy!
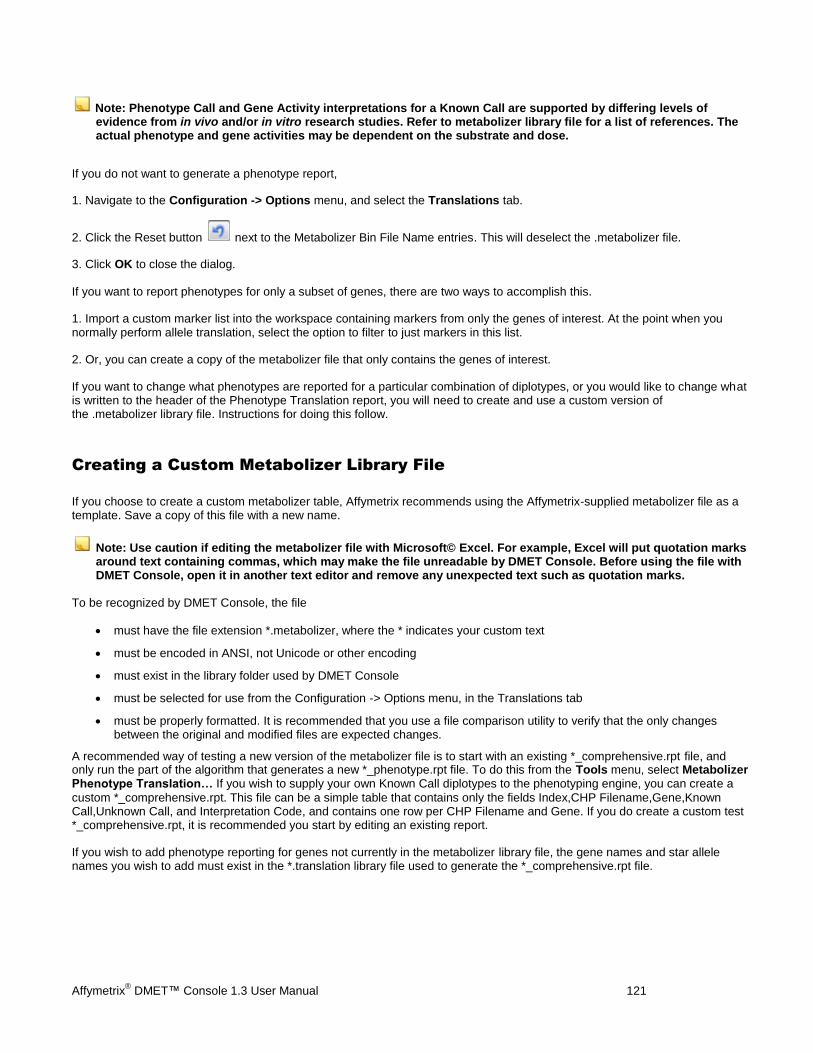
Affymetrix® DMET™ Console 1.3 User Manual 121
Note: Phenotype Call and Gene Activity interpretations for a Known Call are supported by differing levels of evidence from in vivo and/or in vitro research studies. Refer to metabolizer library file for a list of references. The actual phenotype and gene activities may be dependent on the substrate and dose.
If you do not want to generate a phenotype report,
1. Navigate to the Configuration -> Options menu, and select the Translations tab.
2. Click the Reset button next to the Metabolizer Bin File Name entries. This will deselect the .metabolizer file.
3. Click OK to close the dialog.
If you want to report phenotypes for only a subset of genes, there are two ways to accomplish this.
1. Import a custom marker list into the workspace containing markers from only the genes of interest. At the point when you normally perform allele translation, select the option to filter to just markers in this list.
2. Or, you can create a copy of the metabolizer file that only contains the genes of interest.
If you want to change what phenotypes are reported for a particular combination of diplotypes, or you would like to change what is written to the header of the Phenotype Translation report, you will need to create and use a custom version of the .metabolizer library file. Instructions for doing this follow.
Creating a Custom Metabolizer Library File
If you choose to create a custom metabolizer table, Affymetrix recommends using the Affymetrix-supplied metabolizer file as a template. Save a copy of this file with a new name.
Note: Use caution if editing the metabolizer file with Microsoft© Excel. For example, Excel will put quotation marks around text containing commas, which may make the file unreadable by DMET Console. Before using the file with DMET Console, open it in another text editor and remove any unexpected text such as quotation marks.
To be recognized by DMET Console, the file
must have the file extension *.metabolizer, where the * indicates your custom text
must be encoded in ANSI, not Unicode or other encoding
must exist in the library folder used by DMET Console
must be selected for use from the Configuration -> Options menu, in the Translations tab
must be properly formatted. It is recommended that you use a file comparison utility to verify that the only changes between the original and modified files are expected changes.
A recommended way of testing a new version of the metabolizer file is to start with an existing *_comprehensive.rpt file, and only run the part of the algorithm that generates a new *_phenotype.rpt file. To do this from the Tools menu, select Metabolizer Phenotype Translation… If you wish to supply your own Known Call diplotypes to the phenotyping engine, you can create a
custom *_comprehensive.rpt. This file can be a simple table that contains only the fields Index,CHP Filename,Gene,Known Call,Unknown Call, and Interpretation Code, and contains one row per CHP Filename and Gene. If you do create a custom test *_comprehensive.rpt, it is recommended you start by editing an existing report.
If you wish to add phenotype reporting for genes not currently in the metabolizer library file, the gene names and star allele names you wish to add must exist in the *.translation library file used to generate the *_comprehensive.rpt file.
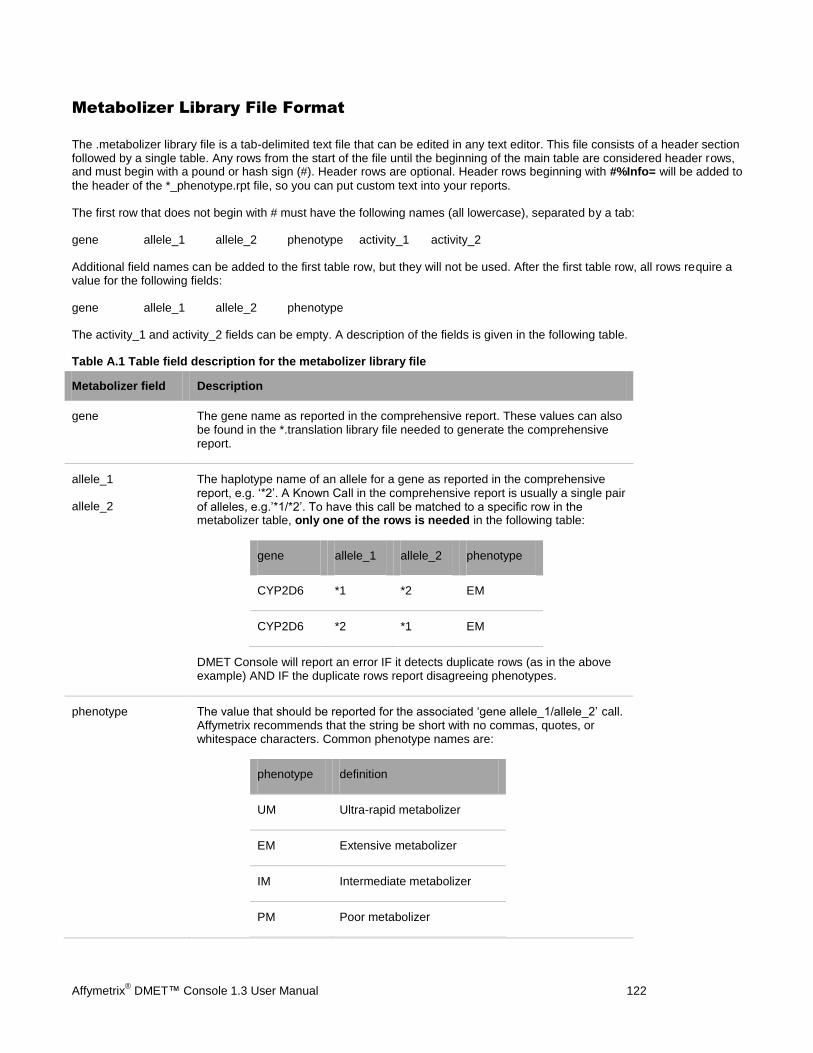
Affymetrix® DMET™ Console 1.3 User Manual 122
Metabolizer Library File Format
The .metabolizer library file is a tab-delimited text file that can be edited in any text editor. This file consists of a header section followed by a single table. Any rows from the start of the file until the beginning of the main table are considered header rows, and must begin with a pound or hash sign (#). Header rows are optional. Header rows beginning with #%Info= will be added to
the header of the *_phenotype.rpt file, so you can put custom text into your reports.
The first row that does not begin with # must have the following names (all lowercase), separated by a tab:
gene allele_1 allele_2 phenotype activity_1 activity_2
Additional field names can be added to the first table row, but they will not be used. After the first table row, all rows require a value for the following fields:
gene allele_1 allele_2 phenotype
The activity_1 and activity_2 fields can be empty. A description of the fields is given in the following table.
Table A.1 Table field description for the metabolizer library file
Metabolizer field Description
gene The gene name as reported in the comprehensive report. These values can also be found in the *.translation library file needed to generate the comprehensive report.
allele_1
allele_2
The haplotype name of an allele for a gene as reported in the comprehensive report, e.g. ‘*2’. A Known Call in the comprehensive report is usually a single pair of alleles, e.g.’*1/*2’. To have this call be matched to a specific row in the metabolizer table, only one of the rows is needed in the following table:
gene allele_1 allele_2 phenotype
CYP2D6 *1 *2 EM
CYP2D6 *2 *1 EM
DMET Console will report an error IF it detects duplicate rows (as in the above example) AND IF the duplicate rows report disagreeing phenotypes.
phenotype The value that should be reported for the associated ‘gene allele_1/allele_2’ call. Affymetrix recommends that the string be short with no commas, quotes, or whitespace characters. Common phenotype names are:
phenotype definition
UM Ultra-rapid metabolizer
EM Extensive metabolizer
IM Intermediate metabolizer
PM Poor metabolizer

Affymetrix® DMET™ Console 1.3 User Manual 123
unknown Unknown metabolizer
activity_1
activity_2
The reported gene activity for an allele, e.g. ‘normal’ or ‘reduced’. Activity_1 is for allele_1, and activity_2 is for allele_2. The values in these fields are used to populate the Gene Activity field in the phenotype report, e.g. ‘normal/reduced’. If you leave these fields empty, the phenotype report will display ‘/’ for the Gene Activity.
Optional fields DMET Console will ignore additional fields in the metabolizer file. Additional fields may be used to annotate each row.
Reference Databases Used in Translation Data Curation
The databases used to curate the DMET™ Plus allele translation gene tables include:
PharmGKB – Stanford University Pharmacogenomics reference database
http://www.pharmgkb.org
Karolinska cytochrome P450 gene standard nomenclature
http://www.imm.ki.se/CYPalleles
Database of NAT genes (University of Louisville)
http://louisville.edu/medschool/pharmacology/NAT.html
Database of UGT genes
http://www.pharmacogenomics.pha.ulaval.ca/sgc/ugt_alleles
Drug interaction database (University of Indiana)
http://medicine.iupui.edu/clinpharm/ddis
PubMed – On-line National Library of Medicine publication database
http://www.ncbi.nlm.nih.gov/sites/entrez
Affymetrix® DMET™ Console 1.3 User Manual 124
Appendix B: Restricting Configuration Changes
DMET™ Console normally allows you to configure the software for his or your particular needs. However, the Lab Manager may want to “lock” the application for routine use, so that normal users cannot alter analysis settings.
How to Prevent Analysis Configuration Changes
Restricted Operations
Additional Security Precautions
How to Prevent Analysis Configuration Changes
The DMET™ Console program folder is located here:
C:\Program Files\Affymetrix\DMET Console
In this folder is a file called RestrictUser.DMET Console. Open this file with Microsoft NotePad or an equivalent text editor.
There is a single word in this file, and the default value is False, which means that no operations in the software are disabled. To prevent a user from editing the analysis configuration, change this value to True, and save the change. DMET Console will use this setting at next launch.
Restricted Operations
When the file RestrictUser.DMET Console contains the single word True, the following restrictions apply in DMET Console.
A user cannot:
Change the Library folder that contains the configuration files or the files required for genotyping and allele translation
Download new versions of the analysis files (even if new versions are available)
Select a different marker annotation file (which is required for many operations)
Create a new genotyping analysis configuration which specifies some customizable genotyping parameters
Change the sample QC thresholds that are used to classify samples as “In Bounds” or “Out of Bounds”
Select a different analysis configuration at the point of genotyping
Select different translation files (which are used for allele translation)
Change the allele translation option controlling how haplotypes are reported when an optional marker list removes markers needed to differentiate multiple haplotypes
Additional Security Precautions
At the Lab Manager’s discretion, the following measures can be implemented to supplement the restricted software mode.
The IT administrator can make the C:\Program Files\Affymetrix\DMET Console folder “Read Only” for normal users, so they can’t edit or delete the RestrictUser.DMET Console file.
Note: This will interfere with newer versions of the DMET Console installer being able to update the application in this folder.

Affymetrix® DMET™ Console 1.3 User Manual 125
The IT administrator can make the current library folder “Read Only” for normal users, so they can’t edit or delete any of the library files used for analysis.
Note: After the library folder is made “Read Only”, users will not be able to create additional custom views of tables in DMET Console.
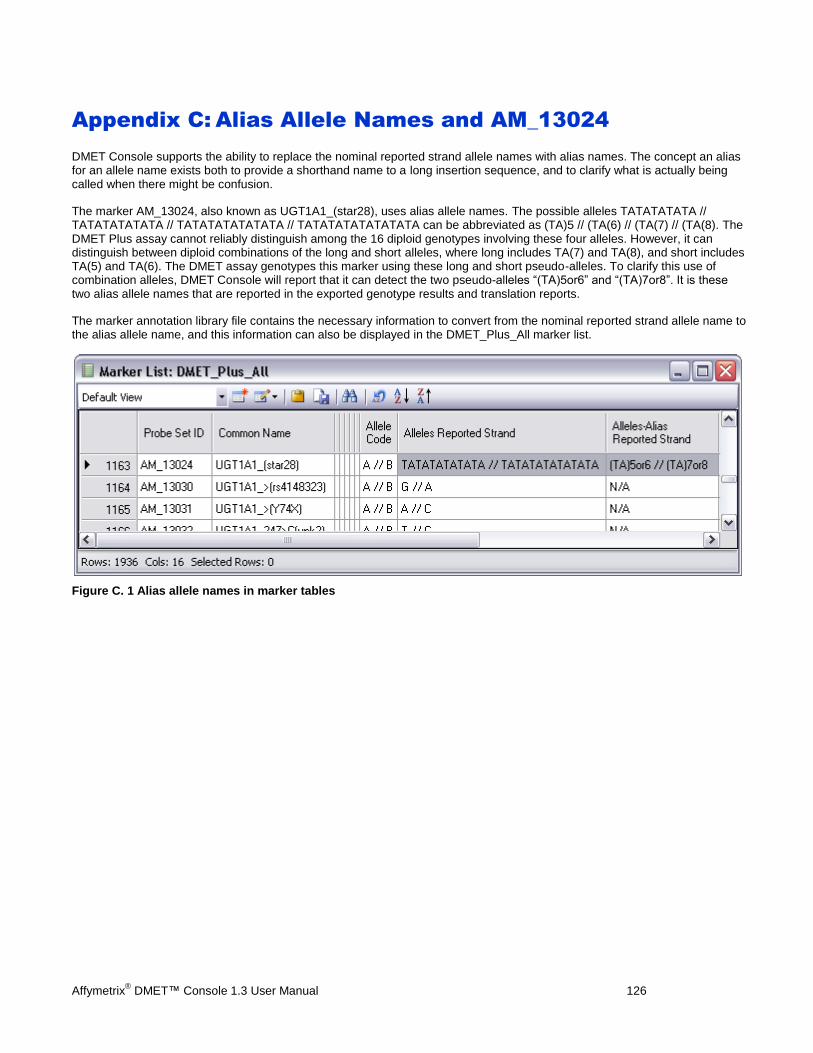
Affymetrix® DMET™ Console 1.3 User Manual 126
Appendix C: Alias Allele Names and AM_13024
DMET Console supports the ability to replace the nominal reported strand allele names with alias names. The concept an alias for an allele name exists both to provide a shorthand name to a long insertion sequence, and to clarify what is actually being called when there might be confusion.
The marker AM_13024, also known as UGT1A1_(star28), uses alias allele names. The possible alleles TATATATATA // TATATATATATA // TATATATATATATA // TATATATATATATATA can be abbreviated as (TA)5 // (TA(6) // (TA(7) // (TA(8). The DMET Plus assay cannot reliably distinguish among the 16 diploid genotypes involving these four alleles. However, it can distinguish between diploid combinations of the long and short alleles, where long includes TA(7) and TA(8), and short includes TA(5) and TA(6). The DMET assay genotypes this marker using these long and short pseudo-alleles. To clarify this use of combination alleles, DMET Console will report that it can detect the two pseudo-alleles “(TA)5or6” and “(TA)7or8”. It is these two alias allele names that are reported in the exported genotype results and translation reports.
The marker annotation library file contains the necessary information to convert from the nominal reported strand allele name to the alias allele name, and this information can also be displayed in the DMET_Plus_All marker list.
Figure C. 1 Alias allele names in marker tables
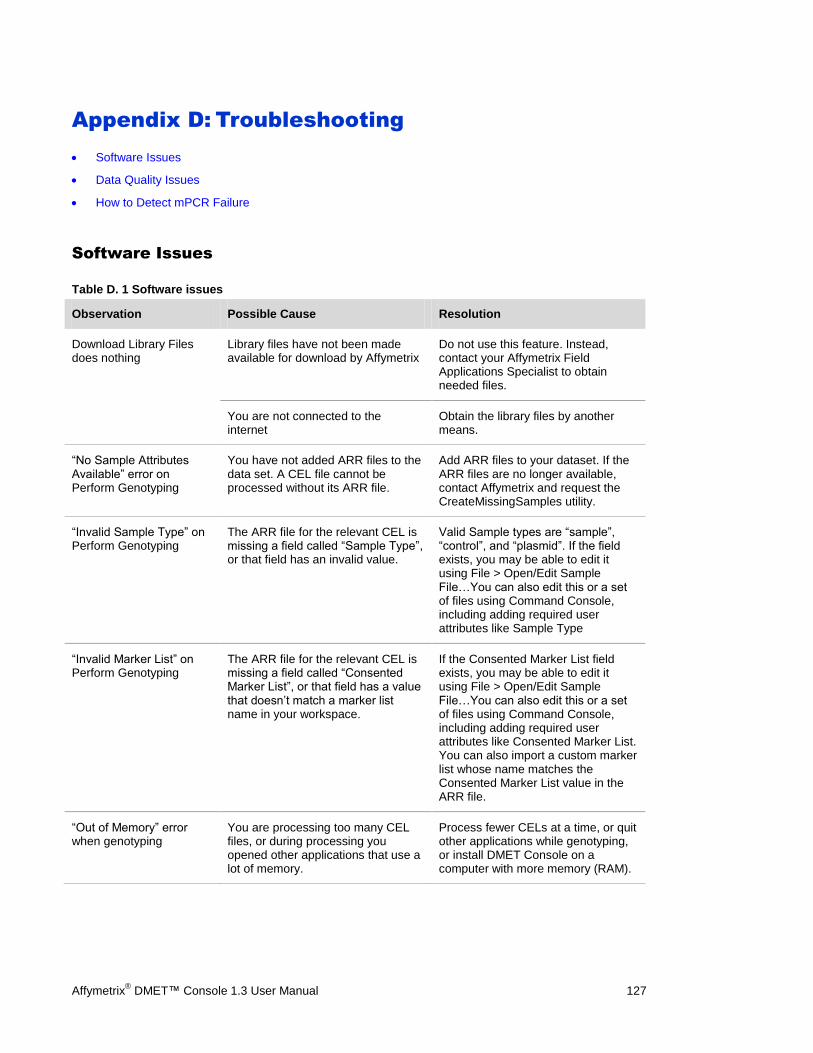
Affymetrix® DMET™ Console 1.3 User Manual 127
Appendix D: Troubleshooting
Software Issues
Data Quality Issues
How to Detect mPCR Failure
Software Issues
Table D. 1 Software issues
Observation Possible Cause Resolution
Download Library Files does nothing
Library files have not been made available for download by Affymetrix
Do not use this feature. Instead, contact your Affymetrix Field Applications Specialist to obtain needed files.
You are not connected to the internet
Obtain the library files by another means.
“No Sample Attributes Available” error on Perform Genotyping
You have not added ARR files to the data set. A CEL file cannot be processed without its ARR file.
Add ARR files to your dataset. If the ARR files are no longer available, contact Affymetrix and request the CreateMissingSamples utility.
“Invalid Sample Type” on Perform Genotyping
The ARR file for the relevant CEL is missing a field called “Sample Type”, or that field has an invalid value.
Valid Sample types are “sample”, “control”, and “plasmid”. If the field exists, you may be able to edit it using File > Open/Edit Sample File…You can also edit this or a set of files using Command Console, including adding required user attributes like Sample Type
“Invalid Marker List” on Perform Genotyping
The ARR file for the relevant CEL is missing a field called “Consented Marker List”, or that field has a value that doesn’t match a marker list name in your workspace.
If the Consented Marker List field exists, you may be able to edit it using File > Open/Edit Sample File…You can also edit this or a set of files using Command Console, including adding required user attributes like Consented Marker List. You can also import a custom marker list whose name matches the Consented Marker List value in the ARR file.
“Out of Memory” error when genotyping
You are processing too many CEL files, or during processing you opened other applications that use a lot of memory.
Process fewer CELs at a time, or quit other applications while genotyping, or install DMET Console on a computer with more memory (RAM).
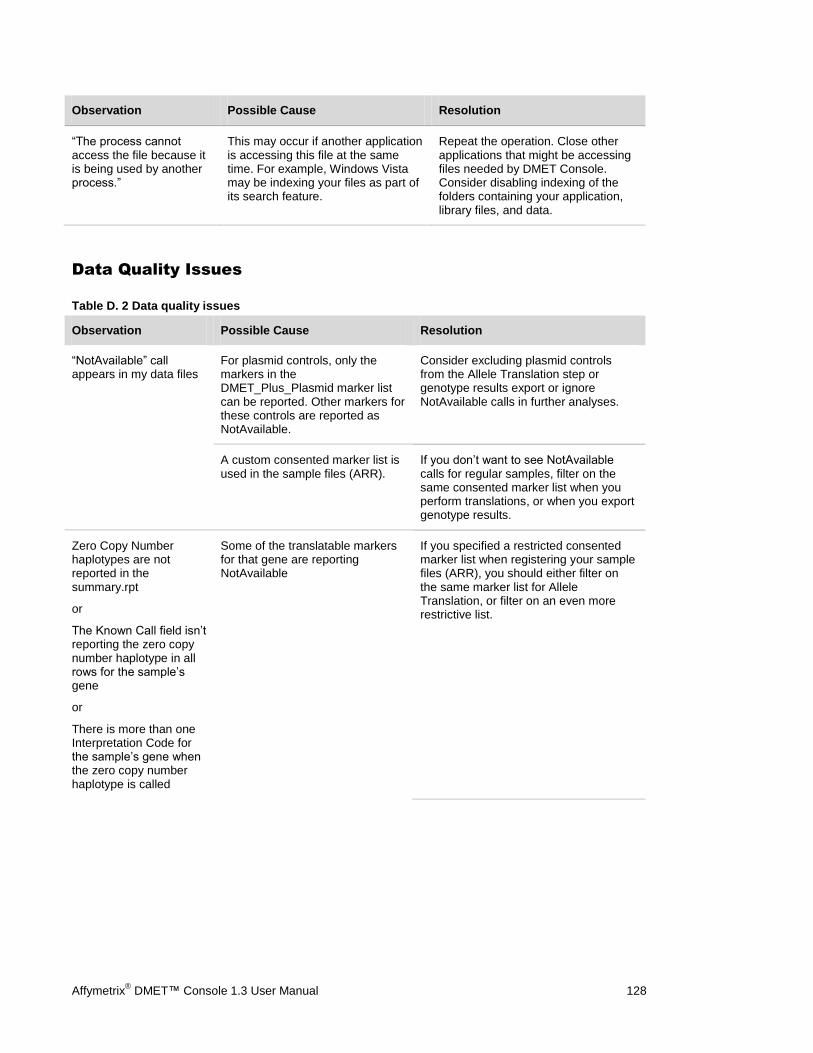
Affymetrix® DMET™ Console 1.3 User Manual 128
Observation Possible Cause Resolution
“The process cannot access the file because it is being used by another process.”
This may occur if another application is accessing this file at the same time. For example, Windows Vista may be indexing your files as part of its search feature.
Repeat the operation. Close other applications that might be accessing files needed by DMET Console. Consider disabling indexing of the folders containing your application, library files, and data.
Data Quality Issues
Table D. 2 Data quality issues
Observation Possible Cause Resolution
“NotAvailable” call appears in my data files
For plasmid controls, only the markers in the DMET_Plus_Plasmid marker list can be reported. Other markers for these controls are reported as NotAvailable.
Consider excluding plasmid controls from the Allele Translation step or genotype results export or ignore NotAvailable calls in further analyses.
A custom consented marker list is used in the sample files (ARR).
If you don’t want to see NotAvailable calls for regular samples, filter on the same consented marker list when you perform translations, or when you export genotype results.
Zero Copy Number haplotypes are not reported in the summary.rpt
or
The Known Call field isn’t reporting the zero copy number haplotype in all rows for the sample’s gene
or
There is more than one Interpretation Code for the sample’s gene when the zero copy number haplotype is called
Some of the translatable markers for that gene are reporting NotAvailable
If you specified a restricted consented marker list when registering your sample files (ARR), you should either filter on the same marker list for Allele Translation, or filter on an even more restrictive list.
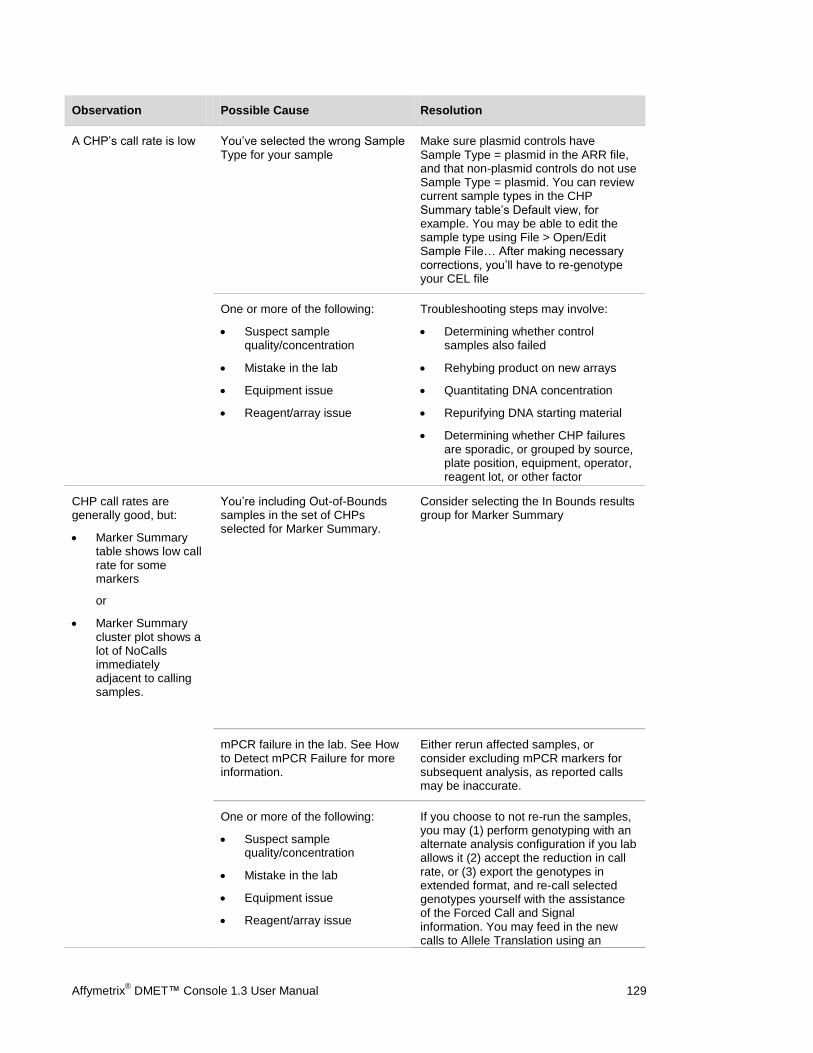
Affymetrix® DMET™ Console 1.3 User Manual 129
Observation Possible Cause Resolution
A CHP’s call rate is low You’ve selected the wrong Sample Type for your sample
Make sure plasmid controls have Sample Type = plasmid in the ARR file, and that non-plasmid controls do not use Sample Type = plasmid. You can review current sample types in the CHP Summary table’s Default view, for example. You may be able to edit the sample type using File > Open/Edit Sample File… After making necessary corrections, you’ll have to re-genotype your CEL file
One or more of the following:
Suspect sample quality/concentration
Mistake in the lab
Equipment issue
Reagent/array issue
Troubleshooting steps may involve:
Determining whether control samples also failed
Rehybing product on new arrays
Quantitating DNA concentration
Repurifying DNA starting material
Determining whether CHP failures are sporadic, or grouped by source, plate position, equipment, operator, reagent lot, or other factor
CHP call rates are generally good, but:
Marker Summary table shows low call rate for some markers
or
Marker Summary cluster plot shows a lot of NoCalls immediately adjacent to calling samples.
You’re including Out-of-Bounds samples in the set of CHPs selected for Marker Summary.
Consider selecting the In Bounds results group for Marker Summary
mPCR failure in the lab. See How to Detect mPCR Failure for more information.
Either rerun affected samples, or consider excluding mPCR markers for subsequent analysis, as reported calls may be inaccurate.
One or more of the following:
Suspect sample quality/concentration
Mistake in the lab
Equipment issue
Reagent/array issue
If you choose to not re-run the samples, you may (1) perform genotyping with an alternate analysis configuration if you lab allows it (2) accept the reduction in call rate, or (3) export the genotypes in extended format, and re-call selected genotypes yourself with the assistance of the Forced Call and Signal information. You may feed in the new calls to Allele Translation using an
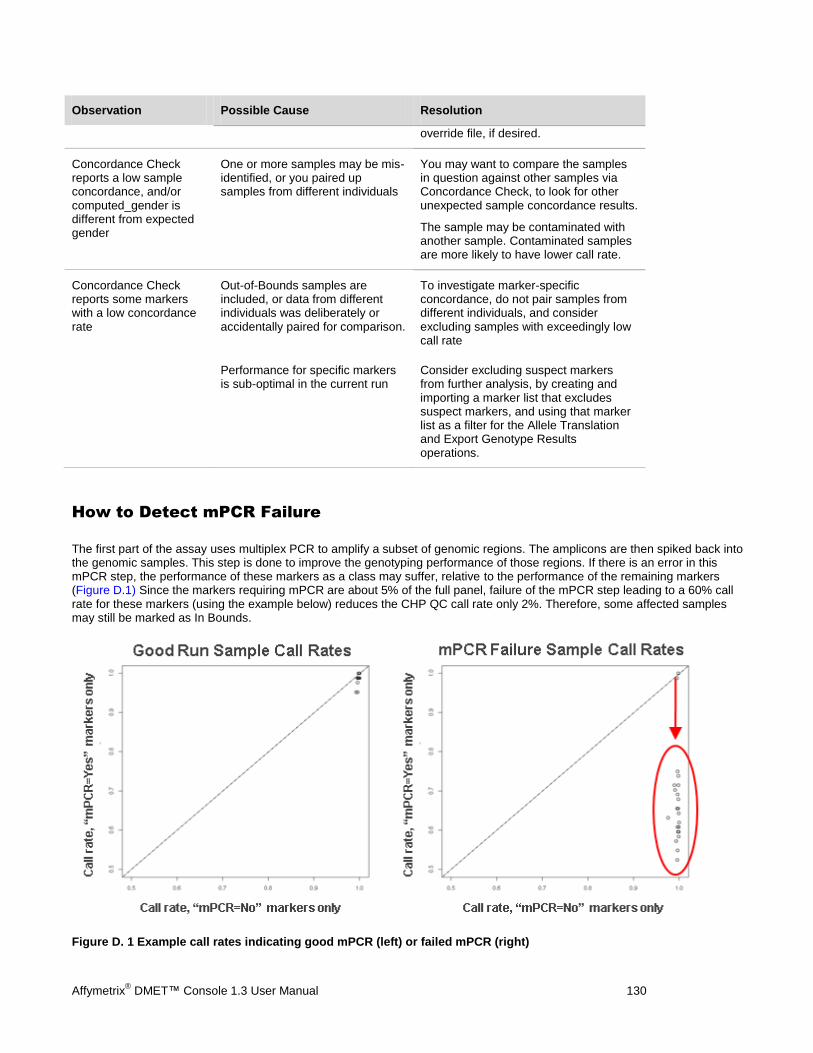
Affymetrix® DMET™ Console 1.3 User Manual 130
Observation Possible Cause Resolution
override file, if desired.
Concordance Check reports a low sample concordance, and/or computed_gender is different from expected gender
One or more samples may be mis-identified, or you paired up samples from different individuals
You may want to compare the samples in question against other samples via Concordance Check, to look for other unexpected sample concordance results.
The sample may be contaminated with another sample. Contaminated samples are more likely to have lower call rate.
Concordance Check reports some markers with a low concordance rate
Out-of-Bounds samples are included, or data from different individuals was deliberately or accidentally paired for comparison.
To investigate marker-specific concordance, do not pair samples from different individuals, and consider excluding samples with exceedingly low call rate
Performance for specific markers is sub-optimal in the current run
Consider excluding suspect markers from further analysis, by creating and importing a marker list that excludes suspect markers, and using that marker list as a filter for the Allele Translation and Export Genotype Results operations.
How to Detect mPCR Failure
The first part of the assay uses multiplex PCR to amplify a subset of genomic regions. The amplicons are then spiked back into the genomic samples. This step is done to improve the genotyping performance of those regions. If there is an error in this mPCR step, the performance of these markers as a class may suffer, relative to the performance of the remaining markers (Figure D.1) Since the markers requiring mPCR are about 5% of the full panel, failure of the mPCR step leading to a 60% call rate for these markers (using the example below) reduces the CHP QC call rate only 2%. Therefore, some affected samples may still be marked as In Bounds.
Figure D. 1 Example call rates indicating good mPCR (left) or failed mPCR (right)
Affymetrix® DMET™ Console 1.3 User Manual 131
It is recommended that for each run of samples, you inspect the proportion of samples that are marked In Bounds using the default sample QC threshold of qc_call_rate >= 98%. If the proportion of samples passing QC drops significantly below 95%, you should do further investigation to determine the root cause.
It is recommended that you display the line graph from the CHP Summary table, and look for patterns in the outlier samples. For example, if you track plate well as a sample attribute, you can select plate well as the x-axis category. If there is a performance problem with only specific plate rows, sorting the metrics by plate position will be informative.
If a significant fraction of CHPs suffer a qc_call_rate dip, the quickest way to determine whether mPCR failure is a cause, is to look at mPCR marker performance compared to non-mPCR marker performance. To do this:
1. Select Show Marker Summary on the Genotype Results All group for the current data set.
2. In the table, sort the mPCR Region column in descending order. This brings all mPCR markers to the top of the list. The mPCR Region column has a value of “Y” (yes) for mPCR markers.
3. As you scroll through the mPCR marker rows, review the Marker Call Rate. If a significant fraction of mPCR markers report a Marker Call Rate that’s substantially lower than the typical CHP call rate (from the CHP Summary table), then you have a problem with the mPCR step of the assay.
4. If a small fraction of CHPs suffer a qc_call_rate dip, then select Show Marker Summary on the Genotype Results Out of Bounds group. By selecting this group, Marker Call Rate should show a more pronounced difference between mPCR and
non-mPCR markers if mPCR failure occurred.
5. For a more quantitative assessment, you may want to reproduce the graph in Figure D.1. To do this:
a. Create two custom marker lists, one containing only mPCR Region = “Y” markers, and one containing only mPCR Region = “N” markers. Do this by displaying the DMET_Plus_All marker list, saving the table to file, and deleting unneeded marker rows.
b. Import the edited files as new marker lists.
c. Export Genotype Results, selecting the option to export collated genotype results (not extended format), and filter the output by the mPCR=Y and mPCR=N marker lists.
d. Using the exported data, recalculate each CHP file’s call rate for mPCR=Y markers versus mPCR=N markers. (Tip: Use the Microsoft
® Excel
® COUNTIF function for NoCall, and compare the proportion of NoCalls to the total number of
markers in each category).
e. Plot each sample’s mPCR=Y call rate vs its mPCR=N call rate, and look for samples with a significant deviation in call rate from the 1:1 line.
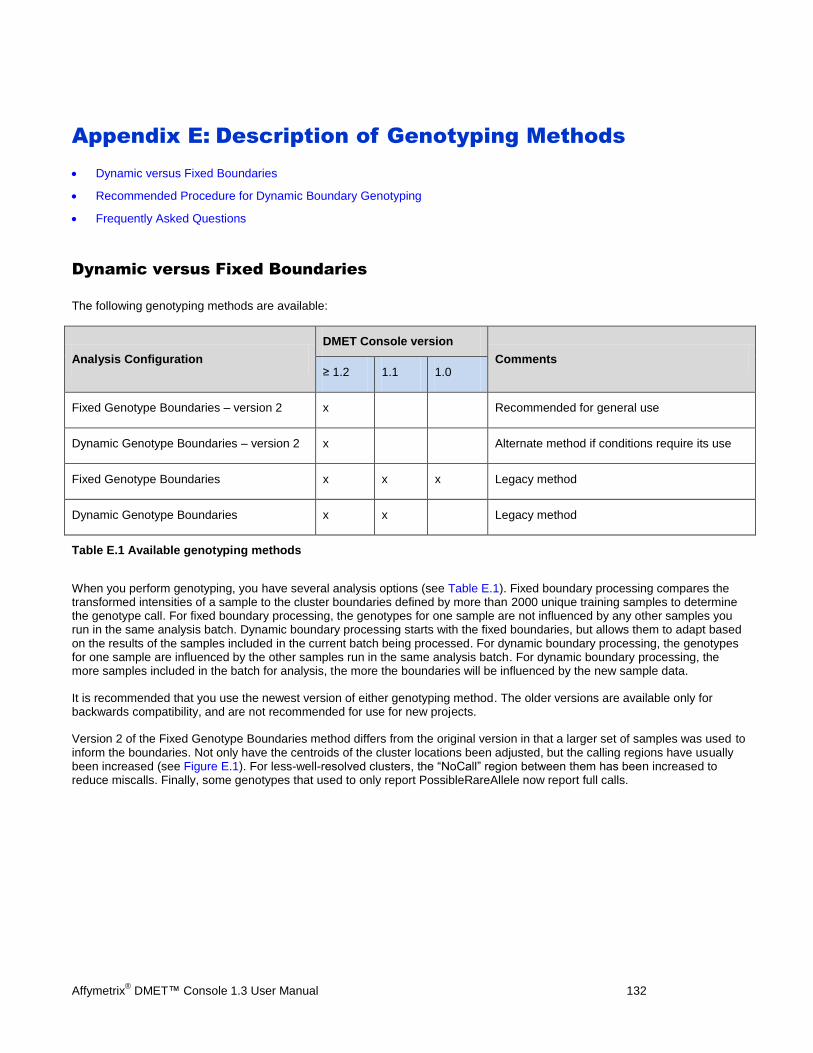
Affymetrix® DMET™ Console 1.3 User Manual 132
Appendix E: Description of Genotyping Methods
Dynamic versus Fixed Boundaries
Recommended Procedure for Dynamic Boundary Genotyping
Frequently Asked Questions
Dynamic versus Fixed Boundaries
The following genotyping methods are available:
Analysis Configuration
DMET Console version
Comments ≥ 1.2 1.1 1.0
Fixed Genotype Boundaries – version 2 x Recommended for general use
Dynamic Genotype Boundaries – version 2 x Alternate method if conditions require its use
Fixed Genotype Boundaries x x x Legacy method
Dynamic Genotype Boundaries x x Legacy method
Table E.1 Available genotyping methods
When you perform genotyping, you have several analysis options (see Table E.1). Fixed boundary processing compares the transformed intensities of a sample to the cluster boundaries defined by more than 2000 unique training samples to determine the genotype call. For fixed boundary processing, the genotypes for one sample are not influenced by any other samples you run in the same analysis batch. Dynamic boundary processing starts with the fixed boundaries, but allows them to adapt based on the results of the samples included in the current batch being processed. For dynamic boundary processing, the genotypes for one sample are influenced by the other samples run in the same analysis batch. For dynamic boundary processing, the more samples included in the batch for analysis, the more the boundaries will be influenced by the new sample data.
It is recommended that you use the newest version of either genotyping method. The older versions are available only for backwards compatibility, and are not recommended for use for new projects.
Version 2 of the Fixed Genotype Boundaries method differs from the original version in that a larger set of samples was used to inform the boundaries. Not only have the centroids of the cluster locations been adjusted, but the calling regions have usually been increased (see Figure E.1). For less-well-resolved clusters, the “NoCall” region between them has been increased to reduce miscalls. Finally, some genotypes that used to only report PossibleRareAllele now report full calls.

Affymetrix® DMET™ Console 1.3 User Manual 133
Figure E.1 The “Fixed Genotype Boundaries – version 2” method generally has larger calling regions than the original “Fixed Genotype Boundaries” method.
Compared to the original version, version 2 of the Dynamic Genotype Boundaries method also takes advantage of the larger set of training samples to inform the seed boundaries. The default size of the “NoCall” region between less-well-resolved clusters has been increased to reduce miscalls. Dynamic boundary processing may be useful if using low-quality input DNA, if deviating from the assay protocol, or if reagents have changed. Experimental conditions can yield clusters that deviate from the expectation, and dynamic boundaries can prove effective in adjusting the cluster positions to account for these deviations. Figure E.2 shows how the dynamic boundaries method improved the calling of a particular marker.
Figure E.2 The Dynamic Genotype Boundaries method updates cluster boundaries using supplied data.
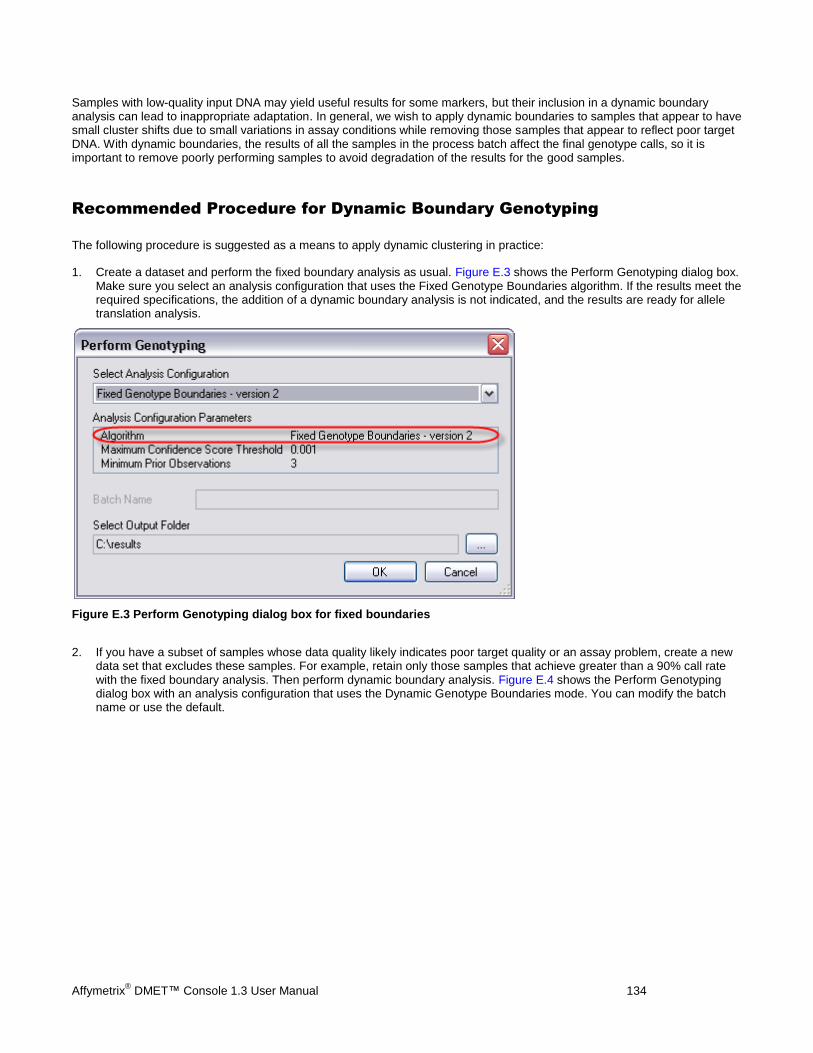
Affymetrix® DMET™ Console 1.3 User Manual 134
Samples with low-quality input DNA may yield useful results for some markers, but their inclusion in a dynamic boundary analysis can lead to inappropriate adaptation. In general, we wish to apply dynamic boundaries to samples that appear to have small cluster shifts due to small variations in assay conditions while removing those samples that appear to reflect poor target DNA. With dynamic boundaries, the results of all the samples in the process batch affect the final genotype calls, so it is important to remove poorly performing samples to avoid degradation of the results for the good samples.
Recommended Procedure for Dynamic Boundary Genotyping
The following procedure is suggested as a means to apply dynamic clustering in practice:
1. Create a dataset and perform the fixed boundary analysis as usual. Figure E.3 shows the Perform Genotyping dialog box. Make sure you select an analysis configuration that uses the Fixed Genotype Boundaries algorithm. If the results meet the required specifications, the addition of a dynamic boundary analysis is not indicated, and the results are ready for allele translation analysis.
Figure E.3 Perform Genotyping dialog box for fixed boundaries
2. If you have a subset of samples whose data quality likely indicates poor target quality or an assay problem, create a new data set that excludes these samples. For example, retain only those samples that achieve greater than a 90% call rate with the fixed boundary analysis. Then perform dynamic boundary analysis. Figure E.4 shows the Perform Genotyping dialog box with an analysis configuration that uses the Dynamic Genotype Boundaries mode. You can modify the batch name or use the default.
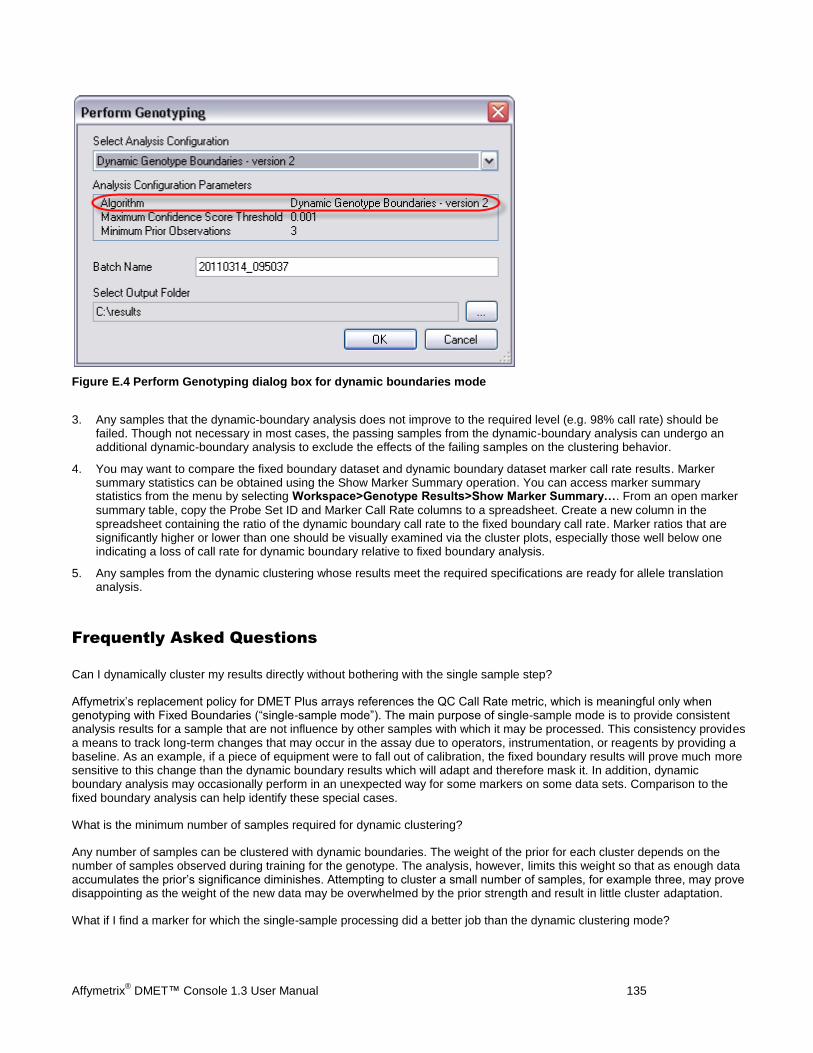
Affymetrix® DMET™ Console 1.3 User Manual 135
Figure E.4 Perform Genotyping dialog box for dynamic boundaries mode
3. Any samples that the dynamic-boundary analysis does not improve to the required level (e.g. 98% call rate) should be failed. Though not necessary in most cases, the passing samples from the dynamic-boundary analysis can undergo an additional dynamic-boundary analysis to exclude the effects of the failing samples on the clustering behavior.
4. You may want to compare the fixed boundary dataset and dynamic boundary dataset marker call rate results. Marker summary statistics can be obtained using the Show Marker Summary operation. You can access marker summary statistics from the menu by selecting Workspace>Genotype Results>Show Marker Summary…. From an open marker
summary table, copy the Probe Set ID and Marker Call Rate columns to a spreadsheet. Create a new column in the spreadsheet containing the ratio of the dynamic boundary call rate to the fixed boundary call rate. Marker ratios that are significantly higher or lower than one should be visually examined via the cluster plots, especially those well below one indicating a loss of call rate for dynamic boundary relative to fixed boundary analysis.
5. Any samples from the dynamic clustering whose results meet the required specifications are ready for allele translation analysis.
Frequently Asked Questions
Can I dynamically cluster my results directly without bothering with the single sample step?
Affymetrix’s replacement policy for DMET Plus arrays references the QC Call Rate metric, which is meaningful only when genotyping with Fixed Boundaries (“single-sample mode”). The main purpose of single-sample mode is to provide consistent analysis results for a sample that are not influence by other samples with which it may be processed. This consistency provides a means to track long-term changes that may occur in the assay due to operators, instrumentation, or reagents by providing a baseline. As an example, if a piece of equipment were to fall out of calibration, the fixed boundary results will prove much more sensitive to this change than the dynamic boundary results which will adapt and therefore mask it. In addition, dynamic boundary analysis may occasionally perform in an unexpected way for some markers on some data sets. Comparison to the fixed boundary analysis can help identify these special cases.
What is the minimum number of samples required for dynamic clustering?
Any number of samples can be clustered with dynamic boundaries. The weight of the prior for each cluster depends on the number of samples observed during training for the genotype. The analysis, however, limits this weight so that as enough data accumulates the prior’s significance diminishes. Attempting to cluster a small number of samples, for example three, may prove disappointing as the weight of the new data may be overwhelmed by the prior strength and result in little cluster adaptation.
What if I find a marker for which the single-sample processing did a better job than the dynamic clustering mode?

Affymetrix® DMET™ Console 1.3 User Manual 136
Having examined the clusters, you may determine that while generally satisfied with the results from one genotyping method, another method did better for some of the markers. CHP binary file results cannot be modified, and DMET Console does not have an operation that merges raw genotype results from different analyses. However, calls can be overridden during input into the allele translation process using a manually-edited genotype override file. The format of the override file is identical to the format of the *_uncalled.rpt file generated by the allele translation operation. Although you can add additional genotype rows to the override file by selecting the appropriate columns of the *_translations_comprehensive.rpt file, this procedure is not supported by Affymetrix. Allele translation is performed again, but this time the Override specific genotype calls option is checked and the edited override file is selected (Figure E.5). The allele translation will then reflect the modified calls.
Figure E.5 Allele translation dialog box when using modified calls
How can I tell which genotyping method was used to generate existing CHP results?
The CHP Summary table displays the field Batch Name. If the results in a given CHP file used a version of the Dynamic Genotype Boundaries algorithm, the batch name is displayed. The batch name for a specific CHP file will be empty only if the Fixed Genotyping Boundaries algorithm was used. However, DMET Console does not distinguish between different versions of either the fixed boundaries or genotype boundaries methods. To unambiguously determine which version was used, looking into the CHP file itself will tell you the parameters used. The CHP file is a binary format, but the beginning of the file is readable using a basic text editor like NotePad. The following table specifies the search string to look for in the CHP header, which indicates which reference model file was used to genotype the sample.
Genotyping Analysis Configuration CHP file header search string
(Remember the space between each character!)
Fixed Genotype Boundaries D M E T _ P l u s . v 1 . g e n o m i c . r e f . a 5
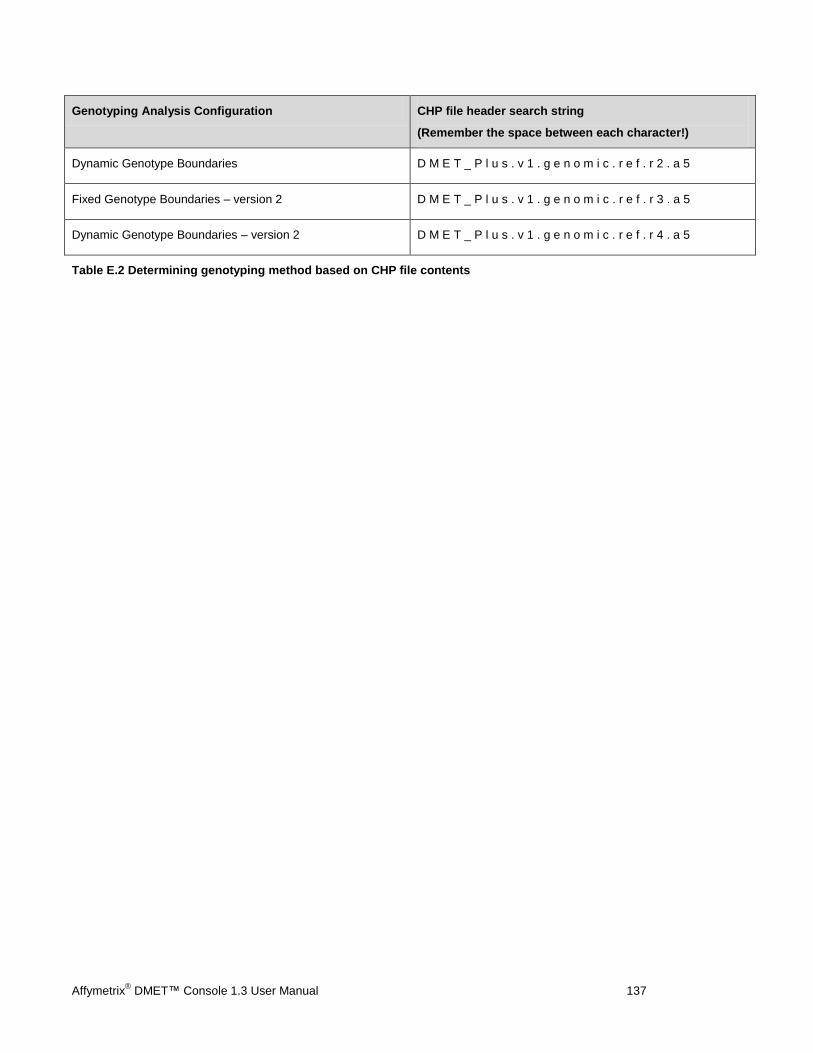
Affymetrix® DMET™ Console 1.3 User Manual 137
Genotyping Analysis Configuration CHP file header search string
(Remember the space between each character!)
Dynamic Genotype Boundaries D M E T _ P l u s . v 1 . g e n o m i c . r e f . r 2 . a 5
Fixed Genotype Boundaries – version 2 D M E T _ P l u s . v 1 . g e n o m i c . r e f . r 3 . a 5
Dynamic Genotype Boundaries – version 2 D M E T _ P l u s . v 1 . g e n o m i c . r e f . r 4 . a 5
Table E.2 Determining genotyping method based on CHP file contents