Embed Size (px)
Citation preview
I
i i l I I I
I I
l I J
!
\
COMPARISON OF CRITICAL CHAIN AND CRITICAL PA TH METHODOLOGIES
IN CONSTRUCTION MANAGEMENT
by
Kemal Okumus
B.S. in C.E., Bogazici University, 1987
~~
~~~
Submitted to the Institute for Graduate Studies in
Science and Engineering in partial fulfillment of
the requirements for the degree of
Master of Science
m
Civil Engineering
\\\1111!1!\l!!IJlll!I II\\\\ NEU
Bogazici University
2002
rnfflllllllllllllllll ~
I
I
I
I
111
ACKNOWLEDGMENTS
I express my gratitude to Prof. Gulay ALTAY, who is my thesis supervisor, for his
help in every stage of my thesis study.
I would like to thank to my colleague, Cost Engineer, Ahmet AGRJBOZ who has
been very kind in giving me support to supply the documentary works during my thesis
study.
I would also like to thank to my family who has always encouraged and supported me
during my study.
l - - -
IV
ABSTRACT
COMPARISON OF CRITICAL CHAIN AND CRITICAL PATH
METHODOLOGIES IN CONSTRUCTION MANAGEMENT
According to Peter Drucker, the fundamental task of management is, to make people
capable of joint performance through common goals, common values, the right structure,
and the training and development they need to perform and respond to change.
The important issue in this description is to respond to change. As Construction
sector become more competitive, the need for improvement embraces every aspect of
business. Traditionally, construction had low barriers to entry and cash positive. Change is
inevitable and provides extraordinary opportunity. It is being driven by demands from
clients, markets and the share holders for greater predictability in project performance in all
respects- time, quality and cost. Winners will be the ones able to manage the risk and
uncertainity. Although the stakeholders require predictability in time, quality and cost,
Projects are late, over budget and mostly change is scope. According to a study by Standish
Group, 30 per cent of IT -projects cancelled before finished, 75 per cent of completed
projects are late, average cost overruns are 189 per cent and average time overruns are 222
percent, and according to a study by USA Ministry of Energy in the last 20 years, 31 of 80
projects was cancelled after spending US$ IO billion, 50 per cent of them have time delays,
28 per cent of them cost overruns. In order to overcome these consequences, new
methodologies or system thinking has to be adapted to how we manage projects.
This thesis study tries to identify the benefits from an improvement methodology
called "Critical Chain" developed through the " Theory of Constraints" by comparing with
the former Critical Path Methodology. Theory of Constraints, developed by Dr. Eliyahu
Goldratt, uses methodologies to identify and focus specific resources, which restrict
organization's ability to improve, which are called "constraints".
------------
I I I I I I
t i!'
I I I :
I l i I I ! ' I !
i I I I I
V
OZET
iNSAA T YONETiMiNDE KRiTiK ZiNCiR VE KRiTiK YOL
METODOLOJiLERiNiN KARSILASTIRILMASI
Peter Drucker'a gore, yonetimin temel gorevi, ortak hedeflerle, ortak degerlerle,
dogru bir yap: ile ve gerceklestirmelerl gereken egitim ve gelisrnelerle ile, insanlan birlikte
hareket etmelerini saglarnak ve degisime cevap verecek hale getirmektir.
Yonetirnin bu tarnmmda en onemli konu degisime cevap verebilrnektir. lnsaat
sektcru daha fazla rekabetci olmakta ve her konuda gelisme ihtiyacnu ortaya koymaktadir.
Geleneksel olarak, Insaat sektoru giris icin az engele sahiptir ve nakit olarak arudadir.
Degisirn kacimlmaz olup, onernli imkanlar yaratmaktadir. Miisteriler tarafmdan, proje
performansmm her konusunda zaman, kalite ve maliyet olarak daha fazla tahmin
edilebilirlik talep edilmektedir. Ayrn sekilde piyasalar ve ortaklar daha fazla tahmin
edilebilirlik talep etmektedirler. Kazananlar risk ve belirsizligi daha iyi yonetenler
olacaktir. Proje ortaklan zaman, kalite ve silre belirligi talep etselerde, projeler gecikir,
butcelerini asar ve genellikle kapsarnlan degisir. Standish Group tarafmdan yapilan bir
cahsmaya gore IT projelerinin yi.izde 30'u tamamlanmadan iptal edilrnis, yi.izde 75'i gee
tamamlanrms, ve ortalama maliyet asirm yi.izde 189 ve zaman asarm yi.izde 222 olmustur.
Amerikan Enerji Bakanhgi tarafmdan yapilan bir calismaya gore son 20 yilda 80 projenin
31 'i 10 Milyar US$ harcandiktan sonra iptal edilmis, projelerin yi.izde 50'sinde zaman
gecikmesi ve yi.izde 28'inde maliyet artisi olmustur, Projeleri nasil yonettigimiz konusunda
yeni metodolojiler ve sistem dusuncelerirn uygulamaya koymahyiz.
Bu tez cahsrnasi, "Kisitlar Teorisi"nin "Kritik Zincir" ve "Kritik Yol"
Metodolojilerini karsrlastirarak, avantajlanm ortaya koymaya cahsmaktadir, Dr. E. Goldratt
tarafmdan gelistirilen "Kisitlar Teorisi", organizasyonun ileri gitmesini engelleyen ve
"Kisit" olarak adladmlan bazi kaynaklan ortaya cikanp, bunlara yogunl~maktad1r.
I I I I I I
VI
TABLE OF CONTENTS
ACKNOWLEDGMENTS iii
ABSTRACT .iv
OZET v
LIST OF FIGURES ix
· LIST OF SYMBOLS AND ABBREVIATIONS xi
1. INTRODUCTION 1
1.1. Construction Projects 1
1.1.1. Specifications of Construction Projects 2
1.1.2. Stages of Construction Projects 3
1.2. Project Management. 4
1.3. Project Time Management 5
1.3.1. Activity Definition 6
1.3.2 Activity Sequencing 6
1.3.3. Activity Duration Estimation 7
1.3.4. Schedule Development. 8
1.3.5. Schedule Control. 9
1.4. Project Cost Management. 10
Resource Planning 11
Cost Estimating 11
Cost Budgeting '. 12
Cost Control. : 12
1.5. Definition and Role of Cost Engineer. 13
1.6. Project Cost and Time Estimation 16
1.6.1. Accuracy of an Estimate , 16
1.6.2. Types of Estimates 18
1.6.2.1. Order of Magnitude Estimate 18
1.6.2.2. Budget Estimate 19
1.6.2.3. Definite Estimate 20
1.7. Project Cost Control 21
1.4.1.
1.4.2.
I Ii 1.4.3.
l 1.4.4.
I I
I
I
I I I
I
Vil
1.7.1. Objectives of a Cost Control Program 21
1. 7 .2. Elements of a Cost Control System 21
1.8. Project Task Duration Estimating 22
2. THEORY OF CONSTRAINTS AND CRITICAL CHAIN , 26
2.1. Theory of Constraints 26
2.1.1. Toe Application Areas 27
2.1.2. Types of Constraints 28
2.1.2.1. Demand Constraints 29
2.1.2.2. Production Constraints 29
2.1.2.3. Raw Materials Constraints : 29
2.1.3. Measuring Business Performance 30
2.1.4. The Thinking Process Tools 30
2.1.5. Easing Resistance to Change 32
2.2. Critical Chain 32
2.2.1. Critical Chain Project Management Methodology 36
2.2.1.1. Estimating Task Durations 37
2.2.1.2. Student Syndrome 37
2.2.1.3. Parkinson's Law and No Early Finishes 39
2.2.1.4. The Effect of Maltitasking .41
2.2.2. The Theory of Critical Chain 44
2.2.3. Single versus Multi-Project Implementation 50
2.2.4. Fundamental Project Planning I Scheduling 50
2.2.4.1. Two-Point Estimates and Risk Management. 52
2.2.4.2. A Relay Race Approach ; 53
2.2.5. Project Control and Risk response Control 55
2.2.5.1. Project Control with Buffer Management. 56
2.2.5.2. Buffer Management and Risk Identification 57
2.2.6. Critical Chain Project Management Software 57
2.3. Comparison of Critical Chain and PM Body of Knowledge 58
2.3. I. Project Time Management. 61
2.3.1.1. Activity Sequencing 61
2.3.1.2. Activity Duration Estimating 61
\1111
2.3.1.3. Schedule Development. 61
2.3.1.4. Schedule Control. 62
2.3.2. Project Cost Management 62
2.3.2.1. Resource Planning 62
2.3.2.2. Cost Budgeting 63
2.3.2.3. Cost Control. 63
2.3.2.4. Conclusions 63
2.3 .3. Case Study Application 64
3. RESULTS AND DISCUSSION 67
APPENDIX A : PROCESS PLANT FEASIBILITY STUDY 70
REFERENCES 78
REFERENCES NOT CITED 80
------~
I II i II II I
I I I
I I I II I I Ii I I
IX
LIST OF FIGURES
Figure 1.1. Historical project phases .4
Figure 1.2. Accuracy of an estimate versus time 16
Figure 2.1. Hidden safety in estimating 37
I Figure 2.2. Student syndrome (Goldratt Institute) 38
Figure 2.3. Student syndrome 39
Figure 2.4. The multiplying effect of multitasking .42
Figure 2.5. The project completion without multitasking 43
Figure 2.6. Distribution of possible task duration outcomes .44
Figure 2.7. Combination of task durations in a project 46
Figure 2.8. Sample critical chain schedule 48
Figure A.l. Process Plant Feasibility Study- Critical Path Schedule 71
Figure A.2. Critical Path - Resource Graph of Project Manager. 72
Figure A.3. Critical Path - Resource Graph of Commercial Manager 73
Figure A.4. Process Plant Feasibility Study - Critical Chain Taks Schedule 74
Figure A.5. Process Plant Feasibility Study - Critical Chain Schedule 75
I I I I I I
I I I
I I I I I I J
i I
Figure A.6. Critical Chain - Resource Graph of Project Manager 76
Figure A. 7. Critical Chain - Resource Graph of Commercial Manager. 77
.•. "J
I I I I I I
AACE
ADM
cc CCPM
CPM
IPMA
EVM
PERT
PDM
PMBOK
PM!
ROI
roe TQM
WBS
XI
LIST OF SYMBOLS AND ABBREVIATIONS
American Association of Cost Engineers
Arrow diagramming method
Critical Chain
Critical Chain Project Management
Critical Path Method
International Project Management Association
Earned value management
Program Evaluation and Research Technique
Precedence diagramming method
Project Management Body of Knowledge
Project Management Institution
Return on Investment
Theory of Constraints
Total Quality Management
Work Breakdown Structure
I I I I I I
I I
I
I I I
I I I
1. INTRODUCTION
1.1. Construction Projects
Project can be defined in terms of its distinctive characteristics, a temporary endeavor
undertaken to create a unique product or a service [1]. Construction Projects are a group of
special unrepetitive activities, which has to be completed with specific resources within a
specified time. Construction requires specific engineering applications and it is a contract
or a work schedule, with a subject of structures like building, highway, bridge, dam,
harbor, power plant, petrochemical plant or steel construction etc., aiming to satisfy the
demand or a specific consumer or a user. This definition defines the construction as a
process. We can also define construction as a result. Construction can be· defined as
products, which are built over an area by using material, manpower and equipment. In
developing countries, construction industry is an important factor of progress and
technology. We cannot think a life style or a part of life without dependence on
construction. Management of construction projects are specific events, as each of them is a
unique set of coordinated activities, undertaken by an individual or an organization within
a defined schedule, cost and performance parameters [2].
1.1.1. Specifications of Construction Projects
Construction projects can cover anything from a 2-day engineering effort to resolve a
minor technical problem to a present-day super project such as GAP project. Cost
engineering has application regardless of project size. The principles of cost engineering as
the same regardless of industry and size and can be applied to most situations [3).
Construction project has a defined aim like building a specified size of specific plant
in a specific area. It has a defined start and a finish time [2]. It has a concrete finish time
when the target, which is aimed, is achieved. Generally construction project is unique and
unrepetetive. It is a set of activities, which requires time and monetarial resources, to
establish a specific product. These construction activities can be parallel or successive.
-~~--~-~
I I I I I I
I I I
I I I I I I I I r ~·
2
It requires a different organizational structure and different functional requirements.
It is dependant on land or an area. It is constructed to stay on the same area for the lifetime.
It is heavy and has a big volume and it is complex. It requires an extensive effort. It is
expensive and has a long life.
There is a multitude of reasons that a corporation or a company decides to build a
project. The decision could be the result of a favorable analysis of the marketing situation
that shows future increased product demand or the research department may develop new
products with high sale potential, or new government or social requirements may dictate
the need for new facilities, especially in the area of environmental protection. Regardless of
which of the above-mentioned reasons for building a project apply, the ultimate reason in
virtually every case is economic.
The main aim is to make the maximum return that can be made for the money
invested. In making this extremely important decision, management asks and needs the
answer to many questions. How many products should I make? Where should the plant be
built? How competitive will a new product be? If diversification is desirable, where and
what?
To answer most of these questions raised requires economic studies. Economic
studies cannot be made without investments, which in tum requires an estimate and that in
turn requires a Cost Engineer [3].
Not only is the Cost Engineer needed during the very early evaluation stage, but also
similar management type decisions must be made throughout the life if a project. We need
cost control during all phases of the projects and we have the need for cost control services
throughout a project life cycle in order to achieve favorable results. Essential part of any
project is estimating or predicting what something will cost and then controlling the cost of
doing that something within the limits of the estimate.
Estimate is a prediction of manner in which project will be executed. The estimate
basis should reflect a plan of how the project people feel or predict the job will be done.
I
I
I I I
I I I
I
I I I
3
In case of a design, a flow plan and equipment list is made which predicts the final
design will look like when completed. The estimator develops a plan and a schedule, which
translates the flow plan and equipment list into cost values and purchase dates and costs by
by applying unit costs to the material quantities.
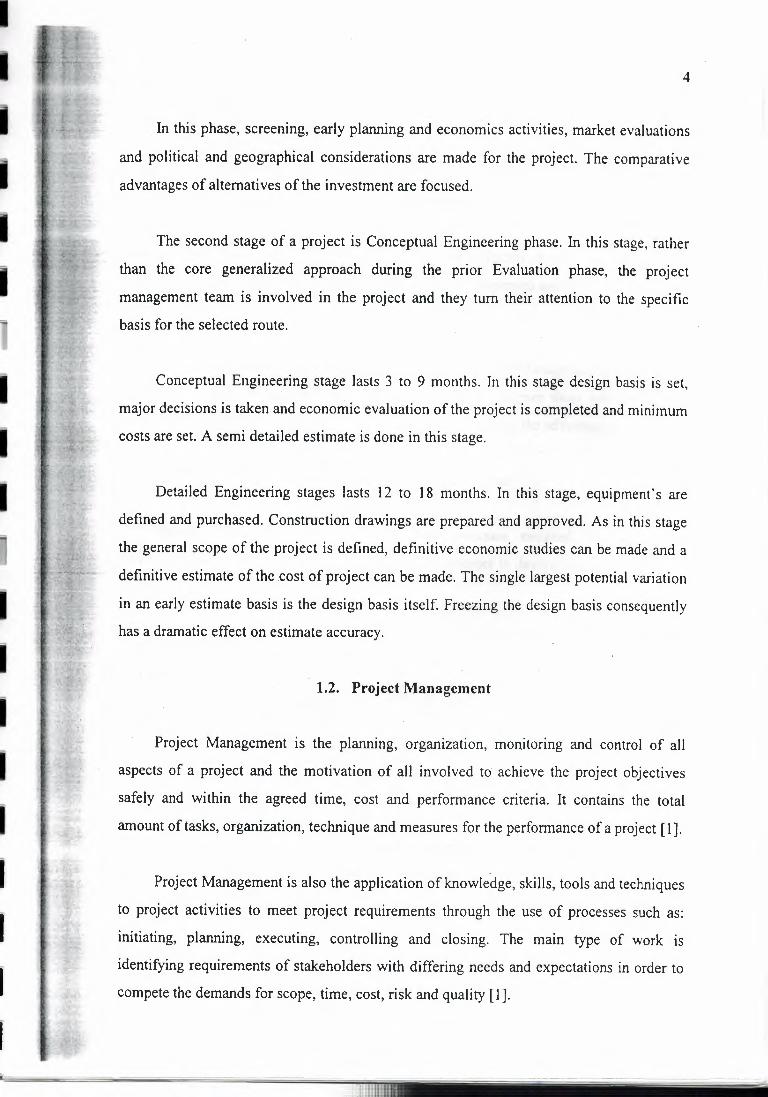
1.1.2. Stages of Construction Projects
Construction projects can be divided into 4 phases; Evaluation and Planning,
Conceptual Engineering, Detailed Engineering and Construction [3]. The stages are
successive but they can be intersecting. In Figure 1.1 historical project phases, types of
estimate at every phase and time period are shown.
Conceptual Engineering 3 rn to 9 rn
Construction 1 yr to 3 yr
s T A
R T u p
Preliminary Estimate
Semidetailed Estimate
Definitive Estimate
Evaluation and Planning
Detailed Engineering
3 rn to 3 yr 12 rn to 18 rn
Figure 1.1. Historical project phases [3]
Evaluation and Planning phase covers the period from inception until a decision is
made on a definitive plan of execution. What will be built where and why. Generally this
phase lasts 3 months to 3 years. But there are projects having an evaluation period of weeks
or a project evaluation, which lasts years, like to build a tunnel under the Bosphorus
Straight - istanbul. In this phase, as the scope of project is not clear yet, a preliminary
estimate is made to see the general picture of the work. Main evaluation of delta costs of
possible alternatives are carried out in order to select the most feasible solution of the project.
I I I I I I
I I I
I I I I I I r
r
r
4
In this phase, screening, early planning and economics activities, market evaluations
and political and geographical considerations are made for the project. The comparative
advantages of alternatives of the investment are focused.
The second stage of a project is Conceptual Engineering phase. In this stage, rather
than the core generalized approach during the prior Evaluation phase, the project
management team is involved in the project and they turn their attention to the specific
basis for the selected route.
Conceptual Engineering stage lasts 3 to 9 months. In this stage design basis is set,
major decisions is taken and economic evaluation of the project is completed and minimum
costs are set. A semi detailed estimate is done in this stage.
Detailed Engineering stages lasts 12 to 18 months. In this stage, equipment's are
defined and purchased. Construction drawings are prepared and approved. As in this stage
the general scope of the project is defined, definitive economic studies can be made and a
definitive estimate of the .cost of project can be made. The single largest potential variation
in an early estimate basis is the design basis itself. Freezing the design basis consequently
has a dramatic effect on estimate accuracy.
1.2. Project Management
Project Management is the planning, organization, monitoring and control of all
aspects of a project and the motivation of all involved to achieve the project objectives
safely and within the agreed time, cost and performance criteria. It contains the total
amount of tasks, organization, technique and measures for the performance of a project [1].
Project Management is also the application of knowledge, skills, tools and techniques
to project activities to meet project requirements through the use of processes such as:
initiating, planning, executing, controlling and closing. The main type of work is
identifying requirements of stakeholders with differing needs and expectations in order to
compete the demands for scope, time, cost, risk and quality [ 1].
I I I I I I
I I I
I I I I I I I
I
5
Project Management Body of Knowledge (PMBOK) developed by Project
Management Institute organized project management knowledge and practice in terms of
their component processes into nine knowledge areas which are areas Project Integration
Management, Project Scope Management, Project Time Management, Project Cost
Management, Project Quality Management, Project Human Resources Management,
Project Communications Management, Project Risk Management and Project Procurement
Management [I].
In this study Project Time Management and Project Cost Management is explained in
detail of inputs, tools and techniques and outputs as to compare them with the current
applications of Critical Chain Methodology in order to focus on the advantages.
1.3. Project Time Management
Project Time Management includes the processes required ensuring timely
completion and control of the project [I]. Major processes in developing the project time
schedule are:
• Activity Definition,
• Activity Sequencing,
• Activity Duration Estimating,
• Schedule Development,
• Schedule Control.
Each process may involve effort from one or more individuals or groups of
individuals, based on the needs of the project. Each-process generally occurs at least once
in every project phase. On some projects, especially smaller ones, activity sequencing,
activity duration estimating and schedule development are so tightly linked that they are
viewed as single process. Schedule control and schedule development is also an important
part of this process. After all the activities are defined and sequenced, their probable
durations are estimated and the schedule of the project is developed.
----
I I
I I I
I I I
I I I I I I I I I
6
t.3.1. Activity Definition
Activity definition involves identifying and documenting the specific activities that
must be performed to produce the deliverables and sub deliverables identified in the Work
Breakdown Structure (WBS). Implicit in these processes in the need to define the activities
such that the project objectives will be met. Objectives should be defined clearly.
• Inputs to Activity Definition are:
o Work breakdown structure,
o Scope statement,
o Historical information,
o Constraints,
o Assumptions,
o Expert judgment.
• Tools and Techniques for Activity Definition:
o Decomposition,
o Templates.
• Outputs from Activity Definition:
o Activity list,
o Supporting detail,
o Work breakdown structure updates:
1.3.2. Activity Sequencing
Activity sequencing involves identifying and documenting interactivity logical
relationships. Activities must be sequenced accurately to support later development of a
realistic and achievable schedule. Sequencing can be performed with the aid of a computer
by using project management software or with manual techniques.
• Inputs to Activity Sequencing:
o Activity list,
o Product description,
--
I I I i I I
I I I
I I I I I I I
7
o Mandatory dependencies,
o Discretionary dependencies,
o External dependencies,
o Milestones.
• Tools and Techniques for Activity Sequencing:
o Precedence diagramming method (PDM),
o Arrow diagramming method (ADM),
o Conditional diagramming methods,
o Network templates.
• Outputs from Activity Sequencing:
o Project network diagrams,
o Activity list updates.
1.3.3. Activity Duration Estimation
Activity duration estimating is the process of taking information on project scope and
resources and then developing durations for input to schedules.
The inputs for the estimates of duration originate from the person or group on the
project team who is most familiar with the nature of a specific activity. The estimate is
often progressively elaborated and the process considers the quality and availability of the
input data. The person on the project team who is most familiar with the nature of a
specific activity should make or at least approve the estimate. Estimating the number of
· work periods required to complete an activity would often require consideration of elapsed
time as well.
• Inputs to Activity Duration Estimating:
o Activity list,
o Constraints,
o Assumptions,
o Resource requirements and Resource capabilities,
o Historical information,
ii1ii- -- - -------
I
I
I I
I
8
o Identified risks.
• Tools and Techniques for Activity Duration Estimating:
o Expert judgment,
o Analogous estimating,
o Quantitatively based durations,
o Reserve time and contingency.
• Outputs from Activity Duration Estimating:
o Activity duration estimates,
o Basis of estimates,
o Activity list updates.
1.3.4. Schedule Development
Schedule development means determining start and finish dates for project activities.
If the start and finish dates are not realistic, then the project is unlikely to be finished as
scheduled. The schedule development process must often be iterated (along with the
process that provides inputs, especially duration estimating and cost estimating) prior to
determination of the project schedule.
• Inputs to Schedule Development:
o Project network diagrams,
o Activity duration estimates,
o Resource requirements and Resource pool description,
o Calendars,
o Constraints,
o Assumptions,
o Leads and lags,
o Risk management plan,
o Activity attributes.
• Tools and Techniques for Schedule Development:
o Mathematical analysis,
o Duration compression,
fllllllllllliillllllllllllllllllllli
II
I i I
I I I
I I I
I I I I I
9
o Simulation,
o Resource leveling heuristics,
o Project management software,
o Coding structure.
• Outputs from Schedule Development:
o Project schedule,
o Supporting detail,
o Schedule management plan,
o Resource requirement updates.
1.3.5. Schedule Control
Schedule control is concerned with influencing the factors that create schedule
changes to ensure that changes are agreed upon and determining that the schedule has
changed and managing the actual changes when and as they occur. Also necessary
corrective actions are taken in order to overcome delays because of change requests.
• Inputs to Schedule Control:
o Project schedule,
o Performance reports,
o Change request,
o Schedule management plan.
• Tools and techniques for Schedule Control:
o Schedule change control system,
o Performance measurements,
o Additional planning,
o Project management software,
o Variance analysis.
• Outputs from Schedule Control:
o Schedule updates,
o Corrective action,
o Lessons learned.
I I I i i i
I
I
I I I I
10
1.4. Project Cost Management
Project Cost Management includes the processes required to ensure that the project is
completed within the approved budget [1). Major processes are;
• Resource Planning,
• Cost Estimating,
• Cost Budgeting,
• Cost Control.
Each process may involve effort from one or more individuals or groups of
individuals, based on the needs of the project. Each process generally occurs at least once
in every project phase.
Project cost management is primarily concerned with the cost of the resources needed
to complete project activities. However, project cost management should also consider the
effect of project decisions on the cost of using the project's product.
In many application areas, predicting and analyzing the prospective financial
performance of the project's product is done outside the project. In other projects like
capital facilities projects, project cost management also includes this work. When such
predictions and analyses are included; project cost management will include additional
processes and numerous general management techniques such as return on investment,
discounted cash flow, payback analysis and others. When project costs are used as a
component of a reward and recognition system, controllable and uncontrollable costs
should be estimated and budgeted separately to ensure that rewards reflect actual
performance. On some projects, especially smaller ones, resource planning, cost estimating
and cost budgeting are so tightly linked that they are viewed as single process.
1.4.1. Resource Planning
Resource planning involves determining what physical resources and what quantities of each should be used and when they would be needed to perform project activities.
I I I II II I
I I I
I I I I I I I I I
1 l
• Inputs to Resource Planning:
o Work breakdown structure,
o Historical information,
o Scope statement,
o Resource pool description,
o Organizational policies,
o Activity duration estimates.
• Tools and Techniques for Resource Planning:
o Expert judgment,
o Alternatives identification,
o Project management software.
• Outputs from Resource Planning:
o Resource requirements.
1.4.2. Cost Estimating
Cost estimating involves developing an approximation, estimate, of the costs of the
resources needed to complete project activities. In approximating cost, the estimator
considers the causes of variation of the final estimate for purposes of better managing
project.
• Inputs to Cost Estimating:
o Work breakdown structure,
o Resource requirements,
o Resource rates,
o Activity duration estimates,
o Estimating publications,
o Historical information,
o Chart of accounts,
o Risks.
• Tools and Techniques for Cost Estimating:
o Analogous estimating,
1- 1 I i i i
I I i
I I I I I I i I
12
o Parametric modeling,
o Bottom-up estimating,
o Computerized tools,
o Other cost estimate methods.
• Outputs from Cost Estimating:
o Cost estimates,
o Supporting detail,
o Cost management plan.
1.4.3. Cost Budgeting
Cost budgeting involves allocating the overall cost estimates to individual activities
or work packages to establish a cost baseline for measuring project performance. Normally
estimates are done after budgetary approval is provided. In order to get more feasible
results, estimates should be done prior to budget request wherever possible.
• Inputs to Cost Budgeting:
o Cost estimates,
o Work breakdown structure,
o Project schedule,
o Risk management plan.
• Tools and Techniques for Cost Budgeting:
o Cost budgeting tools and techniques.
• Outputs from Cost Budgeting:
o Cost baseline.
1.4.4. Cost Control
Cost control is concerned with influencing the factors that create changes to the cost
baseline ensure that changes are agreed upon and determining that the cost baseline has
changed and managing the actual changes when they occur at every stage of the project.
II
I
I
13
Cost control includes monitoring cost performance to detect and understand
variances from plan and ensuring that all appropriate changes are recorded accurately in the
cost baseline and preventing unauthorized changes from being included in the cost
.,, - baseline. Cost control is used for informing appropriate stakeholders of authorized changes
. and acting to bring expected costs within acceptable limits.
• · Inputs to Cost Control:
o Cost baseline,
o Performance report,
o Change requests,
o Cost management plan.
• Tools and Techniques for Cost Control:
o Cost change control system,
o Performance measurement,
o Earned value management (EVM),
o Additional planning,
o Computerized tools.
• Outputs from Cost Control:
o Revised cost estimates,
o Budget updates,
o Corrective action,
o Estimate at completion,
o Project closeout,
o Lessons learned.
1.5. Definition and Role of Cost Engineer
Cost Engineering is that area of engineering judgment and experiences are utilized in
the application of scientific principles and techniques to the problems of cost estimation,
cost control and profitability [3]. This definition clearly emphasizes that cost estimating
and cost control are areas of engineering practices using scientific principles and
techniques and requires a strong engineering background.
II II ,~ 1-
T
r IT ri
14
The cost engineer should be involved in all phases of a project life cycle, from initial
planning and evaluation to the startup of the plant after construction. Cost Engineer plays
an important role in each of the four phases of a project. Generally the earlier he is brought
into the picture the more effective he can be. Although the first stage, Planning and
Evaluation stage can often be the most critical stage, little or no Cost Engineering
assistance is sought by or made available to management.
During the Evaluation Phase, the Cost Engineer provides the cost estimates needed in
the economic evaluations of a number of different areas. He makes different case studies
reflecting alternate processes or alternate product yields. He studies on cost changes due to
choosing different geographic locations. He evaluates sketch of a new process being
developed, making coordinated studies by research or work development departments. In
this stage, cost is the most important factor but very little time or effort was spent
establishing the basis for a total cost picture and delta costs are evaluated in order to select
the most economical case.
In this stage highly critical decisions are made. Once the project is approved, future
decisions can only involve a portion of the project; but at the early evaluation stage, a
"make-or-break" decision is made on the total project value. But in this stage the
information, which is available to the Cost Engineer, is very less and unreliable. It is very
difficult to extract the necessary information to improve the accuracy of the estimate'. After
a decision is made to proceed, the project moves to the next phase, which is establishing a
firm design basis for the selected route.
The Basic-Design phase is the stage in project development at which the project and
management persons are involved in the project and they turn their attention to the specific
basis for the selected route. In this phase the process or basic-design is firmed. The physical
layout of the facilities involved is given consideration.
The need for support facilities like utilities and off-plot items such as storage, roads
is reviewed. Cost Engineer gives more serious thought to timing and he discusses project
execution strategy with the project management team.
I
I I I
n
15
As because most areas are not finalized, during this phase Cost Engineer must do a
considerable amount of predicting to visualize what the final detailed design will look like.
He must be designer of all sorts. He needs to develop a time schedule for the project and
therefore has to be a scheduler. He needs to gather and analyze historical cost data,
therefore has to be a data analyst. He must establish cost for different geographic locations
and countries and predict escalation rates. He must predict contract strategy to estimate the
kind of contract and under what conditions, so a contracts engineer. But most of important
of all, to do all of the above he needs data from and the cooperation of many people
involved in the project.
The next phase of project life cycle after the basic design is completed is detailed
engineering. In this phase the owner select the contractor to execute the project. This phase
is very important and crucial for the owner because, for the first time, he will be giving
some of the controls of the job to another party. The owner reviews the qualifications of the
various contractors who have been requested to bid on the project in order to select the
contractor who is capable of exercising good job control.
Cost Engineer also evaluates the alternatives given by the contractor. He also
evaluates the offer according to the type of contract. For example if the contract is
reimbursable type, the Cost Engineer also assists the bid evaluation team in analyzing the
commercial terms submitted by the Contractor. He prepares the definitive control estimate.
Cost Engineer involves full-time with the project during the detailed project execution
phase, which is after the award of the contract. During this Construction phase the
hardware that was designed and procured during the detailed engineering phase is installed
by the contractor. The Cost Engineer continues to appraise the contractor's cost control
efforts, monitor changes and reviews extras. His forecasts of labor man-hour requirements
are an essential ingredient for the project schedule and have an impact on the prediction of
both final costs and final completion date. Cost Engineers are depended on to provide
accurate and timely estimates of the current costs of the project and to provide cost
alternatives and cost savings recommendations. As a result of the need for greater control
and management of resource utilization Life cycle project management has emerged as the
key methodology.
-~ ii~iililillilllllllllllllllllllll
16
As a result, there is a pressure to identify all the costs associated as early as possible;
this is necessary to remain on schedule, to tie down project requirements as much as
possible at the budgetary phase and to identify causes for the cost increases as they occur.
1.6. Project Cost and Time Estimation
Cost and Time Estimation is one of the main duties of Cost Engineer. As mentioned
earlier Estimate is a prediction of the manner in which a project will be executed and a very
important concept in Cost Engineering. First, we discuss the accuracy of an estimate [3].
1.6.1. Accuracy of an Estimate
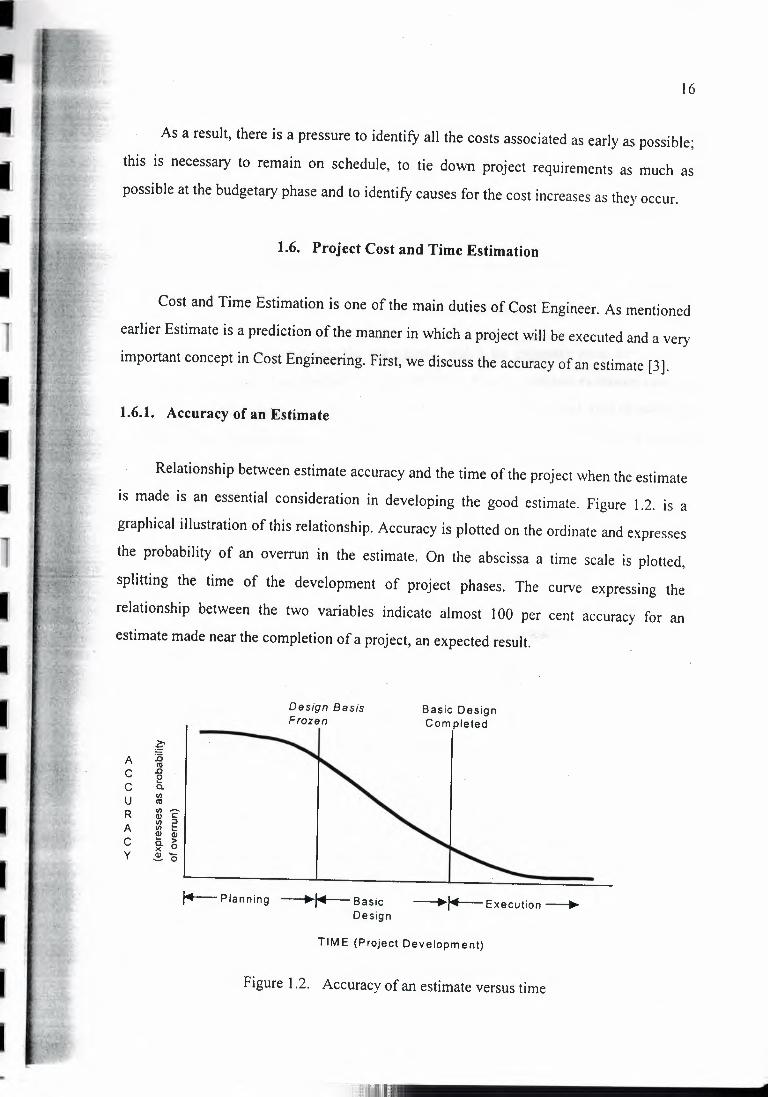
Relationship between estimate accuracy and the time of the project when the estimate
is made is an essential consideration in developing the good estimate. Figure 1.2. is a
graphical illustration of this relationship. Accuracy is plotted on the ordinate and expresses
the probability of an overrun in the estimate. On the abscissa a time scale is plotted,
splitting the time of the development of project phases. The curve expressing the
relationship between the two variables indicate almost l 00 per cent accuracy for an
estimate made near the completion of a project, an expected result.
~ A ii ro C .0 e C a. u <I) ro R <I)~ a, C: A
<I) 2 <I) a, cii C •.. >
~ 0 y a, - ~o
Design Basis Frozen
Basic Design Completed
~Planning --.~Basic --.~Execution--. Design
TIME (Project Development)
Figure 1.2. Accuracy of an estimate versus time
. tili11lilllllllllllllllllllll _
,~ [~
17
Two important conclusions can be drawn from this figure. First is; the rather lengthy
and vague time of planning is an inaccurate period, on average, for making an estimate.
Consequently, not only is the probability of overrun great but the degree or the magnitude
of the overrun is difficult to predict and the second is; There is a dramatic change in slope
at the moment the design basis is selected and frozen, and a very significant increase in
accuracy occurs during the relatively short period of time when the basic design is being
put together.
For an accurate estimate the ingredients, which the estimator must have if he is to
have any measure of success are; a sound "frozen" basis, a realistic execution plan of the
project, proper timing of each activity, good estimating methods and data of each project
item , neatly recorded and documented, balanced detail of project and a good and
experienced estimator.
These factors affect the accuracy of an estimate and all of them must be reliable, but
the most critical item affecting estimator accuracy is the estimate basis. During the early
stages of a project when estimate accuracy is poorest, the effort needs to be directed toward
establishing a firmer basis rather than concentrating on utilizing more detailed estimating
method. Knowing the accuracy of an estimate is of extreme importance to management and
the project people involved.
Some of the reasons for are sensitivity to economics, cash flow and budgeting,
determines the estimating method and the approach to be used, feedback which improves
method development, and develops confidence and management support. If we can
develop an approach that allows us to determine in advance what kind of accuracy we can
expect from a specific estimate made at a certain time in project development, we can test
the sensitivity of the investment level predicted by the estimate to potential variation and
determine the impact on the calculated economics of the project.
Perhaps the most important reason that knowing the accuracy of an estimate is so
critical is the impact this knowledge has on company management and company policy.
I l1 I I i_ i. l i i i
I I I l l l I I
18
1.6.2. Types of Estimates
Construction projects are becoming larger in scale and competition is keen
worldwide. Many factors have to be considered carefully as to their effect on the estimate.
Some important ones of them are; technological advances, inflation forecasts, potential
price controls, and new. environmental regulations on safety and pollution and social
concerns. The American Association of Cost Engineers defines three types of estimates; order of magnitude, budget, and definitive.
I .6.2.1. Order of Magnitude Estimate. Order of Magnitude Estimates have an expected
accuracy within +50 and -30 per cent. They are generally based on cost capacity curves and
cost capacity ratios, and do not require any preliminary design work. The principal reasons
of this type of estimate are feasibility designs, selection from among alternative designs
and alternative investments, and budgeting or construction forecasting. After this screening
estimate whether to go or no-go decisions or which way to go for a particular project is
decided. The primary concern is with the rough delta costs between to or more alternative
cases. Management usually requires this information in order to select the proper route for
the next step in developing the project. Regardless, in either case, the emphasis is not on
detailed sufficient accuracy to insure that the results are meaningful and above all, not
misleading. To accomplish this, three different approaches can be used to prepare an order of magnitude estimate.
• Gross (overall) proration,
• Curves,
• Rough semi detailed.
The most commonly used approach is gross proration. Curves and the semi detailed
approach are more commonly associated with budget estimates. Prorations need historical
data on similar plant or process, projects must be near duplicate, should be reasonably close
in size, portion slope are critical, adjustments must be made for off-sites and utilities, must
be escalated and adjusted for location. The advantages of order of magnitute estimate are
being quick and all inclusive, but the disadvantage of are high degree of variation.
II I I I I II
I I I
I I
I
' I I I I =--------
19
1.6.2.2. Budget Estimate. Budget Estimates are based on flow sheets, layouts and
preliminary equipment description and specifications and have an accuracy range of + 30 to
-15 per cent. Design generally must be 5 to 20 per cent complete to permit such an estimate
to be performed. The principal reasons of this type of estimate are budgeting or
construction forecasting, authorization funds. The total budget of the project can be reached
with this type of estimate. Budget estimates are normally prepared after the owner has
completed his planning work, has screened out options via economics and is now in a
position where normally he will require management approval to proceed.
To do this, he needs budgetary information to give management can allocate or
budget money in the future for this purpose. To take advantage of this increased accuracy
afforded by the frozen basis, there are commonly used estimating methods for preparing a
budget estimate.
• Curve,
• Semi detailed,
• Factored.
All three methods are used with equal frequency throughout the industry. Curve is
plotted from past historical data. Curve estimates predict the execution of the project.
Consequently, when the estimator picks a point on the curve for his project, that point in
reality represents a certain amount and type of physical hardware, consistent with the
average of what is in the design of the plants that make up the curve.
This concept becomes important in the cost control approach to be used during
conceptual design. As long as one has some idea of the details of the estimate prediction,
one can compare what is actually happening against what was predicted.
Curve Estimates need significant historical data and can be sophisticated and
accurate. Advantages are being quick and reasonable accuracy and all inclusive.
Disadvantages are some variations, no details available and more on construction project
site oriented.
iiili!~illillllllllllllllllllllll
I
I I I I
I I I
I
I
20
1.6.2.3. Definitive Estimate. Definitive Estimates require defined engineering data, such as
site data, specifications, basic drawings, detailed sketches, and equipment quotations.
Design is generally 20 to 100 per cent complete and estimate accuracy should be within
+ 15 to -5 per cent. The principal reasons of this type are authorization of full funds; check of an authorized project and presentation of bids. This type of estimate is the most accurate
and the one requires the greatest effort to prepare. Whereas the other types of estimates can
be completed in a matter of hours or days by one estimator, Definitive estimates require
months to complete and, can require an considerable effort of technical man-hours and
costs.
There are basically two kinds of definitive estimates. One utilizes the conceptual or
averaging approach, is often referred to as an " in-house " estimate, and is used mainly by
owner organizations. In this approach, estimating methods are developed from past
historical data and an averaging concept is applied. It is more or less an extension of the
factored estimating approach, except in greater detail.
The second type of definitive estimate is much more detailed in its approach and is
used mainly by contractor organizations. Here, each item for specific project is developed
engineering-wise to sufficient detail to allow a customized estimate to be made of that
item. Vendors' preliminary estimate or quotations for individual equipment items are
widely used. Preliminary take-off are made of piping, etc., from early detailed-engineering
drawings, and there take-offs are priced up to form the estimate. Whereas the conceptual
approach requires a very significant effort in the data gathering and method development
areas beforehand, the detailed approachrequires a large effort during the preparation of the
estimate itself. The in-house approach has the advantages of requiring considerably less
time and effort to prepare and is more suitable for cost control. The disadvantages lie in the
fact that a major data-gathering and method development effort is needed.
Also, the end result is somewhat less accurate than the detailed approach; averaging
versus specific data. The detailed approach used by a contractor is more accurate but has
the disadvantages of being costly to prepare and often being available too late for early cost
control on the project.
II I I I I I
I I
I
I
I
21
1. 7. Project Cost Control
In preconstruction and construction phase of project, the project manager has the
following three basic responsibilities; quality, schedule and cost control. These three
responsibilities are of equal importance and to some degree interdependent. For example,
quality can usually be improved with expenditure of additional money and, on most
projects; schedule can be improved if one is willing to pay premiums to equipment vendors
and overtime to construction workers. It is project manager's job to see that equilibrium is
maintained between quality, schedule and cost [3]. Forecasting cost trouble spots before
funds are committed and determining corrective action to minimize these expenditures are
the Cost Engineer's job. Cost Control is spotting trouble spots and taking action.
1.7.1. Objectives of a Cost Control Program
A project cost control program has the following four objectives:
• To focus management attention on potential cost trouble spots in time for corrective
or cost minimizing action to be taken by detecting potential budget overruns before rather than after they occur.
• To keep each project supervisor informed of the budget for his own area of
responsibility and how his expenditure performance compares to that budget.
• To create a cost-conscious atmosphere so that all persons working on a project will
be cost conscious and aware of how their activities impact on the project cost.
• To minimize project costs by looking at all activities with cost reduction view.
1.7.2. Elements of a Cost Control System
For any construction project, the elements of a good cost control system comprise of:
• A planned approach to the project in order to realize maximum economy, all
activities must be carefully planned as to timing and method of execution.
I I
I I I
I I I
I
I I I
22
• A realistic financial yardstick by preparing a controlled budget estimate.
• Accurate and timely cost forecasts by covering the costs to completion.
• Comparison of forecasts to the yardstick: preparing a detailed itern-by-item
comparison of forecasted costs with the budget.
• Positive action to minimize forecasted budget overruns, which is the essential m gradient of the cost control.
1.8. Project Task Duration Estimating
A project schedule is the result of the aggregation of all of the task durations. If the
durations lack validity, so does the project schedule. Fidelity in task duration estimating is
essential to the development of a wholesome project schedule. And such fidelity can only
be achieved via a structured and consistent approach toward establishing task durations.
Steps in task duration estimation as discussed by Harvey Levine [4] are:
First, we come up with a "most likely" estimate of the duration. This is the time that
we feel that it would take about 50 per cent of the times that we were to execute the task.
But, we're not comfortable with a 50 per cent confidence factor. So we add some time that
we feel that we could support about 90 per cent of the time. Then we think about what we
will need to start the task, including what kinds of conditions are required. If we are
concerned that we will not have everything that we need to start the task, we add some more time to the task estimate.
Then there is the "collection factor". When a group of tasks come together, we tend
to add some more safety margin, to allow for one of the tasks to slip. Similarly, we note
that there is a tendency to "lose time" between tasks. Two tasks, each estimated at X days
and Y days respectively, performed in series, will take (X+Y+Safety duration) days
because we lose safety duration days between the completion of the first task and the start of the second task.
Finally, everyone knows that the total duration will not be accepted. They expect to
be pushed for a 20 per cent reduction, so they add 25 per cent to the inflated estimate.
lllllllllllllllllllllllllllim,
I
I I I I
I I I
I I I I I I I I I
Furthermore, even the estimate of the actual task duration can take several paths. For
instance, here are several approaches to estimating task durations:
• Elapsed time versus working time - We feel that it will take five days to actually
perform the work. But we know that we will not be working on the task without
interruption. So we set the task duration at ten days, to allow for the elapsed time that we expect to occur.
• Ask time versus resource time - We estimate that the task will take 80 hours to
perform. Is this 80 hours by two people, producing an elapsed time of five days? Or
is it 80 hours for one person, working half time, producing an elapsed time of 20 days?
• Interface losses and delays - We noted above that we could expect some loss of time
between tasks and when multiple tasks converge. We incorporate these expected
losses into the tasks themselves, or set up dummy tasks to allow for these delays.
• Theoretical duration versus experience - Each time that we estimate how long it
should take, we come up with 20 days. So we know that we can do it in 20 days. But,
each time that we perform the task, it takes about 50 per cent longer than the 20 days.
Each time the reason for the delay is different. The task should be completed in 20
days and this is what we should use as a target. But. if our experience tells us to
expect 30 days, aren't we deceiving the team by saying that we expect it to be done in
20 days? And, when we use the 30-day estimate, will we end up taking the 30 days, because that is the time available.
• Skill levels, learning curves and priorities - In order to handle potential performance
modifiers, we add time to the duration estimate because we expect that there will be
additional time and effort to do the task the first time which is called learning curve.
• PERT method - This technique provides for a quantitative method of considering
uncertainty or risk. It calls for the use of three time estimates for each task. These are
called optimistic, most likely and pessimistic. The most likely duration is the
duration that can be expected 50 per cent of the time. The optimistic duration is the
shortest reasonable duration, attainable about 10 per cent of the time. The pessimistic
duration is the longest reasonable duration, also with a probability of IO per cent.
I I I I
I I
I I
I I I I I I
24
• In the PERT method, a PERT duration is calculated, usually based on the formula: (a
+ 4b + c) I 6, where "b" is the most likely. Although it may appear that the PERT
method takes a great deal of additional effort, the reverse is really true. In reality, we
tend to- go through the process of thinking of the possible range of estimates, based
on perceived risk and uncertainty. But then, after mentally deriving a single duration,
we fail to capture the information that went into the estimate.
• Delphi Method - This decision-aiding technique is rarely employed in determining
task durations, but could be applied if desired. It calls for each member of the team to
offer their own estimate to the group. Estimates at the extremes (shortest/longest) are
defended by the estimator, which often introduces issues that were not considered by
the others. Based on the new information, the team votes again (re-estimates). The
process is repeated until there is a reasonable consensus and comfort with the task duration.
There is a self-fulfilling prophecy regarding performance of tasks within planned
durations. A task is hardly ever completed ahead of schedule. There are several reasons for
this. We can demonstrate these using an illustration of a task that has a 50-50 chance of
being completed in five days, but has been scheduled for ten days to allow for uncertainty, risk, emergency diversions, etc.
First, there is Parkinson's Law: "Work expands to fill the time available for the
work". Work on the task has commenced on schedule and is essentially completed within
the first five days. But, because ten days have been allocated for the task, the performer
spends the next five days "fine tuning" the deliverable. This is a natural work ethic of most
people. We reach 98 per cent completion on our task and, if additional time is available, we
attempt to refine it until a delivery deadline is reached.
Second, is procrastination. We are able to start the task as scheduled. But, because
there are ten days allocated, and we know that we only need five days, we wait a week to
start the task. Now, of course, the contingency has been exhausted before the task has been
started, and the potential for a schedule overrun has been increased. But, even if there are
no problems, the five-day task has taken ten days.
I
I I
I I I I I I
I
Less obvious are the subtle motivators to avoid "early" completion of tasks. If we
estimated ten days and complete the task in five days, we might be criticized for "padding"
the estimate, even though the extra five days was a legitimate allowance for uncertainty.
Or, we might be under increased pressure to shorten duration estimates in the future. There
rarely is a reward for finishing tasks early - only demerits for running over. So there is no
the motivation to do the task in five days.
Certainly, if we do not allow for uncertainty, by adding contingency, we risk a high
potential of running late and missing deadlines. However, if we bury the contingency in the
individual task estimates, we almost assure that the work will slip to fill the time available.
It is this dilemma that motivated the concepts of Shared Contingency. Use of the
various shared contingency conventions is one way of addressing many of the issues raised
above. It is also feasible to deal with some of these issues using traditional CPM methods
and tools.
More important than all of the above is the need to develop consistency in estimating
task durations. There should be a blanket policy for contingency. At least that way
everyone knows the basis for the estimate. Standard guidelines for task duration estimating
should be established by the project's function for universal use.
The application of the guidelines should consider the key factors in achieving project
success. If getting the job done as fast as possible is a key objective, and then contingencies
should be minimized and identified. If protecting the firm from delay penalties is a key
issue, and then contingency allowances play a larger role.
Flexibility, within standardized guidelines, together with notation of and
communication of the basis for the estimates, will help reduce the potential for poor
estimating and scheduling.
I I
I I I
I
I
I
I I
~
26
2. THEORY OF CONSTRAINTS AND CRITICAL CHAIN
2.1. Theory of Constraints
The Theory of Constraints (TOC) is a management philosophy that treats a
corporation not as a collection of independent processes, but as a complete system. The
Theory of Constraints is a system of problem analysis and decision-making. The originator
of the Theory of Constraints, Dr. Eliyahu M. Goldratt, often explains his theory with a
simple but effective analogy [5]. He likens a corporation to a chain. Just as the links of a
chain work together to form a complete system that is capable of transmitting a great force,
so too the various divisions and departments of a corporation work together to generate
great profits for the stockholders or private owners. Hence the weakest link or constraint,
and the fact that the constraint, whether it is physical, policy or paradigm, will always determine performance of the system.
TOC is a management philosophy that aims to improve the performance of any
system. The methodology is first to find the constraint of the system and then concentrate
all our efforts on elevating the capacity of the constraint.
According to the Theory of Constraints, every system is subject to at least one
constraint, which prevents the system from achieving infinitely high levels of performance.
For the system that is a corporation, the often unidentified constraint prevents it from
achieving infinite profits, just as a chain's weakest link limits the chain's capacity to transmit force.
The Theory of constraints provides the theoretical framework and the tools with
which a team of knowledgeable executives can continually identify the constraints in their
corporate chain and improve performance of the entire corporation.
The systemic approach was at the center of the creation of applications such as
Drum-Buffer-Rope for manufacturing and Critical Chain for project management.
rnll
I I I I I I I I
I -.,. ''1!1!1111111 - ~ -,·
I I I I I
I I I
27
It has also been used to develop a set of team building and management tools, which
address issues such as conflict resolution, improving delegation, achieving ambitious team targets.
2.1.1. Toe Application Areas
The Theory of Constraints has been used at three different levels: Production
Management - TOC was initially applied here to solve problems of bottlenecks, scheduling, and inventory reduction [6].
Throughput Analysis is based on the application of TOC has caused a shift from cost
based decision making to decision making based on continuous improvement of processes
in which system throughput, system constraints, and statistically determined protective capacities at critical points are key elements.
Theory of Constraints Logical Processes is the general application of TOC reasoning
to attack a variety of process problems within organizations. TOC logic is applied to
identify what factors are limiting an organization from achieving its goals, developing a
solution to the problem, and getting the individuals in the process to invent the requisite changes for themselves.
For a manufacturing organization, with the goal being to make money now as well as
in the future, TOC defines three operational measurements that measure whether
operations are working toward that goal. They are:
Throughput is the rate at which the system generates money through sales. This
contribution margin is considered to be the same as selling price minus cost of raw
materials. Labor costs are considered to be part of Operating Expense rather than
throughput. Inventory is all the money the system invests in things it intends to or could
sell. This is the total system investment, which includes not only conventional inventory,
but also buildings, land, vehicles, plant, and equipment. It does not include the value of labor added to Work-In-Process inventory.
I I
I I I
I
I
I I I I I I I I I
28
Operating Expense is all the money the system spends in turning Inventory into
Throughput. This includes all of the money constantly poured into a system to keep it
operating, such as heat, light, scrap materials, depreciation, etc.
The following four measurements are used to identify results for the overall
organization:
• Net Profit = Throughput - Operating Expense
• Return on Investment (ROI)= (Throughput - Operating Expense) I Inventory
• Productivity = Throughput I Operating Expense
• Turnover = Throughput I Inventory
Given the measurements as described, employees can make local decisions by
examining the effect of those decisions on the organization's overall Throughput,
Inventory, and Operating Expense. A decision that results in increasing overall
Throughput, decreasing the overall Inventory or decreasing the overall Operating Expense
for the firm will generally is a good decision for the business.
The Theory of Constraints does away with much of cost accounting. It is clear that
application of cost accounting principles (primarily the allocation of costs in order to make
decisions at the local level) leads to poor management decisions at the department as well
as in upper levels of the organization.
2.1.2. Types of Constraints
A constraint is anything in an organization that limits it from moving toward or
achieving its goal. Of course, this assumes that an appropriate goal has been defined. For
most business organizations the goal is to make money nowas well as in the future. There
are two basic types of constraints: physical constraints and non-physical constraints. A
physical constraint is something like the physical capacity of a machine. A non-physical
constraint might be something like demand for a product, a corporate procedure, or an
individual's paradigm for looking at the world [7].
!!illllll!llilllllllllllllllllllll!
I
I I I
II I II
I II II II I I I I I
29
2.1.2.1. Demand Constraints. A demand constraint is a constraint on output. Symptoms
include large amounts of final product inventory, or a production line running at a fraction
of full capacity production. It means you have excess capacity given the demand for your
product. You either have a problem with marketing as your customers may not know about
your high quality product), you have a low quality product, undesired by customers,
regardless of the marketing effort; or you have an obsolete product, undesired by
customers, regardless of the marketing effort. Solution to this involves finding which of the
above three problems is, and doing something about it.
This is why a relationship with one's customers and suppliers is so important in Total
Quality Management. So as a result, you are getting some lead-time on solving this
problem.
2.1.2.2. Production Constraints. Production constraints are generally of three types. Policy
constraints which are company policies or practice create the constraint and impede its
long-term solution. Machine capacity constraints which are a single or small number of
machines on a line form a bottleneck. Labor constraints are insufficient labor or a skilled
operator or the general labor pool are sufficient to run a line to full capacity, including extra
shifts if needed. In-process inventories between production steps are often a symptom of a
production constraint.
2.1.2.3. Raw Materials Constraints. Raw material constraints include shortages in the short
or Jong term of one or more essential ingredients necessary to making the product. This is
why a relationship with one's vendors is so important in TQM. The most frequent
constraint is the policy constraint. The cycle is like this:
• A problem arises,
• A policy is created to solve the problem,
• The situation changes eliminating the original problem,
• The policy remains and causes a constraint on production,
• Change is emotionally difficult to implement and the policy is lived with ..
w
II ll I I I I
I I I
I I I I I II II I I
30
2.1.3. Measuring Business Performance
The performance of a company is most frequently judged by examining its financial
statements. The traditional performance measures are Net Profit, which is reported on the
Profit and Loss statement of a company and the ratio of Return on Investment (ROI), the
data for which is found on the Balance Sheet of a company. The third financial statement,
Statement of Cash Position that assists in assessing whether a company has sufficient
financial maneuvering room to accomplish its goals [7].
The goal is to find a global performance measure that we can use locally to assist in
decision making. None of the traditional measures-Net Profit, traditional ROI, or cash will
do this. What is needed for local decision making is a method of measuring the rate at
which a company produces money through sales of which Goldratt defines this as
Throughput.
Local decisions that increase company's throughput, decrease a company's operating
expense, or reduce a company's inventory are most generally good decisions for the
company.
2.1.4. The Thinking Process Tools
Theory of Constraints (TOC) seeks to bring any organization to substantial improved
performance through a process of on going improvement based the Five Focusing Steps
[8]. These steps are;
• Step I : IDENTIFY the system's constraint(s).
• Step 2 : EXPLOIT the system's constraint(s).
• Step 3 : SUBORDINATE everything else to the above decision.
• Step 4 : ELEV ATE the system's constraint(s).
• Step 5 : If in a previous step, a constraint has been broken, go back to Step I. But do
not allow INERTIA to become the system's constraint.
llffllllm:
II II II II II II
I I
I I I I I I I I I
31
The thinking processes provide people with the ability to logically and systematically
answer three questions essential to any process of on-going improvement for the purpose of
managing change.
The questions we try to find answers are : "What to change in the system?", "To
what to change in the system?" and "How to cause and implement the change within the
system of the organization?" and no matter what the subject matter is considered [9]. The
tools are logic structures divided into two groups as of sufficiency and necessity based.
They consist of a collection of simple declarative statements that are linked with cause
and-effect relationships.
A sufficiency-based logic diagram is one that identifies all the conditions that are
necessary and sufficient to cause a particular effect.
The current reality tree is a sufficiency based logic diagram, which lets us to
identify the root causes and core problem of our organization.
The future reality tree is also another sufficiency based logic construct. It begins
with our solution of choice and links desirable effects. It is a what-if exercise.
A necessity based logic diagram is one that identifies conditions that are merely
necessary for a particular effect to exist.
The evaporating cloud which is a conflict resolution diagram is a necessity and
based on a logic diagram to identify a solution.
The prerequisite tree is a necessity based logic structure. Its purpose is to help us
identify all the intermediate steps that we need to reach an ambition goal, such as our
chosen solution.
The transition tree is the last of thinking process tools and a sufficiency-based logic
structure. It is our step-by-step implementation plan.
I I i I
I
I I
I I I I
32
2.1.5. Easing Resistance to Change
In human-based organizations, there is resistance to change. If one succeeds in
answering "What to change?" and "To what to change?" the inherent difficulty lies in
"How to cause the change?" TOC addresses these well-known phenomena through what is
called "Overcoming the 6 Layers of Resistance to Change" [7]. In essence, having a
solution without agreeing on the problem serves no purpose. Having a solution without the
skills to bring about important change is an exercise in futility. By peeling the 6 Layers in
succession, one is able to achieve success through:
• Complete consensus on the cause for the problems to be addressed.
• Agreement on the direction of the solution.
• Agreement that the solution will solve the problem and deliver the expected results.
• Bringing others to participate in developing a complete solution through their active
collaboration.
• Developing an implementation plan to bring the solution into reality.
• Overcoming people's unverbalized fears in making important change.
Remarkably, both TQM and TOC come to amazingly similar conclusions about
instituting progressive change within an organization. Both philosophies view employees
as the key to change. Both philosophies agree that all the employees must very well
understand the solution to a problem.
2.2. Critical Chain
The Theory of Constrains is a systems-oriented approach to process improvement
The Critical Chain is an application of Theory of Constraints' principles to project
management [1 O]. The Theory of Constraints assumes that a system is like a chain. Also, a
project operates as all the stakeholders and/or departments, which we can call links, are
independent on each other to satisfy a need. In order to achieve the project's goals requires
the cooperation of many different people in a series of independent actions.
I
I I I
I I I
I I I I I I I
33
The principle difference between this and the concepts underlying the Critical Path
Approach is that the critical chain includes logically and resource related tasks, while the
critical path includes only logically related tasks. The belief is that finding and
strengthening the weakest link, which is the system constraint, gives the greatest
opportunity for measurable improvement, both within individual projects and across the
entire collection of an organization's projects. Every TOC improvement effort tries to find
only one or two leverage points to change the system, so that the results are far better than
with current approaches. For organizations that already have a well disciplined, mature
approach to project management, the Critical Chain Approach will not disrupt, but rather
enhance the organization. For organizations that are not such a maturity level, the
combination of Critical Chain and traditional project management is a powerful one.
Uncertainty is why we need project management. How we manage for uncertainty is
at the core of improvement of project performance and getting projects done both faster
and with better reliability of the promised deliverable dates. The approach to project
management known as "Critical Chain Scheduling and Buffer Management" provides
mechanisms to allow a "whole system" view of projects. It identifies and protects what's
critical from inevitable uncertainty, and as a result, avoids major impact of Parkinson's Law
at the task level while accounting for Murphy's Law at the project level. Project managers
need to shift their attention from assuring the achievement of task estimates and
intermediate milestones to assuring the only date that matters is the final promised due
date.
Safety that is typically built into tasks to cover Murphy's Law is inefficient, leading to
longer than necessary or acceptable schedules, and apparently ineffective, given the impact
of Parkinson's Law from which many projects suffer. Protecting the value of a project
involves dealing with the uncertainty that will be associated with its delivery. The role of
Project Management is to assist in turning uncertain events and efforts into certain
outcomes and promises. If this is the case, then the primary process associated with project
management should be that of risk management. How other processes, such as scope,
schedule, and spending management support risk management is therefore critical for
successful project management and for maximizing the value of our project-based efforts.
I
I I I I
I I I
I I I I I I I
I
34
One of the more recently introduced project management methodologies has at its
core a focus on the management of uncertainty and system thinking and risk. Dr. Eliyahu
Golratt outlined how the Theory of Constraints (TOC) can be applied to projects to
improve performance.
When Critical Chain-based project management is introduced in Dr. Eliyahu M.
Goldratt's book, Critical Chain [IO], it gained considerable attention on the areas of
schedule development and management. But the details of the scheduling methodology -
the critical chain versus the critical path, just-in-time starts replacing as-soon-as-possible
starts, the eschewing of task due dates and use of buffers of time to protect the project's
promise and monitor its progress - are only means to an end.
The end results of project are speed and reliability. Speed and reliability of project
performance unencumbered by conflicting pressures and behaviors. Reliability of project
promises is as much a result of a methodology's ability to support effective risk
management of possible risks of the project, as it is a result of effective planning and scheduling.
Critical Chain Project Management approach resides in a development of new
paradigm that addresses, for the first time, both the human side of project management and
the algorithmic methodology side of project management in a unified discipline. Critical
Chain Project Management assumes that the projects can be completed in a significantly
shorter time than traditional Critical Path Project Management by eliminating the safety
durations in each estimated task and by focusing on the tasks related with the limited resources.
Recognition of uncertainty and its associated risk are at the core of the initial stages
of developing Critical Chain schedules. The emphasis on dependencies in the usual
approach to developing a project network for a Critical Chain schedul3 h§p~~b -avoid risks ' <\ . \\
of missing interactions of different parts of the project. The use ,qf~2-point estimates to ft . lf ,.
assess and address the early view of schedule risk associated with task un'ceitajnty ~ets-.f"h\1 -~i
tone up front for the appreciation of risk in the real world. · ~\.:'l -) \ ··, 1: ~. ..... I'
--· ---
I
I I I I
I I I
I I I I I I I I I
35
In addition to task uncertainty, iteration uncertainty can also be taken into account in
the sizing of Feeding and Project Buffers. These resulting buffers themselves become a
highly visible and direct assessment of the schedule risk associated with the project as a
whole.
Critical Chain-based project management is more than just Critical Chain Scheduling
and Buffer Management. The genesis of Critical Chain in the Theory of Constraints (TOC)
has yielded a holistic view of project management that provides effective risk-focused
approaches not only to scheduling and control, but also to initial scoping and planning,
effective resource behaviors, and minimizing cross-project impacts.
Project management must reconcile two conflicting aspects of projects -- the
increasingly important need for speed in project delivery and the equally important need for
reliability in delivering the project as promised. Project management must deal with
uncertainty in an attempt to deliver project outcomes with certainty. One way of thinking
about how to deal with this conflict is to develop strategies to avoid expansion of project
lead-time (Parkinson's Law) while protecting against Murphy's Law.
The way we manage for uncertainty in projects is at the core of improvement of
project performance, defined as getting projects done both faster and with better reliability
of the promised final project due date. In most projects managed with commonly accepted
practices, this uncertainty is dealt with by focusing on delivery of tasks with the seemingly
reasonable belief that if individual tasks come in on time, the project will as well.
Developed through the application of the Theory of Constraints to the subject of
projects, "Critical Chain Scheduling" suggests the shifting of focus from assuring the
achievement of task estimates and intermediate milestones to assuring the only date that
matters is the final promised due date of a project.
The scheduling mechanisms provided by Critical Chain Scheduling require the
elimination of task due dates from project plans. Each project team member focuses on
project completion date, not on due dates of specific activities.
' I I I
I I
36
One benefit is that it allows those who use it to avoid the significant impact of
"Parkinson's Law;" i.e., work expanding to fill the time allowed. Take away the idea of
time allowed, and you've got half the battle won. But how to do that is the question that
requires us to look at some current common project practices and how they lead to "Parkinson's Law".
People usually derive schedules and their component deadlines from estimates of
duration required by the various tasks that comprise the project. In many cases, project
resources know that they will be held accountable for delivering against their estimate, and
equally, that the organization needs to be able to count on their promise. Therefore, it is
prudent that they include not only the amount of focused effort/time they expect the work
to take, but also time for "safety" to protect their promise. This safety must deal with the
uncertainty involved in the work which could be aresult of Murphy's Law, the impact of
distractions and interruptions they live with in their organization, and, in many cases, the
effect of dealing more than one such project at a time.
So task estimates have plenty of safety in them, above and beyond the actual expected time to do the work.
The "urgent stuff' takes precedence until we see the due date sneaking up on us, or,
as the following graphic shows, the due date is within even the aggressive expected
duration of the work itself. Sometimes it sneaks up quietly enough ,drowned out by the
louder squeaking wheels, that when we look, we realize that it has now become urgent and gets our attention.
2.2.1. Critical Chain Project Management Methodology
Critical Chain Project Management is the application developed using the full set of
the TOC tools known as the TOC Thinking Processes (TOC!TP). Critical Chain Project
Management Methodology is based upon great insight into human nature and what happens
when a project management discipline is applied to people. If the tools are not carefully
applied, the opposite of what is intended can be achieved.
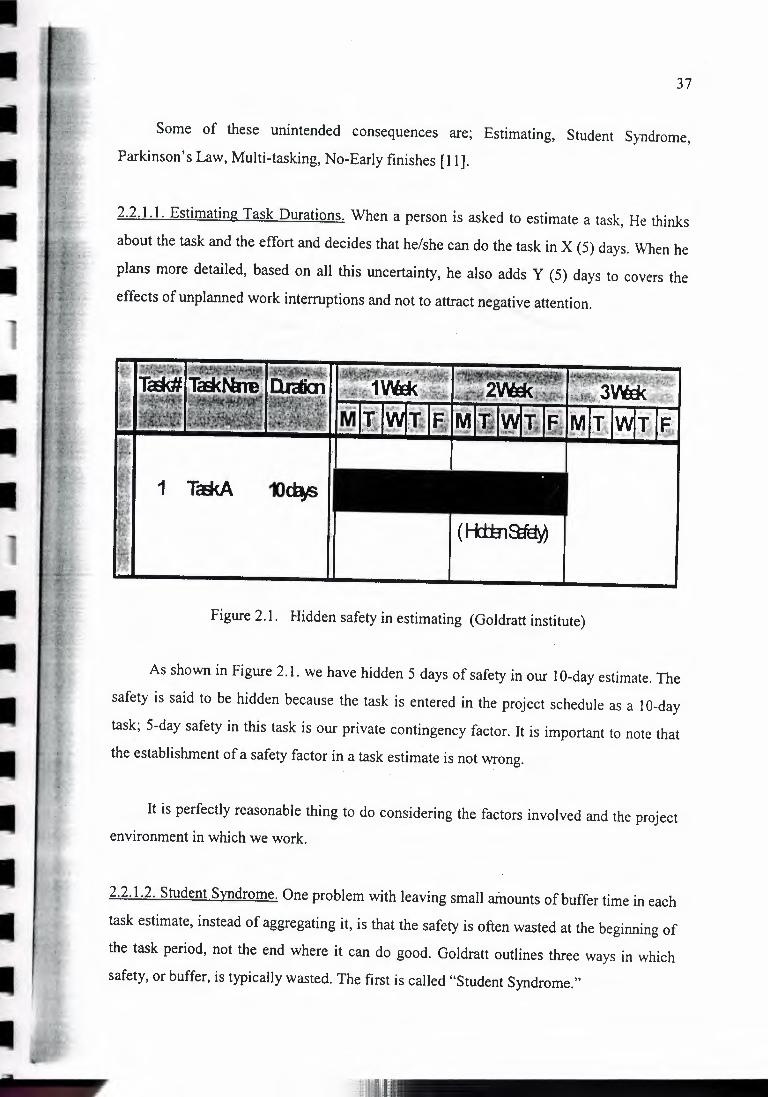
I
I I I I
II
II II I
I I
37
Some of these unintended consequences are; Estimating, Student Syndrome,
Parkinson's Law, Multi-tasking, No-Early finishes [11].
2.2.1.1. Estimating Task Durations. When a person is asked to estimate a task, He thinks
about the task and the effort and decides that he/she can do the task in X (5) days. When he
plans more detailed, based on all this uncertainty, he also adds Y (5) days to covers the
effects of unplanned work interruptions and not to attract negative attention.
1 Ta:l<A
Figure 2.1. Hidden safety in estimating (Goldratt institute)
As shown in Figure 2.1. we have hidden 5 days of safety in our I 0-day estimate. The
safety is said to be hidden because the task is entered in the project schedule as a 10-day
task; 5-day safety in this task is our private contingency factor. It is important to note that
the establishment of a safety factor in a task estimate is not wrong.
It is perfectly reasonable thing to do considering the factors involved and the project
environment in which we work.
2.2.1.2. Student Syndrome. One problem with leaving small amounts of buffer time in each
task estimate, instead of aggregating it, is that the safety is often wasted at the beginning of
the task period, not the end where it can do good. Goldratt outlines three ways in which
safety, or buffer, is typically wasted. The first is called "Student Syndrome."
-llllllll!llll!llllllllllllllllllllli
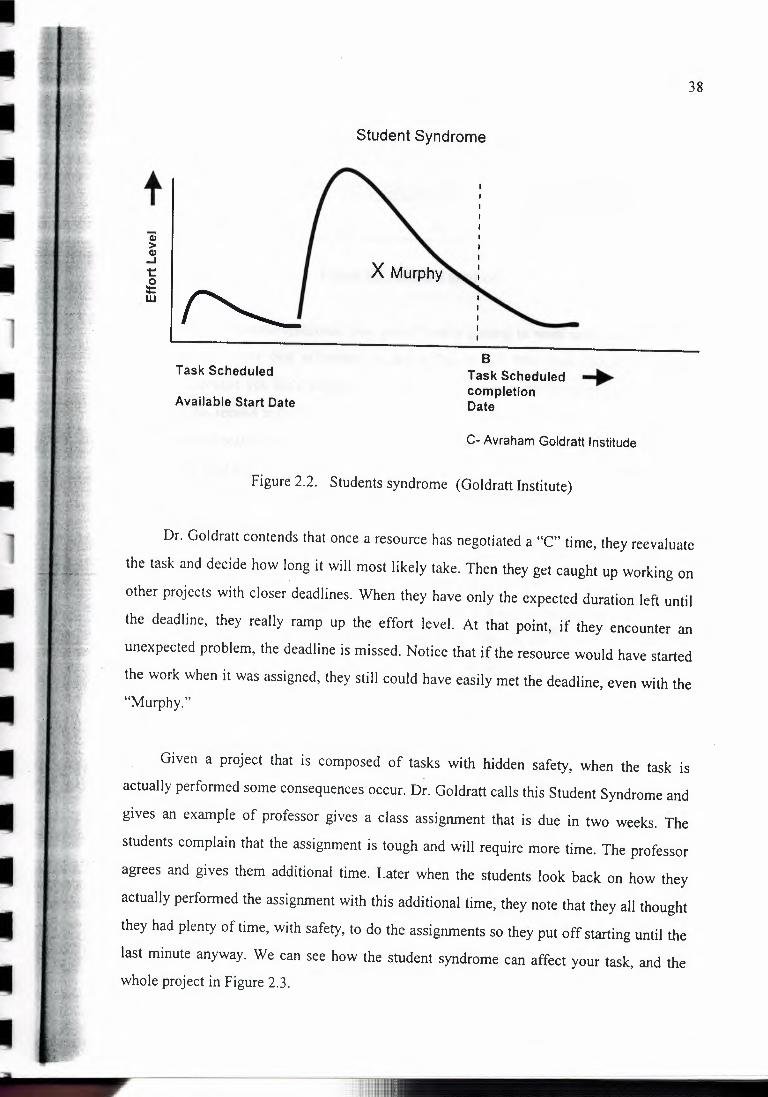
II I I I I I l I I I
38
Student Syndrome
t
Task Scheduled B
Task Scheduled ~ completion Date Available Start Date
C- Avraham Goldratt lnstitude
Figure 2.2. Students syndrome (Goldratt Institute)
Dr. Goldratt contends that once a resource has negotiated a "C" time, they reevaluate
the task and decide how long it will most likely take. Then they get caught up working on
other projects with closer deadlines. When they have only the expected duration left until
the deadline, they really ramp up the effort level. At that point, if they encounter an
unexpected problem, the deadline is missed. Notice that if the resource would have started
the work when it was assigned, they still could have easily met the deadline, even with the "Murphy."
Given a project that is composed of tasks with hidden safety, when the task is
actually performed some consequences occur. Dr. Goldratt calls this Student Syndrome and
gives an example of professor gives a class assignment that is due in two weeks. The
students complain that the assignment is tough and will require more time. The professor
agrees and gives them additional time. Later when the students look back on how they
actually performed the assignment with this additional time, they note that they all thought
they had plenty of time, with safety, to do the assignments so they put off starting until the
last minute anyway. We can see how the student syndrome can affect your task, and the whole project in Figure 2.3.
I I I I I I I I I
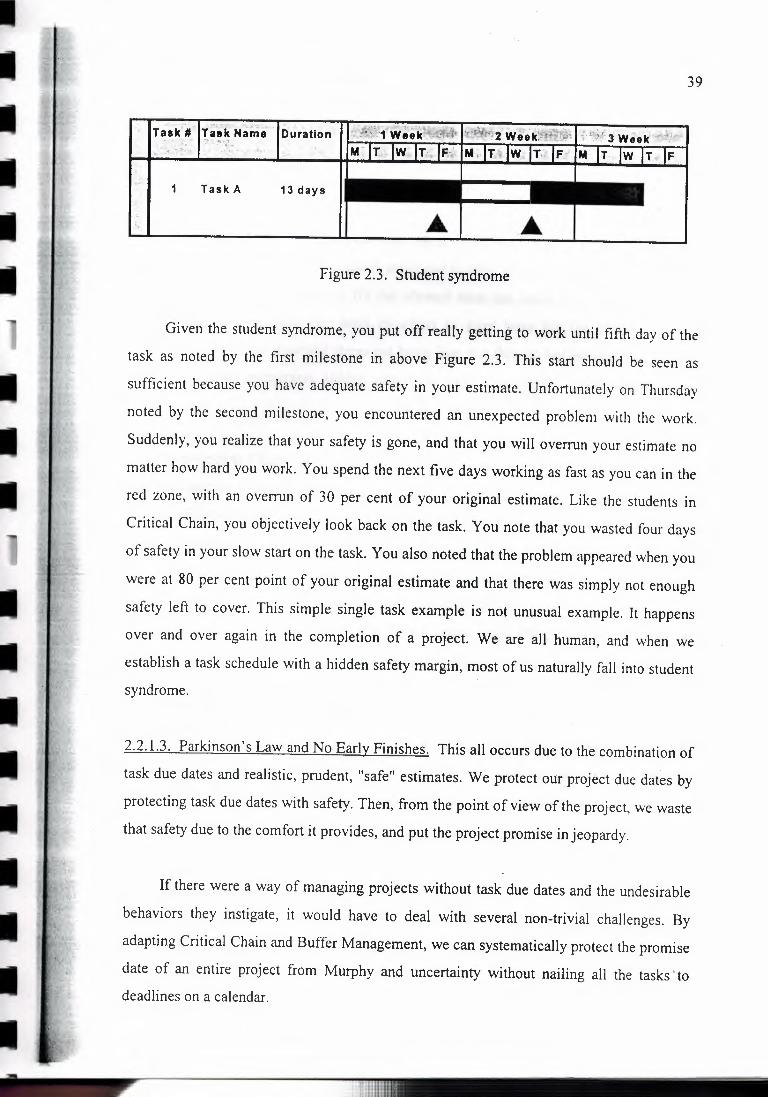
I I I I I I
I I
I I
I I I I I I
39
Task A 13days
Figure 2.3. Student syndrome
Given the student syndrome, you put off really getting to work until fifth day of the
task as noted by the first milestone in above Figure 2.3. This start should be seen as
sufficient because you have adequate safety in your estimate. Unfortunately on Thursday
noted by the second milestone, you encountered an unexpected problem with the work.
Suddenly, you realize that your safety is gone, and that you will overrun your estimate no
matter how hard you work. You spend the next five days working as fast as you can in the
red zone, with an overrun of 30 per cent of your original estimate. Like the students in
Critical Chain, you objectively look back on the task. You note that you wasted four days
of safety in your slow start on the task. You also noted that the problem appeared when you
were at 80 per cent point of your original estimate and that there was simply not enough
safety left to cover. This simple single task example is not unusual example. It happens
over and over again in the completion of a project. We are all human, and when we
establish a task schedule with a hidden safety margin, most of us naturally fall into student
syndrome.
2.2.1.3. Parkinson's Law and No Early Finishes. This all occurs due to the combination of
task due dates and realistic, prudent, "safe" estimates. We protect our project due dates by
protecting task due dates with safety. Then, from the point of view of the project, we waste
that safety due to the comfort it provides, and put the project promise in jeopardy.
If there were a way of managing projects without task due dates and the undesirable
behaviors they instigate, it would have to deal with several non-trivial challenges. By
adapting Critical Chain and Buffer Management, we can systematically protect the promise
date of an entire project from Murphy and uncertainty without nailing all the tasks 'to
deadlines on a calendar.
I I I
I
40
This application brings Parkinson and wasted safety time and take advantage of early
task finishes when they can help us to accelerate the project and maybe allow us to finish it
early, freeing up the resources to address other projects.
Work expands to fit the allotted time. Most of us heard about Parkinson's Law and
seen it in action on Projects. If a task is estimated to take IO days, it usually does not take
less. This adjustment of effort to fill the allotted time can come in a number of ways.
People will simply adjust the level of effort to keep busy for the entire schedule.
Traditional project environment stress not being late, but they do not promote being early.
This environment encourages hidden safety, the student syndrome and Parkinson's Law effects.
Non-Critical Chain-based projects often rely on safety embedded within tasks and
task due dates as milestone schedules to schedule and control projects. This approach runs
the risk of suffering from the impact of common resource behaviors that will minimize the
ability to gain time on the schedule. If you finish a task earlier than planned, you might be
accused of sandbagging your estimates instead of being rewarded for completion ahead of
schedule. In this environment, you worry about your future estimates being cut based upon
history so you quietly enjoy the lull of your hidden early completion gives you, and
officially finish on schedule. In this case you will probably get accolades for good
estimating even though you know you could have finished earlier. If you finish early and
announce your results, you then encounter the next problem. The task that is dependent
upon your completion might not be able to start early because the required resources are off
doing something else, because of the Project Schedule gave a clear start for the following
task and the resources were allocated elsewhere based upon this schedule.
When we integrate student syndrome and Parkinson's Law, with the likelihood of no
early finishes, we get the following result of finishing at due date. Traditional Project
Management methods loose the effects of early finishes and only propagate late finishes in
the schedule. In other words, the best they can do is to finish on time, and the likelihood of that happening is small.
I
II I II
41
We can systematically protect the promise date of an entire project by buffers and by
buffer management from Murphy and uncertainty without nailing all the tasks to deadlines on a calendar.
This brings Parkinson and wasted safety time into the picture by building the
schedule with target durations that are too tight to allow/encourage diversion of attention,
getting rid of task due dates and charging management with the responsibility to protect
project resources from interruptions rather than getting in their way with unnecessary distractions.
The Critical Chain methodology requires that the schedule be built with only the time
to do the work without any safety. This is the time we expect the work to take if allowed to
focus a full sustainable level of effort on it and if there are no significant problems. We
usually describe this estimate in terms of having a 50 per cent confidence level.
This now leads directly to and supports the second requirement for repealing
Parkinson's Law -- the elimination of due dates. If we're building a schedule on the basis of
aggressive, 50 per cent confidence durations, we can't expect people to meet them all the
time, and therefore there is no way we can think in terms of due dates.
2.2.1.4. The Effect of Multitasking. By the multiplying effect of multi-tasking safety is
wasted. We all have experiences of having to stop working on one task so that progress can
be accomplished on another task in other projects. Often, we wonder if all this jumping
around makes sense because it comes with the penalties of reduced focus and loss of
efficiency. However, there is a reason for this multi-tasking environment. Internal and
external customers have a tendency for demanding. They think that their project is the
highest priority and they want to see frequent progress on their project. Resources tend to
migrate between projects in response to the latest, loudest customer demand in an attempt
to keep as many customers satisfied as possible. This focus on showing progress on as
many active projects as possible is the major cause of multitasking. This focus is the
detriment of the overall project throughput of the organization because of relative inefficiency.
·111111111111111111111111111111111111
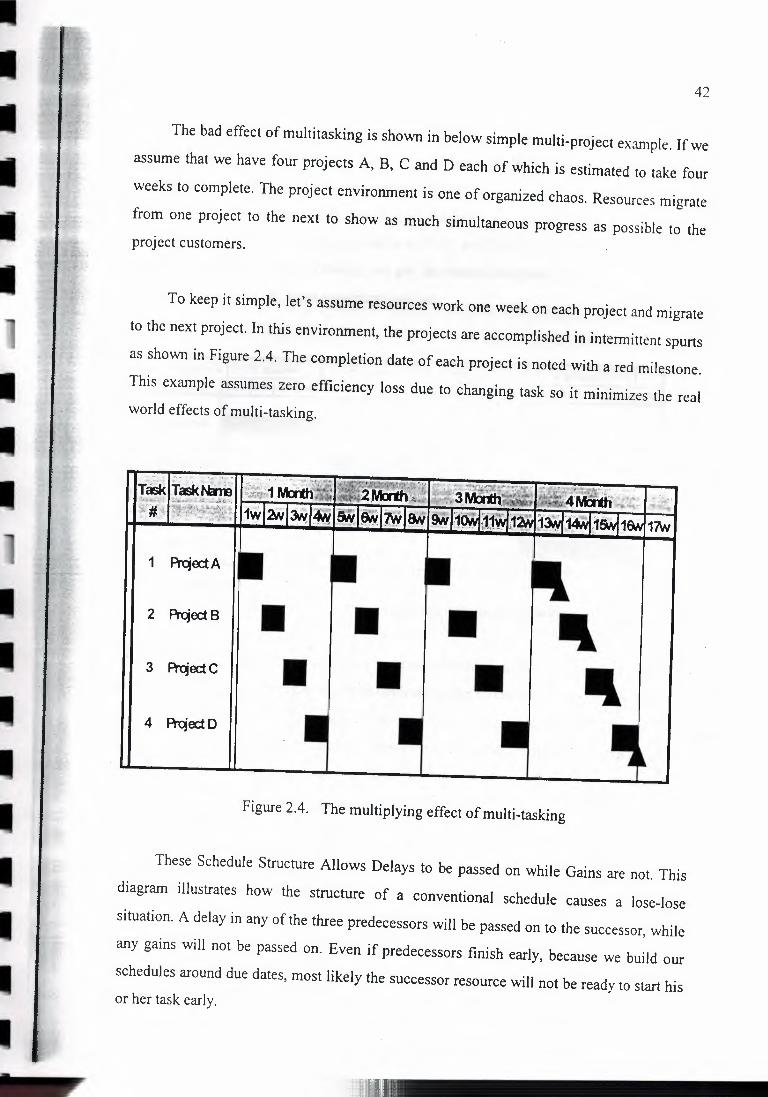
I I I I I I
42
The bad effect of multitasking is shown in below simple multi-project example. If we
assume that we have four projects A, B, C and D each of which is estimated to take four
weeks to complete. The project environment is one of organized chaos. Resources migrate
from one project to the next to show as much simultaneous progress as possible to the project customers.
To keep it simple, let's assume resources work one week on each project and migrate
to the next project. In this environment, the projects are accomplished in intermittent spurts
as shown in Figure 2.4. The completion date of each project is noted with a red milestone.
This example assumes zero efficiency loss due to changing task so it minimizes the real world effects of multi-tasking.
1 F\tjoctA
2 F\tjoct B • • • 3 F\tjoctC • • • 4 F\tjoctD
Figure 2.4. The multiplying effect of multi-tasking
These Schedule Structure Allows Delays to be passed on while Gains are not. This
diagram illustrates how the structure of a conventional schedule causes a lose-lose
situation. A delay in any of the three predecessors will be passed on to the successor, while
any gains will not be passed on. Even if predecessors finish early, because we build our
schedules around due dates, most likely the successor resource will not be ready to start his or her task early.
rn11111111111111111111111111111111
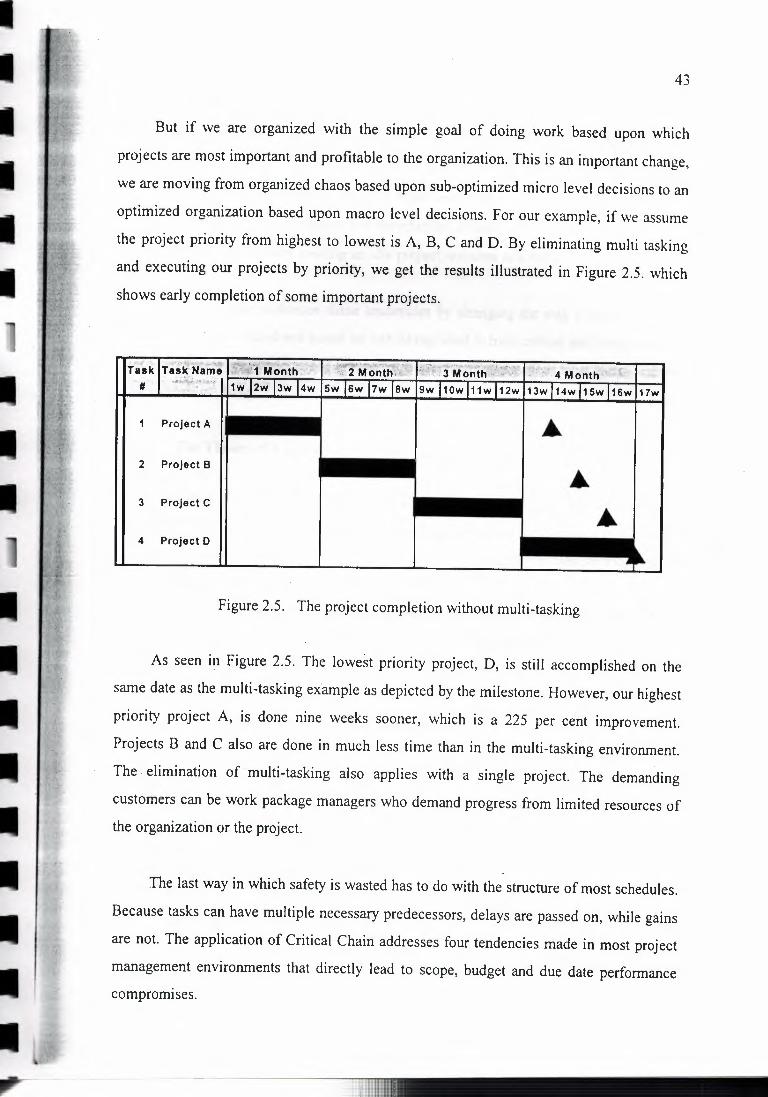
I I I I I I
I
I I I I I
43
But if we are organized with the simple goal of doing work based upon which
projects are most important and profitable to the organization. This is an important change,
we are moving from organized chaos based upon sub-optimized micro level decisions to an
optimized organization based upon macro level decisions. For our example, if we assume
the project priority from highest to lowest is A, B, C and D. By eliminating multi tasking
and executing our projects by priority, we get the results illustrated in Figure 2.5. which
shows early completion of some important projects.
' .••. ;.~ , - ri',"W.:~,i,.,,_,~ :-"~'
Task Tasl('Name . . . ... _ .. # .·.,~~fY.«'<.·~1l1..,l?..;l.,,.,jA, .. 1., .. :i., ... l .•.. :·1n ... L.iu I •• I._ I._ I .. I I I
Project A
2 Project B
3 Project C
4 Project D
Figure 2.5. The project completion without multi-tasking
As seen in Figure 2.5. The lowest priority project, D, is still accomplished on the
same date as the multi-tasking example as depicted by the milestone. However, our highest
priority project A, is done nine weeks sooner, which is a 225 per cent improvement.
Projects B and C also are done in much less time than in the multi-tasking environment.
The. elimination of multi-tasking also applies with a single project. The demanding
customers can be work package managers who demand progress from limited resources of
the organization or the project.
The last way in which safety is wasted has to do with the structure of most schedules.
Because tasks can have multiple necessary predecessors, delays are passed on, while gains
are not. The application of Critical Chain addresses four tendencies made in most project
management environments that directly lead to scope, budget and due date performance
compromises.
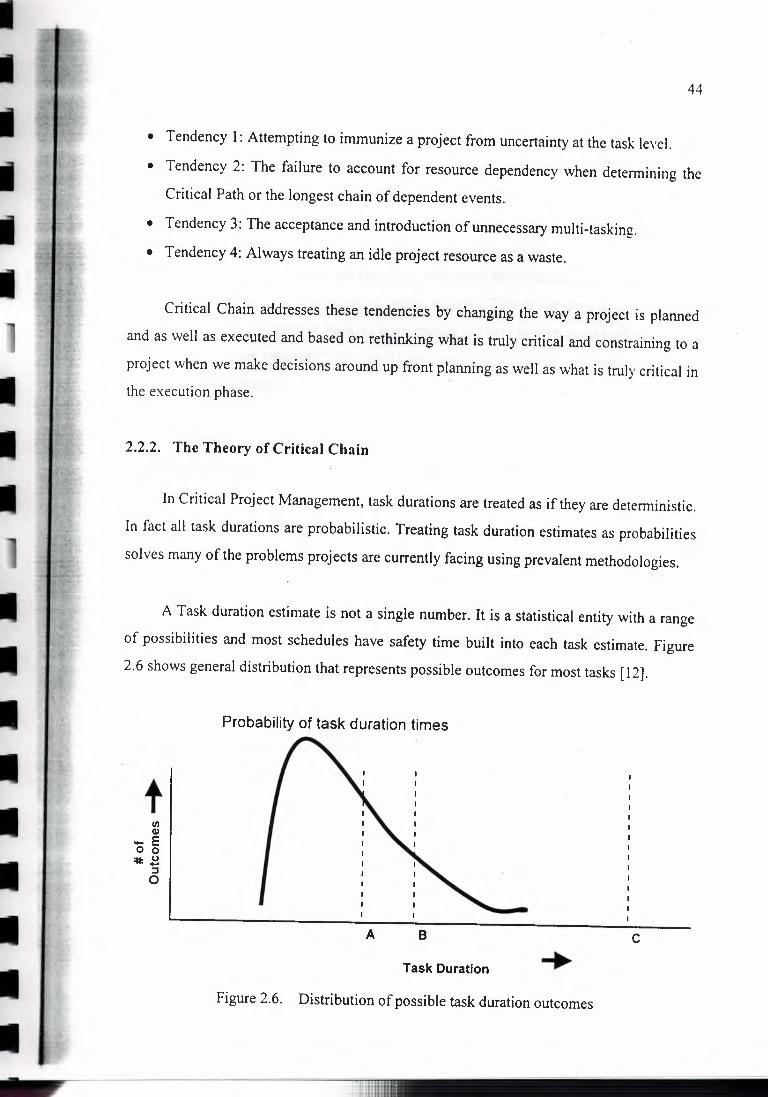
II 'I
1 t·' t • .u ~- ' VI a, .._ E
I r ~. 0 0
j ; ..• ,.::,:,:~.
:it: 0 - l ;•, ,f:">.
::::J 0
I I I
L -
I I I I I I
I
I.I
II I
44
• Tendency I: Attempting to immunize a project from uncertainty at the task level.
• Tendency 2: The failure to account for resource dependency when determining the
Critical Path or the longest chain of dependent events.
• Tendency 3: The acceptance and introduction of unnecessary multi-tasking.
• Tendency 4: Always treating an idle project resource as a waste.
Critical Chain addresses these tendencies by changing the way a project is planned
and as well as executed and based on rethinking what is truly critical and constraining to a
project when we make decisions around up front planning as well as what is truly critical in the execution phase.
2.2.2. The Theory of Critical Chain
In Critical Project Management, task durations are treated as if they are deterministic,
In fact all task durations are probabilistic. Treating task duration estimates as probabilities
solves many of the problems projects are currently facing using prevalent methodologies.
A Task duration estimate is not a single number. It is a statistical entity with a range
of possibilities and most schedules have safety time built into each task estimate. Figure
2.6 shows general distribution that represents possible outcomes for most tasks [12].
Probability of task duration times
C
Task Duration
Figure 2.6. Distribution of possible task duration outcomes
-. ---- ------
I I I I I II
I I I I I
45
It is a normal distribution with a finite left tail because things can only go so well. On
the other hand, quite a lot can go amiss. This explains the long right tail. When a person is
asked to estimate task duration, consciously or subconsciously he or she is picturing a
graph like the one above which is built from historical data points. Time "A" is the "Pure
Success" basis, minimum time to complete the task. It is not likely to repeat and, unless
someone is very new to project management, will never be given as a task estimate. Time
"C" is highly achievable, even with a major disaster. This is the time commonly used
because this is what incentive systems have trained workers to give as estimates. Goldratt
calls this the "95 per cent time" because 95 per cent time a resource will finish in less time than the given estimate.
Furthermore, if management has a practice of cutting all estimates across the board to
squeeze a schedule into a given amount of time, this is even more incentive for team
members to give "C" or even "C+" times. "Even though we were trying to offer our best
estimates with as little safety built in, there were sufficient buffers built in there. Time "B"
represents the duration estimate such that 50 per cent of the outcomes are less than it, and
50 per cent of the outcomes are greater. B is the aggressive estimate with significant safety
removed. In other words, if a resource gives this duration as an estimate he or she has a
50/50 chance of finishing on time. This is the median task duration and the time estimate
one attempts to build into a Critical Chain schedule.
In most projects, estimates are turned into a project schedule including task estimates
with plenty of safest in them above and beyond the actual expected time to the work - a list
of dependent tasks with associated start-dates and due-dates. People plan their work around
these dates and focus on delivering their deliverables by these dates as per the estimated
schedule. The problem comes in when the scheduled time arrives. It often happens that
there is other "urgent stuff' when the task shows up in the in-box.
In any event, we have until the promised date to finish the work, which at this point
looks like a long way off due to the safety included in the estimate. We are comfortable
putting off or "pacing" the work in favor of other stuff because the due date is out there and
nobody is blamed with using the estimated duration of that specific activity.
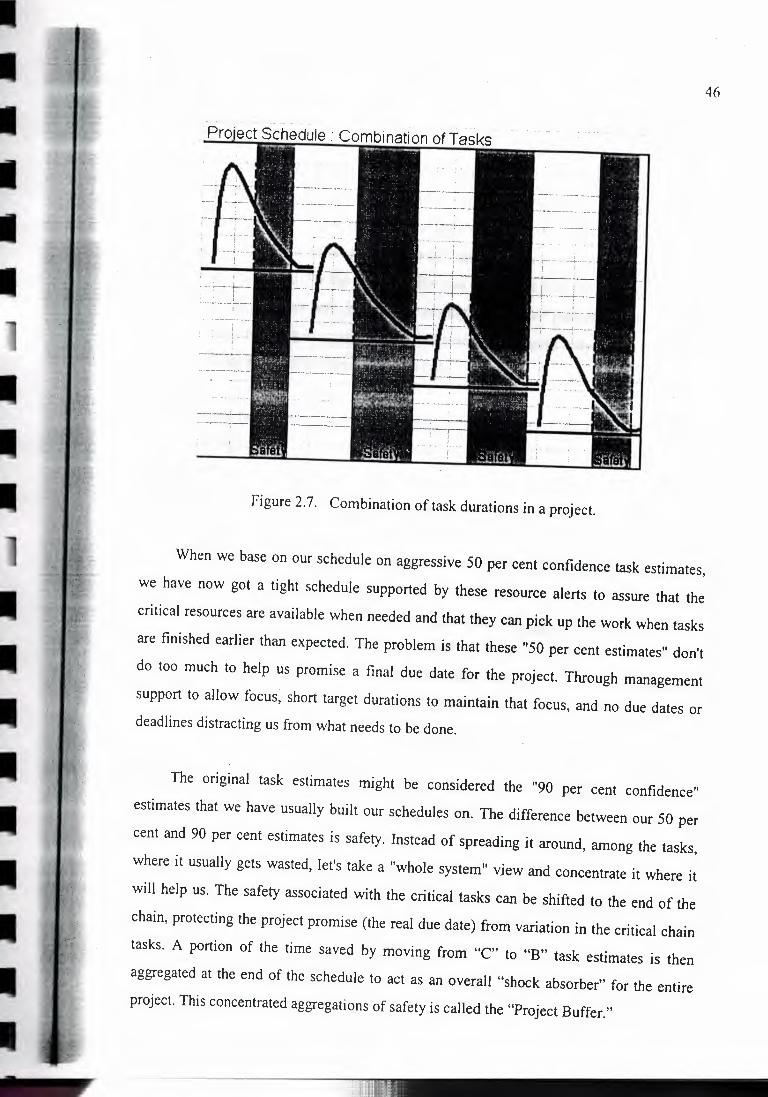
II
I I I I
II
II II II
46
. -·· ···-----·--···-··· -- -- ..... ·-·······
Project Schedule: Combination of Tasks WWW &-.-W;;.c, .. ,,
Figure 2. 7. Combination of task durations in a project.
When we base on our schedule on aggressive 50 per cent confidence task estimates,
we have now got a tight schedule supported by these resource alerts to assure that the
critical resources are available when needed and that they can pick up the work when tasks
are finished earlier than expected. The problem is that these "50 per cent estimates" don't
do too much to help us promise a final due date for the project. Through management
support to allow focus, short target durations to maintain that focus, and no due dates or
deadlines distracting us from what needs to be done.
The original task estimates might be considered the "90 per cent confidence"
estimates that we have usually built our schedules on. The difference between our 50 per
cent and 90 per cent estimates is safety. Instead of spreading it around, among the tasks,
where it usually gets wasted, let's take a "whole system" view and concentrate it where it
will help us. The safety associated with the critical tasks can be shifted to the end of the
chain, protecting the project promise (the real due date) from variation in the critical chain
tasks. A portion of the time saved by moving from "C" to "B" task estimates is then
aggregated at the end of the schedule to act as an overall "shock absorber" for the entire
project. This concentrated aggregations of safety is called the "Project Buffer."
I I I
II II
I I I I I s:.·· . _.·
47
There is an additional advantage to this aggregation of safety in the form of buffers.
Because the tasks' target durations are 50 per cent confidence estimates, we might expect
that half the time they will come in early and half the time they will be late. In Traditional
Project Management we cannot be able to take advantage of early finishes of tasks. Since
the early tasks will help to offset some ofthe late ones, we don't need all the protection that
used to be spread around. So the project buffer can be smaller than the sum of the parts. I
won't go into the statistics here, but we can usually cut the total protection at least in half
and still be safe, resulting in a project lead-time that can be significantly shorter than in the old paradigm for a project promise of similar risk.
There are two kinds of resources; resources that perform critical tasks and resources
that perform non-critical tasks. We really have to worry about are the critical chain tasks as
they determine the project duration. We want to make sure that critical chain resources are
available when the preceding task is done, without relying on fixed due dates. When we
focus on the non-critical tasks, we do not want to micro-manage everybody to the degree
we do the critical tasks with the resource availability alerts. Yet we do want to assure that,
if things go wrong in the non-critical, we do not want them to affect the ability of the
critical tasks to stay on track. The traditional approach is to start these tasks as early as
possible, and hope that the slack or float is enough to absorb the variability. Buffer
approach can be used as concentrating the safety associated with chains of non-critical
tasks as a buffer protecting the start of the critical chain task they feed into feeding buffers.
Note that the feeding buffers are also relied upon to deal with resource timeliness for
non-critical tasks/resources; we do not use the "work-coming alerts" because even if the
feeding buffer is consumed, the worst case is that the critical tasks are delayed and maybe
eat some project buffer. The feeding, non-critical tasks are two buffers away from
impacting the project promise. Also, you gain more by keeping non-critical resources
focused on the work at hand and to assure they finish work that can be passed on to other
resources rather than interrupt them for other non-critical stuff.
As a result of this time allocation and buffer approach, we can built a Critical Chain Schedule shown in Figure 2.8.
rn111111111111111111111111111111
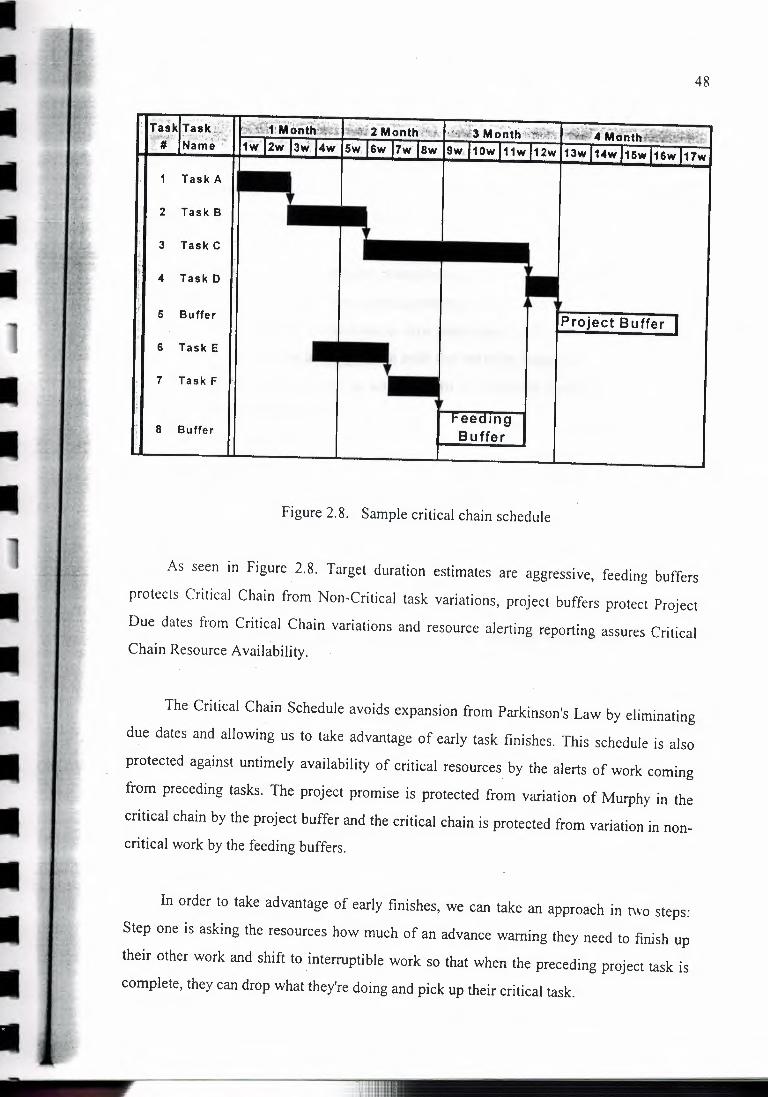
I I I I I I
I ----~-----
48
2 Task B
3 Task C
4 Task D
5 Buffer II _J_ I I f Project Buffer 6 Task E
7 Task F
8 Buffer
Figure 2.8. Sample critical chain schedule
As seen in Figure 2.8. Target duration estimates are aggressive, feeding buffers
protects Critical Chain from Non-Critical task variations, project buffers protect Project
Due dates from Critical Chain variations and resource alerting reporting assures Critical Chain Resource Availability.
The Critical Chain Schedule avoids expansion from Parkinson's Law by eliminating
due dates and allowing us to take advantage of early task finishes. This schedule is also
protected against untimely availability of critical resources by the alerts of work coming
from preceding tasks. The project promise is protected from variation of Murphy in the
critical chain by the project buffer and the critical chain is protected from variation in non
critical work by the feeding buffers.
In order to take advantage of early finishes, we can take an approach in two steps:
Step one is asking the resources how much of an advance warning they need to finish up
their other work and shift to interruptible work so that when the preceding project task is
complete, they can drop what they're doing and pick up their critical task.
-·-----
I I I I I ~,.,.
I I I
II
I
49
Step two is each resource provides regular, periodic updates of their current estimate
of the time to complete their current task. When the estimate to complete task A matches
the advance warning needed by the resource on task B, let the B resource know the work is
on its way and that it should get ready to pick it up.
Compared to traditional project management, this is a bit of a shift away from
focusing on "what we've done" via reporting percent of work complete to focusing on what
counts to assess and address project status--how much time is left to accomplish unfinished
tasks. This process puts us into a position such that we're no longer nailed to the calendar
through due-dates, we can move up activity as its predecessors finish early, and we can
avoid the impact of Parkinson's Law.
During the execution stage, the key to the management of the project is the set of
feeding and project buffers and a process known as "Buffer Management". As tasks are
completed, we know how much they have used or replenished the buffers. Because we are
now getting updated estimates of time-to-completion from currently active tasks, we can
stay on top of how much of the buffers are consumed in an ongoing fashion. As long as
there is some predetermined proportion of the buffer remaining, all is well. If task variation
· consumes a buffer by a certain amount, we raise a flag to determine what we might need to
do to if the situation continues to deteriorate. If it deteriorates past another point in the
buffer, we put those plans into effect. This process allows us to stay out of the way of the
project resources if things are on track, build a contingency plan in something other than a
crisis atmosphere, and implement that plan only if necessary.
The Critical Chain Approach is a way to manage all of an organization's projects
holistically. Developed using the Theory of Constraints improvement methodology,
Critical Chain puts forward only a few strategic changes in how projects are planned,
scheduled and managed. However, these few changes are resulting in claims of tripling the
number of projects completed, reducing project cycle times, and increasing company
revenues. Critical Chain methods focus mostly on improving project cycle time.
Sometimes, conscious tradeoffs are made in resource cost, in order to generate a much
higher throughput from the project.
I I I i I I
I
I I I I I I
50
2.2.3. Single versus Multi-Project Implementation
There are two main categories of Critical Chain Management [12]. The first is called
single project implementation. The definition of single project implementation is that the
projects are not predominantly utilizing the same resources. Within an organization, there
can be multiple single Critical Chain projects. The second type of implementation is called
multi-project implementation. Multi-project implementation indicates. there are multiple
simultaneous Critical Chain projects and many of the resources are shared across projects.
It is more difficult to schedule resources across multiple projects because there is no clear
decision metric when deciding which project to first allocate a constrained resource.
Goldratt contends that CC and TOC can provide this global project metric.
Multi-projects require a higher level of implementation with much higher
coordination requirements. At this level, an organization identifies which resource is the
constraint across all the projects it undertakes. More strategically, an organization would
identify which resource should be its constraint, and then have this resource or group of
resources pace when new projects are undertaken by the entire organization.
2.2.4. Fundamentals of Project Planning and Scheduling ·
The use of Critical Chain does not exclude the use of other common sense project
management tools. The more tasks can be decomposed into finer detail, the more this will
allow the team to overlap tasks and shorten the Critical Chain. The team members need to
understand the requirements of tasks, which have to be performed sequentially or in
parallel. We have to change the thinking style that tasks do not always have to be
performed sequentially or performed by specific people [12].
Once the Critical Chain for a project is identified by the project team, they can take a
much closer look at those tasks to identify opportunities for performing them in parallel.
First, the project team will identify the constraint of the project and then work to break that
constraint. Once they have broken the first constraint, they begin to work to break the next
constraint, until they get to the shortest practical schedule.
I I I I I I
II
II
I II II I I I
I I
51
Network building process is the primary aspect of planning in a Critical Chain
environment. It is a multi-pass approach designed to assure that no key dependencies for
the project are missed. No matter how good a project schedule is or how well resources
perform in the execution of tasks in that schedule, if critical dependencies associated with
the project are not included in the description of the effort, they represent considerable risk.
Once the end result is understood, network building quickly shifts to a focus on task
dependencies required to get there. The clear definition of deliverables serves as a high
level WBS, but rather than continue developing the individual hierarchical branches of a
WBS, Network Building shifts to dependency identification. Once the first pass of major
dependencies, from end to beginning has been developed, it is addressed for identification
of the minimum resource capability needed for task completions. The emphasis of Network
Building in a Critical Chain environment is on clarity of task inputs necessary to support
that task's deliverables. Any effective planning process is about the identification and
inclusion of necessary handoffs. These handoffs are the linkages of the chain of tasks -
they serve as inputs to some tasks and are developed as outputs of others.
The plan, which is the dependency network, is simply the sum of handoffs that need
to occur to overcome obstacles on the way to the project's objective and to minimize the
effect of potential pitfalls along the way. To the extent that careful consideration is given to
the completeness of necessary inputs, identified risks can be avoided or mitigated by
adding additional tasks to the network. Too often, plans include assumptions regarding the
existence of necessary inputs. The focus on whether all identifiable inputs are sufficiently
provided for in the network ·goes a long way to avoiding and mitigating risks that might
have otherwise been buried in those assumptions.
The final step in Network Building is the development of range estimates for both
task durations and iterations. Critical Chain Scheduling utilizes a 2-point estimate, for both
durations and iterations. A Critical Chain schedule takes advantage of the 2-point estimate
process to translate the dependency network into a reliable project promise. Reliability
comes first from feasibility assured by explicitly including resource dependencies as well
as handoff dependencies in the determination of the critical chain/path of the project.
I I I I I I
I I I
I II I II I I I I
52
Secondarily, the two estimates developed in the planning process are used to
aggregate and concentrate safety where it will do the most good to protect the project's
promises and its intended value. The body of the schedule, which is the network of tasks
and resources used to identify the critical chain, makes use of the smaller of the two estimates.
The difference between the "safe" estimate and that "aggressive but achievable"
estimate for critical chain tasks is used to develop the primary characteristic of the critical
chain schedule with the buffers. A project buffer, which protects the final project due date
from the variability in performance on those tasks is built from the estimates associated
with the critical chain tasks. Feeding buffers, which are related to chains of tasks that feed
into or merge with the critical chain, are similarly sized and placed to isolate the critical
chain from the integration effects of those chains.
To this end, resources are first queried for a safe estimate, one in which they have a
high level of confidence, and are willing to consider a commitment. This defines the upper
end of the possible requirements of the project components in terms of time. Once this
upper limit is initially established, a second "aggressive but achievable" estimate is
solicited, one that reflects a near "best case" situation that is "in the realm of possibility" if
things go well in the performance of the task in question.
2.2.4.1. Two-Point Estimates and Risk Assessment/ Avoidance/Mitigation. Schedule and
cost risk assessment are inherent in Critical Chain's 2-point duration and iteration
estimates. Once basic dependencies are identified in the Network Building process, the
uncertainty and potential variation associated with individual tasks and groups of tasks are
the next link related to the risk of keeping project promises and delivering desired value.
Even if identified, mitigated, or avoided through additional tasks in the network, task
delivery is still subject to technical or performance risk. Some of the major beneficial
effects of the Critical Chain approach come from the linking of scope and time
management to risk management.
--· - --·-----
I I I I I I
I I
I I I I I I I I I
53
Once developed, assessment of the full schedule, including the contribution of the
buffers to project lead-time, provides a clear view into the identified potential of schedule
risk for the project. In non-Critical Chain environments, when contingency is included in
tasks, it is often hidden, either in management reserve, or in internal and external commitments.
The common practice of keeping these components off the table hides their true
impact and implications. The open and explicit communication of buffers, which are
important because of being project control tool, allows a clear assessment of what could
happen "in the best of all possible worlds," versus what might happen if individual concerns accumulate to affect project performance.
The ultimate risk of a project is not delivering the promised value in the required
time frame. If the schedule results in a lead-time that does not support business needs of the
project, the critical chain schedule provides two primary sources for reduction - the critical
chain and the project buffer. Assumptions that have been made on key critical activities can )
be revisited to assess whether additional actions or activities can be added to the project to
reduce variability and the size of the project buffer, or whether task handoffs can be
restructured to allow more parallel activity and reduce the length of the critical chain. At
some point, limits on corrective action are reached, resulting in a buffered schedule that
reflects the accepted risk of the project's lead-time and schedule promise.
2.2.4.2. A Relay Race Approach. Most projects are managed by carefully watching the
calendar, comparing where we are today against some baseline schedule. That schedule
typically consists of a series of start and due dates for consecutive tasks, with due dates of
predecessors matching start dates of successors. Like a train schedule, if a task arrives at its
completion on or before its due date, that portion of the project is considered to be "on
track." Successor resources plan other work and their availability around those dates. If the
predecessor is finished early, the successor resource may not be available to pick up the
handoff. Even if the resource is available, there is commonly little or no urgency for the
successor to start (or to focus on it exclusively), since we're "ahead of schedule," and that resource will typically tend to other priorities.
I I I I I I
I II
II
II I I I I I I ---
54
In order to take advantage of early finishes and deal effectively with late finishes,
schedule must be very dynamic. Most project managers worry that a dynamic schedule will
become unmanageable, and use a "simpler" approach of trying to lock down the schedule
by assigning due dates. The CC schedule does not become unmanageable because only the
CC tasks must remain flexible. Unless there are major variances, feeder paths remain set.
The team makes a pact during the implementation of CC that all members will drop
what they are doing to work on CC tasks and work non-stop on those tasks until they are
complete. In this regard, a CC schedule is very similar to running a relay race. Team
members wait to get the baton and then run as fast as they can until they pass the baton on
to another teammate. The CC by definition defines the overall length of the project, thus it
makes sense to concentrate all management attention on these tasks and "sprint" them as
quickly as possible. Resource behaviors for timely projects in critical chain is like a relay
race. Due dates for some tasks are start dates for others. Successor resources plan other
work and their availability around those dates. If the predecessor is finished early, there is
no pressure on the successor to start, even if the resource is available.
The problem with this common practice is that while it is important for trains to
arrive at and depart from their stations (their milestones) at appointed times, project value
is more often tied to the absolute speed from beginning to end. The sooner the entire
project is completed; the sooner project benefits can be accrued. A more appropriate
metaphor to guide projects is a relay race, in which resources are encouraged to pick up the
input handoff as soon as it is available, "run with it" in a full, focused, sustainable level of effort, and hand off the output as soon as it is complete.
This Relay race behavior is very useful in projects where schedules are built upon
estimates that are considered commitments by the resources,and contain a substantial
amount of safety in each task to protect that commitment. If a project is deemed "on track,"
and a resource realizes that there is chance of completing the work well within the "safe"
estimate, the desired sense of urgency is again diminished. As a result, resources are
momentarily comfortable sharing their time among several tasks or issues, extending out
the time that they would otherwise be able to hand off their output to the next leg of race.
I I I I I I
I
I I
I
55
Milestone schedules, like training schedules, become, at best, self-fulfilling
prophecies, at least in terms of expectations of speed. They may still and often take longer
due to being derailed by Murphy's Law because they have wasted what might have been
early finishes which are now not available to offset tasks that take longer than anticipated in the early stages.
2.2.5. Project Control and Risk response Control
The need for project control and benefit of effective project control is very important.
Planning, scheduling and synchronization are all processes that will create a model of
expectation for the project organization. But that model needs to be managed once it comes
into contact with reality. Resource behaviors, especially the required focus on the most
important task at hand; require the occasional guidance to clarify priorities in a shifting situation.
The buffers also help management to act proactively. Buffer management highlights
potential problems much earlier than they would ordinarily be discovered using typical
project management techniques. The feeder and project buffers are broken into three zones
similar to a traffic light indicator. The ''green" zone is labeled "OK." If this portion is eaten into, management does nothing.
The next zone of the buffer is labeled ''Watch & Plan." In this "yellow" zone, the
team would form a plan to put into action if further buffer is eaten in order to protect the completion date.
The last zone is labeled "Act." This is the "red" zone wherein management would
expect its team to initiate the plans to increase the size of the buffer or at least prevent
further erosion of it. This is extremely powerful, especially because management can set
the size of each zone based on past performance, inherent variability of the project. Setting
the size of each zone will in some regards define the degree of management involvement in the project.
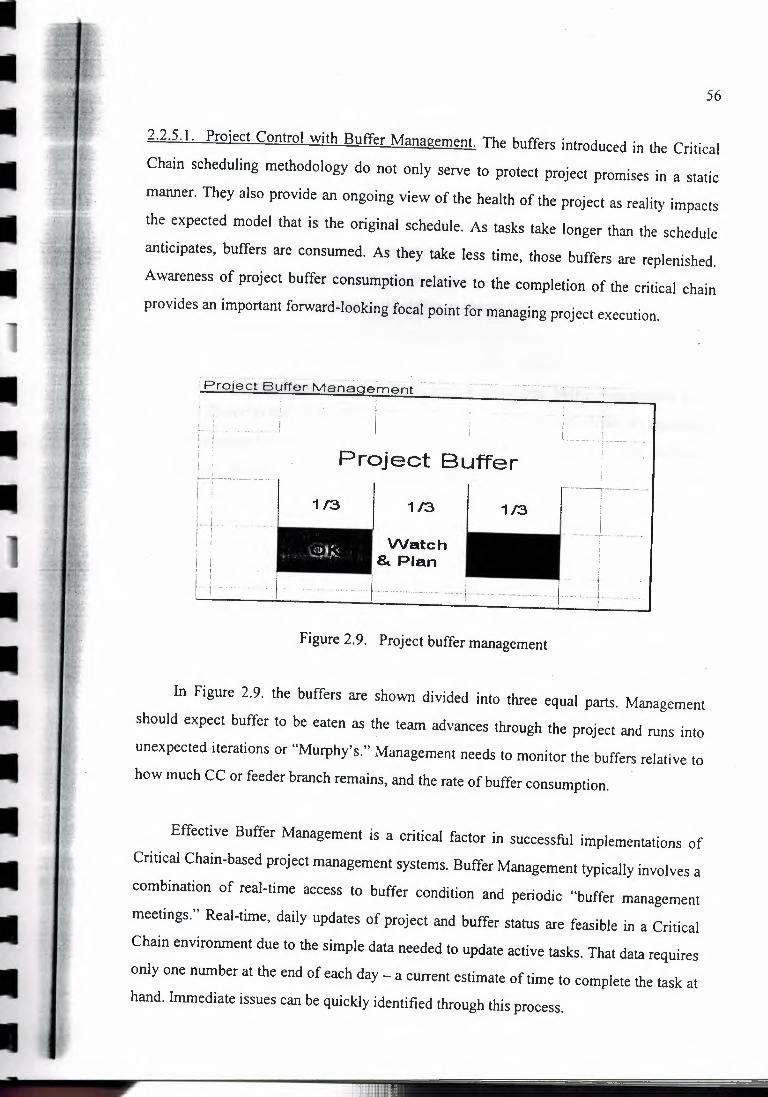
I I I I I I
II
II
II I I I I I I
56
2.2.5. l. Project Control with Buffer Management. The buffers introduced in the Critical
Chain scheduling methodology do not only serve to protect project promises in a static
manner. They also provide an ongoing view of the health of the project as reality impacts
the expected model that is the original schedule. As tasks take longer than the schedule
anticipates, buffers are consumed. As they take less time, those buffers are replenished.
Awareness of project buffer consumption relative to the completion of the critical chain
· provides an important forward-looking focal point for managing project execution.
i Proie-ct Buffer Manaaement ... r
L I ........... , . I i !
Project Buffer '
,-[ I 113 I ,
/··! ''
i . . I . I- i-- · · · ··· _ ·
1/3 1/3
·-~----i----- i l j ...... T···· ----- .
Watch & Plan
_J_ I j ·-·· - ... -·
Figure 2.9. Project buffer management
In Figure 2.9. the buffers are shown divided into three equal parts. Management
should expect buffer to be eaten as the team advances through the project and runs into
unexpected iterations or "Murphy's." Management needs to monitor the buffers relative to
how much CC or feeder branch remains, and the rate of buffer consumption.
Effective Buffer Management is a critical factor in successful implementations of
Critical Chain-based project management systems. Buffer Management typically involves a
combination of real-time access to buffer condition and periodic "buffer management
meetings." Real-time, daily updates of project and buffer status are feasible in a Critical
Chain environment due to the simple data needed to update active tasks. That data requires
only one number at the end of each day - a current estimate of time to complete the task at
hand. Immediate issues can be quickly identified through this process.
I I I I I I
II
II
I I I I I
57
Periodic multi-project buffer management meetings, typically involving project
owners, project managers, and resource managers, start with· buffer status of the portfolio's
projects. Those with buffers "in the green" require little if any discussion. Those "in the
yellow" or "in the red" are rightfully the focus of the meeting, with project managers
highlighting identified opportunities and actions for buffer recovery. These meetings are
also useful for supporting regular, forward-looking risk management as well, again with an
eye to current buffer condition and to its ability to absorb the impact of identified risks to the project schedule.
2.2.5.2. Buffer Management and Risk Identification. Consistent buffer management is a
major contributor to the establishment of a risk management culture. Risks are potential
future occurrences that require a forward-looking approach to support their identification.
The everyday process of developing an estimate-to-complete task status keeps short term
risks in the forefront of the mind of the reporting resources. In addition, the elimination of
task estimates as commitments and the related transfer of safety to the buffer should
support a greater willingness to raise concerns, if the buffer is there to absorb them and
they are not expected to have to have an immediate solution to protect their personal performance.
Buffer management also provides a clear view of the cumulative risk effects of
project performance. Buffer consumption at any point in time is the result of all previous
work, which can eat away at the buffer quietly but insidiously as the project progresses.
2.2.6. Critical Chain Project Management Software
There are currently three packages for Critical Chain applications. Prochain was the
first used for implementations, in the market. It proved to be reasonably effective for single
project environments but less effective in multi-project environments. Prochain is
essentially a macro sitting on top of Microsoft MS Project which is a scheduling software
using Critical Path Methodology. Scitor have a product called PS8, and Concerto, a product from East-to-Market.
I I I I I I
I I II
II II I I I I I I I
58
2.3. Comparison of Critical Chain and PM Body of Knowledge
This section is to expliam how Critical Chain Approach integrates with and adds
value to the current body of Project Management knowledge. It is based on a dialogue
between Dr. Kerzner and Dr. Goldratt and IIL [13].
Since projects are undertaken to bring benefits to an organization, the sooner they are
completed, the sooner the benefits are realized. Critical Chain focuses on the amount of
time it takes to complete any single project. In a collection of projects, Critical Chain
focuses on the factor that most effects the cumulative cycle of all projects. This factor is
known as the organization's strategic or critical resource, also called the "Drum".
Critical Chain's focus on the critical factor to improve overall project performance is
one of its major contributions.Accepting cycle time as significant target of our
improvement efforts, we must focus our attention on the causes of long cycle times.
In projects, there is a difference between elapsed time (duration) and effort. Effort
can be applied in a dedicated or non-dedicated way. For example, non-dedicated would
have a resource assigned to several tasks simultaneously, whereas a dedicated resource
would be fully assigned to one task until that task is completed. Non-dedicated effort implies extending the duration.
Critical Chain highlights the importance of dedicating effort to streamline and
optimize the cycle time. Critical Chain analysis shows that within single projects, the
biggest factor impacting cycle times as the practice of estimating tasks according to non
dedicated elapsed time, and managing the execution of those tasks to a due date.
Within the multi-project environment, the biggest factor impacting cycle times is the
resource bottleneck. This factor is created by the current system of pushing work as in the
form of new projects or more involvement into the organization, irrespective of the
capacity of the most critical resource - the one that most impacts the cycle time of all projects.
------
I I II II II I
I
II
59
Critical Chain addresses both the single and multi-project factors in the reduction of
duration. Critical Chain assumes a good critical path network that has been effectively
resource leveled. Starting from that point, Critical Chain enhances the ability to optimize
the schedule and set the stage for improved project monitoring and control. It should be
noted that some of the actions needed to· implement Critical Chain successfully might be
significant changes for an organization. Following are specific ways that the Critical Chain Approach works and adds value.
Using the Citical Chain approach, team members are asked to dedicate themselves to
a project task, to complete it as quickly as possible and periodically report how many days
are remaining. When planning a project, task times should be estimated much closer to
how long the task will take with dedicated resources, rather than elapsed times assuming
the organization's current practice of assigning resources to work on several tasks at once
whcich reduces behaviours called "student syndrome" and "Parkinson's Law".
Bad multitasking is significantly reduced, permanently. The reduction of bad
multitasking goes hand in hand with reducing task estimates to dedicated elapsed times and
having people complete tasks before starting new ones, as much as possible.
In executing a project, people are not measured and are not held accountable for
completing their tasks on time. Managing tasks by due dates is not done. People are asked
to pass on their outputs to the next resource as quickly as possible with a relay runner ethic.
By taking resource dependency, as well as logical task dependency into account, the
longest sequence of dependent tasks can be seen more clearly. This longest sequence, the Critical Chain, may cross logical paths in the network.
Buffers which are equivalent to schedule contingency reserves, are key part of the
schedule and how it is managed. The ability to increase the certainity of project completion
dates is closely related to the use of buffers. The use of buffers allows the planner to
clearly accommodate all common cause variations. Buffer types include Project buffers,
Feeding buffers, Resource buffers, Drum buffers and Strategic Resource buffers.
··-- •
I I I I I I
I
II I I I I I I I I
60
Critical Path uses a concept of slack time or float to the determine how much
flexibility there is in non-critical path tasks. Critical Chain Approach groups tasks on each
non-critical or feeding) path entering into the critical chain and "protects" the critical chain
with a Feeding Buffer. The feeding buffer is equivalent to a schedule contingency reserve
that is local to a part of the project. The Critical Chain Approach is explicit and systematic
about the use of Feeding buffers throughout the task network.
This buffering allows for non-critical tasks to be scheduled at their latest possible
start times to discorage costly early investment of work in process. This also significantly
reduces behaviors called "student syndrome" and "Parkinson's Law". Early starts are
discouraged unless there is a major strategic reason for starting as early as possible. Early
starts require the resources allocated earliar which also affects the cash flow of the project.
Often, the Critical Path changes during execution because there is no buffer to absorb
the variation in task times. If implemented correctly, the Critical Chain plan and the
Critical Chain itself do not change througout the life of the project, because the buffers
absorb the uncertainities in task duration.
Critical Chain recognizes that there are multi-project environments in which projects
have resource-based interdependencies. In other words, projects share a common resource pool, for at least some tasks.
The Critical Chain Approach identifies the critical resource (called a Drum Resource)
across a collection of projects. When overloaded or not available, this resource is the one
most likely to impact the project cycle time of all projects.
The staggered introduction of projects into the system is issued to improve the flow
of projects, to increase the predictability in each project outcome and to increase the
effectiveness of critical resources by minimizing the effect of bad multitasking. Shorter
project cycle time and an increase of the number of projects that can be pushed through the
system without increasing resources result from sraggering the release of new projects.
I I I I I I
I I I
I I I I I I I I
61
Similar to vertical traceability in Critical Path, in the Critical Chain plan and prepare
detailed schedules with linked entities. Any logic at the detailed levels must be reflected in
the summary levels. The benefits of Critical Chain will be secured permanently for the
organization with the implementation of a performance measurement system, policies and
education that are in keeping with the Critical Chain Approach.
2.3.1. Project Time Management
The Critical Chain Plan must represent every activity but may not schedule every
activity in detail in a large project. In other words, the Critical Chain Plan schedules
summary level activities. For example, in a large project involving high level activities are
typically sufficent capture the major dependencies for Critical Chain. In such cases, it is
important that a detailed plan for controlling the work at the detailled level is linked
properly to the Critical Chain plan.
2.3.1.1. Activity Sequencing. The Critical Chain method includes any resource
dependencies in activity sequencing. A resource-loaded and leveled schedule is an input.
2.3.1.2. Activity Duration Estimating. The Critical Chain activity durations are estimated
assuming no bad multi-tasking and resource dedicated to tasks. The duration is the actual
time dedicated to perform a task, or something very close to this time. These assumptions
are possible if the organization makes the change required.
2.3.1.3. Schedule Development. Schedules are developed using the The Critical Chain
method as the primary tool. Schedules include a Project Buffer, Feeding Buffers, Resource
Buffers, Strategic Resource Buffers and Drum Buffers.
Tasks normally start as late as Possible. The objective is to minimize any work in
process and to eliminate "Student Syndrome" and " Parkinson's Law". In Critical Chain,
early starts would represent investment that was too early to provide a return. Early starts
also significantly increase the risk of bad multi-tasking. Safety is provided by the buffers
and help to avoid the need for, and hence the practice of padding at the task level.
-··· rni11i1i1ii1iillillllllllllllllll
I I I I I I
I I I
I I
I I I
62
Resource leveling is greatly simplified due to the multi-project Critical Chain
practice of staggering the introduction of the projects into the system according to the
availability of the strategic resources of the organization. This typically results in the
reduction of bad multi-tasking and of the number of active projects in the entire
organization at a given point in time. Experience shows that, because of this practices,
more projects can be delivered in the same time period with the same resources on critical
tasks, even though inefficient in terms of the individual productivity of that resource,
makes it easier to compress schedule.
2.3.1.4. Schedule Control. Buffer Management is the primary schedule control mechanism,
for the overall project. In large projects, traditional methods still apply at the most detailed
level. Team members are not given due dates. Rather, they are asked to report the days
remaining on each task.
2.3.2. Project Cost Management
As a general principle, The Critical Chain Approach looks for the best impact on the
organization, taking into account throughput, operating expense and investment. Many
organizations have managers who are measured by the "efficient" use of their resources.
ritical Chain strategy, using other measures, promotes decisions that support what is best
for the project or the organization as a whole.
If it reduces the total project duration significantly, as benefits exceeds added cost,
this mighty imply individual resource inefficiency. As a result, Net Present Value of Cash
flow from critical chain Environment is significantly higher that multitasking environment.
2.3.2.1. Resource Planning. Resource Requirement quantities are considered in terms of
the three global parameters of Theory of Constraints, throughput, investment and operating
expense. The amount of labor resource in a critical chain plan is typically significantly
smaller than for a traditional plan to accomplish the same work. This is because the labor
consumed with bad multi-tasking and non-dedicated task times is removed.
I I I I I I
I I
I I I I I I I I I
63
2.3.2.2. Cost Budgeting. The cost baseline should include some calculated worth of the
project and Feeding Buffers. These buffers allow for uncertainty in task. estimates.
Generally, a project's promised delivery date is at the end of the Project Buffer. Therefore,
the value of these buffers, perhaps computed at some average running rate of the activities
the buffer is intended to protect, should be translated to allow a Cost Buffer as well. This is
equivalent to the traditional project cost reserves.
2.3.2.3. Cost Control. The Theory of Constraints suggests that a system approach is vital,
with respect to cost control and measuring performance to budget. Some cost tradeoffs
during a project are good, provided that the impact on the organization and/or customer's
goals is significant. The key is to get project managers to better understand the real cost of
a late delivery, to make project cost decisions with those figures in mind, and to keep key
decision makers informed so that there are no surprises.
Some organizations use cost as their number one criteria for decisions. In Critical
Chain, throughout is the number one priority, not cost control. It does not mean that costs
are not ignored. Rather, any cost accrued that d o not contribute to thoughput are considered a waste.
2.3.2.4. Conclusions. Many organizations today must achieve a major breakthrough in
project cycle time in order to stay competitive. They must drive more projects through their
organization to increase throughput. To make things more difficult, this often must not be
done without increasing the number of people allocated to projects.
Many organizations do not have the option of hiring additional people. In expanding
economic conditions, skilled resources are difficult to find. In tough economic times,
executives are reluctant to hire, even though the demands for new projects remains. Critical
chain is a new option that gives organizations the ability to increase the number of projects
that can be done by the same number of resources and to reduce the average durations of
projects. Critical Chain Approach enables organizations to confront the problems that may
exist both on systemic and individual project levels to achieve these benefits. Critical
Chain can be seen as a logical extension of current project management practices.
I I I I II
I, :11111111111~ -··
I I I I I I
II
II
64
2.3.3. Case Study Application
The Case Study is the application of Critical Chain Methodology to the project
schedules developed with Critical Path Methodology. The sample project is "A Feasibility
Study Project" for an industrial Plant. Resources are consultant engineers and engineers
· from subcontractors. The aim of this case study is the application and comparison of both
qiethodologies of the Critical Chain and Critical Path and identify the benefits and advantages of each of them.
In order to develop the Critical Path Method Schedule MS Project 98 [ 14] is used.
An add-on, Prochain [15] is used for Critical Chain Methodology. Prochain Project
Scheduling helps to implement critical chain scheduling based on the schedules prepared by MS Project.
A project schedule is the model of a set of tasks, resources and the linkages between
those tasks and resources, which together describe a project. The schedule can be as a
PERT schedule. The durations of tasks must be defined clearly. The allocation of resources
for tasks and dependencies of each task must be defined clearly. Resources needed for the
project should be identified. Resource plans should state what resources would be required
by the project, when they will be required according to the time schedule. Constraints on resources should be taken into account.
As seen in Figure A.1. in Appendix A, for sample project "Feasibility Study", the
original estimated task durations are given in Durations column of the schedule. The
durations are based on safe estimates which includes safety times.
Task dependencies are given the predecessor column and the resource dependencies
are given in the wording beside each activity represents the resource (usually a person or
group of people) necessary to complete the given task. Assume there is only one available
resource for each given resource. The schedules are prepared in Microsoft Project.
Prochain reads and manipulates this network in order to create a schedule based on the data in the project network.
I I I I I I
I I I
I I I I I I
65
In order to convert the Critical Path Schedule The primary step in the conversion is to
attempt to pull the safety out of each duration estimate and get at the median times for each
task ("B" times). In our examples, this is shown as half of the initial "C" estimate. This is
the rule of thumb that Goldratt recommends using.
The first step is to level the schedule as per the availability of resources and defining
the critical chain. The Prochain load leveling procedure tries to produce the best possible
· schedule, ignoring uncertainty. Uncertainty will be dealt with the buffers inserted. This
means that all resource contention is resolved and tasks are placed at their latest possible
starting points. Prochain's load leveling algorithm takes into account resource availability,
resource requirements and task dependencies.
The second step is for identifying the Critical Chain. Prochain will identify one
critical chain for each project endpoint, which is the deliverable.
The next step is to aggregate all of the safety at the end of the project where it can act
as an overall buffer for the entire project. The date one would commit to the customers or
to the senior manager. Project Buffers are created after each task with no successors;
Feeding Buffers are created for each link that joins a non-critical chain task to a critical
chain task. If there are more than one non-critical chain tasks feeding into a single critical
chain task, same chain task, same number of feeding buffers will be created. Resource
Buffers are created whenever a resource starts to work on critical chain tasks.
Since a resource buffer is assumed as a "wake-up" call, it will not be created if the
resource is assumed to be already "awake". The safety from the non-critical tasks branch
has also been consolidated into the feeding buffer.
This serves to immunize the critical path against negative variations of the feeding
path. In effect you are giving the feeding path its own safety so that if it runs into delays,
unless the entire feeder buffer is "eaten," the delays will not be passed on to the rest of the
schedule. When all the buffers are created Prochain gives us a chance to review and revise
the Buffers before inserting to the schedule.
-~--~ -~ ::11111111111111111111111111111111
I I I I I I
I I
I I I I I I I I
66
Once buffers of the correct sizes are created, they should be inserted into the network.
This is done by moving tasks as early as possible to make space for the buffers.
The last step is creating a Prochain Critical Schedule is to produce a Project signoff
sheet. This report provides information and warnings for the project. It enables others to
see the schedule was created and what the characteristics of the schedule are.
During the executing stage of the project, we can update task progress and buffer
usage, track actual and produce Project Task, Buffer and Resource reports.
In general with Critical Chain, one starts tasks as late as possible, which is a
departure from how Microsoft Project will automatically schedule a project (it will start all
tasks as early as possible). Because work is started later and generally worked on until it is
complete, this helps reduce work in progress (WIP). From a management point of view this
is beneficial because WIP is costly and can serve to bog workers down. This can also be a
difficult paradigm shift for a team to make. Feeder paths are started a defined amount
(feeder buffer) earlier than necessary as a risk reduction.
The next step is considered one of the most powerful aspects of Critical Chain.
Because of random number aggregation theory, the overall variance of the critical chain
will be much less than the addition of all the individual variances for each CC task. In other
words, the amount of protection necessary when we aggregate all of the tasks is much less
than if you added the protection originally built into each estimate. Dr. Goldratt
recommends to cut the buffer in half, leaving a buffer length of one half the length of the
CC. The same applies to feeding paths, so that a feeding buffer is optimally one half the
length of the feeding branch against which it is protecting. The results of the case study can be seen in Appendix A.
I
I I I I I I
67
3. RESULTS AND DISCUSSION
As we can see from the schedules prepared for different methodologies for the case
study in Appendix A. for the Feasibility Project, the total structure of the schedules are very
different for Critical Path Methodology and TOC-Critical Chain Methodology.
The main difference between Critical Path and Critical Chain is;
Critical Path is the sequence of interrelated tasks in a project that takes the longest
time to complete. The Critical Path defines the duration of the project and the project end date.
Critical Chain is the longest set of dependent activities, with explicit consideration
of resource availability, to achieve a project goal. The Critical Chain is not same as the
results we get from performing resource allocation on a Critical Path Schedule. The
Critical Chain defines an alternate path, which completes the project earlier by resolving resource contention up front.
The Critical Chain aggregates safety in strategic places in order to protect the project.
It requires stopping multi-tasking; any resource has to finish his/her specific task before
jumping to the next task. It allows us to stop the behavior of waiting resources by tying up them longer in a project than needed.
Resource Buffers allow a project team to remam aware of the Critical Chain.
Resource Buffers are a form of communication between the schedule keeper and the rest of
the team. The schedule keeper will get task updates from all resources currently working on
tasks as the schedule progresses. The resources merely need to report how many workdays
remain until they estimate their task is complete. When a predecessor Critical Chain
resource reports to have five days remaining, the schedule keeper informs the successor
they have approximately five days until they are on the Critical Chain.
I I I I I I
68
This is a dynamic countdown for the successor. If the predecessor reported two days
later that he or she hit a glitch and still had five days remaining, this would be passed on to
the successor.
This allows Critical Chain resources to plan their work schedules and keep other
project managers aware of their pending Critical Chain status.
I I I
The major distinction of Critical Chain Methodology is the way in which the
schedule is managed. Management controls the project by monitoring status of the buffers.
This allows them to highlight the tasks that need immediate attention. A typical project will
have numerous feeder buffers.
The most consumed feeder buffer is protecting the feeder path with the highest
probability of delaying the Critical Chain. Thus, management can focus attention on the
feeder paths with the most depleted buffers. Of course, the CC tasks by definition are
always considered crucial.
I I I I I I I
The main benefits of Critical Chain Scheduling are throughput oriented priorities for
tasks and resources; on-time projects, controlled scope and cost, significantly improved
project lead times and focus on continuous improvement.
By revising the target durations as an aggressive target duration schedule, along with
elimination of task due-dates, we can minimize impact of "Parkinson's Law."
Using buffers allow resources to focus on work without task due-date distraction and
efficiently protect against "Murphy's Law" with shorter project lead-times through
concentrated safety protecting what is crucial to project· success. Resource alerts and
effective prioritization of resource attention allow projects to take advantage of good luck
and early task finishes while buffers protect against bad luck and later than scheduled
finishes. Buffer Management provides focus for schedule management, avoids unnecessary
distraction, and allows recovery planning to take place when needed, but well before the project is in trouble.
I I I I I I
II I I
I I
69
The Critical Chain approach to single projects allows the multi-project environment
to avoid the lead-time multiplying effect of multi-tasking. In order to achieve the benefits
of Critical Chain Scheduling and Buffer Management, we must change the process how we
design the processes in project management like stopping spreading safety, hidden and
wasted in the tasks.
The Project Team must concentrate safety in strategic places that protect what is
important to the project from Murphy's Law. The Project Team must stop the behaviors
,that waste time in the project by avoiding task due-date focus and Parkinson's Law. The
Project Team must avoid resource multi-tasking which results in the lead-time
multiplication and focus on the task at hand. Management team must take responsibility for
protecting resources from competing priorities that drive multi-tasking. The Project Team
must account properly for resource contention. Project managers, when building project
schedules must realize resource dependency is as real as task dependency when
determining what is critical for the project.
The goal of Critical Chain (CC) is to help projects finish on time, within budget, and
without curtailing the objectives of the project (scope). The main points of Critical Chain
are:
• Throughput oriented priorities for tasks and resources.
• It is a cultural change in how to manage projects and evaluate team members.
• A void multi-tasking, especially while on the Critical Chain.
• Protect against inherent uncertainty by aggregating all safety time at the end of the
project rather than building it into individual task estimates.
• Concentrate on the constraint of the project: the longest chain of dependent tasks or
resources ( dependency can either be the standard CPM finish-start dependencies or
resource dependencies).
• Most importantly focused continuous improvement.
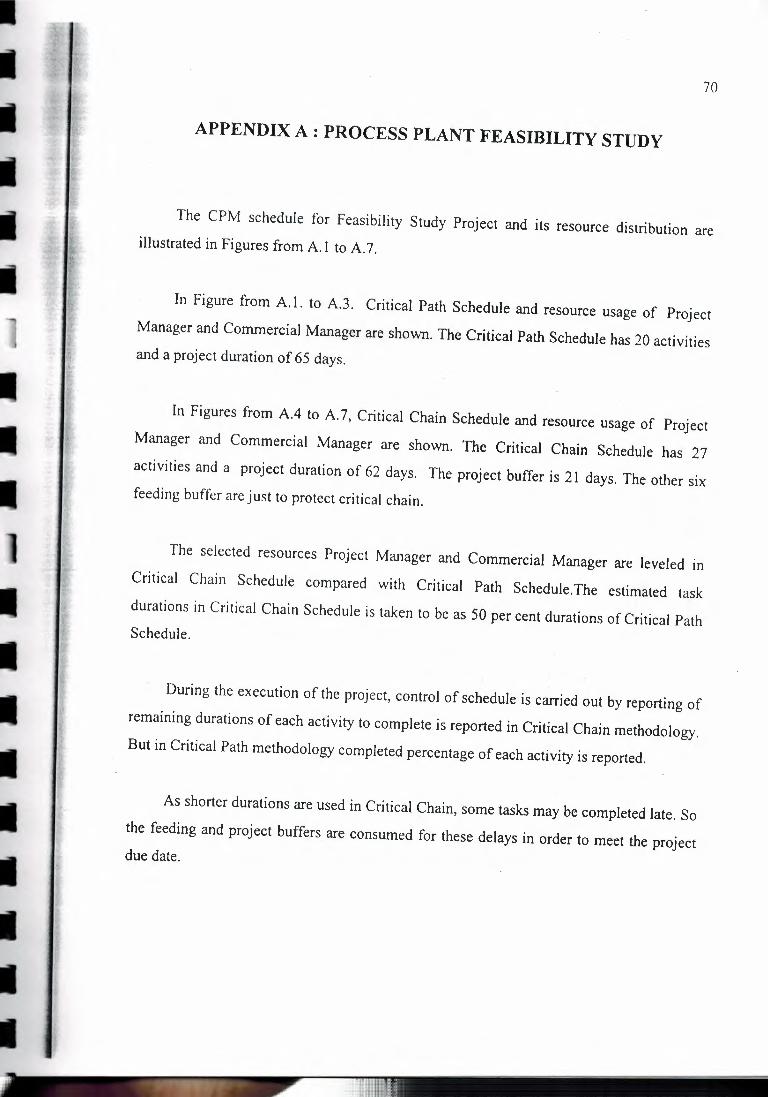
I I I II I I
I
I I I I I I I I
70
APPENDIX A : PROCESS PLANT FEASIBILITY STUDY
The CPM schedule for Feasibility Study Project and its resource distribution are illustrated in Figures from A. l to A. 7.
In Figure from A. l. to A.3. Critical Path Schedule and resource usage of Project
Manager and Commercial Manager are shown. The Critical Path Schedule has 20 activities and a project duration of 65 days.
In Figures from A.4 to A. 7, Critical Chain Schedule and resource usage of Project
Manager and Commercial Manager are shown. The Critical Chain Schedule has 27
activities and a project duration of 62 days. The project buffer is 21 days. The other six feeding buffer are just to protect critical chain.
The selected resources Project Manager and Commercial Manager are leveled in
Critical Chain Schedule compared with Critical Path Schedule.The estimated task
durations in Critical Chain Schedule is taken to be as 50 per cent durations of Critical Path Schedule.
During the execution of the project, control of schedule is carried out by reporting of
remaining durations of each activity to complete is reported in Critical Chain methodology.
But in Critical Path methodology completed percentage of each activity is reported.
As shorter durations are used in Critical Chain, some tasks may be completed late. So
the feeding and project buffers are consumed for these delays in order to meet the project due date.
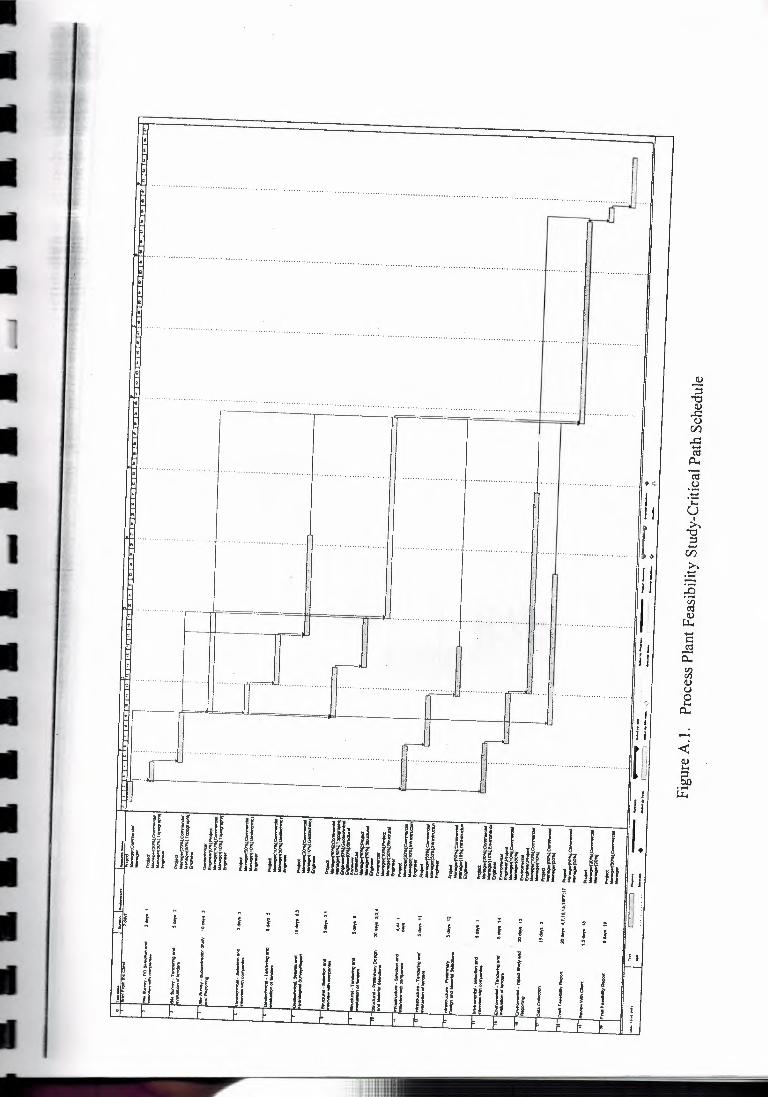
I I I I I I
I I I
I I I I I I
-- --------···· - -- --- -- ..... --------- --------------------------------------------------·····--·- n ··········· 11 . .. ·-·- il
--·-··--!
~ :, '"8 ..c: C) if.) ..c: .•...
1-l I ~ : ~ ~- ------------------------I·------ •·········•· . I . • ----- .. - ····-···· ---------- -------- ······· ·~ -~
l ·E 1 J y
>-. _ ..... L l .........................• .. .
~ f I l I
1 r ', Kl u /1 J --- - Jf J/ .. . // I: -------- ..., __
----~
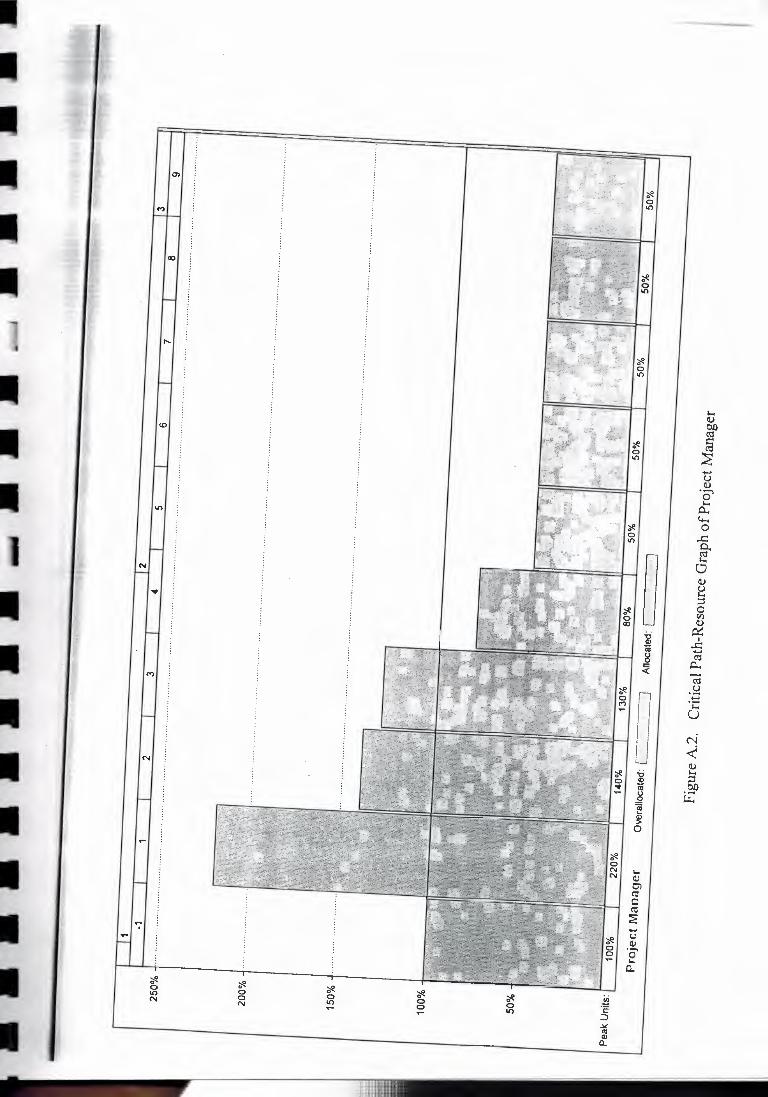
u,
-···· .11111111111111111111111111111111111
II
II
II II II I I I I I I
I I I I I
• ••
I ·ltf I n I r:'"~_:.~;:JLQH I ~ ~
I I .,_.,· I 11 I r;i..ci,!i·- ··_ ~.,"~"':& ::111 I i ·~ :~:ii~~~ ] '-
• .11- ~ / /.,,/ I f;Js!•1:~111 I I I >>< L-, ··""'• · fr,~".s.d'Es~ .n r=, U c..... 0 ..c: §'
NI I I I :;i<•·,-s:~~,r-1 lkl'I I Q
• l i\T 11·1 / f-77:-ej~/ li I ~ , ~·~· b··-,,~• g g g ' ,,-~; :'-"' ,. 7'.7,:_-..:,£_.?.,.::- - 00
(I) i:::z::
I Jt:t I LI I 11 1 ~
• it li:II :-g l ~ u ~ t it\ cii M
I ,j: N ,g ~ "' "' if, } ~
bl)
I .J:/ I I I ····-··- .. -- -·-·-· I :;; 0: C)
"' I ·11 I H ~ ' . .~
o ... I ll bJ~/ 11
0 (.) 'll I j j i r:=~~-,,,-~--~:~.-:: --··::cec;· -~-- ·f I
I i. ~ ~ ::11 o ,t o O o ~ ~ en , ;: ~ 0 ~ g O :g
N T- ._ ti') ::,
I l: 1 \.la
- 11111111111111111111111111111111111!
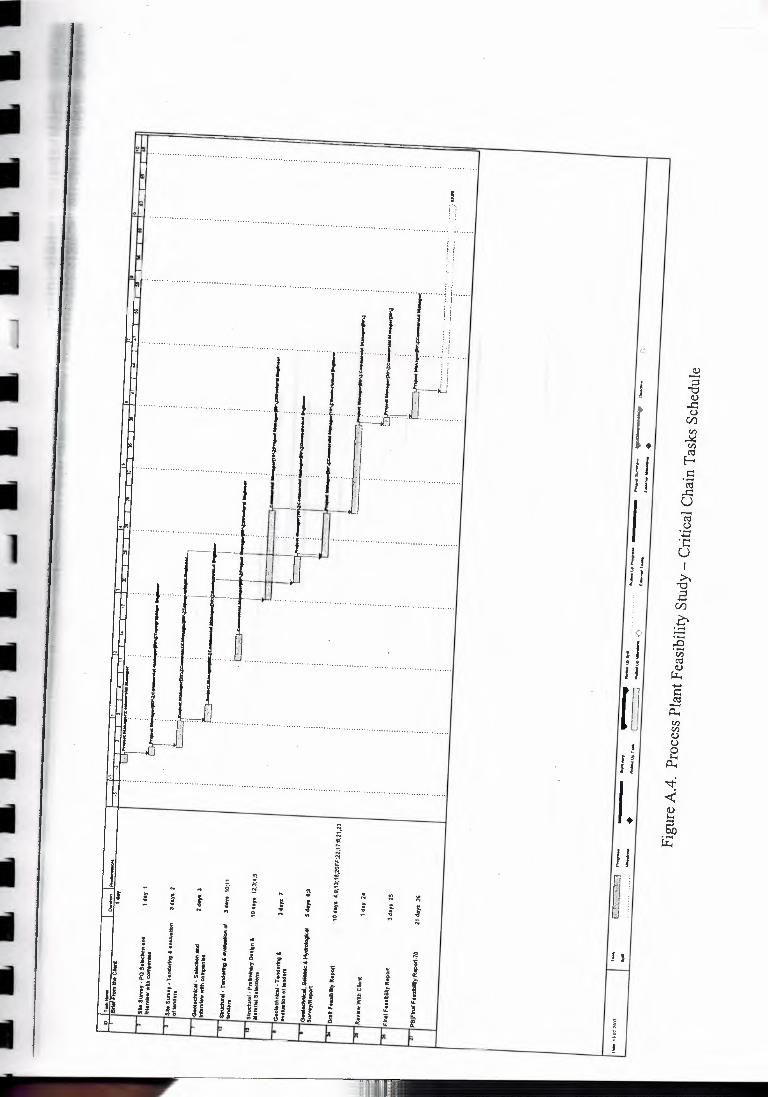
I Ill Ill Ill II II
I I I
I I I I I I I I I
...............................•........
·· ·· ······································· t f f I/ I 1·1·········' i ! i
····· 1' J' t" 1li······ 1·r· n ..... L................ :l J ······ ·' I t=l-=' ..
············ .. I I ··········· ·····•· ····J·····n1····· . .
................................. ,
· l J-1--J-], f
'1 . t l 1 ······ ·~·· ·················· ······· ················ .
··l r 'j !
Ii
I. t - " ~ ~ ~ ~ lll ! f J:. f -e ! - ~ ~ N ~
" ,,
i ' .• f l .. i f H .. .. l ..
! .i l i f; 1 It: u 8 ".' 8
,!! f z • .. fl i i ~Ii .. r: 1 ,! I J • i H h ;; jB { f
.I ! ! : u • .. Jf .Ji u ]
.. f
.. 0 o-
JI
I . ~
L II J 1
I J f Ji
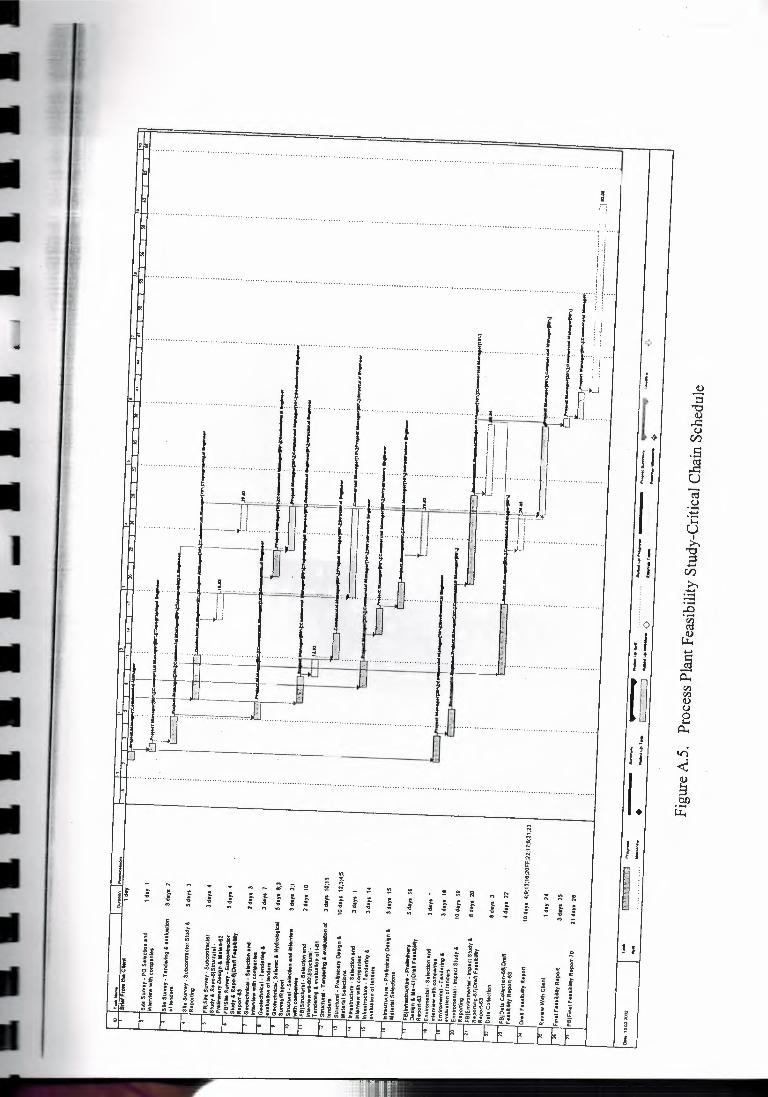
I
I I II I
I I I
I I I I I
c:-,
J (!)
L "3 "O (!) ..c: u Cl)
II .s .2 11 u
I tii -~ .t:;! i.... u J I
>. "O
! a ;:s l J .•...
Cl) >. .•... :.::: :.0
0 "ij d (!)
~ .•... ' ' j I J n 0.. <I) <I) (!) u 8 0..
~ f ' 1£) • l <C
I. (!)
~ OJ) ·- ~
JI
I ! I
................................. . ....•••.....................................•........ ··················•············
------- -----, .. ~ J······ 7 ' -- 1 ······-·----·-- ·--' f ! I , i
J
. I --------- ·---- , I I ; ' 1 I 1 ··- · I 1• i I L.
---··--· J ··-·---------····--1 J .. f .. - ..... f __ -. l __ .. ,J .. /r'~i - ·---- 1=!B - I I I ----··· ---··--------- --· 1--- .
' c1-r-a" )J.'l Hri,J I i ··- J1n····· + -- L J LI q :_JJ i t H-
I .:~r--·1-f IJJ - I -;-· _L_
)i ' -1- f [j I - . I iil - ·------· . .!iL .. ·- - ' " ....................
Ji··············
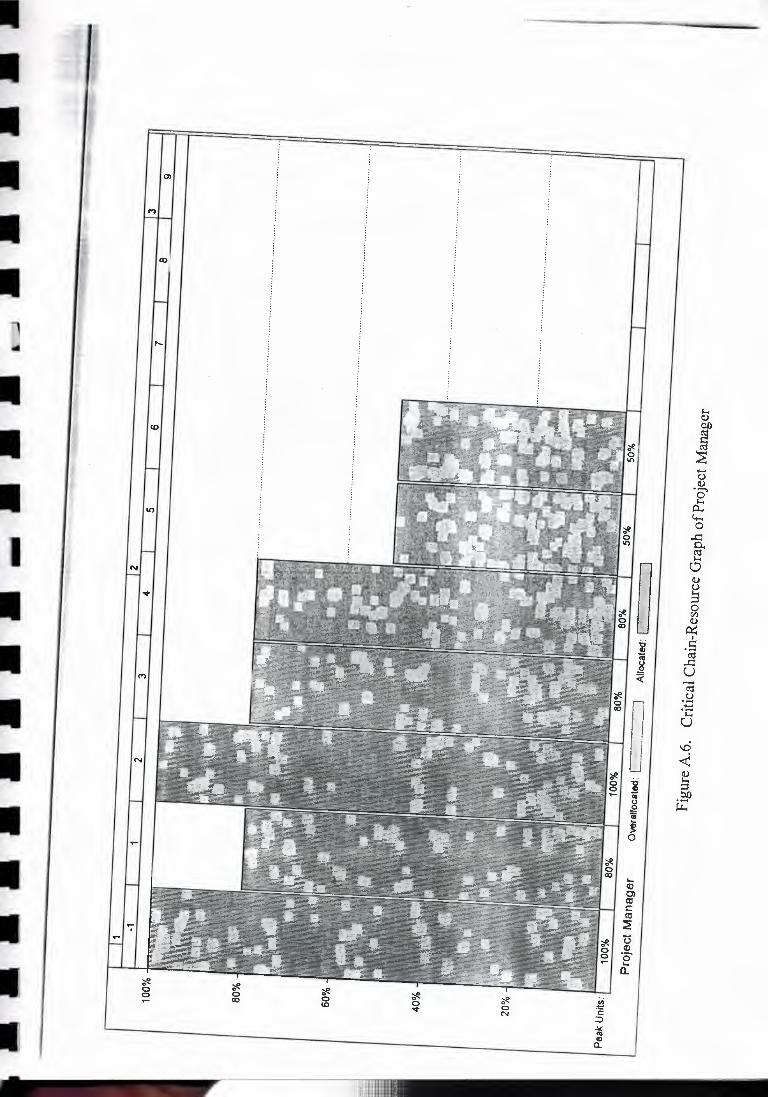
II II I I I I
II
I I I II
• I
• • • I I
M
ao
co
M
'* 0 ao '* s '* 0 N
-~ C => -" "' Q) a.
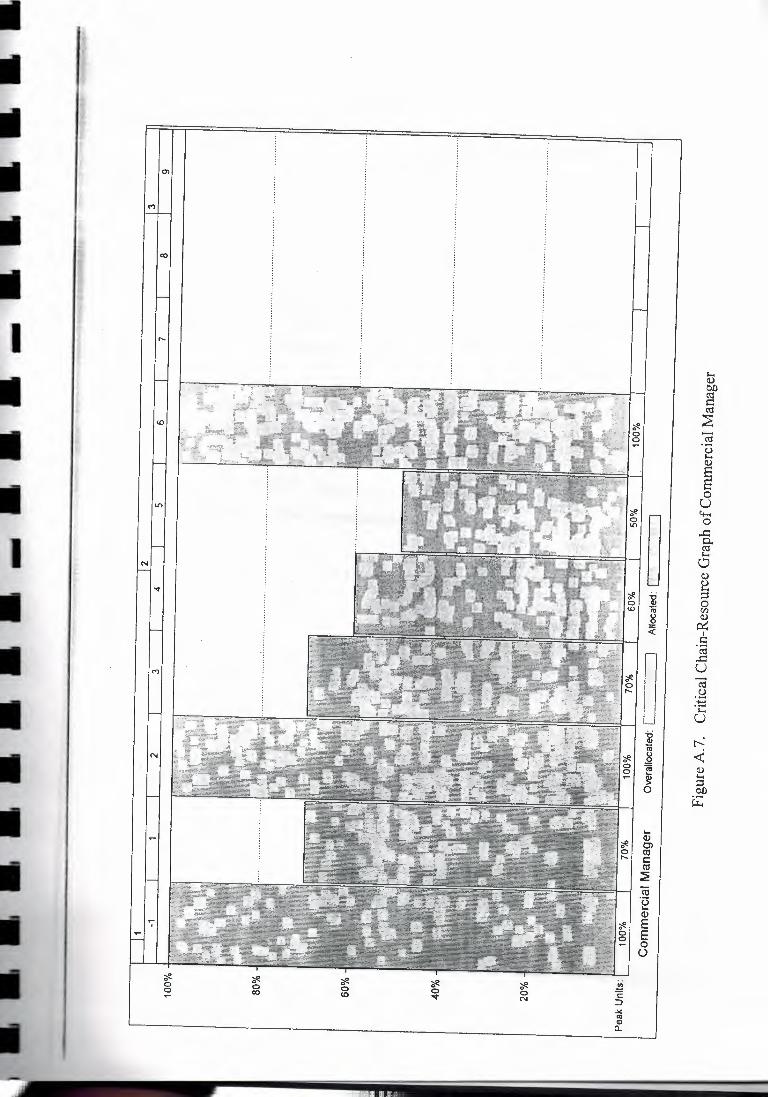
• • • • • 1
• • I I I I I I I
M
I-; <1)
~ c:: ('j
~ ~ ·c:; I-; <1)
§ 0 u 4-. 0
..c:: §- I-; 0 <1)
-g ~ 0 iv Cl)
~ <1) ~ < I .s (1j
u ..c:: u ~ -~ .•.... ·c u
-g r-. iv
<!'. ~ "iii <1) ~ :3 0 bl)
~ I •...
Q.) Ol ca C: ca :E cii ·~ Q.)
E E 0 (.)
r-oc,,,;s,;cc: __ - ,'o---- ,sfcf":,::i,_;;_ ~ - -~-~-----r_,.;,.:.>:--,;-_f,'; ____ ,. ___ I;_:,';~_-",~;;;,;,,/_~~,'-----<---·--'. :bl I ~ *- *- ~ 0 0 0 0 0 0 co (0 ""' ..J ~
..IC
"' Cl) Q.
I I I I I
-
78
REFERENCES
I. PMI, " A guide to Project Management Body of Knowledge " , Electronic Imaging Services, Illinois, 2000.
2. IPMA, "International Project Management Association Competence Baseline" IPMA, The Netherland, 1999.
3. Clark, D. F. and A. B. Lorenzini, "Applied Cost Engineering " , Marcel Decker Inc, NY, 1987.
4. Levine, A. H., "Estimating Task Durations" , Sci tor Corporation, CA, 200 I,
http://www.scitor.com/resources/White _Papers/Estimating_ Task_ Durations.htm.
5. Goldratt, E. M. and J. Cox, "The Goal",: Second Revised edition, Croton-on - Hudson, NY, North River Press, 1992.
6. Sytsma, S., "The Theory of Constraints : Making Process Decisions Under
Conditions of Limited Resources, Capacities" , Ferris State University TOC Lecture Notes, 2001, http://www.sytsma.com.
7. Sytsma, S., "The Theory of Constraints : Philosophy and Applicatiocns" , Ferris State University TOC Lecture Notes, 2001, http://www.sytsma.com.
8. Rand, K. G:, " Critical Chain : the theory of constraints applied to Project
Management " , International Journal of Project Management, 2000, Vol.I 8, pp. 173-177, Elsevier, Amsterdam, 2000.
9. Rizzo, T., " TOC Overview- Theory of Constraints", TOC Review, Premier Issue, pp. 12-14.
I I I I I I
-
14.
15.
79
10. Goldratt, E. M., "The Theory of Constraints", Croton-on-Hudson, N.Y.: North River Press, 1990.
11. Scitor, "Critical Chain Concepts", Scitor Corporation Inc., http://www.scitor.com.
12. Cook, S. C., "Appliying Critical Chain to improve the management of
uncertaininty in Projects", Master of Business Administration and Master of
Science in Electrical and Computer Science, Massachusetss Institude of Technology, June 1998.
13. Kendall, G. I., G. Pitagorsky and D. Hulett, " Integrating Critical Chain and the
PMBOK Guide" International Institude For Leaming, http://www.ill.com.
Microsoft, "Microsoft Project 98 ", Microsoft Corporation Inc., 1998, http://www.microsoft.com.
Prochain, "Prochain addon for Microsoft Project", Prochain Corporation Inc., 200 I, http://www.prochain.com.
iii!iH
I I ]
I I I I
80
REFERENCES NOT CITED
Drucker, F. P., "The New Realities", Harper & Row, NY, 1999.
Halpin, W. D. , "Financial and Cost Concepts for Construction Management" , John Wiley and Sons Inc., NY, 1985.
Hollman, J. and R. W. Querns, " The Total Cost Management Framework", Cost Engineering, Vol.43, No. 3, March 2001, pp. 13-19.
Hutchins, T.," TOC and Critical Chain Management Seminar Notes", iTU, 17 October 2001.
Houle, D., " Introduction to the Theory of Constraints " , General Partner of the
Avraham Y. Goldratt Institute, the Jonah Upgrade WorkshopffOC Symposium, London, UK, May 1998.
Ibbs, C. W., "Project Control Methods and Their Application to international Projects", Seminar Notes, Bogazic: University, istanbul, September 1995.
Lynch, B., "Benefits of Critical Chain Project Management", Prochain Solutions Inc., 1998, http://www.prochain.com.
Newbold, R. and W. Lynch, "Critical Chain : Critical Success Factor", Presentation in APICS Constraint Management SIG, Phoenix, AZ, March 1999.
Newbold, R., "Introduction to Critical Chain Project Management", Prochain Solutions Inc., 2001, http://www.prochain.com.
Newbold, R., "Project Management in the Fast Lane, Applying the Theory of Constraints", St. Lucie Press, NY, 1998.
TI!mflllmllllllllllllllllll--------------------
81
Parkinson, C.N., '' Parkinson's Law" The Riverside Press, Cambridge, 1957.
Patrick, S. F., "Critical Chain and Risk ManagementProtecting Project Value", Focused Performance, Hillsborough, NJ, USA.
Patrick, F. S, "Getting Out From Between Parkinson's Rock and Murphy's hard Place", - PMI, PM Network, April 1999, pp. 57-62.
Standish Group, "Fundemental of Project Management Tools", West Yarmaunt MA
02673, 2001.
Steyn, H., "An investigation into the fundementals of critical chain project scheduling",
International Journal of Project Management Vol.I 9, pp. 363-369, Elsevier,
Amsterdam, 2000.