Embed Size (px)
Citation preview

En vue de l'obtention du
DOCTORAT DE L'UNIVERSITÉ DE TOULOUSEDélivré par :
Institut National Polytechnique de Toulouse (INP Toulouse)Discipline ou spécialité :
Génie des Procédés et de l'Environnement
Présentée et soutenue par :M. SANDYANTO ADITYOSULINDRO
le vendredi 7 avril 2017
Titre :
Unité de recherche :
Ecole doctorale :
Activation of homogeneous and heterogeneous Fenton processes byultrasound and ultraviolet/visible irradiations for the removal of ibuprofen in
water
Mécanique, Energétique, Génie civil, Procédés (MEGeP)
Laboratoire de Génie Chimique (L.G.C.)Directeur(s) de Thèse :MME CARINE JULCOURMME LAURIE BARTHE
Rapporteurs :M. FRANK ERICH STUBER, UNIVERSITAT ROVIRA I VIRGILI TARRAGONA
M. STEPHANE BAUP, UNIVERSITE GRENOBLE ALPES
Membre(s) du jury :1 M. FRANK ERICH STUBER, UNIVERSITAT ROVIRA I VIRGILI TARRAGONA, Président2 M. DOMINIQUE WOLBERT, ECOLE NATIONALE SUP DE CHIMIE DE RENNES, Membre2 M. HENRI DELMAS, INP TOULOUSE, Membre2 Mme CARINE JULCOUR, INP TOULOUSE, Membre2 Mme LAURIE BARTHE, INP TOULOUSE, Membre

1
Author: Sandyanto ADITYOSULINDRO Director of thesis: Dr. Carine JULCOUR-LEBIGUE and Dr. Laurie BARTHE
Title:
Activation of homogeneous and heterogeneous Fenton processes by ultrasound and
ultraviolet/visible irradiations for the removal of ibuprofen in water
Abstract:
Due to booming consumption and only partial removal by conventional water treatment
processes, ibuprofen, a non-steroidal anti-inflammatory drug, has been detected in water
resources, raising increasing concerns for possible environmental and health impact. On the
other hand, advanced oxidation processes (AOPs), among which Fenton reaction, have shown
successful results for removal of various organic compounds. Traditionally based on the use
of hydrogen peroxide and ferrous ions in solution, large-scale application of this AOP is still
limited by narrow pH window (2 to 4) and uneasy recovery of iron catalyst.
This work investigated Fenton-based oxidation of ibuprofen, and reaction activation by
ultrasound (US) irradiation and ultraviolet/visible light (UV/Vis) so as to lower the required
concentration of dissolved iron catalyst or improve the activity of heterogeneous counterparts.
To that purpose, the efficacy of individual homogeneous AOPs (sonolysis, photolysis,
ultrasound/H2O2, light/H2O2, Fenton oxidation) was evaluated first, varying operating
parameters such as light wavelength and ultrasound frequency. Then, their two-by-two and
overall combinations (sonophotolysis, sono-Fenton, photo-Fenton and sono-photo-Fenton
oxidation) were examined with emphasis on the identification of synergistic effects. In
particular, combined US/Fenton and Vis/Fenton oxidation were found more effective than the
sum of individual processes due to sono- and photo-regeneration of ferrous ions. These results
also served as a reference for the assessment of heterogeneous systems. Among tested solids,
iron-containing zeolite (Fe-ZSM5 type) was shown to be a promising catalyst for peroxide
oxidation of ibuprofen due to high efficiency at natural pH and low iron leaching. However,
in this case, no more than additive effects was observed between ultrasound/light irradiation
and heterogeneous Fenton oxidation. Beside pollutant and Total Organic Carbon conversion,
main degradation products were monitored for different processes and some plausible
degradation pathways were proposed. Water matrix impact was also addressed using
wastewater plant effluent, which resulted into hindered performance of all oxidation processes
either due to alkaline buffer or light attenuation effect.
Keywords: Water treatment, Advanced oxidation processes, Pharmaceuticals, Water matrix

2
This page is intentionally left blank
3
Auteur: Sandyanto ADITYOSULINDRO
Directrice de thèse: Dr. Carine JULCOUR-LEBIGUE et Dr. Laurie BARTHE
Titre:
Activation du procédé Fenton (homogène et hétérogène) par irradiation ultrasonore et
rayonnement ultraviolet/visible pour l'élimination de l'ibuprofène dans l'eau
Résumé :
Du fait de sa consommation en plein essor et d’une élimination partielle par les
procédés conventionnels de traitement des eaux, l'ibuprofène, un médicament anti-
inflammatoire non stéroïdien, a été détecté dans les ressources en eau, suscitant de plus en
plus d'inquiétude quant à son impact possible sur l'environnement et la santé. Par ailleurs, les
procédés d'oxydation avancée (POA), parmi lesquels la réaction Fenton, ont montré
d’excellents résultats pour l'élimination de divers composés organiques. Traditionnellement
basé sur l'utilisation du peroxyde d'hydrogène et des ions ferreux en solution, l'application à
grande échelle de ce POA est encore limitée par une fenêtre de pH étroite (2 à 4) et une
récupération difficile du catalyseur à base de fer.
Ce travail a étudié l'oxydation Fenton de l'ibuprofène et l'activation de la réaction par
irradiation ultrasonore (US) et rayonnement ultraviolet/visible (UV/Vis) et de manière à
abaisser la concentration de fer dissous ou à améliorer l'activité de catalyseurs hétérogènes.
A cet effet, on a d'abord évalué l'efficacité des POA individuels homogènes (sonolyse,
photolyse, sono- et photo-oxydation avec H2O2, oxydation Fenton), en fonction de paramètres
opératoires tels que la longueur d'onde lumineuse et la fréquence ultrasonore. Ensuite, on a
examiné leurs combinaisons deux-par-deux et globale (sonophotolyse, oxydation sono-,
photo- et sono-photo-Fenton) en mettant l'accent sur l'identification d'effets synergiques. En
particulier, les oxydations US/Fenton et Vis/Fenton se sont révélées plus efficaces que la
somme des procédés individuels grâce à la sono- et photo-régénération des ions ferreux. Ces
résultats ont également servi de référence pour l'évaluation des systèmes hétérogènes. Parmi
les solides testés, on a montré qu’une zéolite dopée au fer (de type Fe/ZSM5) était un
catalyseur prometteur pour l'oxydation de l'ibuprofène par le peroxyde, en raison d'une
efficacité élevée à pH naturel et d’une faible lixiviation du fer. Cependant, dans ce cas, on n’a
observé au mieux qu'une addition d’effets des ultrasons ou de la lumière et de l'oxydation
Fenton hétérogène. Outre la conversion du polluant et du carbone organique total (COT), la
formation des principaux produits de dégradation a été suivie pour différents procédés et des
voies possibles de dégradation ont été proposées. L’effet matrice a également été examiné en
utilisant un effluent de station, qui a eu pour conséquence de réduire la performance de tous
les procédés d'oxydation, en raison d'un pH tampon alcalin ou de l’atténuation de la lumière.
Mots-clés: Traitement d’eau, Procédés d'oxydation avancée, Médicaments, Effets matrice

4
This page is intentionally left blank

5
ACKNOWLEDGEMENT
This work was conducted at Laboratoire de Génie Chimique (LGC), INP-ENSIACET in
Toulouse. Take a look behind the scenes, there are many people contributing in this
successful work. First, I would like to express my sincere gratitude to my supervisors, Dr.
Carine JULCOUR-LEBIGUE, and Dr. Laurie BARTHE for all the guidance, knowledge,
patience and countless supports during my doctorate.
My deep gratitude also goes to the members of the jury: Prof. Frank STÜBER, Dr. Stéphane
BAUP, Prof. Dominique WOLBERT and Prof. Henri DELMAS for spending your precious
time reading my manuscript and also for the valuable advices and suggestions. Go back to
2013, a special word of gratitude must go to Prof. Henri DELMAS who was proposing an
interesting research subject and supporting me to get the scholarship for my doctoral study.
A scholarship provided by Ministry of Research, Technology and Higher Education of the
Republic of Indonesia is gratefully acknowledged. I also express my gratitude to Prof. Irwan
KATILI, Prof. Djoko HARTONO, Prof. Widjojo PRAKOSO and Dr. Setyo MOERSIDIK
from Civil Engineering Department Universitas Indonesia for their supports on the candidacy
and extension of my scholarship. The financial supports from French National Agency for
Research and Campus France are also acknowledged.
I would like to appreciate the contribution of Prof. Ulises Javier JAUREGUI-HAZA, Katia
GONZALEZ-LABRADA and Michel MANDUCA-ARTILES from InSTEC Cuba in this
work. My appreciation also extends to David RIBOUL, Marie-line DE SOLAN
BETHMALE, Marie-line PERN, Gwenaëlle GUITTIER, Christine REY-ROUCH, Jean-louis
LABAT, Ignazio COGHE, Jean-Pierre ESCAFIT, Vincent LOISEL, Alain PHILIP, Daniele
BOUSCARY and Claudine LORENZON from LGC Toulouse for their analytical, technical
and administrative support.
I would like to thank my colleagues: German, Imane, Sylvie, Leticia, Pei San, Lindy, Freddy,
Pedro, Filipa, Séda, Rihab, Vincent, Benjamin, Bi, Sebastien, Sebastien, Jaouher, Sid Ahmed,
Isabelle, Usman and all doctoral students for their help and encouragement during my stay at
LGC. I thank Bpk. Robert and Ibu Septi from Consulate General of Indonesia in Marseille for
their help during my stay in France. I also appreciate the kindness and supports from my

6
Indonesian friends in France: Bastian, Aziz, Mba Winda, Mas Deni, Mas Yoga, Mba Munky,
Mas Harris, Mas Pai, Pak Aloysius, Bu Natalia, Bu Nelly, Bang Yusrizal, Fito, Amie, ….
Last but not least my sincere gratitude goes to my wife and my parents, thanks to their infinite
moral and spiritual supports I can successfully pass one of the most exceptional and
challenging period in my life: doing a doctoral study and becoming a “Papa” of a baby boy in
a foreign country at the age of 27.
Thank you / Merci / Gracias / Obrigado / Danke / ُْك ً ار / 谢谢 / Terima kasih / Matur nuwun

7
"Gantungkan cita-cita mu setinggi langit, bermimpilah setinggi langit.
Jika engkau jatuh, engkau akan jatuh di antara bintang-bintang."
(“Aim the sky as your goal, dream as high as the sky.
Even if you fall, you will fall among the stars”)
Soekarno (first President of Republic of Indonesia)

8
This page is intentionally left blank

9
TABLE OF CONTENTS
Abstract………………………………………………………………………………….……1
Résumé…………………………………………………………………………….…...…….3
Acknowledgement …………………………………………………………….……………..5
INTRODUCTION……………………………………………………………….……….….15
CHAPTER 1 LITERATURE REVIEW……………………………………………………..19
1.1. CONTAMINATION OF AQUATIC ENVIRONMENTS BY
PHARMACEUTICAL COMPOUNDS............................................................................... 21
1.1.1. Removal of pharmaceuticals by conventional treatment processes ................... 21
1.1.2. Sources and environmental fate ......................................................................... 23
1.1.3. Possible adverse effect ....................................................................................... 24
1.2. ADVANCED OXIDATION PROCESSES .............................................................. 25
1.2.1. Principle ............................................................................................................. 25
1.2.2. Ibuprofen removal by AOPs .............................................................................. 27
1.2.3. Transformation products of ibuprofen ............................................................... 29
1.3. FENTON REACTION .............................................................................................. 31
1.3.1. Principle and mechanism ................................................................................... 31
1.3.1.1. Homogeneous system ................................................................................. 31
1.3.1.2. Heterogeneous system ................................................................................ 34
1.3.2. Review of recent studies on Fenton oxidation ................................................... 37
1.4. SONOLYSIS AND SONO-FENTON PROCESSES ............................................... 40
1.4.1. Principle and mechanisms.................................................................................. 40
1.4.1.1. Ultrasound process ..................................................................................... 40
1.4.1.2. Activation of Fenton reaction by ultrasound .............................................. 42
1.4.2. Review of recent studies .................................................................................... 44
1.5. PHOTOLYSIS AND PHOTO-FENTON PROCESSES .......................................... 46
1.5.1. Principle and mechanisms.................................................................................. 46
1.5.1.1. Photo-degradation ....................................................................................... 46

10
1.5.1.2. Activation of Fenton reaction by (UV/Vis) light ........................................ 48
1.5.2. Review of recent studies .................................................................................... 50
1.6. SONO-PHOTO-FENTON PROCESSES ................................................................. 52
1.6.1. Principle and mechanisms.................................................................................. 52
1.6.2. Review of recent studies .................................................................................... 54
1.7. EFFECT OF OPERATING PARAMETERS .......................................................... 56
1.7.1. Hydrogen peroxide concentration ...................................................................... 56
1.7.2. Effect of iron catalyst concentration .................................................................. 57
1.7.3. Effect of temperature ......................................................................................... 57
1.7.4. Effect of pH........................................................................................................ 58
1.7.5. Effect of initial concentration of pollutant ......................................................... 59
1.7.6. Effect of dissolved gas ....................................................................................... 59
1.7.7. Effect of ultrasound power and frequency ......................................................... 60
1.7.8. Effect of lamp type (wavelength) and power ..................................................... 61
1.8. CONCLUSION ......................................................................................................... 62
CHAPTER 2 METHODS AND MATERIALS……….……………………………....……63
2.1. ANALYTICAL METHODS .................................................................................... ..66
2.1.1. Analysis of liquid phase ..................................................................................... 66
2.1.1.1. Quantification of ibuprofen by HPLC/UV ................................................. 66
2.1.1.2. Analysis of reaction intermediates by HPLC/MS ...................................... 67
2.1.1.3. Analysis of Total Organic Carbon (TOC) .................................................. 69
2.1.1.4. Analysis of (residual) hydrogen peroxide by spectrophotometry .............. 71
2.1.1.5. Analysis of total dissolved iron by ICP-AES ............................................. 71
2.1.2. Analysis of solid phase (heterogeneous catalyst) .............................................. 72
2.1.2.1. Laser diffraction ......................................................................................... 72
2.1.2.2. SEM and EDX Spectroscopy ..................................................................... 73
2.1.2.3. X-ray diffraction ......................................................................................... 74

11
2.1.2.4. Gas porosimetry .......................................................................................... 76
2.1.2.5. CO chemisorption ....................................................................................... 76
2.1.2.6. Identification of the pH at the point of zero charge .................................... 77
2.1.2.7. Carbon trace analysis .................................................................................. 77
2.2. CHEMICALS AND CATALYSTS .......................................................................... 78
2.2.1. Ibuprofen ............................................................................................................ 78
2.2.2. Hydrogen peroxide............................................................................................. 80
2.2.3. Soluble catalysts................................................................................................. 81
2.2.4. Heterogeneous catalysts ..................................................................................... 82
2.2.4.1. Iron containing zeolite (Fe-MFI) ................................................................ 82
2.2.4.2. Zero-valent iron (ZVI) ................................................................................ 85
2.3. EXPERIMENTAL SETUP ....................................................................................... 88
2.3.1. Sono-reactor ....................................................................................................... 88
2.3.2. Photo-reactor ...................................................................................................... 91
2.4. EXPERIMENTAL PROCEDURE ........................................................................... 95
2.4.1. Homogeneous processes .................................................................................... 95
2.4.2. Heterogeneous processes ................................................................................... 95
2.4.3. Sample preparation for HPLC/UV and TOC analysis ....................................... 96
2.4.4. Experimental data analysis ................................................................................ 97
2.5. CONCLUSION ......................................................................................................... 97
CHAPTER 3 HOMOGENEOUS PROCESSES………….……………………..………….99
3.1. IBUPROFEN REMOVAL BY SINGLE PROCESSES ......................................... 101
3.1.1. Preliminary considerations: reference conditions of the study ........................ 101
3.1.2. Ultrasound irradiation ...................................................................................... 102
3.1.2.1. IBP degradation by ultrasound and its mechanisms ................................. 102
3.1.2.2. pH effect ................................................................................................... 104
3.1.2.3. Effect of ultrasound density ...................................................................... 105

12
3.1.2.4. Effect of sonication frequency .................................................................... 98
3.1.2.5. Effect of H2O2 addition on 20 kHz sonolysis ........................................... 109
3.1.3. Light irradiation (UV, Vis and UV-Vis) .......................................................... 111
3.1.3.1. IBP degradation under monochromatic UV light (254 nm) irradiation and
its mechanisms ........................................................................................................... 111
3.1.3.2. pH effect ................................................................................................... 114
3.1.3.3. Effect of irradiated volume fraction ......................................................... 115
3.1.3.4. Effect of lamp type (irradiation spectrum) ............................................... 116
3.1.3.5. Effect of H2O2 addition ............................................................................. 117
3.1.4. Fenton oxidation .............................................................................................. 121
3.2. IBUPROFEN REMOVAL BY COMBINED PROCESSES .................................. 125
3.2.1. Sonophotolysis and sonophoto-oxidation with H2O2 ...................................... 125
3.2.2. Sono-Fenton oxidation ..................................................................................... 128
3.2.2.1. Effect of Fenton’s reagent concentration on sonolysis (20 kHz) ............. 128
3.2.2.2. Effect of ultrasound density ...................................................................... 131
3.2.2.3. Effect of sonication frequency .................................................................. 133
3.2.3. Photo-Fenton oxidation .................................................................................... 135
3.2.3.1. Effect of lamp type on photo-Fenton oxidation........................................ 136
3.2.3.2. Effect of Fenton’s reagent concentration (Xe lamp) ................................ 138
3.2.4. Sono-Photo-Fenton oxidation (20 kHz US / Xe lamp) .................................... 139
3.3. EVALUATION OF TRANSFORMATION PRODUCTS .................................... 145
3.3.1. Identified intermediates and general IBP degradation scheme ........................ 145
3.3.2. Comparison of different homogeneous processes ........................................... 148
3.3.3. Evolution of selected intermediates during homogeneous processes .............. 151
3.4. EFFECT OF WATER MATRIX ............................................................................ 155
3.5. CONCLUSIONS ..................................................................................................... 160
CHAPTER 4 HETEROGENEOUS PROCESSES...……………………………….………161

13
4.1. PRE-SELECTION OF THE HETEROGENEOUS CATALYST .......................... 163
4.1.1. Adsorption of ibuprofen over Fe-MFI and ZVI catalysts ................................ 163
4.1.2. Fenton oxidation of ibuprofen over Fe-MFI and ZVI catalysts ....................... 165
4.1.3. Evaluation of Fe-MFI and ZVI catalysts after reaction ................................... 167
4.1.4. Mechanisms of Fenton reaction over investigated catalysts ............................ 170
4.2. PARAMETRIC STUDY ......................................................................................... 173
4.2.1. Effect of solid catalyst concentration ............................................................... 173
4.2.2. Effect of H2O2 concentration ........................................................................... 175
4.2.3. Effect of H2O2 / Fe molar ratio ........................................................................ 177
4.2.4. Effect of temperature ....................................................................................... 179
4.2.5. pH effect........................................................................................................... 181
4.2.6. Activity of leached iron ................................................................................... 184
4.3. HETEROGENEOUS SONO-FENTON PROCESSES .......................................... 187
4.3.1. Investigation of 20 kHz sono-Fenton oxidation............................................... 187
4.3.1.1. Effect of catalyst particles on sonolysis ................................................... 187
4.3.1.2. Comparison of Fenton and sono-Fenton oxidation with Fe/MFI ............. 189
4.3.2. Effect of US application mode ......................................................................... 191
4.3.3. Effect of ultrasound intensity ........................................................................... 191
4.3.4. Effect of ultrasound power density .................................................................. 194
4.3.5. Effect of ultrasound frequency......................................................................... 196
4.4. HETEROGENEOUS PHOTO-FENTON PROCESSES ........................................ 198
4.4.1. Heterogeneous photo-Fenton oxidation under UV light (LP Hg lamp) .......... 198
4.4.2. Heterogeneous photo-Fenton oxidation under visible light (Xe lamp) ........... 200
4.5. HETEROGENEOUS SONO-PHOTO-FENTON PROCESSES ............................ 202
4.6. EVOLUTION OF THE HETEROGENEOUS CATALYST ................................. 205
4.6.1. Particle size distribution ................................................................................... 205
4.6.2. Catalyst morphology and iron content ............................................................. 206
14
4.6.3. Activity of leached iron in sono-Fenton and photo(Vis)-Fenton oxidation ..... 208
4.6.4. Effect of ultrasound and light irradiation on residual carbon content ............. 209
4.7. EVALUATION OF TRANSFORMATION PRODUCTS ..................................... 211
4.8. EFFECT OF WATER MATRIX ............................................................................ 214
4.9. CONCLUSIONS ..................................................................................................... 219
CONCLUSIONS AND PERSPECTIVES………………………………………………….221
REFERENCES……………………………………………………………………………...227
S. Adityosulindro (2017) / Doctoral Thesis / INP Toulouse
INTRODUCTION
15
INTRODUCTION
Contaminated water is a world concern, and threatens both quality of life and public
health. The oldest water pollution was that due to organic matter, followed in the beginning
of twentieth century by metal pollution caused by the industrial development. With the
increase of population, urbanization, industrialization and agriculture intensification, new
types of pollutants have arisen such as organic solvents, fertilizers, pesticides and
pharmaceuticals. It is now well-known that after medication, drugs can reach the aquatic
environment via excreta and have an impact on non-target organisms. Thousands tons of
pharmaceutical compounds (PCs) are commercially produced each year. Following their
increasing use, numerous studies have demonstrated the presence of pharmaceuticals in
various wastewater treatment effluents, typically at concentration levels from nanogram to
few micrograms per liter. Possible risks associated to the release of pharmaceuticals are still
unclear and require further research to better characterize their long-term effects for
environment and human health. Regarding ecosystems, impacts can be blooms of
microorganisms or apparition of mutant species. For humans, potential consequences of
chronical exposure via drinking-water range from allergy to cancer through loss of fertility.
Therefore those emerging pollutants have become an important issue due to their recognized
occurrence in wastewater and probable harmful effects on environment and health.
Due to their complex molecular structure, low concentration in water and possible
toxicity to microorganisms, most of these molecules cannot be completely removed by
conventional wastewater treatment (e.g. chemical precipitation and activated sludge) due to
their complex molecular structure, low concentration in water and possible toxicity to
microorganisms. Thus environmental and health concerns are driving wastewater treatment
plants to develop different techniques and to come up with advanced technologies. Moreover,
current researches on the remediation of bio-recalcitrant and/or toxic compounds are moving
towards a coupling of processes, either traditional or more innovative.
Advanced Oxidation Processes (AOPs) are promising techniques for the degradation of
refractory organic compounds, including drugs. AOPs are based on the generation of reactive
oxygen species (ROS), especially hydroxyl radical (OH) a powerful and non-selective
oxidant and other strong oxidant species (e.g. OOH,
O2
-) that are capable to degrade and
S. Adityosulindro (2017) / Doctoral Thesis / INP Toulouse
INTRODUCTION
16
mineralize organic compounds into water (H2O) and carbon dioxide (CO2) as final products.
AOPs are classified according to the reactive system (homogeneous or heterogeneous) and
the radical generation methods (chemical, electrochemical, sonochemical or photochemical).
Fenton oxidation is one of the most popular AOPs. It classically involves the reaction
of ferrous ions and hydrogen peroxide under acidic condition to form hydroxyl radicals.
However, the relatively high iron concentration needed (50-500 ppm) with respect to
discharge limit (2 ppm in EU) and the difficulty in recovering dissolved iron promote the
development of heterogeneous systems. Heterogeneous Fenton oxidation uses an iron
containing solid as catalyst in order to facilitate its recovery, for instance by using membrane
filtration.
Unfortunately, degradation rates in heterogeneous process are usually lower than that of
homogeneous counterpart. In order to enhance the reaction, several activation methods have
been proposed, the most popular being UV/Vis light in the so-called photo-Fenton process.
This irradiation enhances the regeneration of ferrous species (limiting step in dark Fenton
process) by photo-reduction, while generating additional radicals. It also promotes the direct
decomposition of H2O2 into OH and eventually the direct photolysis of the molecule
depending on the applied wavelengths.
More recently, increasing attention has also been paid to the application of ultrasound
(“sono-Fenton process”) with nearly one hundred publications and two thirds of them from
the last five years. In solution, a synergetic effect between Fenton reaction and ultrasound has
been proven, in which US also improves Fe2+
regeneration and subsequent formation of
radicals. Moreover, acoustic cavitation gives rise to extreme conditions inside and around the
collapsing bubble, which can result in the thermal cleavage of the organic pollutants. Low
frequency ultrasound also induces mechanical effects, including particle aggregate disruption
and possible surface activation and/or regeneration of the heterogeneous catalysts. Still,
scarce information is available on the exact role of US enhancement in heterogeneous Fenton
reaction (mechanical vs. chemical effects).
The aim of this study is to investigate the coupling of both homogeneous and
heterogeneous Fenton reaction with these activation techniques (ultrasound and/or
ultraviolet/visible) for the degradation of pharmaceutical compounds. Reaction tests are
performed in a batch mode and investigate the effects of irradiation spectrum (sound
frequency / light wavelength), power input, irradiation time and modulation, as well as
oxidant and catalyst doses. Despite efficacies of these combined techniques are probably
S. Adityosulindro (2017) / Doctoral Thesis / INP Toulouse
INTRODUCTION
17
greater, interactions could also be not so advantageous. Therefore the study progresses from
the separate processes, via their two-by-two associations towards overall combination.
For this work, ibuprofen has been selected as model drug contaminant owing to its high
consumption (for self-medication) and reported occurrence in the environment.
The manuscript starts with a review on pharmaceutical contaminants in aquatic
systems, particularly ibuprofen, and advanced oxidation processes (AOPs) proposed to
reduce this pollution. This literature survey focuses on homogeneous and heterogeneous
Fenton reaction, as well as sonolysis, photolysis and their combination (sono-Fenton, photo-
Fenton, sono-photo-Fenton). Finally, main operating parameters of these different AOPs are
reviewed.
Description of materials, experimental equipment and procedures involved in this
study is gathered in chapter 2. Liquid chromatography, analysis of Total Organic Carbon and
residual hydrogen peroxide have been used as routine measurements for liquid samples so as
to evaluate the process performance. Solid catalysts have been characterized by a range of
techniques for their morphological and textural properties, as well iron species type, content
and dispersion. For these heterogeneous systems, iron leaching in solution has also been
monitored to evaluate possible contribution of homogeneous mechanism. Different types of
ultrasound equipment and lamps have been used whose characteristics are also given in this
chapter.
Chapter 3 is dedicated to the degradation of ibuprofen by homogeneous oxidation
treatments: a parametric study is first carried out on the separate processes (sonolysis,
photolysis, and Fenton oxidation) to highlight the involved mechanisms, prior to the
investigation of their combinations.
Chapter 4 focuses on the heterogeneous Fenton reaction. The activity of two different
catalysts (zero-valent iron particles and iron-containing zeolite) is first evaluated with respect
to the homogeneous system. Then possible activation of selected catalyst by ultrasound
and/or light irradiation is examined. In these two chapters, effect of water matrix and
identification of degradation intermediates are also addressed in order to assess the feasibility
and relevance of such advanced processes.

18
This page is intentionally left blank

19
CHAPTER 1 LITERATURE REVIEW
This chapter provides a literature survey about pharmaceutical emerging pollutants and
advanced oxidation processes as possible treatment for their remediation.

20
This page is intentionally left blank
S. Adityosulindro (2017) / Doctoral Thesis / INP Toulouse
CHAPTER 1 - LITERATURE REVIEW
21
1.1. CONTAMINATION OF AQUATIC ENVIRONMENTS BY
PHARMACEUTICAL COMPOUNDS
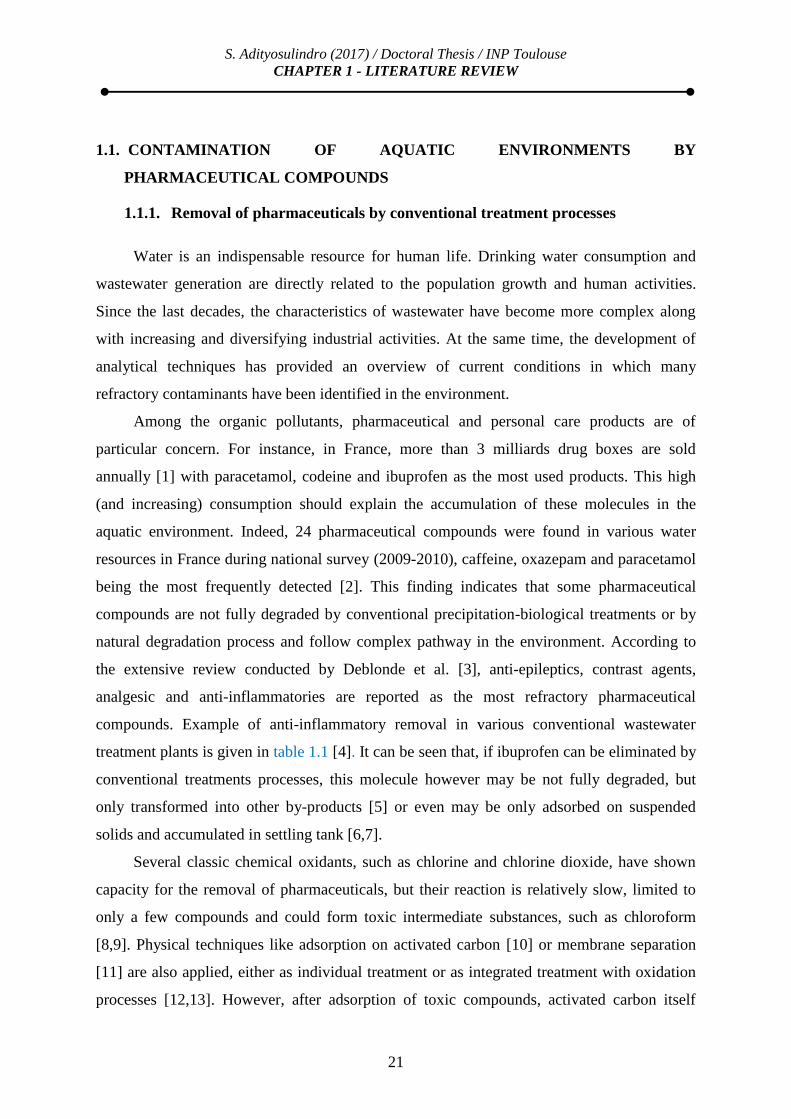
1.1.1. Removal of pharmaceuticals by conventional treatment processes
Water is an indispensable resource for human life. Drinking water consumption and
wastewater generation are directly related to the population growth and human activities.
Since the last decades, the characteristics of wastewater have become more complex along
with increasing and diversifying industrial activities. At the same time, the development of
analytical techniques has provided an overview of current conditions in which many
refractory contaminants have been identified in the environment.
Among the organic pollutants, pharmaceutical and personal care products are of
particular concern. For instance, in France, more than 3 milliards drug boxes are sold
annually [1] with paracetamol, codeine and ibuprofen as the most used products. This high
(and increasing) consumption should explain the accumulation of these molecules in the
aquatic environment. Indeed, 24 pharmaceutical compounds were found in various water
resources in France during national survey (2009-2010), caffeine, oxazepam and paracetamol
being the most frequently detected [2]. This finding indicates that some pharmaceutical
compounds are not fully degraded by conventional precipitation-biological treatments or by
natural degradation process and follow complex pathway in the environment. According to
the extensive review conducted by Deblonde et al. [3], anti-epileptics, contrast agents,
analgesic and anti-inflammatories are reported as the most refractory pharmaceutical
compounds. Example of anti-inflammatory removal in various conventional wastewater
treatment plants is given in table 1.1 [4]. It can be seen that, if ibuprofen can be eliminated by
conventional treatments processes, this molecule however may be not fully degraded, but
only transformed into other by-products [5] or even may be only adsorbed on suspended
solids and accumulated in settling tank [6,7].
Several classic chemical oxidants, such as chlorine and chlorine dioxide, have shown
capacity for the removal of pharmaceuticals, but their reaction is relatively slow, limited to
only a few compounds and could form toxic intermediate substances, such as chloroform
[8,9]. Physical techniques like adsorption on activated carbon [10] or membrane separation
[11] are also applied, either as individual treatment or as integrated treatment with oxidation
processes [12,13]. However, after adsorption of toxic compounds, activated carbon itself

S. Adityosulindro (2017) / Doctoral Thesis / INP Toulouse
CHAPTER 1 - LITERATURE REVIEW
22
becomes a hazardous waste that must be regenerated, treated or disposed properly. Similarly,
even though nanofiltration and reverse osmosis have proved to remove most of the
pharmaceutical compounds, these techniques require a post-destructive process increasing the
operation costs.
Table 1.1. Example of pharmaceuticals removal in conventional treatment
Drugs Unit operations Removal (%) Region
IBP AcS/phosphate removal 78-100 Aura, Tampere, Harjavalta
(Finland)
AcS/N/DeN/phosphate removal 92-99
Helsinki, Seinajoki, Turku
(Finland)
1
O settling, AcS, 2
O 60-70 Galicia (Spain)
1
O Settling, AcS/N/DeN, 2
O settling 86 S. England
1
O Settling, AcS 75 Rio de Janeiro (Brazil)
AcS, ppt with FeCl3 62-79 on Lake Geneva (W. Switzerland)
DCF Conventional WWTP 17 Berlin (Germany)
AcS, P removal 23-60
Aura, Tampere, Harjavalta
(Finland)
AcS/N/DeN/phosphate removal 9-25
Helsinki, Seinajoki, Turku
(Finland)
1
O Settling, AcS 75 Rio de Janeiro (Brazil)
AcS, disinfection 18 Baltimore (USA)
NPX AcS/phosphate removal 55-98 Aura, Tampere, Harjavalta
(Finland)
AcS/N/DeN/phosphate removal 69-94
Helsinki, Seinajoki, Turku
(Finland)
1
O Settling, AcS 78 Rio de Janeiro (Brazil)
AcS/N/DeN, sand filtration 50-80 Kloten/Opfikon (Switzerland)
KTF AcS/phosphate removal 51-100 Aura, Tampere, Harjavalta
(Finland)
AcS/N/DeN/phosphate removal 63-98
Helsinki, Seinajoki, Turku
(Finland)
AcS, ppt with FeCl3 15-72 on Lake Geneva (W. Switzerland)
1
O Settling, AcS 69 Rio de Janeiro (Brazil)
MEF 1O Settling, AcS/N/DeN, 2
O settling 91 S. England
1O Settling, AcS, ppt with FeCl3, 2
O
settling 28-74 on Lake Geneva (W. Switzerland)
AcS, ppt with FeCl3 19-69 on Lake Geneva (W. Switzerland) AcS: activated sludge, N: nitrification, DeN: denitrification, 1°: primary settling tank, 2°: secondary settling
tank, ppt: chemical precipitation, IBP: Ibuprofen, DCF: Diclofenac, NPX: Naproxen, KTF: Ketoprofen, MEF:
Mefenamic acid
These facts lead pharmaceutical compounds to become emerging pollutants. Emerging
pollutants are new products or chemicals without regulatory status and whose (cumulative)

S. Adityosulindro (2017) / Doctoral Thesis / INP Toulouse
CHAPTER 1 - LITERATURE REVIEW
23
effects on environment and human health are unknown [3]. The concentration of the
pharmaceutical products was not monitored in European waters until the revision of the
Directive 2000/60/EC in 2013, when the European Commission has proposed to include on a
"watch list" three pharmaceuticals (a painkiller and two hormones), namely diclofenac, α-
ethinylestradiol, and β-estradiol.
1.1.2. Sources and environmental fate
It is widely accepted that pharmaceutical compounds are introduced into the
environment mainly through wastewater effluent from pharmaceutical industries, hospitals,
live-stock and household activities, as shown in figure 1.1 [14]. Pharmaceutical wastewater
generated from industry is more easily measured and managed than that derived from
domestic source. The latter has been identified as the main contamination pathway of
ibuprofen in the aquatic environment [15]. In aquatic environment, the possible removal
processes of organic compounds are biodegradation, sorption and photo-degradation (direct
and indirect). However, since pharmaceuticals contain active ingredients are designed to have
pharmacological effects on humans and animals, they are usually resistant to biodegradation
[16,17]. Photo-degradation might be also not efficient considering the spectral absorption of
pharmaceuticals, which is usually in UV-C region [18–20]. On the other hand, removal by
sorption process is both soil (or site)- and molecule- specific, so it cannot be generalized on a
global basis and it may be only a liquid-solid phase transfer without significant degradation
process.
In the case of ibuprofen (IBP), several studies reported its presence in effluents from
wastewater treatment plants (0.002 - 95 µg/L), in surface water (0.01 - 0.4 µg/L) and in
drinking water (0.0002 - 0.0013 µg/L) [4,21]. After excretion by human body or treatment by
biological process, IBP can enter the water bodies under unaltered parent compound, as
metabolized hydroxy-ibuprofen and as carboxy-ibuprofen [22–24]. In all cases, IBP also
tends to adsorb onto suspended solids and sediments leading to an underestimation of its
measured concentration in aquatic environment [25].

S. Adityosulindro (2017) / Doctoral Thesis / INP Toulouse
CHAPTER 1 - LITERATURE REVIEW
24
Figure 1.1. Possible sources and pathways of pharmaceutical compounds in the environment (adapted from reference [14])
1.1.3. Possible adverse effect
Regardless of its function as a medicine, the presence of pharmaceuticals in the
environment may have negative impacts, especially for microorganisms and aquatic
organisms. Carlsson et al. [26] evaluated hazard and risk assessments of 27 pharmaceuticals
based on some parameters such as daily dose, acute toxicity, degradation, and octanol-water
partition coefficient (KOW) and they found diclofenac, ethinylestradiol, ibuprofen, metoprolol,
norethisterone, and oxytetracycline as having the potential for toxic and/or long-term effects.
Ecological risk assessment of 33 pharmaceutical compounds detected in French water
resources was also carried out by Bouissou-Schurtz et al (2014). The results suggest that only
ibuprofen was identified as posing real environmental risk based on its measured
environmental concentration (Risk Quotient = 1.9) [25].
Despite the unclear effect on human health [3,27], ibuprofen has been shown to
significantly affect the growth of several fishes, microorganisms, algae, bacterial and fungal
species [28–32] (Table 1.2). Chronic exposure to ibuprofen at 0.1 - 1 µg/L affects several
endpoints related to the reproduction of the fish, including induction of vitellogenin in male
fish, fewer broods per pair, and more eggs per brood [32].

S. Adityosulindro (2017) / Doctoral Thesis / INP Toulouse
CHAPTER 1 - LITERATURE REVIEW
25
Table 1.2. Environmental toxicity of ibuprofen
Species Duration / endpoint Concentration
(mg/L)
P. carinatus 21 d / Growth (wet weight) NOEC 1.02
P. carinatus 21 d / Reproduction (hatching success) NOEC 2.43
P. carinatus 21 d / Survival NOEC 5.36
D. magna 21 d / Reproduction NOEC 20
D. magna 21 d / Reproduction NOEC < 1.23
D. magna 21 d / Survival NOEC 33.3
D. magna 14 d / Reproduction EC50 13.4
D. magna 14 d / Survival NOEC 20
D. magna 14 d / Population growth rate NOEC < 20
M. macrocopa 7 d / Reproduction NOEC 25
M. macrocopa 7 d / Survival NOEC >50
H. vulgaris 10 d / Bud formation NOEC >10
H. attenuata 96 h / Morphology EC50 1.65
H. attenuata 96 h / Morphology NOEC 0.1
H. attenuata 96 h / Feeding EC50 3.85
O. latipes 30 dph / Survival NOEC 0.1
O. latipes 90 dph / Survival NOEC 0.001
O. latipes 120 dph / Survival NOEC 0.0001
O. latipes 120 dph / Reproduction NOEC 0.001
EC50: Half maximal effective concentration, LC50: Half lethal concentration, NOEC: No observed effect
concentration
1.2. ADVANCED OXIDATION PROCESSES
1.2.1. Principle
Advanced Oxidation Processes (AOPs) are oxidative processes applied for the
elimination of contaminants in water, soils and air, which are based on the formation of
highly reactive and non-selective species, such as hydroxyl radical (OH), superoxide radical
(O2), hydroperoxyl radical (
O2H) and peroxy radical (ROO
). These reactive radicals are
generated in atmospheric or subcritical conditions of temperature and pressure, with or
without catalyst and/or energy (electrochemical, UV–Vis or ultrasound) [33]. Among reactive
oxidant species, OH is usually considered as the main oxidant since it possesses high
standard oxidation potential (E0 = 2.8 V in acidic medium) that would be able to oxidize
almost all organic compounds to carbon dioxide and water through different mechanisms, i.e.
electron transfer reaction (as oxidizing agent), abstraction of protons producing organic

S. Adityosulindro (2017) / Doctoral Thesis / INP Toulouse
CHAPTER 1 - LITERATURE REVIEW
26
radicals (R) and electrophilic addition on a double bond or aromatic ring (figure 1.2) [34,35].
However, some of the simplest organic compounds, such as acetic, maleic, oxalic acids,
acetone are more difficult to degrade by this process [36].
Figure 1.2. General scheme of hydroxyl radical based reactions (adapted from reference [34])
Figure 1.3. Distribution of studies on pharmaceuticals removal by AOPs (adapted from reference [37])
S. Adityosulindro (2017) / Doctoral Thesis / INP Toulouse
CHAPTER 1 - LITERATURE REVIEW
27
Numerous types of AOPs are known such as ozonation (O3), Fenton reaction (H2O2 and
iron-based catalyst), UV photolysis, photo-peroxide oxidation (UV/H2O2), photo-catalysis
(UV/TiO2), ultrasound (US), electrochemical oxidation, wet-air oxidation, pulse plasma and
also their possible combination (such as UV/O3, UV/Fenton, US/Fenton, Electro-Fenton,
etc.). Considering pharmaceutical compounds as model pollutants, ozonation and
heterogeneous photocatalysis using TiO2 are the most studied [37] (figure 1.3).
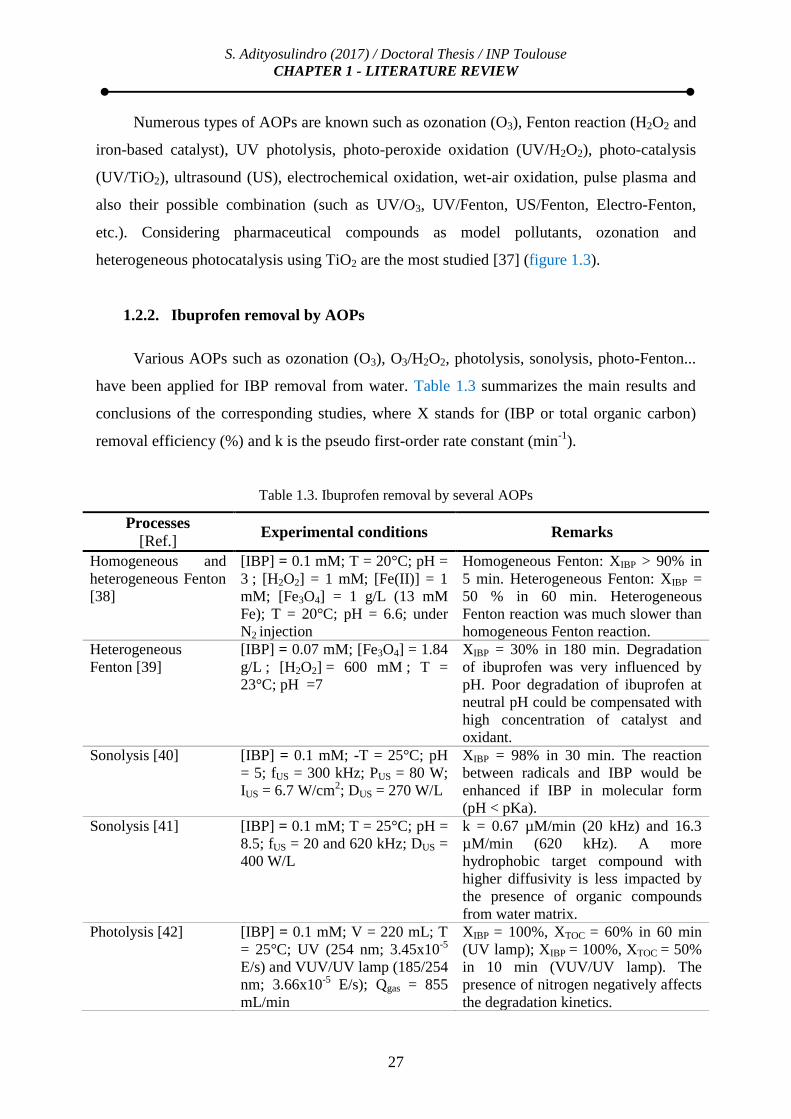
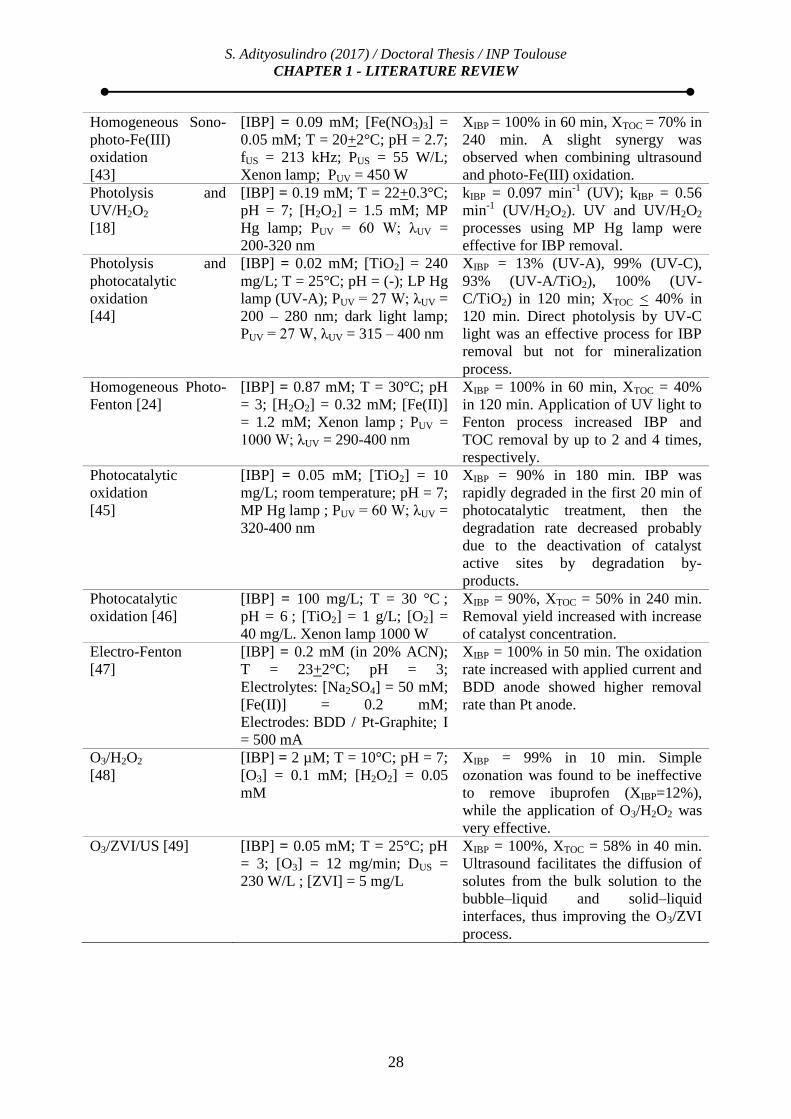
1.2.2. Ibuprofen removal by AOPs
Various AOPs such as ozonation (O3), O3/H2O2, photolysis, sonolysis, photo-Fenton...
have been applied for IBP removal from water. Table 1.3 summarizes the main results and
conclusions of the corresponding studies, where X stands for (IBP or total organic carbon)
removal efficiency (%) and k is the pseudo first-order rate constant (min-1
).
Table 1.3. Ibuprofen removal by several AOPs
Processes [Ref.] Experimental conditions Remarks
Homogeneous and
heterogeneous Fenton
[38]
[IBP] = 0.1 mM; T = 20°C; pH =
3 ; [H2O2] = 1 mM; [Fe(II)] = 1
mM; [Fe3O4] = 1 g/L (13 mM
Fe); T = 20°C; pH = 6.6; under
N2 injection
Homogeneous Fenton: XIBP > 90% in
5 min. Heterogeneous Fenton: XIBP =
50 % in 60 min. Heterogeneous
Fenton reaction was much slower than
homogeneous Fenton reaction.
Heterogeneous
Fenton [39]
[IBP] = 0.07 mM; [Fe3O4] = 1.84
g/L ; [H2O2] = 600 mM ; T =
23°C; pH =7
XIBP = 30% in 180 min. Degradation
of ibuprofen was very influenced by
pH. Poor degradation of ibuprofen at
neutral pH could be compensated with
high concentration of catalyst and
oxidant.
Sonolysis [40] [IBP] = 0.1 mM; -T = 25°C; pH
= 5; fUS = 300 kHz; PUS = 80 W;
IUS = 6.7 W/cm2; DUS = 270 W/L
XIBP = 98% in 30 min. The reaction
between radicals and IBP would be
enhanced if IBP in molecular form
(pH < pKa).
Sonolysis [41] [IBP] = 0.1 mM; T = 25°C; pH =
8.5; fUS = 20 and 620 kHz; DUS =
400 W/L
k = 0.67 µM/min (20 kHz) and 16.3
µM/min (620 kHz). A more
hydrophobic target compound with
higher diffusivity is less impacted by
the presence of organic compounds
from water matrix.
Photolysis [42] [IBP] = 0.1 mM; V = 220 mL; T
= 25°C; UV (254 nm; 3.45x10⁻⁵
E/s) and VUV/UV lamp (185/254
nm; 3.66x10⁻⁵ E/s); Qgas = 855
mL/min
XIBP = 100%, XTOC = 60% in 60 min
(UV lamp); XIBP = 100%, XTOC = 50%
in 10 min (VUV/UV lamp). The
presence of nitrogen negatively affects
the degradation kinetics.
S. Adityosulindro (2017) / Doctoral Thesis / INP Toulouse
CHAPTER 1 - LITERATURE REVIEW
28
Homogeneous Sono-
photo-Fe(III)
oxidation
[43]
[IBP] = 0.09 mM; [Fe(NO3)3] =
0.05 mM; T = 20+2°C; pH = 2.7;
fUS = 213 kHz; PUS = 55 W/L;
Xenon lamp; PUV = 450 W
XIBP = 100% in 60 min, XTOC = 70% in
240 min. A slight synergy was
observed when combining ultrasound
and photo-Fe(III) oxidation.
Photolysis and
UV/H2O2
[18]
[IBP] = 0.19 mM; T = 22+0.3°C;
pH = 7; [H2O2] = 1.5 mM; MP
Hg lamp; PUV = 60 W; λUV =
200-320 nm
kIBP = 0.097 min-1 (UV); kIBP = 0.56
min-1 (UV/H2O2). UV and UV/H2O2
processes using MP Hg lamp were
effective for IBP removal.
Photolysis and
photocatalytic
oxidation
[44]
[IBP] = 0.02 mM; [TiO2] = 240
mg/L; T = 25°C; pH = (-); LP Hg
lamp (UV-A); PUV = 27 W; λUV =
200 – 280 nm; dark light lamp;
PUV = 27 W, λUV = 315 – 400 nm
XIBP = 13% (UV-A), 99% (UV-C),
93% (UV-A/TiO2), 100% (UV-
C/TiO2) in 120 min; XTOC < 40% in
120 min. Direct photolysis by UV-C
light was an effective process for IBP
removal but not for mineralization
process.
Homogeneous Photo-
Fenton [24]
[IBP] = 0.87 mM; T = 30°C; pH
= 3; [H2O2] = 0.32 mM; [Fe(II)]
= 1.2 mM; Xenon lamp ; PUV =
1000 W; λUV = 290-400 nm
XIBP = 100% in 60 min, XTOC = 40%
in 120 min. Application of UV light to
Fenton process increased IBP and
TOC removal by up to 2 and 4 times,
respectively.
Photocatalytic
oxidation
[45]
[IBP] = 0.05 mM; [TiO2] = 10
mg/L; room temperature; pH = 7;
MP Hg lamp ; PUV = 60 W; λUV =
320-400 nm
XIBP = 90% in 180 min. IBP was
rapidly degraded in the first 20 min of
photocatalytic treatment, then the
degradation rate decreased probably
due to the deactivation of catalyst
active sites by degradation by-
products.
Photocatalytic
oxidation [46]
[IBP] = 100 mg/L; T = 30 °C ;
pH = 6 ; [TiO2] = 1 g/L; [O2] =
40 mg/L. Xenon lamp 1000 W
XIBP = 90%, XTOC = 50% in 240 min.
Removal yield increased with increase
of catalyst concentration.
Electro-Fenton
[47]
[IBP] = 0.2 mM (in 20% ACN);
T = 23+2°C; pH = 3;
Electrolytes: [Na2SO4] = 50 mM;
[Fe(II)] = 0.2 mM;
Electrodes: BDD / Pt-Graphite; I
= 500 mA
XIBP = 100% in 50 min. The oxidation
rate increased with applied current and
BDD anode showed higher removal
rate than Pt anode.
O3/H2O2
[48]
[IBP] = 2 µM; T = 10°C; pH = 7;
[O3] = 0.1 mM; [H2O2] = 0.05
mM
XIBP = 99% in 10 min. Simple
ozonation was found to be ineffective
to remove ibuprofen (XIBP=12%),
while the application of O3/H2O2 was
very effective.
O3/ZVI/US [49]
[IBP] = 0.05 mM; T = 25°C; pH
= 3; [O3] = 12 mg/min; DUS =
230 W/L ; [ZVI] = 5 mg/L
XIBP = 100%, XTOC = 58% in 40 min.
Ultrasound facilitates the diffusion of
solutes from the bulk solution to the
bubble–liquid and solid–liquid
interfaces, thus improving the O3/ZVI
process.

S. Adityosulindro (2017) / Doctoral Thesis / INP Toulouse
CHAPTER 1 - LITERATURE REVIEW
29
Despite it is difficult to compare these studies performed in rather different conditions,
coupling ozone and hydrogen peroxide seems to be the most effective AOP, with complete
removal of IBP in 10 min [48]. However, the high energy consumption for generating ozone
by silent electrical discharges makes its use expensive [50]. Some other efficient treatments
(photolysis, UV/H2O2) use UV-C irradiation (λ = 200-280 nm). However, its application to
large wastewater treatment plants may be a challenge considering the cost of mercury vapor
lamps [51]. In order to reduce energy consumption, development of water treatment
processes tends more towards a better utilization of sunlight (with major fraction in the
visible domain, λ = 400-800 nm). On the other hand, for all the proposed AOPs, complete
mineralization of ibuprofen is still a challenging issue. In any case, it should be mentioned
that ibuprofen removal by heterogeneous Fenton coupled with ultrasound and light
irradiations hasn’t been investigated yet.
1.2.3. Transformation products of ibuprofen
Transformation products (TPs), also called degradation products or reaction
intermediates, are related to the molecules formed during the oxidation process of the
targeted compound. Degradation pathway of ibuprofen generally consists in decarboxylation,
demethylation, hydroxylation and cleavage moiety reactions [52]. These reactions form 4-
isobutylacetophenone and 4-ethylbenzaldehyde, that were found to be toxic, causing adverse
effects to the central nervous system and presenting high dermal absorption [52–54].
Hydroxylated ibuprofen molecules are usually detected as first degradation products by
mass spectrometry. Hydroxylation is assumed to take place on the side chains in the
secondary or tertiary positions or by attachment to the aromatic benzene ring [24,43,45,55],
with H extractions kinetically favored over ring additions [51].
An example of ibuprofen degradation pathways during TiO2 photocatalytic oxidation is
given in figure 1.4 [52]. The first transformation product TP1 (mono-hydroxylated IBP; m/z:
221) is formed via the addition of a hydroxyl group (
OH) onto ibuprofen molecule
(hydroxylation), which was found here to take place rather on the aromatic ring. Together
with hydroxylation, direct demethylation can occur in parallel to form TP2 (4-(1-
carboxyethyl) benzoic acid; m/z: 191), which can be further hydroxylated into TP3
(C12H15O3; m/z: 207). TP4 (1-ethyl-4-(2-hydroxy)isobutylbenzene; m/z: 177) is formed by
removal of carboxylic acid from the isobutyl moiety (decarboxylation) of TP1. Then, TP5
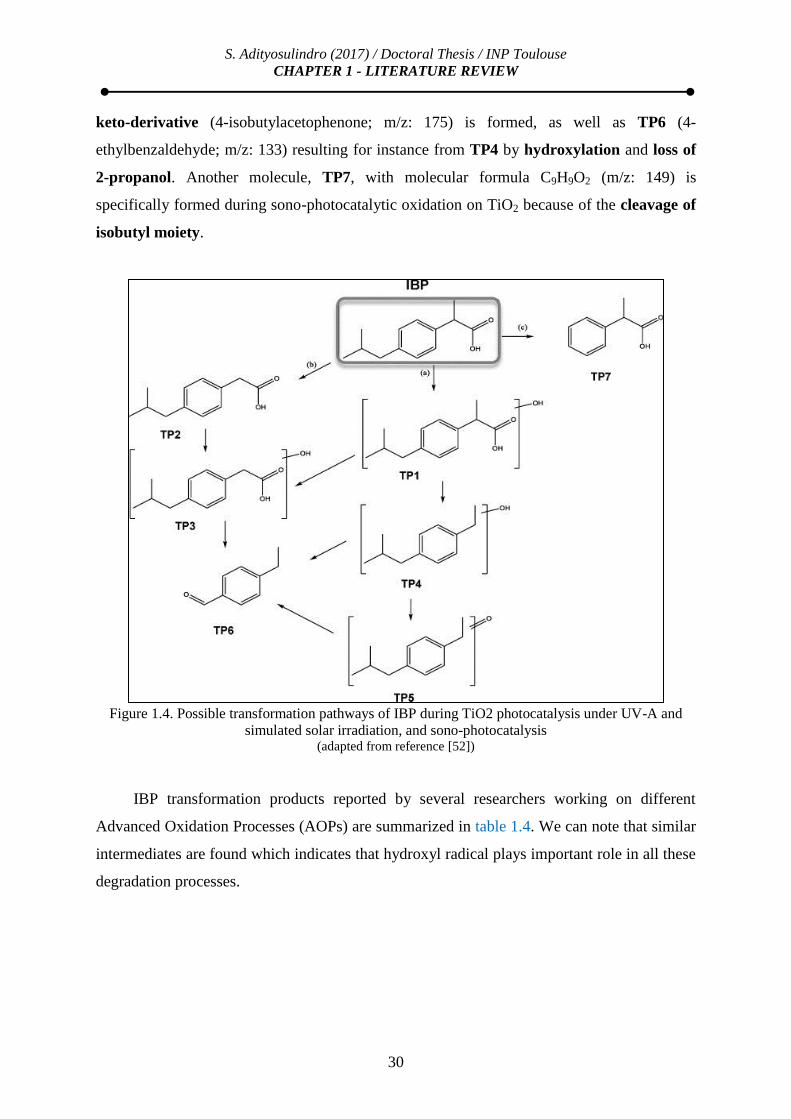
S. Adityosulindro (2017) / Doctoral Thesis / INP Toulouse
CHAPTER 1 - LITERATURE REVIEW
30
keto-derivative (4-isobutylacetophenone; m/z: 175) is formed, as well as TP6 (4-
ethylbenzaldehyde; m/z: 133) resulting for instance from TP4 by hydroxylation and loss of
2-propanol. Another molecule, TP7, with molecular formula C9H9O2 (m/z: 149) is
specifically formed during sono-photocatalytic oxidation on TiO2 because of the cleavage of
isobutyl moiety.
Figure 1.4. Possible transformation pathways of IBP during TiO2 photocatalysis under UV-A and
simulated solar irradiation, and sono-photocatalysis (adapted from reference [52])
IBP transformation products reported by several researchers working on different
Advanced Oxidation Processes (AOPs) are summarized in table 1.4. We can note that similar
intermediates are found which indicates that hydroxyl radical plays important role in all these
degradation processes.

S. Adityosulindro (2017) / Doctoral Thesis / INP Toulouse
CHAPTER 1 - LITERATURE REVIEW
31
Table 1.4. Transformation products of ibuprofen observed in different AOPs
Treatment Transformation products References Electro-
Fenton
p-Benzoquinone (m/z 107.98)
4-Isobutylphenol (m/z 150.03)
1-(1-Hydroxyethyl)-4-isobutylbenzene (m/z 178.86)
4-Isobutylacetophenone (m/z 175.97)
Isomer molecule 1 (m/z 249.08)
Isomer molecule 2 (m/z 249.12)
[47]
Photo-Fenton 1 or 2-Hydroxy-IBP (m/z 221)
(2RS)-2-(4-Methylphenyl)propanoic acid (m/z 163)
1-ethyl-4-(2-hydroxy)isobutylbenzene (m/z 177)
1-ethyl-4-(1-Hydroxy)isobutylbenzene (m/z 175)
1-[4-(2-Methylpropyl)phenyl]ethanone (m/z 175)
4-(1-hydroxy-2-methylpropyl)acetophenone (m/z 191)
2-Methyl-1-phenylpropane (m/z 133)
2-hydroxy-2-[4-(2methylpropyl)phenyl]peroxic acid (m/z 238)
[24]
Sono-photo-
catalysis
using TiO2
1 or 2-Hydroxy-IBP (m/z 221)
(2RS)-2-(4-Methylphenyl)propanoic acid (m/z 163)
1-ethyl-4-(2-hydroxy)isobutylbenzene (m/z 177)
1-ethyl-4-(1-Hydroxy)isobutylbenzene (m/z 175)
1-[4-(2-Methylpropyl)phenyl]ethanone (m/z 175)
4-(1-hydroxy-2-methylpropyl)acetophenone (m/z 191)
2-Methyl-1-phenylpropane (m/z 133)
2-hydroxy-2-[4-(2methylpropyl)phenyl]peroxic acid (m/z 238)
[43]
Sono-photo-
catalysis
using TiO2
1 or 2-Hydroxy-IBP (m/z 221)
4-(1-carboxyethyl) benzoic acid (m/z 191)
C12H15O3 (m/z 207)
C12H17O (m/z 177)
4-isobutylacetophenone (m/z 175)
4-ethylbenzaldehyde (m/z 133)
C9H9O2 (m/z 149)
[52]
1.3. FENTON REACTION
1.3.1. Principle and mechanism
1.3.1.1. Homogeneous system
Among the Advances Oxidation Processes, Fenton oxidation is one of the most
promising one owing to (i) the use of easy-to-handle and environmental-friendly reagents
(Fe2+
or Fe3+
and H2O2), (ii) the low energy consumption compared to other oxidation
technologies, (iii) the ability to destroy a large number of organic compounds along with a
reduction of toxicity, odor and color and an improvement of biodegradability, and (iv) the
S. Adityosulindro (2017) / Doctoral Thesis / INP Toulouse
CHAPTER 1 - LITERATURE REVIEW
32
simplicity of the required equipment allowing an easy scale-up from laboratory to large scale
[56–58].
The Fenton reaction was discovered in 1894 by H.J.H. Fenton, who reported that H2O2
could be activated by ferrous (Fe2+
) salts to oxidize tartaric acid [59]. Recently, Fenton
reaction has been proved to be very effective in the removal of many hazardous organic
pollutants from water. The Fenton reaction causes the dissociation of the oxidant and the
formation of highly reactive hydroxyl radicals that attack and destroy the organic pollutants
[56,60].
It is usually accepted that Fenton reaction follows a free radical mechanism [56,60,61]:
hydroxyl radicals (OH) are generated by the reaction between ferrous ions (Fe
2+) and
hydrogen peroxide (H2O2) in acid condition (pH between 2 – 4):
Fe2+
+ H2O2 → Fe3+
+ OH- +
OH {k = 40 – 80 L.mol
-1.s
-1 [60,62]} (R.1.1)
Fe3+
+ H2O2 ↔ Fe-OOH2+
+ H+ {K = 3.1·10
-3 [62]} (R.1.2)
Fe-OOH2+
→ OOH + Fe
2+ {k = 2.7·10
-3 s
-1 [62]} (R.1.3)
As abovementioned, generated hydroxyl radicals (OH) can oxidize organic compounds (RH)
by different mechanism [34], i.e. electron transfer reaction (as oxidizing agent), abstraction of
protons producing organic radicals (R) and electrophilic addition on a double bond or
aromatic ring:
OH + RH → RH
+ OH
- (R.1.4)
RH + OH → R
+ H2O (R.1.5)
R – CH = CH2 + OH → R – C
R – CH2OH (R.1.6)
The organic radicals (R) are highly reactive and can further react with hydrogen peroxide,
ferrous or ferric ions, dissolved oxygen, hydroperoxyl radicals (OOH) or form a dimer,
leading to reactions (R.1.7) to (R.1.14):
S. Adityosulindro (2017) / Doctoral Thesis / INP Toulouse
CHAPTER 1 - LITERATURE REVIEW
33
R +H2O2 → ROH +
OH (R.1.7)
R + Fe
3+ → R
+ + Fe
2+ (R.1.8)
R + Fe
2+ → R
- + Fe
3+ (R.1.9)
R + O2 → RO2
(R.1.10)
RO2 + H2O → ROH +
OOH (R.1.11)
R +
OOH → RO2H (R.1.12)
RO2H + Fe2+
→ Fe3+
+ OH- + OR
(R.1.13)
2R → R–R (R.1.14)
Besides the reactions that generate free radicals, several detrimental reactions occur during
the Fenton oxidation process, such as radical scavenging reactions (reactions between
hydroxyl radicals with non-organic substances - (R.1.15) to (R.1.21), or decomposition of
H2O2 into water and oxygen (R.1.22):
OH + H2O2 →
OOH + H2O {k = (1.7 – 4.5) x 10
7 L.mol
-1.s
-1 [60,62]} (R.1.15)
OH +
OOH → H2O + O2 {k = (0.71 – 1.4) x 10
10 L.mol
-1.s
-1 [60,62]} (R.1.16)
OH +
OH → H2O2 {k = (5 – 8) x 10
9 L.mol
-1.s
-1 [60,62]} (R.1.17)
OOH +
OOH ↔ H2O2 + O2 {k = 0.8 – 2.2 x 10
5 L.mol
-1.s
-1 [60,62]} (R.1.18)
Fe2+
+ OH → Fe
3+ +
-OH {k = (2.5 – 5) 10
8 L.mol
-1.s
-1 [60,62]} (R.1.19)

S. Adityosulindro (2017) / Doctoral Thesis / INP Toulouse
CHAPTER 1 - LITERATURE REVIEW
34
H2O2 + H2O2 → 2 H2O + O2 (R.1.20)
The hydroperoxyl radicals (OOH) produced in reaction (R.1.3) and (R.1.11) exhibit
lower oxidation potential compared to OH (E
0 = 1.65 V vs. 2.8 V) and also unstable in water
[35]. These molecules react with ferrous or ferric ions, combine each other or undergo
disproportionation to superoxide (O2
-) and hydrogen ion (H
+) rather than reacting with the
contaminants:
Fe2+
+ OOH → Fe
III(HO2)
2+ {k = (0.72 – 1.5) x 10
6 L.mol
-1.s
-1 [60,62]} (R.1.21)
Fe3+
+ OOH → Fe
2+ + O2 + H
+ {k = (0.33 – 2.1) x 10
6 L.mol
-1.s
-1 [60,62]} (R.1.22)
OOH +
OOH → H2O2 + O2 {k = (0.8 – 2.2) x 10
6 L.mol
-1.s
-1 [60,62]} (R.1.23)
OOH ↔
O2
- + H
+ {K = 1.58 x 10
5 s
-1 [62]} (R.1.24)
Fe3+
+ O2
- → Fe
2+ + O2 {k = 5 x 10
7 L.mol
-1.s
-1 [62]} (R.1.25)
In addition, some studies proposed non-radical pathway producing high-valent iron
species (Fe(IV)), especially under circumneutral pH condition [63–66]:
Fe2+
+ H2O2 → FeO2+
+ H2O (R.1.26)
1.3.1.2. Heterogeneous system
There are several major drawbacks associated with homogeneous Fenton oxidation
especially when applied at large scale, among which [37,57,67]:
i. the need of operating in an acid pH range to avoid the precipitation of iron
oxyhydroxides, requiring subsequent neutralization of the effluent;
ii. the difficulty to separate and recover dissolved iron ions from the treated solution,
thus requiring an additional treatment stage;
iii. the possibility of iron sludge formation which creates disposal problems;

S. Adityosulindro (2017) / Doctoral Thesis / INP Toulouse
CHAPTER 1 - LITERATURE REVIEW
35
iv. the limitations in oxidant utilization efficiency due to radical scavenging and H2O2
self-decomposition;
v. the slow regeneration of ferrous ion (rate limiting step), thus increasing the catalyst
demands.
Utilization of heterogeneous catalysts (containing surface ferrous and/or ferric species) is
expected to overcome some of the drawbacks associated with Fenton oxidation: the uneasy
recovery of dissolved catalyst and the necessity of iron sludge management.
There are numerous types of iron containing solids that can be used as Fenton oxidation
catalysts: iron oxide minerals (e.g. ferrihydrite, ferrite, goethite, magnetite, hematite, pyrite,
schorl), iron oxide immobilized on high specific area materials (e.g. activated carbon,
alumina, biosorbent, polymer fiber, silica, zeolite), iron containing clays (e.g. laterite,
bentonite, kaolinite, laponite, vermiculite, sepiolite, saponite, montmorillonite), waste
materials (e.g. fly ash, pyrite ash, steel industry waste, iron sludge), and zero valent iron
(ZVI) [35,60,68,69]. Among these catalysts, iron containing zeolites are very promising due
to their high activity and stability [68].
Compared with the homogeneous reaction, the mechanism of pollutant degradation via
heterogeneous reaction has been less investigated and is still subject of discussion. In general
there are two possible mechanisms for heterogeneous Fenton reaction (figure 1.5) [65]: first,
a heterogeneous Fenton reaction mechanism induced by iron surface species on the catalyst
[70,71] and second, a homogeneous Fenton reaction mechanism induced by leached iron in
solution [72,73]. A surface radical mechanism similar to that of the homogeneous reaction
has been proposed by several researchers [70,71,74,75].
Figure 1.5. Schematic diagram of Fenton reaction using iron containing solids: (1) heterogeneous
mechanism induced by iron surface species and (2) homogeneous mechanism induced by leached iron (adapted from reference [65])

S. Adityosulindro (2017) / Doctoral Thesis / INP Toulouse
CHAPTER 1 - LITERATURE REVIEW
36
If ferrous active sites are already available on catalyst surface, they can react directly
with hydrogen peroxide (R.1.27). If not, hydrogen peroxide first forms a complex with ferric
sites located on catalyst surface, that are subsequently converted to ferrous species ((R.1.28)
and (R.1.29)) [70,71,75];
≡Fe(II) + H2O2 → ≡Fe(III) + OH + OH
- (R.1.27)
≡Fe(III) + H2O2 ↔ ≡Fe(III)(H2O2) (R.1.28)
≡Fe(III)(H2O2) → ≡Fe(II) + OOH (
O2
-) + H
+ (2 H
+) (R.1.29)
Where ≡ indicates species on catalyst surface
Hydroperoxyl radical (OOH) can be dissociated into superoxyde (
O2
-) and hydrogen ion
(H+), as shown previously in equation (R.1.24). Similarly to what reported for the
homogeneous system (see equations (R.1.22) and (R.1.25)), OOH and
O2
- radicals play an
important role in the redox cycle of iron, because they can react with ferric sites to form
ferrous active sites (R.1.30), which subsequently react with H2O2 and generate hydroxyl
radicals (OH) [71,75]:
≡Fe(III) + OOH /
O2
- → ≡Fe(II) + O2 (+ H
+) (R.1.30)
≡Fe(II) + OOH /
O2
- → ≡Fe(III) + HO2
- (R.1.31)
The hydroxyl radical may attack species adsorbed on active sites, as well as aqueous species:
(RH)ads / RH + OH → intermediates → CO2 + H2O (R.1.32)
In heterogeneous Fenton oxidation, some studies also reported a non-radical pathway
producing high-valent iron species [50,65,76]:
≡Fe(II) + H2O2 → ≡Fe(IV) + 2OH- (R.1.33)

S. Adityosulindro (2017) / Doctoral Thesis / INP Toulouse
CHAPTER 1 - LITERATURE REVIEW
37
Both mechanisms are illustrated on figure 1.6 for the case of an iron containing zeolite [50].
Figure 1.6. Representation of possible mechanisms involved in heterogeneous Fenton-like reactions
catalyzed by Fe-zeolites (adapted from reference [50])
1.3.2. Review of recent studies on Fenton oxidation
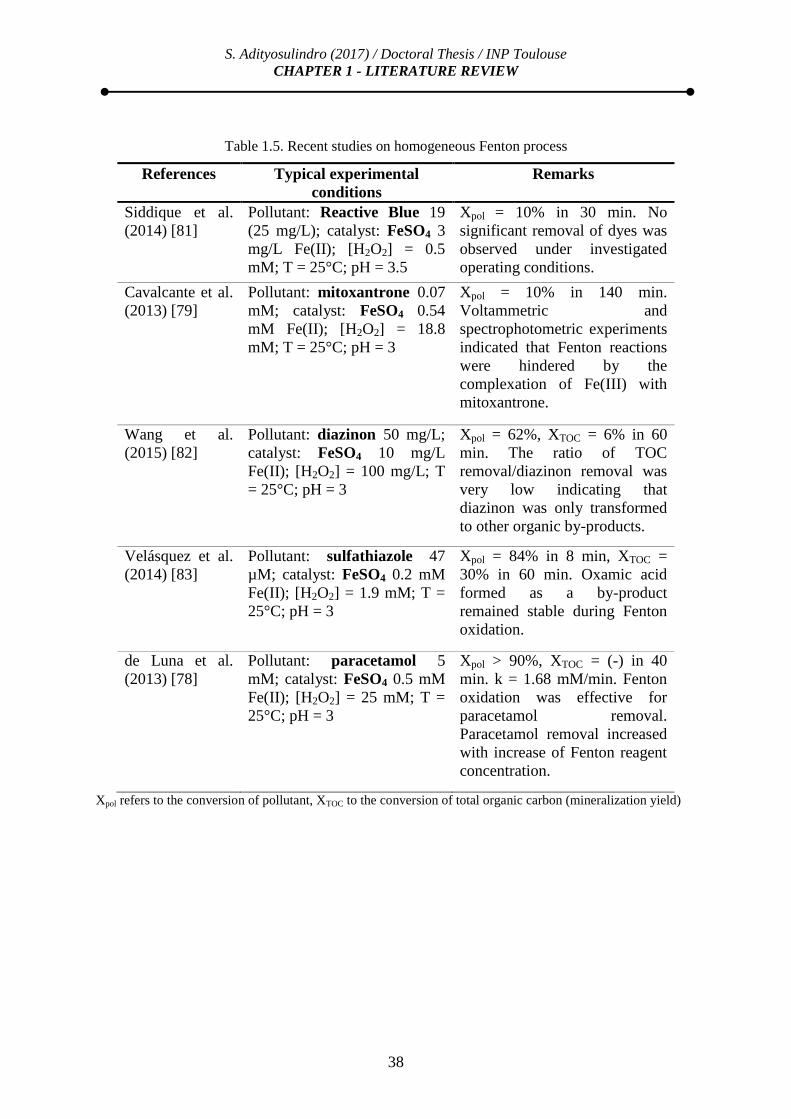
Examples of recent studies ( 2013) about homogeneous Fenton oxidation of organic
compounds are given in table 1.5. Homogeneous Fenton reaction was found to be effective
for the removal of pharmaceuticals [77,78]; however, the conversion and mineralization yield
depended on the target pollutant [79].
Some recent studies ( 2000) on heterogeneous Fenton oxidation are summarized in
table 1.6: on the whole they exhibited slower degradation rates than the homogeneous system
(see table 1.5), as shown by longer reaction times to yield significant Xpol and XTOC. For
instance, Kusić et al [80] reported that the removal rate of phenol was much slower in
heterogeneous Fenton oxidation using Fe-ZSM5 than in homogeneous Fenton process
performed under similar theoretical total iron concentration, as complete pollutant conversion
required 30 and 2 min, respectively. Despite of its advantages described above, the
application of the heterogeneous process thus requires activation techniques to improve its
performance.
S. Adityosulindro (2017) / Doctoral Thesis / INP Toulouse
CHAPTER 1 - LITERATURE REVIEW
38
Table 1.5. Recent studies on homogeneous Fenton process
References Typical experimental
conditions
Remarks
Siddique et al.
(2014) [81]
Pollutant: Reactive Blue 19
(25 mg/L); catalyst: FeSO4 3
mg/L Fe(II); [H2O2] = 0.5
mM; T = 25°C; pH = 3.5
Xpol = 10% in 30 min. No
significant removal of dyes was
observed under investigated
operating conditions.
Cavalcante et al.
(2013) [79]
Pollutant: mitoxantrone 0.07
mM; catalyst: FeSO4 0.54
mM Fe(II); [H2O2] = 18.8
mM; T = 25°C; pH = 3
Xpol = 10% in 140 min.
Voltammetric and
spectrophotometric experiments
indicated that Fenton reactions
were hindered by the
complexation of Fe(III) with
mitoxantrone.
Wang et al.
(2015) [82]
Pollutant: diazinon 50 mg/L;
catalyst: FeSO4 10 mg/L
Fe(II); [H2O2] = 100 mg/L; T
= 25°C; pH = 3
Xpol = 62%, XTOC = 6% in 60
min. The ratio of TOC
removal/diazinon removal was
very low indicating that
diazinon was only transformed
to other organic by-products.
Velásquez et al.
(2014) [83]
Pollutant: sulfathiazole 47
µM; catalyst: FeSO4 0.2 mM
Fe(II); [H2O2] = 1.9 mM; T =
25°C; pH = 3
Xpol = 84% in 8 min, XTOC =
30% in 60 min. Oxamic acid
formed as a by-product
remained stable during Fenton
oxidation.
de Luna et al.
(2013) [78]
Pollutant: paracetamol 5
mM; catalyst: FeSO4 0.5 mM
Fe(II); [H2O2] = 25 mM; T =
25°C; pH = 3
Xpol > 90%, XTOC = (-) in 40
min. k = 1.68 mM/min. Fenton
oxidation was effective for
paracetamol removal.
Paracetamol removal increased
with increase of Fenton reagent
concentration.
Xpol refers to the conversion of pollutant, XTOC to the conversion of total organic carbon (mineralization yield)

S. Adityosulindro (2017) / Doctoral Thesis / INP Toulouse
CHAPTER 1 - LITERATURE REVIEW
39
Table 1.6. Recent studies on heterogeneous Fenton processes
Processes Typical experimental
conditions
Remarks
Centi et al. (2000)
[84]
Pollutant: propionic acid
(TOC = 30 mg/L); catalyst: Fe-
ZSM5 0.7 g/L; [H2O2] = 1.5
stoichiometric amount; T =
70°C; pH = 4
XTOC = 60% in 240 min.
Compared to the homogeneous
Fenton process, heterogeneous
process exhibited slower
degradation rate, but higher TOC
removal efficiency.
Kusić et al. (2006)
[80]
Pollutant: phenol (TOC = 80
mg/L); catalyst: Fe-ZSM5 1.5
g/L; [H2O2] = 40 mM; T =
25°C; pH = 3
Xpol = 100% in 30 min, XTOC =
45% in 60 min. Longer reaction
time (30 min vs. 2 min) was
needed by Fe-ZSM5 catalyst to
obtained similar conversion of
phenol as homogeneous system.
Zhou et al. (2008)
[85]
Pollutant: 4-chlorophenol 100
mg/L (0.8 mM); catalyst: ZVI
1 g/L (18 mM of Fe); [H2O2] =
1.7 g/L (50 mM); T = 20°C; pH
= 4
Xpol = 100%, XTOC = (-) in 30
min. The authors conclude on a
two-stage mechanism: a slow
then much faster degradation.
The latter was attributed to iron
leaching inducing homogeneous
reaction.
Velichkova et al.
(2013) [58]
Pollutant: paracetamol 0.66
mM; catalyst: Fe3O4 1 g/L;
[H2O2] = 28 mM; T = 60°C; pH
= 2.6
Xpol = 100% in 150 min, XTOC =
45% in 300 min. A small excess
of oxidant should be preferred
because of the occurrence of
scavenging effect.
Zha et al. (2014)
[73]
1.1.1.
Pollutant: amoxillin 50 mg/L
(0.14 mM); catalyst: ZVI 500
mg/L (9 mM of Fe); [H2O2] =
224 mg/L (6.6 mM); T = 30°C;
pH = 3
Xpol = 87%, XCOD = 71% in 25
min. Initial pH was the most
significant operating parameter
since it affected the extent of
Fe2+
leaching from ZVI.
Cihanoğlu et al.
(2015) [86]
Pollutant: Acetic acid (100
mg/L (1.7 mM); catalyst: Fe-
ZSM5 1.33 g/L; [H2O2] = 8.35
mM; T = 60°C; pH = 4
XTOC = 50% in 120 min. Acetic
acid degradation was accelerated
in acidic medium with the
increase in temperature, H2O2
and catalyst amount. Xpol refers to the conversion of pollutant, XTOC to the conversion of total organic carbon (mineralization yield)
S. Adityosulindro (2017) / Doctoral Thesis / INP Toulouse
CHAPTER 1 - LITERATURE REVIEW
40
1.4. SONOLYSIS AND SONO-FENTON PROCESSES
1.4.1. Principle and mechanisms
1.4.1.1. Ultrasound process
The development of ultrasound-based technology in water treatment originated from
the discovery that ultrasonic waves (at 20 kHz) were able to cause a thinning of cell walls of
microbes, attributed to the freeing of the cytoplasm membrane from the cell wall [87]. In
recent years, ultrasound has been used for water disinfection, anti-scaling treatment and algae
control [88].
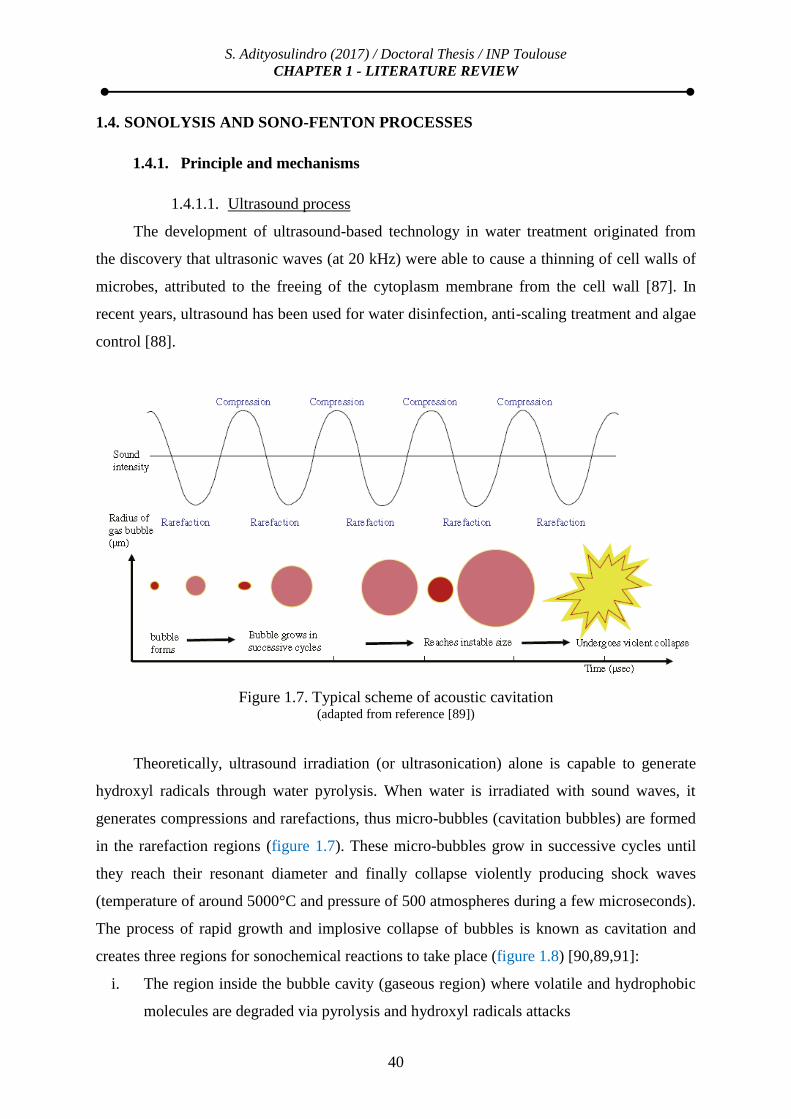
Figure 1.7. Typical scheme of acoustic cavitation (adapted from reference [89])
Theoretically, ultrasound irradiation (or ultrasonication) alone is capable to generate
hydroxyl radicals through water pyrolysis. When water is irradiated with sound waves, it
generates compressions and rarefactions, thus micro-bubbles (cavitation bubbles) are formed
in the rarefaction regions (figure 1.7). These micro-bubbles grow in successive cycles until
they reach their resonant diameter and finally collapse violently producing shock waves
(temperature of around 5000°C and pressure of 500 atmospheres during a few microseconds).
The process of rapid growth and implosive collapse of bubbles is known as cavitation and
creates three regions for sonochemical reactions to take place (figure 1.8) [90,89,91]:
i. The region inside the bubble cavity (gaseous region) where volatile and hydrophobic
molecules are degraded via pyrolysis and hydroxyl radicals attacks

S. Adityosulindro (2017) / Doctoral Thesis / INP Toulouse
CHAPTER 1 - LITERATURE REVIEW
41
ii. The region at the bubble-liquid interface where hydrophobic molecules are degraded
via hydroxyl radical attacks
iii. The liquid bulk region where free radicals formed at the bubble-liquid interface
generate secondary sonochemical reactions
Figure 1.8. General mechanism of sonochemical reactions
(adapted from reference [92])
In bubble cavity, both thermal cleavage (direct sonolysis) of organic compounds (R.1.34) and
generation of reactive radical species (R.1.36) occur [91–93]:
Organic compound + ))) → Transformation products (R.1.34)
Transformation products + ))) → CO2 + H2O (R.1.35)
H2O + ))) → OH +
H (R.1.36)
Where ))) refers to the ultrasound irradiation
OH radicals formed by water sonolysis can further react with pollutants or recombine to
form H2O2. It is well known that the resonance radius and duration of the collapse of a bubble
are lower at high frequencies (> 100 kHz) because the finite time of the rarefaction cycle is
too short to allow a bubble to grow and collapse [94]. For instance, the resonance radius of
acoustic bubble ranges from 3.3 µm at 1 MHz, 7 µm at 515 kHz and 170 µm at 20 kHz
according to linear acoustic theory [92,95]. Note, however, that in practice the size of
cavitation bubbles is usually smaller than this radius, due to the nonlinear nature of the
S. Adityosulindro (2017) / Doctoral Thesis / INP Toulouse
CHAPTER 1 - LITERATURE REVIEW
42
bubble pulsation [96]. Since the resonance radius and duration of the bubble are lower at high
frequency, OH could be ejected more efficiently from bubble cavity into liquid phase before
they have time to recombine in the cavitation bubble. In liquid bulk solution, OH can either
react with target pollutant or recombine to form H2O2. At low US frequency (especially in the
typical 20-40 kHz range), bigger and long-lived bubbles are formed and OH are
preferentially recombined or even scavenged by other radicals in bubble cavity and bubble-
liquid interface causing smaller portion of OH ejected into bulk solution. Under this
condition, only volatile and hydrophobic compounds which easily diffuse into bubble cavity
or interface can be degraded (figure 1.8) [92]. Apart from that, low frequency ultrasound
bubble has sufficient rarefaction time to grow, thus results a in more violent collapse,
generating shockwave and favoring mechanical effects [89].
Numerous works have been devoted to the sonolysis of organic compounds. Various
ultrasound frequencies (fUS) ranging from 20 kHz to 1200 kHz have been used [40,41,97–
106]. However, most studies used a single frequency, and only a few investigated different
frequencies [41,99,100,103–107]. Based on their conclusions, the optimum frequency range
in sonochemical processes seems to be molecule- and transducer-dependent. Degradation of
volatile compounds are favored at low frequencies [103], while removal of non-volatile
compounds usually increased with increasing frequencies [41,99,100,104–106]. However,
there exists an optimum frequency beyond which negative effects of frequency on
degradation rates are observed [99,100,104,108,109]. In addition, even some ultrasound
transducer are multi-frequency, the effective power may be very low at working limits (at
low and high frequency limit) [100,108] that may explain why the optimum frequency for
sonochemical process is normally around 580 – 860 kHz. In any cases, the comparison of low
and high frequency ultrasound is still rarely studied [110,111].
Regarding the effect of ultrasound power, some researchers reported the existence of
optimum value, beyond which sonochemical effect is reduced because of the scattering effect
and/or coalescence of cavitation bubbles resulting into lower collapse pressure [92,112].
Similar to ultrasound frequency, the optimum ultrasound power in sonochemical processes
seems to be transducer-dependent.
1.4.1.2. Activation of Fenton reaction by ultrasound
However, due to the low mineralization yield and high energy consumption of
ultrasound, it is usually not recommended as single treatment [92,97,100,111]. On the other

S. Adityosulindro (2017) / Doctoral Thesis / INP Toulouse
CHAPTER 1 - LITERATURE REVIEW
43
hand, there is a strong interest in combining it with other AOPs such as Fenton reaction and
taking advantage of possible beneficial synergistic effects for reducing treatment time and
chemical costs [82,113–115].
Indeed, in situ hydrogen peroxide generated from ultrasound can react with Fe2+
,
producing OH in the solution bulk that can more easily react with the contaminants (R.1.1).
Ultrasound also enhances the decomposition of Fe-OOH2+
into Fe2+
and hydroperoxyl
radicals [93] (R.1.37):
Fe-OOH2+
+ ))) → Fe2+
+ OOH (R.1.37)
Moreover, hydrogen radicals (H) formed by water sonolysis can react either with hydrogen
peroxide, ferric ion, hydroperoxyl radicals or hydroxyl radical to produce hydroxyl radical,
ferrous iron, hydrogen peroxide, or water respectively [116]:
H + H2O2 →
OH + H2O (R.1.38)
Fe3+
+ H → Fe
2+ + H
+ (R.1.39)
H +
OOH → H2O2 (R.1.40)
OH +
H → H2O (R.1.41)
Ferrous ion produced from (R.1.37) and (R.1.39) can react subsequently with hydrogen
peroxide, as per Fenton oxidation mechanism.
With heterogeneous catalysts, the sono-Fenton reactions are similar to those reported
for the homogenous system, but they occur on the catalyst surface [117]. A coupling of
heterogeneous catalyst with low frequency ultrasound can also be interesting since the
ultrasonic irradiation may (i) improve mixing and decrease mass transfer limitation, (ii)
reduce the particle size of heterogeneous catalysts leading to a higher amount of available
catalyst active sites, and (iii) promotes a continuous cleaning of the solid catalyst surface. In
addition, the presence of solid particles provides additional nuclei enhancing cavitation
phenomena [118–122]. However it can also result into ultrasound attenuation by scattering
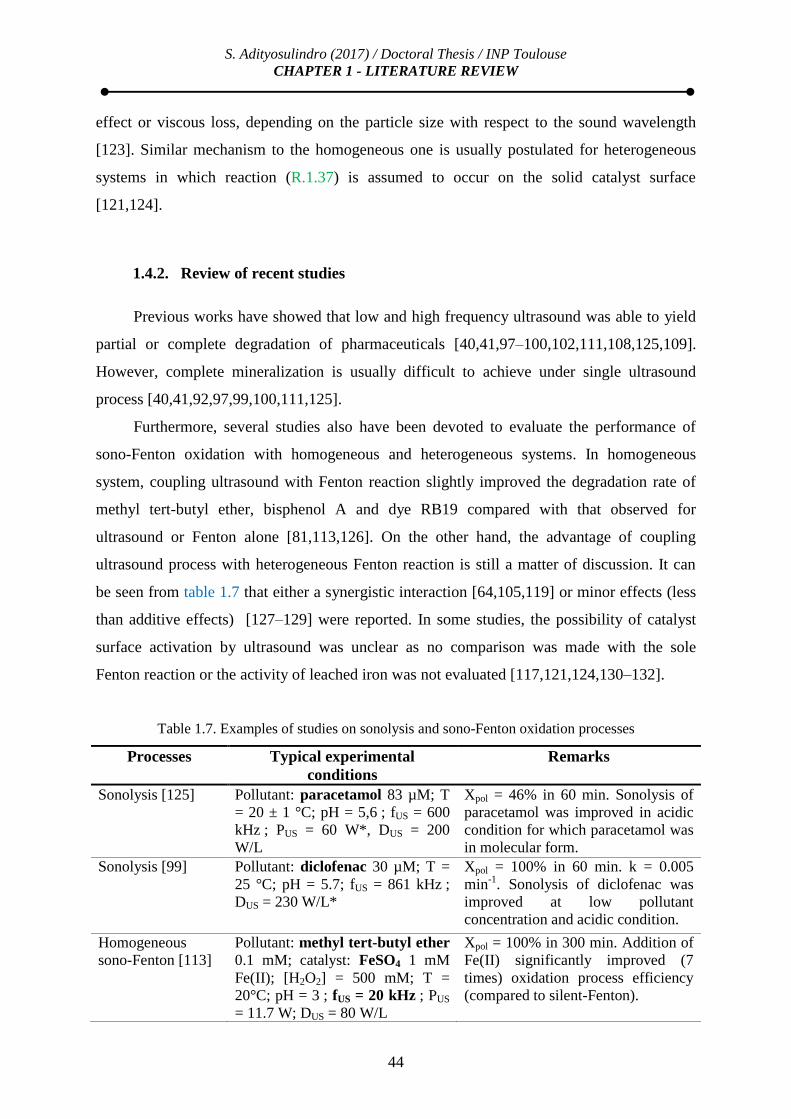
S. Adityosulindro (2017) / Doctoral Thesis / INP Toulouse
CHAPTER 1 - LITERATURE REVIEW
44
effect or viscous loss, depending on the particle size with respect to the sound wavelength
[123]. Similar mechanism to the homogeneous one is usually postulated for heterogeneous
systems in which reaction (R.1.37) is assumed to occur on the solid catalyst surface
[121,124].
1.4.2. Review of recent studies
Previous works have showed that low and high frequency ultrasound was able to yield
partial or complete degradation of pharmaceuticals [40,41,97–100,102,111,108,125,109].
However, complete mineralization is usually difficult to achieve under single ultrasound
process [40,41,92,97,99,100,111,125].
Furthermore, several studies also have been devoted to evaluate the performance of
sono-Fenton oxidation with homogeneous and heterogeneous systems. In homogeneous
system, coupling ultrasound with Fenton reaction slightly improved the degradation rate of
methyl tert-butyl ether, bisphenol A and dye RB19 compared with that observed for
ultrasound or Fenton alone [81,113,126]. On the other hand, the advantage of coupling
ultrasound process with heterogeneous Fenton reaction is still a matter of discussion. It can
be seen from table 1.7 that either a synergistic interaction [64,105,119] or minor effects (less
than additive effects) [127–129] were reported. In some studies, the possibility of catalyst
surface activation by ultrasound was unclear as no comparison was made with the sole
Fenton reaction or the activity of leached iron was not evaluated [117,121,124,130–132].
Table 1.7. Examples of studies on sonolysis and sono-Fenton oxidation processes
Processes Typical experimental
conditions
Remarks
Sonolysis [125] Pollutant: paracetamol 83 µM; T
= 20 ± 1 °C; pH = 5,6 ; fUS = 600
kHz ; PUS = 60 W*, DUS = 200
W/L
Xpol = 46% in 60 min. Sonolysis of
paracetamol was improved in acidic
condition for which paracetamol was
in molecular form.
Sonolysis [99] Pollutant: diclofenac 30 µM; T =
25 °C; pH = 5.7; fUS = 861 kHz ;
DUS = 230 W/L*
Xpol = 100% in 60 min. k = 0.005
min-1. Sonolysis of diclofenac was
improved at low pollutant
concentration and acidic condition.
Homogeneous
sono-Fenton [113]
Pollutant: methyl tert-butyl ether
0.1 mM; catalyst: FeSO4 1 mM
Fe(II); [H2O2] = 500 mM; T =
20°C; pH = 3 ; fUS = 20 kHz ; PUS
= 11.7 W; DUS = 80 W/L
Xpol = 100% in 300 min. Addition of
Fe(II) significantly improved (7
times) oxidation process efficiency
(compared to silent-Fenton).

S. Adityosulindro (2017) / Doctoral Thesis / INP Toulouse
CHAPTER 1 - LITERATURE REVIEW
45
Homogeneous
sono-Fenton [81]
Pollutant: RB 19 0.04 mM;
Catalyst: FeSO4 3 mg/L Fe(II);
[H2O2] = 0.5 mM ; pH = 3.5 ; fUS
= 20 kHz; PUS = 45.6 W; IUS = 8
W/cm2; DUS = 50 W/L
Xpol = 78% in 30 min.
Synergistic interaction between
ultrasound and Fenton was observed.
The decoloration of dye solution in-
creased with the increase of
hydrogen peroxide concentration,
ultrasonic power and iron sulfate
concentration, but decreased by
increasing the initial dye
concentration.
Heterogeneous
sono-Fenton [105]
Pollutant: 4-chlorophenol 100
mg/L; catalyst: iron powders
(slag) 1 g/L; [H2O2] = 3 mM; T =
30°C; fUS = 200 kHz; PUS = 50
W*; DUS = 50 W/L
Xpol = 40% in 60 min. The addition
of iron powder and H2O2
significantly enhanced the
degradation rate compared to
ultrasound only.
Heterogeneous
sono-Fenton [127]
Pollutant: 2,4-
dichlorophenoxyacetic acid 1.1
mM; catalyst: ZVI 0.6 g/L; [H2O2]
= 85.5 mM; T = 22°C; pH = 3 ; fUS
= 20 kHz ; PUS = 45 W*; IUS =
57.3 W/cm2; DUS = 150 W/L
XTOC = 64% in 60 min. Low
frequency ultrasound slightly
improved Fenton oxidation process
efficiency (7% improvement with
respect to sole Fenton process).
Heterogeneous
sono-Fenton [121]
Pollutant: C.I. Acid Orange 7
0.23 mM; catalyst: goethite 0.2
g/L; [H2O2] = 7.8 mM ; T = 20°C ;
pH = 3; fUS = 20 kHz; PUS = 20
W*; IUS = 25.5 W/cm2; DUS = 80
W/L
Xpol = 100% in 30 min; XTOC = 42%
in 90 min. Hydrogen peroxide
concentration and pH played an
important role in the degradation
process
Heterogeneous
sono-Fenton [117]
Pollutant: phenol 2.5 mM;
catalyst: Fe2O3/SBA-15 0.6 g/L;
[H2O2] = 70 mM; T = 25°C; pH =
3; fUS = 584 kHz; DUS = 29 W/L*
XTOC = 30% in 240 min;
Heterogeneous sono-Fenton was
more effective than heterogeneous
Fenton and US/H2O2 processes.
Ultrasound frequency of 584 kHz
was better than 20 kHz and 1142
kHz.
Heterogeneous
sono-Fenton [119]
Pollutant: bisphenol A 0.09 mM;
catalyst: Fe3O4 0.6 g/L; [H2O2] =
160 mM; T = 35+1°C; pH = 3; fUS
= 40 kHz ; PUS = 100 W
Xpol = 95%, XTOC = 45% in 480 min.
Coupling of heterogeneous Fenton
reaction and ultrasound was very
synergic (increase of the removal
efficiency by up to 4 times compared
to the separate processes).
Heterogeneous
sono-Fenton [129]
Pollutant: C.I. Acid Orange 7
0.14 mM; Catalyst: Fe-ZSM5 ([Fe
equivalent] = 0.1 mM); [H2O2] = 5
mM; fUS = 850 kHz; PUS = 22.3
W*; DUS = 112 W/L
Xpol = 47% in 120 min. Degradation
of C.I. Acid Orange 7 under sono-
Fenton was dominated by US/H2O2
process
*Ultrasound (US) power measured by calorimetry
Xpol refers to the conversion of pollutant, XTOC to the conversion of total organic carbon (mineralization yield)
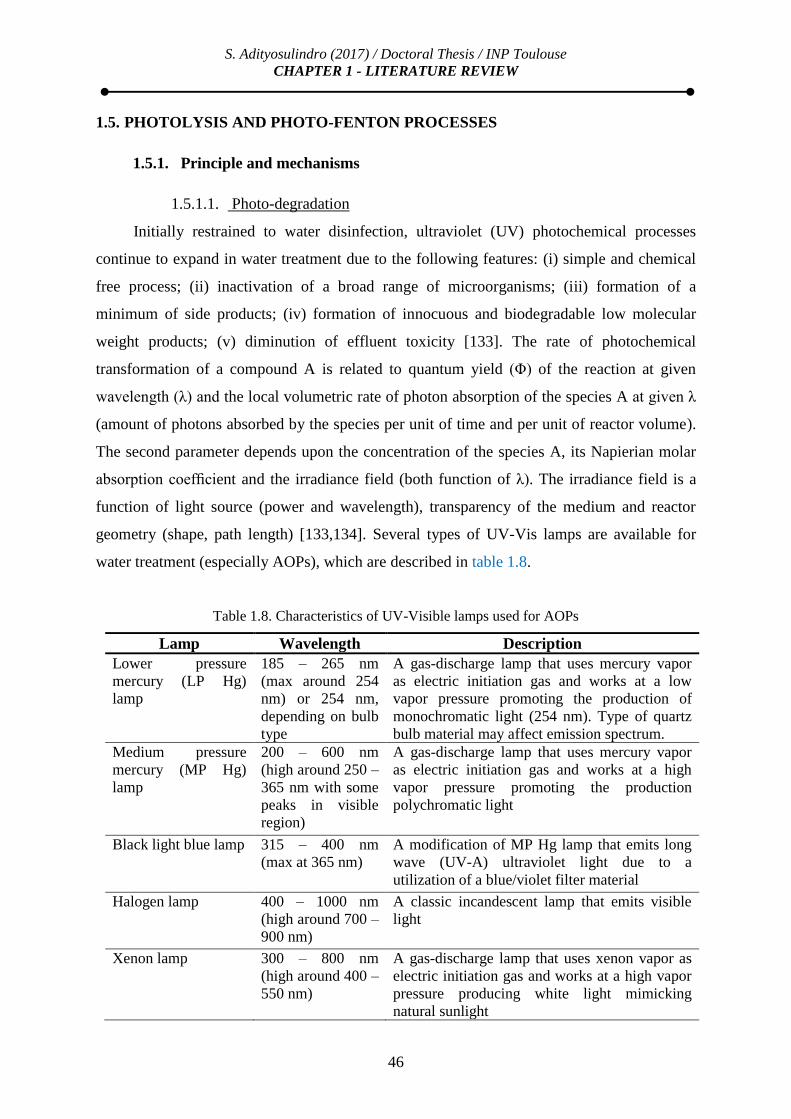
S. Adityosulindro (2017) / Doctoral Thesis / INP Toulouse
CHAPTER 1 - LITERATURE REVIEW
46
1.5. PHOTOLYSIS AND PHOTO-FENTON PROCESSES
1.5.1. Principle and mechanisms
1.5.1.1. Photo-degradation
Initially restrained to water disinfection, ultraviolet (UV) photochemical processes
continue to expand in water treatment due to the following features: (i) simple and chemical
free process; (ii) inactivation of a broad range of microorganisms; (iii) formation of a
minimum of side products; (iv) formation of innocuous and biodegradable low molecular
weight products; (v) diminution of effluent toxicity [133]. The rate of photochemical
transformation of a compound A is related to quantum yield (Φ) of the reaction at given
wavelength (λ) and the local volumetric rate of photon absorption of the species A at given λ
(amount of photons absorbed by the species per unit of time and per unit of reactor volume).
The second parameter depends upon the concentration of the species A, its Napierian molar
absorption coefficient and the irradiance field (both function of λ). The irradiance field is a
function of light source (power and wavelength), transparency of the medium and reactor
geometry (shape, path length) [133,134]. Several types of UV-Vis lamps are available for
water treatment (especially AOPs), which are described in table 1.8.
Table 1.8. Characteristics of UV-Visible lamps used for AOPs
Lamp Wavelength Description
Lower pressure
mercury (LP Hg)
lamp
185 – 265 nm
(max around 254
nm) or 254 nm,
depending on bulb
type
A gas-discharge lamp that uses mercury vapor
as electric initiation gas and works at a low
vapor pressure promoting the production of
monochromatic light (254 nm). Type of quartz
bulb material may affect emission spectrum.
Medium pressure
mercury (MP Hg)
lamp
200 – 600 nm
(high around 250 –
365 nm with some
peaks in visible
region)
A gas-discharge lamp that uses mercury vapor
as electric initiation gas and works at a high
vapor pressure promoting the production
polychromatic light
Black light blue lamp 315 – 400 nm
(max at 365 nm)
A modification of MP Hg lamp that emits long
wave (UV-A) ultraviolet light due to a
utilization of a blue/violet filter material
Halogen lamp 400 – 1000 nm
(high around 700 –
900 nm)
A classic incandescent lamp that emits visible
light
Xenon lamp 300 – 800 nm
(high around 400 –
550 nm)
A gas-discharge lamp that uses xenon vapor as
electric initiation gas and works at a high vapor
pressure producing white light mimicking
natural sunlight

S. Adityosulindro (2017) / Doctoral Thesis / INP Toulouse
CHAPTER 1 - LITERATURE REVIEW
47
Excimer lamp 108 – 351 nm Quasi monochromatic light sources that can
operate over a wide range of wavelengths in the
ultraviolet (UV) and vacuum ultraviolet (VUV)
spectral regions
The first mechanism implied in UV-Vis activated oxidation processes is the direct
photolysis of the pollutant. Under light irradiation, organic compounds are transform into
their excited singlet states then undergo degradation process through homolysis, heterolysis
or photoionization [133,135,136] :
RH + hv (λ depending on the molecule) → (RH)* (R.1.42)
(RH)* → Transformation products (R.1.43)
Where hv refers to the light irradiation and ()* refers to excited state
Furthermore, the excited state of the pollutant can undergo photo-sensitization reactions
generating a high energy form of oxygen (called singlet molecular oxygen (1O2)) [133,135] or
producing active radicals [137,138] according to following reactions :
RH* + 3O2 → RH +
1O2 (R.1.44)
RH + 1O2 → Transformation products (R.1.45)
RH* + O2 → RH+
+ O2-
(R.1.46)
2O2-
+ 2H+ → H2O2 + O2 (R.1.47)
H2O2 + hv (λ = 185 – 300 nm) → 2 OH (R.1.48)
OH / O2
- + RH → Transformation products (R.1.49)
In addition, if the light irradiation emits light near vacuum UV spectrum, OH can be formed
[42,44,139–141] according to reactions:

S. Adityosulindro (2017) / Doctoral Thesis / INP Toulouse
CHAPTER 1 - LITERATURE REVIEW
48
H2O + hv (λ < 235 nm) → (H2O)* (R.1.50)
(H2O)* → H +
OH + H
+ + eaq
- (R.1.51)
1.5.1.2. Activation of Fenton reaction by (UV/Vis) light
In previous studies, UV photolysis has been used in combination with H2O2, ozone and
Fenton reaction [18,142,143] in order to improve pollutant removal and mineralization rate.
In the presence of Fenton reagent, not only photo-decomposition of H2O2 occurs (R.1.48), but
also other reactions including photo-reduction of ferric ions (R.1.52), photo-reduction of
iron(III)-hydroxo complexes (R.1.53-R.1.54) and photo-reduction of ferric-H2O2 complex
(R.1.55) [63,144–148]:
Fe3+
+ H2O + hv (λ < 300 nm, λmax = 240 nm) → Fe2+
+ OH + H
+ (pH < 4) (R.1.52)
Fe(OH)2+
+ hv (λ=200–400 nm, λmax = 205; 297 nm) → Fe2+
+ OH (pH = 2–4) (R.1.53)
Fe2(OH)24+
+ hv (λ<400 nm, λmax = 335 nm) → Fe3+
+ Fe2+
+ OH (pH > 3) (R.1.54)
Fe-OOH2+
+ hv (λ=180 – 550 nm) → Fe2+
+ OOH (R.1.55)
In addition, photo-decarboxylation of the ferric carboxylates formed by complexation of
ferric ions with organic ligands is also possible under UV-A and visible light [149–152]:
[FeIII
(RCO2)]2+
+ hv (λ = 365 – 600 nm) → Fe2+
+ RCOO (R.1.56)
Reactions (R.1.52) to (R.1.55) are promoted in different wavelength ranges, and tables 1.9
and 1.10 report their quantum yields Φ.
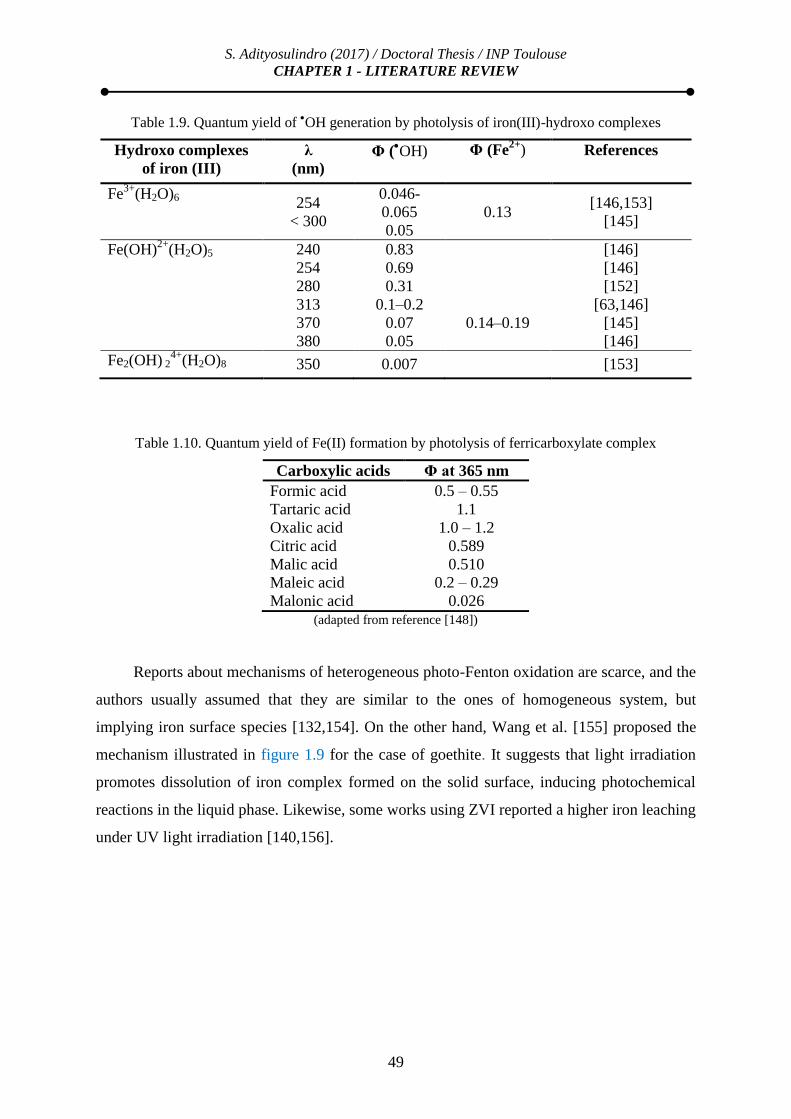
S. Adityosulindro (2017) / Doctoral Thesis / INP Toulouse
CHAPTER 1 - LITERATURE REVIEW
49
Table 1.9. Quantum yield of OH generation by photolysis of iron(III)-hydroxo complexes
Hydroxo complexes
of iron (III)
λ
(nm) Φ (
OH) Φ (Fe
2+) References
Fe3+
(H2O)6
254
< 300
0.046-
0.065
0.05
0.13 [146,153]
[145]
Fe(OH)2+
(H2O)5
240
254
280
313
370
380
0.83
0.69
0.31
0.1–0.2
0.07
0.05
0.14–0.19
[146]
[146]
[152]
[63,146]
[145]
[146]
Fe2(OH) 24+
(H2O)8 350 0.007 [153]
Table 1.10. Quantum yield of Fe(II) formation by photolysis of ferricarboxylate complex
Carboxylic acids Φ at 365 nm
Formic acid 0.5 – 0.55
Tartaric acid 1.1
Oxalic acid 1.0 – 1.2
Citric acid 0.589
Malic acid 0.510
Maleic acid 0.2 – 0.29
Malonic acid 0.026 (adapted from reference [148])
Reports about mechanisms of heterogeneous photo-Fenton oxidation are scarce, and the
authors usually assumed that they are similar to the ones of homogeneous system, but
implying iron surface species [132,154]. On the other hand, Wang et al. [155] proposed the
mechanism illustrated in figure 1.9 for the case of goethite. It suggests that light irradiation
promotes dissolution of iron complex formed on the solid surface, inducing photochemical
reactions in the liquid phase. Likewise, some works using ZVI reported a higher iron leaching
under UV light irradiation [140,156].

S. Adityosulindro (2017) / Doctoral Thesis / INP Toulouse
CHAPTER 1 - LITERATURE REVIEW
50
Figure 1.9. Mechanism of photo-reductive dissolution of Fe(III) complex on goethite (adapted from reference [151,155])
1.5.2. Review of recent studies
Recent studies on photolysis, UV/H2O2 and photo-Fenton are summarized in table 1.11.
Some researchers reported that UV irradiation is effective for removal of pharmaceuticals due
to their high absorption in the UV-C spectrum region (λ=200 – 280 nm). Addition of H2O2 on
UV photolysis was also found beneficial, but the enhancement is dependent on the molecule
sensitivity to direct photolysis [18,42,142,157]. Regarding photo-Fenton process, coupling
light irradiation and homogeneous Fenton reaction was usually beneficial [67,158,159].
Conversely, real synergistic interaction in heterogeneous photo-Fenton is still subject of
debate. Numerous studies observed that heterogeneous photo-Fenton was more efficient than
heterogeneous Fenton oxidation [80,132,154,160–166]. However, some of them concluded
that the enhancement was due to the UV/H2O2 reaction [161–163], or reported a significant
contribution of iron leaching [164–166]. The latter is rather difficult to assess considering the
evolution of iron concentration and speciation during the reaction [161]. Therefore, more
studies are needed to evaluate the possible synergistic effect and get better understanding in
the involved mechanisms.

S. Adityosulindro (2017) / Doctoral Thesis / INP Toulouse
CHAPTER 1 - LITERATURE REVIEW
51
Table 1.11. Examples of studies on photolysis and photo-Fenton oxidation processes
Process Typical experimental conditions Remarks
Photolysis [18] Pollutant: naproxen (NPX) 10 mg/L
and carbamazepine (CBP) 7 mg/L;
T = 25°C ; pH = 7; MP Hg lamp ;
PUV = 1000 W
k = 0.29 min-1 (NPX), k = 0.004 min-1
(CBP). Photolysis degradation of
naproxen was faster than carbamazepine
due to higher UV absorbance in UV-C
region.
Photolysis
[142]
Pollutant: 5-methyl-1,3,4-
thiadiazole-2-methylthio (MMTD)
1 - 100 mg/L; T = 25°C; LP Hg
lamp ; PUV = 17 W; λ = 254 nm
(2.8x10⁻⁶ Einstein/s)
XPol > 90% (for C0=1 mg/L), XPol = 40%
(for C0=100 mg/L). MMTD degradation
rate and yield increased with decrease in
initial concentration of pollutant.
UV/H2O2 [18] Pollutant: naproxen (NPX) 10 mg/L
and carbamazepine (CBP) 7 mg/L;
[H2O2] = 50 mg/L; T = 25°C; pH = 7;
MP Hg lamp ; PUV = 1000 W
k = 0.69 min-1 (NPX), k = 0.70 min-1
(CBP). Effect of H2O2 addition on
photolysis process was more remarkable
for less photo-degradable compound
such as carbamazepine.
Homogeneous
photo-Fenton
[159]
Pollutant: sulfamonomethoxine 4.5
mg/L ; catalyst : Fe2+ 0.02 mM;
[H2O2] = 0.49 mM; T = 25°C; pH =
4; PUV = 12 W; λ = 365 nm
XPol = 98%, XTOC = 99% in 120 min.
Degradation of SMMS in photo-Fenton
process was described by first-order
kinetics, and the apparent activation
energy was 23.95 kJ/mol.
Homogeneous
photo-Fenton
[158]
Pollutant: valproate 0.35 mM; [Fe2+]
= 0.18 mM; [H2O2] = 4.4 mM; pH =
3; T = 25°C; UV-C lamp; λ = 254
nm; PUV = 24W (1.85 x 10⁻⁵ E/s)
Xpol = 100%, XTOC = 76.3% in 120 min.
Photo-Fenton reaction was more
effective under UV-A than visible light
Heterogeneous
photo-Fenton
[160]
Pollutant: phenol 1 mM ; catalyst:
Fe-laponite 1 g/L; [H2O2] = 50 mM ;
T = 30°C ; pH = 3; UV-C and UV-A
lamps ; PUVC = 15 W; λUVC = 254 nm;
PUVC = 40 W; λUVC = 365 nm
Xpol = 100% in 5 min (UV-C) and Xpol =
100% in 25 min (UV-A). Fast
degradation of phenol was observed
under UV-C irradiation due to the
contribution of UV/H2O2 reaction. On
the other hand, synergistic effect was
clearly observed under UV-A light.
Contribution of iron leaching was also
negligible.
Heterogeneous
photo-Fenton
[161]
Pollutant: reactive red HE-38 100
mg/L ; Catalyst: Fe-laponite 1 g/L;
[H2O2] = 500 mg/L ; T = 30°C; pH =
3; UV-C lamp; PUVC = 16 W; λUVC =
254 nm
XTOC = 76% in 120 min.
Additive interaction between Fenton and
UV/H2O2 reactions was observed in
terms of TOC mineralization.
Heterogeneous
photo-Fenton
[80]
Pollutant: phenol 1 mM ; catalyst:
Fe-ZSM5 1.5 g/L (1 mM of Fe);
[H2O2] = 40 mM ; T = 25°C ; pH = 3;
LP Hg lam ; PUV = 125 W; λ = 254
nm (0.34x10⁻⁵ E/s)
XPol = 100%, XTOC = 86% in 60 min. UV
irradiation enhanced TOC removal of
heterogeneous Fenton oxidation by up to
43%. However, no comparison with UV
or UV/H2O2 alone.
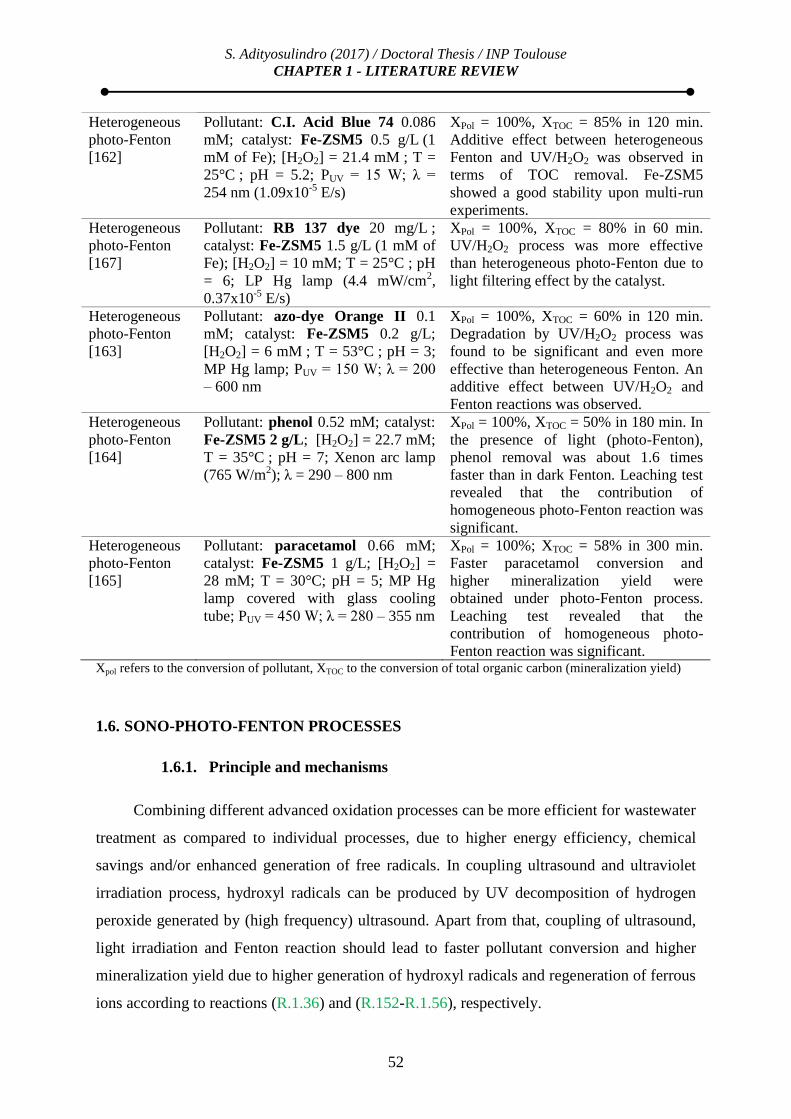
S. Adityosulindro (2017) / Doctoral Thesis / INP Toulouse
CHAPTER 1 - LITERATURE REVIEW
52
Heterogeneous
photo-Fenton
[162]
Pollutant: C.I. Acid Blue 74 0.086
mM; catalyst: Fe-ZSM5 0.5 g/L (1
mM of Fe); [H2O2] = 21.4 mM ; T =
25°C ; pH = 5.2; PUV = 15 W; λ =
254 nm (1.09x10⁻⁵ E/s)
XPol = 100%, XTOC = 85% in 120 min.
Additive effect between heterogeneous
Fenton and UV/H2O2 was observed in
terms of TOC removal. Fe-ZSM5
showed a good stability upon multi-run
experiments.
Heterogeneous
photo-Fenton
[167]
Pollutant: RB 137 dye 20 mg/L ;
catalyst: Fe-ZSM5 1.5 g/L (1 mM of
Fe); [H2O2] = 10 mM; T = 25°C ; pH
= 6; LP Hg lamp (4.4 mW/cm2,
0.37x10⁻⁵ E/s)
XPol = 100%, XTOC = 80% in 60 min.
UV/H2O2 process was more effective
than heterogeneous photo-Fenton due to
light filtering effect by the catalyst.
Heterogeneous
photo-Fenton
[163]
Pollutant: azo-dye Orange II 0.1
mM; catalyst: Fe-ZSM5 0.2 g/L;
[H2O2] = 6 mM ; T = 53°C ; pH = 3;
MP Hg lamp; PUV = 150 W; λ = 200
– 600 nm
XPol = 100%, XTOC = 60% in 120 min.
Degradation by UV/H2O2 process was
found to be significant and even more
effective than heterogeneous Fenton. An
additive effect between UV/H2O2 and
Fenton reactions was observed.
Heterogeneous
photo-Fenton
[164]
Pollutant: phenol 0.52 mM; catalyst:
Fe-ZSM5 2 g/L; [H2O2] = 22.7 mM;
T = 35°C ; pH = 7; Xenon arc lamp
(765 W/m2); λ = 290 – 800 nm
XPol = 100%, XTOC = 50% in 180 min. In
the presence of light (photo-Fenton),
phenol removal was about 1.6 times
faster than in dark Fenton. Leaching test
revealed that the contribution of
homogeneous photo-Fenton reaction was
significant.
Heterogeneous
photo-Fenton
[165]
Pollutant: paracetamol 0.66 mM;
catalyst: Fe-ZSM5 1 g/L; [H2O2] =
28 mM; T = 30°C; pH = 5; MP Hg
lamp covered with glass cooling
tube; PUV = 450 W; λ = 280 – 355 nm
XPol = 100%; XTOC = 58% in 300 min.
Faster paracetamol conversion and
higher mineralization yield were
obtained under photo-Fenton process.
Leaching test revealed that the
contribution of homogeneous photo-
Fenton reaction was significant. Xpol refers to the conversion of pollutant, XTOC to the conversion of total organic carbon (mineralization yield)
1.6. SONO-PHOTO-FENTON PROCESSES
1.6.1. Principle and mechanisms
Combining different advanced oxidation processes can be more efficient for wastewater
treatment as compared to individual processes, due to higher energy efficiency, chemical
savings and/or enhanced generation of free radicals. In coupling ultrasound and ultraviolet
irradiation process, hydroxyl radicals can be produced by UV decomposition of hydrogen
peroxide generated by (high frequency) ultrasound. Apart from that, coupling of ultrasound,
light irradiation and Fenton reaction should lead to faster pollutant conversion and higher
mineralization yield due to higher generation of hydroxyl radicals and regeneration of ferrous
ions according to reactions (R.1.36) and (R.152-R.1.56), respectively.

S. Adityosulindro (2017) / Doctoral Thesis / INP Toulouse
CHAPTER 1 - LITERATURE REVIEW
53
Figure 1.10. Schematic illustration of bisphenol A (BPA) mineralization under ultrasound/solar
light/Fe(II) process (adapted from reference [126])
Possible mechanisms involved in the homogeneous sono-photo-Fenton oxidation are
illustrated in figure 1.10 for bisphenol A (BPA) [126]. The proposed pathways mainly
combine those reported for the separate processes. In this scheme, OH radicals generated
from sonolysis of water oxidize BPA into more hydrophilic products at the bubble surface.
These intermediates are degraded mainly in the solution bulk by OH radicals coming from
the photo-Fenton reaction (h/H2O2/Fe2+
). This reaction is possible thanks to in-situ
generation of H2O2 by ultrasound (no external H2O2 addition in this case). On the other hand,
Fe3+
can form complex with aliphatic acids, but they are rapidly decomposed in the presence
of light. Fe2+
regeneration is improved by light irradiation and possibly ultrasound, generating
additional OH radicals.

S. Adityosulindro (2017) / Doctoral Thesis / INP Toulouse
CHAPTER 1 - LITERATURE REVIEW
54
1.6.2. Review of recent studies
Some contradictory findings are actually present in the literature. Only seven of the
eleven studies (table 1.12) observed a net synergistic effect [126,168–172], while in others
the effect of ultrasound was found to be marginal. This indicates a possible predominant
effect of photo-Fenton over sono-Fenton process in some cases [33,43,173,174]. In addition,
it worth noting that only two studies applied external H2O2 addition, because most of the
studies were performed under high frequency ultrasound (200-300 kHz).
Table 1.12. Works related to homogeneous sono-photo-Fenton oxidation
References Typical experimental conditions Remarks Torres and
coworkers (2007)
[168]
Pollutant: bisphenol A 0.118 mM;
catalyst: FeSO4 0.1 mM Fe(II); T =
20°C; pH = 3; fUS = 300 kHz; PUS = 80
W*; IUS = 4.1 W/cm2; DUS = 267 W/L;
PUV = 25 W; λ = 254 nm (1.5·10-6
E/s); O2 saturated solutions
Xpol = 95% in 75 min, XTOC = 100%
in 240 min. Sono-photo-Fenton is
presented as the most cost-effective
treatment for mineralization of
bisphenol A.
Torres and
coworkers (2008)
[126]
Pollutant: bisphenol A 0.118 mM;
catalyst: FeSO4 0.1 mM Fe(II); [H2O2]
= 1.6 µM/min**; T = 20°C; pH = 5;
fUS = 300 kHz; PUS = 80 W*; IUS = 4.1
W/cm2; DUS = 133 W/L; PUV = 200 W;
λ = 400 – 800 nm; O2 saturated
solutions
Xpol = 92% in 75 min, XTOC = 70%
in 240 min. Sono-Fenton was more
effective in removing the initial
substrate (bisphenol), while photo-
Fenton was more effective in
degrading reaction intermediates
(TOC reduction).
Méndez-Arriaga
and cowokers
(2009) [33]
Pollutant: ibuprofen 0.039 mM;
catalyst: FeSO4 0.1 g/L Fe(II); [H2O2]
= 2.5 µmol/(L.min) (in-situ); T =
25°C; pH = 3; fUS = 300 kHz; PUS =
47* W; IUS = 3.7 W/cm2; DUS = 78
W/L; Xenon arc lamp
Xpol > 90% in 60 min, XCOD = 55%
in 240 min. The addition of
ultrasound to photo-Fenton process
did not improve ibuprofen
degradation because Fenton-like
reaction is probably favored.
Madhavan and
coworkers (2010)
[43]
Pollutant: ibuprofen 0.09 mM;
catalyst: Fe(NO3)3 0.05 mM Fe(III); T
= 20°C ; pH = 2,7; fUS = 213 kHz; PUS
= 13.75 W*; IUS = 0.6 W/cm2; DUS =
55 W/L; P(U)V = 450 W; Xenon arc
lamp
Xpol = 100% in 60 min, XTOC = 70%
in 240 min. Combination of photo-
Fenton-like oxidation and US
showed a slight improvement for
ibuprofen conversion.
Madhavan and
coworkers (2010)
[173]
Pollutant: monocrotophos 0.12 mM;
catalyst: Fe(NO3)3 0.025 mM Fe(III);
T = 25°C ; pH = 2.7; fUS = 213 kHz;
PUS = 13.75 W*; IUS = 0.6 W/cm2; DUS
= 55 W/L; P(U)V = 450 W; Xenon arc
lamp
Xpol = 100% in 40 min, XTOC = 51%
in 180 min. Performance of photo-
Fenton-like oxidation was not
improved by sonication.

S. Adityosulindro (2017) / Doctoral Thesis / INP Toulouse
CHAPTER 1 - LITERATURE REVIEW
55
Madhavan and
coworkers (2010)
[169]
Pollutant: Acid red 88 0.09 mM;
catalyst: Fe(NO3)3 0.05 mM Fe(III); T
= 25°C ; pH = 2,7; fUS = 213 kHz; PUS
= 13.75 W*; IUS = 0.6 W/cm2; DUS =
55 W/L; P(U)V = 450 W; Xenon arc
lamp
XTOC = 40% in 240 min. Synergistic
interaction between sono-Fenton
and visible light irradiation was
observed in the degradation and
mineralization of AR88.
Katsumata and
coworkers (2011)
[170]
Pollutant: linuron 0.04 mM; catalyst:
FeSO4 0.12 mM Fe(II); T = 25°C ; pH
= 3; fUS = 200 kHz; PUS = 100 W;
Light intensity = 2 mW/cm2; λUV =
320 – 410 nm
Xpol = 100% in 20 min, XTOC =
100% in 120 min. Sono-photo-
Fenton process exhibited higher
degradation and mineralization
rates than photolysis and sono-
Fenton oxidation, but the
degradation efficiency was strongly
affected by pH and catalyst
concentration.
Xu and coworkers
(2013) [171]
Pollutant: n-butyl phthalate 0.01
mM; catalyst: FeSO4 0.1 mM Fe(II); T
= 24°C pH = 2; fUS = 400 kHz; PUS =
7.5 W*; DUS = 30 W/L, λUV = 254 nm
(1.72 x 10⁻⁶ E/(L.s))
Xpol = 100% in 120 min. Synergistic
effects were observed in sono-
photo-Fenton process, due to the
enhanced generation of hydroxyl
radicals.
Madhavan and
coworkers (2013)
[172]
Pollutant: paracetamol (P) 0.07 mM;
catalyst: Fe(NO3)3 0.05 mM Fe(III); T
= 25°C; pH = 2,7; fUS = 213 kHz; PUS
= 13.75 W*; DUS = 55 W/L; PUV = 450
W; Xenon arc lamp
k = 18.6 x 10⁻⁷ M/min (P), XTOC >
80% in 180 min. Synergistic
interaction was observed in sono-
photocatalytic oxidation using Fe3+.
Sonication of paracetamol led to the
formation of hydroxylated
derivatives.
Dükkancı and
coworkers (2014)
[129]
Pollutant: C.I. Acid Orange 7 0.14
mM; catalyst: FeSO4 0.1 mM Fe(II);
[H2O2] = 5 mM; fUS = 850 kHz; PUS =
22.3 W*; DUS = 112 W/L; λUV = 254
nm
Xpol = 81% in 120 min. Synergistic
interaction between processes was
observed and decomposition of
H2O2 by UV played an important
role.
Chakma and
Moholkar (2014)
[174]
Pollutant: bisphenol A 10 mg/L;
catalyst: FeSO4 0.36 mM Fe(II);
[H2O2] = 7.85 mM; fUS = 40 kHz; DUS
= 8.71 W/L; PUV = 160 W; λUV = 365
nm
Xpol = 86.5% in 60 min. No synergy
was observed, probably due to the
predominance of UV/H2O2
reaction.
Papoutsakis and
coworkers (2015)
[115]
Pollutant: phenol 80 mg/L, diuron 100
mg/L, bisphenol A 80 mg/L; catalyst:
FeSO4 0.018 mM Fe(II); [H2O2] = 6
mM; fUS = 400 kHz; PUS = 450 W;
Solar light
Xphenol = 100% in 60 min, Xbisphenol A
= 100% in 60 min. Combined effect
between ultrasound and
photo(solar)-Fenton oxidation was
pollutant dependent: synergistic for
phenol, only additive for diuron and
detrimental for bisphenol A (photo-
Fenton predominant)
*US power measured by calorimetric, ** No external H2O2 addition if ultrasound applied
Xpol refers to the conversion of pollutant, XTOC to the conversion of total organic carbon (mineralization yield)
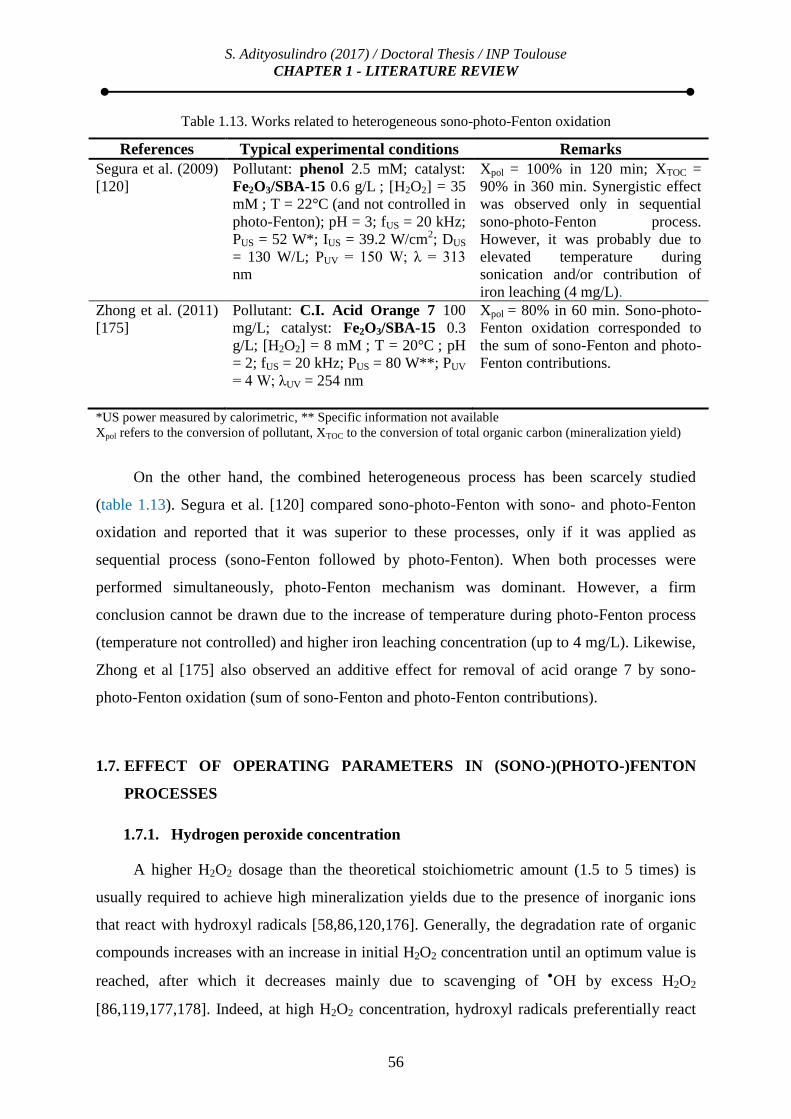
S. Adityosulindro (2017) / Doctoral Thesis / INP Toulouse
CHAPTER 1 - LITERATURE REVIEW
56
Table 1.13. Works related to heterogeneous sono-photo-Fenton oxidation
References Typical experimental conditions Remarks
Segura et al. (2009)
[120]
Pollutant: phenol 2.5 mM; catalyst:
Fe2O3/SBA-15 0.6 g/L ; [H2O2] = 35
mM ; T = 22°C (and not controlled in
photo-Fenton); pH = 3; fUS = 20 kHz;
PUS = 52 W*; IUS = 39.2 W/cm2; DUS
= 130 W/L; PUV = 150 W; λ = 313
nm
Xpol = 100% in 120 min; XTOC =
90% in 360 min. Synergistic effect
was observed only in sequential
sono-photo-Fenton process.
However, it was probably due to
elevated temperature during
sonication and/or contribution of
iron leaching (4 mg/L).
Zhong et al. (2011)
[175]
Pollutant: C.I. Acid Orange 7 100
mg/L; catalyst: Fe2O3/SBA-15 0.3
g/L; [H2O2] = 8 mM ; T = 20°C ; pH
= 2; fUS = 20 kHz; PUS = 80 W**; PUV
= 4 W; λUV = 254 nm
Xpol = 80% in 60 min. Sono-photo-
Fenton oxidation corresponded to
the sum of sono-Fenton and photo-
Fenton contributions.
*US power measured by calorimetric, ** Specific information not available
Xpol refers to the conversion of pollutant, XTOC to the conversion of total organic carbon (mineralization yield)
On the other hand, the combined heterogeneous process has been scarcely studied
(table 1.13). Segura et al. [120] compared sono-photo-Fenton with sono- and photo-Fenton
oxidation and reported that it was superior to these processes, only if it was applied as
sequential process (sono-Fenton followed by photo-Fenton). When both processes were
performed simultaneously, photo-Fenton mechanism was dominant. However, a firm
conclusion cannot be drawn due to the increase of temperature during photo-Fenton process
(temperature not controlled) and higher iron leaching concentration (up to 4 mg/L). Likewise,
Zhong et al [175] also observed an additive effect for removal of acid orange 7 by sono-
photo-Fenton oxidation (sum of sono-Fenton and photo-Fenton contributions).
1.7. EFFECT OF OPERATING PARAMETERS IN (SONO-)(PHOTO-)FENTON
PROCESSES
1.7.1. Hydrogen peroxide concentration
A higher H2O2 dosage than the theoretical stoichiometric amount (1.5 to 5 times) is
usually required to achieve high mineralization yields due to the presence of inorganic ions
that react with hydroxyl radicals [58,86,120,176]. Generally, the degradation rate of organic
compounds increases with an increase in initial H2O2 concentration until an optimum value is
reached, after which it decreases mainly due to scavenging of OH by excess H2O2
[86,119,177,178]. Indeed, at high H2O2 concentration, hydroxyl radicals preferentially react

S. Adityosulindro (2017) / Doctoral Thesis / INP Toulouse
CHAPTER 1 - LITERATURE REVIEW
57
with H2O2 than with organic compounds, generating less reactive species such as OOH and
O2
- (see R.1.15 and R.1.24). Moreover, stepwise or continuous addition of H2O2 has been
therefore proposed to overcome these detrimental effects [33,179,180]. In all cases, low H2O2
dosage should be preferred because an excessive H2O2 dosage would increase the treatment
cost and be harmful for the microorganisms [155,181].
1.7.2. Effect of iron catalyst concentration
Degradation rate of organic compounds first increases with an increase in
(homogeneous or heterogeneous) iron catalyst. However, beyond an optimum value, the
degradation efficiency reaches a plateau [60,155].
In the homogeneous Fenton oxidation, the optimum iron concentration corresponds to a
[H2O2] / [Fe] molar ratio between 10 to 50 [80,129,182–185] and this ratio can be much
higher up to 400 if dealing with real and concentrated wastewater [186]. According to
Koprivana and Kusic [187], the minimal concentration of Fe2+
or Fe3+
required for Fenton
reaction is in the range 3 – 15 mg/L (0.05 – 0.3 mM). On the other hand, excessive iron
concentration would increase the process cost due to the subsequent iron precipitation
required to lower its concentration below the discharge limit (2 mg/L in EU [188]), the
management of generated iron sludge and the uneasy catalyst recovery [155].
The same criteria ([H2O2] / [Fe] ratio or minimal iron concentration) are not easily
applied to the heterogeneous process, as only a fraction of immobilized iron is in fact
accessible. Solid catalyst concentrations ranging from 0.2 to 5 g/L have been used in previous
studies using Fe-ZSM5 catalyst [50,80,84,86,162,189], but values up to 25 – 70 g/L have
been also reported [190,191]. Indeed, the associated operating cost is now only related to
catalyst separation/retention (by membrane filtration for instance) and catalyst stability.
Note that, in heterogeneous (sono-)(photo-)Fenton process, low concentration of solid
catalyst should be preferred (< 2 g/L) to limit light and sound wave scattering/attenuation
[103,160,161,165,192].
1.7.3. Effect of temperature
Based on Arrhenius law, it is expected that an increase in temperature leads to a faster
generation of hydroxyl radicals by the Fenton reaction. However several studies reported an
optimal value (about 40°C), due to the concomitant accelerated decomposition of H2O2 into
oxygen and water [60,193].

S. Adityosulindro (2017) / Doctoral Thesis / INP Toulouse
CHAPTER 1 - LITERATURE REVIEW
58
Compared to Fenton, effect of temperature was found to be marginal in homogeneous
photo-Fenton oxidation [183]. Regarding ultrasound mediated processes, too high
temperature could be detrimental because it increases the amount of vapor in cavitation
bubbles cushioning their implosion, and it also results into a higher number of bubbles
attenuating ultrasound propagation [194,195]. Therefore, the effect of temperature in
combined (sono-)(photo-)Fenton processes has been rarely studied and the set temperature is
typically around 20 – 25°C (see tables 1.8 - 1.11).
It should be finally noted that high temperature may affect the stability of
heterogeneous iron catalyst by increasing metal leaching [177].
1.7.4. Effect of pH
Besides catalyst recovery, heterogeneous Fenton reaction was also developed to
overcome the classical problem of narrow pH range (pH=2-4) in homogeneous Fenton
reaction. However, most of the studies using solid catalyst – in Fenton [58,85,86,177,191],
sono-Fenton [121,127], photo-Fenton [80,162,163] and sono-photo-Fenton [120,175]
oxidation – still work at low pH values (2 to 5). Only a few works report good results at
circumneutral pH (6 – 7) [74,167,191,196]. In heterogeneous Fenton, acidic pH may be
important if the main mechanism of degradation is through leached iron (homogeneous
Fenton process), like observed for instance with ZVI catalyst [73].
Basically, the efficacy of Fenton reaction is reduced at both high and low pH [60]. At
high pH, the oxidation potential of hydroxyl radicals decreases and H2O2 is decomposed into
HO2- or H2O and O2 [162,197,198]. Low degradation rate at high pH (> 4) can also be
explained by the formation of selective oxidants, such as ferryl ions (FeO2+
) [65,198]. On the
other hand, at low pH (below 3), iron active species may be converted into iron complexes
which react more slowly with hydrogen peroxide [199]. Moreover, at pH 2, OH can be
scavenged by H+ and H2O2 can be stabilized through the formation of oxonimum ion (H3O2
+),
reducing its reactivity with ferrous species, and thus decreasing the process efficiency
[155,200]. Therefore, the optimum pH of homogeneous Fenton reaction is usually around 3.
It is also worth noting that iron leaching from heterogeneous catalyst is favored at low pH. In
addition, pH may evolve during the reaction due to H2O2 depletion [178] and formation of
acidic intermediates [57,115].
Several researchers investigated the effect of initial pH in heterogeneous Fenton
reaction and observed contrasted trends. Cihanoğlu et al. (2015) found that a pH increase

S. Adityosulindro (2017) / Doctoral Thesis / INP Toulouse
CHAPTER 1 - LITERATURE REVIEW
59
from 4 to 7 in Fe-ZSM5 catalyzed Fenton oxidation of acetic acid reduced COD conversion
after 120 min from 50% to 20% [86]. Queirós et al. (2015) also reported a decrease of azo
dye removal (from 70% to 20%) when the initial pH was increased from 2 to 4 [177]. On the
contrary, Aleksić et al. (2010) and Centi et al. (2000) reported that Fe-ZSM5 activity was not
sensitive to pH and could work well in mildly acidic conditions (pH=4-6) [84,167]. A
plausible explanation lies in the acidic property of Fe- ZSM5 [165,201] and/or the existence
of an interaction between the positively charged iron ions and negatively charged zeolite
framework that prevents or postpones the formation of stable iron hydro-complexes as pH
approaches neutral value [167].
Regarding sonochemical process, degradation of organic compounds is improved if pH
< pKa because in its molecular form the molecule can be vaporized into the cavitation
bubbles and both thermal cleavage and oxidation with OH radicals can occur [40,195,202].
On the other hand, the effect of direct photolysis is more pronounced at alkali pH since
deprotonated species are less stable under light irradiation [136,139].
Regarding heterogeneous sono-photo-Fenton process, we can cite the work of Zhong et
al. (2011) which investigated pH effect on the degradation of acid orange 7 using mesoporous
iron-containing silica (Fe2O3/SBA-15): the increase of initial pH from 3 to 5 led to the
reduction of removal efficiency from 65% to 40% [175].
1.7.5. Effect of initial concentration of pollutant
The degradation rate usually decreases when increasing the initial concentration of the
pollutant (other conditions remaining the same) due to an insufficient number of hydroxyl
radicals [86,198,203]. At high concentration, the pollutant may also occupy iron active sites
on the catalyst surface to the detriment of H2O2, resulting in less OH generation [198].
Furthermore, along with temperature, pH and H2O2 concentration, initial pollutant
concentration can influence the complex mechanism of iron leaching [204].
1.7.6. Effect of dissolved gas
Dissolved oxygen in solution can react with organic radicals (R) to form organic
peroxyl radicals (ROO) and organic peroxides (ROOH). These radicals can participate to the
degradation process as secondary oxidants. Segura et al. (2015) showed that air injection (5
L/min) can improve TOC removal in heterogeneous Fenton process by up to 17% [178].

S. Adityosulindro (2017) / Doctoral Thesis / INP Toulouse
CHAPTER 1 - LITERATURE REVIEW
60
Furthermore, dissolved oxygen reacts with H
and OH, and thereby prevents their loss
by termination reactions Likewise, high O2 concentration disfavors OOH recombination
[174,205]:
OH + O2 ↔
O +
OOH (R.1.56)
H + O2 ↔
OOH (
O +
OH) (R.1.57)
H2O2 + O2 ↔ 2 OOH (R.1.58)
Gases affect differently sonochemical reactions depending on their thermodynamic
properties. For instance, Gültekin and Ince observed that sonolysis of biphenol A under argon
was slightly faster than under oxygen, which could be ascribed to its higher polytropic ratio
and low conductivity, favoring higher collapse temperatures [206]. Regarding photolysis,
injection of nitrogen could be detrimental by inhibiting the formation of reactive oxygenated
species (1O2, O2
-, OH) by photo-sensitization reactions (R.1.44 – R.1.48), as observed for
the photodegradation of ibuprofen [42].
1.7.7. Effect of ultrasound power and frequency
The effect of ultrasound power in homogeneous sono-Fenton process has been scarcely
investigated. Siddique et al [81] reported that dye sono-oxidation (at 20 kHz) increased from
60% to 75% by increasing ultrasonic intensity from 4 W/cm2 (40 W/L) to 8 W/cm
2 (80 W/L).
The authors attributed this enhancement to better mixing and improved hydroxyl radical
generation by ultrasound.
In heterogeneous system, similar results have been reported: degradation yield
increased by increasing ultrasound power [122,124,130] and optimum value was rarely
observed [130]. This trend was explained by more hydroxyl radicals generated from water
sonolysis [124] and more intense mixing [122]. Note, however, that these explanations were
not supported by study of sole sonolysis and activity of iron leached was not investigated.
Effect of US frequency on sono-Fenton reaction, particularly on decomposition of Fe-
OOH2+
iron complex into Fe2+
and OOH (R.1.37), is not well-known. Bremner et al [117]
varied US frequency between 20 and 1142 kHz and found that 584 kHz should be preferred
for heterogeneous sono-Fenton oxidation of phenol over Fe2O3/SBA catalyst.

S. Adityosulindro (2017) / Doctoral Thesis / INP Toulouse
CHAPTER 1 - LITERATURE REVIEW
61
1.7.8. Effect of lamp type (wavelength) and power
Various lamp types have been used by researchers to study photo-Fenton and sono-
photo-Fenton oxidation processes: low pressure mercury vapor (LP Hg) lamp [168,207],
medium pressure mercury vapor (MP Hg) lamp [80,152,163], halogen lamp [208], black light
blue (BLB) lamp [209] and xenon Arc (Xe) lamp [24,33,43,164,172,183]. Among them, LP
Hg, MP Hg and xenon arc lamp are the most utilized. Various possible photo-chemical
reactions induced by these lamps are given in figure 1.11.
Figure 1.11. Classification of photo-based AOPs according to lamp type and wavelength
Among them, MP Hg lamp is the most effective since it covers a wide range of
wavelengths (λ=200-600 nm), but it is more expensive compared to the other lamps. LP Hg
lamp (λ=254 nm) is also interesting due to its low cost, efficiency for H2O2 decomposition
and ability to initiate photo-reduction of ferric to ferrous iron. Xenon arc lamp (λ=300-800
nm) may be not as effective as MP and LP Hg lamps, but it can be used to assess the
efficiency of a solar process since it mimics sunlight irradiation.
Increase of irradiation power is generally followed by an increase in the catalytic
activity, due to faster photo-reduction of Fe (III) to Fe(II) [161].

S. Adityosulindro (2017) / Doctoral Thesis / INP Toulouse
CHAPTER 1 - LITERATURE REVIEW
62
1.8. CONCLUSION
Complete removal and mineralization of pharmaceuticals are still a major challenge in
conventional water treatment processes. On the other hand, this literature review showed that
advanced oxidation (AOPs) processes are very promising techniques for the remediation of
refractory organic compounds in water, such as pharmaceuticals. Among them, ibuprofen
was chosen as model molecule due to its regular presence in aquatic environment and
potential environmental risks. To eliminate ibuprofen, both homogeneous and heterogeneous
Fenton processes were evaluated. However, drawbacks associated to each process, such as
uneasy regeneration of ferrous ion and use of dissolved iron concentrations well above the
discharge limit for homogeneous system or lower reaction rates for heterogeneous system,
encourage more developments by coupling processes. Indeed, despite of the limited oxidation
capacity of sole ultraviolet/visible and ultrasound irradiation, it was demonstrated that these
processes can be used to (re)activate Fenton reaction, mainly by improving the regeneration
of ferric to ferrous iron species.
Notwithstanding, more information is actually needed, especially concerning
mechanisms of ibuprofen degradation by ultrasound and ultraviolet irradiation, effects of
ultrasound power and frequency on sono-Fenton oxidation, effect of light wavelength on
photo-Fenton oxidation and possible synergistic effect by coupling these process (in the so-
called sono-photo-Fenton oxidation).
The originality of the present work relies in the activation of homogeneous Fenton
reaction carried out at relatively low iron concentration (1.8 – 7.5 mg/L of Fe) and the
combination of low frequency ultrasound and visible irradiation with heterogeneous Fenton
reaction.
Prior to result report and discussion, next chapter details analytical methods and
equipment, as well as experimental set-up and procedures.
63
CHAPTER 2 METHODS AND MATERIALS
This chapter presents the methods and materials involved in this study. The first part of
this chapter is dedicated to the analytical methods used for the characterization of liquid
samples and heterogeneous catalysts. Then properties of chemicals and catalysts are
provided. Finally, the experimental apparatus and procedures applied for investigating AOPs
are described.

64
This page is intentionally left blank
S. Adityosulindro (2017) / Doctoral Thesis / INP Toulouse
CHAPTER 2 - METHODS AND MATERIALS
65
2.1. ANALYTICAL METHODS
2.1.1. Analysis of liquid phase
2.1.1.1. Quantification of ibuprofen by HPLC/UV
High-Performance Liquid Chromatography coupled with UV detection (HPLC/UV)
was used as a routine method to monitor the degradation of ibuprofen during the oxidation
experiments. HPLC uses a liquid mobile phase (solvent mixture) to transport the molecules
(analytes) in a sample through a stationary phase (sorbent particles packed inside a column)
and separates them according to their affinity for mobile and stationary phases. At the end of
the system (figure 2.1), a UV/Vis spectrophotometer monitors the absorbance of analytes in
the eluent and shows the output in the form of a chromatogram. Thus, a calibration is needed
in order to transform the peak area on the chromatogram into analyte concentration.
The HPLC system used in this work (ACCELA PDA, Thermo scientific Inc.) consists
in a dual-piston quaternary mixing pump, an auto-sampler, and a photodiode array detector
capable to scan the analyte absorbance on a range of wavelengths. Acquisition and treatment
of chromatograms were performed by Chromeleon software (version 6.8, Thermo scientific
Inc.).
IBP stock solution was prepared by dissolving 40 mg of IBP powder in 2 L of
distillated water and stirred for 14 hours using a magnetic stirrer (600 rpm) at 25°C to ensure
complete powder dissolution. Complete dissolution was confirmed by comparison to the peak
area obtained when IBP solution was prepared in acetonitrile. Before each analysis, five
standard solutions were prepared to calibrate the machine, with concentration ranging from 2
to 20 mg/L (example of calibration curve can be found in appendix: figure II). Analysis of
standard solution was duplicated, showing a coefficient of variation lower that 2%.
Detail of HPLC separation method is given in table 2.1. Acetonitrile (Scharlau, Ref.
AC03334000) and ultrapure water acidified with phosphoric acid (Sigma-Aldrich, Ref.
79606) were chosen as eluents due to their low absorption in UVC region. Acidification of
water eluent (pH = 2.3) prevented ionization of ibuprofen (pKa = 4.9) during the analysis so
as to improve reproducibility and resolution of the method. According to the absorption
spectrum of ibuprofen (see figure 2.8) exhibiting a maximum at 222 nm, this wavelength was
chosen for pollutant monitoring. A temperature of 40°C was set to improve the separation
between the pollutant and its degradation intermediates, especially to prevent co-elution

S. Adityosulindro (2017) / Doctoral Thesis / INP Toulouse
CHAPTER 2 - METHODS AND MATERIALS
66
between ibuprofen and 4-isobutylacetophenone (see appendix: figure I). Limits of detection
and quantification of ibuprofen with this method were 10 µg/L and 30 µg/L, respectively.
Figure 2.1. Schematic diagram of HPLC system (adapted from reference [210])
Table 2.1. HPLC method for ibuprofen analysis
Parameters
Column C18 250x4 mm, 5 μm (ProntoSIL C18
AQ, Bischoff chromatography)
Elution method Isocratic
Aqueous solvent (A) Ultrapure water with H3PO4 0,1% (v/v)
Organic solvent (B) Acetonitrile
Volumetric A/B ratio 40/60
Elution flow rate (mL/min) 1
Temperature (°C) 40
Injection volume (µL) 20
Retention time (min) 8.8 + 0.3
Principal wavelengths (nm) 222
Diode array detector wavelengths (nm) 200 – 800
2.1.1.2. Analysis of reaction intermediates by HPLC/MS
High Performance Liquid Chromatography coupled with high resolution Mass
Spectrometry (HPLC/MS) was used as complementary analysis in order to identify the
reaction intermediates (degradation products) formed during the different oxidation
processes. In the MS detector, the injected compounds are vaporized, ionized and undergo
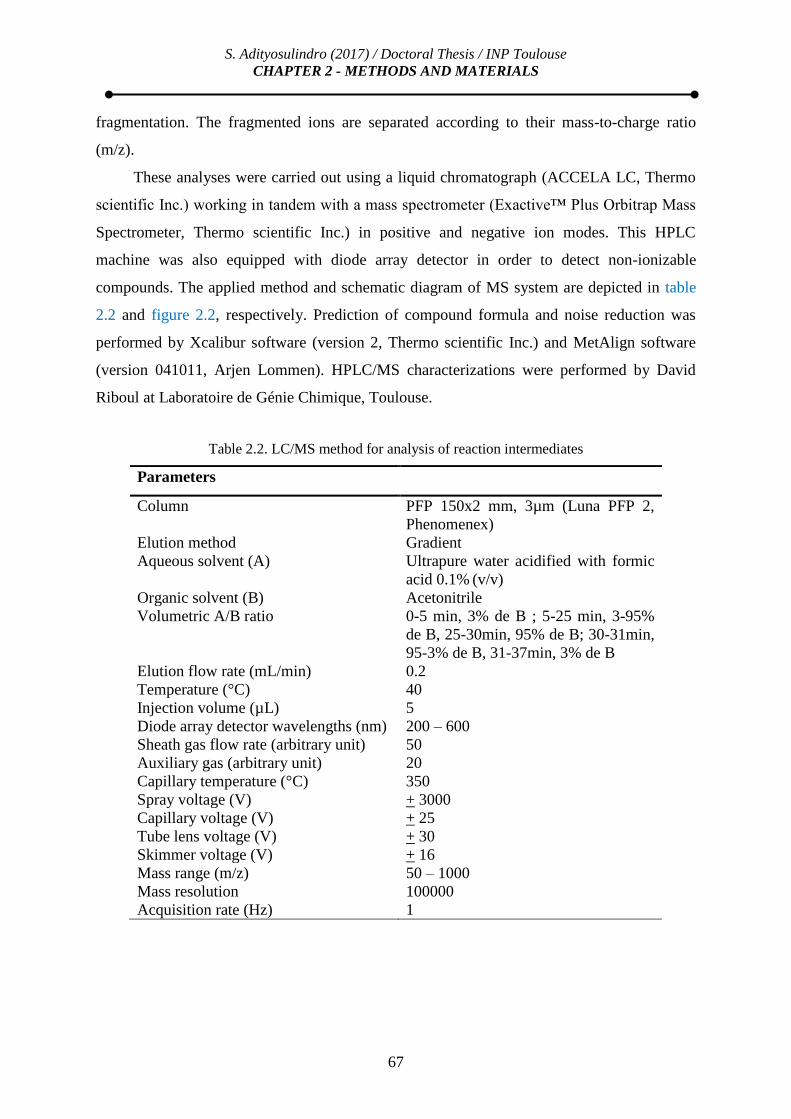
S. Adityosulindro (2017) / Doctoral Thesis / INP Toulouse
CHAPTER 2 - METHODS AND MATERIALS
67
fragmentation. The fragmented ions are separated according to their mass-to-charge ratio
(m/z).
These analyses were carried out using a liquid chromatograph (ACCELA LC, Thermo
scientific Inc.) working in tandem with a mass spectrometer (Exactive™ Plus Orbitrap Mass
Spectrometer, Thermo scientific Inc.) in positive and negative ion modes. This HPLC
machine was also equipped with diode array detector in order to detect non-ionizable
compounds. The applied method and schematic diagram of MS system are depicted in table
2.2 and figure 2.2, respectively. Prediction of compound formula and noise reduction was
performed by Xcalibur software (version 2, Thermo scientific Inc.) and MetAlign software
(version 041011, Arjen Lommen). HPLC/MS characterizations were performed by David
Riboul at Laboratoire de Génie Chimique, Toulouse.
Table 2.2. LC/MS method for analysis of reaction intermediates
Parameters
Column PFP 150x2 mm, 3µm (Luna PFP 2,
Phenomenex)
Elution method Gradient
Aqueous solvent (A) Ultrapure water acidified with formic
acid 0.1% (v/v)
Organic solvent (B) Acetonitrile
Volumetric A/B ratio 0-5 min, 3% de B ; 5-25 min, 3-95%
de B, 25-30min, 95% de B; 30-31min,
95-3% de B, 31-37min, 3% de B
Elution flow rate (mL/min) 0.2
Temperature (°C) 40
Injection volume (µL) 5
Diode array detector wavelengths (nm) 200 – 600
Sheath gas flow rate (arbitrary unit) 50
Auxiliary gas (arbitrary unit) 20
Capillary temperature (°C) 350
Spray voltage (V) + 3000
Capillary voltage (V) + 25
Tube lens voltage (V) + 30
Skimmer voltage (V) + 16
Mass range (m/z) 50 – 1000
Mass resolution 100000
Acquisition rate (Hz) 1

S. Adityosulindro (2017) / Doctoral Thesis / INP Toulouse
CHAPTER 2 - METHODS AND MATERIALS
68
Figure 2.2. Schematic diagram of MS system (adapted from reference [211])
2.1.1.3. Analysis of Total Organic Carbon (TOC)
Analysis of total organic carbon (TOC) was performed in order to determine the whole
concentration of contaminant and transformation products during the oxidation. This analysis
was carried out using TOC analyzer (TOC-L, Shimadzu Co.).
TOC is the Total Organic Carbon present in an aqueous sample as dissolved
compounds and suspended material. The quantification of TOC is based on the difference
between Total Carbon (TC) and Inorganic Carbon (IC) (analyzed separately as it can be seen
on figure 2.3). TC is measured by oxygen combustion of the sample at 680°C using a
platinum catalyst that converts all carbon present into carbon dioxide (CO2), while IC is
measured by transformation of carbonate (CO32-
) and bicarbonate (HCO3-) ions into CO2 after
acidification (by adding HCl 2N) and degassing by nitrogen sparging. The evolved gases are
transferred to a dehumidifier, then CO2 is quantified using a non-dispersive infrared sensor
(NDIR).

S. Adityosulindro (2017) / Doctoral Thesis / INP Toulouse
CHAPTER 2 - METHODS AND MATERIALS
69
Figure 2.3. Principle of TOC measurement
(adapted from reference [212])
Calibration of TC analysis was conducted with the target contaminant: eight calibration
points ranging from 0.66 mg/L to 20 mg/L of ibuprofen (0.5 mg/L to 15 mg/L of TC) were
used. In addition, calibration of IC analysis was conducted between 0.2 and 2 mg/L, using
standards prepared from a 100 mg/L IC solution, corresponding to a mixture of 0.35 g
sodium bicarbonate NaHCO3 (Sigma Aldrich, Ref. S6014) and 0.441 g sodium carbonate
Na2CO3 (Sigma Aldrich, Ref. S7795) in 1 L ultrapure water. The injection volume was 50 µL
and 400 µL for TC and IC, respectively (example of calibration curve of TC and IC can be
found in appendix: figure III and IV).
Theoretical TOC concentration of prepared solutions ([TOC]theo in mg/L) was calculated by
the following equation:
[TOC]theo = nC x MCx [Molecule]
MMolecule (E.2.1)
With
nC : number of carbons in the molecule
MC : molecular weight of carbon (g/mol)
[Molecule] : concentration of the molecule (mg/L)
MMolecule : molecular weight of the molecule (g/mol)
In case of ibuprofen (molecular weight 206.29 g/mol), this leads to:
S. Adityosulindro (2017) / Doctoral Thesis / INP Toulouse
CHAPTER 2 - METHODS AND MATERIALS
70
[TOC]theo = 13 .12 . [IBP]
206.29 = 0.756 [IBP] (E.2.2)
According to the supplier, detection limits were 50 µg/L and 4 µg/L for TC and IC,
respectively. By default, the measurement was duplicated; extra measurements were
performed only if the coefficient of variation of the first ones was higher than 2%.
2.1.1.4. Analysis of (residual) hydrogen peroxide by spectrophotometry
(Residual) hydrogen peroxide after oxidation/sonication was determined by the
titanium tetrachloride method [213,214]. This method has also been used in literature both to
determine sono-generation of H2O2 [174] and conversion of H2O2 in sono-photo-Fenton
process [171] due to its large application range. It is based on the reaction between H2O2 and
Ti4+
in acidic condition to form a yellow complex, pertitanic acid (TiO2.H2O2) (R.2.1).
Ti4+
+ H2O2 + 2 H2O → TiO2.H2O2 + 4 H+ (R.2.1)
At the end of the experiment, a 25 mL aliquot was withdrawn and filtered. Then, 1 mL of
TiCl4 solution at 0.09 M (Sigma-Aldrich, Ref. 404985) and 1 mL of 1 M H2SO4 (Sigma-
Aldrich, Ref. 35276) were added, yielding an orange-yellow coloration. This colored
complex is stable during several hours and exhibits a molar extinction coefficient ε=742
L/(mol.cm) at 410 nm [213]. Its concentration was measured on a Genesys 2 (Thermo
Electron Corporation) or UV-1800 (Shimadzu Corporation) spectrophotometer. For
quantification, a calibration plot using different H2O2 solutions was performed (for example
see appendix figure V). Examples of coloration formed at different complex concentrations
can be seen in figure 2.4. This method allows the measurement of hydrogen peroxide
concentration between 0.01 and 3 mM (0.34 – 102 mg/L), the detection limit being 0.003
mM (0.1 mg/L). For higher concentration ranges, a smaller sample volume was taken and
diluted with distillated water before treatment and analysis.
The result of H2O2 analysis was expressed in either residual (remaining) concentration
(in mM) or in percentage consumption.(%).

S. Adityosulindro (2017) / Doctoral Thesis / INP Toulouse
CHAPTER 2 - METHODS AND MATERIALS
71
Figure 2.4. Standard solutions of titanium (IV)-hydrogen peroxide complex at different concentrations
2.1.1.5. Analysis of total dissolved iron by ICP-AES
Inductively Coupled Plasma Atomic Emission Spectroscopy (ICP-AES) was used to
measure the total iron concentration leached from the heterogeneous catalyst during the
reaction after filtering the final solution. In the ICP-AES apparatus (figure. 2.5), the sample is
sprayed as a mist of droplets in a nebulizer and introduced in a high temperature plasma
(6000 to 10000 K) resulting in excitation and ionization of the atoms. Once the atoms or ions
are in their excited state, they can decay to lower states through thermal or radiative
(emission) energy transitions. The intensity of the light emitted at specific wavelengths is
measured and used to determine the concentration of the elements of interest [215].
This analysis was also used to measure the iron content of Fe-MFI. In this case,
extraction of iron from the zeolite matrix was carried out by mixing 0.15 g of Fe-MFI with 5
mL of 15 M HNO3 at high temperature (120°C) until complete discoloration of the solid
residue (96 hours).
Analysis of total dissolved iron was carried out by Marie-Line De Solan Bethmale
using Ultima 2 ICP-AES spectrometer (HORIBA Jobin Yvon) at Service Analyse et Procédés
(SAP) of LGC Toulouse. Limits of detection and quantification were 1 µg/L and 10 µg/L,
respectively.

S. Adityosulindro (2017) / Doctoral Thesis / INP Toulouse
CHAPTER 2 - METHODS AND MATERIALS
72
Figure 2.5. Schematic diagram of ICP-AES apparatus (adapted from reference [215])
2.1.2. Analysis of solid phase (heterogeneous catalyst)
2.1.2.1. Laser diffraction
Laser diffraction was used to measure the particle size distribution of the heterogeneous
catalysts (Fe-ZSM5 [Fe-MFI] and zero valent iron [ZVI]). When a sample containing
suspended particles is irradiated with a laser beam (infrared and blue light), light is scattered,
diffracted, refracted, absorbed and transmitted. The intensity of diffracted/scattered light is
analyzed using Mie theory to calculate the size distribution of the particles, in the range 0.02-
2000 µm. This presupposes knowledge of the light refractive index of the particles and the
dispersion media and the imaginary part of the refractive index of the particles (see table 2.3).
Measurement of Fe-MFI particle size distribution was carried out in wet dispersion
(using a Malvern Mastersizer 2000 equipped with Hydro 2000S accessory) in order to
approach the experimental conditions. On the other hand, ZVI was analyzed as dry powder
(Malvern Mastersizer 3000 equipped with Aero 3000 accessory) because these magnetic
particles easily agglomerate in liquid causing poor repeatability of the measurement. Details
of analytical methods are given in table 2.3.
Particle size analyses were carried out by Christine Rey Rouch at SAP, LGC Toulouse.

S. Adityosulindro (2017) / Doctoral Thesis / INP Toulouse
CHAPTER 2 - METHODS AND MATERIALS
73
Table 2.3. Methods for particle size analyses
Parameters Solid catalyst
Fe-MFI ZVI
Dispersion media (unit) water (Hydro 2000S) air (Aero 3000)
Stirrer-pump speed (rpm) 1750 N/A
Air pressure (bar) N/A 2
Refractive index 1.503 1.520
Absorption index 0.1 0.1
Obscuration level (%) 3 9
2.1.2.2. Scanning Electron Microscopy and Energy Dispersive X-ray
Spectroscopy
Scanning Electron Microscopy (SEM) – coupled to elemental analysis – was performed
to evaluate the morphology of the solid catalysts and the (surface) distribution of iron. The
measurement is based on the interaction of the primary electron beam with the sample
causing the emission of secondary electrons (related to the surface topography), backscattered
electrons and X-rays (figure 2.6). The latter can be used to obtain elemental information by
coupling with Energy-Dispersive X-Ray Spectroscopy (EDX) detector. When the sample is
bombarded by the SEM electron beam, electrons are ejected from the atoms on the sample
surface. The resulting electron vacancies are filled by electrons from a higher state, and X-
rays are emitted to balance the energy difference between the two electron states. The
resulting X-ray spectrum exhibits specific energy lines which depend on the atomic number
of the atoms.
This analysis was carried out by Marie-Line De Solan Bethmale using a LEO 435VP
microscope (SEMTech Solutions, Inc.) equipped with EDS detector (INCA System, Oxford
Instrument) at SAP, LGC Toulouse.

S. Adityosulindro (2017) / Doctoral Thesis / INP Toulouse
CHAPTER 2 - METHODS AND MATERIALS
74
Figure 2.6. Schematic diagram of SEM (adapted from reference [216])
2.1.2.3. X-ray diffraction
X-ray diffraction (XRD) was used to characterize the crystalline phases of the catalysts
(e.g. for identification of crystalline phases, evaluation of crystallite size, etc ...). This
analytical technique is based on the diffraction pattern formed by the interaction between
incident beam of monochromatic X-rays and target material (described by Bragg’s law). X-
rays refracted and captured by the detector are depicted as diffraction peaks. Each peak
appearing on the diffractogram pattern representing a crystal plane is then compared with a
database from Joint Committee on Powder Diffraction Standards – International Centre for
Diffraction Data (JCPDS–ICDD). The size of the crystallites can be estimated by Scherrer’s
equation using the width of the diffraction peaks:
dc = kλ / (βcosθ) (E.2.3)
With
dc : average diameter of crystallites (nm)

S. Adityosulindro (2017) / Doctoral Thesis / INP Toulouse
CHAPTER 2 - METHODS AND MATERIALS
75
k : shape factor of the crystallite (typically around 0.9)
λ : X-ray wavelength (nm)
β : peak broadening at half the maximum intensity
θ : half diffraction angle
This analysis was carried out by Cédric Charvillat at Centre Inter-universitaire de Recherche
et d’Ingénierie des Matériaux (CIRIMAT), Toulouse.
2.1.2.4. Gas porosimetry
Gas porosimetry was used to determine the specific surface area of the solid catalyst.
The measurement is based on the physical adsorption of a gas (nitrogen, argon or helium) on
the surface of a solid material, which depends upon temperature and pressure.
Prior to the analysis, the solid samples were degassed at 200°C during 2 h. The
adsorption isotherm (or quantity of gas adsorbed as a function of pressure) was then
measured at the temperature of liquid nitrogen (77 K), and the specific surface area was
determined by calculating the amount of adsorbed gas corresponding to a monomolecular
layer (Brunauer, Emmet and Teller, or BET equation). Furthermore, gas porosimetry also
gave access to mesoporous and microporous volumes by application of Barrett-Joyner-
Halenda (BJH) and Horvath-Kawazoe (HK) models, respectively.
This analysis was carried out by Gwenaëlle Raimbeaux using an ASAP 2010 M
porosimeter (Micromeritics Instrument Corporation) at SAP, LGC Toulouse.
2.1.2.5. CO chemisorption
Chemisorption of carbon monoxide was used to determine the dispersion of iron on the
surface of Fe-MFI (Fe-ZSM5) and the size of crystallites. During chemisorption process, the
adsorbing gas forms a chemical bond with the adsorption site. A wide range of metals react
with CO forming single or multiple bonds. Knowing the stoichiometry of the reaction, the
number of molecules of CO chemisorbed per gram of catalyst provides the metal dispersion,
defined as the percentage of accessible metal atoms with respect to the total metal content.
0.5 g of Fe-MFI catalyst was degassed at 200°C and 400°C during 30 min and 1 h,
respectively, then reduced under flowing H2 at 450°C for 12 h (ramp of 5°C/min), and placed
under vacuum for 1 hour at 400°C before cooling to 35°C for CO adsorption [189,217]. A
first isotherm was measured, then the sample was evacuated at 35°C to remove physisorbed

S. Adityosulindro (2017) / Doctoral Thesis / INP Toulouse
CHAPTER 2 - METHODS AND MATERIALS
76
CO and a second isotherm was recorded. The difference between the two isotherms gave
chemisorbed gas amount. Afterwards, the sample was degassed and re-oxidized at 450°C by
using 10% of O2 in helium to determine the extent of reduction. Assuming a CO uptake per
Fe atom of ½, as well as crystallites of uniform size and spherical shape, iron dispersion D
(%) and crystallite diameter (dc) was calculated according to following equations [217]:
D = 1.117 X / (Wf) (E.2.4)
dc = 96/D (E.2.5)
With
D : iron dispersion (%)
X : chemisorbed CO amount (µmol/g)
W : total weight percentage of iron in the catalyst (%)
f : fraction of reduced iron determined by O2 titration
dc : average diameter of crystallites (nm)
Note that caution must be taken on the interpretation of such measurement for Fe/zeolite, as
Fe2+
ions (resulting from the preliminary reduction of ionic iron species) also chemisorb CO
[218]. Therefore room temperature (RT) 57
Fe Mössbauer spectroscopy of Fe/MFI was
performed on a WissEl spectrometer to investigate iron oxidation state and quantify the
amount of isolated ionic species. It showed mainly hematite and a very low amount of Fe3+
ions in octahedral coordination (7%) [165], whose contribution to CO chemisorption was
neglected.
CO chemisorption was carried out by Pascale Mascunan at Institut de Recherches sur la
Catalyse et l'Environnement de Lyon (IRCELyon), Villeurbanne.
2.1.2.6. Identification of the pH at the point of zero charge
The pH at the point of zero charge (pHpzc) is the pH at which a solid surface immersed
in an electrolyte solution has a net neutral charge. When the pH of the solution is below
pHpzc, the solid surface is positively charged, thus promoting the adsorption of organic

S. Adityosulindro (2017) / Doctoral Thesis / INP Toulouse
CHAPTER 2 - METHODS AND MATERIALS
77
compounds in ionic form. Conversely, at a pH value above pHpzc, the catalyst surface is
negatively charged and repels anions.
pHpzc value was measured by mass titration method [219]. Several suspensions with
concentrations of solid catalyst ranging from 2 and 14 g/L were prepared in distilled water
and bubbled with nitrogen. Then the suspensions were agitated during 24 h and filtered
before measuring the pH (Model C861 pH-meter, Consort). Beyond a certain concentration
of solid, the contact pH reached a plateau corresponding to the pH at the point of zero charge.
2.1.2.7. Carbon trace analysis
Carbon traces analysis was performed to determine the (residual) organic amount
adsorbed on Fe-ZSM5 catalyst, so that to calculate the global mineralization yield (TOC
removal in both solid and liquid phases). At the end of heterogeneous reaction, the
suspension was filtered through a nitrocellulose membrane filter with 0.22 µm pore size
(GSWP, Merck Millipore) and the collected solid was dried at 70°C during 24 h. About 400
mg of dried sample was subjected to combustion at 1350°C, in the presence of oxygen. The
formed carbon dioxide was detected using an infrared detector (SC144, LECO, dosing range
from 50 ppm to 10% of C).
This analysis was carried out by Patrick Jame at Institut des Sciences Analytiques
(ISA), Villeurbanne.
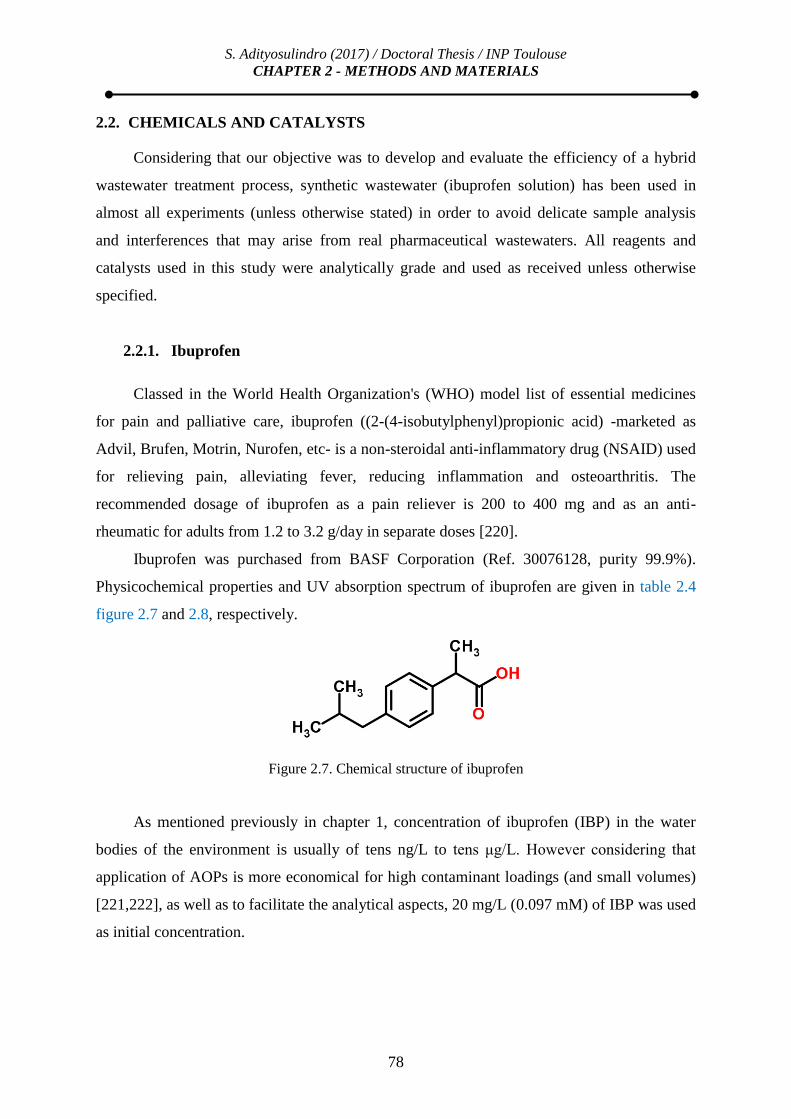
S. Adityosulindro (2017) / Doctoral Thesis / INP Toulouse
CHAPTER 2 - METHODS AND MATERIALS
78
2.2. CHEMICALS AND CATALYSTS
Considering that our objective was to develop and evaluate the efficiency of a hybrid
wastewater treatment process, synthetic wastewater (ibuprofen solution) has been used in
almost all experiments (unless otherwise stated) in order to avoid delicate sample analysis
and interferences that may arise from real pharmaceutical wastewaters. All reagents and
catalysts used in this study were analytically grade and used as received unless otherwise
specified.
2.2.1. Ibuprofen
Classed in the World Health Organization's (WHO) model list of essential medicines
for pain and palliative care, ibuprofen ((2-(4-isobutylphenyl)propionic acid) -marketed as
Advil, Brufen, Motrin, Nurofen, etc- is a non-steroidal anti-inflammatory drug (NSAID) used
for relieving pain, alleviating fever, reducing inflammation and osteoarthritis. The
recommended dosage of ibuprofen as a pain reliever is 200 to 400 mg and as an anti-
rheumatic for adults from 1.2 to 3.2 g/day in separate doses [220].
Ibuprofen was purchased from BASF Corporation (Ref. 30076128, purity 99.9%).
Physicochemical properties and UV absorption spectrum of ibuprofen are given in table 2.4
figure 2.7 and 2.8, respectively.
Figure 2.7. Chemical structure of ibuprofen
As mentioned previously in chapter 1, concentration of ibuprofen (IBP) in the water
bodies of the environment is usually of tens ng/L to tens μg/L. However considering that
application of AOPs is more economical for high contaminant loadings (and small volumes)
[221,222], as well as to facilitate the analytical aspects, 20 mg/L (0.097 mM) of IBP was used
as initial concentration.

S. Adityosulindro (2017) / Doctoral Thesis / INP Toulouse
CHAPTER 2 - METHODS AND MATERIALS
79
Table 2.4. Physicochemical properties of ibuprofen
Properties Ref.
IUPAC name 2-(4-Isobutylphenyl)propionic acid [220]
CAS number 15687-27-1 [220]
Formula C13H18O2 [220]
Molecular weight 206.29 g/mol [220]
Molecular size 1.3 nm x 0.6 nm [223]
Log Kow* 3.8 – 3.97 [220,224]
pKa 4.3 – 4.9 (carboxylic group) [225,226]
Solubility in water 21 mg/L (0.1 mM) at 25°C [227]
Henry’s law constant 1.5 x 10⁻⁷
atm.m3/mol [40]
Vapor pressure 1.18 x 10⁻⁸
atm at 25°C [228]
Rate constant with OH 6.5 x 10
9 M
-1.s
-1 [229]
Rate constant with 1O2 6 x 10
4 M
-1.s
-1 [54]
*Kow: octanol-water partition coefficient
Figure 2.8. UV absorption spectrum of ibuprofen solution ([IBP] = 20 mg/L; pH0 = 4.3)

S. Adityosulindro (2017) / Doctoral Thesis / INP Toulouse
CHAPTER 2 - METHODS AND MATERIALS
80
2.2.2. Hydrogen peroxide
Hydrogen peroxide (H2O2) is known as "green" oxidant because it releases only water
as by-product. Since addition of sole H2O2 for oxidation of organic compounds has limited
efficiency due to its relatively low oxidation potential (1.77 V), H2O2 is rather used as source
of stronger oxidants in advanced oxidation processes (AOPs), such as hydroxyl radical OH
that exhibits higher oxidation potential (2.80 V). Physicochemical properties and UV
absorption spectrum of H2O2 are depicted in table 2.5 and figure 2.9, respectively.
The stoichiometric amount of H2O2 required for the total oxidation of 20 mg/L
ibuprofen was 3.2 mM and it was calculated based on the following equation:
C13H18O2 + 33 H2O2 → 13 CO2 + 42 H2O (R.2.2)
Hydrogen peroxide (H2O2) was purchased from Sigma-Aldrich as a 30% wt. solution
(ref. 95294) with density of 1.14 g/cm3
Table 2.5. Physicochemical properties of hydrogen peroxide
Properties Ref.
IUPAC name Hydrogen peroxide [230]
CAS number 7722-84-1 [230]
Formula H2O2 [230]
Molecular weight 34 g/mol [230]
Density 1.1 g/cm³ at conc. 30% [231]
Log Kow -1.5 [230]
pKa 11.62 [230]
Koc 0.2 L/kg [230]
Solubility in water miscible [230]
Henry’s law constant 7.4 x 10⁻⁹
atm.m3/mol at 20 °C [230]
Vapor pressure 0.003 atm at 25°C [230]

S. Adityosulindro (2017) / Doctoral Thesis / INP Toulouse
CHAPTER 2 - METHODS AND MATERIALS
81
Figure 2.9. UV absorption spectrum of H2O2
2.2.3. Soluble catalysts
Homogeneous Fenton oxidation experiments were performed as reference using the
classical Fe2+
/H2O2 system. FeSO47H2O (Sigma, purity 99%) was used as ferrous ion
source.
Table 2.6. Physicochemical properties of ferrous sulfate
Properties Ref.
IUPAC name Iron(II) sulfate heptahydrate [232]
CAS number 7782-63-0 [232]
Formula FeSO4.7H2O [232]
Molecular weight 278 g/mol [232]
Solubility in water 25.6 g/100 mL at 20°C [233]
Vapor pressure 0.019 atm at 25°C [233]

S. Adityosulindro (2017) / Doctoral Thesis / INP Toulouse
CHAPTER 2 - METHODS AND MATERIALS
82
2.2.4. Heterogeneous catalysts
2.2.4.1. Iron containing zeolite (Fe-MFI)
Iron containing zeolite catalyst (Fe-MFI) was obtained from Süd-Chemie AG (ref. Fe-
MFI-27). This catalyst has a ZSM5 structure (pentasil zeolite). ZSM5 framework exhibits a
10-ring channel structure, with minor and major axis dimensions of 5.1Å x 5.5 Å and 5.4 Å x
5.6 Å for sinusoidal and straight channels, respectively [234] (figure 2.10).
Figure 2.10. (a) Skeletal diagram of the (100) face of ZSM5, (b) Channel structure of ZSM5
(adapted from reference [234])
According to SEM analysis, Fe-MFI particles consisted in agglomerates of micronic
grains (figures 2.11A and 2.11B). Laser diffraction analysis showed a narrow size
distribution of the suspended particles (mainly between 1 - 20 µm), with volume mean
diameter (d43) of 7.9 µm (figure 2.12). EDX analysis (figure 2.11C) shows a “surface” iron
content of 3.1+0.9 wt%, almost same as the bulk content, and confirms a homogeneous
distribution of the metal within the particles. Iron can be located either in the framework of
the zeolite or in the form of cations at the exchange sites in the channels, or in the form of
oxide nanoparticles [77]. As abovementioned (cf. § 2.1.2.5), iron is mainly present as
hematite phase and to a much lesser extent as Fe3+
ions according to Mössbauer
spectroscopy [165]. X-ray diffractograms of Fe-MFI and MFI (without iron, ref. H-MFI-27)
are very similar (figure 2.13), indicating that incorporation of iron has not resulted into any
significant structural change of the zeolite.

S. Adityosulindro (2017) / Doctoral Thesis / INP Toulouse
CHAPTER 2 - METHODS AND MATERIALS
83
Figure 2.11. SEM images (A and B) and EDX analysis (C) of fresh Fe-MFI catalyst
Figure 2.12. Particles size distribution of Fe-MFI (in suspension)
0
1
2
3
4
5
6
7
8
0.01 0.1 1 10 100 1000
Volu
me
(%)
Particle size (µm)
1 µm

S. Adityosulindro (2017) / Doctoral Thesis / INP Toulouse
CHAPTER 2 - METHODS AND MATERIALS
84
Figure 2.13. XRD patterns of fresh Fe-MFI and MFI
Moreover, iron oxide phase corresponding to hematite (Fe2O3, reference pattern 01-
086-2368) can be hardly distinguished for Fe-MFI, which can be the result of high metal
dispersion. CO chemisorption indeed gives a mean size of iron crystallite of about 4 nm. On
the other hand, TEM/EDX indicates the presence of iron-rich clusters, but of a few tens of
nanometers (figure 2.14). Detailed properties of Fe-MFI catalyst are summarized in table 2.7.
Table 2.7. Properties of Fe-MFI
Properties
Label Fe-MFI
Support ZSM5 (SiO2/Al2O3=27)
%Fe 3.4a / 3.1+0.9
b / 3.6
c
Iron dispersion (%) 22d
dc,CO (nm) 4d
dc,XRD (nm) Non visible e
SBET (m2/g) 329
f
VMesopores (cm3/g)
0.05
f
VMicropores (cm3/g) 0.13
f
VPorous (cm3/g)
0.18
f
d43 (μm) 7.9
g
pHpzc 2.9h
Iron content according to: aICP-AES analysis of acid leachate,
bSEM-EDX analysis of Fe-MFI,
cSüd-Chemie
supplier; d
Metal dispersion and mean diameter of crystallites calculated from CO chimisorption; eMean diameter
of crystallites calculated from XRD fSpecific surface area, mesoporous, microporous and total porous volumes
measured by N2 porosimetry; g
Volume mean diameter of agglomerates in suspension (laser diffraction method); hpH at the point of zero charge measured by mass titration.
0
2000
4000
6000
8000
10000
12000
14000
16000
10 20 30 40 50 60 70
Inte
nsi
ty (
a.u
.)
2 Thêta
Fe-MFI
MFI
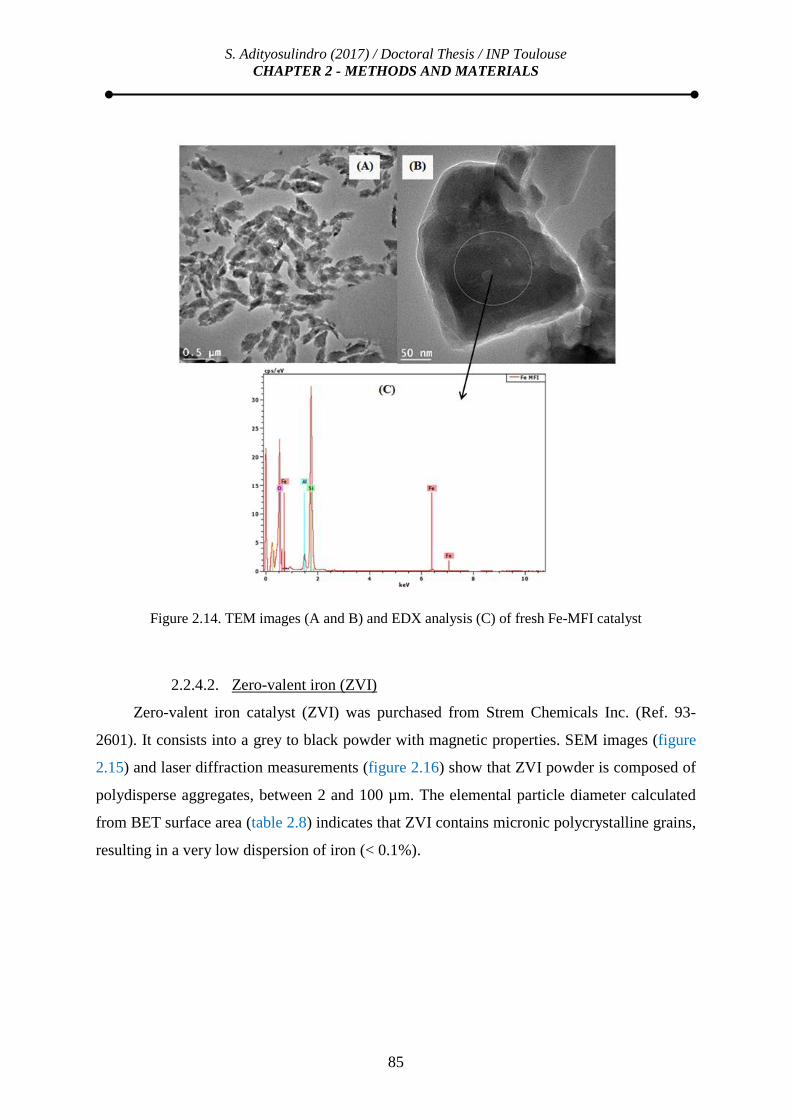
S. Adityosulindro (2017) / Doctoral Thesis / INP Toulouse
CHAPTER 2 - METHODS AND MATERIALS
85
Figure 2.14. TEM images (A and B) and EDX analysis (C) of fresh Fe-MFI catalyst
2.2.4.2. Zero-valent iron (ZVI)
Zero-valent iron catalyst (ZVI) was purchased from Strem Chemicals Inc. (Ref. 93-
2601). It consists into a grey to black powder with magnetic properties. SEM images (figure
2.15) and laser diffraction measurements (figure 2.16) show that ZVI powder is composed of
polydisperse aggregates, between 2 and 100 µm. The elemental particle diameter calculated
from BET surface area (table 2.8) indicates that ZVI contains micronic polycrystalline grains,
resulting in a very low dispersion of iron (< 0.1%).

S. Adityosulindro (2017) / Doctoral Thesis / INP Toulouse
CHAPTER 2 - METHODS AND MATERIALS
86
Figure 2.15. SEM images (A and B) and EDX analysis (C) of fresh ZVI catalyst
Figure 2.16. Particle size distribution of ZVI powder

S. Adityosulindro (2017) / Doctoral Thesis / INP Toulouse
CHAPTER 2 - METHODS AND MATERIALS
87
Figure 2.17. XRD pattern of fresh ZVI
Table 2.8. Properties of ZVI
Properties
Label Iron powder
Fe content (%) 99.9a (88+5)
b
SBET (m2/g) 0.47
c dc,XRD (nm) 45
d
dep (nm) 1620e
Iron dispersion (%) < 0.1f
d43 (μm) 30g
pHpzc 5.8h
Iron content according to asupplier (
bSEM-EDX analysis);
cSpecific surface area measured by N2 porosimetry;
dMean diameter of crystallites calculated from XRD;
eMean diameter of elemental particles calculated from SBET
assuming spherical shape (dep = 6/(SBETρ)); fIron dispersion (%) = 96/dep (nm);
gVolume mean diameter of
agglomerates in dry powder (laser diffraction method) ; hpH at the point of zero charge measured by mass
titration
According to the supplier, ZVI is a pure iron powder (purity 99.9%), but evaluation of
elemental composition by SEM-EDX shows that surface iron content is only of 88+5%.
Detected oxygen and carbon might be due either to the adhesive carbon tape used to stick the
particles for observation or to the presence of a surfactant on the surface. Indeed, the intense
characteristic peaks at 2θ = 44.70, 65.06 and 82.38 confirm that fresh catalyst is mainly in its
reduced state Fe0 (in agreement with JCPDS 65-4899). Main properties of ZVI are given in
table 2.8.
0
5000
10000
15000
20000
25000
30000
10 30 50 70 90
Inte
nsi
ty (
a.u
.)
2 Thêta
S. Adityosulindro (2017) / Doctoral Thesis / INP Toulouse
CHAPTER 2 - METHODS AND MATERIALS
88
2.3. EXPERIMENTAL SETUP
Three types of sono-photochemical reactors have been used in the previous works, i.e.
combined sono-photo-reactor with immersed lamp [175], combined sono-photo-reactor with
external lamp [120,129,170,171] and separate sono- and photo-reactors [33,126,235]. To the
author’s knowledge, there is no report on the advantages and disadvantages of each system.
However, Segura et al. (2009) pointed out that the presence of an ultrasonic field results in
light scattering (due to cavitation bubbles) and thus a lower efficiency for the combined
reactors. Therefore, a system comprising separate sono- and photo-reactors was chosen for
this study.
Experiments were thus performed using two batch glass reactors (sono- and photo-
reactors), either individually or in a loop system. Each was equipped with a jacket connected
to a thermostated bath (F18, Julabo). The suspension was circulated in between the two
reactors by a dual-head peristaltic pump (Masterflex, model 7554-95, Teflon tubing) at a high
flow rate (150 mL/min) to ensure a uniform concentration.
2.3.1. Sono-reactor
The sono-reactor (1000 mL) was of Cup-Horn type and equipped with a pitch blade
impeller (400 rpm), temperature probe, several injection/sampling points. The sonication
probe was placed at the bottom of the reactor and the fitting between glass reactor and
sonication probe was accommodated by Teflon joint braced with a clamp ring (figure 2.18A).
Three sonication devices emitting different frequencies were used in this study (figure
2.18). Note that almost all experiments performed at 20 kHz were carried out in equipment 1.
In addition, it should be mentioned here that experiments with high frequency ultrasound
(ultrasonic equipment 3, figure 2.18D) were conducted in Instituto Superior de Tecnologías y
Ciencias Aplicadas (InSTEC), at University of Habana, Cuba. Properties of the sonication
devices used in this study are given in table 2.9.

S. Adityosulindro (2017) / Doctoral Thesis / INP Toulouse
CHAPTER 2 - METHODS AND MATERIALS
89
Figure 2.18. Ultrasonic equipment 1 mounted in sono-reactor (A), ultrasonic probe of equipment 1
(B), ultrasonic equipment 2 (C), and sono-reactor with ultrasonic equipment 3 (D)
Table 2.9. Characteristics of sonication systems
Properties Equipment 1 2 3
Supplier Sonics &
Materials, Inc. SinapTec
Meinhardt
Ultraschalltechnik
Model VCX750 NexTgen
Inside 500 E/805/T/M
Frequency (kHz) 20 12 / 20 580 – 862
Max nominal power (W)a 180 200 250
Max calorimetric power (W)b 131 156 32
Efficiency (%) 73 78 13
Applied power (W)c 25, 50,75
f, 100 50 12.5
Liquid volume (mL) 1000 (+500f) 1000 250
Applied DUS (W/L)d 25, 50, 100 50 50
Probe diameter (mm) 51 35 40
Applied IUS (W/cm2)e 1.25, 2.45, 4.9 5.2 1
a Nominal power displayed on generator
b Dissipated power measured by calorimetry [236]
c Power used in experiments
d Sonication density : applied power / liquid volume [91]
e Sonication intensity : applied power / probe surface area
[91]
f If coupled with photo-reactor
The actual sonication power was determined by calorimetric method [236]. A vertical
mechanical stirrer was used to ensure the homogeneity of temperature throughout the reactor
and cooling jacket is emptied during the test. Calorimetric sonication power delivered into the
solution (Pcal) can be determined using following equation:
Pcal = (dT/dt) x (Cpw + Cpg) x (Mw + Mg) (E.2.6)

S. Adityosulindro (2017) / Doctoral Thesis / INP Toulouse
CHAPTER 2 - METHODS AND MATERIALS
90
Where Pcal is the calorimetric power (W), dT/dt is the rate of temperature increase (K/s), Cpw
is the specific heat of water = 4181 J/kg.K and Mw is the mass of solution (kg). It should be
noted that the accumulation of heat in the glass reactor wall (in contact with water) was not
taken into account since the corresponding mass (Mg ~ 0.2 kg) and heat (Cpg = 720 J/kg.K for
glass) are much smaller than those of water, thus giving an imprecision of less than 3%.
Calorimetric evaluation of ultrasound equipment 1 is illustrated in figure 2.19, for three
different amplitudes (Amp).
Figure 2.19. Calorimetric evaluation of ultrasonic equipment 1 Amp: Amplitude, Pgen: Electrical power consumed by US generator (W), Pcal: calorimetric power (W)
Furthermore, several parameters can be defined to characterize the ultrasound power
delivered into the solution (suspension) [91]:
22
24
26
28
30
32
34
0 1 2 3 4 5
Tem
per
atu
re (
°C)
Time (min)
Amp 50% Amp 75% Amp 100%
Amp 50% Amp 75% Amp 100%
P (gen) 67 123 181
P (cal) 52 95 131
0
20
40
60
80
100
120
140
160
180
Pow
er (
W)

S. Adityosulindro (2017) / Doctoral Thesis / INP Toulouse
CHAPTER 2 - METHODS AND MATERIALS
91
IUS = Pcal / AP (E.2.7)
DUS = Pcal / V (E.2.8)
EUS = (Pcal x t) / M (E.2.9)
Referred to as IUS: sonication intensity (W/cm2), DUS: sonication density (W/L) and EUS:
specific energy input (kJ/kg), with Pcal: actual power determined by calorimetry (W), AP:
probe area (cm2), V: volume of treated solution or suspension (L), M: weight of treated
solution or suspension (kg), and t: sonication time (s).
2.3.2. Photo-reactor
The photo-reactor (500 mL) consisted in a cylindrical glass reactor with an immersion
lamp contained in a thermostated quartz sleeve. Quartz lamp holder was chosen to ensure that
almost all ultraviolet (UV) and visible irradiation emitted by the tested lamps was transmitted
to the treated solution (>90% light transmittance between 200-1000 nm). A magnetic stirrer
was used to prevent particle settling. For safety reasons, this photochemical reactor was
installed inside a closed cabinet and equipped with an automatic shutdown system if the
temperature of the solution exceeds 60°C and/or the box door was opened (figure 2.20A).
Figure 2.20. Photo-reactor (A) and investigated lamps (B)
Three UV-vis lamps (medium and low pressure mercury lamps and xenon arc lamp
(figure 2.20B), differing by their irradiation spectrum (figures 2.21 and 2.22) and intensity,

S. Adityosulindro (2017) / Doctoral Thesis / INP Toulouse
CHAPTER 2 - METHODS AND MATERIALS
92
were used in this study. The MP Hg lamp was selected due to its wide range of irradiation
spectrum covering UV and visible irradiation. The LP Hg lamp (monochromatic) was chosen
considering its low energy consumption. The Xenon-Arc lamp was selected as a model of
sunlight irradiation. The main characteristics of the lamps are given in table 2.10 and figure
2.23.
Figure 2.21. Spectral distribution of TQ150 lamp (medium pressure Hg vapor lamp) (Data provided by supplier)
Figure 2.22. Spectral distribution of lamp TXE150 lamp (xenon arc lamp) (Data provided by supplier)

S. Adityosulindro (2017) / Doctoral Thesis / INP Toulouse
CHAPTER 2 - METHODS AND MATERIALS
93
Table 2.10. Characteristics of UV-Vis lamps
Characteristics Lamp 1 Lamp 2 Lamp 3
Supplier Peschl Ultraviolet Heraeus Peschl Ultraviolet
Model TQ150 GPH150T5L TXE150
Type MP Hg LP Hg Xenon-Arc
λ (nm) 200 – 577 254 360 – 740
Electric power (W) 150 6 150
Figure 2.23. Irradiation spectrum of the lamps vs. useful ranges for the different photochemical
reactions

S. Adityosulindro (2017) / Doctoral Thesis / INP Toulouse
CHAPTER 2 - METHODS AND MATERIALS
94
Finally, figure 2.24 shows the complete sono-photochemical reactor system.
Figure 2.24. Schematic drawing and photograph of the sono-photochemical reactor system
Photo-reactor
Lamp
Peristaltic
pump
Cooling bath
Sono-reactor
Ultrasound
generator
TC
Sampling tubeThermometer
Stirrer
Stirring
motor
Sonotrode
Transducer
Jacket
Teflon tube
Lamp generator
UV protection cabinet
S. Adityosulindro (2017) / Doctoral Thesis / INP Toulouse
CHAPTER 2 - METHODS AND MATERIALS
95
2.4. EXPERIMENTAL PROCEDURE
As abovementioned, 20 mg/L ibuprofen solution was treated in this work. After
introduction of the solution in the sono-reactor and/or photo-reactor, stirring, thermostat and
pump circulation were turned on. The zero time of the reaction depended on the type of
experiment (homogeneous or heterogeneous, with or without ultrasound/light irradiation).
2.4.1. Homogeneous processes
In homogeneous processes (e.g. Fenton, ultrasound and/or light irradiation, sono-
Fenton, photo-Fenton, etc), a first sample (9 mL) was taken once the desired temperature was
reached (referred to as zero time of the reaction) and oxidation was started by the addition of
H2O2 and/or application of ultrasound. In case of experiment using light irradiation, lamp was
turned on 2 min before in order to attain a constant irradiation prior to the oxidation. In case
of Fenton reaction, ibuprofen solution was previously mixed with iron salt (FeSO4.7H2O) and
the pH was adjusted with 1 M H2SO4 and 1 M NaOH. Aliquots samples (9 mL) were
withdrawn throughout the reaction (t = 5, 10, 30, 60, 120, 180 min).
2.4.2. Heterogeneous processes
When heterogeneous reaction was performed, the solution was first contacted with the
solid catalysts (Fe-MFI or ZVI) under stirring in order to approach the adsorption equilibrium
(adsorption step). After 120 min, 15 mL of solution was withdrawn and this first sampling
corresponded to zero time of the reaction. Oxidation step was starting by addition of H2O2
and/or US application. As for homogeneous process, lamp was turned on 2 min before.
Aliquots samples (9 mL) were withdrawn throughout the reaction (t = 5, 10, 30, 60, 120, 180
min). At the end of experiment with solid catalyst, the suspension was filtered on a
nitrocellulose membrane filter with 0.22 µm pore size (GSWP, Merck Millipore). Final pH,
as well as concentrations of residual H2O2 and leached iron were measured according to the
methods described in section 2.1.1. The recovered Fe-MFI was also analyzed for carbon
content (see § 2.1.2.7).
In order to examine the repeatability, some experiments were duplicated and the
coefficients of variation of the principal parameters such as IBP, TOC and residual H2O2

S. Adityosulindro (2017) / Doctoral Thesis / INP Toulouse
CHAPTER 2 - METHODS AND MATERIALS
96
concentrations did not exceed 5% of the averaged values (example of experiment with error
bars can be found in appendix: figure VI).
2.4.3. Sample preparation for HPLC/UV and TOC analysis
All withdrawn samples containing heterogeneous catalyst were filtered with 0.45 µm
regenerated cellulose (RC) syringe filter (Thermo Scientific National; ref. F2513-7). A
preliminary study showed that retention of ibuprofen on this filter was negligible, contrarily
to 5% retention observed with nylon filter syringe (Fisherbrand; ref. 11812743). The 1 mL
filtered samples were mixed with 1 mL of phosphate buffer before HPLC/UV analysis to
precipitate leached (or dissolved) iron, and filtered again through RC membrane. Phosphate
buffer solution consisted in a mixture of monopotassium phosphate (KH2PO4) 0.05 M and
Na2HPO4.2H2O 0.05 M [58]. All phosphate reagents were purchased from Sigma-Aldrich
(ref. 60220 and 30412).
Table 2.11. Composition of phosphate buffer and quenching solution
Solutions Composition C (mM)
Phosphate buffer KH2PO4 0.05
Na2HPO4.2H2O 0.05
Quenching KH2PO4 0.05
Na2HPO4.2H2O 0.05
KI 0.1
Na2SO3 0.1
Likewise, the rest of sample filtrate (8 mL) was mixed with a quenching solution (3
mL), filtered again through RC membrane then diluted with ultrapure water up to 20 mL
before TOC analysis. The quenching solution was added to withdrawn samples in order to
stop the reaction immediately after sampling. Quenching solution consisted in a mixture of
potassium iodide 0.1 M (KI), sodium sulfite (Na2SO3) 0.1 M and the phosphate buffer. While
the phosphate buffer precipitates solubilized iron, iodide ion (I-) and sodium sulphite
(Na2SO3) reduces residual hydrogen peroxide (H2O2) and radicals according to the following
equations [58,237–239]:
I- +
OH → I
+ OH
- (R.2.3)
2 H+ + 2 I
- + H2O2 → I2 + 2 H2O (R.2.4)
S. Adityosulindro (2017) / Doctoral Thesis / INP Toulouse
CHAPTER 2 - METHODS AND MATERIALS
97
Na2SO3 + H2O2 → Na2SO4 + H2O (R.2.5)
Na2SO3 + I2 (+ H2O) → Na2SO4 + 2 HI (R.2.6)
Recently, it was found that potassium iodide can pass through the halogen filter and
accumulate in the NDIR cell detector of TOC analyzer reducing the lifetime of the NDIR
cell. Therefore, the utilization of potassium iodide should be avoided in further studies before
the installation of specific iodide filter in TOC analyzer.
2.4.4. Experimental data analysis
In chapter 3 and chapter 4, IBP degradation and TOC elimination during the reaction
were presented in terms of normalized concentration (C/C0). In addition, a first-order kinetic
constant (k) for IBP degradation was also estimated from linear regression of the logarithm of
ibuprofen concentration against time:
ln ([IBP]0 / [IBP]t ) = kt → y = ax + b (R.2.7)
k values in each experiment were based on data corresponding to IBP removal level of less
than 60%.
2.5. CONCLUSION
This chapter has given details about the analytical methods used to characterize liquid
samples, as well as solid catalysts studied in this work. The experimental tools have been also
presented. Two batch reactors connected in a loop system have been implemented: a sono-
reactor and a photo-reactor whose main characteristics have been described. Finally, the
operating protocols, including the treatment of the liquid samples before analysis, have been
explained. The following chapters investigate the removal of ibuprofen by homogeneous and
heterogeneous advanced oxidation processes.

S. Adityosulindro (2017) / Doctoral Thesis / INP Toulouse
CHAPTER 2 - METHODS AND MATERIALS
98
This page is intentionally left blank

99
CHAPTER 3 HOMOGENEOUS PROCESSES
As mentioned in the literature section, main limitation of the conventional Fenton
reaction lies in the uneasy regeneration of ferrous iron that may cause wastage of expensive
H2O2 reagent by limiting the pollutant mineralization. Furthermore, high iron salt
concentrations - well above European discharge limit (2 mg/L) - are normally needed to gain
appreciable reactions rates, leading to techno-economic issues related to the formation of
excessive ferric hydroxide sludge and continuous loss of iron especially in large scale
operation. Therefore, activation methods would be of special interest if they can significantly
reduce the required amounts of Fenton’s reagent.
Beyond their ability for direct pollutant lysis or radical generation, ultrasound and
UV/Vis light irradiation have shown to be promising methods for the (re)activation of iron
catalyst, but the underlying mechanisms are complex and their contribution is not easily
appreciable, due to the large number of concomitant processes involved.
In this first chapter dedicated to the degradation of ibuprofen (IBP) by homogeneous
advanced oxidation treatments, the study will progress stepwise, from the separate processes
– sonolysis, photolysis, and Fenton oxidation – then their two-by-two combinations, to
conclude about the benefit(s) of the global hybrid process. At each stage the effect of several
operating parameters on the pollutant conversion and mineralization (Total Organic Carbon
removal) will be investigated, such as pH of the solution, amount of reagents, applied power,
sound frequency or irradiation spectrum etc., in order to get some insight of the implied
phenomena.

100
This page is intentionally left blank

S. Adityosulindro (2017) / Doctoral Thesis / INP Toulouse
CHAPTER 3 – HOMOGENEOUS PROCESSES
101
3.1. IBUPROFEN REMOVAL BY SINGLE PROCESSES
3.1.1. Preliminary considerations: reference conditions of the study
It should be first recalled that a 20 mg/L solution of IBP (just below the molecule
solubility, 21 mg/L at 25°C) was used for all the experiments. This concentration is much
higher that encountered in usual wastewaters, but according to recent reviews on hybrid
processes [240,241], advanced oxidation processes would be better used downstream a pre-
concentration step so as to treat smaller streams, limit radical scavenging and save chemicals.
This concentration also allowed both the liquid and the solid phases to be analyzed with
enough precision to determine the fate of the pollutant during the batch oxidation tests.
The synthetic solution was first prepared in distilled water, leading to a “natural” pH of
4.3. However, other values were also considered, namely 2.6 and 8.0, in order to mimic pH
condition of the Fenton reaction on the one hand, and pH of wastewater effluent on the other
hand (cf. § 3.4).
Regarding chemical oxidation, the stoichiometric amount of H2O2 required for IBP
mineralization was calculated according to reaction R.3.1 (cf. § 2.2.2 for more detail
information):
C13H18O2 + 33 H2O2 → 13 CO2 + 42 H2O (R.3.1)
As shown in figure 3.1, it was checked that simple addition of H2O2 at two times (2x) or
seven times (7x) the stoichiometric amount did not result in any measurable IBP and H2O2
conversion within 3 hours corresponding to the standard reaction time. The same observation
could be made at the two other pH values and confirmed that a catalyst and/or physical
activation process(es) were required to decompose H2O2 into more active species able to
degrade the molecule. On the other hand, addition of ferrous iron catalyst in the absence of
H2O2 did not result in any pollutant conversion.

S. Adityosulindro (2017) / Doctoral Thesis / INP Toulouse
CHAPTER 3 – HOMOGENEOUS PROCESSES
102
Figure 3.1. Effect of addition of H2O2 (alone) or iron salt (without H2O2)
([IBP]0 = 20 mg/L, pH0 = 2 – 8, T = 25°C, [FeSO47H2O]0 = 0.13 mM, [H2O2]0 = 6.4 – 22.4 mM)
With regard to iron catalyst, [H2O2] / [Fe] ratio was set to 48 - corresponding to the
upper bound of the recommended range (between 10 to 50 [62,129,184,242]) - in order to
limit metal concentration in the treated water.
As mentioned previously in chapter 2 (§ 2.3), 20 kHz was chosen as reference ultrasound
frequency considering its practical application in water treatment [60,243]. Likewise, low
pressure mercury vapor lamp irradiating around 254 nm was used as reference equipment for
photochemical processes, due to its moderate cost and successful application in photo-
degradation of pharmaceutical compounds [13,18,19,42,44,139,143,157].
3.1.2. Ultrasound irradiation
Tests described in this section were performed in the sono-reactor only (V = 1000 mL).
3.1.2.1. IBP degradation by ultrasound and its mechanisms
Before applying ultrasound for IBP oxidation, a preliminary sonication test at 20 kHz
was performed in water. It is well known that sonication of water can generate hydroxyl
radicals that should be recombined to form H2O2 (R.3.2 – R.3.7) [95,244,245]. Indeed, it was
found that a small quantity of H2O2 (0.41 µM/min) was formed during sonication, confirming
the occurrence of transient cavitation in the investigated conditions (DUS = 50 W/L,
corresponding to the calorimetric ultrasound power per unit volume).
H2O + ))) → OH +
H (R.3.2)
0.0
0.2
0.4
0.6
0.8
1.0
0 30 60 90 120 150 180
IBP
/IB
Po
Time (min)
FeSO4 H2O2

S. Adityosulindro (2017) / Doctoral Thesis / INP Toulouse
CHAPTER 3 – HOMOGENEOUS PROCESSES
103
OH +
OH → H2O2 (R.3.3)
OH +
H → H2O (R.3.4)
OH +
OOH → H2O + O2 (R.3.5)
OOH +
OOH ↔ H2O2 + O2 (R.3.6)
OOH +
H → H2O2 (R.3.7)
Degradation of IBP by low frequency ultrasound (20 kHz) or sonolysis process is
depicted in figure 3.2. As final conversion was below 50%, time evolution of IBP can be
fitted using both zero (k = 0.0002 mM/min, R2
= 0.992) and first order (0.0035 min-1
, R2
=
0.996) kinetics, but the latter was chosen in accordance with the literature (and to facilitate
comparison with other processes). After 180 min of sonication, 48% of IBP was degraded
and mainly converted to oxidation intermediates, as mineralization yield was only 7%. For
comparison, Xiao and coworkers [41] reported that 60% of IBP was degraded after 60 min of
20 kHz sonication, but they used much higher ultrasound density (DUS = 400 W/L) and
different pH (8.5). Based on the result of HRMS analysis, low TOC conversion in sonolysis
process can be ascribed to the formation of more hydrophilic degradation products such as 1-
hydroxyibuprofen and 2-hydroxyibuprofen (log Kow = 2.25 [246]).
As mentioned in the literature section, organic compounds can be degraded under
ultrasound (US) irradiation in three different zones: inside cavitation bubble (R.3.8) and/or at
the bubble-liquid interface and/or in the solution bulk (R.3.2 and R.3.9), depending on the
volatility and hydrophobicity of the molecule [40,41,98,103].
Pollutant + ))) → degradation products (R.3.8)
Pollutant + OH → degradation products (R.3.9)
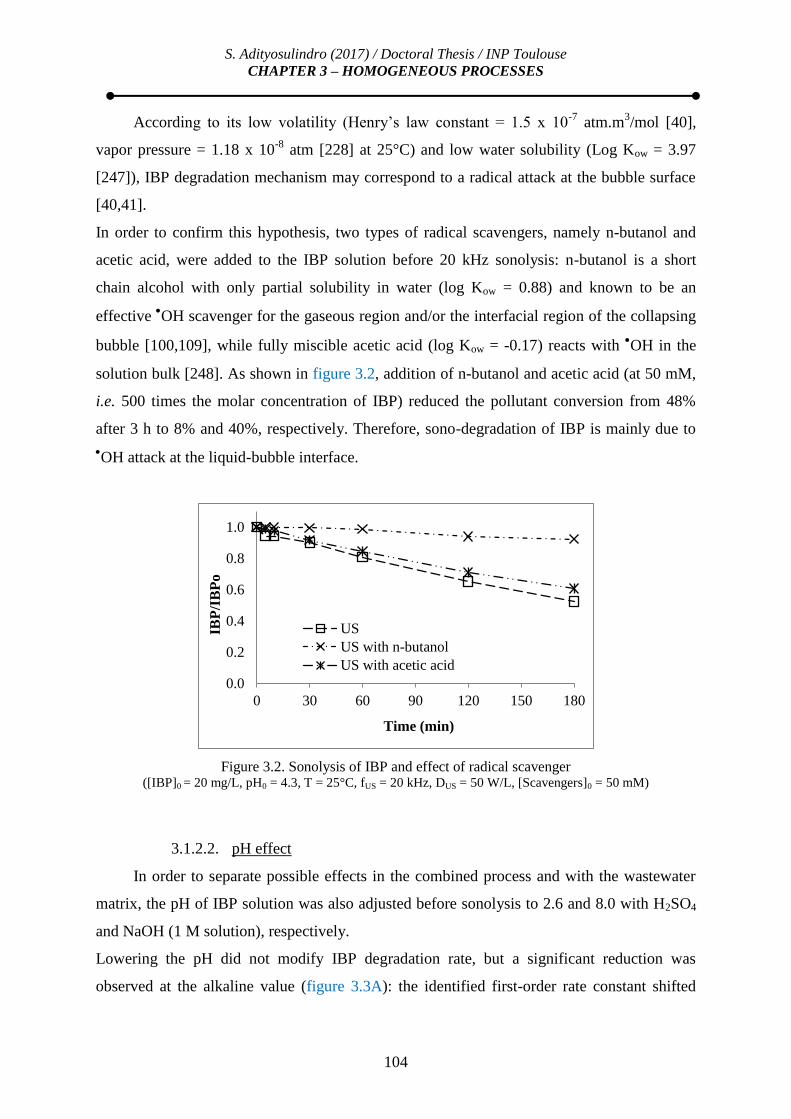
S. Adityosulindro (2017) / Doctoral Thesis / INP Toulouse
CHAPTER 3 – HOMOGENEOUS PROCESSES
104
According to its low volatility (Henry’s law constant = 1.5 x 10⁻⁷
atm.m3/mol [40],
vapor pressure = 1.18 x 10⁻⁸
atm [228] at 25°C) and low water solubility (Log Kow = 3.97
[247]), IBP degradation mechanism may correspond to a radical attack at the bubble surface
[40,41].
In order to confirm this hypothesis, two types of radical scavengers, namely n-butanol and
acetic acid, were added to the IBP solution before 20 kHz sonolysis: n-butanol is a short
chain alcohol with only partial solubility in water (log Kow = 0.88) and known to be an
effective OH scavenger for the gaseous region and/or the interfacial region of the collapsing
bubble [100,109], while fully miscible acetic acid (log Kow = -0.17) reacts with OH in the
solution bulk [248]. As shown in figure 3.2, addition of n-butanol and acetic acid (at 50 mM,
i.e. 500 times the molar concentration of IBP) reduced the pollutant conversion from 48%
after 3 h to 8% and 40%, respectively. Therefore, sono-degradation of IBP is mainly due to
OH attack at the liquid-bubble interface.
Figure 3.2. Sonolysis of IBP and effect of radical scavenger ([IBP]0 = 20 mg/L, pH0 = 4.3, T = 25°C, fUS = 20 kHz, DUS = 50 W/L, [Scavengers]0 = 50 mM)
3.1.2.2. pH effect
In order to separate possible effects in the combined process and with the wastewater
matrix, the pH of IBP solution was also adjusted before sonolysis to 2.6 and 8.0 with H2SO4
and NaOH (1 M solution), respectively.
Lowering the pH did not modify IBP degradation rate, but a significant reduction was
observed at the alkaline value (figure 3.3A): the identified first-order rate constant shifted
0.0
0.2
0.4
0.6
0.8
1.0
0 30 60 90 120 150 180
IBP
/IB
Po
Time (min)
US
US with n-butanol
US with acetic acid

S. Adityosulindro (2017) / Doctoral Thesis / INP Toulouse
CHAPTER 3 – HOMOGENEOUS PROCESSES
105
from 0.0035 to 0.0020 min-1
. It can be explained by the different forms of IBP at a given pH.
As the pKa of its carboxyl group is 4.9, IBP is in molecular form at pH 2.6 and 4.3 (natural
pH), but fully deprotonated at pH 8.0. In ionic form, IBP should be less accumulated at the
surface of the cavitation bubbles, where radical attacks mainly occurred. This result is also in
agreement with previous studies on the sonolysis of ibuprofen [40], diclofenac [99],
dicloxacilin [249] and paracetamol [125], that showed a reduction of the degradation rate at a
pH value higher than the pKa of the molecule.
In all cases, removal of total organic carbon (TOC) remained below 8% (figure 3.3B).
Figure 3.3. Effect of the solution pH on: (A) IBP and (B) TOC removal by sonolysis ([IBP]0 = 20 mg/L, pH0 = 2.6 – 8, T = 25°C, fUS = 20 kHz, DUS = 50 W/L)
3.1.2.3. Effect of ultrasound density
Three levels of ultrasound density (DUS) - 25, 50 and 100 W/L - were tested during 180
min, corresponding to a specific energy input (EUS) of 270, 540 and 1080 kJ/kg, respectively.
0.0
0.2
0.4
0.6
0.8
1.0
0 30 60 90 120 150 180
IBP
/IB
Po
Time (min)
A
pH 2.6 pH 4.3 pH 8
0.0
0.2
0.4
0.6
0.8
1.0
0 30 60 90 120 150 180
TO
C/T
OC
o
Time (min)
B
pH 2.6 pH 4.3 pH 8

S. Adityosulindro (2017) / Doctoral Thesis / INP Toulouse
CHAPTER 3 – HOMOGENEOUS PROCESSES
106
Figure 3.4. Effect of ultrasound density on IBP sonolysis: (A) IBP concentration-time profile, (B)
first-order rate constant and (C) TOC concentration-time profile ([IBP]0 = 20 mg/L, pH0 = 4.3, T = 25°C, fUS = 20 kHz, DUS = 25 – 100 W/L)
As shown in figure 3.4A, the degradation rate of IBP increased with increasing DUS in
the investigated range. This could be explained by a higher number of collapsing bubbles that
0.0
0.2
0.4
0.6
0.8
1.0
0 30 60 90 120 150 180
IBP
/IB
Po
Time (min)
A
25 W/L 50 W/L 100 W/L
0
1
2
3
4
5
6
0 25 50 75 100 125
Rate
con
stan
t (1
0-3
/min
)
Power density (W/L)
B
0.0
0.2
0.4
0.6
0.8
1.0
0 30 60 90 120 150 180
TO
C/T
OC
o
Time (min)
C
25 W/L 50 W/L 100 W/L
S. Adityosulindro (2017) / Doctoral Thesis / INP Toulouse
CHAPTER 3 – HOMOGENEOUS PROCESSES
107
enhanced the formation of hydroxyl radicals. An optimum value of DUS should be expected,
due to bubble cloud formation on the emitter surface absorbing or scattering the sound waves
above a critical value [250], but due to the limitation of our ultrasonic equipment it could not
be attained. Calculated first-order rate constants were as follows: k25W/L = 0.0024 min-1
(R2
=
0.992), k50W/L = 0.0035 min-1
(R2
= 0.996), k100W/L = 0.0048 min-1
(R2
= 0.994), showing
however that the positive effect of DUS already leveled off (figure 3.4B). Moreover, the
enhancement of TOC removal by increasing DUS was also negligible (figure 3.4C).
Therefore, ultrasound density of 50 W/L was chosen as reference.
3.1.2.4. Effect of sonication frequency
The influence of frequency on sonochemistry is complex. Despite cavitation threshold
increases and less energy is released upon collapse at high frequency (>100 kHz), fewer
acoustic cycles are required for the bubbles to reach their resonant size [251]. Moreover,
more radicals can escape before being recombined due to faster collapse and smaller bubbles
[252]. Therefore, high frequency is usually preferred for “pure” sonochemistry applications.
As part of a collaborative work with Instec Cuba, two high US frequencies (580 and
862 kHz) were thus investigated for the sonolysis of IBP (details on the corresponding
equipment is also provided in chapter 2). In addition, an audible frequency (12 kHz) was also
applied to further evaluate the impact of this parameter in the low value range.
According to figure 3.5A, IBP removal after 180 min was increased from 48% to 87%
when increasing fUS in the 20 - 862 kHz range. Degradation rates followed a first-order
kinetic trend with: k20kHz = 0.0035 min-1
(R2=0.996), k580kHz = 0.0084 min
-1 (R
2=0.984) and
k862kHz = 0.0102 min-1
(R2=0.959) (figure 3.5B). Close values obtained at 580 and 862 kHz
could be explained by similar OH effective production rate, as reported by Güyer and Ince
on an analogous high fUS equipment by monitoring H2O2 concentration [99]. An optimal
frequency for radical-mediated sonolysis was also observed by these authors at 861 kHz as
the consequence of abovementioned antagonist effects at high frequency.

S. Adityosulindro (2017) / Doctoral Thesis / INP Toulouse
CHAPTER 3 – HOMOGENEOUS PROCESSES
108
Figure 3.5. Effect of sonication frequency on IBP sonolysis: (A) IBP concentration-time profile, (B)
first-order rate constant, (C) TOC concentration-time profile ([IBP]0 = 20 mg/L, pH0 = 4.3, T = 25°C, fUS = 12-862 kHz, DUS = 50 W/L)
Interestingly, audible frequency (12 kHz) was able to only slightly degrade IBP (16%
after 3 h, k12kHz = 0.0008 min-1
). Corresponding H2O2 generation rate was 0.18 µM/min vs.
0.0
0.2
0.4
0.6
0.8
1.0
0 30 60 90 120 150 180
IBP
/IB
Po
Time (min)
A
12 kHz 20 kHz 580 kHz 862 kHz
0
2
4
6
8
10
12
0 200 400 600 800 1000
Rate
con
stan
t (1
0-3
/min
)
f us (kHz)
B
12 kHz
20 kHz
580 kHz
862 kHz
0.0
0.2
0.4
0.6
0.8
1.0
0 30 60 90 120 150 180
TO
C/T
OC
o
Time(min)
C
12 kHz 20 kHz 580 kHz 862 kHz

S. Adityosulindro (2017) / Doctoral Thesis / INP Toulouse
CHAPTER 3 – HOMOGENEOUS PROCESSES
109
0.41 µM/min for 20 kHz irradiation, which confirmed the similar evolution of H2O2
generation and IBP degradation rates. This significant loss of efficiency from 20 to 12 kHz is
in complete contrast with the gain observed in sludge treatment where radical formation is
not involved [89,253].
In all cases, total organic carbon (TOC) removal was low: 2%, 7%, 10% and 11%
under 12, 20, 580 and 862 kHz irradiation, respectively (figure 3.5C).
3.1.2.5. Effect of H2O2 addition on 20 kHz sonolysis
Several previous studies mentioned that addition of H2O2 could significantly enhance
the efficacy of US-based water treatment process [129,192]. Indeed, even if it had only a
negligible effect on IBP degradation in its molecular form (cf. § 3.1.1), it is expected to be
decomposed by US and/or to react with H generated by water sonolysis (R.3.2) thus
generating additional OH (R.3.10 and R.3.11) [95,192].
H2O2 + ))) → 2 OH (R.3.10)
H2O2 + H →
OH + H2O (R.3.11)
On the other hand, a too large excess of H2O2 can be deleterious, as hydroxyl radicals
can also react with H2O2 to the detriment of organic molecules, generating less active
hydroperoxyl radicals [109,174,192] (R.3.12).
H2O2 + OH →
OOH + H2O (R.3.12)
This complex interaction usually leads to an optimum value for H2O2 dosage. This
optimum H2O2/pollutant molar ratio was found to vary in between 19 and 280, depending on
solution pH, ultrasound parameters and nature of the pollutant [95,192]. The latter was found
to be an important factor, as volatile and hydrophobic compounds are normally not affected
by addition of H2O2 [95].
In this study, two and seven times the stoichiometric amount of H2O2 (calculated
according to R.3.1) were added, which corresponded to 6.4 mM and 22.4 mM, respectively
(for 0.1 mM of IBP). They matched the doses applied for the Fenton oxidation of the
molecule (cf. § 3.1.3), and were thus much higher than that generated by the sole sonolysis

S. Adityosulindro (2017) / Doctoral Thesis / INP Toulouse
CHAPTER 3 – HOMOGENEOUS PROCESSES
110
(0.41 µM/min). Alkaline conditions were also investigated, as the sono-degradation of IBP
was previously found to be reduced for pH > pKa of the molecule. The corresponding
concentration-time profiles of the pollutant are exhibited on figure 3.6A and figure 3.6B for
the two pH levels (4.3 and 8.0), respectively. The oxidation results under silent conditions are
also recalled for comparison purpose.
Figure 3.6. Effect of H2O2 addition on IBP and TOC removal under sonolysis: IBP removal at pH0 =
4.3 (A) and 8.0 (B); TOC removal at pH0 = 4.3 (C) and 8.0 (D) ([IBP]0 = 20 mg/L, T = 25°C, fUS = 20 kHz with DUS = 50 W/L, [H2O2]0 = 0 – 22.4 mM)
First, at natural pH, addition of two times (2x) the stoichiometric amount of H2O2 did
not modify IBP sono-oxidation rate, while a slight decrease was observed for the highest
amount of oxidant. These results are thus in agreement with studies reporting negligible [174]
or detrimental effect of H2O2 [97] for hydrophobic compounds and low frequency US. The
existence of different reaction zones for IBP (bubble surface) and H2O2 (bulk solution) could
be hypothesized to explain why H2O2 did not help the pollutant degradation under US
irradiation [97], while its scavenging effect at high concentration (R.3.12) could explain the
results observed at 22.4 mM. In the first hypothesis, part of the ultrasound energy should be
spent for H2O2 decomposition which in turn would be partly wasted into H2O or O2 by radical
recombination (R.3.4 and R.3.5). However, no decomposition of H2O2 was measured at the
S. Adityosulindro (2017) / Doctoral Thesis / INP Toulouse
CHAPTER 3 – HOMOGENEOUS PROCESSES
111
lowest concentration, excluding this mechanism. The oxidation of IBP by OH (R.3.9)
exhibits a rate constant of 6.5·109 L/(mol.s) at ambient temperature [229], which is much
higher than that reported for the reaction in between H2O2 and OH (R.3.12): 2.7·10
7
L/(mol.s) [254]. However, at the largest excess of H2O2 (22.4 mM vs. 0.1 mM of IBP), the
rates of the two reactions become comparable, confirming a possible competition effect.
On the other hand, at alkaline pH, a slight H2O2 sonolysis was observed (5%
conversion after 3 h) and accelerated the pollutant oxidation at 6.4 mM (figure 3.6B),
although not reaching the degradation yield observed at pH 4.3. Note that H2O2 is a weak
acid with a pKa value of 11.8 [255], therefore it is only marginally decomposed at pH = 8.0
as seen under silent conditions.
Finally, it should be mentioned that TOC conversion was marginally modified by the
addition of H2O2 (figures 3.6C and 3.6D).
3.1.3. Light irradiation (UV, Vis and UV-Vis)
3.1.3.1. IBP degradation under monochromatic UV light (254 nm) irradiation
and its mechanisms
Photolysis experiments were first performed using a 6W low pressure mercury vapor
lamp (LP Hg) with main light emission at 254 nm, under the following operating conditions:
irradiated volume = 500 mL (only photo-reactor was used here), pH0 = 4.3 (natural pH), T =
25°C. After 3 hours of irradiation, 69% of IBP was converted (figure 3.7) and a
mineralization yield of 12% was achieved. Assuming first-order kinetics with respect to IBP
as proposed in literature [42,135,139], the following rate constant was obtained: k = 0.0063
min-1
(R2 = 0.9805).
According to previous studies, ibuprofen (IBP) degradation by ultraviolet (UV)
irradiation can occur through several possible mechanisms:
(i) direct photo-degradation of the molecule: IBP is transformed by photon absorption
into excited IBP (IBP*), which then undergoes bond scission (R.3.13 – R.3.14) [133,135],
(ii) photo-sensitization: IBP* transfers its energy to dissolved oxygen and generates a
high energy form of oxygen (called singlet molecular oxygen (1O2)) which subsequently
attacks IBP (R.3.15 – R.3.16) [133,135], or produces active radicals according to reactions
R.3.17 – R.3.20 [137,138],

S. Adityosulindro (2017) / Doctoral Thesis / INP Toulouse
CHAPTER 3 – HOMOGENEOUS PROCESSES
112
(iii) UV-driven homolysis of water which produces OH [44,140,141]. However,
considering the emission spectrum of LP Hg lamp, this mechanism should thus be excluded
here, as water photolysis occurs only below 200 nm.
IBP + hv (λ = 200 – 280 nm) → IBP* (R.3.13)
IBP* → degradation products (R.3.14)
IBP* + 3O2 → IBP +
1O2 (R.3.15)
IBP + 1O2 → degradation products (R.3.16)
IBP* + O2 → IBP+
+ O2-
(R.3.17)
O2-
+ 2H+ → H2O2 + O2 (R.3.18)
H2O2 + hv (λ = 185 – 200 nm) → 2 OH (R.3.19)
OH / O2
- + IBP → degradation products (R.3.20)
UV absorption spectrum of IBP (figure 3.8) exhibits a maximum at 222 nm and a weak
peak around 255 – 265 nm which might be sufficient to induce molecule degradation by
direct photolysis or through photo-sensitization reactions involving IBP*.
As some of the reported mechanisms involve radical pathways, methanol was added as
radical scavenger to evaluate their contribution. Since methanol absorbs light at wavelength
lower than 240 nm, its addition should not lower the photon absorption by IBP under 254 nm
irradiation, nor quenched the possible contribution of 1O2 [135]. In the presence of 50 mM
methanol, IBP degradation yield and rate constant were reduced to 47% (figure 3.7) and
0.0035 min-1
, respectively. A plausible explanation for this observation may be related to the
possibility that photo-sensitization reactions produced active radicals (R.3.17 – R.3.20)
[133,256]. Furthermore, an additional experiment carried out under anoxic condition
(solution was bubbled with N2) showed similar result as the addition of methanol (IBP
removal 50%, rate constant 0.0038 min-1
) indicating negligible contribution of 1O2.

S. Adityosulindro (2017) / Doctoral Thesis / INP Toulouse
CHAPTER 3 – HOMOGENEOUS PROCESSES
113
Therefore, it can be concluded that degradation of IBP under UV light irradiation (λ = 254
nm, pH = 4.3) is mainly due to direct photolysis (R.3.13 – R.3.14) and to a lesser extent to
radical mechanism (R.3.17 – R.3.20).
Figure 3.7. IBP photolysis and effect of radical scavenger or oxygen depletion ([IBP]0 = 20 mg/L, pH0 = 4.3, T = 25°C, irradiated volume = 500 mL, lamp = 6W LP Hg)
Figure 3.8. Effect of pH on UV absorption spectrum of IBP ([IBP] = 20 mg/L)
0.0
0.2
0.4
0.6
0.8
1.0
0 30 60 90 120 150 180
IBP
/IB
Po
Time (min)
UV UV+Methanol UV+N2

S. Adityosulindro (2017) / Doctoral Thesis / INP Toulouse
CHAPTER 3 – HOMOGENEOUS PROCESSES
114
3.1.3.2. pH effect
As for sonolysis, the effect of pH on IBP photolysis was investigated using three levels
(2.6, 4.3 and 8.0).
Figure 3.9. Effect of the solution pH on IBP photolysis: (A) IBP concentration-time profile, (B) first-
order rate constant, (C) TOC concentration-time profile ([IBP]0 = 20 mg/L, pH0 = 2.6 – 8.0, T = 25°C, irradiated volume = 500 mL, lamp = 6W LP Hg)
0.0
0.2
0.4
0.6
0.8
1.0
0 30 60 90 120 150 180
IBP
/BP
o
Time (min)
A
pH 2.6 pH 4.3 pH 8
0
3
6
9
12
0 2 4 6 8 10
Rate
con
stan
t (1
0-3
/min
)
pH
B
0.0
0.2
0.4
0.6
0.8
1.0
0 30 60 90 120 150 180
TO
C/T
OC
o
Time (min)
C
pH 2.6 pH 4.3 pH 8

S. Adityosulindro (2017) / Doctoral Thesis / INP Toulouse
CHAPTER 3 – HOMOGENEOUS PROCESSES
115
Figure 3.9A shows that the degradation of IBP was enhanced when increasing the pH
of the solution and followed a first-order kinetic trend with: kpH2.6 = 0.0035 min-1
(R2
=
0.9663), kpH4.3 = 0.0063 min-1
(R2
= 0.9805) and kpH8.0 = 0.0116 min-1
(R2
= 0.9813). The plot
of these rate constants on figure 3.9B revealed an almost linear increase with respect to pH
value. Regarding TOC removal (figure 3.9C), main improvement seemed to occur at the
alkaline pH value for which up to 19% mineralization was observed.
At pH 8.0, IBP molecule is mainly in anionic form and it seems to be more photo-
active [139]. To evaluate this effect, the absorbance of ibuprofen at the different pH values
was measured in the 200-300 nm range: the corresponding spectra indicate that IBP absorbs
more light at higher pH (figure 3.8). However, it did not explain the gap between photolysis
under pH 2.6 and 4.3.
3.1.3.3. Effect of irradiated volume fraction
As described in chapter 2, two distinct reactors were used to investigate sono- and
photo-based processes and the solution was circulated in between the two by means of a
peristatic pump for coupling tests (loop reactor system). Thus for a proper comparison of the
corresponding effects, photolysis experiments were also performed for the same
configuration of partly irradiated volume (500 mL vs. 1.5 L of total volume) with ultrasound
OFF.
As seen in figure 3.10A, this new configuration led to a decrease of final IBP
conversion from 69% to 40%, which is expected considering the larger volume to be treated
and its partial irradiation. On the other hand, TOC removal was slightly higher in the loop
reactor system (figure 3.10B). In this case, less degradation products were formed (lower IBP
conversion), that could absorb light and limit photo-sensitization reactions if less photo-active
than IBP. Note that higher mineralization in loop reactor system vs. unique photo-reactor has
already been reported in literature [133].

S. Adityosulindro (2017) / Doctoral Thesis / INP Toulouse
CHAPTER 3 – HOMOGENEOUS PROCESSES
116
Figure 3.10. Effect of irradiated volume fraction on IBP photolysis: (A) IBP and (B) TOC
concentration-time profiles ([IBP]0 = 20 mg/L, pH0 = 4.3, T = 25°C, irradiated volume = 500 mL, total volume = 500 and 1500 mL, lamp =
6W LP Hg)
3.1.3.4. Effect of lamp type (irradiation spectrum)
Three different lamps varying from their emission spectrum, namely LP Hg (6W, λ =
254 nm), Xe (150W, λ = 360 – 740 nm) and UV-Vis (150W, λ = 200 – 577 nm), were
evaluated for IBP photolysis in the loop reactor configuration.
As expected, IBP was very stable under visible irradiation (Xe lamp) due to a negligible
absorption in the visible region (figure 3.11A). This observation also suggests that photo-
degradation of IBP by sunlight should be very limited in the natural environment.
On the other hand, fast degradation until complete removal of IBP was observed under
UV-Vis irradiation (k = 0.0567 min-1
, R2
= 0.9969). This result is in agreement with Shu and
coworkers [18] who found that MP Hg lamp can effectively degrade IBP (k = 0.097 min-1
, R2
= 0.998). The superior performance of MP Hg lamp compared to LP Hg lamp could be
0.0
0.2
0.4
0.6
0.8
1.0
0 30 60 90 120 150 180
IBP
/IB
Po
Time (min)
A
6W / 0.5 L (batch reactor 100% irradiated)
6W / 1.5 L (loop reactor 33% irradiated)
0.0
0.2
0.4
0.6
0.8
1.0
0 30 60 90 120 150 180
TO
C/T
OC
o
Time (min)
B
6W / 0.5 L (batch reactor 100% irradiated)
6W / 1.5 L (loop reactor 33% irradiated)

S. Adityosulindro (2017) / Doctoral Thesis / INP Toulouse
CHAPTER 3 – HOMOGENEOUS PROCESSES
117
ascribed to both higher power and larger emission band in the UVC region. As
abovementioned (§ 3.1.3.1), UVC wavelength (200 – 280 nm) can promote both direct and
indirect photo-degradation of IBP. In terms of mineralization efficiency (figure 3.11B), 45%
of TOC was removed after 3 h of irradiation with MP Hg lamp vs. 19% for LP Hg. These
findings are in agreement with previous studies reporting that degradation products formed
during photolysis were less photoactive, resulting in TOC conversion less than 50% [42,44].
Figure 3.11. Effect of lamp type on IBP photolysis: (A) IBP and (B) TOC concentration-time profiles ([IBP]0 = 20 mg/L, pH0 = 4.3, T = 25°C, irradiated volume = 500 mL, total volume = 1500 mL, lamp = 6W
LP Hg, 150W Xe, or 150W MP Hg)
3.1.3.5. Effect of H2O2 addition
Hydrogen peroxide (H2O2) was proven to be an effective promoter in photo-initiated
oxidation reactions [37,257]: under UV irradiation, H2O2 can be excited and undergo O-O
bond scission, producing highly reactive hydroxyl radicals (R.3.19) [60,133].
0.0
0.2
0.4
0.6
0.8
1.0
0 30 60 90 120 150 180
IBP
/IB
Po
Time (min)
A
LP Hg (6W, 254 nm)
Xe (150W, 360-740 nm)
MP Hg (150W, 200-577 nm)
0.0
0.2
0.4
0.6
0.8
1.0
0 30 60 90 120 150 180
TO
C/T
OC
o
Time (min)
B
LP Hg (6W, 254 nm)
Xe (150W, 360-740 nm)
MP Hg(150W, 200-577 nm)

S. Adityosulindro (2017) / Doctoral Thesis / INP Toulouse
CHAPTER 3 – HOMOGENEOUS PROCESSES
118
Figure 3.12. Effect of H2O2 concentration on photo-oxidation of IBP: (A) IBP and (B) TOC
concentration-time profiles, and (C) H2O2 consumption ([IBP]0 = 20 mg/L, pH0 = 4.3, T = 25°C, irradiated volume = 500 mL, total volume = 1500 mL, lamp = 6W LP
Hg, [H2O2]0 = 0 – 22.4 mM)
0.0
0.2
0.4
0.6
0.8
1.0
0 30 60 90 120 150 180
IBP
/IB
Po
Time (min)
A
0 mM 1.6 mM 6.4 mM 22.4 mM
0.0
0.2
0.4
0.6
0.8
1.0
0 30 60 90 120 150 180
TO
C/O
Co
Time (min)
B
0 mM 1.6 mM 6.4 mM 22.4 mM
0
4
8
12
16
20
24
1.6 mM 6.4 mM 22.4 mM
[H2O
2]
(mM
)
C Consumed Remaining

S. Adityosulindro (2017) / Doctoral Thesis / INP Toulouse
CHAPTER 3 – HOMOGENEOUS PROCESSES
119
Figure 3.13. Effect of lamp type on photo-oxidation of IBP: (A) IBP and (B) TOC concentration-time
profiles, and (C) H2O2 consumption ([IBP]0 = 20 mg/L, pH0 = 4.3, T = 25°C, irradiated volume = 500 mL, total volume = 1500 mL, lamp = 6W LP
Hg (UV), 150W Xe (Vis), or 150W MP Hg (UV-Vis), [H2O2]0 = 6.4 mM). Photolysis results are recalled for
comparison purpose
0.0
0.2
0.4
0.6
0.8
1.0
0 30 60 90 120 150 180
IBP
/IB
Po
Time (min)
A
Xe LP Hg MP Hg
Xe/H2O2 LP Hg/H2O2 MP Hg/H2O2
0.0
0.2
0.4
0.6
0.8
1.0
0 30 60 90 120 150 180
TO
C/T
OC
o
Time (min)
B
Xe LP Hg MP Hg
Xe/H2O2 LP Hg/H2O2 MP Hg/H2O2
0
2
4
6
8
LP Hg/H2O2 Xe/H2O2 MP Hg/H2O2
[H2O
2]
(mM
)
C Consumed Remaining

S. Adityosulindro (2017) / Doctoral Thesis / INP Toulouse
CHAPTER 3 – HOMOGENEOUS PROCESSES
120
The effect of H2O2 addition was first studied with 6W LP Hg lamp (in loop reactor
configuration). A set of experiments varying H2O2 concentration from 1.6 to 22.4 mM (0.5 to
7 times the stoichiometric amount) was performed, whose results are depicted on figure 3.12.
IBP degradation rate increased with increasing H2O2 concentration up to 6.4 mM (k varying
from 0.0028 min-1
without H2O2 to 0.0664 min-1
at 6.4 mM). However, further increase to
22.4 mM did not show additional benefit. As previously seen under ultrasound, the existence
of an optimum H2O2 concentration could be explained by the scavenging of OH at high
H2O2 concentration (R.3.12).
On the other hand, addition of H2O2 only modestly improved TOC conversion with
similar optimum dose found at 6.4 mM. Moreover, it was observed that LP Hg lamp was only
able to partly convert H2O2 (figure 3.12C). This was not expected considering the overlapping
of H2O2 adsorption spectrum (λmax = 200 – 280 nm) with the maximum emission of LP Hg
lamp (λmax = 254 nm). However, comparison with existing literature is rather difficult due to
the lack of information in terms of H2O2 consumption in other studies. Then, the effect of 6.4
mM H2O2 was assessed for the two other lamps (MP Hg and Xe), figure 3.13.
Degradation of IBP under Vis/H2O2 was not expected due to the negligible absorbance
of IBP and H2O2 above 280 and 300 nm, respectively. However, according to the
manufacturer of the xenon lamp, if 97% of its emission is in the 400-740 nm range, it also
exhibits a small portion (3%) at lower wavelength range. In addition, it should be mentioned
that several studies reported that xenon lamp has emission at wavelengths as low as 300 nm
[13,20,136,158,164]. This might be responsible for a weak H2O2 decomposition (figure
3.13B), resulting into 15% of IBP conversion after 3 h. Measurement of H2O2 absorption
spectrum also indicates a small absorbance in UVA region (cf. chapter 2, figure 2.9).
Conversely, significant enhancement due to H2O2 addition was observed with MP Hg
lamp, resulting in a 5-fold increase of the rate constant (from 0.0567 to 0.261 min-1
).
However this improvement was less remarkable than with LP Hg lamp (24-fold increase),
because photolysis of IBP was already very effective with MP Hg lamp, and thus H2O2
decomposition contributed to a lesser extent to IBP degradation.
On the other hand, the combination of H2O2 and MP Hg lamp was more effective for
TOC removal as complete mineralization was achieved after 3 h vs. only 30% by LP
Hg/H2O2. Analysis of H2O2 concentration at the end of reaction showed 14%, 5% and 99%
consumption for LP Hg, Xe and MP Hg lamp, respectively. Therefore, the remarkable
performance of MP Hg/H2O2 process in mineralization of IBP could be ascribed to both high
S. Adityosulindro (2017) / Doctoral Thesis / INP Toulouse
CHAPTER 3 – HOMOGENEOUS PROCESSES
121
power and wide UV-C spectral emission inducing an effective direct photolysis and photo-
decomposition of H2O2 reactions.
3.1.4. Fenton oxidation
Classical Fenton oxidation (without activation technique) generally uses relatively high
iron concentration (>10 mg/L i.e. 0.18 mM) and the few works which investigated ibuprofen
removal by homogeneous Fenton reaction used iron concentration as high as 1 mM [38,258].
Conversely, in this study, much lower concentrations, in the 0.033-0.134 mM range (1.8-7.5
mg/L) were investigated, interestingly close to the iron discharge limit (2 mg/L or 0.035
mM).
A H2O2 dosage corresponding to either half the stoichiometric amount required for
mineralization (see R.3.1) or to a limited excess (2x) was applied to avoid extensive hydroxyl
radical scavenging [58,86,120], while the [H2O2] / [Fe] molar ratio was always set to 48.
Reactions were performed in the same reactor as used for sono-mediated processes (but under
silent conditions).
Thereby, three levels of Fenton’s reagent concentration were applied: (i) [Fe2+
]0 =
0.033 mM and [H2O2]0 = 1.6 mM (referred to as “F(-)”), (ii) [Fe2+
]0 = 0.067 mM and [H2O2]0
= 3.2 mM (“F(med)”) and (iii) [Fe2+
]0 = 0.134 mM and [H2O2]0 = 6.4 mM (“F(+)”).
In the presence of Fenton’s reagent, a fast oxidation of IBP was observed in the first 5
minutes followed by a much slower degradation (figure 3.14A), which cannot be fitted either
with first or second order kinetics. This behavior is consistent with that reported in previous
studies [38,63,258,259] where it was explained by radical pathway at acidic pH. A
supplementary experiment in the presence of methanol as radical scavenger confirmed that
the degradation of ibuprofen in homogeneous-Fenton reaction was indeed due to radical
mechanism (figure 3.15).
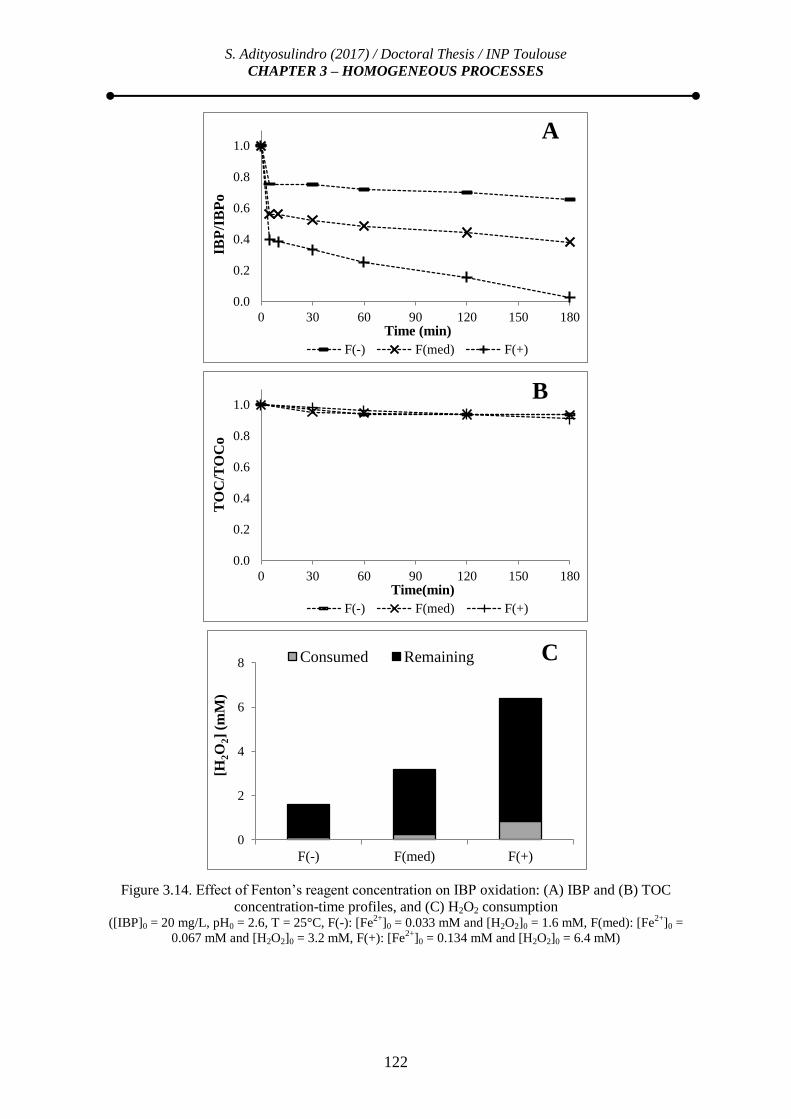
S. Adityosulindro (2017) / Doctoral Thesis / INP Toulouse
CHAPTER 3 – HOMOGENEOUS PROCESSES
122
Figure 3.14. Effect of Fenton’s reagent concentration on IBP oxidation: (A) IBP and (B) TOC
concentration-time profiles, and (C) H2O2 consumption ([IBP]0 = 20 mg/L, pH0 = 2.6, T = 25°C, F(-): [Fe
2+]0 = 0.033 mM and [H2O2]0 = 1.6 mM, F(med): [Fe
2+]0 =
0.067 mM and [H2O2]0 = 3.2 mM, F(+): [Fe2+
]0 = 0.134 mM and [H2O2]0 = 6.4 mM)
0.0
0.2
0.4
0.6
0.8
1.0
0 30 60 90 120 150 180
IBP
/IB
Po
Time (min)
A
F(-) F(med) F(+)
0.0
0.2
0.4
0.6
0.8
1.0
0 30 60 90 120 150 180
TO
C/T
OC
o
Time(min)
B
F(-) F(med) F(+)
0
2
4
6
8
F(-) F(med) F(+)
[H2O
2]
(mM
)
C Consumed Remaining

S. Adityosulindro (2017) / Doctoral Thesis / INP Toulouse
CHAPTER 3 – HOMOGENEOUS PROCESSES
123
According to this mechanism, the initial reaction stage corresponded to the fast
hydroxyl radical generation from reaction between ferrous ions and hydrogen peroxide
(R.3.21). Then, formation of stable ferric complexes, such as Fe-OOH2+
(R.3.22 and R.3.23),
hindered Fe2+
regeneration and further radical generation.
Fe2+
+ H2O2 → Fe3+
+ OH- +
OH {k = 40 – 80 L.mol
-1.s
-1 [60]} (R.3.21)
Fe3+
+ H2O2 ↔ Fe-OOH2+
+ H+ {K = 3.1·10
-3 [62]} (R.3.22)
Fe-OOH2+
→ OOH + Fe
2+ {k = 2.7·10
-3 s
-1 [62]} (R.3.23)
Figure 3.15. Effect of methanol on Fenton oxidation of IBP ([IBP]0 = 20 mg/L, pH0 = 2.6, T = 25°C, [Fe
2+]0 = 0.134 mM, [H2O2]0 = 6.4 mM, [MeOH]0 = 50 mM)
Furthermore, IBP and/or reaction intermediates could form a complex with Fe3+
, which
renders iron less reactive towards H2O2, thus hindering the cycle of Fenton reactions
[260,261]. A blank experiment in F(+) conditions indeed showed higher H2O2 consumption
without IBP (38% vs. 13% with IBP, figure 3.14C), confirming this possible binding effect.
This effect is dependent upon IBP/Fe3+
ratio and higher ratio promotes stronger binding
effect [261]. Therefore, at given [H2O2] / [Fe] molar ratio, increasing Fenton’s reagent was
found beneficial (no scavenging effect from H2O2 or Fe2+
), and F(+) yielded 97% conversion
of IBP after 3 hours. However TOC removal remained almost unchanged for all investigated
conditions, to less than 10% at the end of reaction (figure 3.14B).
0.0
0.2
0.4
0.6
0.8
1.0
0 30 60 90 120 150 180
IBP
/IB
Po
Time (min)
Fenton (without methanol) Fenton (with methanol)

S. Adityosulindro (2017) / Doctoral Thesis / INP Toulouse
CHAPTER 3 – HOMOGENEOUS PROCESSES
124
Highlights: homogeneous single processes
Partial degradation of ibuprofen was observed after 3 hours of ultrasound
and light (ultraviolet and visible) irradiation.
Degradation mechanism of ibuprofen under ultrasound corresponded to
radical attack, mainly at the bubble-solution interface.
Sono-degradation of ibuprofen was favoured by high power and high
frequency.
Degradation mechanism of ibuprofen under ultraviolet light corresponded
mainly to direct photolysis and in a lower extent to radical attack.
Photo-degradation of ibuprofen was improved in the ultraviolet wavelength
range and oxic condition.
Effect of H2O2 as radical promoter was found to be significantly beneficial for
ultraviolet irradiation process only.
Fenton reaction was mainly effective during the first 5 minutes, then hindered
by the formation of ferric complexes.

S. Adityosulindro (2017) / Doctoral Thesis / INP Toulouse
CHAPTER 3 – HOMOGENEOUS PROCESSES
125
3.2. IBUPROFEN REMOVAL BY COMBINED PROCESSES
3.2.1. Sonophotolysis and sonophoto-oxidation with H2O2
Actually, study on the combination of ultrasound and light irradiation without catalyst
or oxidant promoter (called sonophotolysis process) is scarce [262–264]. Moreover
sonophotolysis using low frequency ultrasound has not been studied yet. Basically, this
combined process is based on the photo-decomposition of hydrogen peroxide produced by
ultrasound [263,264], and thus it has the main advantage of being chemical-free.
Figure 3.16. Sonophotolysis of IBP: (A) IBP and (B) TOC concentration-time profiles ([IBP]0 = 20 mg/L, pH0 = 4.3, T = 25°C, irradiated volume = 500 mL, total volume = 1500 mL,
lamp = 6W LP Hg (UV) or 150W MP Hg (UV-Vis), fUS = 20 kHz, DUS = 50W/L)
In this work, combined US/light irradiation process was evaluated using 20 kHz US, LP
Hg and MP Hg lamps. Note that the value of DUS (50 W/L) was based here on the whole
treated volume (in both sono-reactor and photo-reactor, containing 1 L and 0.5 L,
0.0
0.2
0.4
0.6
0.8
1.0
0 30 60 90 120 150 180
IBP
/IB
Po
Time (min)
A
US LP Hg MP Hg
US/LP Hg US/MP Hg
0.0
0.2
0.4
0.6
0.8
1.0
0 30 60 90 120 150 180
TO
C/T
OC
o
Time (min)
B
US LP Hg MP Hg
US/LP Hg US/MP Hg

S. Adityosulindro (2017) / Doctoral Thesis / INP Toulouse
CHAPTER 3 – HOMOGENEOUS PROCESSES
126
respectively) or in other words PUS = 75 W was applied in this configuration. It was checked
that sonolysis of IBP remained identical as that performed at same DUS in the sono-reactor
only (cf. § 3.1.2).
In fact, figure 3.16A reveals no significant beneficial interaction between the processes
with both the lamps. Indeed, IBP removal rate constant for US/ LP Hg was 0.0045 min-1
(R2
= 0.9971), which is lower than the sum of those corresponding to the separate processes: k =
0.0035 min-1
for single US and k = 0.0028 min-1
for 254 nm photolysis. It should be noted
that, since US and UV were applied in separate reactors, light scattering effect by cavitation
bubbles was not possible. Competition in between IBP and reaction intermediates might be
then suspected, either for photons (« inner filter effect ») or radicals formed by both the
processes, limiting a possible additive effect.
Interestingly, even though US was slightly more effective than LP Hg lamp in IBP
removal (48% vs. 40%), US process was found less effective for TOC removal (7% vs. 19%,
figure 3.16B). This could be explained by the formation of degradation products being less
hydrophobic than IBP, but still exhibiting similar absorption properties, such as 1-
hydroxyibuprofen and 2-hydroxyibuprofen (log Kow = 2.25 [246], λmax = 222 nm). These
oxidation intermediates would be less sensitive to radicals formed by US, mainly located at
the bubble interface, while they could be decomposed by light through direct photolysis or
radical attack in the bulk.
With MP Hg lamp, a simple additive effect was observed in the combined process: k =
0.0647 min-1
(R2
= 0.9872) vs. k = 0.0567 min-1
without US. In this case, competition effect
was not observed because MP Hg lamp was very effective for both IBP and TOC degradation
(figure 3.16A).
Thus synergistic effect was not observed under any circumstances for 20 kHz
sonophotolysis that should be mainly due to the too low sono-generation of H2O2 at this low
frequency (0.41 µM/min). Nonetheless, ultrasonic frequency should not be the only
explaining factor, since a previous study about US/UV process using fUS = 800 kHz only
reported an additive effect [264]. Conversely, it could depend upon model pollutant or reactor
configuration.
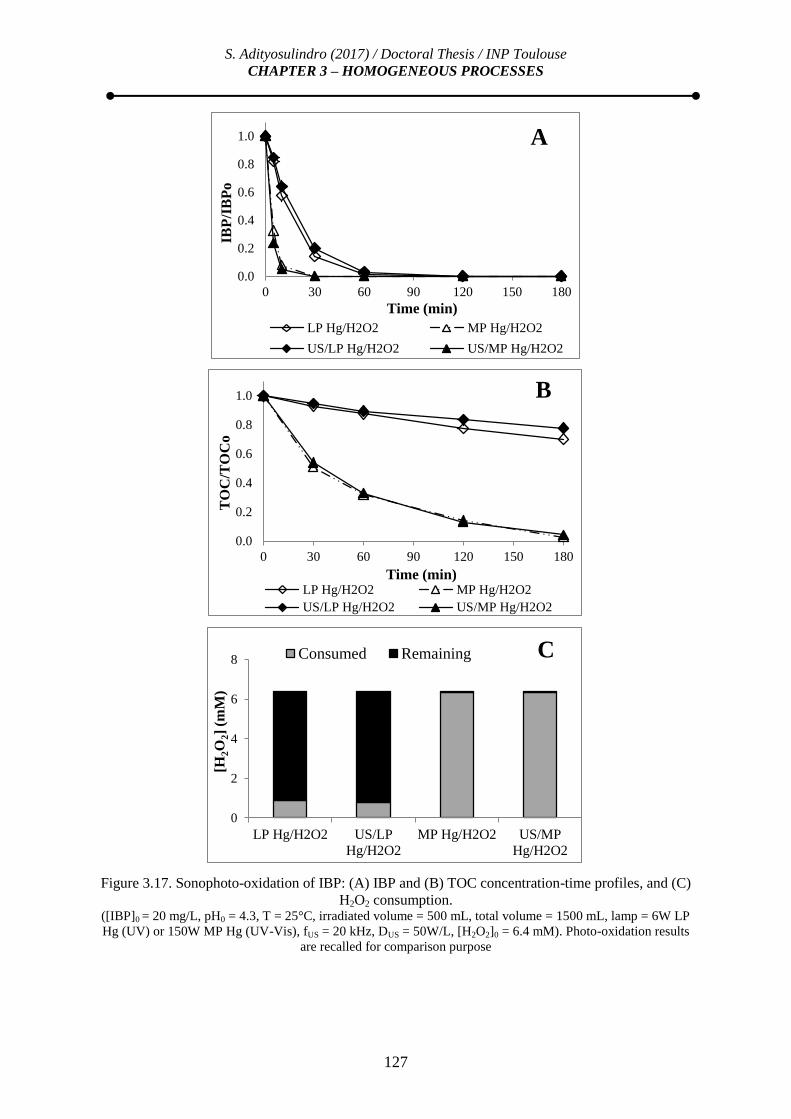
S. Adityosulindro (2017) / Doctoral Thesis / INP Toulouse
CHAPTER 3 – HOMOGENEOUS PROCESSES
127
Figure 3.17. Sonophoto-oxidation of IBP: (A) IBP and (B) TOC concentration-time profiles, and (C)
H2O2 consumption. ([IBP]0 = 20 mg/L, pH0 = 4.3, T = 25°C, irradiated volume = 500 mL, total volume = 1500 mL, lamp = 6W LP
Hg (UV) or 150W MP Hg (UV-Vis), fUS = 20 kHz, DUS = 50W/L, [H2O2]0 = 6.4 mM). Photo-oxidation results
are recalled for comparison purpose
0.0
0.2
0.4
0.6
0.8
1.0
0 30 60 90 120 150 180
IBP
/IB
Po
Time (min)
A
LP Hg/H2O2 MP Hg/H2O2
US/LP Hg/H2O2 US/MP Hg/H2O2
0.0
0.2
0.4
0.6
0.8
1.0
0 30 60 90 120 150 180
TO
C/T
OC
o
Time (min)
B
LP Hg/H2O2 MP Hg/H2O2
US/LP Hg/H2O2 US/MP Hg/H2O2
0
2
4
6
8
LP Hg/H2O2 US/LP
Hg/H2O2
MP Hg/H2O2 US/MP
Hg/H2O2
[H2O
2]
(mM
)
C Consumed Remaining
S. Adityosulindro (2017) / Doctoral Thesis / INP Toulouse
CHAPTER 3 – HOMOGENEOUS PROCESSES
128
The effect of 6.4 mM H2O2 dosage on US/UV(-Vis) combined process was also
evaluated, and the results compared to those of the corresponding photo-oxidation (figure
3.17). Following the trend observed for the photo-mediated process, H2O2 addition enhanced
the removal rate of both IBP and TOC (cf. figure 3.13). For both the lamps, photolysis of
H2O2 producing hydroxyl radicals was clearly the dominating process and the role of
ultrasound appeared to be insignificant.
3.2.2. Sono-Fenton oxidation
In order to evaluate sonication as an activation technique for Fenton oxidation, some of
the oxidation tests described in section 3.1.4 were repeated under ultrasound irradiation,
starting with the reference frequency of 20 kHz and a power density of 50 W/L. The effects
of several parameters were successively investigated: concentration of Fenton’s reagent,
ultrasound density and sonication frequency.
3.2.2.1. Effect of Fenton’s reagent concentration on sonolysis (20 kHz)
For this study, low and high concentration levels of Fenton’s reagent were applied,
corresponding to half the stoichiometric amount of H2O2 (1.6 mM) and twofold excess (6.4
mM), respectively, keeping [H2O2] / [Fe] = 48.
As depicted in figure 3.18, 20 kHz irradiation clearly improved the performance of
Fenton oxidation. For instance, at low reagent concentration, IBP conversion increased from
35% to 89% after 3 hours (figure 3.18A). However, accounting for 48% of IBP removal by
US alone, the interaction between US and Fenton oxidation seemed to be additive rather than
synergistic. Likewise, similar additive effect was also observed in TOC removal, as
mineralization yields in US, Fenton and US/Fenton at low reagent concentration were 7%,
6% and 12% respectively (figure 3.18B). In other words, Fenton oxidation was found mainly
efficient during the first 5 minutes, after which sonolysis prevailed without significantly
activating the catalytic process (nor the decomposition of H2O2 as shown previously).

S. Adityosulindro (2017) / Doctoral Thesis / INP Toulouse
CHAPTER 3 – HOMOGENEOUS PROCESSES
129
Figure 3.18. Fenton (F) and sono-Fenton oxidation (US/F) of IBP: (A) IBP and (B) TOC
concentration-time profiles, and (C) H2O2 consumption ([IBP]0 = 20 mg/L, pH0 = 2.6, T = 25°C, fUS = 20 kHz, DUS = 50W/L, F(-): [Fe
2+]0 = 0.033 mM and [H2O2]0 =
1.6 mM, (+): [Fe2+
]0 = 0.134 mM and [H2O2]0 = 6.4 mM)
On the contrary, synergistic interaction was observed at high reagent concentration,
especially in terms of mineralization yield. With high concentration of reagent, sono-Fenton
oxidation achieved 40% TOC removal within 180 min, vs. 10% or less for each of the
0.0
0.2
0.4
0.6
0.8
1.0
0 30 60 90 120 150 180
IBP
/IB
Po
Time (min)
A
F(-) F(+) US/F(-) US/F(+)
0.0
0.2
0.4
0.6
0.8
1.0
0 30 60 90 120 150 180
TO
C/T
OC
o
Time (min)
B
F(-) F(+) US/F (-) US/F (+)
0
2
4
6
8
F(-) US/F(-) F(+) US/F(+)
[H2O
2]
(mM
)
C Consumed Remaining

S. Adityosulindro (2017) / Doctoral Thesis / INP Toulouse
CHAPTER 3 – HOMOGENEOUS PROCESSES
130
separate process. In addition, in this condition, H2O2 consumption at the end of Fenton and
sono-Fenton oxidation tests were 13% and 44%, respectively. Higher amount of residual
oxidant confirmed a lower overall activity of the Fenton catalytic system under silent
conditions.
Beyond additional radicals generated from water sonolysis (R.3.2), synergistic effect
observed in the combined process could be ascribed to the sono-regeneration of ferrous ions,
as illustrated by equation R.3.24 [114]. Furthermore, the existence of a minimum Fenton’s
reagent concentration for synergistic interaction between Fenton oxidation and US is also
suggested, that could be due to formation of variety of ferric complexes (for instance, with
IBP itself or oxidation intermediates), which are more or less sensitive to sonication.
Fe-OOH2+
+ ))) → Fe2+
+ OOH (R.3.24)
In order to confirm the activation effect at high reagent concentration, a complementary
experiment was conducted. Same amounts of H2O2 and ferrous salt as in F(+) experiment
were mixed into 100 mL of acidic distillated water (pH 2.6) during 60 min to pre-form the
expected Fe-OOH2+
complex. Fenton oxidation was then started by addition of this solution
into 900 mL of IBP solution. The system was let under stirring for 180 min (silent Fenton
oxidation), then sonication was applied for another 180 min period (sono-Fenton oxidation).
Figure 3.19. Effect of sonication on Fenton catalyst regeneration ([IBP]0 = 20 mg/L, pH0 = 2.6, T = 25°C, fUS = 20 kHz, DUS = 50W/L, [H2O2]0 = 6.4 mM, [Fe
2+]0 = 0.134 mM)
0.0
0.2
0.4
0.6
0.8
1.0
0 60 120 180 240 300 360 420
C/C
o
Time (min) IBP TOC
sono-Fenton silent-Fenton
US ON Ferric complex

S. Adityosulindro (2017) / Doctoral Thesis / INP Toulouse
CHAPTER 3 – HOMOGENEOUS PROCESSES
131
In this case, only 4% of IBP was converted within 5 min (figure 3.19) vs. 60% for the
standard Fenton oxidation procedure (figure 3.14A). The concentration-time profile of the
pollutant also exhibited two different stages, with an IBP removal yield almost plateauing at
20-25% after 90 min. Ultrasound application at t = 240 min immediately accelerated IBP
oxidation, the first-order rate constant (k = 0.0102 min-1
, R2 = 0.978) being three times higher
than for the sole sonolysis (cf. § 3.1.2.1, k = 0.0035 min-1
).
3.2.2.2. Effect of ultrasound density
As abovementioned, high ultrasound density (DUS) promotes higher formation of
hydroxyl radicals and thus improves degradation rate and efficiency of sonolysis process.
Nonetheless, the effect of DUS on sono-Fenton oxidation process has been scarcely
investigated.
Siddique et al. [81] reported that degradation of dye by homogeneous sono-Fenton
oxidation increased from 60% to 75% with increasing ultrasonic intensity from 4 W/cm2 (40
W/L) to 8 W/cm2 (80 W/L). In our study, the effect of ultrasound density on sono-Fenton
oxidation process was evaluated at 25 W/L, 50 W/L and 100 W/L (figure 3.20).
Concentration-time profiles of IBP were found similar on the whole DUS range, with even a
slight decrease of initial degradation rate at 100 W/L. Similarly, varying DUS from 25 to 50
W/L improved TOC removal from 29% to 39%, but further increase to 100 W/L also did not
show additional benefit. These observations suggest the existence of optimum DUS for sono-
Fenton process. This trend might be due to a balance in between sono-reduction (R.3.24) and
sono-oxidation (due to OH) mechanisms affecting the iron cycle.

S. Adityosulindro (2017) / Doctoral Thesis / INP Toulouse
CHAPTER 3 – HOMOGENEOUS PROCESSES
132
Figure 3.20. Effect of DUS on sono-Fenton oxidation of IBP: (A) IBP and (B) TOC concentration-time
profiles ([IBP]0 = 20 mg/L, pH0 = 2.6, T = 25°C, fUS = 20 kHz, DUS = 25-100 W/L, [H2O2]0 = 6.4 mM, [Fe
2+]0 = 0.134
mM). Fenton oxidation result is recalled for comparison purpose
0.0
0.2
0.4
0.6
0.8
1.0
0 30 60 90 120 150 180
IBP
/IB
Po
Time (min)
A
0 W/L 25 W/L 50 W/L 100 W/L
0.0
0.2
0.4
0.6
0.8
1.0
0 30 60 90 120 150 180
TO
C/T
OC
o
Time(min)
B
0 W/L 25 W/L 50 W/L 100 W/L
0
2
4
6
8
0 W/L 25 W/L 50 W/L 100 W/L
[H2O
2]
(mM
)
C Consumed Remaining
S. Adityosulindro (2017) / Doctoral Thesis / INP Toulouse
CHAPTER 3 – HOMOGENEOUS PROCESSES
133
3.2.2.3. Effect of sonication frequency
Despite growing interest for sono-Fenton process in the literature, information about
optimum US frequency is still limited, because previous studies usually operated at a single
value (in the 20-40 kHz range) [60,243,265].
Sonochemical effects being suspected in the enhanced ferrous iron regeneration, two
high US frequencies (580 and 862 kHz) were investigated. Audible frequency (12 kHz) was
also applied since this frequency was never used in sono-Fenton process. As previously,
concentration of the Fenton’s reagent was set at “high” level. Note that H2O2 consumption
under high frequencies was not available due to limited equipment at Instec Cuba.
Figure 3.21 revealed that degradation rate of both IBP and TOC, as well as H2O2
consumption, increased with increasing sonication frequency, but the differences were mostly
marked between 12 and 20 kHz as observed already for sonolysis (cf. § 3.1.2.4). Best TOC
abatement was about 50%, which lay within the values reported by previous studies on Fe
catalyzed sonodegradation (10% abatement) [43] and sono-Fenton oxidation (55%) [33] of
IBP under high frequency US (213-300 kHz).

S. Adityosulindro (2017) / Doctoral Thesis / INP Toulouse
CHAPTER 3 – HOMOGENEOUS PROCESSES
134
Figure 3.21. Effect of sonication frequency on sono-Fenton oxidation of IBP: (A) IBP and (B) TOC
concentration-time profiles, and (C) H2O2 consumption ([IBP]0 = 20 mg/L, pH0 = 2.6, T = 25°C, fUS = 12-862 kHz, DUS = 50W/L, [H2O2]0 = 6.4 mM, [Fe
2+]0 = 0.134
mM). Fenton oxidation result is recalled for comparison purpose
0.0
0.2
0.4
0.6
0.8
1.0
0 30 60 90 120 150 180
IBP
/IB
Po
Time (min)
A
F US12kHz / F US20kHz / F
US580kHz / F US862kHz / F
0.0
0.2
0.4
0.6
0.8
1.0
0 30 60 90 120 150 180
TO
C/T
OC
o
Time (min)
B
F US12kHz / F US20kHz / F
US580kHz / F US862kHz / F
0
2
4
6
8
F US12kHz/F US20kHz/F
[H2O
2]
(mM
)
C Consumed Remaining

S. Adityosulindro (2017) / Doctoral Thesis / INP Toulouse
CHAPTER 3 – HOMOGENEOUS PROCESSES
135
3.2.3. Photo-Fenton oxidation
Photo-activation of Fenton process has been more largely investigated than sono-
activation for the abatement of pharmaceutical compounds [60,67]. Several processes were
reported to contribute to the remarkable performance of photo-Fenton oxidation:
(i) photolysis of the organic pollutant and/or its oxidation intermediates, but mainly in the
UVC range (see § 3.1.3),
(ii) photo-decomposition of H2O2 producing OH in the 185-300 nm range (R.3.19),
(iii) photo-regeneration of ferrous iron catalyst providing also additional (hydroxyl)
radicals, according to the following equations (R.3.25 – R.3.28) [63,144–148]:
Fe3+
+ H2O + hv (λ < 300 nm, λmax = 240 nm) → Fe2+
+ OH + H
+ (pH < 4) (R.3.25)
Fe(OH)2+
+ hv (λ=200–400 nm, λmax = 205; 297 nm ) → Fe2+
+ OH (pH = 2–4) (R.3.26)
Fe2(OH)24+
+ hv (λ<400 nm, λmax = 335 nm) → Fe3+
+ Fe2+
+ OH (pH > 3) (R.3.27)
Fe-OOH2+
+ hv (λ=180 – 550 nm) → Fe2+
+ OOH + H
+ (R.3.28)
(iv) photo-decarboxylation of the ferric carboxylates formed by complexation of ferric
ions with organic ligands (R.3.29) [149–152]
[FeIII
(RCO2)]2+
+ hv (λ = 365 – 600 nm) → Fe2+
+ RCOO (R.3.29)
Note that in the last two mechanisms, UVA and even visible irradiation can be beneficial. In
this study, the effect of two parameters was investigated: concentration of Fenton’s reagent,
and emission spectrum of the lamp, including the xenon lamp which irradiates mainly in the
visible range (97%). As previously seen in § 3.1.3.4 and § 3.1.3.5, IBP photolysis and photo-
decomposition of H2O2 were confirmed to be marginal with Xe lamp.

S. Adityosulindro (2017) / Doctoral Thesis / INP Toulouse
CHAPTER 3 – HOMOGENEOUS PROCESSES
136
3.2.3.1. Effect of lamp type on photo-Fenton oxidation
For the comparison between visible light (xenon lamp) and reference lamp (LP Hg
lamp), photo-Fenton oxidation experiments were performed with high concentration of
Fenton’s reagent (0.134 mM of Fe and 6.4 mM of H2O2) in order to gain appreciable
mineralization yield. The corresponding results are depicted in figure 3.22, where they are
compared to those of Fenton and UV/H2O2 oxidation (performed with LP Hg lamp).
First, it can be concluded that photo-Fenton oxidation at 254 nm yielded much higher
IBP and TOC oxidation rates than the previous processes, and the expected synergistic
interaction was clearly visible.
What is more, the xenon lamp was also found very efficient for photo-Fenton process,
albeit not outperforming LP Hg lamp. With these two lamps, H2O2 consumption was 80%
(Xe lamp) and 99% (LP Hg lamp), as compared to 13% only in Fenton oxidation (figure
3.22C).
Accounting for the much lower nominal power of the LP Hg lamp (6 W vs 150 W), its
remarkable effect - especially on mineralization rate - could be attributed to additional OH
formed by H2O2 photolysis (R.3.19), but also to higher photo-reduction yields of ferric ions
and/or iron(III) complexes (R.3.25 - R.3.28), favored rather under UVC than UVA [145] or
visible irradiation [183]. It is also worth mentioning that TOC removal by Xe/Fenton (59%)
and LP Hg/Fenton (82%) was comparable to that obtained by previous studies on photo-
Fenton oxidation of IBP (40-96% mineralization) [24,266].

S. Adityosulindro (2017) / Doctoral Thesis / INP Toulouse
CHAPTER 3 – HOMOGENEOUS PROCESSES
137
Figure 3.22. Effect of irradiation spectrum on photo-Fenton oxidation of IBP: (A) IBP and (B) TOC
concentration-time profiles, and (C) H2O2 consumption ([IBP]0 = 20 mg/L, pH0 = 2.6 (photo-Fenton) and 4.3 (LP Hg/H2O2), T = 25°C, irradiated volume fraction = 1/3,
lamp = 6W LP Hg or 150W Xe, [H2O2]0 = 6.4 mM and [Fe2+
]0 = 0.134 mM). Fenton and LP Hg/H2O2 oxidation
results are recalled for comparison purpose
0.0
0.2
0.4
0.6
0.8
1.0
0 30 60 90 120 150 180
IBP
/IB
Po
Time (min)
A
LP Hg/H2O2 F LP Hg/F Xe/F
0.0
0.2
0.4
0.6
0.8
1.0
0 30 60 90 120 150 180
TO
C/T
OC
o
Time (min)
B
LP Hg/H2O2 F LP Hg/F Xe/F
0
2
4
6
8
LP Hg/H2O2 F LP Hg/F Xe/F
[H2O
2]
(mM
)
C Consumed Remaining

S. Adityosulindro (2017) / Doctoral Thesis / INP Toulouse
CHAPTER 3 – HOMOGENEOUS PROCESSES
138
3.2.3.2. Effect of Fenton’s reagent concentration (Xe lamp)
This effect was investigated with the xenon lamp, which interestingly was able to
significantly enhance Fenton oxidation (figure 3.23).
Figure 3.23. Effect of the concentration of Fenton’s reagent on Fenton oxidation and photo-Fenton
oxidation of IBP under visible irradiation: (A) IBP and (B) TOC concentration-time profiles ([IBP]0 = 20 mg/L, pH = 2.6, T = 25°C, irradiated volume fraction = 1/3, lamp = 150W Xe (Vis), F(-): [Fe
2+]0 =
0.033 mM and [H2O2]0 = 1.6 mM, F(+): [Fe2+
]0 = 0.134 mM and [H2O2]0 = 6.4 mM)
0.0
0.2
0.4
0.6
0.8
1.0
0 30 60 90 120 150 180
IBP
/IB
Po
Time (min)
A
F(-) F(+) Xe/F(-) Xe/F(+)
0.0
0.2
0.4
0.6
0.8
1.0
0 30 60 90 120 150 180
TO
C/T
OC
o
Time (min)
B
F(-) F(+) Xe/F(-) Xe/F(+)
0
2
4
6
8
F(-) F(+) Xe/F(-) Xe/F(+)
[H2O
2]
(mM
)
C Consumed Remaining
S. Adityosulindro (2017) / Doctoral Thesis / INP Toulouse
CHAPTER 3 – HOMOGENEOUS PROCESSES
139
It should be indeed recalled that it mimics sunlight irradiation. As for sono-Fenton
oxidation, activation of the reaction was also assessed at the low concentration level of
Fenton’s reagent. At this concentration, 76% IBP was converted in photo-Fenton oxidation
vs. 35% in Fenton oxidation. Contrarily to the ultrasound irradiation (cf. § 3.2.2.1), it is worth
noting that visible light irradiation was able to activate Fenton reaction performed at very low
concentration of Fenton’s reagent. On the other hand, higher iron catalyst concentration was
necessary to gain appreciable TOC removal (figure 3.23B) and minimize possible
complexation effect (significant amount of residual H2O2 being measured for Xe/Fe(-) (figure
3.23C).
3.2.4. Sono-Photo-Fenton oxidation (20 kHz US / Xe lamp)
Combining homogeneous Fenton oxidation, ultrasound and light irradiation may be
expected to reduce reaction time and/or minimize the utilization of chemical reagents, due to
higher generation of hydroxyl radicals coming from various concomitant processes (i.e.
Fenton reaction, sono- and photo-regeneration of ferrous ions). However, as mentioned in
chapter 1, contradictory findings are actually present in literature. For instance, the coupling
of UV irradiation and high frequency sono-Fenton oxidation was found synergistic for the
decolorization of azo dye Orange II solution [129], but detrimental interaction between UV
and sono(40 kHz)-Fenton was observed by Chakma and coworkers [174] for degradation of
bisphenol A. On the other hand, Méndez-Arriaga et al. [33] reported that ibuprofen oxidation
by photo(visible)-Fenton and sono(300 kHz)-photo(visible)-Fenton process was similar. In
addition, Papoutsakis et al. [115] observed that the combined effect between ultrasound (400
kHz) and photo(sunlight)-Fenton oxidation was pollutant-dependent: it was synergistic for
phenol, only additive for diuron, while photo-Fenton process dominated in the case of
bisphenol A.
Therefore, further investigation is required to conclude about the possible benefits of
sono-photo-Fenton oxidation.

S. Adityosulindro (2017) / Doctoral Thesis / INP Toulouse
CHAPTER 3 – HOMOGENEOUS PROCESSES
140
Figure 3.24. Comparison of sono-photo-Fenton and other Fenton-related processes, for low reagent
concentration: (A) IBP and (B) TOC concentration-time profiles, and (C) H2O2 consumption. ([IBP]0 = 20 mg/L, pH0 = 2.6, T = 25°C, fUS = 20 kHz, DUS = 50W/L, irradiated volume fraction = 1/3, lamp =
150W Xenon, [H2O2]0 = 1.6 mM and [Fe2+
]0 = 0.033 mM)
0.0
0.2
0.4
0.6
0.8
1.0
0 30 60 90 120 150 180
IBP
/IB
Po
Time (min)
A
US Xe F(-)
US/F(-) Xe/F(-) US/Xe/F(-)
0.0
0.2
0.4
0.6
0.8
1.0
0 30 60 90 120 150 180
TO
C/T
OC
o
Time (min)
B
US Xe F(-)
US/F(-) Xe/F(-) US/Xe/F(-)
0.0
0.4
0.8
1.2
1.6
2.0
F(-) US/F(-) Xe/F(-) US/Xe/F(-)
[H2O
2]
(mM
)
C Consumed Remaining

S. Adityosulindro (2017) / Doctoral Thesis / INP Toulouse
CHAPTER 3 – HOMOGENEOUS PROCESSES
141
In our case, low frequency ultrasound and visible irradiation were applied: 20 Hz ultrasound
was chosen as most usual equipment and already very good efficiency in sono-oxidation with
respect to higher frequencies (cf. § 3.2.2.3), and xenon lamp to examine the potential of
sunlight irradiation.
In order to estimate quantitatively the interaction coming from different individual processes,
some researchers proposed to calculate a synergy factor (SF) according to the following
equation [129,267]:
SF = k coupling process / (k process 1 + k process 2 + k process …) (E.3.1)
in which k is the corresponding first-order degradation rate constant.
The coupling process can be thus considered as synergistic if SF > 1.
Sono-photo-Fenton oxidation of IBP was first performed at low reagent concentration
(0.033 mM of Fe, 1.6 mM of H2O2) and the results, as well as those of corresponding Fenton
(F), sono-Fenton (US/F) and photo(visible)-Fenton (Xe/F) oxidation, are shown on figure
3.24. This combined process allowed full conversion of IBP after 180 min oxidation (figure
3.24A), with respect to 89% and 76% by US/F and Vis/F, respectively. Since the degradation
of IBP by Fenton-related processes was very rapid in the first 5 minutes, calculation of rate
constant was done afterwards. Values corresponding to the separate and combined processes
are listed in table 3.1.
Table 3.1. Final conversion and first-order degradation rate constant of IBP for the separate and
combined processes (20 kHz US, Vis irradiation, low concentration of Fenton’s reagent)
Process Final conversion
(%)
Degradation rate
constanta (min
-1)
R2
US
Xe
47
0
0.0035
negligible
0.9787
N/A
F(-) 35 0.0008 0.9940
US/F(-) 89 0.0088 0.9940
Xe/F(-) 76 0.0065 0.9955
US/Xe/F(-) 100 0.0130 0.9975
a based on IBP concentration-time profile after 5 minutes of reaction
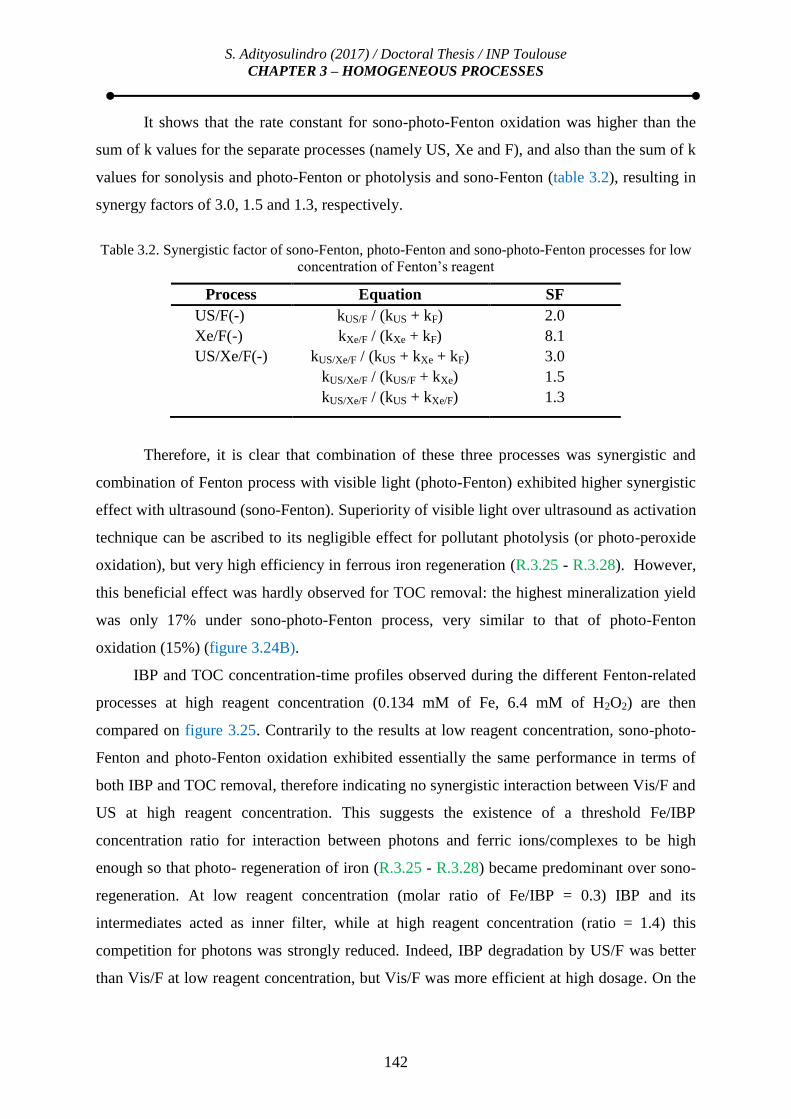
S. Adityosulindro (2017) / Doctoral Thesis / INP Toulouse
CHAPTER 3 – HOMOGENEOUS PROCESSES
142
It shows that the rate constant for sono-photo-Fenton oxidation was higher than the
sum of k values for the separate processes (namely US, Xe and F), and also than the sum of k
values for sonolysis and photo-Fenton or photolysis and sono-Fenton (table 3.2), resulting in
synergy factors of 3.0, 1.5 and 1.3, respectively.
Table 3.2. Synergistic factor of sono-Fenton, photo-Fenton and sono-photo-Fenton processes for low
concentration of Fenton’s reagent
Process Equation SF
US/F(-) kUS/F / (kUS + kF) 2.0
Xe/F(-) kXe/F / (kXe + kF) 8.1
US/Xe/F(-) kUS/Xe/F / (kUS + kXe + kF) 3.0
kUS/Xe/F / (kUS/F + kXe) 1.5
kUS/Xe/F / (kUS + kXe/F) 1.3
Therefore, it is clear that combination of these three processes was synergistic and
combination of Fenton process with visible light (photo-Fenton) exhibited higher synergistic
effect with ultrasound (sono-Fenton). Superiority of visible light over ultrasound as activation
technique can be ascribed to its negligible effect for pollutant photolysis (or photo-peroxide
oxidation), but very high efficiency in ferrous iron regeneration (R.3.25 - R.3.28). However,
this beneficial effect was hardly observed for TOC removal: the highest mineralization yield
was only 17% under sono-photo-Fenton process, very similar to that of photo-Fenton
oxidation (15%) (figure 3.24B).
IBP and TOC concentration-time profiles observed during the different Fenton-related
processes at high reagent concentration (0.134 mM of Fe, 6.4 mM of H2O2) are then
compared on figure 3.25. Contrarily to the results at low reagent concentration, sono-photo-
Fenton and photo-Fenton oxidation exhibited essentially the same performance in terms of
both IBP and TOC removal, therefore indicating no synergistic interaction between Vis/F and
US at high reagent concentration. This suggests the existence of a threshold Fe/IBP
concentration ratio for interaction between photons and ferric ions/complexes to be high
enough so that photo- regeneration of iron (R.3.25 - R.3.28) became predominant over sono-
regeneration. At low reagent concentration (molar ratio of Fe/IBP = 0.3) IBP and its
intermediates acted as inner filter, while at high reagent concentration (ratio = 1.4) this
competition for photons was strongly reduced. Indeed, IBP degradation by US/F was better
than Vis/F at low reagent concentration, but Vis/F was more efficient at high dosage. On the
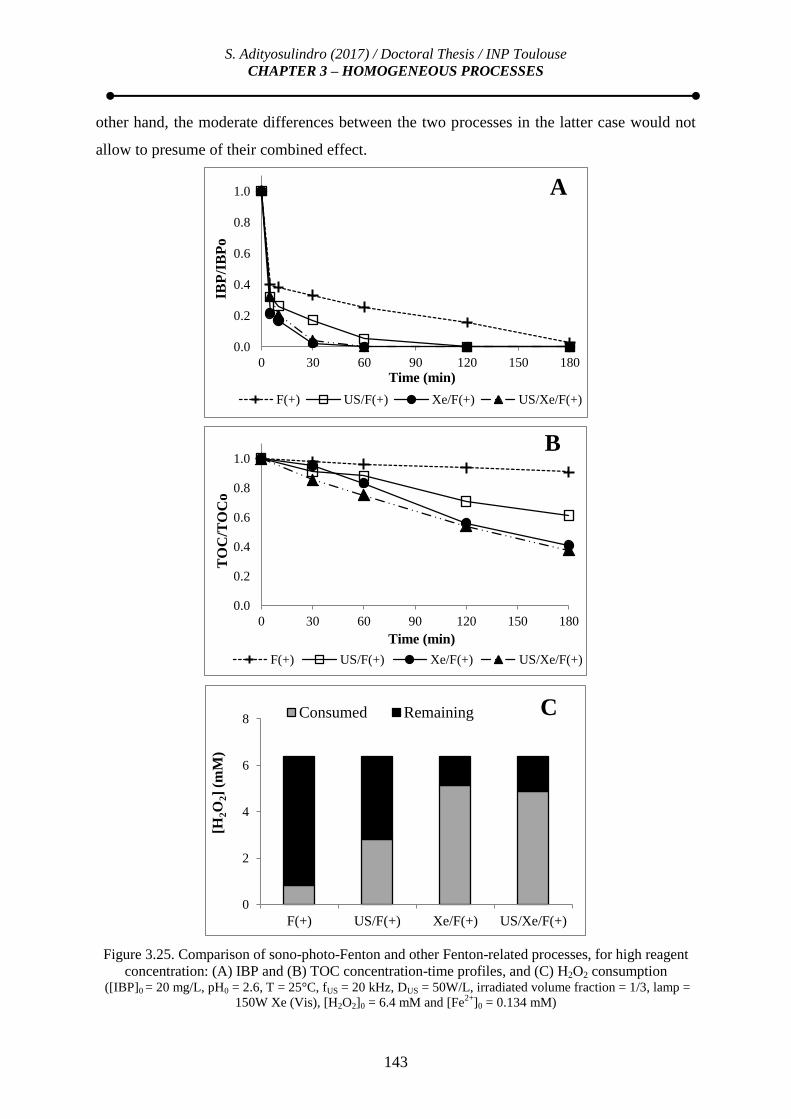
S. Adityosulindro (2017) / Doctoral Thesis / INP Toulouse
CHAPTER 3 – HOMOGENEOUS PROCESSES
143
other hand, the moderate differences between the two processes in the latter case would not
allow to presume of their combined effect.
Figure 3.25. Comparison of sono-photo-Fenton and other Fenton-related processes, for high reagent
concentration: (A) IBP and (B) TOC concentration-time profiles, and (C) H2O2 consumption ([IBP]0 = 20 mg/L, pH0 = 2.6, T = 25°C, fUS = 20 kHz, DUS = 50W/L, irradiated volume fraction = 1/3, lamp =
150W Xe (Vis), [H2O2]0 = 6.4 mM and [Fe2+
]0 = 0.134 mM)
0.0
0.2
0.4
0.6
0.8
1.0
0 30 60 90 120 150 180
IBP
/IB
Po
Time (min)
A
F(+) US/F(+) Xe/F(+) US/Xe/F(+)
0.0
0.2
0.4
0.6
0.8
1.0
0 30 60 90 120 150 180
TO
C/T
OC
o
Time (min)
B
F(+) US/F(+) Xe/F(+) US/Xe/F(+)
0
2
4
6
8
F(+) US/F(+) Xe/F(+) US/Xe/F(+)
[H2O
2]
(mM
)
C Consumed Remaining

S. Adityosulindro (2017) / Doctoral Thesis / INP Toulouse
CHAPTER 3 – HOMOGENEOUS PROCESSES
144
Highlights: homogeneous combined processes
Both (ultra)sound and light irradiation were able to activate Fenton reaction
conducted under relatively low Fenton reagent concentration.
The interaction effect seemed to be dependent on the Fenton reagent
concentration.
In all cases, sufficient Fenton reagent concentration was necessary to gain
appreciable mineralization yield.
S. Adityosulindro (2017) / Doctoral Thesis / INP Toulouse
CHAPTER 3 – HOMOGENEOUS PROCESSES
145
3.3. EVALUATION OF TRANSFORMATION PRODUCTS
Ultrasound (US), UV (LP Hg) irradiation, UV/H2O2 (LP Hg/H), homogeneous Fenton
(F), sono-Fenton (US/F) and photo(Vis)-Fenton (Xe/F) were chosen as model treatments for
intermediate monitoring due to possibly different mechanisms occurring in each process.
Samples collected at various time intervals from corresponding experiments were analyzed
on a liquid chromatograph coupled to a HR mass spectrometer working in positive and
negative ionization modes and scanning mass range from 50 to 1000 m/z. However, due to
the limited availability of analytical standards (and use of gradient method), these
intermediates were not quantified.
3.3.1. Identified intermediates and general IBP degradation scheme
Up to 16 transformation products of ibuprofen (IBP) were found during the
reactions, including several isomers. Among them, three could be unequivocally identified
thanks to available standards: 1-hydroxy-IBP (referred to as TP1A), 2-hydroxy-IBP
(TP1B) and 4-isobutylacetophenone (TP4). 4-ethylbenzaldehyde (C9H10O) which was
reported in some previous studies [52,268,269] was not detected in any of the samples. Table
3.3 indicates all the compounds identified from HPLC-HRMS, at least by their molecular
formula. Note that the developed technique was not suited for either low molecular weight
molecules or nonpolar compounds.
Based on these results and on the available information in literature, a general
degradation scheme of IBP was presumed which is depicted in figure 3.26. Occurrence of the
intermediates in the different AOPs is also reported in this figure.
It can be seen that the principal reactions involved in IBP degradation by AOPs are
hydroxylation, decarboxylation and cleavage of C-C bond. The latter mechanism was
assumed, as TP7 formula (C9H10O2) matched that of 2-phenyl-propionic acid, observed in
preceding works [52,55].

S. Adityosulindro (2017) / Doctoral Thesis / INP Toulouse
CHAPTER 3 – HOMOGENEOUS PROCESSES
146
Table 3.3. Identified compounds from LC-HRMS
Name Molecule tR
(min)
Ion
mode
m/z Remark
TP1A
OH
O
OH C13H18O3
1-hydroxy-IBP (std)
19.75
Neg
221.118
TP1B
OH
O
OH C13H18O3
2-hydroxy-IBP (std)
18.7
Neg
221.118
TP1C
TP1D
OH
O
OH C13H18O3
Mono-hydroxylated IBP
21.15
22.15
Neg
221.118
2 identified
isomers of TP1A
& TP1B
TP2
(A-C)
C13H18O4
Di-hydroxylated IBP
19.8
20.05
20.5
Neg
237.113
3 identified
isomers
TP3
(A-C)
C13H18O5
Tri-hydroxylated IBP
18.35
18.65
19.15
Neg
253.108
3 identified
isomers
TP4
C12H16O
4-isobutylacetophenone (std)
25.1
Pos
177.127
TP5 C12H16O 20.95 Neg 175.111 Isomer of TP4
TP6 C9H
8O
3 16.75 Neg 163.040
TP7 C9H10O2 16.8 Neg 149.061
TP8 C9H10O 17.7 Neg 133.066 Isomer of 4-
ethylbenzaldehyde
TP9 C5H10O3 4.0 Neg 117.056

S. Adityosulindro (2017) / Doctoral Thesis / INP Toulouse
CHAPTER 3 – HOMOGENEOUS PROCESSES
147
Figure 3.26. Proposed reaction scheme for degradation of ibuprofen by homogeneous AOPs
S. Adityosulindro (2017) / Doctoral Thesis / INP Toulouse
CHAPTER 3 – HOMOGENEOUS PROCESSES
148
According to the available sites on IBP molecule, hydroxylation can take place either
on the side chains (methylpropyl moiety or phenylpropionic moiety) [24,39,43,44] or on the
aromatic ring [52,55,258]. In agreement with the literature, mono-hydroxylated
intermediates (C13H18O3) were detected, up to 4 in our case referred to as TP1(A-D), among
which those classically mentioned: 1-hydroxy-IBP (TP1A) and 2-hydroxy-IBP (TP1B).
These hydroxylated IBP can undergo further hydroxylation forming TP2 (C13H18O4)
[24,39,44] then TP3 (C13H18O5) [39,44]. 3 di-hydroxylated and 3 tri-hydroxylated isomers
were observed, but identification of their detailed structure was not possible.
In parallel to hydroxylation route, decarboxylation of hydroxylated IBP may yield 4-
isobutylacetophenone (TP4, C12H16O) [24,39,52]. Direct photo-decarboxylation of IBP to
TP4 was also proposed in literature [54,270]. Isomer of TP4 was observed, referred to as
TP5 (C12H16O).
Next, TP6 (C9H8O3) could be formed by successive hydroxylation and loss of terminal
propyl group from TP4 [44]. TP8 (C9H10O) was an isomer of 4-ethylbenzaldehyde, but in the
absence of structural information its formation pathway could not be clearly derived. It was
probably similar to that of TP6. Finally, ring opening could lead to the formation of small
aliphatic molecules, such as TP9 (C5H10O3). Note that such molecule was rarely mentioned
in the literature [44].
In addition, an alternative degradation pathway of IBP might go through the cleavage
of isobutyl moiety from IBP, forming 2-phenyl-propionic acid (C9H10O2, TP7 ?) [52,55].
3.3.2. Comparison of different homogeneous processes
Comparison of degradation pathways induced by different AOPs is still rarely reported
in literature. As shown in figure 3.26, similar intermediates were formed during ultrasound
(US), ultraviolet irradiation (LPHg), UV/H2O2 (LPHg/H), homogeneous Fenton (F), sono-
Fenton (US/F) and photo(Vis)-Fenton (Xe/F), which is consistent with the involved
mechanisms: with the exception of photolysis, for which a direct transformation pathway was
put into evidence (cf. § 3.1.3.1), all other processes involved hydroxyl radical attack.
However all transformation products were not observed during the different AOPs.
Under ultrasound irradiation 20 kHz (US), only six transformation products were
identified i.e. TP1A, TP1B, TP1C, TP1D, TP5 and TP7 (figure 3.27). Formation of mono-
hydroxylated IBPs (TP1A-D) is consistent with radical attack at cavitation bubble surface

S. Adityosulindro (2017) / Doctoral Thesis / INP Toulouse
CHAPTER 3 – HOMOGENEOUS PROCESSES
149
(and to a much smaller extent in the liquid bulk). By comparing the concentration-time
profiles of these compounds, it can be seen that all degradation products reached their
maximum almost at the end of the reaction time, resulting in rather high residual TOC. As
mentioned previously, plausible explanation for this limited mineralization (only 7% after
180 min) could be that several of these intermediates were more hydrophilic, thus less prone
to be degraded by the radicals formed at the bubble interface. For instance, subsequent
hydroxylation of TP1 (Log Kow =2.25 [246]) was rather difficult, as confirmed by the absence
of TP2 and TP3, and the reaction might mainly progress through decarboxylation of TP1 to
TP5 (and/or C-C bond cleavage of IBP forming TP7).
Figure 3.27. Evolution of normalized* concentration of IBP transformation products during US (*based on the maximum peak area measured for each compound)
Only three hydroxylated-IBP (TP1C, TP1D, TP2C) were observed during UV
irradiation with LP Hg lamp, indicating that hydroxylation of methylpropyl moiety was not
favored in this case. According to the measured peak area, TP1 and TP4 were the main
intermediates formed during UV irradiation, while TP2 was only in a low amount, as well as
TP5, TP7 and TP8 which were detected only at the end of reaction. TP6 also appeared later in
the sequence (figure 3.28). This observation indicated that principal degradation pathways of
IBP under UV irradiation could from decarboxylation of mono-hydroxylated-IBP (IBP >
0 30 60 90 120 150 180
0.0
0.2
0.4
0.6
0.8
1.0
Time (min)
A/A
max
TOC
IBP
TP1A
TP1B
TP1C
TP1D
TP5
TP7

S. Adityosulindro (2017) / Doctoral Thesis / INP Toulouse
CHAPTER 3 – HOMOGENEOUS PROCESSES
150
TP1D > TP4 > ….) and direct photo-decarboxylation of IBP (IBP > TP4 > …). As
abovementioned, direct pollutant photolysis was indeed observed in addition to radical-
mediated route (cf. § 3.1.3.1).
UV irradiation at 254 nm was able to yield higher mineralization (TOC removal =
19%) than US and thus more intermediates were detected. Moreover TP4 exhibits a
maximum absorbance (λmax=255 nm) closer to the lamp emission wavelength than IBP
(λmax=222 nm).
Figure 3.28. Evolution of normalized* concentration of IBP transformation products during UV-
photolysis with LP Hg lamp (*based on the maximum peak area measured for each compound)
Furthermore, IBP degradation pathways under UV/H2O2 (LPHg/H), homogeneous
Fenton (F), sono-Fenton (US/F) and photo(Vis)-Fenton (Xe/F) were similar, wherein almost
all the transformation products were detected. These findings could be explained by the
dominant contribution of powerful and non-selective free radical attack in these processes.
However, it is not clear why TP1A, TP1B, TP1D and TP2B were not detected under Fenton
oxidation. Interestingly, even if similar mineralization yield was obtained for ultrasound (7%)
and Fenton reaction (9%), Fenton reaction was able to degrade almost all hydroxylated IBP
within reaction time (figure 3.29).
0 30 60 90 120 150 180
0.0
0.2
0.4
0.6
0.8
1.0
Time (min)
A/A
max
TOC
IBP
TP1C
TP1D
TP2C
TP4
TP5
TP6
TP7
TP8
TP9

S. Adityosulindro (2017) / Doctoral Thesis / INP Toulouse
CHAPTER 3 – HOMOGENEOUS PROCESSES
151
Figure 3.29. Evolution of normalized* concentration of hydroxylated IBP compounds during
homogeneous Fenton reaction (*based on the maximum peak area measured for each compound)
3.3.3. Evolution of selected intermediates during homogeneous processes
The evolution of four transformation products, TP1A (1-hydroxy-ibuprofen), TP1B (2-
hydroxy-ibuprofen), TP4 (4-isobutylacetophenone) and TP5 (TP4 isomer), was more
particularly examined. While TP1A and TP1B are the most frequently reported in the
literature [24,39,43–46,52,55,258,269], TP4 (and probably TP5) is known for its possible
toxicity effects [53,55,271,272].
TP1A and TP1B exhibited very similar profiles for all the homogenous AOPs (figures
3.30 and 3.31, respectively): continuous concentration increase under ultrasound, and
maximum observed at 30 minutes or less in LP Hg/H2O2, Xe/F and US/F processes.
0 30 60 90 120 150 180
0.0
0.2
0.4
0.6
0.8
1.0
Time (min)
A/A
max
TOC
IBP
TP1C
TP2A
TP2C
TP3A
TP3B
TP3C

S. Adityosulindro (2017) / Doctoral Thesis / INP Toulouse
CHAPTER 3 – HOMOGENEOUS PROCESSES
152
Figure 3.30. Evolution of TP1A concentration during homogeneous AOPs
Figure 3.31. Evolution of TP1B concentration during homogeneous AOPs
Moreover, in combined US/F, the presence of Fenton’s reagent was able to significantly
reduce the amounts of TP1A and TP1B with respect to US. As abovementioned, TP1A was
not detected in LP Hg and Fenton process. Hydroxylation of IBP under LP Hg irradiation
seemed to occur rather on phenylcarboxylic acid moiety or on the aromatic ring. It is not
0 30 60 90 120 150 180
0
20
40
60
80
100
120
140
160
180
Time (min)
Ch
rom
ato
gra
m p
eak
are
a Th
ou
san
ds TP1A
US LPHg LPHg/H2O2
F US/F Xe/F
0 30 60 90 120 150 180
0
20
40
60
80
100
120
140
160
180
Time (min)
Ch
rom
ato
gra
m p
eak
are
a Th
ou
san
ds TP1B
US LPHg LPHg/H2O2
F US/F Xe/F

S. Adityosulindro (2017) / Doctoral Thesis / INP Toulouse
CHAPTER 3 – HOMOGENEOUS PROCESSES
153
clear why these compounds were not found during Fenton oxidation considering its
occurrence – however in very low amount – in photo-Fenton process (Xe/F).
Figure 3.32. Evolution of TP4 concentration during homogeneous AOPs
Figure 3.33. Evolution of TP5 concentration during homogeneous AOPs
Differences in process selectivity even more clearly arose in case of TP4 and TP5
(figures 3.32 and 3.33, respectively). TP4 was only observed under UV and US/F processes.
High concentration of TP4 was formed in the first 5 minutes of US/F, and then it decreased
0 30 60 90 120 150 180
0
100
200
300
400
500
600
Time (min)
Ch
rom
ato
gra
m p
eak
are
a Th
ou
san
ds
TP4
US LPHg LPHg/H2O2
F US/F Xe/F
0 30 60 90 120 150 180
0
200
400
600
800
1000
1200
1400
1600
1800
Time (min)
Ch
rom
ato
gra
m p
eak
are
a
Tho
usa
nd
s
TP5
US LPHg LPHg/H2O2
F US/F Xe/F

S. Adityosulindro (2017) / Doctoral Thesis / INP Toulouse
CHAPTER 3 – HOMOGENEOUS PROCESSES
154
until complete removal after 120 minutes. Conversely, less TP4 was formed under UV
irradiation, but the concentration was relatively stable during the reaction. TP5 was detected
in all processes except photolysis, for which radical mechanism was not dominant. Moreover,
in US/F similar trend was observed for this compound as for TP4: rapid concentration
increase in 5 minutes and slow decrease afterwards. A complete removal of formed TP5 was
also achieved in 60 min for LPHg/H2O2 and Xe/F.Therefore, it can be concluded that, even if
IBP removal can be achieved rather rapidly by some processes such as US/F, much longer
reaction time is needed to gain sufficient mineralization and remove some toxic intermediates
formed during the reaction.
S. Adityosulindro (2017) / Doctoral Thesis / INP Toulouse
CHAPTER 3 – HOMOGENEOUS PROCESSES
155
3.4. EFFECT OF WATER MATRIX
Sono- and photo-Fenton oxidation processes were shown to be promising methods for
the removal of ibuprofen (IBP) in water. However, all the experiments that have been done so
far were conducted in distillated water (DW). In order to investigate the efficiency in real
application, some experiments with a real wastewater matrix (WW) were performed.
Wastewater consists in a complex mixture of organic and inorganic compounds, such as
nutrients, salts and many substances that could influence the outcome of advanced oxidation
processes [235]. For instance, the presence of organic (humic acid, fulvic acid, …) and
inorganic compounds (chloride, carbonate, bicarbonate, and phosphate ions) in WW may
hamper Fenton reaction by scavenging OH and/or forming iron complex [41,273]. On the
other hand, phenolic compounds that WW may contain could reduce ferric ion to ferrous ion
and thus enhance Fenton reaction [273].
According to recent reviews on hybrid processes [240,241], AOPs are recommended in
combination with membrane filtration as post-treatment of biological process for destruction
of refractory organics in concentrate stream. Such hybridization allows the AOPs to reach
appreciable mineralization level in relatively short oxidation time, and to save chemicals and
energy.
In this study, water samples taken after biological treatment of a municipal wastewater
treatment plant located in Nailloux village (France) were used to prepare the IBP solution (at
20 mg/L). Table 3.4 shows the physicochemical characteristics of this effluent. After addition
of IBP, TOC concentration increased to 25 mg/L, IBP being the major organic compound in
the resulting solution. The amount of carbonate and bicarbonate was evaluated from
inorganic carbon (IC) analysis and the measured concentration level (29.4 mg/L) could be
high enough to scavenge hydroxyl radicals at neutral and alkaline pH [121]. On the other
hand, the initial iron concentration (< 0.05 mg/L) appeared too low to effectively contribute
to Fenton oxidation mechanism.

S. Adityosulindro (2017) / Doctoral Thesis / INP Toulouse
CHAPTER 3 – HOMOGENEOUS PROCESSES
156
Table 3.4. Physicochemical properties of the wastewater effluent
Parameter Value
pH 8
Turbidity (NFU) 1
BOD (mg/L) < 2
COD (mg/L) < 30
TC (mg/L) 39.2
IC (mg/L) 29.4
TOC (mg/L) 9.8 (25a)
Total Fe (mg/L) < 0.05
a after the addition of IBP
Matrix effect was first evaluated for sonolysis (US), homogeneous Fenton (F) and
sono-Fenton (US/F) oxidation in figure 3.34. The treatment efficiency in distilled water (DW)
was also recalled for comparison purpose. As usual, the initial pH of DW and WW was set to
2.6 (using H2SO4) for the Fenton and sono-Fenton oxidation runs, while the pH of WW was
not adjusted for sonolysis.
Degradation of both IBP and TOC by ultrasound was significantly hampered in WW.
Lower IBP removal in WW (24% vs. 48% in DW after 180 min) could be mainly explained
by a pH effect, the initial pH of the IBP solution varying from 4.3 to 8.0 whether prepared
with DW or WW, respectively. As abovementioned (see § 3.1.2.2) pH value of 8.0 indeed
reduced the sono-degradation of IBP to 31% in DW by increasing the molecule solubility.
Competition or scavenging effects from organic and/or inorganic compounds of WW thus
seemed to have only a minor effect.
After preliminary acidification to 2.6, concentration-time profiles of IBP during Fenton
oxidation were almost superimposed for the two matrixes, while a slight decrease was
observed for sono-Fenton process when in WW (figure 3.34A). Therefore, it seems to
confirm that IBP didn’t strongly compete for radicals with the organic molecules present in
WW, and that iron complexation and free-radical scavenging were not significantly increased
in this matrix. In particular, inorganic carbon content was almost totally converted into
carbonic acid and CO2 by initial acidification.

S. Adityosulindro (2017) / Doctoral Thesis / INP Toulouse
CHAPTER 3 – HOMOGENEOUS PROCESSES
157
Figure 3.34. Effect of water matrix (DW: distillated water, WW: wastewater effluent) on sonolysis
(US), Fenton (F) and sono-Fenton (US/F) oxidation of IBP: (A) IBP and (B) TOC concentration-time
profiles, and (C) H2O2 consumption. ([IBP]0 = 20 mg/L, pH0 = 2.6 except for US in WW (pH0 = 8.0), T = 25°C, fUS = 20 kHz with DUS = 50W/L
under US, [H2O2]0 = 6.4 mM and [Fe2+
]0 = 0.134 mM for F and US/F)
0.0
0.2
0.4
0.6
0.8
1.0
0 30 60 90 120 150 180
IBP
/IB
Po
Time (min)
A
US (DW) F (DW) US/F (DW)
US (WW) F (WW) US/F (WW)
0.0
0.2
0.4
0.6
0.8
1.0
0 30 60 90 120 150 180
TO
C/T
OC
o
Time (min)
B
US (DW) F (DW)
US/F (DW) US (WW)
F (WW) US/F (WW)
F (WW, without IBP)
0
2
4
6
8
F(DW) F(WW) US/F(DW) US/F(WW)
[H2O
2]
(mM
)
Consumed Remaining

S. Adityosulindro (2017) / Doctoral Thesis / INP Toulouse
CHAPTER 3 – HOMOGENEOUS PROCESSES
158
Moreover, overall TOC removal by Fenton oxidation was improved in WW (25% vs.
9%, figure 3.34B). Fenton oxidation test without IBP proved this result to be mainly the
consequence of more readily oxidized organic compounds in WW (50% of TOC removal).
However, similar behavior was not observed in sono-Fenton oxidation. This might due to
selective effect of acoustic cavitation towards specific organic molecules [126] and complex
interplay between iron and WW compounds (and/or their oxidation intermediates) somewhat
hampering sono-regeneration of Fe2+
.
The effect of WW matrix was also evaluated in photo-based advanced oxidation
processes, i.e. photolysis under UV light, UV/H2O2 (LP Hg lamp) and photo(Vis)-Fenton (Xe
lamp). Despite the possible improvement in IBP removal by UV photolysis under alkaline pH
(cf. § 3.1.3.2), photolysis of IBP in WW matrix was clearly inhibited (figure 3.35). IBP
removal by UV/H2O2 and photo(Vis)-Fenton was also hampered, but to a lesser extent
compared to UV photolysis and complete IBP removal still could be achieved within reaction
time. Likewise, mineralization yields were always lower in WW matrix, indicating also that
organic compounds present in WW matrix were less photo-active than IBP. Measurement of
residual H2O2 concentration after reaction also showed smaller H2O2 consumption in
experiments with WW matrix. Inhibition of UV photolysis and photo-Fenton oxidation by
real water matrix has been reported in literature [274,275] and it can be possibly attributed to
scattering and filtering of UV and visible light by organic and inorganic compounds present
in WW.

S. Adityosulindro (2017) / Doctoral Thesis / INP Toulouse
CHAPTER 3 – HOMOGENEOUS PROCESSES
159
Figure 3.35. Effect of water matrix (DW: distillated water, WW: wastewater effluent) on UV
photolysis (LP Hg), UV/H2O2 (LP Hg/H2O2) and photo(Vis)-Fenton (Xe/F) oxidation of IBP: (A) IBP
and (B) TOC concentration-time profiles, and (C) H2O2 consumption. ([IBP]0 = 20 mg/L, pH0 = 8.0, except for Xe/F in WW (pH0 = 2.6), T = 25°C, irradiated vol. fraction = 1/3, lamp
= 6W LP Hg (UV) or 150W Xe (Vis), [H2O2]0 = 6.4 mM and [Fe2+
]0 = 0.134 mM for Xe/F)
0.0
0.2
0.4
0.6
0.8
1.0
0 30 60 90 120 150 180
IBP
/IB
Po
Time (min)
A
LP Hg (DW) LP Hg (WW)
LP Hg/H2O2 (DW) LP Hg/H2O2 (WW)
Xe/F (DW) Xe/F (WW)
0.0
0.2
0.4
0.6
0.8
1.0
0 30 60 90 120 150 180
TO
C/T
OC
o
Time (min)
B
LP Hg (DW) LP Hg (WW)
LP Hg/H2O2 (DW) LP Hg/H2O2 (WW)
Xe/F (DW) Xe/F (WW)
0
2
4
6
8
[H2O
2]
(mM
)
C Consumed Remaining
S. Adityosulindro (2017) / Doctoral Thesis / INP Toulouse
CHAPTER 3 – HOMOGENEOUS PROCESSES
160
3.5. CONCLUSIONS
This chapter was dedicated to the degradation of ibuprofen by homogeneous AOPs.
The performance of separated (ultrasound, light irradiation - with or without H2O2, Fenton
oxidation) and combined processes (sonophotolysis, sono-Fenton, photo-Fenton and sono-
photo-Fenton oxidation) was investigated with the aim of identifying synergistic effects, and
obtaining “benchmark” for heterogeneous counterparts.
Single processes such as sonolysis, UV photolysis and Fenton oxidation were able to
achieve at least partial degradation of ibuprofen in 3 hours, while addition of hydrogen
peroxide as promoter was found significantly beneficial under ultraviolet light only (with 5-
to 24-fold enhancement of IBP degradation rate). For instance, peroxide oxidation with MP
Hg lamp resulted in nearly complete abatement of both IBP and TOC within reaction time.
Conversely, Fenton oxidation yielded less than 10% mineralization yield.
Combination of homogeneous Fenton oxidation with ultrasound or light (ultraviolet /
visible) irradiation was found to be more effective than the sum of individual processes in
most cases, although it seemed to be dependent on the Fenton’s reagent concentration. In
addition, ultrasound and visible light emitted by xenon lamp was able to activate Fenton
oxidation conducted at very low iron concentration (1.8 mg/L). For instance, coupling
US/Vis/Hom-F process was found to be synergistic at very low reagent concentration (0.033
mM Fe and 1.6 mM H2O2), while Vis/Hom-F becomes predominant at higher reagent
concentration (0.134 mM Fe and 6.4 mM H2O2). In all cases, sufficient Fenton’s reagent
concentration was necessary to gain appreciable mineralization yield, which could exceed
60% only under photo-activation.
Up to 16 transformation products (mainly aromatics) were detected during the different
AOPs, and the monitoring of their evolution allowed to confirm some specific features of the
processes.
In real wastewater effluent, sonolysis and all photo-based advanced oxidation processes
were hampered mainly due to alkaline pH and light scattering effect, respectively. On the
other hand, preliminary acidification could maintain the efficiency of Fenton and sono-
Fenton oxidation.
In the next chapter, degradation of ibuprofen by heterogeneous Fenton oxidation and
activation effect by ultrasound and light irradiation are assessed.

161
CHAPTER 4. HETEROGENEOUS PROCESSES
Degradation of ibuprofen (IBP) by homogeneous Fenton based-processes has been
presented in the previous chapter (chapter 3). It was found that an iron concentration in the
order of magnitude, but still higher than the discharge limit (7.5 mg/L vs. 2 mg/L), was
necessary to achieve within 3 hours almost complete conversion of IBP and appreciable TOC
removal (40% or more) under activation by ultrasound, low pressure mercury vapor lamp or
xenon lamp. This would thus still require post-treatment to precipitate excess iron. Moreover,
the limited pH range (pH = 2 – 4) of the homogeneous Fenton reaction is a major obstacle,
especially for real applications since real water matrices are usually buffered around neutral
pH [164,178]. In order to overcome these problems, recent studies are moving towards
heterogeneous catalyst utilization. This is the purpose of this chapter, where different types of
iron-based solid catalysts are first screened for the degradation of IBP. Then a parametric
study is conducted with the selected catalyst, before the investigation of heterogeneous
reaction coupling with ultrasound and/or light irradiation. The experiments were first
performed in sono-reactor, and loop reactor configuration was used for UV/Vis coupling.

162
This page is intentionally left blank

S. Adityosulindro (2017) / Doctoral Thesis / INP Toulouse
CHAPTER 4 – HETEROGENEOUS PROCESSES
163
4.1. PRE-SELECTION OF THE HETEROGENEOUS CATALYST
Extensive comparison of various heterogeneous catalysts for Fenton oxidation
including iron oxide particles (hematite, magnetite, maghemite) and iron containing ZSM5
zeolite (Fe-BEA and Fe-MFI) had been conducted in a previous study of our research group
on the remediation of paracetamol [189], an analgesic drug with a relatively similar structure
to ibuprofen. Among the tested catalysts, Fe-MFI catalyst appeared as the most promising
catalyst due to its high catalytic activity and low iron leaching. In addition, zero-valent iron
powder (ZVI) was also considered here, based on results from the literature which indicated
that ZVI can catalyze H2O2 decomposition under circumneutral pH conditions
[73,85,198,239]. In this section, efficacies of Fe-MFI and ZVI are compared for the catalytic
oxidation of ibuprofen.
4.1.1. Adsorption of ibuprofen over Fe-MFI and ZVI catalysts
Preliminary adsorption tests (without oxidant) were first conducted in order to
investigate the possible adsorption of IBP on the solid catalysts. From figure 4.1 it can be
seen that negligible adsorption occurred on ZVI (up to 1 g/L). For Fe-MFI, IBP removal
increased from 7% to 25% when increasing solid concentration from 0.5 g/L to 4.8 g/L, and
adsorption equilibrium was reached within 120 min. These experiments were conducted
without any pH adjustment, but the pH of the solution decreased from 4.3 to 3.3-3.7 by
simple contact with the Fe-MFI catalyst (depending on its concentration), while no pH
change was observed for ZVI. The acidity of Fe-MFI is due to the presence of Brønsted and
Lewis acid sites on zeolite framework [201].
Figure 4.1. Adsorption of ibuprofen over ZVI and Fe-MFI catalysts ([IBP]0 = 20 mg/L, [Fe-MFI] = 0.5 – 4.8 g/L, [ZVI] = 0.056 and 1 g/L, pH0 = 4.3, T = 25°C)
0.0
0.2
0.4
0.6
0.8
1.0
0 60 120 180 240 300
IBP
/IB
Po
Time (min)
Fe-MFI 0.5 g/L Fe-MFI 1 g/L Fe-MFI 3 g/L
Fe-MFI 4.8 g/L ZVI 0.056 g/L ZVI 1 g/L

S. Adityosulindro (2017) / Doctoral Thesis / INP Toulouse
CHAPTER 4 – HETEROGENEOUS PROCESSES
164
Higher adsorption capacity of Fe-MFI compared to ZVI can be attributed to its much
larger specific surface area (329 vs 0.5 m2/g). It should be mentioned that since molecular
size of IBP (1.3 nm x 0.6 nm) is larger than minor and major axes of the sinusoidal (0.51 nm
x 0.55 nm) and straight channels (0.54 nm x 0.56 nm) of Fe-MFI zeolite, IBP molecules may
be only adsorbed at the intersection of the straight and sinusoidal channels, as proposed by
Yazaydin et al. [276] in the case of methyl tert-butyl ether (MTBE) (figure 4.2). Moreover,
strong interaction between IBP and zeolite could be possible due to the formation of iron- or
aluminium-ibuprofenate complexes (ibuprofenate coordinately bonded to iron active sites or
extra-framework aluminium species) [223,260,261].
Figure 4.2. Illustration of IBP adsorption on zeolite surface
Since, in the investigated range of catalyst concentration, the majority of IBP molecules
were in solution after adsorption, the evolution of liquid phase concentrations allowed to
evaluate the oxidation performance. Concentration of IBP (TOC) in the liquid phase after
adsorption was then used as reference.
S. Adityosulindro (2017) / Doctoral Thesis / INP Toulouse
CHAPTER 4 – HETEROGENEOUS PROCESSES
165
4.1.2. Fenton oxidation of ibuprofen over Fe-MFI and ZVI catalysts
Comparison of the catalytic activity of Fe-MFI and ZVI for Fenton oxidation of IBP
was performed under the following operating conditions: [Fe-MFI] = 1 g/L, [ZVI] = 0.056
g/L, [H2O2]0 = 6.4 mM, pH0 = 3.5 – 4.3 (initial solution pH before contacting with solid), T =
25°C. According to iron dispersion measured by CO chemisorption (see § 2.1.2.5), 1 g/L of
Fe-MFI should correspond to 0.13 mM of accessible iron (vs. 0.61 mM of total Fe), same as
used for homogeneous Fenton oxidation (“high concentration level”, see chapter 3).
On the other hand, concentration of ZVI (0.056 g/L) was chosen so that the total iron
amount (1 mM according to supplier purity data) was of same order of magnitude as with 1
g/L of Fe-MFI. It should be recalled however that, according to SBET value (0.5 m2/g), iron
dispersion on ZVI should be lower than 0.1% (cf. chapter 2, table 2.8).
Heterogeneous Fenton experiments started with a preliminary step without oxidant to
separate as far as possible the contribution of adsorption and oxidation to the pollutant
removal in solution. As abovementioned, 120 min allowed to reach equilibrium for Fe-MFI,
and the same duration was fixed for ZVI. The oxidation step was then initiated by injection of
hydrogen peroxide (H2O2). In the case of Fe-MFI, the test conducted without any pH
adjustment led to a partial conversion of IBP and TOC (figures 4.3A and 4.3B), as well as to
some consumption of H2O2 (figure 4.3C) confirming that Fe-MFI was able to catalyze H2O2
decomposition and oxidize IBP. Conversely, no catalytic activity of ZVI was observed
(negligible IBP degradation or H2O2 consumption), despite some study mentioned H2O2
decomposition under circumneutral pH conditions (pH=4-6) over this catalyst
[73,85,198,239]. The pH value for optimum ZVI activity being usually around 3
[73,85,198,239], Fenton oxidation with ZVI catalyst was also performed at pH0 = 3.5 (using
1 M H2SO4 for preliminary acidification). Under such acidic condition, a remarkable catalytic
activity of ZVI was observed, in which 90% of IBP and 10% of TOC were removed after 30
min of oxidation (figure 4.3).

S. Adityosulindro (2017) / Doctoral Thesis / INP Toulouse
CHAPTER 4 – HETEROGENEOUS PROCESSES
166
Figure 4.3. Fenton oxidation of ibuprofen over ZVI and Fe-MFI catalysts: evolution of (A) IBP and
(B) TOC concentration and (C) H2O2 consumption ([IBP]0 = 20 mg/L, [Fe-MFI] = 1 g/L, [ZVI] = 0.056 g/L, [H2O2]0 = 6.4 mM, T = 25°C). Homogeneous Fenton
oxidation using 0.13 mM of FeSO47H2O was recalled for comparison
Comparison of homogeneous and heterogeneous Fenton reaction has been scarcely
investigated, and in almost all cases based on the same total iron amount. For instance, it was
0.0
0.2
0.4
0.6
0.8
1.0
0 30 60 90 120 150 180
IBP
/IB
Po
Time (min)
A
FeSO4 (pHo 2.6) ZVI (pHo 4.3)
Fe-MFI (pHo 4.3) ZVI (pHo 3.5)
0.0
0.2
0.4
0.6
0.8
1.0
0 30 60 90 120 150 180
TO
C/T
OC
o
Time (min)
B
FeSO4 (pHo 2.6) ZVI (pHo 4.3)
Fe-MFI (pHo 4.3) ZVI (pHo 3.5)
0
2
4
6
8
[H2O
2]
(mM
)
Consumed Remaining

S. Adityosulindro (2017) / Doctoral Thesis / INP Toulouse
CHAPTER 4 – HETEROGENEOUS PROCESSES
167
reported that H2O2 decomposition (determined as the oxygen release rate measured
barometrically) was three times faster using iron salt (Fe(NO3)3) than Fe-ZSM5 [277] as
catalyst. Kusić and coworkers [80] also observed that Fenton oxidation of phenol was faster
with ferrous or ferric salt than with Fe-ZSM5 (total pollutant conversion being achieved in 2
vs. 30 min, respectively). Conversely, Centi and coworkers [84] reported that Fe-ZSM5 led to
a higher removal efficiency (72% in 60 min) of propionic acid than ferric salt (43% in 60
min). Velichkova et al. [30] compared the activity of the same iron containing zeolite as the
one used here (Fe-MFI-27) to that of the homogeneous system for the Fenton oxidation of
paracetamol. They found a similar mineralization yield of about 30% with 2 g.L-1
of Fe-MFI
at natural pH (corresponding to ca. 0.3 mM of accessible iron) and 0.6 mM of ferrous salt at
pH0 =2.6 (T = 45°C, [H2O2]0 = 14 mM).
In the present study, based theoretically on the same amount of accessible iron (0.134
mM), IBP oxidation catalyzed by Fe-MFI was clearly slower than the homogeneous reaction
catalyzed by FeSO47H2O at the initial stage (figure 4.3A). To check for possible detrimental
effect of the adsorbed pollutant (competition with H2O2 for iron active sites or porosity
blockage), H2O2 decomposition by Fe-MFI catalyst was also monitored without IBP. It
resulted into 31% of H2O2 conversion after 180 min, which was similar to that measured
during the oxidation of IBP (26%) indicating the minor role of adsorbed IBP. Interestingly,
after the 5 first minutes, the rate of the homogeneous reaction was very similar to that
observed with Fe-MFI, suggesting that the initial activity difference could be due to iron
speciation (ferrous vs. ferric iron). In accordance with Velichkova et al. [30] both systems
yielded similar TOC removal (figure 4.3B).
Furthermore, accounting for the very low iron dispersion on ZVI, it is noticeable that
this catalyst outperformed the homogeneous system when the solution was initially acidified,
and suggests extensive leaching. These parameters, as well as the aging of the solid catalysts
are examined in the following section.
4.1.3. Evaluation of Fe-MFI and ZVI catalysts after reaction
The morphology and iron content of Fe-MFI and ZVI catalysts before and after reaction
were investigated by SEM-EDX. Morphology of Fe-MFI catalyst was found unchanged after
Fenton oxidation (figures 4.4A and 4.4B), as well as estimated “surface” iron content

S. Adityosulindro (2017) / Doctoral Thesis / INP Toulouse
CHAPTER 4 – HETEROGENEOUS PROCESSES
168
(3.3+1.0% (after Fenton) vs. 3.1+0.9% (initial)). ICP-AES analysis (table 4.1) confirmed that
iron leaching from Fe-MFI catalyst was negligible.
Figure 4.4. SEM images of (A) fresh and (B) used Fe-MFI catalyst after Fenton oxidation
Figure 4.5. SEM images of (A) fresh and (B) used ZVI (pH0 = 3.5)
Table 4.1. Iron leaching from tested solids
System [Catalyst](1)
g/L
[Fe]total(2)
mg/L
pH0 / pHf(3)
Iron
leaching(4)
mg/L
Fenton (Fe-MFI) 1 34 4.3 / 3.7 0.014
Fenton (ZVI) 0.056 56 4.3 / 4.3 0.009
Fenton (ZVI) 0.056 56 3.5 / 3.6 3.3
(1) Concentration of solid catalyst; (2) Corresponding total iron concentration; (3) pH of IBP solution / pH at
the end of the experiment; (4) Concentration of total dissolved iron at the end of experiment
(C) (D) 1µm 1µm

S. Adityosulindro (2017) / Doctoral Thesis / INP Toulouse
CHAPTER 4 – HETEROGENEOUS PROCESSES
169
Figure 4.6. XRD analysis of (A) fresh and (B) used ZVI
On the contrary, ZVI surface became coarser due to the formation of numerous little
clusters indicating a corroded surface (figures 4.5A and 4.5B). Estimation of elemental
composition by EDX analysis also confirmed oxidation of ZVI surface, oxygen content
increasing from 2.3% to 20.2%. According to XRD analysis (figure 4.6B), other diffraction
peaks were observed at 2θ = 30.03° and 63.03° matching with maghemite (Fe2O3) pattern
(PDF 39-1346), and at 2θ = 35.69° and 57.32° corresponding to magnetite (Fe3O4) (PDF 75-
0449). These peaks were not present on the original particle spectrum (cf. figure 4.6A).
Evaluation by ICP-AES of dissolved iron concentration after reaction with ZVI
showed that acidic condition caused significant iron leaching (3.3 mg/L i.e. 0.06 mM of Fe)
from this catalyst (table 4.1). This concentration in solution is lower than that used for the
homogenous reaction depicted in figure 4.3 and possible mechanism explaining the higher
activity of this system with respect to ferrous salt is addressed in the next section.

S. Adityosulindro (2017) / Doctoral Thesis / INP Toulouse
CHAPTER 4 – HETEROGENEOUS PROCESSES
170
4.1.4. Mechanisms of Fenton reaction over investigated catalysts
Fenton reaction with iron-containing solids can occur according to two main
mechanisms, i.e., a true heterogeneous one implying surface iron species and a homogeneous
one induced by metal ions leached in the solution [65]. Due to acidification with H2SO4,
significant iron leaching occurred from ZVI (3.3 mg/L) that should in fact be responsible for
its catalytic activity at pH0 3.5. Under acid (and H2O2) addition, ZVI was corroded and
released Fe2+
into the solution which subsequently reacted with H2O2 and generated OH as
per homogeneous Fenton mechanism (reactions R.4.1 to R.4.3). Several authors [85,138,203]
proposed that a fast reduction of Fe3+
to Fe2+
should occur on Fe0 surface, which was
mentioned as the main advantage of ZVI over iron salt catalyst, but could be limited by the
availability of Fe0 on the surface [203]. In any case, a continuous release of iron in solution
should lead to a better utilization than addition at once.
≡Fe0
+ 2H+ → Fe
2+ + H2 (R.4.1)
≡Fe0 + H2O2 + 2H
+ → Fe
2+ + 2H2O (R.4.2)
Fe2+
+ H2O2 → Fe3+
+ OH- +
OH (R.4.3)
≡Fe0
+ 2Fe3+
→ 3Fe2+
(R.4.4)
(notation ≡ indicates species on catalyst surface)
Conversely, real heterogeneous Fenton reaction seemed to occur on Fe-MFI catalyst
owing to its low iron leaching (0.014 mg/L). As described in chapter 1, true heterogeneous
Fenton is based on the activity of iron species (FeII and Fe
III) present on the catalyst surface,
which lead to radical [70,75] and/or non-radical mechanisms [50,65,74] according to the
following reactions:
Radical mechanism (involving hydroxyl radical OH):
≡Fe(III) + H2O2 ↔ ≡Fe(III)(H2O2) (R.4.5)
S. Adityosulindro (2017) / Doctoral Thesis / INP Toulouse
CHAPTER 4 – HETEROGENEOUS PROCESSES
171
≡Fe(III)(H2O2) → ≡Fe(II) + OOH (
O2
-) + H
+ (2 H
+) (R.4.6)
≡Fe(II) + H2O2 → ≡Fe(III) + OH + OH
- (R.4.7)
≡Fe(III) + OOH /
O2
- → ≡Fe(II) + O2 (+ H
+) (R.4.8)
Non-radical mechanism (involving high-valent iron species Fe(IV)):
≡Fe(II) + H2O2 → ≡Fe(IV) + 2OH- (R.4.9)
≡Fe(IV) + H2O2 → ≡Fe(II) + O2 + 2H+ (R.4.10)
≡Fe(IV) + ≡Fe(II) → 2≡Fe(III) (R.4.11)
In order to evaluate the contribution of free radicals in Fenton reaction catalyzed by Fe-
MFI, a complementary experiment was carried out with and without methanol (CH3OH) as
radical scavenger ([CH3OH] = 50 mM, i.e. 500 times higher than molar concentration of
IBP). In this experiment, methanol was injected after adsorption step (at the same time as the
injection of H2O2). Experimental conditions were kept similar ([H2O2] = 6.4 mM, T = 25°C,
pH0 = 4.3), except that Fe-MFI concentration was set to higher level (4.8 g/L). High Fe-MFI
concentration should increase IBP removal efficiency and facilitates the evaluation of the
radical scavenger effect. From figure 4.7, it can be seen that the presence of excess methanol
reduced IBP removal yield from 88% to 23% (with similar H2O2 consumption of about 80%)
after 3 h. This result is in contrast to the homogeneous Fenton reaction for which complete
inhibition was observed in the presence of methanol (see § 3.1.4). However, methanol might
have scavenged only radicals within the liquid bulk, so that this residual activity could be
explained either from a parallel non-radical mechanism or a radical one but involving
adsorbed IBP.

S. Adityosulindro (2017) / Doctoral Thesis / INP Toulouse
CHAPTER 4 – HETEROGENEOUS PROCESSES
172
Figure 4.7. Effect of methanol on heterogeneous Fenton oxidation of IBP over Fe-MFI ([IBP]0 = 20 mg/L, [Fe-MFI] = 4.8 g/L, [H2O2]0 = 6.4 mM, T = 25°C)
As abovementioned, the presence of different iron active species (i.e. ≡Fe(III) and Fe2+
)
may be responsible for the different initial catalytic activity observed in heterogeneous and
homogeneous systems. Moreover, while in homogeneous reaction dissolved ferrous ions
directly react with H2O2 to form OH, the heterogeneous reaction involves several serial steps
including H2O2 diffusion into the catalyst pores to the active sites, chemisorption of H2O2
onto ≡Fe(III) sites to form ≡Fe(III)(H2O2) surface complex (R.4.5), dissociation of this ferric
complex into ≡Fe(II) species (R.4.6) and reaction between ≡Fe(II) and H2O2 to generate OH
(R.4.7). Subsequently, OH might attack IBP adsorbed on the zeolite framework and/or in the
bulk solution [68]. Since the half-life of OH radical is only a few nanoseconds and its
migration distance is only a few micro-meters [65], reaction with IBP in bulk solution might
be in fact limited on the most external surface of Fe-MFI catalyst.
The catalytic activity of iron-containing zeolite catalyst is thus not only influenced by
the iron content, but also metal dispersion, type of iron species [191], intensity of Brønsted-
lewis acid sites [86], and possibly pore size distribution and particle size [177,277] if
diffusional limitations are involved.
Due to its negligible iron leaching (and thus truly heterogeneous catalytic mechanism),
Fe-MFI was selected for further investigation on heterogeneous Fenton oxidation.
0.0
0.2
0.4
0.6
0.8
1.0
0 30 60 90 120 150 180
IBP
/IB
Po
Time (min)
F (without methanol) F (with methanol)

S. Adityosulindro (2017) / Doctoral Thesis / INP Toulouse
CHAPTER 4 – HETEROGENEOUS PROCESSES
173
4.2. PARAMETRIC STUDY
Prior to evaluate possible sono- and/or photo-activation of the heterogeneous Fenton
reaction, a parametric study was first carried out to investigate the effect of catalyst
concentration, hydrogen peroxide concentration, pH and temperature. Except in the last two
cases, the pH of the IBP solution was not modified and the temperature was set to 25°C. As
abovementioned, a preliminary adsorption step (120 min) was conducted in order to
discriminate IBP removal by adsorption and oxidation.
4.2.1. Effect of solid catalyst concentration
In this study, concentration of Fe-MFI was varied in between 1 and 4.8 g/L, which
should correspond to 0.13 – 0.62 mM of accessible iron. This investigated range was thus
larger than for the homogeneous reaction, thanks to iron immobilization allowing easy
catalyst separation and recycling. In these conditions, increasing Fe-MFI concentration was
always found beneficial for both IBP and TOC removal (figures 4.8A and 4.8B).
IBP degradation was well fitted by a first-order kinetic law, resulting in: k1g/L = 0.0014
min-1
(R2=0.9741), k3g/L = 0.0071 min
-1 (R
2=0.9984), k4.8g/L = 0.0139 min
-1 (R
2=0.9976).
There was thus no plateauing of the oxidation rate when increasing the catalyst concentration,
which excludes any significant radical scavenging effect from surface iron species. The fact
that rate constants did not strictly increase proportionally with respect to the Fe-FMI
concentration could make suspect a possible role of the pollutant adsorption inducing
nonlinear effects.
The effect of solid catalyst concentration could be explained by a higher amount of
active sites for H2O2 decomposition, as confirmed by the increased oxidant consumption
(figure 4.8C). Note however that it was higher than in the homogeneous reaction (1.7 mM or
26% with 1 g/L of Fe-MFI vs. 0.85 mM or 13% with [Fe2+
] = 0.134 mM), despite the
conversion of IBP was much lower. According to the literature, higher H2O2 consumption in
the heterogeneous system could be attributed to the decomposition of H2O2 to water and
oxygen on the zeolite surface [84].
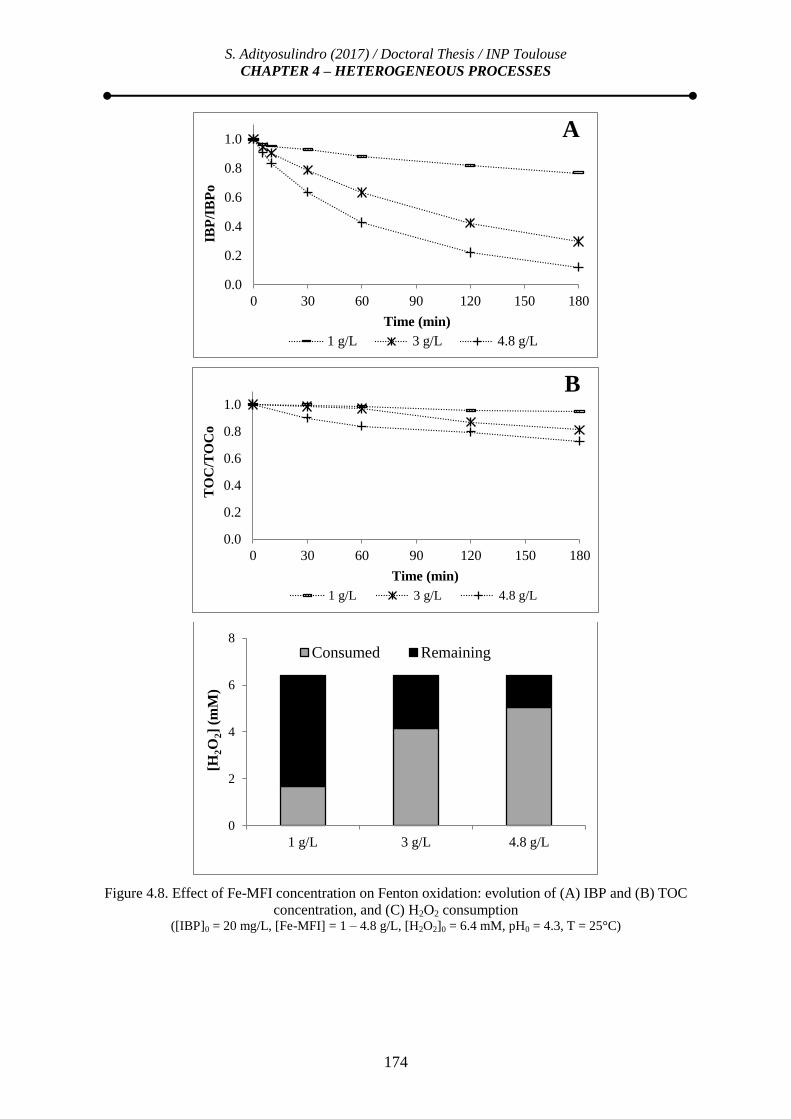
S. Adityosulindro (2017) / Doctoral Thesis / INP Toulouse
CHAPTER 4 – HETEROGENEOUS PROCESSES
174
Figure 4.8. Effect of Fe-MFI concentration on Fenton oxidation: evolution of (A) IBP and (B) TOC
concentration, and (C) H2O2 consumption ([IBP]0 = 20 mg/L, [Fe-MFI] = 1 – 4.8 g/L, [H2O2]0 = 6.4 mM, pH0 = 4.3, T = 25°C)
0.0
0.2
0.4
0.6
0.8
1.0
0 30 60 90 120 150 180
IBP
/IB
Po
Time (min)
A
1 g/L 3 g/L 4.8 g/L
0.0
0.2
0.4
0.6
0.8
1.0
0 30 60 90 120 150 180
TO
C/T
OC
o
Time (min)
B
1 g/L 3 g/L 4.8 g/L
0
2
4
6
8
1 g/L 3 g/L 4.8 g/L
[H2O
2]
(mM
)
Consumed Remaining
S. Adityosulindro (2017) / Doctoral Thesis / INP Toulouse
CHAPTER 4 – HETEROGENEOUS PROCESSES
175
The observed trends were consistent with previous studies using Fe-ZSM5 catalyst.
Olmos et al. [191] and Makhotkina et al. [190] reported that increasing catalyst concentration
improved the oxidation of acetone and MTBE, even at very high concentrations (5-25 and 5-
70 g/L of Fe-ZSM5, respectively).
4.2.2. Effect of H2O2 concentration
As seen in chapter 3 for the homogeneous systems, an optimal dosage is expected for
the oxidant, due to the scavenging of OH provoked by a too large excess. On the other hand,
iron containing zeolite decomposing part of H2O2 into water and oxygen, it should shift this
optimum to a higher value. In this study, the catalyst concentration was set at 4.8 g/L and
three levels of H2O2 concentration were tested - 1.6, 6.4 and 22.4 mM - corresponding to 0.5,
2 and 7 times the stoichiometric amount needed for complete mineralization of IBP. It should
be recalled that for sono- and photo-oxidation (without catalyst) the optimal H2O2
concentration lay in between the last two values.
As depicted in figure 4.9A, IBP oxidation rate increased with H2O2 dosage on the
whole investigated range due to the abovementioned effect of Fe-FMI. Moreover the first-
order rate constant was found proportional to the concentration of oxidant: k1.6 mM = 0.0029
min-1
(R2=0.9678), k6.4 mM = 0.0139 min
-1 (R
2=0.9976), k22.4mM = 0.0411 min
-1 (R
2=0.9983).
H2O2 effect was however somewhat different regarding TOC removal. Increasing H2O2
concentration from 1.6 mM to 6.4 mM enhanced TOC conversion from 11% to 27%, but
further increase to 22.4 mM resulted in only a slight positive effect (28% of mineralization),
mainly due to some levelling off after 60 min. This kind of plateau in TOC removal profile
was also observed by previous studies [163,165,167]. It might result from the complexation
of iron active sites by oxidation intermediates, that hampered Fenton cycle [167], or to the
formation of intermediates exhibiting slower rate constants for radical attack (especially
small organic compounds, such as carboxylic acids [36]). Moreover, under excess of H2O2
higher iron leaching concentration was observed (0.1 mg/L of Fe at 22.4 mM H2O2 vs. 0.048
mg/L at 6.4 mM H2O2) – which might be the result of higher complexation of surface iron.
Note also that similar amount of H2O2 was consumed -5.1 mM vs. 6.5 mM - when starting
with either 6.4 mM or 22.4 mM, respectively (figure 4.9C). These results confirmed that a too
large excess was useless to further improve IBP mineralization.

S. Adityosulindro (2017) / Doctoral Thesis / INP Toulouse
CHAPTER 4 – HETEROGENEOUS PROCESSES
176
Figure 4.9. Effect of H2O2 concentration on Fenton oxidation over Fe-MFI: evolution of (A) IBP and
(B) TOC concentration, and (C) H2O2 consumption ([IBP]0 = 20 mg/L, [Fe-MFI] = 4.8 g/L, [H2O2] = 1.6 – 22.4 mM (0.5 – 7 times stoichiometric amount), pH0 =
4.3, T = 25°C)
0.0
0.2
0.4
0.6
0.8
1.0
0 30 60 90 120 150 180
IBP
/IB
Po
Time (min)
A
1.6 mM 6.4 mM 22.4 mM
0.0
0.2
0.4
0.6
0.8
1.0
0 30 60 90 120 150 180
TO
C/T
OC
o
Time (min)
B
1.6 mM 6.4 mM 22.4 mM
0
4
8
12
16
20
24
1.6 mM 6.4 mM 22.4 mM
[H2O
2]
(mM
)
C
Consumed Remaining

S. Adityosulindro (2017) / Doctoral Thesis / INP Toulouse
CHAPTER 4 – HETEROGENEOUS PROCESSES
177
4.2.3. Effect of H2O2 / Fe molar ratio
Effect of Fenton reagent is usually investigated by varying iron concentration while
keeping H2O2 concentration unchanged and vice versa. On the other hand, the molar ratio of
H2O2 / Fe appears as a key parameter to control the performance of Fenton oxidation and
optimum ratios between 10 – 50 have been reported in the literature [14, 32–36]. In order to
evaluate this role, different amounts of H2O2 and Fe-MFI were tested for two different molar
ratios matching lower and upper bounds of the interval. The corresponding experimental
conditions are given in table 4.2. Note that the molar ratio was calculated based on the
corresponding concentration of accessible iron (instead of total iron) in the suspension as it
should be more relevant.
Table 4.2. Experimental conditions for effect of H2O2 / Fe molar ratio
Experiment Ratio
H2O2/Fe
[H2O2]
(mM)
[Fe-MFI]
(g/L)
[Fe]c
(mM)
R=48 a;1x
b 48 3.2 0.5 0.07
R=48;2x 48 6.4 1 0.13
R=10;1x 10 3.2 2.4 0.32
R=10;2x 10 6.4 4.8 0.64
a R : ratio of molar [H2O2] / [Fe]
b 1x, 2x : [H2O2] corresponds to 1 or 2 times the stoichiometric amount for pollutant mineralization
c [Fe] : corresponding concentration of accessible iron in the slurry (according to CO chemisorption)
IBP and TOC time-concentration profiles exhibited in figure 4.10A and figure 4.10B,
respectively, seem to indicate that low H2O2 / Fe molar ratio (R) promoted faster oxidation
than high value. For instance, after 3 hours of reaction, IBP conversion was more than 65% at
R = 10, but less than 25% at R = 48. However, even higher IBP removal rate was achieved
with 22.4 mM of H2O2 and 4.8 g/L of Fe-MFI (cf. figure 4.9A), i.e. for R = 35. Thus, the
reaction performance could not in fact be reduced to this sole parameter for the investigated
catalyst, probably due to non-radical decomposition of H2O2 over Fe-MFI.
In particular, the effect of increasing H2O2 concentration from 3.2 mM (1x) to 6.4 mM (2x)
was more significant at low H2O2/Fe ratio. Due to the higher concentration of active surface
species for H2O2 decomposition at R = 10, more than half of H2O2 was consumed by the
reaction, while it was the reverse at R = 48 (figure 4.10C). Therefore oxidant concentration
was more limiting in the first case.

S. Adityosulindro (2017) / Doctoral Thesis / INP Toulouse
CHAPTER 4 – HETEROGENEOUS PROCESSES
178
Figure 4.10. Effect of H2O2 / Fe molar ratio on Fenton oxidation over Fe-MFI: evolution of (A) IBP
and (B) TOC concentration, and (C) H2O2 consumption ([IBP]0 = 20 mg/L, R = 10 – 48, [Fe-MFI] = 0.5 – 4.8 g/L, [H2O2]0 = 3.2 – 6.4 mM, pH0 = 4.3, T = 25°C)
0.0
0.2
0.4
0.6
0.8
1.0
0 30 60 90 120 150 180
IBP
/IB
Po
Time (min)
A
R=48;1x R=48;2x R=10;1x R=10;2x
0.0
0.2
0.4
0.6
0.8
1.0
0 30 60 90 120 150 180
TO
C/T
OC
o
Time (min)
B
R=48;1x R=48;2x R=10;1x R=10;2x
0
2
4
6
8
R=48;1x R=48;2x R=10;1x R=10;2x
[H2O
2]
(mM
)
C Consumed Remaining

S. Adityosulindro (2017) / Doctoral Thesis / INP Toulouse
CHAPTER 4 – HETEROGENEOUS PROCESSES
179
4.2.4. Effect of temperature
Based on Arrhenius law, it is expected that an increase in temperature leads to a faster
generation of hydroxyl radicals by the Fenton reaction. On the other hand, it also increases
the rate of wasteful reactions, and temperature effect thus depends on the respective
activation energies. Previous studies in heterogeneous Fenton oxidation using Fe-ZSM5
catalyst reported that catalytic activity was improved by increasing temperature (from 10°C
to 80°C) and no optimum value was observed [84,86,177,190].
Three levels of temperature, i.e. 15°C, 25°C and 45°C, were investigated here, resulting
only in a marginal effect on IBP adsorption. A clear enhancement in terms of IBP oxidation
rate constant (k15°C = 0.0057 min-1
(R2=0.9946), k25°C = 0.0139 min
-1 (R
2=0.9976), k45°C =
0.0470 min-1
(R2=0.9992)) was observed at higher temperature (figure 4.11A), leading to an
apparent activation energy of 53 kJ/mol. TOC conversion was also improved at higher
temperature, but to a lesser extent than IBP conversion (figure 4.11B). As observed
previously at the highest H2O2 concentration, the removal of TOC plateaued after 60 min for
the experiment conducted at 45°C, so that mineralization yield still did not exceed 28%. It
should be however noticed figure 4.11C that actually all H2O2 was consumed at the end of
the experiment performed at 45°C, which in fact explained here why the reaction was
stopped.
On the other hand, iron leaching was significantly higher at 45°C (0.21 mg/L of Fe)
than at 25°C (0.048 mg/L) and 15°C (0.046 mg/L), and possible contribution of
homogeneous contribution will be thus addressed in section 4.2.6. Even though dissolved
iron is still below the standard limit for discharge (2 mg/L), metal loss should be minimized
to limit catalyst deactivation upon recycling or continuous operation. From economical point
of view, working under room temperature is better in industrial scale application. Therefore,
room temperature was preferred for further investigation of Fe-MFI. Note however that under
process conditions, the reaction could thus benefit from the temperature increase by
ultrasound/light activation.
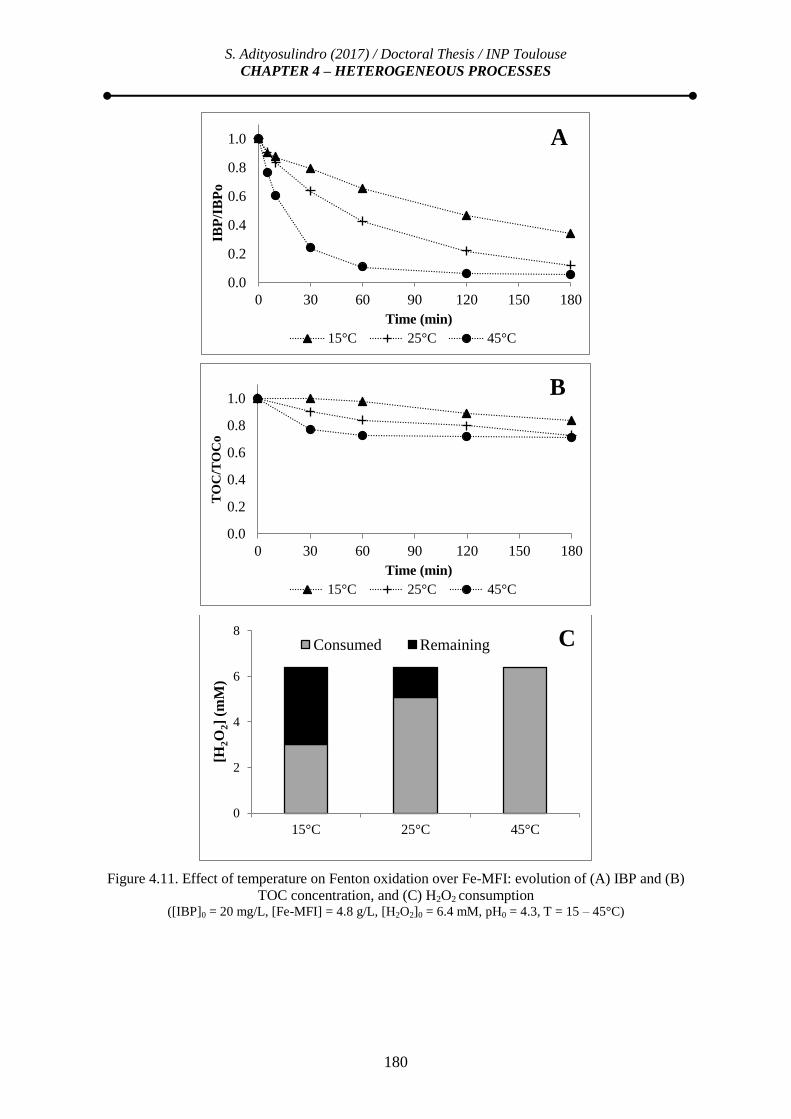
S. Adityosulindro (2017) / Doctoral Thesis / INP Toulouse
CHAPTER 4 – HETEROGENEOUS PROCESSES
180
Figure 4.11. Effect of temperature on Fenton oxidation over Fe-MFI: evolution of (A) IBP and (B)
TOC concentration, and (C) H2O2 consumption ([IBP]0 = 20 mg/L, [Fe-MFI] = 4.8 g/L, [H2O2]0 = 6.4 mM, pH0 = 4.3, T = 15 – 45°C)
0.0
0.2
0.4
0.6
0.8
1.0
0 30 60 90 120 150 180
IBP
/IB
Po
Time (min)
A
15°C 25°C 45°C
0.0
0.2
0.4
0.6
0.8
1.0
0 30 60 90 120 150 180
TO
C/T
OC
o
Time (min)
B
15°C 25°C 45°C
0
2
4
6
8
15°C 25°C 45°C
[H2O
2]
(mM
)
C Consumed Remaining

S. Adityosulindro (2017) / Doctoral Thesis / INP Toulouse
CHAPTER 4 – HETEROGENEOUS PROCESSES
181
4.2.5. pH effect
Heterogenization of the Fenton system usually overcomes the classical problem of loss
of iron catalyst and narrow pH range (pH = 2 – 4). However, several studies using Fe-ZSM5
catalyst reported that acidic conditions (pH = 3 – 4) were still necessary to obtain appreciable
catalytic activity [86,177,190], while others indicated that this type of catalyst could work
well under near-neutral pH (pH = 4 – 6) [84,163,165,167]. Velichkova et al. [165] observed
that the oxidation rate of paracetamol over Fe-MFI was similar with or without preliminary
acidification of the solution (at pH0 2.8), probably due to the zeolite ability to significantly
lower the pH (from 5.5 to 3.6). As abovementioned, the acidity of Fe-MFI is due to the
presence of Brønsted and Lewis acid sites on the zeolite [201].
The investigation of pH effect was here carried out close to neutral conditions (pH = 4
– 8) with or without controlled pH. This range was also chosen to mimic the pH of a real
wastewater matrix which is usually buffered at circumneutral or slightly alkaline value
[67,164,178,278]. The experimental conditions are given in table 4.3 and the experiments
were performed with 4.8 g/L of Fe-MFI.
Table 4.3. Experimental conditions for pH effect
Experiment pHo pHi pHf pH setting method
pH 4.3 4.3 3.3 3.2 Experiment was conducted with
the synthetic IBP solution
without pH adjustment
pH 6.0 6.0 3.3 3.2 pH of the solution was set to 6.0
using NaOH 1 M before contact
with solid catalyst
pH 8.0 8.0 3.6 3.5 pH of the solution was set to 8.0
using NaOH 1 M before contact
with solid catalyst
pH 7.0 (controlled) 7.0 7.0 7.0 pH of the solution was adjusted
to 7 (+0.2) using NaOH 1 M
during the experiment
pHo: initial pH of the solution, pHi: pH of the solution after adsorption step, pHf: pH of the solution at the
end of reaction
Increasing the initial pH of the solution to 6 or 8 had negligible influence on IBP time-
concentration profile, which was almost superimposed to that obtained without pH
adjustment (figure 4.12A), and led to a small reduction of TOC conversion for the highest

S. Adityosulindro (2017) / Doctoral Thesis / INP Toulouse
CHAPTER 4 – HETEROGENEOUS PROCESSES
182
value (figure 4.12B). In addition, similar IBP adsorption was also observed during the
preliminary solid-liquid contacting phase. As abovementioned, these results could be
explained by the ability of Fe-MFI to acidify the different solutions (pH0 = 4.3 – 8) towards
almost single pH value (pHi = 3.3 – 3.6) during the adsorption step (table 4.3).
On the contrary, IBP adsorption was reduced from 25% to 5% and degradation kinetics
was significantly hampered if the reaction was performed under a controlled pH of 7 by
continuous addition of NaOH during the experiment: IBP removal rate was found 12 times
slower (k = 0.0012 min-1
) than under non-controlled pH, and final TOC abatement decreased
from 27% to 7%. Under this condition, IBP was in ionic form and zeolite surface was
negatively charged, thus leading to electrostatic repulsion. This observation provides support
for the hypothesis that of OH attack in heterogeneous Fenton oxidation of IBP mainly
occurred on the catalyst surface.
Moreover, lower IBP and TOC conversions at pH 7 were not followed by lower H2O2
consumption, figure 4.12C. It is noteworthy to recall that the mixture of IBP and H2O2 (6.4
mM) was previously found to be stable at pH 8, as self-decomposition of H2O2 only occurs
only at pH > 10 [279,280].
Similar trends were reported by Makhotkina et al. [190] for the wet peroxide oxidation
of 1,1-dimethylhydrazine over Fe-ZSM5 catalyst: the molecule abatement was lower at
neutral-alkaline pH (pH=7-10) compared to acidic pH (pH=2-5), while H2O2 consumption
remained similar. The authors argued that different reaction mechanisms occurred depending
on pH, as they measured different values of activation energy for the catalytic decomposition
of H2O2 under alkaline (17 kJ/mol) and acidic (53 kJ/mol) conditions. The former value being
closer to that observed in the presence of catalase (7 kJ/mol) or iron oxohydroxides (11
kJ/mol) than in the presence of transition metal ions (30–80 kJ/mol) where free-radical
mechanism takes place, alkaline conditions were believed to favor non-radical decomposition
route.

S. Adityosulindro (2017) / Doctoral Thesis / INP Toulouse
CHAPTER 4 – HETEROGENEOUS PROCESSES
183
Figure 4.12. Effect of pH on Fenton oxidation over Fe-MFI: evolution of (A) IBP and (B) TOC
concentration, and (C) H2O2 consumption ([IBP]0 = 20 mg/L; [Fe-MFI] = 4.8 g/L, [H2O2]0 = 6.4 mM, pH0 = 4.3-8 or pH controlled at 7, T = 25°C)
Non-radical mechanism at neutral or alkaline pH, mediated by high-valent iron species,
was also proposed by other researchers [50,65]. Note that in our case the zeolite support also
0.0
0.2
0.4
0.6
0.8
1.0
0 30 60 90 120 150 180
IBP
/IB
Po
Time (min)
A
pHo = 4.3 pHo = 6.0
pHo = 8.0 pH = 7.0 (controlled)
0.0
0.2
0.4
0.6
0.8
1.0
0 30 60 90 120 150 180
TO
C/T
OC
o
Time (min)
B
pHo = 4.3 pHo = 6.0
pHo = 8.0 pH = 7.0 (controlled)
0
2
4
6
8
[H2O
2]
(mM
)
C Consumed Remaining
S. Adityosulindro (2017) / Doctoral Thesis / INP Toulouse
CHAPTER 4 – HETEROGENEOUS PROCESSES
184
induced such mechanism [15]. An alternative explanation for this lower performance at pH 7
could lie in the reduction of OH oxidation potential at neutral pH (2.8 V at pH 3 vs 1.9 V at
pH 7 [177]).
Regarding iron leaching, increasing pH toward alkaline condition (pH controlled at 7)
reduced the concentration of dissolved iron from 0.048 mg/L to 0.024 mg/L.
4.2.6. Activity of leached iron
Metal loss into the solution could initiate homogeneous Fenton reaction, whose
contribution should depend not only on the concentration of dissolved iron, but also the
nature of the corresponding species (for instance free or as complexes).
First, the concentration of leached iron in the present study (0.048 – 0.21 mg/L
corresponding to 0.03 – 0.13 % of total iron content in Fe-ZSM5) was in the lower range
compared to that measured in previous works with Fe-ZSM5 catalyst (0.040 – 4 mg/L or 0.4
– 7% of initial catalyst content) [84,162,163,165,167]. Iron leaching rate is influenced by
many factors including pH, temperature, catalyst particle size, but also H2O2 concentration
[84,177] and intermediates formed during reaction [165]. It should be also mentioned that
commercial Fe-ZSM5 catalyst [163,165] is usually more stable than laboratory-prepared Fe-
ZSM5 [84,162,167].
Nonetheless, despite these wide variations in dissolved iron concentration (0.04 – 4
mg/L), negligible contribution of homogeneous reaction was always reported when examined
[84,162,165].
To verify this point in the present conditions, activity of the leachates was also
examined. The suspensions collected after heterogeneous oxidation experiment at 25°C ([Fe]
leached = 48 µg/L) and 45°C ([Fe] leached = 210 µg/L) - both at 4.8 g/L Fe-MFI and 6.4 mM
H2O2 - were filtered on a 0.2 µm pore size membrane. Then the leachates were
complemented with IBP and H2O2 to match previous initial conditions. Figure 4.13A and
figure 4.13B compare the time-concentration profiles of IBP and TOC during Fenton
oxidation with Fe-MFI catalyst and corresponding filtrate.

S. Adityosulindro (2017) / Doctoral Thesis / INP Toulouse
CHAPTER 4 – HETEROGENEOUS PROCESSES
185
Figure 4.13. Activity of leachate for Fenton oxidation: evolution of (A) IBP and (B) TOC
concentration, and (C) H2O2 consumption ([IBP]0 = 20 mg/L, [Fe-MFI] = 4.8 g/L, [Fe]leachate = 48 µg/L (25°C) and 210 µg/L (45°C), [H2O2]0 = 6.4 mM,
pH0 Fe-MFI* = 4.3, pH0 leachate = 3.2, T = 25°C and 45°C) (*before contact). Corresponding Fenton oxidations were
recalled for comparison
0.0
0.2
0.4
0.6
0.8
1.0
0 30 60 90 120 150 180
IBP
/IB
Po
Time (min)
A
Fe-MFI (25°C) Fe-MFI (45°C)
Leachate (48 µg/L;25°C) Leachate (210 µg/L;45°C)
0.0
0.2
0.4
0.6
0.8
1.0
0 30 60 90 120 150 180
TO
C/T
OC
o
Time (min)
B
Fe-MFI (25°C) Fe-MFI (45°C)
Leachate (48 µg/L;25°C) Leachate (210 µg/L;45°C)
0
2
4
6
8
Fe-MFI
(25°C)
Leachate (48
µg/L;25°C)
Fe-MFI
(45°C)
Leachate (210
µg/L;45°C)
[H2O
2]
(mM
)
C Consumed Remaining

S. Adityosulindro (2017) / Doctoral Thesis / INP Toulouse
CHAPTER 4 – HETEROGENEOUS PROCESSES
186
In accordance with the previous studies, negligible IBP and TOC degradation was
indeed observed with the leachate at 25°C, while only 21% conversion of IBP was observed
for the other condition (210 µg/L of Fe at 45°C). In line with this result, only marginal H2O2
consumptions were measured (figure 4.13C), indicating that the amount of dissolved iron was
too small to yield appreciable decomposition rate and/or the corresponding species exhibited
negligible activity. This confirms that Fenton oxidation of IBP over Fe-MFI was mainly
induced by surface iron species.
Highlights: heterogeneous Fenton processes
Catalytic activity of iron-containing zeolite of ZSM5 type (Fe-MFI) and zero-
valent iron particles (ZVI) was compared.
Fe-MFI catalyst was selected as it did not require preliminary acidification
and led to very low iron leaching (<0.1 mg/L)
IBP removal increased with increasing both Fe-MFI and H2O2 concentrations
and temperature, but reduced under buffered-neutral pH
Appreciable ibuprofen removal (88%) and mineralization (27%) were
obtained in heterogeneous Fenton reaction performed under mild conditions
(25°C, not controlled pH, 4.8 g/L of Fe-MFI, 2 times the stoichiometric
amount of H2O2)

S. Adityosulindro (2017) / Doctoral Thesis / INP Toulouse
CHAPTER 4 – HETEROGENEOUS PROCESSES
187
4.3. HETEROGENEOUS SONO-FENTON PROCESSES
Besides the easiest recovery of the catalyst, heterogeneous Fenton oxidation also allows
to operate at wider pH ranges than the homogeneous reaction. However its main drawback
lies in significantly lower reaction rates as shown in § 4.1.2 and possible catalyst deactivation
by reaction byproducts (such as oligomers formed at catalyst surface blocking the active
surface) [45]. To overcome these issues, ultrasound irradiation can be used for chemical
activation and continuous cleaning of the catalyst surface [122,192], as well as for
improvement of active surface area due to particle size reduction [281]. In this section,
coupling of heterogeneous Fenton oxidation (F) and ultrasound (US) called heterogeneous
sono-Fenton oxidation (US/F) was studied. In addition to the operating parameters of the
Fenton reaction, different US characteristics were varied, namely density, intensity,
frequency and application mode. As for homogeneous processes, 20 kHz was chosen as
reference ultrasound frequency.
4.3.1. Investigation of 20 kHz sono-Fenton oxidation
4.3.1.1. Effect of catalyst particles on sonolysis
First, to better assess the effect of ultrasound on heterogeneous systems, a preliminary
test was performed to investigate the possible influence of Fe-MFI particles on sonolysis at
20 kHz in the absence of oxidant.
Previous studies conducted at higher frequencies (80-200 kHz) reported contradictory
conclusions for particles in the 5-15 µm range (0.1 – 1% solid content): no effect [105],
detrimental [282] or positive one [283]. Indeed, regardless of the particle type (active or
inert), solid can either provide additional nuclei for cavitation improving the generation of
radicals [192,284] or attenuate the sound waves involving a decrease in the net energy
transferred into the system [129]. Ultrasound attenuation in slurry depends upon the size of
the particles with respect to the sound wavelength ( = c/f with c the sound velocity 1500
m/s in water). Scattering effect is important when the particle radius (Rp) is of the same order
of magnitude or higher than the sound wavelength, while viscous loss dominates in the
reverse case [123]. Nonetheless, under cavitation conditions, the effect of bubbles might be
higher than that of solid.

S. Adityosulindro (2017) / Doctoral Thesis / INP Toulouse
CHAPTER 4 – HETEROGENEOUS PROCESSES
188
On the other hand, solid particles can act as adsorbent for the target molecule or as
catalyst to further decompose hydrogen peroxide generated by ultrasound. As shown in figure
4.14, conversion of IBP and TOC was found very similar with 4.8 g/L of Fe-MFI or without
particles, indicating they had no effect on sonolysis process. Negligible attenuation of US is
consistent considering the mean size of the particles (d43 = 7.9 µm) - much lower than (7.5
cm at 20 kHz) - and the rather low concentration of the slurry (about 0.5%). Concentration of
H2O2 generated by US (0.41 µM/min) was also too low for heterogeneous Fenton mechanism
to superimpose.
Figure 4.14. Effect of Fe-MFI on sonolysis: evolution of (A) IBP and (B) TOC concentration. ([IBP]0 = 20 mg/L, [Fe-MFI] = 4.8 g/L, pH0 = 4.3, T = 25°C, fUS = 20 kHz, DUS = 50 W/L)
0.0
0.2
0.4
0.6
0.8
1.0
0 30 60 90 120 150 180
IBP
/IB
Po
Time (min)
A
US US / Fe-MFI (4.8 g/L)
0.0
0.2
0.4
0.6
0.8
1.0
0 30 60 90 120 150 180
TO
C/T
OC
o
Time (min)
B
US US / Fe-MFI (4.8 g/L)

S. Adityosulindro (2017) / Doctoral Thesis / INP Toulouse
CHAPTER 4 – HETEROGENEOUS PROCESSES
189
4.3.1.2. Comparison of Fenton and sono-Fenton oxidation with Fe/MFI
The effect of 20 kHz ultrasound as activation technique for heterogeneous Fenton
reaction was investigated under the following reaction conditions: pH0 = 4.3, T = 25°C
(controlled), [H2O2]0 = 6.4 mM, [Fe-MFI] = 1 g/L (-) and 4.8 g/L (+), using DUS = 50 W/L.
As depicted in figure 4.15, ultrasound irradiation had only marginal effect on Fenton
oxidation for the highest solid concentration. Under sonication, the first order rate constant
for IBP oxidation (k) only increased from 0.0139 (F(+)) to 0.0159 min-1
(US/F(+)). In this
case, the overall process was dominated by the Fenton reaction, that produced •OH faster than
ultrasound (kUS = 0.0035 min-1
).
On the other hand, apparent additive effect between US and Fenton reaction was
observed at catalyst concentration of 1 g/L, resulting for IBP oxidation into: kUS/F = 0.0059
min-1
vs. kF = 0.0014 min-1
and kUS (or kUS/6.4 mM H2O2) = 0.0038 min-1
. In the same way, TOC
conversion by the coupling process (14%) was close to the sum of individual Fenton
oxidation (5%) and sonolysis (7%). Similar H2O2 consumption was observed in both cases
(26% in Fenton vs. 27% in sono-Fenton), discarding any enhancement of the reaction as it
was observed for the homogeneous system (cf. § 3.2.2).
The benefit of hybridizing heterogeneous Fenton oxidation with US is still a matter of
discussion, because some studies reported a synergistic interaction [64,105,119,122,130,175],
while others indicated only minor effects [127–129]. Moreover, when a synergistic effect was
observed, activation of heterogeneous catalyst was only concluded in some cases
[105,122,175]. Absence of synergistic effect in the present study could be ascribed to limited
iron surface (re)activation, negligible contribution of iron leaching and/or limited particle size
reduction (discussed in details in § 4.6).
To further investigate this coupling, a parametric study was conducted by varying
ultrasound parameters: application mode, power intensity, power density and frequency.
Heterogeneous sono-Fenton oxidation was then mainly performed at high catalyst
concentration ([Fe-MFI] = 4.8 g/L), considering the appreciable IBP removal under this
condition.

S. Adityosulindro (2017) / Doctoral Thesis / INP Toulouse
CHAPTER 4 – HETEROGENEOUS PROCESSES
190
Figure 4.15. Comparison of Fenton and sono-Fenton oxidation with Fe-MFI: evolution of (A) IBP and
(B) TOC concentration, and (C) H2O2 consumption ([IBP]0 = 20 mg/L, pH0 = 4.3, T = 25°C, [H2O2]0 = 6.4 mM, [Fe-MFI] = 1 and 4.8 g/L, fUS = 20 kHz, DUS = 50
W/L)
0.0
0.2
0.4
0.6
0.8
1.0
0 30 60 90 120 150 180
IBP
/IB
Po
Time (min)
A
US F(-) F (+) US/F(-) US/F(+)
0.0
0.2
0.4
0.6
0.8
1.0
0 30 60 90 120 150 180
TO
C/T
OC
o
Time (min)
B
US F(-) F(+) US/F(-) US/F(+)
0
20
40
60
80
100
F(-) US/F(-) F(+) US/F(+)
H2O
2 c
on
sum
pti
on
(%
)
C
S. Adityosulindro (2017) / Doctoral Thesis / INP Toulouse
CHAPTER 4 – HETEROGENEOUS PROCESSES
191
4.3.2. Effect of US application mode
For applications where mechanical effects were mainly sought, like in sludge
pretreatment, high power for a short time was found beneficial [253,285].
Previous studies on sono-Fenton process were performed in either continuous
[81,82,106] or sequential (pulse) mode [117,121,127,130]. However, they rarely compared
the effect of US operation mode with same applied specific energy (EUS).
In this study, effect of ultrasound application mode was firstly investigated by doubling
the power input (100 W/L) with a cycle of 10 seconds US ON and 10 seconds US OFF, in
order to get higher transient mechanical effects for the activation of the catalyst surface at
similar energy consumption (540 kJ/kg). Actually, it didn’t result in any measurable
influence: IBP and TOC removal at the end of the reaction remained at 96% and 23%,
respectively, figure 4.16. Therefore, continuous mode was used for following experiments.
4.3.3. Effect of ultrasound intensity
Ultrasound intensity (IUS) or ultrasound power input per unit probe surface is one of the
main parameters of ultrasound, as it is directly linked to the amplitude of the acoustic
pressure. However, it is usually investigated by varying ultrasound power with the same
probe [81,121,127] and more rarely by changing the emitter diameter. In this case, variation
of US intensity was performed by changing probe diameter from 51 mm (IUS = 2.45 W/cm2)
to 35 mm (IUS = 5.2 W/cm2), while the power density was kept constant at 50 W/L. Again, it
didn’t yield any increase of the pollutant conversion or mineralization, which could be the
result of a reduced volume of the cavitation zone balancing locally enhanced effects (figure
4.17).

S. Adityosulindro (2017) / Doctoral Thesis / INP Toulouse
CHAPTER 4 – HETEROGENEOUS PROCESSES
192
Figure 4.16. Effect of US application mode on sono-Fenton oxidation with Fe-MFI: evolution of (A)
IBP and (B) TOC concentration, and (C) H2O2 consumption ([IBP]0 = 20 mg/L, pH0 = 4.3, T = 25°C, [H2O2]0 = 6.4 mM, [Fe-MFI] = 4.8 g/L, fUS = 20 kHz, EUS = 540 kJ/kg,
sequential mode: 10 s US ON / 10 s US OFF)
0.0
0.2
0.4
0.6
0.8
1.0
0 30 60 90 120 150 180
IBP
/IB
Po
Time (min)
A
Continuous Sequential
0.0
0.2
0.4
0.6
0.8
1.0
0 30 60 90 120 150 180
TO
C/T
OC
o
Time (min)
B
Continuous Sequential
0
20
40
60
80
100
Continuous Sequential
H2O
2 c
on
sum
pti
on
(%
)
C

S. Adityosulindro (2017) / Doctoral Thesis / INP Toulouse
CHAPTER 4 – HETEROGENEOUS PROCESSES
193
Figure 4.17. Effect of US intensity on Fenton oxidation with Fe-MFI: evolution of (A) IBP and (B)
TOC concentration, and (C) H2O2 consumption ([IBP]0 = 20 mg/L, pH0 = 4.3, T = 25°C, [H2O2]0 = 6.4 mM, [Fe-MFI] = 4.8 g/L, fUS = 20 kHz, IUS = 2.45 – 5.2
W/cm2)
0.0
0.2
0.4
0.6
0.8
1.0
0 30 60 90 120 150 180
IBP
/IB
Po
Time (min)
A
2.45 W/cm2 5.2 W/cm2
0.0
0.2
0.4
0.6
0.8
1.0
0 30 60 90 120 150 180
TO
C/T
OC
o
Time (min)
B
2.45 W/cm2 5.2 W/cm2
0
20
40
60
80
100
2.45 W/cm2 5.2 W/cm2
H2O
2 c
on
sum
pti
on
(%
)
C

S. Adityosulindro (2017) / Doctoral Thesis / INP Toulouse
CHAPTER 4 – HETEROGENEOUS PROCESSES
194
4.3.4. Effect of ultrasound power density
The influence of a higher ultrasound density (DUS) was investigated by comparing
sono-Fenton results at 50 W/L (US(-)) and 100 W/L (US(+)), corresponding to specific
energy (EUS) of 540 kJ/kg and 1080 kJ/kg, respectively. It should be noted that this range of
EUS is similar to that used in previous works (EUS = 500 – 1000 kJ/kg) [81,117,120,127]. For
these tests, 1 and 4.8 g/L of Fe-MFI were successively used (denoted F(-) and F(+)) (table
4.4).
Figure 4.18A and figure 4.18B put into evidence a slight increase in IBP and TOC
removal when doubling DUS. However, IBP oxidation rate constant increased by 50%
maximum (table 4.4), while the improvement of final TOC conversion did not exceed 27%.
Similarly, up to 7% higher consumption of H2O2 was measured at DUS = 100 W/L.
Moreover, it can be seen that the enhancement in catalytic activity was clearer at high
Fe-MFI concentration (condition US(+)/F(+)). This might be due to a higher contact between
OOH and ≡Fe(III) leading to catalyst surface activation according to Eq. R.4.12 – 4.14 [71]:
H2O + ))) → OH +
H (R.4.12)
OH + H2O2 →
OOH + H2O (R.4.13)
≡Fe(III) + OOH → ≡Fe(II) + O2 + H
+ (R.4.14)
The limited improvement at 100 W/L also explains why the sequential application mode of
US (§ 4.3.2) or the twice increase in US intensity at same EUS (§ 4.3.3) had only low effect on
sono-Fenton efficiency. Accounting for higher energy consumption versus relatively low
enhancement in terms of IBP and TOC removal, continuous application of this high power
input may be not economical.
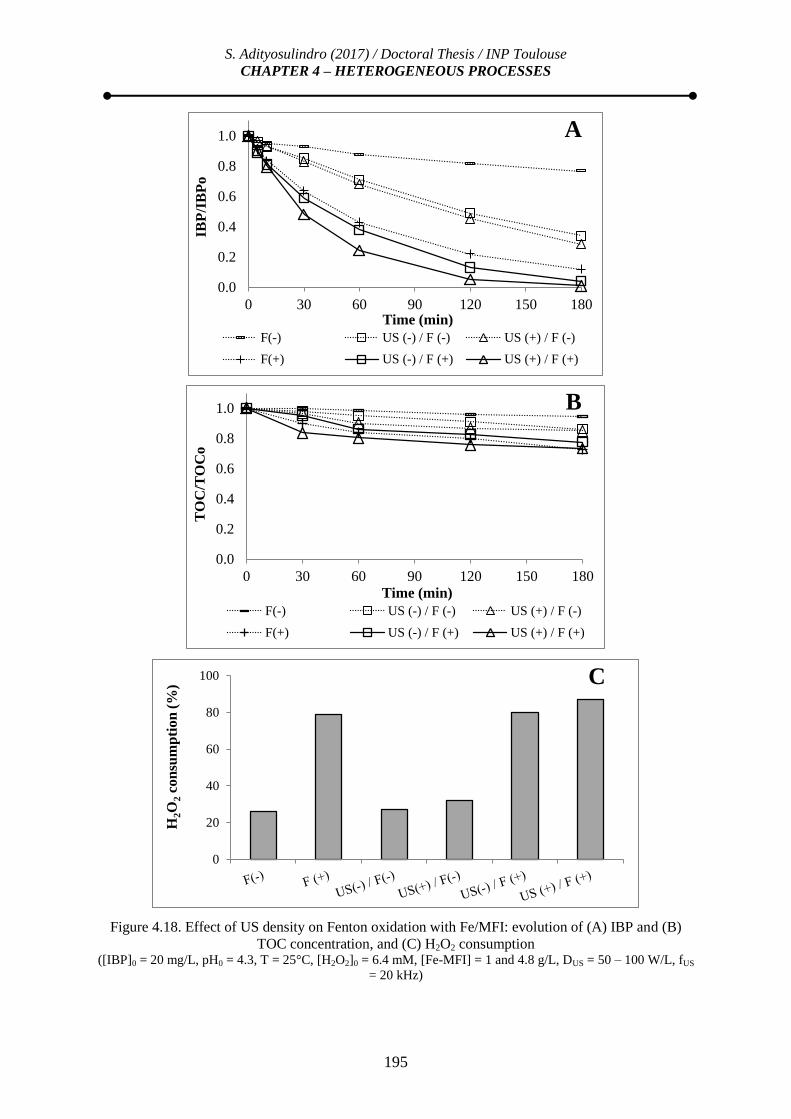
S. Adityosulindro (2017) / Doctoral Thesis / INP Toulouse
CHAPTER 4 – HETEROGENEOUS PROCESSES
195
Figure 4.18. Effect of US density on Fenton oxidation with Fe/MFI: evolution of (A) IBP and (B)
TOC concentration, and (C) H2O2 consumption ([IBP]0 = 20 mg/L, pH0 = 4.3, T = 25°C, [H2O2]0 = 6.4 mM, [Fe-MFI] = 1 and 4.8 g/L, DUS = 50 – 100 W/L, fUS
= 20 kHz)
0.0
0.2
0.4
0.6
0.8
1.0
0 30 60 90 120 150 180
IBP
/IB
Po
Time (min)
A
F(-) US (-) / F (-) US (+) / F (-)
F(+) US (-) / F (+) US (+) / F (+)
0.0
0.2
0.4
0.6
0.8
1.0
0 30 60 90 120 150 180
TO
C/T
OC
o
Time (min)
B
F(-) US (-) / F (-) US (+) / F (-)
F(+) US (-) / F (+) US (+) / F (+)
0
20
40
60
80
100
H2O
2 c
on
sum
pti
on
(%
) C

S. Adityosulindro (2017) / Doctoral Thesis / INP Toulouse
CHAPTER 4 – HETEROGENEOUS PROCESSES
196
Table 4.4. Effect of ultrasound power density on IBP degradation
Process DUS (W/L)
[Fe-MFI] (g/L)
IBP removal
(%)
TOC
removal
(%)
H2O2 Cons. (%)
k IBP (min
-1)
SF*
US(-) 50 - 48 7 - 0.0035 - US(+) 100 - 58 7 - 0.0048 - F(-) - 1 23 5 26 0.0014 - F(+) - 4.8 88 27 79 0.0139 - US(-)/F(-) 50 1 66 14 27 0.0059 1.2 US(+)/F(-) 100 4.8 72 15 32 0.0069 1.1 US(-)/F(+) 50 1 96 23 80 0.0159 0.9 US(+)/F(+) 100 4.8 99 27 87 0.0239 1.3
Other parameters remained constant: [IBP]0 = 20 mg/L, [H2O2]0 = 6.4 mM, pH0 = 4.3, T = 25°C, fUS = 20 kHz;
*E.3.1 (cf. § 3.2.4)
4.3.5. Effect of ultrasound frequency
While the increase in US frequency promotes the generation of hydroxyl radicals,
decreasing the sonication frequency should enhance mixing, mass transfer, dispersion and
disaggregation of solid catalyst particles, as well as increase the surface defects or active sites
on the catalyst surface [243].
In the presence of 4.8 g/L of Fe-MFI, varying sound frequency from 12 to 862 kHz
only marginally improved IBP and TOC removal rates (figures 4.19A and 4.19B). Slightly
reduced degradation at 12 kHz vs. 20 kHz discarded any activation of the catalyst surface by
US mechanical effects, probably because the particles (about 8 µm mean diameter) were
small as compared to the size of the cavitation bubbles (Sauter diameter of 10 to 50 µm at 20
kHz [96]). This is also consistent with the negligible evolution of particle size, morphology or
iron content reported under ultrasound in § 4.6.
Moreover, in any case, the reaction probably didn’t suffer from high enough limitations
by internal or external mass transfer to see low frequency sonication bring any improvement
on the whole process. Consumption of H2O2 at the end of reaction was also the same under
12 and 20 kHz (figure 4.19C). In sole sonolysis, rate constant of IBP removal was multiplied
by a factor 3 between 20 and 862 kHz (cf. § 3.1.2.4), leading to a value (0.0102 min-1
at 862
kHz) comparable to that of Fenton oxidation (0.0139 min-1
). However, additive effects were
hardly seen in coupling processes even under high frequency (kUS(862 kHz)/F = 0.0174 min-1
).
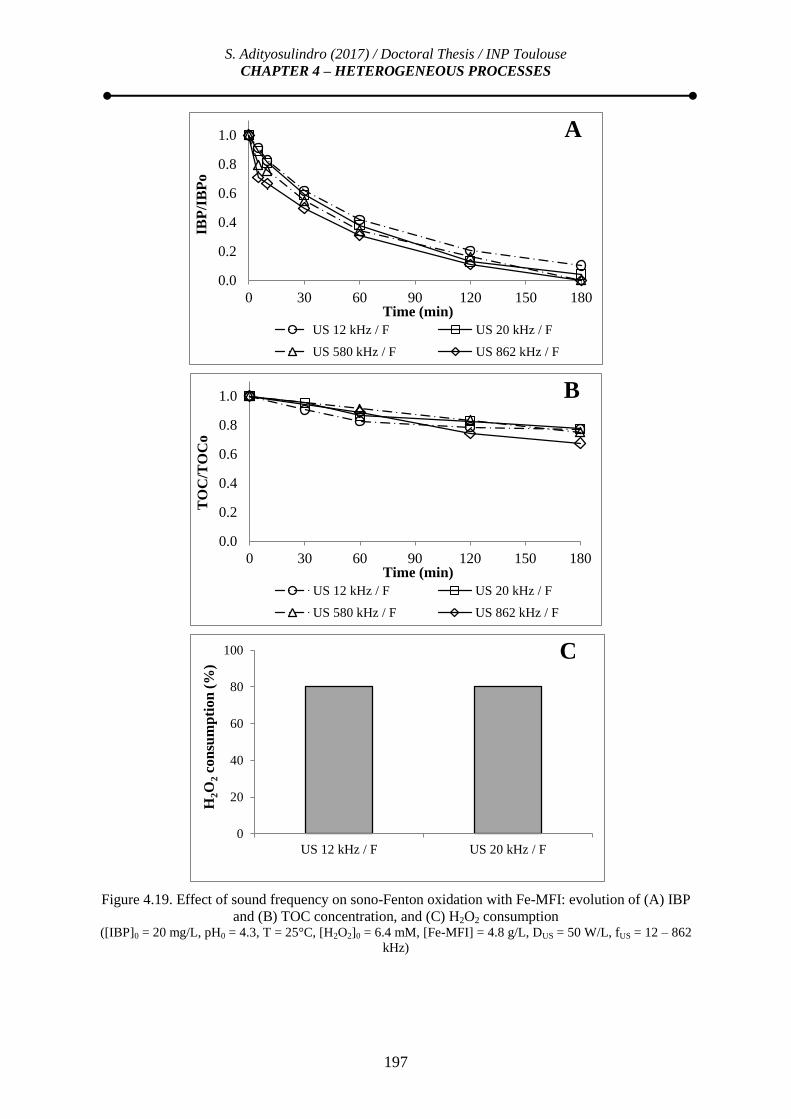
S. Adityosulindro (2017) / Doctoral Thesis / INP Toulouse
CHAPTER 4 – HETEROGENEOUS PROCESSES
197
Figure 4.19. Effect of sound frequency on sono-Fenton oxidation with Fe-MFI: evolution of (A) IBP
and (B) TOC concentration, and (C) H2O2 consumption ([IBP]0 = 20 mg/L, pH0 = 4.3, T = 25°C, [H2O2]0 = 6.4 mM, [Fe-MFI] = 4.8 g/L, DUS = 50 W/L, fUS = 12 – 862
kHz)
0.0
0.2
0.4
0.6
0.8
1.0
0 30 60 90 120 150 180
IBP
/IB
Po
Time (min)
A
US 12 kHz / F US 20 kHz / F
US 580 kHz / F US 862 kHz / F
0.0
0.2
0.4
0.6
0.8
1.0
0 30 60 90 120 150 180
TO
C/T
OC
o
Time (min)
B
US 12 kHz / F US 20 kHz / F
US 580 kHz / F US 862 kHz / F
0
20
40
60
80
100
US 12 kHz / F US 20 kHz / F
H2O
2 c
on
sum
pti
on
(%
)
C
S. Adityosulindro (2017) / Doctoral Thesis / INP Toulouse
CHAPTER 4 – HETEROGENEOUS PROCESSES
198
4.4. HETEROGENEOUS PHOTO-FENTON PROCESSES
As shown in chapter 3 (§ 3.2.3), ultraviolet (UV) and visible (Vis) light irradiation
emitted by LP Hg and xenon lamp can be used to enhance homogeneous Fenton oxidation
process. In this section, coupling of heterogeneous Fenton oxidation and light irradiation (UV
from LP Hg lamp or Vis from Xe lamp) called heterogeneous photo-Fenton processes (LP
Hg/F or Xe/F) was also examined (using loop reactor configuration).
4.4.1. Heterogeneous photo-Fenton oxidation under UV light (LP Hg lamp)
Activation of heterogeneous Fenton oxidation by light irradiation was firstly evaluated
at 254 nm (using LP Hg lamp). Experiments were carried out at different Fe-MFI
concentrations: 1 g/L and 4.8 g/L (denoted as (-) and (+), respectively), while other
parameters remained constant (pH0 4.3 and 25°C). The results of photolysis (LP Hg), photo-
oxidation (LP Hg/H2O2) and “dark” heterogeneous Fenton (F) are also recalled in figure 4.20
for comparison purpose.
Ibuprofen degradation rate was significantly improved when shifting from “dark” to
photo-assisted Fenton oxidation (figure 4.20A). Same trend was observed for TOC at 1 g/L of
Fe-MFI, while F(+) and LP Hg/F(+) achieved almost same TOC conversion after 3 hours
(figure 4.20B). On the other hand, degradation profiles by LP Hg/Fenton and LP Hg/H2O2
were found very similar suggesting that direct photolysis of hydrogen peroxide was the
dominant process even at the highest catalyst concentration.
Furthermore, it is worth noting that in fact IBP removal rate decreased with an increase
in catalyst concentration. Indeed, the rate constants for LP Hg/H2O2, LP Hg/F(-) and LP
Hg/F(+) process were 0.0664 min-1
(R2=0.9954), 0.0578 min
-1 (R
2=0.9987) and 0.0411 min
-1
(R2=0.9970), respectively. In these conditions, UV light scattering/absorption caused by the
presence of Fe-MFI particles seemed to overweigh their catalytic effect, thus reducing the
effectiveness of radical production.

S. Adityosulindro (2017) / Doctoral Thesis / INP Toulouse
CHAPTER 4 – HETEROGENEOUS PROCESSES
199
Figure 4.20. Photo-Fenton oxidation with Fe-MFI under UV light and comparison with separate
processes: evolution of (A) IBP and (B) TOC concentration, and (C) H2O2 consumption ([IBP]0 = 20 mg/L, [Fe-MFI] = 1 and 4.8 g/L, [H2O2] = 6.4 mM, pH0 = 4.3, T = 25°C, UV lamp: LP Hg 6W)
0.0
0.2
0.4
0.6
0.8
1.0
0 30 60 90 120 150 180
IBP
/IB
Po
Time (min)
A
F(-) LP Hg LP Hg/F(-)
F(+) LP Hg/H2O2 LP Hg/F(+)
0.0
0.2
0.4
0.6
0.8
1.0
0 30 60 90 120 150 180
TO
C/T
OC
o
Time (min)
B
F(-) LP Hg LP Hg/F(-)
F(+) LP Hg/H2O2 LP Hg/F(+)
0
20
40
60
80
100
H2O
2 c
on
sum
pti
on
(%
)
C

S. Adityosulindro (2017) / Doctoral Thesis / INP Toulouse
CHAPTER 4 – HETEROGENEOUS PROCESSES
200
Consumption of H2O2 for F(-), LP Hg/H2O2 and LP Hg/F(-) was 26%, 14% and 37%,
indicating not more than additive effect, and higher TOC removal in LP Hg/F(-) (35%) than
F(-) (5%) at similar H2O2 consumption could be attributed to LP Hg/H2O2 process (30%). On
the other hand, LP Hg /F(+) and F(+) showed similar H2O2 consumption (79% vs. 83%)
mainly due to the zeolite (figure 4.20C). Therefore, photo-activation/regeneration of the
catalyst was not visible in the present conditions.
Among previous studies investigating photo-Fenton oxidation with Fe-ZSM5 catalyst
[80,162,163,165,167], only one clearly concluded to an activation of the sole heterogeneous
reaction by UV light [163], while some others indicated noticeable contribution of iron
leaching (homogeneous photo-Fenton reaction) [165] or a prominent role of UV/H2O2
reaction [167].
4.4.2. Heterogeneous photo-Fenton oxidation under visible light (Xe lamp)
In order to limit the contribution of photolysis of H2O2, another set of photo-Fenton
experiments were conducted under visible light using xenon lamp. Results are depicted in
figure 4.21. In these conditions, the improvement in IBP degradation rate was much lower
than under UV light: overall rate constants of 0.0019 and 0.0159 min-1
were measured for
Xe/F(-) and Xe/F(+), respectively, as compared to 0.0014 and 0.0139 min-1
for F(-) and F(+).
On the other hand, Xe/H2O2 mechanism – despite very slow – could contribute for a rate
constant value up to 0.0017 min-1
(in the absence of solid particles). Therefore, all together,
photo-activation of the heterogeneous reaction was only marginal, even at high Fe-MFI
concentration. Probably, photons might not reach active iron sites located within the zeolite
porous structure, limiting the activation effect to the most outer particle surface.

S. Adityosulindro (2017) / Doctoral Thesis / INP Toulouse
CHAPTER 4 – HETEROGENEOUS PROCESSES
201
Figure 4.21. Photo-Fenton oxidation with Fe-MFI under Vis light and comparison with separate
processes: evolution of (A) IBP and (B) TOC concentration and (C) H2O2 consumption ([IBP]0 = 20 mg/L, [Fe-MFI] = 1 and 4.8 g/L, [H2O2]0 = 6.4 mM, pH0 = 4.3, T = 25°C, Vis lamp: Xenon 150W)
0.0
0.2
0.4
0.6
0.8
1.0
0 30 60 90 120 150 180
IBP
/IB
Po
Time (min)
A
F(-) Xe Xe/F(-)
F(+) Xe/H2O2 Xe/F(+)
0.0
0.2
0.4
0.6
0.8
1.0
0 30 60 90 120 150 180
TO
C/T
OC
o
Time (min)
B
F(-) Xe Xe/F(-)
F(+) Xe/H2O2 Xe/F(+)
0
20
40
60
80
100
H2O
2 c
on
sum
pti
on
(%
) C

S. Adityosulindro (2017) / Doctoral Thesis / INP Toulouse
CHAPTER 4 – HETEROGENEOUS PROCESSES
202
4.5. HETEROGENEOUS SONO-PHOTO-FENTON PROCESSES
Despite the very limited activation of heterogeneous process by ultrasound or light
irradiation observed in this study (cf. § 4.3 and 4.4), the efficacy of the coupled sono-photo-
Fenton oxidation process was also evaluated with 1 g/L of Fe-MFI (to limit light attenuation
effects). Two experiments were performed, one with the LP Hg lamp (figure 4.22) and the
other with the Xe lamp (figure 4.23), while low frequency ultrasound was applied in both
cases (with DUS = 50 W/L, based here on the whole treated volume of 1.5 L).
From figure 4.22A, it can be seen that IBP degradation by US/LP Hg/F was slightly
faster than LP Hg/F. Moreover, some enhancement of H2O2 consumption was indeed
observed (figure 4.22C, 37% in LP Hg/F vs. 50% in US/LP Hg/F). The influence of US on
LP Hg/H2O2 process being negligible (cf. chapter 3, § 3.2.1), a promotion of homogeneous
photo-Fenton process by increased iron leaching could be suspected. Nonetheless, addition of
ultrasound on LP Hg/F did not result in any measurable improvement of TOC conversion
(figure 4.22B). This is consistent with the limited mineralization observed by ultrasound itself
(cf. chapter 3, § 3.1.2). In all cases, LP Hg/H2O2 process being much more effective than US
and Fenton oxidation at selected Fe-MFI concentration, it was the dominant mechanism.
Sono-photo-Fenton oxidation process under visible light irradiation (figure 4.23)
showed different trends than under UV light. Indeed, sono-photo(Vis)-Fenton oxidation
(US/Xe/F) was found very similar to sono-Fenton (US/F) regarding both IBP and TOC
conversion. H2O2 consumption at the end of reaction was also almost the same in both cases,
discarding any contribution of photo-mediated process initiated by visible light.
Comparison with literature is rather difficult because heterogeneous sono-photo-Fenton
process is still rarely studied. Zhong et al. [175] reported that the removal of acid orange 7 by
sono-photo-Fenton oxidation with Fe2O3/SBA-15 catalyst at fUS=20 kHz and λUV=254 nm
corresponded to the sum of sono-Fenton and photo-Fenton contributions. On the other hand,
under similar conditions (Fe2O3/SBA-15 catalyst, fUS=20 kHz), but UVA irradiation, Segura
et al. [120] observed that photo-Fenton oxidation dominated the coupled process for phenol
remediation. Based on all these results, the advantage of combining both ultrasound and light
irradiation with heterogeneous Fenton oxidation seems rather questionable. The efficacy of
the heterogeneous sono-photo-Fenton process does not seem to exceed the sum of sono-
Fenton and photo-Fenton processes, and in some cases, as observed here, one process takes
over the other depending on light irradiation wavelength.

S. Adityosulindro (2017) / Doctoral Thesis / INP Toulouse
CHAPTER 4 – HETEROGENEOUS PROCESSES
203
Figure 4.22. Sono-photo-Fenton oxidation with Fe-MFI under UV light and 20 kHz US, and
comparison with other Fenton-based processes: evolution of (A) IBP and (B) TOC concentration, and
(C) H2O2 consumption ([IBP]0 = 20 mg/L, [Fe-MFI] = 1 g/L, [H2O2]0 = 6.4 mM, pH0 = 4.3, T = 25°C, fUS = 20 kHz, DUS = 50W/L, UV
lamp: LP Hg 6 W)
0.0
0.2
0.4
0.6
0.8
1.0
0 30 60 90 120 150 180
IBP
/IB
Po
Time (min)
A
F US/F LP Hg/F US/LP Hg/F
0.0
0.2
0.4
0.6
0.8
1.0
0 30 60 90 120 150 180
TO
C/T
OC
o
Time (min)
B
F US/F LP Hg/F US/LP Hg/F
0
20
40
60
80
100
F US/F LP Hg/F US/LP Hg/F
H2O
2 c
on
sum
pti
on
(%
) C

S. Adityosulindro (2017) / Doctoral Thesis / INP Toulouse
CHAPTER 4 – HETEROGENEOUS PROCESSES
204
Figure 4.23. Sono-photo-Fenton oxidation with Fe-MFI under Vis light and 20 kHz US, and
comparison with other Fenton-based processes: evolution of (A) IBP and (B) TOC concentration, and
(C) H2O2 consumption ([IBP]0 = 20 mg/L, [Fe-MFI] = 1 g/L, [H2O2]0 = 6.4 mM, pH0 = 4.3, T = 25°C, fUS = 20 kHz, DUS = 50W/L, Vis
lamp: Xenon 150 W)
0.0
0.2
0.4
0.6
0.8
1.0
0 30 60 90 120 150 180
IBP
/IB
Po
Time (min)
A
F US/F Xe/F US/Xe/F
0.0
0.2
0.4
0.6
0.8
1.0
0 30 60 90 120 150 180
TO
C/T
OC
o
Time (min)
B
F US/F Xe/F US/Xe/F
0
20
40
60
80
100
F US/F Xe/F US/Xe/F
H2O
2 c
on
sum
pti
on
(%
) C

S. Adityosulindro (2017) / Doctoral Thesis / INP Toulouse
CHAPTER 4 – HETEROGENEOUS PROCESSES
205
4.6. EVOLUTION OF THE HETEROGENEOUS CATALYST AFTER (SONO-,
PHOTO-)FENTON OXIDATION
4.6.1. Particle size distribution
Under ultrasound irradiation, the collapse of cavitation bubbles near particle surface
generates liquid microjets with a velocity of about 100 m/s [286]. These microjets can
increase mass transfer rate (diffusion of substrates to/from the catalyst surface), can cause
erosion (surface cleaning and/or leaching) or even fragmentation of the particles, improving
the apparent catalytic reaction rate [120,122,175,287].
The size distribution of Fe-MFI particles after Fenton, photo-Fenton and sono-Fenton
oxidation was evaluated and compared with that of fresh one (figure 4.24).
Figure 4.24. Fe-MFI particle size distribution: (A) before reaction, (B) after Fenton, (C) after photo-
Fenton, (D) after sono-Fenton oxidation
As expected, the results showed that the particle size distribution before and after
Fenton and photo-Fenton oxidation was similar, while a reduction of the mean size was
observed after sono-Fenton oxidation (d43 shifted from 7.9 µm to 4.1 µm). However, catalyst
fragmentation under sonication observed in this study was less remarkable compared to the
previous studies (showing particle size reduced from hundreds to tens of microns) [120,175].
According to the literature [287], erosion and fragmentation by ultrasound are strongly
0
1
2
3
4
5
6
7
8
9
10
0.01 0.1 1 10 100 1000
Volu
me
(%)
Particle size (µm)
A
B
C
D

S. Adityosulindro (2017) / Doctoral Thesis / INP Toulouse
CHAPTER 4 – HETEROGENEOUS PROCESSES
206
dependent on the size of particles size vs. the size of cavitation bubbles, which is frequency-
dependent [95,288]. Since the diameter of cavitation bubbles at 20 kHz is tens of microns
[96,289], mechanical effects would mainly concern larger particles (> 200 µm) [287].
4.6.2. Catalyst morphology and iron content
As abovementioned (see § 4.2.6), iron leaching from the solid catalyst is an important
issue because it can result into progressive loss of activity, additional homogeneous oxidation
mechanism and supplementary post-treatment to lower the dissolved metal concentration
below acceptable level if too high. Since ultrasound application may affect the catalyst
stability, iron leaching in the coupling processes was also evaluated. First, SEM and EDX
analysis showed no major modification of the catalyst morphology (figure 4.25) and surface
iron content after Fenton (3.3+1.0%) and sono-Fenton process (3.4+1.1%). This result is in
accordance with the study of Queirós et al. [177] who reported that the morphology and
elemental composition of Fe-ZSM5 catalyst were not modified after Fenton or sono-Fenton
oxidation. Note that the catalyst used in photo-Fenton oxidation was not examined since no
further change was expected with respect to Fenton reaction.
Figure 4.25. SEM images of (A) fresh and used Fe-MFI from (B) Fenton and (C) sono-Fenton
oxidation
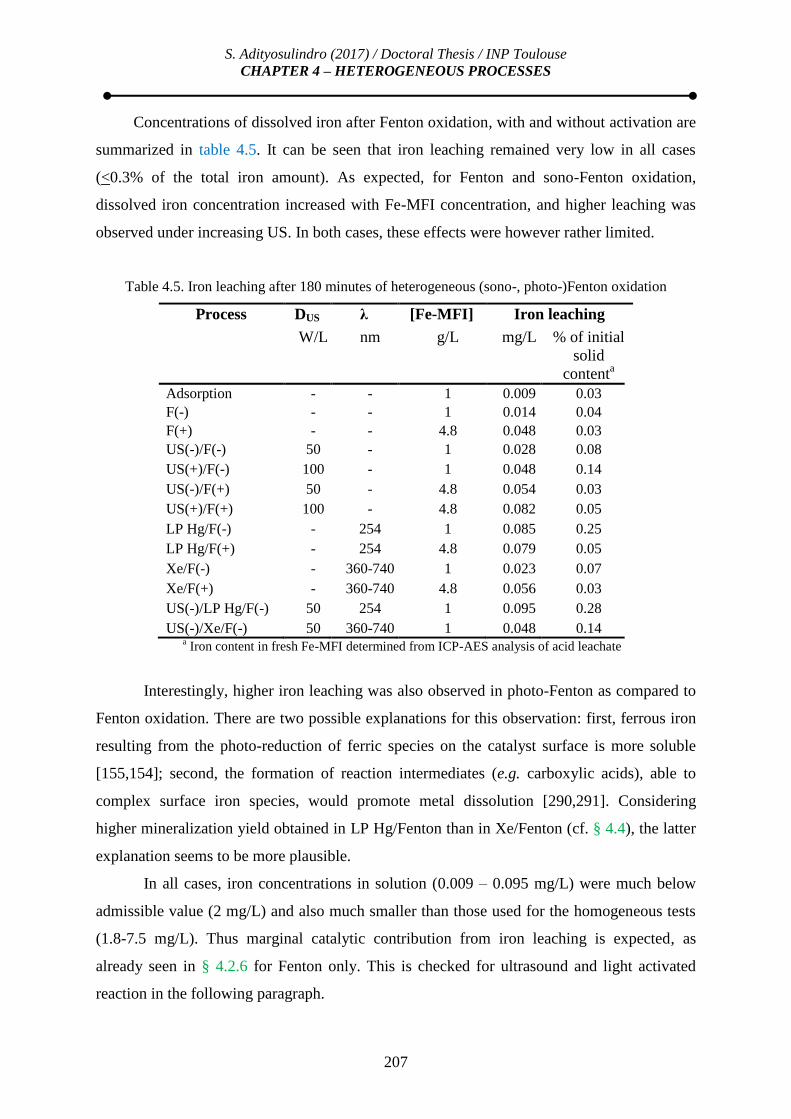
S. Adityosulindro (2017) / Doctoral Thesis / INP Toulouse
CHAPTER 4 – HETEROGENEOUS PROCESSES
207
Concentrations of dissolved iron after Fenton oxidation, with and without activation are
summarized in table 4.5. It can be seen that iron leaching remained very low in all cases
(<0.3% of the total iron amount). As expected, for Fenton and sono-Fenton oxidation,
dissolved iron concentration increased with Fe-MFI concentration, and higher leaching was
observed under increasing US. In both cases, these effects were however rather limited.
Table 4.5. Iron leaching after 180 minutes of heterogeneous (sono-, photo-)Fenton oxidation
Process DUS λ [Fe-MFI] Iron leaching
W/L nm g/L mg/L % of initial
solid
contenta
Adsorption - - 1 0.009 0.03
F(-) - - 1 0.014 0.04
F(+) - - 4.8 0.048 0.03
US(-)/F(-) 50 - 1 0.028 0.08
US(+)/F(-) 100 - 1 0.048 0.14
US(-)/F(+) 50 - 4.8 0.054 0.03
US(+)/F(+) 100 - 4.8 0.082 0.05
LP Hg/F(-) - 254 1 0.085 0.25
LP Hg/F(+) - 254 4.8 0.079 0.05
Xe/F(-) - 360-740 1 0.023 0.07
Xe/F(+) - 360-740 4.8 0.056 0.03
US(-)/LP Hg/F(-) 50 254 1 0.095 0.28
US(-)/Xe/F(-) 50 360-740 1 0.048 0.14 a Iron content in fresh Fe-MFI determined from ICP-AES analysis of acid leachate
Interestingly, higher iron leaching was also observed in photo-Fenton as compared to
Fenton oxidation. There are two possible explanations for this observation: first, ferrous iron
resulting from the photo-reduction of ferric species on the catalyst surface is more soluble
[155,154]; second, the formation of reaction intermediates (e.g. carboxylic acids), able to
complex surface iron species, would promote metal dissolution [290,291]. Considering
higher mineralization yield obtained in LP Hg/Fenton than in Xe/Fenton (cf. § 4.4), the latter
explanation seems to be more plausible.
In all cases, iron concentrations in solution (0.009 – 0.095 mg/L) were much below
admissible value (2 mg/L) and also much smaller than those used for the homogeneous tests
(1.8-7.5 mg/L). Thus marginal catalytic contribution from iron leaching is expected, as
already seen in § 4.2.6 for Fenton only. This is checked for ultrasound and light activated
reaction in the following paragraph.
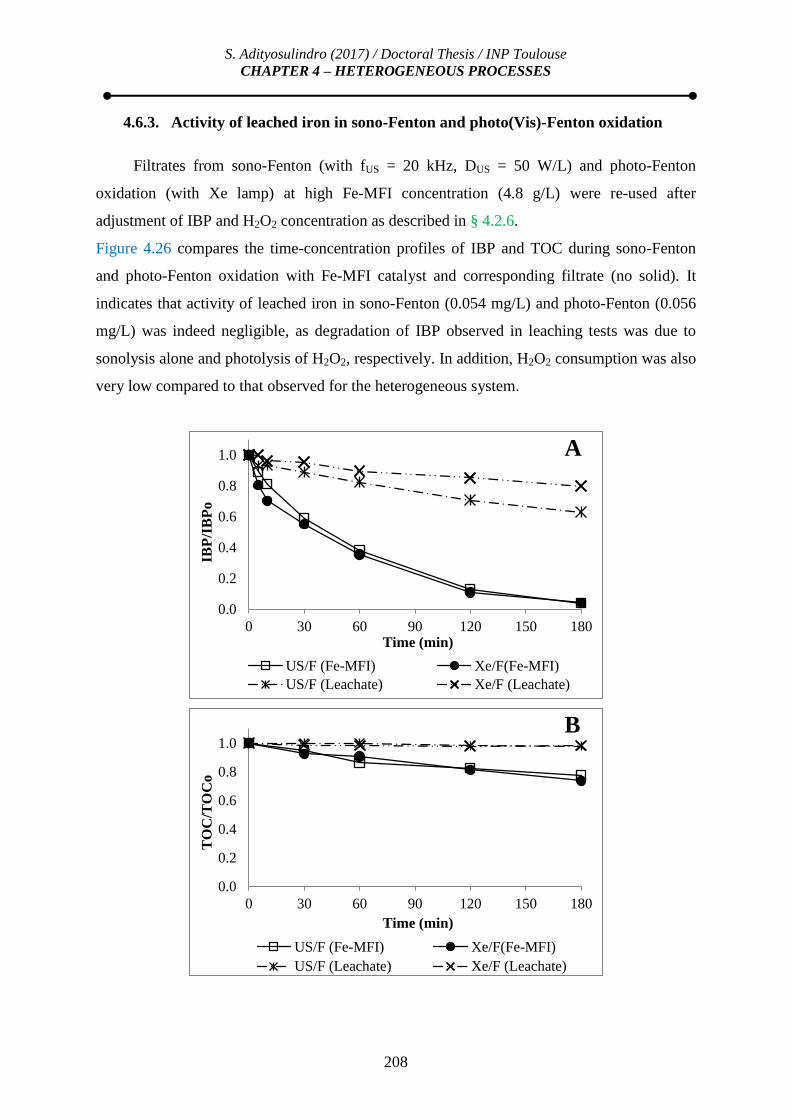
S. Adityosulindro (2017) / Doctoral Thesis / INP Toulouse
CHAPTER 4 – HETEROGENEOUS PROCESSES
208
4.6.3. Activity of leached iron in sono-Fenton and photo(Vis)-Fenton oxidation
Filtrates from sono-Fenton (with fUS = 20 kHz, DUS = 50 W/L) and photo-Fenton
oxidation (with Xe lamp) at high Fe-MFI concentration (4.8 g/L) were re-used after
adjustment of IBP and H2O2 concentration as described in § 4.2.6.
Figure 4.26 compares the time-concentration profiles of IBP and TOC during sono-Fenton
and photo-Fenton oxidation with Fe-MFI catalyst and corresponding filtrate (no solid). It
indicates that activity of leached iron in sono-Fenton (0.054 mg/L) and photo-Fenton (0.056
mg/L) was indeed negligible, as degradation of IBP observed in leaching tests was due to
sonolysis alone and photolysis of H2O2, respectively. In addition, H2O2 consumption was also
very low compared to that observed for the heterogeneous system.
0.0
0.2
0.4
0.6
0.8
1.0
0 30 60 90 120 150 180
IBP
/IB
Po
Time (min)
A
US/F (Fe-MFI) Xe/F(Fe-MFI)
US/F (Leachate) Xe/F (Leachate)
0.0
0.2
0.4
0.6
0.8
1.0
0 30 60 90 120 150 180
TO
C/T
OC
o
Time (min)
B
US/F (Fe-MFI) Xe/F(Fe-MFI)
US/F (Leachate) Xe/F (Leachate)

S. Adityosulindro (2017) / Doctoral Thesis / INP Toulouse
CHAPTER 4 – HETEROGENEOUS PROCESSES
209
Figure 4.26. Leaching tests of sono-Fenton and photo-Fenton oxidation: evolution of (A) IBP and (B)
TOC concentration and (C) H2O2 consumption ([IBP]0 = 20 mg/L, [Feleachate] = 54 µg/L (US/F) and 56 µg/L (Xe/F), [H2O2]0 = 6.4 mM, pHleachate = 3.2, T =
25°C, fUS = 20 kHz, DUS = 50 W/L, Vis lamp: Xenon 150 W). Sono-Fenton and photo-Fenton oxidation results
over Fe-MFI (4.8 g/L) were recalled for comparison
4.6.4. Effect of ultrasound and light irradiation on residual carbon content
Catalyst surface cleaning effect by ultrasound is still rarely reported in literature. Only
some studies reported that the enhancement of sonocatalysis process was due to catalyst
surface cleaning by ultrasound [122,292]. Part of IBP molecules were preliminary adsorbed
on Fe-MFI and might undergo degradation either in adsorbed phase or after desorption during
oxidation. In this section, carbon contents of Fe-MFI catalyst after selected experiments such
as adsorption only, Fenton oxidation, and coupled processes with 1 g/L of catalyst were
calculated using following equation:
𝑋𝑇𝑂𝐶 (%) = 𝑇𝑂𝐶𝐴𝐷
𝐿 + 𝑇𝑂𝐶𝐴𝐷𝑆 − 𝑇𝑂𝐶𝑂𝑋
𝐿 − 𝑇𝑂𝐶𝑂𝑋𝑆
𝑇𝑂𝐶𝐴𝐷𝐿 + 𝑇𝑂𝐶𝐴𝐷
𝑆 (E.4.1)
Where TOCADL and TOCAD
S are the concentration of TOC in liquid and solid phase after
adsorption (mg/L) and TOCOXL and TOCOX
S are the concentration of TOC in liquid and
solid phase after oxidation (mg/L).
As shown in figure 4.27, TOC reduction in solid phase was found to be insignificant
during Fenton oxidation, even under ultrasound and light irradiation: carbon content on Fe-
MFI varied from 0.35% after preliminary adsorption (in rather good agreement with IBP
0
20
40
60
80
100
H2O
2 c
on
sum
pti
on
(%
) C
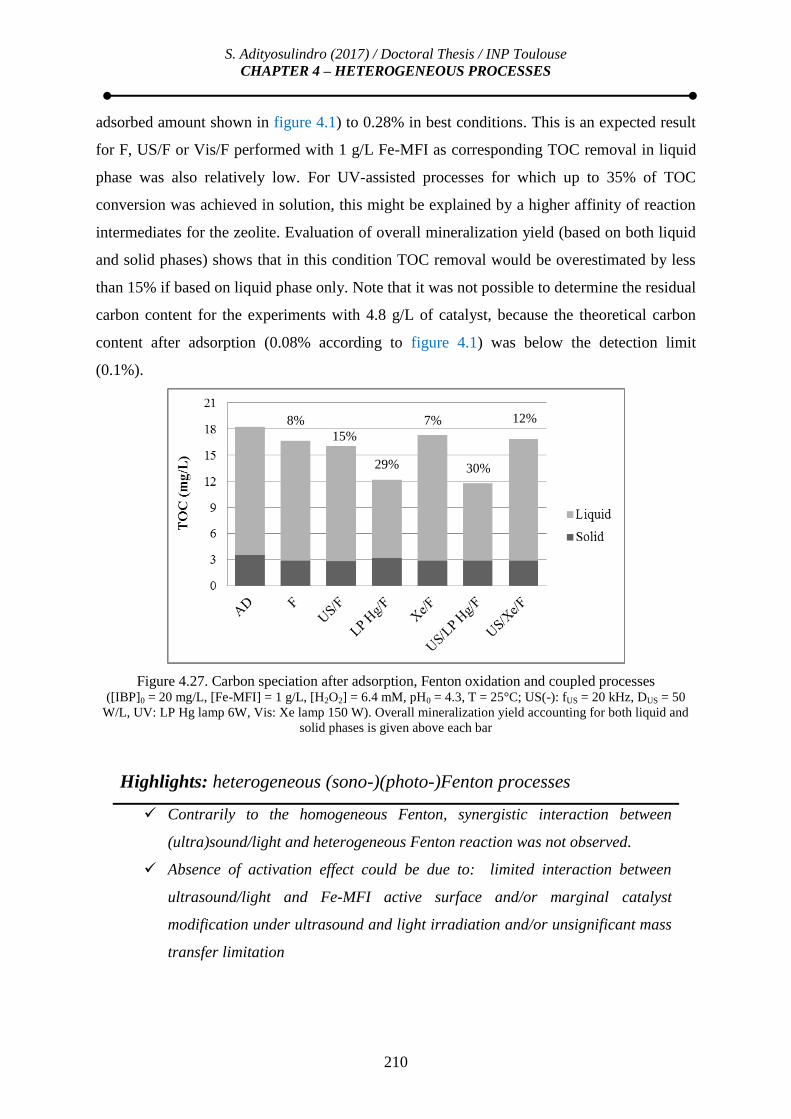
S. Adityosulindro (2017) / Doctoral Thesis / INP Toulouse
CHAPTER 4 – HETEROGENEOUS PROCESSES
210
adsorbed amount shown in figure 4.1) to 0.28% in best conditions. This is an expected result
for F, US/F or Vis/F performed with 1 g/L Fe-MFI as corresponding TOC removal in liquid
phase was also relatively low. For UV-assisted processes for which up to 35% of TOC
conversion was achieved in solution, this might be explained by a higher affinity of reaction
intermediates for the zeolite. Evaluation of overall mineralization yield (based on both liquid
and solid phases) shows that in this condition TOC removal would be overestimated by less
than 15% if based on liquid phase only. Note that it was not possible to determine the residual
carbon content for the experiments with 4.8 g/L of catalyst, because the theoretical carbon
content after adsorption (0.08% according to figure 4.1) was below the detection limit
(0.1%).
Figure 4.27. Carbon speciation after adsorption, Fenton oxidation and coupled processes ([IBP]0 = 20 mg/L, [Fe-MFI] = 1 g/L, [H2O2] = 6.4 mM, pH0 = 4.3, T = 25°C; US(-): fUS = 20 kHz, DUS = 50
W/L, UV: LP Hg lamp 6W, Vis: Xe lamp 150 W). Overall mineralization yield accounting for both liquid and
solid phases is given above each bar
Highlights: heterogeneous (sono-)(photo-)Fenton processes
Contrarily to the homogeneous Fenton, synergistic interaction between
(ultra)sound/light and heterogeneous Fenton reaction was not observed.
Absence of activation effect could be due to: limited interaction between
ultrasound/light and Fe-MFI active surface and/or marginal catalyst
modification under ultrasound and light irradiation and/or unsignificant mass
transfer limitation
8% 15%
29%
7%
30%
12%

S. Adityosulindro (2017) / Doctoral Thesis / INP Toulouse
CHAPTER 4 – HETEROGENEOUS PROCESSES
211
4.7. EVALUATION OF TRANSFORMATION PRODUCTS
Transformation products during heterogeneous Fenton oxidation using Fe-MFI and
ZVI (under acidic condition), as well as during sono-Fenton oxidation (Fe-MFI catalyst),
were examined. As mentioned previously in chapter 3, analysis of samples was carried out by
LC-HRMS and interpretation of intermediate evolution was only qualitative.
Oxidation intermediates were essentially the same as those observed in homogeneous
Fenton reaction, but were not always detected (for instance some di-hydroxylated IBP
derivatives). Therefore same degradation pathways could be hypothesized (cf. § 3.3, figure
3.26 for detailed scheme), except direct photo-degradation because light irradiation was not
used in this case.
As in chapter 3, the evolution of four key transformation products, TP1A (1-hydroxy-
IBP), TP1B (2-hydroxy-IBP), TP4 (4-isobutylacetophenone) and TP5 (TP4 isomer), was
monitored during heterogeneous processes. With Fe-MFI catalyst, for which contribution of
homogeneous reaction was negligible, formation and degradation of TP1A and TP1B
occurred at slow rates (figures 4.28 and 4.29, respectively). Furthermore, despite limited
effect of ultrasound on TOC removal in US(-)/F(+), its presence was found beneficial for the
degradation of these products. Conversely, both formation and removal of TP1A and TP1B
were much faster during Fenton oxidation with ZVI, due to significant leached iron which
efficiently catalyzed the reaction. However, the occurrence of these compounds differed from
what observed with ferrous salt (FeSO4.7H2O), for which only the other mono-hydroxylated
derivatives were detected. This would thus deserve further investigation.
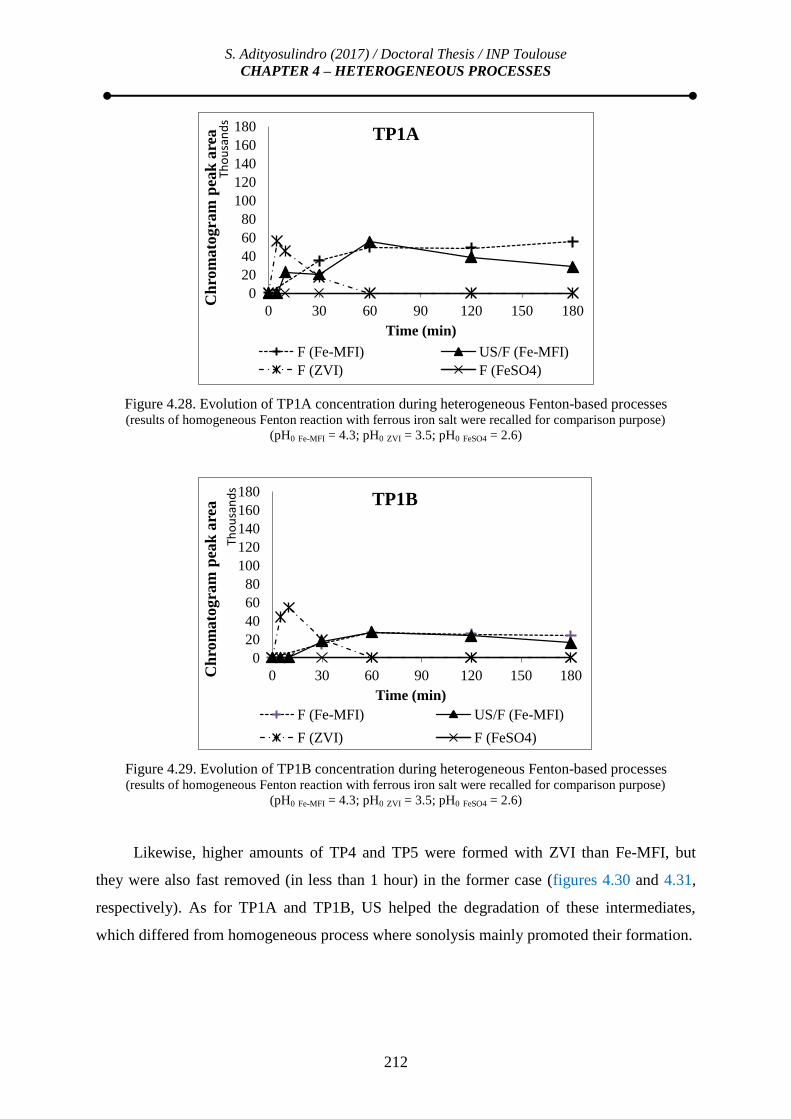
S. Adityosulindro (2017) / Doctoral Thesis / INP Toulouse
CHAPTER 4 – HETEROGENEOUS PROCESSES
212
Figure 4.28. Evolution of TP1A concentration during heterogeneous Fenton-based processes (results of homogeneous Fenton reaction with ferrous iron salt were recalled for comparison purpose)
(pH0 Fe-MFI = 4.3; pH0 ZVI = 3.5; pH0 FeSO4 = 2.6)
Figure 4.29. Evolution of TP1B concentration during heterogeneous Fenton-based processes (results of homogeneous Fenton reaction with ferrous iron salt were recalled for comparison purpose)
(pH0 Fe-MFI = 4.3; pH0 ZVI = 3.5; pH0 FeSO4 = 2.6)
Likewise, higher amounts of TP4 and TP5 were formed with ZVI than Fe-MFI, but
they were also fast removed (in less than 1 hour) in the former case (figures 4.30 and 4.31,
respectively). As for TP1A and TP1B, US helped the degradation of these intermediates,
which differed from homogeneous process where sonolysis mainly promoted their formation.
0 30 60 90 120 150 180
0
20
40
60
80
100
120
140
160
180
Time (min)
Ch
rom
ato
gra
m p
eak
are
a
Tho
usa
nd
s
TP1A
F (Fe-MFI) US/F (Fe-MFI)
F (ZVI) F (FeSO4)
0 30 60 90 120 150 180
0
20
40
60
80
100
120
140
160
180
Time (min)
Ch
rom
ato
gra
m p
eak
are
a
Tho
usa
nd
s
TP1B
F (Fe-MFI) US/F (Fe-MFI)
F (ZVI) F (FeSO4)

S. Adityosulindro (2017) / Doctoral Thesis / INP Toulouse
CHAPTER 4 – HETEROGENEOUS PROCESSES
213
Figure 4.30. Evolution of TP4 concentration during heterogeneous Fenton-based processes
(results of homogeneous Fenton reaction with ferrous iron salt were recalled for comparison purpose)
(pH0 Fe-MFI = 4.3; pH0 ZVI = 3.5; pH0 FeSO4 = 2.6)
Figure 4.31. Evolution of TP4 concentration during heterogeneous Fenton-based processes
(results of homogeneous Fenton reaction with ferrous iron salt were recalled for comparison purpose)
(pH0 Fe-MFI = 4.3; pH0 ZVI = 3.5; pH0 FeSO4 = 2.6)
According to these findings and previous results in chapter 3, different effects of activation
processes may induce this contrasted behavior of specific intermediates and more specific
studies are needed to explain the mechanisms involved in each process and their effects on
the transformation/degradation pathway.
0 30 60 90 120 150 180
0
100
200
300
400
500
600
Time (min)
Ch
rom
ato
gra
m p
eak
are
a
Tho
usa
nd
s
TP4
F (Fe-MFI) US/F (Fe-MFI)
F (ZVI) F (FeSO4)
0 30 60 90 120 150 180
0
200
400
600
800
1000
1200
1400
1600
1800
Time (min)
Ch
rom
ato
gra
m p
eak
are
a
Tho
usa
nd
s
TP5
F (Fe-MFI) US/F (Fe-MFI)
F (ZVI) F (FeSO4)

S. Adityosulindro (2017) / Doctoral Thesis / INP Toulouse
CHAPTER 4 – HETEROGENEOUS PROCESSES
214
4.8. EFFECT OF WATER MATRIX
Contrarily to the homogeneous Fenton oxidation, heterogeneous Fenton (F) oxidation
of IBP was performed in wastewater (WW) without pH adjustment. The result showed a high
reduction of IBP degradation rate constant, from 0.0139 min-1
to 0.0016 min-1
(figure 4.32A).
According to the literature [273,293], organic and inorganic compounds in wastewater may
affect the heterogeneous reaction by (i) fouling the catalyst pores, (ii) poisoning the catalyst
active sites (iron active sites forming complexes with organic and/or inorganic compounds),
(iii) scavenging hydroxyl radicals and (iv) increasing the pH value, which could lower the
catalyst activity. The latter effect seems to be predominant since the acidic zeolite was not
able to reduce the pH to acidic condition due to the presence of natural buffer in WW matrix
(in WW, pH value was only reduced from 8 to 7 after contact with Fe-MFI).
What is more, pH effect was evidenced by comparing Fenton oxidation performed in
DW at a controlled pH of 7 (DW pH 7) and in WW matrix (figure 4.32). As described
previously in § 4.2.5, alkaline pH solution can affect heterogeneous Fenton oxidation by
limiting the interaction between ibuprofen and catalyst (repulsion between ionic form of IBP
(pKa = 3.97) and negatively charged Fe-MFI surface (pHpzc = 2.9)), by reducing the
oxidation potential of hydroxyl radical or by changing the reaction mechanism from radical
to non-radical one.
Nonetheless, IBP oxidation was still slower in WW matrix than in DW at pH 7. One
possible explanation is catalyst fouling or poisoning. At the end of adsorption step,
adsorption of organic and inorganic compounds on Fe-MFI was indeed higher in WW matrix
(21 mg/L of TC and 18 mg/L of IC adsorbed) than in DW matrix (4 mg/L of TC and no IC
adsorbed). Nevertheless, these adsorbed compounds seemed not to affect the available active
sites since similar H2O2 consumption was observed (figure 4.32C), excluding possible
fouling or poisoning effect. Therefore lower IBP removal could be rather attributed to the
scavenging effect of carbonate and bicarbonate ions present in WW matrix.
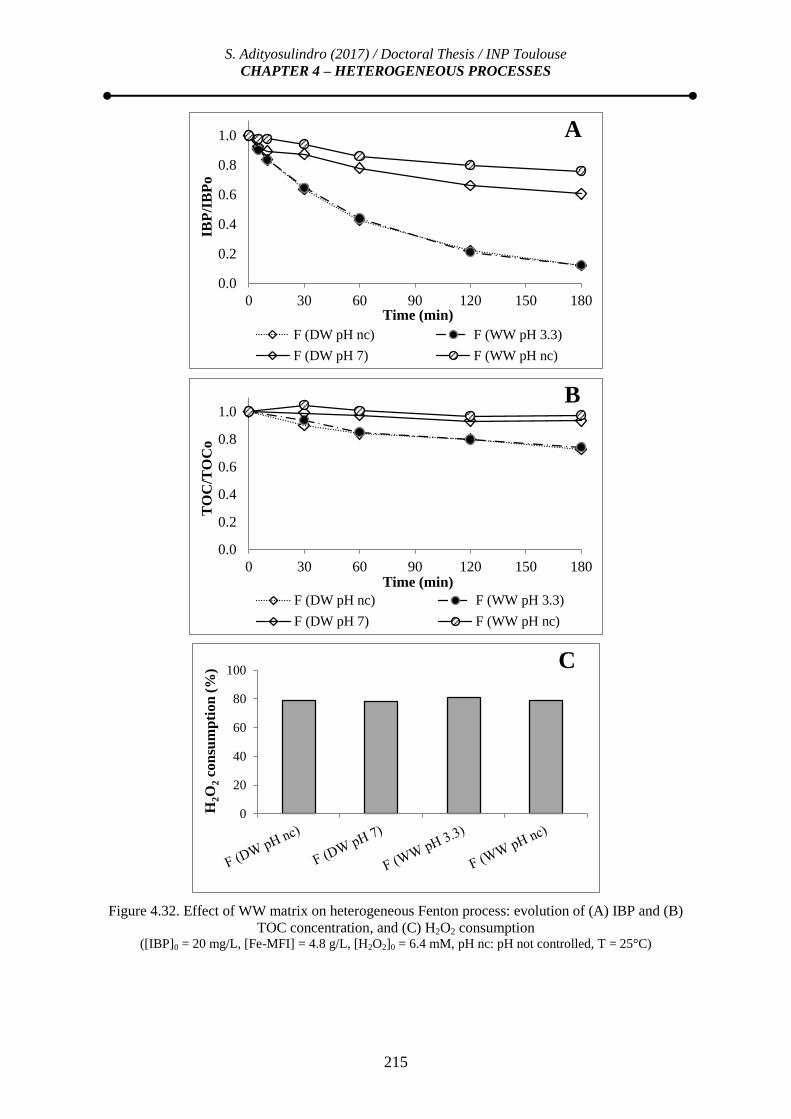
S. Adityosulindro (2017) / Doctoral Thesis / INP Toulouse
CHAPTER 4 – HETEROGENEOUS PROCESSES
215
Figure 4.32. Effect of WW matrix on heterogeneous Fenton process: evolution of (A) IBP and (B)
TOC concentration, and (C) H2O2 consumption ([IBP]0 = 20 mg/L, [Fe-MFI] = 4.8 g/L, [H2O2]0 = 6.4 mM, pH nc: pH not controlled, T = 25°C)
0.0
0.2
0.4
0.6
0.8
1.0
0 30 60 90 120 150 180
IBP
/IB
Po
Time (min)
A
F (DW pH nc) F (WW pH 3.3)
F (DW pH 7) F (WW pH nc)
0.0
0.2
0.4
0.6
0.8
1.0
0 30 60 90 120 150 180
TO
C/T
OC
o
Time (min)
B
F (DW pH nc) F (WW pH 3.3)
F (DW pH 7) F (WW pH nc)
0
20
40
60
80
100
H2O
2 c
on
sum
pti
on
(%
) C

S. Adityosulindro (2017) / Doctoral Thesis / INP Toulouse
CHAPTER 4 – HETEROGENEOUS PROCESSES
216
In order to confirm the dominant role of pH in WW matrix, a supplementary
experiment was conducted in WW matrix whose initial pH was set to 3.3 (adjusted with 1 M
H2SO4, denoted as WW pH 3.3). This pH value matched the value reached in DW after
contact with Fe-MFI. Such acidification should maintain the catalytic activity of the
heterogeneous catalysis and at the same time lower the inorganic carbon content. As shown
in figure 4.32A, at pH0 = 3.3, similar IBP removal was indeed obtained in DW and WW
matrix. Similar role of pH was observed for mineralization yield. Under non controlled pH,
TOC removal by Fenton oxidation was reduced from 27% (DW pH nc) to 3% (WW pH nc),
but the efficacy of the process could be normalized by preliminary acidification (WW pH
3.3) (figure 4.32B). In addition, it should be mentioned that the acidification step caused
more iron leached into solution (0.081 mg/L for WW pH nc vs. 0.250 mg/L for WW pH 3.3).
Despite ultrasound had only a marginal effect on heterogeneous Fenton oxidation using
high Fe-MFI concentration (4.8 g/L) in DW (cf. figure 4.18), sono-Fenton oxidation was also
tested in WW matrix without pH adjustment. Regarding IBP, additive effect between
ultrasound and heterogeneous Fenton oxidation at 4.8 g/L of catalyst was clearly observed in
WW matrix (figure 4.33): IBP removal rate constant increased from 0.0016 min-1
in sonolysis
or Fenton oxidation to 0.0038 min-1
in sono-Fenton oxidation. Because Fenton oxidation
itself was significantly hampered, ultrasound irradiation then took significant part in the
degradation process.
Accounting for measurement uncertainty, TOC removal in sono-Fenton (US/F) process
showed hardly more than additive effect of ultrasound and Fenton oxidation, as the
corresponding mineralization yields were 9%, 2% and 3% and respectively (figure 4.33B).
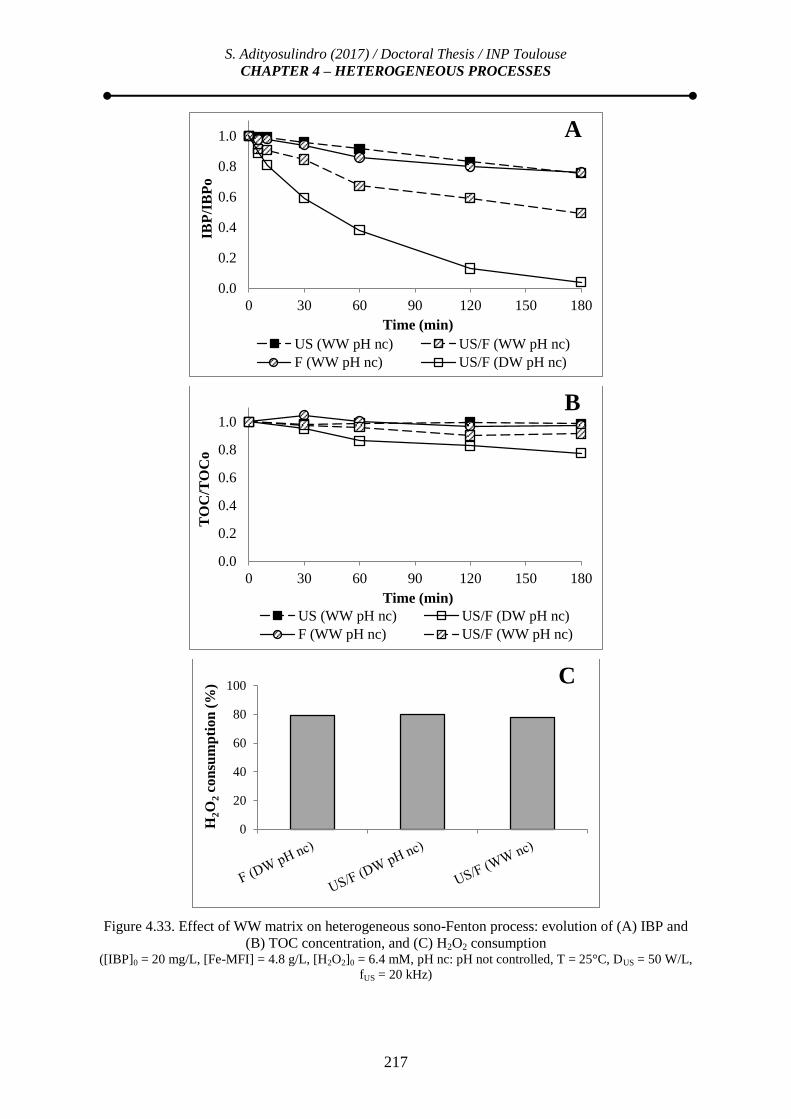
S. Adityosulindro (2017) / Doctoral Thesis / INP Toulouse
CHAPTER 4 – HETEROGENEOUS PROCESSES
217
Figure 4.33. Effect of WW matrix on heterogeneous sono-Fenton process: evolution of (A) IBP and
(B) TOC concentration, and (C) H2O2 consumption ([IBP]0 = 20 mg/L, [Fe-MFI] = 4.8 g/L, [H2O2]0 = 6.4 mM, pH nc: pH not controlled, T = 25°C, DUS = 50 W/L,
fUS = 20 kHz)
0.0
0.2
0.4
0.6
0.8
1.0
0 30 60 90 120 150 180
IBP
/IB
Po
Time (min)
A
US (WW pH nc) US/F (WW pH nc)
F (WW pH nc) US/F (DW pH nc)
0.0
0.2
0.4
0.6
0.8
1.0
0 30 60 90 120 150 180
TO
C/T
OC
o
Time (min)
B
US (WW pH nc) US/F (DW pH nc)
F (WW pH nc) US/F (WW pH nc)
0
20
40
60
80
100
H2O
2 c
on
sum
pti
on
(%
) C

S. Adityosulindro (2017) / Doctoral Thesis / INP Toulouse
CHAPTER 4 – HETEROGENEOUS PROCESSES
218
In order to evaluate the effects of WW matrix and ultrasound on the catalyst textural
properties, nitrogen porosimetry was performed, whose results are given in table 4.6. In all
cases, BET surface area (SBET) and microporous volume of the catalyst were only slightly
reduced after use (by 10% maximum) and the effect was a little increased in WW matrix.
This porosity reduction may be attributed to the deposition of organic and inorganic
compounds from WW matrix or from IBP and its degradation products.
Table 4.6. Effect of WW matrix and ultrasound irradiation on catalyst BET surface area and porosity
Process SBET
(m2/g)
Vmeso
(cm3/g)
Vmicro
(cm3/g)
Vtot
(cm3/g)
Fresh Fe-MFI 329 0.050 0.130 0.180
F (DW) 310 0.052 0.123 0.175
F (WW) 297 0.051 0.118 0.169
US/F (DW) 308 0.055 0.122 0.177
US/F (WW) 298 0.052 0.118 0.170
Heterogeneous photo-Fenton oxidation was not evaluated in WW matrix as photo-
activation of Fe-MFI catalyst was not observed in DW.

S. Adityosulindro (2017) / Doctoral Thesis / INP Toulouse
CHAPTER 4 – HETEROGENEOUS PROCESSES
219
4.9. CONCLUSIONS
Two iron based catalysts were assessed for the catalytic wet peroxide oxidation of
ibuprofen: iron-containing zeolite of ZSM5 type (Fe-MFI) and zero-valent iron particles
(ZVI). Both catalysts were able to promote Fenton reaction. However, preliminary
acidification was necessary to activate ZVI, while Fe-MFI catalyst was directly active by
lowering the pH of the solution. Evaluation of used catalyst morphology and iron leaching
revealed that the activity of ZVI was due to metal ions leached in the solution, while Fe-MFI
promoted a true heterogeneous reaction implying surface iron species. This catalyst was thus
selected for further investigation.
Parametric study of Fenton oxidation using Fe-MFI showed that ibuprofen removal rate
was improved when increasing the concentrations of catalyst and hydrogen peroxide, as well
as temperature. On the other hand, increase of solution pH towards (buffered) alkaline
condition reduced the removal yield.
Contrarily to the homogeneous Fenton process (catalyzed by ferrous sulfate) where
regeneration of ferrous ion could be promoted, activation of heterogeneous Fenton reaction
by ultrasound or light irradiation appeared to be very limited. By coupling Fenton oxidation
on Fe-MFI and ultrasound, only additive effect was observed at low catalyst concentration,
while Fenton reaction was predominant at high Fe-MFI concentration. In the combined
process of Fenton reaction with light irradiation, photo-peroxide oxidation (UV/H2O2) was
the prevailing mechanism under UV light (LP Hg lamp), whilst the effect of visible light
(emitted by xenon lamp) was found to be marginal.
Despite the limited synergy with ultrasound and light irradiation, heterogeneous Fenton
oxidation catalyzed by Fe-MFI appeared to be a promising technique for ibuprofen removal
in water. Under mild operating conditions (25°C, 4.8 g/L of Fe-MFI, 2 times the
stoichiometric amount of H2O2), up to 88% of ibuprofen and 27% of TOC were removed
after 3 hours of reaction. Moreover, this appreciable performance was also followed by very
low iron leaching of about 0.05 mg/L. In wastewater matrix, heterogeneous Fenton oxidation
of ibuprofen was however hampered, mainly due to buffered alkaline pH neutralizing Fe-MFI
acidic sites. Therefore, preliminary acidification would still be required to maintain this
performance. Only minor modifications of the catalyst after reaction (regarding particle size,
morphology, iron content, and specific surface area) proved it could suit for continuous water
treatment process coupled with ultrafiltration membrane.

220
This page is intentionally left blank

221
CONCLUSIONS AND PERSPECTIVES

222
This page is intentionally left blank

S. Adityosulindro (2017) / Doctoral Thesis / INP Toulouse
CONCLUSIONS AND PERSPECTIVES
223
The aim of this study was to investigate the effect of (high / low frequency)
(ultra)sound and (ultraviolet / visible) light irradiation for (re)activation of (homogeneous /
heterogeneous) catalysts in Fenton reaction. Ibuprofen (IBP), one of the most frequently
detected pharmaceuticals in water resources, was chosen as model molecule for this study.
Both homogeneous and heterogeneous reaction have been extensively investigated and
discussed in chapters 3 and 4, respectively. Compared to previous studies, complete work on
the evaluation of synergistic effect of coupling processes was carried out by studying the
separate processes and their exhaustive combinations. Moreover, a large set of parameters
was varied, including irradiation wavelength range for both ultrasound and light, as well as
concentration of oxidant and catalyst. At each stage dedicated studies or analyses were
performed to get an insight of involved mechanisms by using various radical scavengers,
examining the activity of leached iron, analyzing transformation products, pH and matrix
effects, etc.
First, without additional oxidant (or catalyst), (ultra)sound alone (US) yielded moderate
IBP degradation rates on the whole investigated frequency range (12 – 862 kHz), while effect
of light irradiation appeared highly wavelength dependent: fast degradation under ultraviolet
but no effect under visible light (see following table). This dependence is clearly related to
direct photolysis, while US acts through free radical formation, like Fenton reactive systems.
In addition, it should be mentioned that UV-Vis/H2O2 process (using MP Hg lamp 150 W)
was very effective for the degradation and mineralization of IBP. Compared to other tested
processes, the remarkable performance of this process could be ascribed to both high power
and wide UV-C spectral emission of the lamp inducing very effective direct photolysis and
photo-decomposition of H2O2.
Detailed comparison between homogeneous and heterogeneous systems was based on
results obtained at same available iron content (0.13 mM), and a representative set of data is
reported on the figure below, including reference experiments conducted without Fenton’s
reagent, under US or Vis irradiation.
Then, main point of this global comparison was the huge difference at the very
beginning of the reaction (< 5 min) in between the results of homogeneous Fenton oxidation
(IBP conversion > 60%) and that of heterogeneous counterparts (IBP conversion < 7%). At
same available iron, all homogeneous Fenton-based processes started much faster, whatever
the type of activation applied. However, after this fast initial step, performance of classical
Fenton system drastically stepped down, due to formation of various ferric species (including

S. Adityosulindro (2017) / Doctoral Thesis / INP Toulouse
CONCLUSIONS AND PERSPECTIVES
224
complexes). As expected, both US and UV/Vis irradiations were able to regenerate
homogeneous catalyst.
Summary of the principal results in homogeneous and heterogeneous processes
Processes
Interaction
effect [Fe] [H2O2]
IBP
Removal
(%)
IBP
constant
rate
(min-1
)
TOC
Removal
(%)
H2O2
Conso
(%)
(mM) (mM) t=5
min
t=180
min
t=180 min t=180
min
Non-catalytic processes
Ultrasound (US) - - 6 48 0.0035 7 -
Ultraviolet (UV) - - 1 40 0.0028 19 -
Visible (Vis) - - 0 0 0 0 -
UV-Vis - - 23 100 0.0567 45 -
UV/H2O2 - - 18 100 0.0664 30 14
Vis/H2O2 - - 1 15 0.0009 5 6
UV-Vis/H2O2 - - 49 100 0.2610 97 99
Fenton processes
Hom-F 0.033 1.6 25 35 NA 6 7
Hom-F 0.134 6.4 60 97 NA 9 13
Het-F 0.134 6.4 4 23 0.0014 5 26
Het-F 0.643 6.4 9 88 0.0139 27 79
Sono-Fenton processes
US /Hom-F 0.033 1.6 25 89 NA 12 10 Additive
US /Hom-F 0.134 6.4 68 100 NA 39 44 Synergistic
US /Het-F 0.134 6.4 4 66 0.0059 14 27 Additive
US /Het-F 0.643 6.4 11 96 0.0159 23 80 No synergy
Photo-Fenton processes
UV/Hom-F 0.134 6.4 79 100 NA 82 99 Synergistic
Vis/Hom-F 0.033 1.6 23 76 NA 15 15 Synergistic
Vis/Hom-F 0.134 6.4 79 100 NA 59 80 Synergistic
UV/Het-F 0.134 6.4 21 100 0.0578 35 37 No synergy
UV/Het-F 0.643 6.4 24 100 0.0411 26 83 No synergy
Vis/Het-F 0.134 6.4 3 30 0.0019 5 25 No synergy
Vis/Het-F 0.643 6.4 20 96 0.0159 26 89 Additive
Sono-photo-Fenton processes
US/Vis/Hom-F 0.033 1.6 28 100 NA 17 25 Synergistic
US/Vis/Hom-F 0.134 6.4 67 100 NA 62 76 No synergy
US/Vis/Het-F 0.134 6.4 6 66 0.0058 11 30 No synergy
US(20 kHz, 50 W/L); UV(LP Hg lamp 6 W); Vis(Xenon lamp 150 W); UV-Vis(MP Hg lamp 150W); NA: not
applicable due to steep change of slope

S. Adityosulindro (2017) / Doctoral Thesis / INP Toulouse
CONCLUSIONS AND PERSPECTIVES
225
Comparison of homogeneous and heterogeneous process: IBP concentration-time profiles ([IBP]0 = 20 mg/L, [H2O2]0 = 6.4 mM, [Fe
2+]0 = 0.134 mM or [Fe-MFI] = 1 g/L, T = 25°C, pH0 = 2.6 or 4.3, fUS
= 20 kHz, DUS = 50W/L, lamp = 150W Xe (Vis)
With regard to the negligible effect of direct photolysis under visible light (Vis), a
remarkable synergistic effect was observed in photo(Vis)-Fenton process, for which nearly
complete conversion of IBP was obtained in 30 min instead of 180 minutes (see Vis/Hom-F
vs. Hom-F in figure). Likewise higher mineralization yield (TOC removal) and H2O2
consumption were always observed under coupled homogeneous processes (see table).
On the contrary, the expected activation by ultrasound or light irradiation of
heterogeneous Fenton reaction (Het-F) catalyzed by Fe-ZSM5 catalyst (Fe-MFI) appeared to
be very limited, wherein no more than additive effect was observed (see table). In
heterogeneous system, IBP removal rates fitted well first-order kinetics indicating that Fe-
MFI catalyst was not suffering significant deactivation during the reaction. Extensive catalyst
analysis before and after reaction using SEM-EDX, nitrogen porosimetry, laser diffraction
and ICP-AES (for lixiviate) also showed no significant modification in catalyst properties.
Thus, benefit from US or UV/Vis irradiation for active surface reactivation is questionable.
Moreover, in these conditions of rather slow kinetics, higher external mass transfer or particle
disruption due to ultrasound would not be useful. On the other hand, contrasted results on
0.0
0.2
0.4
0.6
0.8
1.0
0 30 60 90 120 150 180
IBP
/IB
Po
Time (min)
US
Vis
Hom-F
Het-Fenton
US/Hom-F
US/Het-F
Vis/Hom-F
Vis/Het-F
US/Vis/Hom-F
US/Vis/Het-F

S. Adityosulindro (2017) / Doctoral Thesis / INP Toulouse
CONCLUSIONS AND PERSPECTIVES
226
light irradiation effect would drive further work towards a more detailed investigation of light
propagation in suspensions.
Despite the limited synergy with US and UV/Vis, heterogeneous Fenton reaction
catalyzed by Fe-MFI is still a promising oxidation process considering its stability and
activity, yielding more than 25% of TOC removal after 3 hours of reaction in 0.5% slurry. In
addition, this appreciable performance obtained without acidification was also followed by
very low iron leaching of about 0.05 mg/L, well above discharge limit (2 mg/L), leading to
potential economical process.
To check more relevant conditions of application, efficacy of simple or combined
processes was also tested in wastewater effluent matrix. All photo-based oxidation processes
(UV, UV/H2O2, Vis/Hom-F) were inhibited, probably due to light attenuation, while
preliminary acidification was essential to counterbalance the alkaline buffered pH effect of
wastewater matrix and maintain the performance of ultrasound and Fenton-based processes.
These results showed that water matrix must be taken into account to select the optimum
process and determine the operating conditions for practical use. In addition, the influence of
different molecules on process interaction would have to be considered, as well as that of
pollutant concentration as wastewaters to be treated are less concentrated.
Regarding the net synergistic effect in homogeneous system, further studies should
consider the optimization of coupled US/Vis/Hom-F process with the aim of achieving
mineralization level required to remove (most of) the toxicity of the treated sample under
relatively low reagent concentration (iron catalyst and H2O2) and low energy consumption.
On the other hand, effect of US and UV/Vis activation on heterogeneous Fenton reaction
should be further investigated by comparing several iron-containing solids. In any case, Fe-
MFI is already a good candidate for testing in continuous water treatment process in
association with membrane filtration. This type of continuous membrane process would be
even more promising with a slowly dissolving iron catalyst as ZVI by optimizing solid iron
content to obtain both activity and iron concentration below discharge limit.
S. Adityosulindro (2017) / Doctoral Thesis / INP Toulouse
REFERENCES
227
REFERENCES
[1] ANSM, Analyse des ventes de médicaments en France en 2012, (2013).
http://ansm.sante.fr/var/ansm_site/storage/original/application/796352eff0e9119cca0ea
5bbd898353a.pdf (accessed January 30, 2017).
[2] ANSES, Campagne nationale d’occurrence des résidus de médicaments dans les eaux
destinées à la consommation humaine, 2011.
[3] T. Deblonde, C. Cossu-Leguille, P. Hartemann, Emerging pollutants in wastewater: a
review of the literature., Int. J. Hyg. Environ. Health. 214 (2011) 442–8.
doi:10.1016/j.ijheh.2011.08.002.
[4] A. Ziylan, N.H. Ince, The occurrence and fate of anti-inflammatory and analgesic
pharmaceuticals in sewage and fresh water: Treatability by conventional and non-
conventional processes, J. Hazard. Mater. 187 (2011) 24–36.
[5] J. Quintana, S. Weiss, T. Reemtsma, Pathways and metabolites of microbial
degradation of selected acidic pharmaceutical and their occurrence in municipal
wastewater treated by a membrane bioreactor, Water Res. 39 (2005) 2654–2664.
doi:10.1016/j.watres.2005.04.068.
[6] L. Berthod, D.C. Whitley, G. Roberts, A. Sharpe, R. Greenwood, G.A. Mills,
Quantitative structure-property relationships for predicting sorption of pharmaceuticals
to sewage sludge during waste water treatment processes, Sci. Total Environ. 579
(2017) 1512–1520. doi:10.1016/j.scitotenv.2016.11.156.
[7] M. Carballa, F. Omil, J.M. Lema, Removal of cosmetic ingredients and
pharmaceuticals in sewage primary treatment, Water Res. 39 (2005) 4790–4796.
doi:10.1016/j.watres.2005.09.018.
[8] M.M. Huber, S. Korhonen, T. a Ternes, U. von Gunten, Oxidation of pharmaceuticals
during water treatment with chlorine dioxide., Water Res. 39 (2005) 3607–17.
doi:10.1016/j.watres.2005.05.040.
[9] Y. Mao, X. Wang, X. Guo, H. Yang, Y.F. Xie, Characterization of haloacetaldehyde
and trihalomethane formation potentials during drinking water treatment,
Chemosphere. 159 (2016) 378–384. doi:10.1016/j.chemosphere.2016.05.088.
[10] M.J. Ahmed, Adsorption of non-steroidal anti-inflammatory drugs from aqueous
solution using activated carbons: Review, J. Environ. Manage. 190 (2017) 274–282.
doi:10.1016/j.jenvman.2016.12.073.
[11] A. Vona, F. di Martino, J. Garcia-Ivars, Y. Picó, J.-A. Mendoza-Roca, M.-I. Iborra-
Clar, Comparison of different removal techniques for selected pharmaceuticals, J.
Water Process Eng. 5 (2015) 48–57. doi:10.1016/j.jwpe.2014.12.011.
[12] J. Rivera-Utrilla, M. Sánchez-Polo, M.Á. Ferro-García, G. Prados-Joya, R. Ocampo-
Pérez, Pharmaceuticals as emerging contaminants and their removal from water. A
review, Chemosphere. 93 (2013) 1268–1287.
[13] J. Wang, S. Wang, Removal of pharmaceuticals and personal care products (PPCPs)
from wastewater: A review, J. Environ. Manage. 182 (2016) 620–640.
doi:10.1016/j.jenvman.2016.07.049.
[14] M.S.U. Rehman, N. Rashid, M. Ashfaq, A. Saif, N. Ahmad, J.-I. Han, Global risk of
pharmaceutical contamination from highly populated developing countries,
Chemosphere. 138 (2015) 1045–1055. doi:10.1016/j.chemosphere.2013.02.036.
[15] M. Winkler, Selective degradation of ibuprofen and clofibric acid in two model river

S. Adityosulindro (2017) / Doctoral Thesis / INP Toulouse
REFERENCES
228
biofilm systems, Water Res. 35 (2001) 3197–3205. doi:10.1016/S0043-
1354(01)00026-4.
[16] World Health Organization, Pharmaceuticals in drinking water, 2012.
[17] E.R. Cooper, T.C. Siewicki, K. Phillips, Preliminary risk assessment database and risk
ranking of pharmaceuticals in the environment., Sci. Total Environ. 398 (2008) 26–33.
doi:10.1016/j.scitotenv.2008.02.061.
[18] Z. Shu, J.R. Bolton, M. Belosevic, M.G. El Din, Photodegradation of emerging
micropollutants using the medium-pressure UV/H2O2 Advanced Oxidation Process.,
Water Res. 47 (2013) 2881–9. doi:10.1016/j.watres.2013.02.045.
[19] J.L. Packer, J.J. Werner, D.E. Latch, K. McNeill, W.A. Arnold, Photochemical fate of
pharmaceuticals in the environment: Naproxen, diclofenac, clofibric acid, and
ibuprofen, Aquat. Sci. 65 (2003) 342–351. doi:10.1007/s00027-003-0671-8.
[20] M. Bergheim, R. Gminski, B. Spangenberg, M. Dębiak, A. Bürkle, V. Mersch-
Sundermann, et al., Recalcitrant pharmaceuticals in the aquatic environment: a
comparative screening study of their occurrence, formation of phototransformation
products and their in vitro toxicity, Environ. Chem. 11 (2014) 431–444.
[21] A. Azzouz, E. Ballesteros, Influence of seasonal climate differences on the
pharmaceutical, hormone and personal care product removal efficiency of a drinking
water treatment plant, Chemosphere. 93 (2013) 2046–2054.
[22] M. Farré, D. Asperger, L. Kantiani, S. González, M. Petrovic, D. Barceló, Assessment
of the acute toxicity of triclosan and methyl triclosan in wastewater based on the
bioluminescence inhibition of Vibrio fischeri., Anal. Bioanal. Chem. 390 (2008) 1999–
2007. doi:10.1007/s00216-007-1779-9.
[23] L. Lishman, S.A. Smyth, K. Sarafin, S. Kleywegt, J. Toito, T. Peart, et al., Occurrence
and reductions of pharmaceuticals and personal care products and estrogens by
municipal wastewater treatment plants in Ontario, Canada., Sci. Total Environ. 367
(2006) 544–58. doi:10.1016/j.scitotenv.2006.03.021.
[24] F. Méndez-Arriaga, S. Esplugas, J. Giménez, Degradation of the emerging
contaminant ibuprofen in water by photo-Fenton., Water Res. 44 (2010) 589–95.
[25] C. Bouissou-Schurtz, P. Houeto, M. Guerbet, M. Bachelot, C. Casellas, A.-C.
Mauclaire, et al., Ecological risk assessment of the presence of pharmaceutical
residues in a French national water survey, Regul. Toxicol. Pharmacol. 69 (2014) 296–
303. doi:10.1016/j.yrtph.2014.04.006.
[26] C. Carlsson, A.-K. Johansson, G. Alvan, K. Bergman, T. Kühler, Are pharmaceuticals
potent environmental pollutants?: Part I: Environmental risk assessments of selected
active pharmaceutical ingredients, Sci. Total Environ. 364 (2006) 67–87.
doi:http://dx.doi.org/10.1016/j.scitotenv.2005.06.035.
[27] M.S. Kostich, A.L. Batt, J.M. Lazorchak, Concentrations of prioritized
pharmaceuticals in effluents from 50 large wastewater treatment plants in the US and
implications for risk estimation., Environ. Pollut. 184C (2013) 354–359.
doi:10.1016/j.envpol.2013.09.013.
[28] D. Pascoe, W. Karntanut, C.T. Müller, Do pharmaceuticals affect freshwater
invertebrates? A study with the cnidarian Hydra vulgaris, Chemosphere. 51 (2003)
521–528. doi:10.1016/S0045-6535(02)00860-3.
[29] L. Heckmann, A. Callaghan, H. Hooper, R. Connon, T. Hutchinson, S. Maund, et al.,
Chronic toxicity of ibuprofen to Daphnia magna: Effects on life history traits and
population dynamics, Toxicol. Lett. 172 (2007) 137–145.
doi:10.1016/j.toxlet.2007.06.001.
[30] N. Pounds, S. Maclean, M. Webley, D. Pascoe, T. Hutchinson, Acute and chronic
effects of ibuprofen in the mollusc Planorbis carinatus (Gastropoda: Planorbidae),
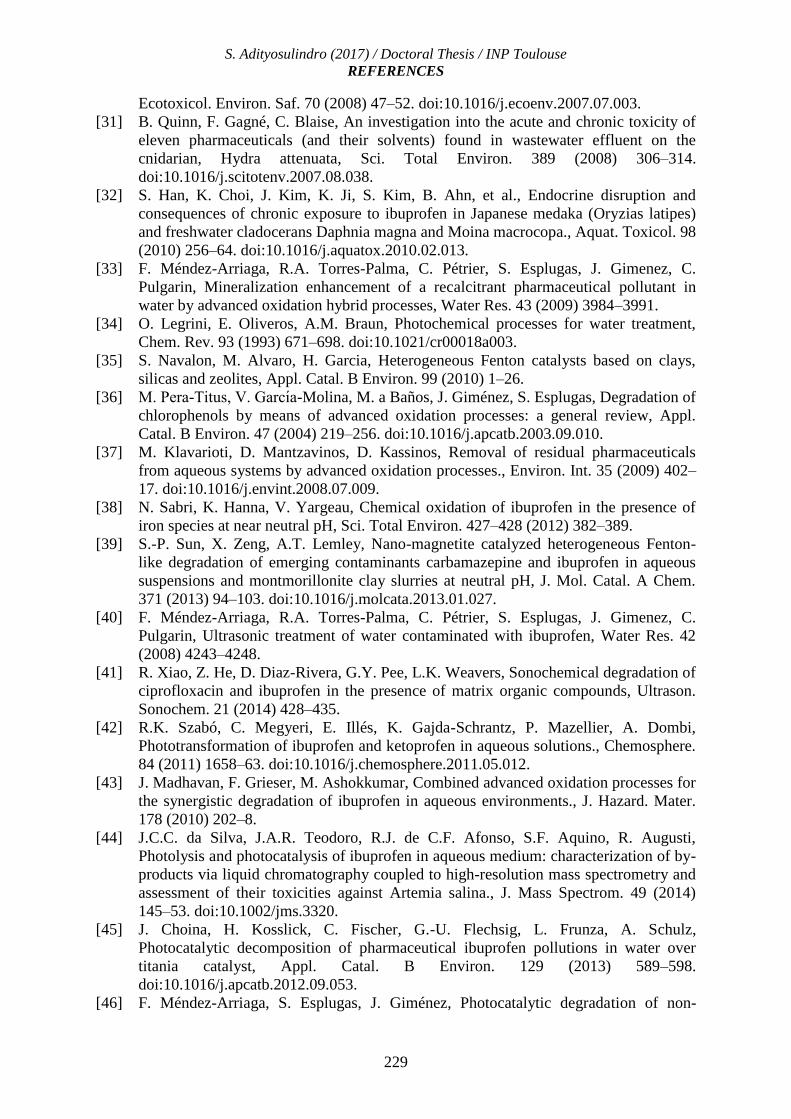
S. Adityosulindro (2017) / Doctoral Thesis / INP Toulouse
REFERENCES
229
Ecotoxicol. Environ. Saf. 70 (2008) 47–52. doi:10.1016/j.ecoenv.2007.07.003.
[31] B. Quinn, F. Gagné, C. Blaise, An investigation into the acute and chronic toxicity of
eleven pharmaceuticals (and their solvents) found in wastewater effluent on the
cnidarian, Hydra attenuata, Sci. Total Environ. 389 (2008) 306–314.
doi:10.1016/j.scitotenv.2007.08.038.
[32] S. Han, K. Choi, J. Kim, K. Ji, S. Kim, B. Ahn, et al., Endocrine disruption and
consequences of chronic exposure to ibuprofen in Japanese medaka (Oryzias latipes)
and freshwater cladocerans Daphnia magna and Moina macrocopa., Aquat. Toxicol. 98
(2010) 256–64. doi:10.1016/j.aquatox.2010.02.013.
[33] F. Méndez-Arriaga, R.A. Torres-Palma, C. Pétrier, S. Esplugas, J. Gimenez, C.
Pulgarin, Mineralization enhancement of a recalcitrant pharmaceutical pollutant in
water by advanced oxidation hybrid processes, Water Res. 43 (2009) 3984–3991.
[34] O. Legrini, E. Oliveros, A.M. Braun, Photochemical processes for water treatment,
Chem. Rev. 93 (1993) 671–698. doi:10.1021/cr00018a003.
[35] S. Navalon, M. Alvaro, H. Garcia, Heterogeneous Fenton catalysts based on clays,
silicas and zeolites, Appl. Catal. B Environ. 99 (2010) 1–26.
[36] M. Pera-Titus, V. Garcı́a-Molina, M. a Baños, J. Giménez, S. Esplugas, Degradation of
chlorophenols by means of advanced oxidation processes: a general review, Appl.
Catal. B Environ. 47 (2004) 219–256. doi:10.1016/j.apcatb.2003.09.010.
[37] M. Klavarioti, D. Mantzavinos, D. Kassinos, Removal of residual pharmaceuticals
from aqueous systems by advanced oxidation processes., Environ. Int. 35 (2009) 402–
17. doi:10.1016/j.envint.2008.07.009.
[38] N. Sabri, K. Hanna, V. Yargeau, Chemical oxidation of ibuprofen in the presence of
iron species at near neutral pH, Sci. Total Environ. 427–428 (2012) 382–389.
[39] S.-P. Sun, X. Zeng, A.T. Lemley, Nano-magnetite catalyzed heterogeneous Fenton-
like degradation of emerging contaminants carbamazepine and ibuprofen in aqueous
suspensions and montmorillonite clay slurries at neutral pH, J. Mol. Catal. A Chem.
371 (2013) 94–103. doi:10.1016/j.molcata.2013.01.027.
[40] F. Méndez-Arriaga, R.A. Torres-Palma, C. Pétrier, S. Esplugas, J. Gimenez, C.
Pulgarin, Ultrasonic treatment of water contaminated with ibuprofen, Water Res. 42
(2008) 4243–4248.
[41] R. Xiao, Z. He, D. Diaz-Rivera, G.Y. Pee, L.K. Weavers, Sonochemical degradation of
ciprofloxacin and ibuprofen in the presence of matrix organic compounds, Ultrason.
Sonochem. 21 (2014) 428–435.
[42] R.K. Szabó, C. Megyeri, E. Illés, K. Gajda-Schrantz, P. Mazellier, A. Dombi,
Phototransformation of ibuprofen and ketoprofen in aqueous solutions., Chemosphere.
84 (2011) 1658–63. doi:10.1016/j.chemosphere.2011.05.012.
[43] J. Madhavan, F. Grieser, M. Ashokkumar, Combined advanced oxidation processes for
the synergistic degradation of ibuprofen in aqueous environments., J. Hazard. Mater.
178 (2010) 202–8.
[44] J.C.C. da Silva, J.A.R. Teodoro, R.J. de C.F. Afonso, S.F. Aquino, R. Augusti,
Photolysis and photocatalysis of ibuprofen in aqueous medium: characterization of by-
products via liquid chromatography coupled to high-resolution mass spectrometry and
assessment of their toxicities against Artemia salina., J. Mass Spectrom. 49 (2014)
145–53. doi:10.1002/jms.3320.
[45] J. Choina, H. Kosslick, C. Fischer, G.-U. Flechsig, L. Frunza, A. Schulz,
Photocatalytic decomposition of pharmaceutical ibuprofen pollutions in water over
titania catalyst, Appl. Catal. B Environ. 129 (2013) 589–598.
doi:10.1016/j.apcatb.2012.09.053.
[46] F. Méndez-Arriaga, S. Esplugas, J. Giménez, Photocatalytic degradation of non-

S. Adityosulindro (2017) / Doctoral Thesis / INP Toulouse
REFERENCES
230
steroidal anti-inflammatory drugs with TiO2 and simulated solar irradiation., Water
Res. 42 (2008) 585–94.
[47] S. Loaiza-Ambuludi, M. Panizza, N. Oturan, A. Özcan, M.A. Oturan, Electro-Fenton
degradation of anti-inflammatory drug ibuprofen in hydroorganic medium, J.
Electroanal. Chem. 702 (2013) 31–36. doi:10.1016/j.jelechem.2013.05.006.
[48] C. Zwiener, Oxidative treatment of pharmaceuticals in water, Water Res. 34 (2000)
1881–1885. doi:10.1016/S0043-1354(99)00338-3.
[49] A. Ziylan, N.H. Ince, Catalytic ozonation of ibuprofen with ultrasound and Fe-based
catalysts, Catal. Today. (2014). doi:10.1016/j.cattod.2014.03.002.
[50] R. Gonzalez-Olmos, F. Holzer, F.-D. Kopinke, A. Georgi, Indications of the reactive
species in a heterogeneous Fenton-like reaction using Fe-containing zeolites, Appl.
Catal. A Gen. 398 (2011) 44–53. doi:10.1016/j.apcata.2011.03.005.
[51] M.Y. Ghaly, G. Härtel, R. Mayer, R. Haseneder, Photochemical oxidation of p-
chlorophenol by UV/H2O2 and photo-Fenton process. A comparative study, Waste
Manag. 21 (2001) 41–47. doi:10.1016/S0956-053X(00)00070-2.
[52] I. Michael, A. Achilleos, D. Lambropoulou, V.O. Torrens, S. Pérez, M. Petrović, et al.,
Proposed transformation pathway and evolution profile of diclofenac and ibuprofen
transformation products during (sono)photocatalysis, Appl. Catal. B Environ. 147
(2014) 1015–1027.
[53] M.A. Miranda, I. Morera, F. Vargas, M.J. Gómez-Lechón, J.V. Castell, In vitro
assessment of the phototoxicity of anti-inflammatory 2-arylpropionic acids, Toxicol.
Vitr. 5 (1991) 451–455. doi:10.1016/0887-2333(91)90071-K.
[54] G. Ruggeri, G. Ghigo, V. Maurino, C. Minero, D. Vione, Photochemical
transformation of ibuprofen into harmful 4-isobutylacetophenone: pathways, kinetics,
and significance for surface waters., Water Res. 47 (2013) 6109–21.
doi:10.1016/j.watres.2013.07.031.
[55] E. Illés, E. Takács, A. Dombi, K. Gajda-Schrantz, G. Rácz, K. Gonter, et al., Hydroxyl
radical induced degradation of ibuprofen., Sci. Total Environ. 447 (2013) 286–92.
doi:10.1016/j.scitotenv.2013.01.007.
[56] E. Neyens, J. Baeyens, A review of classic Fenton’s peroxidation as an advanced
oxidation technique, J. Hazard. Mater. 98 (2003) 33–50.
[57] V. Kavitha, K. Palanivelu, The role of ferrous ion in Fenton and photo-Fenton
processes for the degradation of phenol., Chemosphere. 55 (2004) 1235–43.
doi:10.1016/j.chemosphere.2003.12.022.
[58] F. Velichkova, C. Julcour-Lebigue, B. Koumanova, H. Delmas, Heterogeneous Fenton
oxidation of paracetamol using iron oxide (nano)particles, J. Environ. Chem. Eng. 1
(2013) 1–9. doi:10.1016/j.jece.2013.09.011.
[59] H.J.H. Fenton, Oxidation of tartaric acid in the presence of iron, J. Chem. Soc. 889
(1894) 899–910.
[60] A. Babuponnusami, K. Muthukumar, A review on Fenton and improvements to the
Fenton process for wastewater treatment, J. Environ. Chem. Eng. 2 (2013) 557–572.
[61] A.Y. Sychev, V.G. Isak, Iron compounds and the mechanisms of the homogeneous
catalysis of the activation of O2 and H2O2 and of the oxidation of organic substrates,
Russ. Chem. Rev. 64 (1995) 1105.
[62] J. De Laat, H. Gallard, Catalytic decomposition of hydrogen peroxide by Fe(III) in
homogeneous aqueous solution: mechanism and kinetic modeling, Environ. Sci.
Technol. 33 (1999) 2726–2732.
[63] J.J. Pignatello, E. Oliveros, A. MacKay, Advanced Oxidation Processes for Organic
Contaminant Destruction Based on the Fenton Reaction and Related Chemistry, Crit.
Rev. Environ. Sci. Technol. 36 (2006) 1–84. doi:10.1080/10643380500326564.

S. Adityosulindro (2017) / Doctoral Thesis / INP Toulouse
REFERENCES
231
[64] Y. Segura, F. Martínez, J.A. Melero, R. Molina, R. Chand, D.H. Bremner,
Enhancement of the advanced Fenton process (Fe0/H2O2) by ultrasound for the
mineralization of phenol, Appl. Catal. B Environ. 113–114 (2012) 100–106.
doi:10.1016/j.apcatb.2011.11.024.
[65] J. He, X. Yang, B. Men, D. Wang, Interfacial mechanisms of heterogeneous Fenton
reactions catalyzed by iron-based materials: A review, J. Environ. Sci. (2016).
doi:10.1016/j.jes.2015.12.003.
[66] Y. Ahmed, Z. Yaakob, P. Akhtar, Degradation and mineralization of methylene blue
using a heterogeneous photo-Fenton catalyst under visible and solar light irradiation,
Catal. Sci. Technol. 6 (2016) 1222–1232. doi:10.1039/C5CY01494H.
[67] S. Rahim Pouran, A.R. Abdul Aziz, W.M.A. Wan Daud, Review on the main advances
in photo-Fenton oxidation system for recalcitrant wastewaters, J. Ind. Eng. Chem. 21
(2015) 53–69. doi:10.1016/j.jiec.2014.05.005.
[68] E.G. Garrido-Ramírez, B.K.. Theng, M.L. Mora, Clays and oxide minerals as catalysts
and nanocatalysts in Fenton-like reactions — A review, Appl. Clay Sci. 47 (2010)
182–192. doi:10.1016/j.clay.2009.11.044.
[69] P. V Nidheesh, Heterogeneous Fenton catalysts for the abatement of organic pollutants
from aqueous solution: a review, RSC Adv. 5 (2015) 40552–40577.
doi:10.1039/C5RA02023A.
[70] S. Lin, M.D. Gurol, Catalytic Decomposition of Hydrogen Peroxide on Iron Oxide:
Kinetics, Mechanism, and Implications, Environ. Sci. Technol. 32 (1998) 1417–1423.
doi:10.1021/es970648k.
[71] X. Xue, K. Hanna, M. Abdelmoula, N. Deng, Adsorption and oxidation of PCP on the
surface of magnetite: Kinetic experiments and spectroscopic investigations, Appl.
Catal. B Environ. 89 (2009) 432–440. doi:10.1016/j.apcatb.2008.12.024.
[72] X. Zeng, A.T. Lemley, Fenton Degradation of 4,6-Dinitro-o-cresol with Fe2+-
Substituted Ion-Exchange Resin, J. Agric. Food Chem. 57 (2009) 3689–3694.
doi:10.1021/jf900764q.
[73] S. Zha, Y. Cheng, Y. Gao, Z. Chen, M. Megharaj, R. Naidu, Nanoscale zero-valent
iron as a catalyst for heterogeneous Fenton oxidation of amoxicillin, Chem. Eng. J.
255 (2014) 141–148. doi:10.1016/j.cej.2014.06.057.
[74] A.L.-T. Pham, C. Lee, F.M. Doyle, D.L. Sedlak, A silica-supported iron oxide catalyst
capable of activating hydrogen peroxide at neutral pH values., Environ. Sci. Technol.
43 (2009) 8930–5. doi:10.1021/es902296k.
[75] K. Rusevova, R. Köferstein, M. Rosell, H.H. Richnow, F.-D. Kopinke, A. Georgi,
LaFeO3 and BiFeO3 perovskites as nanocatalysts for contaminant degradation in
heterogeneous Fenton-like reactions, Chem. Eng. J. 239 (2014) 322–331.
doi:10.1016/j.cej.2013.11.025.
[76] W.C. Bray, M.H. Gorin, Ferryl ion, a compound of tetravalent iron, J. Am. Chem. Soc.
54 (1932) 2124–2125. doi:10.1021/ja01344a505.
[77] I. Fechete, Y. Wang, J.C. Védrine, The past, present and future of heterogeneous
catalysis, Catal. Today. 189 (2012) 2–27. doi:10.1016/j.cattod.2012.04.003.
[78] M.D.G. de Luna, R.M. Briones, C.-C. Su, M.-C. Lu, Kinetics of acetaminophen
degradation by Fenton oxidation in a fluidized-bed reactor, Chemosphere. 90 (2013)
1444–1448. doi:10.1016/j.chemosphere.2012.09.003.
[79] R.P. Cavalcante, L. da Rocha Sandim, D. Bogo, A.M.J. Barbosa, M.E. Osugi, M.
Blanco, et al., Application of Fenton, photo-Fenton, solar photo-Fenton, and UV/H2O2
to degradation of the antineoplastic agent mitoxantrone and toxicological evaluation,
Environ. Sci. Pollut. Res. 20 (2013) 2352–2361.
[80] H. Kusić, N. Koprivanac, I. Selanec, Fe-exchanged zeolite as the effective

S. Adityosulindro (2017) / Doctoral Thesis / INP Toulouse
REFERENCES
232
heterogeneous Fenton-type catalyst for the organic pollutant minimization: UV
irradiation assistance., Chemosphere. 65 (2006) 65–73.
doi:10.1016/j.chemosphere.2006.02.053.
[81] M. Siddique, R. Farooq, G.J. Price, Synergistic effects of combining ultrasound with
the Fenton process in the degradation of Reactive Blue 19, Ultrason. Sonochem. 21
(2014) 1206–12.
[82] C. Wang, Y. Shih, Degradation and detoxification of diazinon by sono-Fenton and
sono-Fenton-like processes, Sep. Purif. Technol. 140 (2015) 6–12.
doi:10.1016/j.seppur.2014.11.005.
[83] M. Velásquez, I.P. Santander, D.R. Contreras, J. Yáñez, C. Zaror, R.A. Salazar, et al.,
Oxidative degradation of sulfathiazole by Fenton and photo-Fenton reactions, J.
Environ. Sci. Heal. Part A. 49 (2014) 661–670. doi:10.1080/10934529.2014.865447.
[84] G. Centi, S. Perathoner, T. Torre, M.G. Verduna, Catalytic wet oxidation with H2O2
of carboxylic acids on homogeneous and heterogeneous Fenton-type catalysts, Catal.
Today. 55 (2000) 61–69. doi:10.1016/S0920-5861(99)00226-6.
[85] T. Zhou, Y. Li, J. Ji, F.-S. Wong, X. Lu, Oxidation of 4-chlorophenol in a
heterogeneous zero valent iron/H2O2 Fenton-like system: Kinetic, pathway and effect
factors, Sep. Purif. Technol. 62 (2008) 551–558. doi:10.1016/j.seppur.2008.03.008.
[86] A. Cihanoğlu, G. Gündüz, M. Dükkancı, Degradation of acetic acid by heterogeneous
Fenton-like oxidation over iron-containing ZSM-5 zeolites, Appl. Catal. B Environ.
165 (2015) 687–699. doi:10.1016/j.apcatb.2014.10.073.
[87] D.E. Hughes, W.L. Nyborg, Cell Disruption by Ultrasound: Streaming and other
activity around sonically induced bubbles is a cause of damage to living cells, Sci. 138
(1962) 108–114. doi:10.1126/science.138.3537.108.
[88] T.J. Mason, J.P. Lorimer, Applied sonochemistry: the uses of power ultrasound in
chemistry and processing. 2002, John Wiley & Sons, Ltd., 1991.
[89] N.T. Le, C. Julcour-Lebigue, H. Delmas, An executive review of sludge pretreatment
by sonication, J. Environ. Sci. (China). 37 (2015) 139–53.
doi:10.1016/j.jes.2015.05.031.
[90] Y.G. Adewuyi, Sonochemistry: Environmental Science and Engineering Applications,
Ind. Eng. Chem. Res. 40 (2001) 4681–4715. doi:10.1021/ie010096l.
[91] S. Pilli, P. Bhunia, S. Yan, R.J. LeBlanc, R.D. Tyagi, R.Y. Surampalli, Ultrasonic
pretreatment of sludge: a review, Ultrason. Sonochem. 18 (2011) 1–18.
[92] J. González-García, V. Sáez, I. Tudela, M.I. Díez-Garcia, M. Deseada Esclapez, O.
Louisnard, Sonochemical treatment of water polluted by chlorinated
organocompounds. A review, Water. 2 (2010) 28–74. doi:10.3390/w2010028.
[93] Y. Ma, Short review : Current trends and future challenges in the application of sono-
Fenton oxidation for wastewater treatment, Sustain. Environ. Res. 22 (2012) 271–278.
[94] J.P. Lorimer, T.J. Mason, Sonochemistry. Part 1—The physical aspects, Chem. Soc.
Rev. 16 (1987) 239–274. doi:10.1039/CS9871600239.
[95] Y.L. Pang, A.Z. Abdullah, S. Bhatia, Review on sonochemical methods in the
presence of catalysts and chemical additives for treatment of organic pollutants in
wastewater, Desalination. 277 (2011) 1–14.
[96] F. Burdin, N.A. Tsochatzidis, P. Guiraud, A.M. Wilhelm, H. Delmas, Characterisation
of the acoustic cavitation cloud by two laser techniques, Ultrason. Sonochem. 6 (1999)
43–51. doi:10.1016/S1350-4177(98)00035-2.
[97] Z. Frontistis, D. Mantzavinos, Sonodegradation of 17α-ethynylestradiol in
environmentally relevant matrices: Laboratory-scale kinetic studies, Ultrason.
Sonochem. 19 (2012) 77–84.
[98] I. Gültekin, N.H. Ince, Ultrasonic destruction of bisphenol-A: the operating

S. Adityosulindro (2017) / Doctoral Thesis / INP Toulouse
REFERENCES
233
parameters, Ultrason. Sonochem. 15 (2008) 524–9.
[99] G.T. Güyer, N.H. Ince, Degradation of diclofenac in water by homogeneous and
heterogeneous sonolysis, Ultrason. Sonochem. 18 (2011) 114–119.
[100] I. Quesada-Peñate, C. Julcour-Lebigue, U.J. Jáuregui-Haza, A.M. Wilhelm, H.
Delmas, Sonolysis of levodopa and paracetamol in aqueous solutions, Ultrason.
Sonochem. 16 (2009) 610–616.
[101] R. Xiao, D. Diaz-Rivera, L.K. Weavers, Factors Influencing Pharmaceutical and
Personal Care Product Degradation in Aqueous Solution Using Pulsed Wave
Ultrasound, Ind. Eng. Chem. Res. 52 (2013) 2824–2831.
[102] S.-H. Kim, Q. Tian, J. Fang, S. Sung, Removal of 17-β estradiol in water by sonolysis,
Int. Biodeterior. Biodegradation. 102 (2015) 11–14. doi:10.1016/j.ibiod.2015.03.017.
[103] M. Goel, H. Hongqiang, A.S. Mujumdar, M.B. Ray, Sonochemical decomposition of
volatile and non-volatile organic compounds-a comparative study, Water Res. 38
(2004) 4247–4261.
[104] H.-M. Hung, M.R. Hoffmann, Kinetics and Mechanism of the Sonolytic Degradation
of Chlorinated Hydrocarbons: Frequency Effects, J. Phys. Chem. A. 103 (1999) 2734–
2739. doi:10.1021/jp9845930.
[105] J. Liang, S. Komarov, N. Hayashi, E. Kasai, Improvement in sonochemical
degradation of 4-chlorophenol by combined use of Fenton-like reagents., Ultrason.
Sonochem. 14 (2007) 201–207.
[106] G. Cruz-González, K. Gonzalez-Labrada, Y. Milian-Rodriguez, I. Quesada-Peñate, J.
Colín-Luna, J. Ramírez-Muñoz, et al., Enhancement of paracetamol degradation by
sono-Fenton process, Int. J. Chem. Mater. Environ. Res. 2 (2015) 37–45.
[107] I.D. Manariotis, H.K. Karapanagioti, C. V. Chrysikopoulos, Degradation of PAHs by
high frequency ultrasound, Water Res. 45 (2011) 2587–2594.
doi:10.1016/j.watres.2011.02.009.
[108] E. De Bel, C. Janssen, S. De Smet, H. Van Langenhove, J. Dewulf, Sonolysis of
ciprofloxacin in aqueous solution: Influence of operational parameters, Ultrason.
Sonochem. 18 (2011) 184–189. doi:10.1016/j.ultsonch.2010.05.003.
[109] A.M. Lastre-Acosta, G. Cruz-González, L. Nuevas-Paz, U.J. Jáuregui-Haza, A.C.S.C.
Teixeira, Ultrasonic degradation of sulfadiazine in aqueous solutions, Environ. Sci.
Pollut. Res. 22 (2015) 918–925.
[110] Z. Eren, N.H. Ince, Sonolytic and sonocatalytic degradation of azo dyes by low and
high frequency ultrasound, J. Hazard. Mater. 177 (2010) 1019–1024.
doi:10.1016/j.jhazmat.2010.01.021.
[111] V. Naddeo, V. Belgiorno, D. Kassinos, D. Mantzavinos, S. Meric, Ultrasonic
degradation, mineralization and detoxification of diclofenac in water: Optimization of
operating parameters, Ultrason. Sonochem. 17 (2010) 179–185.
doi:10.1016/j.ultsonch.2009.04.003.
[112] M. Sivakumar, A.B. Pandit, Ultrasound enhanced degradation of Rhodamine B:
optimization with power density, Ultrason. Sonochem. 8 (2001) 233–240.
doi:10.1016/S1350-4177(01)00082-7.
[113] B. Neppolian, H. Jung, H. Choi, J.H. Lee, J.-W. Kang, Sonolytic degradation of
methyl tert-butyl ether: the role of coupled Fenton process and persulphate ion, Water
Res. 36 (2002) 4699–4708.
[114] L. Jih-Gaw, M. Ying-Shih, Oxidation of 2-chlorophenol in water by ultrasound/Fenton
method, J. Environ. Eng. 126 (2000) 130–137.
[115] S. Papoutsakis, S. Miralles-Cuevas, N. Gondrexon, S. Baup, S. Malato, C. Pulgarin,
Coupling between high-frequency ultrasound and solar photo-Fenton at pilot scale for
the treatment of organic contaminants: an initial approach., Ultrason. Sonochem. 22
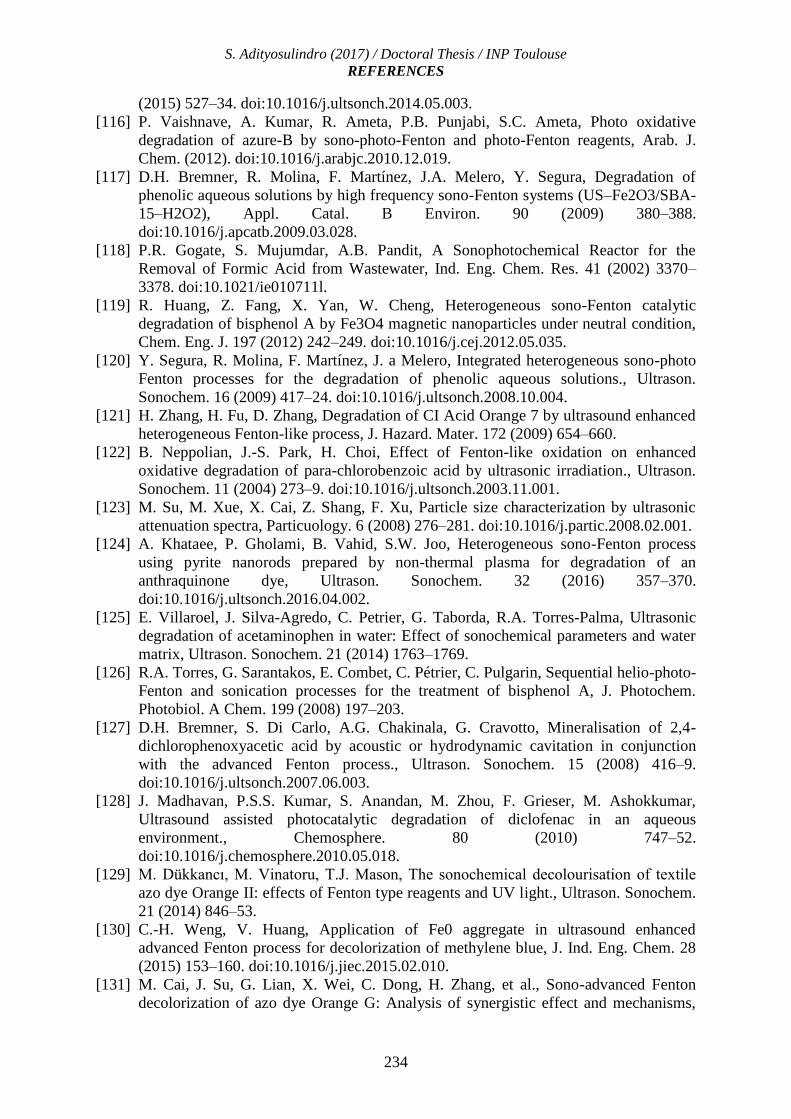
S. Adityosulindro (2017) / Doctoral Thesis / INP Toulouse
REFERENCES
234
(2015) 527–34. doi:10.1016/j.ultsonch.2014.05.003.
[116] P. Vaishnave, A. Kumar, R. Ameta, P.B. Punjabi, S.C. Ameta, Photo oxidative
degradation of azure-B by sono-photo-Fenton and photo-Fenton reagents, Arab. J.
Chem. (2012). doi:10.1016/j.arabjc.2010.12.019.
[117] D.H. Bremner, R. Molina, F. Martínez, J.A. Melero, Y. Segura, Degradation of
phenolic aqueous solutions by high frequency sono-Fenton systems (US–Fe2O3/SBA-
15–H2O2), Appl. Catal. B Environ. 90 (2009) 380–388.
doi:10.1016/j.apcatb.2009.03.028.
[118] P.R. Gogate, S. Mujumdar, A.B. Pandit, A Sonophotochemical Reactor for the
Removal of Formic Acid from Wastewater, Ind. Eng. Chem. Res. 41 (2002) 3370–
3378. doi:10.1021/ie010711l.
[119] R. Huang, Z. Fang, X. Yan, W. Cheng, Heterogeneous sono-Fenton catalytic
degradation of bisphenol A by Fe3O4 magnetic nanoparticles under neutral condition,
Chem. Eng. J. 197 (2012) 242–249. doi:10.1016/j.cej.2012.05.035.
[120] Y. Segura, R. Molina, F. Martínez, J. a Melero, Integrated heterogeneous sono-photo
Fenton processes for the degradation of phenolic aqueous solutions., Ultrason.
Sonochem. 16 (2009) 417–24. doi:10.1016/j.ultsonch.2008.10.004.
[121] H. Zhang, H. Fu, D. Zhang, Degradation of CI Acid Orange 7 by ultrasound enhanced
heterogeneous Fenton-like process, J. Hazard. Mater. 172 (2009) 654–660.
[122] B. Neppolian, J.-S. Park, H. Choi, Effect of Fenton-like oxidation on enhanced
oxidative degradation of para-chlorobenzoic acid by ultrasonic irradiation., Ultrason.
Sonochem. 11 (2004) 273–9. doi:10.1016/j.ultsonch.2003.11.001.
[123] M. Su, M. Xue, X. Cai, Z. Shang, F. Xu, Particle size characterization by ultrasonic
attenuation spectra, Particuology. 6 (2008) 276–281. doi:10.1016/j.partic.2008.02.001.
[124] A. Khataee, P. Gholami, B. Vahid, S.W. Joo, Heterogeneous sono-Fenton process
using pyrite nanorods prepared by non-thermal plasma for degradation of an
anthraquinone dye, Ultrason. Sonochem. 32 (2016) 357–370.
doi:10.1016/j.ultsonch.2016.04.002.
[125] E. Villaroel, J. Silva-Agredo, C. Petrier, G. Taborda, R.A. Torres-Palma, Ultrasonic
degradation of acetaminophen in water: Effect of sonochemical parameters and water
matrix, Ultrason. Sonochem. 21 (2014) 1763–1769.
[126] R.A. Torres, G. Sarantakos, E. Combet, C. Pétrier, C. Pulgarin, Sequential helio-photo-
Fenton and sonication processes for the treatment of bisphenol A, J. Photochem.
Photobiol. A Chem. 199 (2008) 197–203.
[127] D.H. Bremner, S. Di Carlo, A.G. Chakinala, G. Cravotto, Mineralisation of 2,4-
dichlorophenoxyacetic acid by acoustic or hydrodynamic cavitation in conjunction
with the advanced Fenton process., Ultrason. Sonochem. 15 (2008) 416–9.
doi:10.1016/j.ultsonch.2007.06.003.
[128] J. Madhavan, P.S.S. Kumar, S. Anandan, M. Zhou, F. Grieser, M. Ashokkumar,
Ultrasound assisted photocatalytic degradation of diclofenac in an aqueous
environment., Chemosphere. 80 (2010) 747–52.
doi:10.1016/j.chemosphere.2010.05.018.
[129] M. Dükkancı, M. Vinatoru, T.J. Mason, The sonochemical decolourisation of textile
azo dye Orange II: effects of Fenton type reagents and UV light., Ultrason. Sonochem.
21 (2014) 846–53.
[130] C.-H. Weng, V. Huang, Application of Fe0 aggregate in ultrasound enhanced
advanced Fenton process for decolorization of methylene blue, J. Ind. Eng. Chem. 28
(2015) 153–160. doi:10.1016/j.jiec.2015.02.010.
[131] M. Cai, J. Su, G. Lian, X. Wei, C. Dong, H. Zhang, et al., Sono-advanced Fenton
decolorization of azo dye Orange G: Analysis of synergistic effect and mechanisms,

S. Adityosulindro (2017) / Doctoral Thesis / INP Toulouse
REFERENCES
235
Ultrason. Sonochem. 31 (2016) 193–200. doi:10.1016/j.ultsonch.2015.12.017.
[132] J. Herney-Ramirez, M. a. Vicente, L.M. Madeira, Heterogeneous photo-Fenton
oxidation with pillared clay-based catalysts for wastewater treatment: A review, Appl.
Catal. B Environ. 98 (2010) 10–26. doi:10.1016/j.apcatb.2010.05.004.
[133] T. Oppenländer, Photochemical purification of water and air, advanced oxidation
processes: Principles, reaction mechanisms, reactor concepts, 2003.
doi:10.1002/9783527610884.
[134] K. Loubière, M. Oelgemöller, T. Aillet, O. Dechy-Cabaret, L. Prat, Continuous-flow
photochemistry: A need for chemical engineering, Chem. Eng. Process. Process
Intensif. 104 (2016) 120–132. doi:10.1016/j.cep.2016.02.008.
[135] F.H. Li, K. Yao, W.Y. Lv, G.G. Liu, P. Chen, H.P. Huang, et al., Photodegradation of
Ibuprofen Under UV–Vis Irradiation: Mechanism and Toxicity of Photolysis Products,
Bull. Environ. Contam. Toxicol. 94 (2015) 479–483. doi:10.1007/s00128-015-1494-8.
[136] H.D. Burrows, M. Canle L, J.A. Santaballa, S. Steenken, Reaction pathways and
mechanisms of photodegradation of pesticides, J. Photochem. Photobiol. B Biol. 67
(2002) 71–108. doi:10.1016/S1011-1344(02)00277-4.
[137] S. Parsons, Advanced Oxidation Processes for Water and Wastewater Treatment,
2004.
[138] S. Na, C. Jinhua, M. Cui, J. Khim, Sonophotolytic diethyl phthalate (DEP) degradation
with UVC or VUV irradiation, Ultrason. Sonochem. 19 (2012) 1094–1098.
[139] P. Iovino, S. Chianese, S. Canzano, M. Prisciandaro, D. Musmarra, Degradation of
Ibuprofen in Aqueous Solution with UV Light: the Effect of Reactor Volume and pH,
Water, Air, {&} Soil Pollut. 227 (2016) 1–9. doi:10.1007/s11270-016-2890-3.
[140] H.-S. Son, J.-K. Im, K.-D. Zoh, A Fenton-like degradation mechanism for 1,4-dioxane
using zero-valent iron (Fe0) and UV light., Water Res. 43 (2009) 1457–63.
doi:10.1016/j.watres.2008.12.029.
[141] M.G. Gonzalez, E. Oliveros, M. Wörner, A.M. Braun, Vacuum-ultraviolet photolysis
of aqueous reaction systems, J. Photochem. Photobiol. C Photochem. Rev. 5 (2004)
225–246. doi:10.1016/j.jphotochemrev.2004.10.002.
[142] A. Lopez, A. Bozzi, G. Mascolo, J. Kiwi, Kinetic investigation on UV and UV/H2O2
degradations of pharmaceutical intermediates in aqueous solution, J. Photochem.
Photobiol. A Chem. 156 (2003) 121–126. doi:10.1016/S1010-6030(02)00435-5.
[143] I. Kim, H. Tanaka, Photodegradation characteristics of PPCPs in water with UV
treatment, Environ. Int. 35 (2009) 793–802. doi:10.1016/j.envint.2009.01.003.
[144] B.C. Faust, J. Hoigné, Photolysis of Fe (III)-hydroxy complexes as sources of OH
radicals in clouds, fog and rain, Atmos. Environ. Part A. Gen. Top. 24 (1990) 79–89.
doi:10.1016/0960-1686(90)90443-Q.
[145] H.-J. Benkelberg, P. Warneck, Photodecomposition of Iron(III) hydroxo and sulfato
complexes in aqueous solution: wavelength dependence of OH and SO4- quantum
Yields, J. Phys. Chem. 99 (1995) 5214–5221. doi:10.1021/j100014a049.
[146] C. Lee, J. Yoon, Determination of quantum yields for the photolysis of Fe(III)-hydroxo
complexes in aqueous solution using a novel kinetic method., Chemosphere. 57 (2004)
1449–58. doi:10.1016/j.chemosphere.2004.07.052.
[147] S.G. Behar B, Photochemical evolution of oxygen from certain aqueous solutions,
Pubmed. 154 (1966) 1012–1013.
[148] F. Torrades, M. Pérez, H.D. Mansilla, J. Peral, Experimental design of Fenton and
photo-Fenton reactions for the treatment of cellulose bleaching effluents.,
Chemosphere. 53 (2003) 1211–20. doi:10.1016/S0045-6535(03)00579-4.
[149] A. Safarzadeh-Amiri, J.R. Bolton, S.R. Cater, Ferrioxalate-mediated photodegradation
of organic pollutants in contaminated water, Water Res. 31 (1997) 787–798.

S. Adityosulindro (2017) / Doctoral Thesis / INP Toulouse
REFERENCES
236
doi:10.1016/S0043-1354(96)00373-9.
[150] E.M. Rodríguez, B. Núñez, G. Fernández, F.J. Beltrán, Effects of some carboxylic
acids on the Fe(III)/UVA photocatalytic oxidation of muconic acid in water, Appl.
Catal. B Environ. 89 (2009) 214–222. doi:10.1016/j.apcatb.2008.11.030.
[151] T.D. Waite, F.M.M. Morel, Photoreductive dissolution of colloidal iron oxides in
natural waters, Environ. Sci. Technol. 18 (1984) 860–868. doi:10.1021/es00129a010.
[152] D.A. Nichela, J.A. Donadelli, B.F. Caram, M. Haddou, F.J. Rodriguez Nieto, E.
Oliveros, et al., Iron cycling during the autocatalytic decomposition of benzoic acid
derivatives by Fenton-like and photo-Fenton techniques, Appl. Catal. B Environ. 170–
171 (2015) 312–321. doi:10.1016/j.apcatb.2015.01.028.
[153] C.H. Langford, J.H. Carey, The charge transfer photochemistry of the
hexaaquoiron(III) ion, the chloropebtaaquiron(III) ion, and the µ-dihydroxo dimer
explored with ter-butyl alcohol scavenging, Can. J. Chem. 53 (1975) 2430–2435.
[154] F. Martínez, G. Calleja, J.A. Melero, R. Molina, Heterogeneous photo-Fenton
degradation of phenolic aqueous solutions over iron-containing SBA-15 catalyst, Appl.
Catal. B Environ. 60 (2005) 181–190. doi:10.1016/j.apcatb.2005.03.004.
[155] N. Wang, T. Zheng, G. Zhang, P. Wang, A review on Fenton-like processes for
organic wastewater treatment, J. Environ. Chem. Eng. (2016).
doi:10.1016/j.jece.2015.12.016.
[156] G.B. Ortiz de la Plata, O.M. Alfano, A.E. Cassano, 2-Chlorophenol degradation via
photo Fenton reaction employing zero valent iron nanoparticles, J. Photochem.
Photobiol. A Chem. 233 (2012) 53–59. doi:10.1016/j.jphotochem.2012.02.023.
[157] F. Yuan, C. Hu, X. Hu, J. Qu, M. Yang, Degradation of selected pharmaceuticals in
aqueous solution with UV and UV/H2O2, Water Res. 43 (2009) 1766–1774.
doi:10.1016/j.watres.2009.01.008.
[158] D.H. Funai, F. Didier, J. Giménez, S. Esplugas, P. Marco, A. Machulek, Photo-Fenton
treatment of valproate under UVC, UVA and simulated solar radiation, J. Hazard.
Mater. 323 (2017) 537–549.
[159] J. Sun, J. Feng, S. Shi, Y. Pi, M. Song, Y. Shi, Degradation of the antibiotic
sulfamonomethoxine sodium in aqueous solution by photo-Fenton oxidation, Chinese
Sci. Bull. 57 (2012) 558–564. doi:10.1007/s11434-011-4887-z.
[160] B. Iurascu, I. Siminiceanu, D. Vione, M.A. Vicente, A. Gil, Phenol degradation in
water through a heterogeneous photo-Fenton process catalyzed by Fe-treated laponite.,
Water Res. 43 (2009) 1313–22. doi:10.1016/j.watres.2008.12.032.
[161] J. Feng, X. Hu, P.L. Yue, H.Y. Zhu, G.Q. Lu, Discoloration and mineralization of
Reactive Red HE-3B by heterogeneous photo-Fenton reaction., Water Res. 37 (2003)
3776–84. doi:10.1016/S0043-1354(03)00268-9.
[162] M.B. Kasiri, H. Aleboyeh, A. Aleboyeh, Degradation of Acid Blue 74 using Fe-ZSM5
zeolite as a heterogeneous photo-Fenton catalyst, Appl. Catal. B Environ. 84 (2008) 9–
15. doi:10.1016/j.apcatb.2008.02.024.
[163] F. Duarte, L.M. Madeira, Fenton- and Photo-Fenton-Like Degradation of a Textile
Dye by Heterogeneous Processes with Fe/ZSM-5 Zeolite, Sep. Sci. Technol. 45 (2010)
1512–1520. doi:10.1080/01496395.2010.487452.
[164] R. Gonzalez-Olmos, M.J. Martin, A. Georgi, F.-D. Kopinke, I. Oller, S. Malato, Fe-
zeolites as heterogeneous catalysts in solar Fenton-like reactions at neutral pH, Appl.
Catal. B Environ. 125 (2012) 51–58. doi:10.1016/j.apcatb.2012.05.022.
[165] F. Velichkova, H. Delmas, C. Julcour, B. Koumanova, Heterogeneous Fenton and
photo-Fenton oxidation for paracetamol removal using iron containing ZSM-5 zeolite
as catalyst, AIChE J. (2016) n/a--n/a. doi:10.1002/aic.15369.
[166] I. Grčić, S. Papić, K. Žižek, N. Koprivanac, Zero-valent iron (ZVI) Fenton oxidation

S. Adityosulindro (2017) / Doctoral Thesis / INP Toulouse
REFERENCES
237
of reactive dye wastewater under UV-C and solar irradiation, Chem. Eng. J. 195–196
(2012) 77–90. doi:10.1016/j.cej.2012.04.093.
[167] M. Aleksić, H. Kušić, N. Koprivanac, D. Leszczynska, A.L. Božić, Heterogeneous
Fenton type processes for the degradation of organic dye pollutant in water — The
application of zeolite assisted AOPs, Desalination. 257 (2010) 22–29.
doi:10.1016/j.desal.2010.03.016.
[168] R. a Torres, C. Pétrier, E. Combet, F. Moulet, C. Pulgarin, Bisphenol A mineralization
by integrated ultrasound-UV-iron (II) treatment., Environ. Sci. Technol. 41 (2007)
297–302.
[169] J. Madhavan, P.S. Sathish Kumar, S. Anandan, F. Grieser, M. Ashokkumar,
Degradation of acid red 88 by the combination of sonolysis and photocatalysis, Sep.
Purif. Technol. 74 (2010) 336–341. doi:10.1016/j.seppur.2010.07.001.
[170] H. Katsumata, T. Kobayashi, S. Kaneco, T. Suzuki, K. Ohta, Degradation of linuron
by ultrasound combined with photo-Fenton treatment, Chem. Eng. J. 166 (2011) 468–
473. doi:10.1016/j.cej.2010.10.073.
[171] L.J. Xu, W. Chu, N. Graham, Degradation of di-n-butyl phthalate by a homogeneous
sono-photo-Fenton process with in-situ generated hydrogen peroxide, Chem. Eng. J.
240 (2013) 541–547.
[172] J. Madhavan, F. Grieser, M. Ashokkumar, Sonophotocatalytic degradation of
paracetamol using TiO2 and Fe3+, Sep. Purif. Technol. 103 (2013) 114–118.
doi:10.1016/j.seppur.2012.10.003.
[173] J. Madhavan, P.S. Sathish Kumar, S. Anandan, F. Grieser, M. Ashokkumar,
Sonophotocatalytic degradation of monocrotopos usingh TiO2 and Fe3+, J. Hazard.
Mater. 177 (2010) 944–9. doi:10.1016/j.jhazmat.2010.01.009.
[174] S. Chakma, V.S. Moholkar, Investigations in synergism of hybrid advanced oxidation
processes with combinations of sonolysis + Fenton process + UV for degradation of
bisphenol A, Ind. Eng. Chem. Res. 53 (2014) 6855–6865.
[175] X. Zhong, S. Royer, H. Zhang, Q. Huang, L. Xiang, S. Valange, et al., Mesoporous
silica iron-doped as stable and efficient heterogeneous catalyst for the degradation of
C.I. Acid Orange 7 using sono–photo-Fenton process, Sep. Purif. Technol. 80 (2011)
163–171. doi:10.1016/j.seppur.2011.04.024.
[176] C. Sirtori, A. Zapata, W. Gernjak, S. Malato, A. Lopez, A. Agüera, Solar photo-Fenton
degradation of nalidixic acid in waters and wastewaters of different composition.
Analytical assessment by LC-TOF-MS., Water Res. 45 (2011) 1736–44.
doi:10.1016/j.watres.2010.11.023.
[177] S. Queirós, V. Morais, C.S.D. Rodrigues, F.J. Maldonado-Hódar, L.M. Madeira,
Heterogeneous Fenton’s oxidation using Fe/ZSM-5 as catalyst in a continuous stirred
tank reactor, Sep. Purif. Technol. 141 (2015) 235–245.
doi:10.1016/j.seppur.2014.11.046.
[178] Y. Segura, F. Martínez, J.A. Melero, J.L.G. Fierro, Zero valent iron (ZVI) mediated
Fenton degradation of industrial wastewater: Treatment performance and
characterization of final composites, Chem. Eng. J. 269 (2015) 298–305.
doi:10.1016/j.cej.2015.01.102.
[179] W. Chu, K.H. Chan, C.Y. Kwan, K.Y. Choi, Degradation of atrazine by modified
stepwise-Fenton’s processes., Chemosphere. 67 (2007) 755–61.
doi:10.1016/j.chemosphere.2006.10.039.
[180] A.C.-K. Yip, F.L.-Y. Lam, X. Hu, Chemical-Vapor-Deposited Copper on Acid-
Activated Bentonite Clay as an Applicable Heterogeneous Catalyst for the Photo-
Fenton-like Oxidation of Textile Organic Pollutants, Ind. Eng. Chem. Res. 44 (2005)
7983–7990. doi:10.1021/ie050647y.
S. Adityosulindro (2017) / Doctoral Thesis / INP Toulouse
REFERENCES
238
[181] I.-H. Yoon, G. Yoo, H.-J. Hong, J. Kim, M.G. Kim, W.-K. Choi, et al., Kinetic study
for phenol degradation by ZVI-assisted Fenton reaction and related iron corrosion
investigated by X-ray absorption spectroscopy, Chemosphere. 145 (2016) 409–415.
doi:10.1016/j.chemosphere.2015.11.108.
[182] C.K. Duesterberg, S.E. Mylon, T.D. Waite, pH Effects on Iron-Catalyzed Oxidation
using Fenton’s Reagent, Environ. Sci. Technol. 42 (2008) 8522–8527.
doi:10.1021/es801720d.
[183] M. Pérez, Fenton and photo-Fenton oxidation of textile effluents, Water Res. 36 (2002)
2703–2710. doi:10.1016/S0043-1354(01)00506-1.
[184] E. Elmolla, M. Chaudhuri, Optimization of Fenton process for treatment of
amoxicillin, ampicillin and cloxacillin antibiotics in aqueous solution., J. Hazard.
Mater. 170 (2009) 666–72. doi:10.1016/j.jhazmat.2009.05.013.
[185] M.S. Saghafinia, S.M. Emadian, M. Vossoughi, Performances Evaluation of Photo-
Fenton Process and Sonolysis for the Treatment of Penicillin G Formulation Effluent,
Procedia Environ. Sci. 8 (2011) 202–208. doi:10.1016/j.proenv.2011.10.033.
[186] R. Bauer, H. Fallmann, The Photo-Fenton Oxidation --- A cheap and efficient
wastewater treatment method, Res. Chem. Intermed. 23 (1997) 341–354.
doi:10.1163/156856797X00565.
[187] N. Koprivanac, H. Kusic, AOP as an Effective tool for the Minimization of Hazardous
Organic Pollutants in Colored Wastewater; Chemical and Photochemical Processes;,
in: Hazard. Mater. Wastewater Treat. Remov. Anal., 2006: pp. 149–199.
[188] European Commission, Council Directive 76/464/EEC, (2006).
http://ec.europa.eu/environment/water/water-dangersub/lib_dang_substances.htm.
[189] F. Velichkova, Vers un procédé Fenton hétérogène pour le traitement en continu d’eau
polluée par des polluants pharmaceutiques, (2014). http://ethesis.inp-
toulouse.fr/archive/00002806/ (accessed December 1, 2016).
[190] O.A. Makhotkina, E.V. Kuznetsova, S.V. Preis, Catalytic detoxification of 1,1-
dimethylhydrazine aqueous solutions in heterogeneous Fenton system, Appl. Catal. B
Environ. 68 (2006) 85–91. doi:10.1016/j.apcatb.2006.07.008.
[191] R. Gonzalez-Olmos, U. Roland, H. Toufar, F.-D. Kopinke, A. Georgi, Fe-zeolites as
catalysts for chemical oxidation of MTBE in water with H2O2, Appl. Catal. B
Environ. 89 (2009) 356–364. doi:10.1016/j.apcatb.2008.12.014.
[192] P.R. Gogate, Treatment of wastewater streams containing phenolic compounds using
hybrid techniques based on cavitation: a review of the current status and the way
forward, Ultrason. Sonochem. 15 (2008) 1–15.
[193] M. Dükkanci, G. Gündüz, S. Yilmaz, R. V Prihod’ko, Heterogeneous Fenton-like
degradation of Rhodamine 6G in water using CuFeZSM-5 zeolite catalyst prepared by
hydrothermal synthesis., J. Hazard. Mater. 181 (2010) 343–50.
doi:10.1016/j.jhazmat.2010.05.016.
[194] T. Mason, J. Lorimer, Applied Sonochemistry: Uses of Power Ultrasound in
Chemistry and Processing, 2002.
[195] B. Darsinou, Z. Frontistis, M. Antonopoulou, I. Konstantinou, D. Mantzavinos, Sono-
activated persulfate oxidation of bisphenol A: Kinetics, pathways and the controversial
role of temperature, Chem. Eng. J. 280 (2015) 623–633.
doi:10.1016/j.cej.2015.06.061.
[196] K. Rusevova, F.-D. Kopinke, A. Georgi, Nano-sized magnetic iron oxides as catalysts
for heterogeneous Fenton-like reactions-Influence of Fe(II)/Fe(III) ratio on catalytic
performance., J. Hazard. Mater. 241–242 (2012) 433–40.
doi:10.1016/j.jhazmat.2012.09.068.
[197] L. Szpyrkowicz, C. Juzzolino, S.N. Kaul, A Comparative study on oxidation of

S. Adityosulindro (2017) / Doctoral Thesis / INP Toulouse
REFERENCES
239
disperse dyes by electrochemical process, ozone, hypochlorite and fenton reagent,
Water Res. 35 (2001) 2129–2136. doi:10.1016/S0043-1354(00)00487-5.
[198] L. Wang, J. Yang, Y. Li, J. Lv, J. Zou, Removal of chlorpheniramine in a nanoscale
zero-valent iron induced heterogeneous Fenton system: Influencing factors and
degradation intermediates, Chem. Eng. J. 284 (2016) 1058–1067.
doi:10.1016/j.cej.2015.09.042.
[199] X.-R. Xu, X.-Y. Li, X.-Z. Li, H.-B. Li, Degradation of melatonin by UV, UV/H2O2,
Fe2+/H2O2 and UV/Fe2+/H2O2 processes, Sep. Purif. Technol. 68 (2009) 261–266.
doi:10.1016/j.seppur.2009.05.013.
[200] B.G. Kwon, D.S. Lee, N. Kang, J. Yoon, Characteristics of p-chlorophenol oxidation
by Fenton’s reagent, Water Res. 33 (1999) 2110–2118. doi:10.1016/S0043-
1354(98)00428-X.
[201] J. Weitkamp, Zeolite and catalysis, Solid State Ionics. 131 (2000) 175–188.
doi:http://dx.doi.org/10.1016/S0167-2738(00)00632-9.
[202] Y.G. Adewuyi, Sonochemistry in Environmental Remediation. 2. Heterogeneous
Sonophotocatalytic Oxidation Processes for the Treatment of Pollutants in Water,
Environ. Sci. Technol. 39 (2005) 8557–8570. doi:10.1021/es0509127.
[203] L. Gomathi Devi, S. Girish Kumar, K. Mohan Reddy, C. Munikrishnappa, Photo
degradation of methyl orange an azo dye by advanced Fenton process using zero
valent metallic iron: influence of various reaction parameters and its degradation
mechanism., J. Hazard. Mater. 164 (2009) 459–67. doi:10.1016/j.jhazmat.2008.08.017.
[204] W. Najjar, S. Azabou, S. Sayadi, A. Ghorbel, Catalytic wet peroxide photo-oxidation
of phenolic olive oil mill wastewater contaminants, Appl. Catal. B Environ. 74 (2007)
11–18. doi:10.1016/j.apcatb.2007.01.007.
[205] T. Sivasankar, V.S. Moholkar, Mechanistic approach to intensification of
sonochemical degradation of phenol, Chem. Eng. J. 149 (2009) 57–69.
doi:10.1016/j.cej.2008.10.004.
[206] E.A. Neppiras, Acoustic cavitation, Phys. Rep. 61 (1980) 159–251. doi:10.1016/0370-
1573(80)90115-5.
[207] H. Shemer, Y.K. Kunukcu, K.G. Linden, Degradation of the pharmaceutical
metronidazole via UV, Fenton and photo-Fenton processes., Chemosphere. 63 (2006)
269–76. doi:10.1016/j.chemosphere.2005.07.029.
[208] A. Tomašević, E. Kiss, S. Petrović, D. Mijin, Study on the photocatalytic degradation
of insecticide methomyl in water, Desalination. 262 (2010) 228–234.
doi:10.1016/j.desal.2010.06.019.
[209] C. Lee, J. Yoon, Temperature dependence of hydroxyl radical formation in the
hv/Fe3+/H2O2 and Fe3+/H2O2 systems., Chemosphere. 56 (2004) 923–34.
doi:10.1016/j.chemosphere.2004.04.047.
[210] L. Snyder, J. Kirkland, J. Dolan, Introduction to Modern Liquid Chromatography 3rd
Edition, 2010.
[211] ThermoFisher Scientific, Mass Analyzer Technology Overview, (2017).
https://www.thermofisher.com/fr/fr/home/industrial/mass-spectrometry/mass-
spectrometry-learning-center/mass-spectrometry-technology-overview/mass-analyzer-
technology-overview.html (accessed January 22, 2017).
[212] Shimadzu, TOC-L TOC Analyzer : SHIMADZU, (2014).
http://www.shimadzu.com/an/toc/lab/toc-l4.html (accessed March 22, 2014).
[213] J. Rodier, B. Legube, N. Merlet, R. Brunet, L’analyse de l’eau - 9ème édition - Eaux
naturelles, eaux résiduaires, eau de mer: Eaux naturelles, eaux résiduaires, eau de mer,
Dunod, 2009.
[214] D.W. O’Sullivan, M. Tyree, The kinetics of complex formation between Ti(IV) and

S. Adityosulindro (2017) / Doctoral Thesis / INP Toulouse
REFERENCES
240
hydrogen peroxide, Int. J. Chem. Kinet. 39 (2007) 457–461.
[215] C. Boss, K. Fredeen, Concepts, Instrumentation and Techniques in Inductively
Coupled Plasma Optical. Emission Spectrometr, Perkin Elmer, 1997.
[216] Purdue University, Scanning Electron Microscope, (2014).
https://www.purdue.edu/ehps/rem/rs/sem.htm (accessed January 24, 2017).
[217] J.-Y. Park, Y.-J. Lee, P.K. Khanna, K.-W. Jun, J.W. Bae, Y.H. Kim, Alumina-
supported iron oxide nanoparticles as Fischer–Tropsch catalysts: Effect of particle size
of iron oxide, J. Mol. Catal. A Chem. 323 (2010) 84–90.
doi:10.1016/j.molcata.2010.03.025.
[218] S.G. Marchetti, M.V. Cagnoli, J.F. Bengoa, R.C. Mercader, A.A. Yeramián, Study of
the Fe/Zeolite-L system Part II: CO and H2 chemisorption behavior, Appl Surf Sci.
165 (2000) 100–108.
[219] J.S. Noh, J.A. Schwarz, Estimation of the point of zero charge of simple oxides by
mass titration, J. Colloid Interface Sci. 130 (1989) 157–164. doi:10.1016/0021-
9797(89)90086-6.
[220] BASF, Ibuprofen 38 - Technical information, (2010) 14. http://www.pharma-
ingredients.basf.com/Statements/Technical Informations/EN/Pharma
Solutions/03_030720e_Ibuprofen.pdfRjU6vmF4zaygPqx4HQCQ&usg=AFQjCNGtAs
eHO35b7LLCTlPs4Qfg30zvLA&sig2=Djk-
8JNE5hRssyO0b5Wi8A&bvm=bv.65788261,d.bGQ.
[221] S. Miralles-Cuevas, A. Arqués, M.I. Maldonado, J. a. Sánchez-Pérez, S. Malato
Rodríguez, Combined nanofiltration and photo-Fenton treatment of water containing
micropollutants, Chem. Eng. J. 224 (2013) 89–95. doi:10.1016/j.cej.2012.09.068.
[222] R. Andreozzi, Advanced oxidation processes (AOP) for water purification and
recovery, Catal. Today. 53 (1999) 51–59. doi:10.1016/S0920-5861(99)00102-9.
[223] G. Gonzalez, A. Sagarzazu, T. Zoltan, Infuence of Microstructure in Drug Release
Behavior of Silica Nanocapsules, J. Drug Deliv. 2013 (2013) 1–8.
doi:10.1155/2013/803585.
[224] E. Carmona, V. Andreu, Y. Picó, Occurrence of acidic pharmaceuticals and personal
care products in Turia River Basin: From waste to drinking water, Sci. Total Environ.
484 (2014) 53–63. doi:10.1016/j.scitotenv.2014.02.085.
[225] A.S. Mestre, J. Pires, J.M.F. Nogueira, A.P. Carvalho, Activated carbons for the
adsorption of ibuprofen, Carbon N. Y. 45 (2007) 1979–1988.
doi:10.1016/j.carbon.2007.06.005.
[226] B. Thokchom, K. Kim, J. Park, J. Khim, Ultrasonically enhanced electrochemical
oxidation of ibuprofen., Ultrason. Sonochem. 22 (2015) 429–36.
doi:10.1016/j.ultsonch.2014.04.019.
[227] S. Yalkowsky, Y. He, P. Jain, Handbook of Aqueous Solubility Data, Second Edition,
2010.
[228] K.D. Ertel, R.A. Heasley, C. Koegel, A. Chakrabarti, J.T. Carstensen, Determination
of ibuprofen vapor pressure at temperatures of pharmaceutical interest, J. Pharm. Sci.
79 (2016) 552. doi:10.1002/jps.2600790620.
[229] R. Xiao, M. Noerpel, H. Ling Luk, Z. Wei, R. Spinney, Thermodynamic and kinetic
study of ibuprofen with hydroxyl radical: A density functional theory approach, Int. J.
Quantum Chem. 114 (2014) 74–83. doi:10.1002/qua.24518.
[230] HERA, Hydrogen Peroxide, (2005). http://www.heraproject.com/files/36-f-05-
shor_h2o2_version1.pdf.
[231] Sigma-Aldrich, H2O2, (2017).
http://www.sigmaaldrich.com/catalog/product/sial/95294?lang=fr®ion=FR
(accessed February 10, 2017).

S. Adityosulindro (2017) / Doctoral Thesis / INP Toulouse
REFERENCES
241
[232] Chemspider, Iron(II) sulfate heptahydrate, (n.d.).
http://www.chemspider.com/Chemical-Structure.56413.html (accessed February 10,
2017).
[233] Chemical Book, Ferrous sulfate heptahydrate, (2016).
http://www.chemicalbook.com/ChemicalProductProperty_EN_CB9232125.htm
(accessed February 10, 2017).
[234] S.M. Auerbach, K.A. Carrado, P.K. Dutta, Handbook of Zeolite Science and
Technology, CRC Press, 2003.
[235] S. Giannakis, S. Papoutsakis, E. Darakas, A. Escalas-Cañellas, C. Pétrier, C. Pulgarin,
Ultrasound enhancement of near-neutral photo-Fenton for effective E. coli inactivation
in wastewater, Ultrason. Sonochem. 22 (2015) 515–26.
[236] T.J. Mason, J.P. Lorimer, D.M. Bates, Quantifying sonochemistry: Casting some light
on a “black art,” Ultrasonics. 30 (1992) 40–42.
[237] S. Song, L. Zhan, Z. He, L. Lin, J. Tu, Z. Zhang, et al., Mechanism of the anodic
oxidation of 4-chloro-3-methyl phenol in aqueous solution using Ti/SnO2-Sb/PbO2
electrodes., J. Hazard. Mater. 175 (2010) 614–21. doi:10.1016/j.jhazmat.2009.10.051.
[238] S.T. Martin, A.T. Lee, M.R. Hoffmann, Chemical mechanism of inorganic oxidants in
the TiO2/UV process: Increased rates of degradation of chlorinated hydrocarbons,
Environ. Sci. Technol. 29 (1995) 2567–2573.
[239] L. Xu, J. Wang, A heterogeneous Fenton-like system with nanoparticulate zero-valent
iron for removal of 4-chloro-3-methyl phenol., J. Hazard. Mater. 186 (2011) 256–64.
doi:10.1016/j.jhazmat.2010.10.116.
[240] I. Oller, S. Malato, J.A. Sánchez-Pérez, Combination of advanced oxidation processes
and biological treatments for wastewater decontamination-a review, Sci. Total
Environ. 409 (2011) 4141–4166.
[241] S.O. Ganiyu, E.D. van Hullebusch, M. Cretin, G. Esposito, M.A. Oturan, Coupling of
membrane filtration and advanced oxidation processes for removal of pharmaceutical
residues: A critical review, Sep. Purif. Technol. 156 (2015) 891–914.
[242] F. Torrades, J. García-Montaño, Using central composite experimental design to
optimize the degradation of real dye wastewater by Fenton and photo-Fenton reactions,
Dye. Pigment. 100 (2014) 184–189. doi:10.1016/j.dyepig.2013.09.004.
[243] M. V. Bagal, P.R. Gogate, Wastewater treatment using hybrid treatment schemes
based on cavitation and Fenton chemistry: a review, Ultrason. Sonochem. 21 (2014) 1–
14.
[244] J.-W. Kang, H.-M. Hung, A. Lin, M.R. Hoffmann, Sonolytic Destruction of Methyl
tert-Butyl Ether by Ultrasonic Irradiation: The Role of O3, H2O2, Frequency, and
Power Density, Environ. Sci. Technol. 33 (1999) 3199–3205. doi:10.1021/es9810383.
[245] P.R. Gogate, Cavitation: an auxiliary technique in wastewater treatment schemes, Adv.
Environ. Res. 6 (2002) 335–358. doi:10.1016/S1093-0191(01)00067-3.
[246] INERIS, 1-hydroxy-ibuprofene, (2012).
http://www.ineris.fr/substances/fr/substance/2916 (accessed December 1, 2016).
[247] INERIS, Données technico-économiques sur les substances chimiques en France :
Ibuprofène, DRC-11-118962-11078A, 2011.
[248] R. Xiao, D. Diaz-Rivera, Z. He, L.K. Weavers, Using pulsed wave ultrasound to
evaluate the suitability of hydroxyl radical scavengers in sonochemical systems,
Ultrason. Sonochem. 20 (2013) 990–996.
[249] P. Villegas-Guzman, J. Silva-Agredo, A.L. Giraldo-Aguirre, O. Flórez-Acosta, C.
Petrier, R.A. Torres-Palma, Enhancement and inhibition effects of water matrices
during the sonochemical degradation of the antibiotic dicloxacillin, Ultrason.
Sonochem. 22 (2015) 211–219.

S. Adityosulindro (2017) / Doctoral Thesis / INP Toulouse
REFERENCES
242
[250] P.R. Gogate, V.S. Sutkar, A.B. Pandit, Sonochemical reactors: Important design and
scale up considerations with a special emphasis on heterogeneous systems, Chem. Eng.
J. 166 (2011) 1066–1082.
[251] M.A. Beckett, I. Hua, Impact of ultrasonic frequency on aqueous sonoluminescence
and sonochemistry, J. Phys. Chem. A. 105 (2001) 3796–3802.
[252] C. Pétrier, D. Casadonte, The sonochemical degradation of aromatic and
chloroaromatic contaminants, Adv. Sonochemistry. 6 (2001) 92–108.
[253] H. Delmas, N.T. Le, L. Barthe, C. Julcour-Lebigue, Optimization of hydrostatic
pressure at varied sonication conditions – power density, intensity, very low frequency
– for isothermal ultrasonic sludge treatment, Ultrason. Sonochem. 25 (2015) 51–59.
doi:10.1016/j.ultsonch.2014.08.011.
[254] G. V. Buxton, C.L. Greenstock, W.P. Helman, A.B. Ross, Critical review of rate
constants for reactions of hydrated electrons, hydrogen atoms and hydroxyl radicals
(⋅OH/⋅O − in Aqueous Solution, J. Phys. Chem. Ref. Data. 17 (1988) 513–886.
doi:10.1063/1.555805.
[255] Pubchem, Hydrogen peroxide, (2017).
https://pubchem.ncbi.nlm.nih.gov/compound/hydrogen_peroxide#section=Top
(accessed January 16, 2016).
[256] M.C. DeRosa, R.J. Crutchley, Photosensitized singlet oxygen and its applications,
Coord. Chem. Rev. 233 (2002) 351–371. doi:10.1016/S0010-8545(02)00034-6.
[257] B.A. Wols, C.H.M. Hofman-Caris, Review of photochemical reaction constants of
organic micropollutants required for UV advanced oxidation processes in water.,
Water Res. 46 (2012) 2815–27. doi:10.1016/j.watres.2012.03.036.
[258] M. Marković, M. Jović, D. Stanković, V. Kovačević, G. Roglić, G. Gojgić-Cvijović, et
al., Application of non-thermal plasma reactor and Fenton reaction for degradation of
ibuprofen, Sci. Total Environ. 505 (2015) 1148–55.
[259] P.. Malik, S.. Saha, Oxidation of direct dyes with hydrogen peroxide using ferrous ion
as catalyst, Sep. Purif. Technol. 31 (2003) 241–250. doi:10.1016/S1383-
5866(02)00200-9.
[260] S.A. Hamburger, P.B. McCay, Spin Trapping of Ibuprofen Radicals: Evidence That
Ibuprofen is a Hydroxyl Radical Scavenger, Free Radic. Res. Commun. 9 (1990) 337–
342. doi:10.3109/10715769009145692.
[261] T.P. Kennedy, N. V Rao, W. Noah, J.R. Michael, M.H. Jafri, G.H. Gurtner, et al.,
Ibuprofen prevents oxidant lung injury and in vitro lipid peroxidation by chelating
iron., J. Clin. Invest. 86 (1990) 1565–1573.
[262] C.G. Joseph, G. Li Puma, A. Bono, D. Krishnaiah, Sonophotocatalysis in advanced
oxidation process: a short review., Ultrason. Sonochem. 16 (2009) 583–9.
doi:10.1016/j.ultsonch.2009.02.002.
[263] L.J. Xu, W. Chu, N. Graham, Sonophotolytic degradation of dimethyl phthalate
without catalyst: analysis of the synergistic effect and modeling., Water Res. 47 (2013)
1996–2004.
[264] F. Zaviska, P. Drogui, E.M. El Hachemi, E. Naffrechoux, Effect of nitrate ions on the
efficiency of sonophotochemical phenol degradation, Ultrason. Sonochem. 21 (2014)
69–75. doi:10.1016/j.ultsonch.2013.08.003.
[265] M.P. Rayaroth, U.K. Aravind, C.T. Aravindakumar, Degradation of pharmaceuticals
by ultrasound-based advanced oxidation process, Environ. Chem. Lett. 14 (2016) 259–
290.
[266] S. Loaiza-Ambuludi, M. Panizza, N. Oturan, M.A. Oturan, Removal of the anti-
inflammatory drug ibuprofen from water using homogeneous photocatalysis, Catal.
Today. 224 (2014) 29–33. doi:10.1016/j.cattod.2013.12.018.

S. Adityosulindro (2017) / Doctoral Thesis / INP Toulouse
REFERENCES
243
[267] L.K. Weavers, F.H. Ling, M.R. Hoffmann, Aromatic Compound Degradation in Water
Using a Combination of Sonolysis and Ozonolysis, Environ. Sci. Technol. 32 (1998)
2727–2733. doi:10.1021/es970675a.
[268] M. Skoumal, R.M. Rodríguez, P.L. Cabot, F. Centellas, J.A. Garrido, C. Arias, et al.,
Electro-Fenton, UVA photoelectro-Fenton and solar photoelectro-Fenton degradation
of the drug ibuprofen in acid aqueous medium using platinum and boron-doped
diamond anodes, Electrochim. Acta. 54 (2009) 2077–2085.
doi:10.1016/j.electacta.2008.07.014.
[269] G. Caviglioli, P. Valeria, P. Brunella, C. Sergio, A. Attilia, B. Gaetano, Identification
of degradation products of Ibuprofen arising from oxidative and thermal treatments, J.
Pharm. Biomed. Anal. 30 (2002) 499–509. doi:10.1016/S0731-7085(02)00400-4.
[270] L.E. Jacobs, R.L. Fimmen, Y.-P. Chin, H.E. Mash, L.K. Weavers, Fulvic acid
mediated photolysis of ibuprofen in water., Water Res. 45 (2011) 4449–58.
doi:10.1016/j.watres.2011.05.041.
[271] J. V. Castell, M.J. Gomez-L., M.A. Miranda, I.M. Morera, Photolytic degradation of
ibuprofen. Toxicity of the isolated photoproducts on fibroblasts and erythrocytes,
Photochem. Photobiol. 46 (1987) 991–996. doi:10.1111/j.1751-1097.1987.tb04882.x.
[272] H. Gong, W. Chu, S.H. Lam, A.Y.-C. Lin, Ibuprofen degradation and toxicity
evolution during Fe2+/Oxone/UV process, Chemosphere. 167 (2017) 415–421.
doi:10.1016/j.chemosphere.2016.10.027.
[273] M. Tokumura, A. Sugawara, M. Raknuzzaman, M. Habibullah-Al-Mamun, S.
Masunaga, Comprehensive study on effects of water matrices on removal of
pharmaceuticals by three different kinds of advanced oxidation processes,
Chemosphere. 159 (2016) 317–325. doi:10.1016/j.chemosphere.2016.06.019.
[274] T.E. Doll, F.H. Frimmel, Photocatalytic degradation of carbamazepine, clofibric acid
and iomeprol with P25 and Hombikat UV100 in the presence of natural organic matter
(NOM) and other organic water constituents, Water Res. 39 (2005) 403–411.
doi:10.1016/j.watres.2004.09.016.
[275] M. Neamţu, D. Grandjean, A. Sienkiewicz, S. Le Faucheur, V. Slaveykova, J.J.V.
Colmenares, et al., Degradation of eight relevant micropollutants in different water
matrices by neutral photo-Fenton process under UV254 and simulated solar light
irradiation – A comparative study, Appl. Catal. B Environ. 158 (2014) 30–37.
doi:10.1016/j.apcatb.2014.04.001.
[276] A.O. Yazaydin, R.W. Thompson, Molecular simulation of the adsorption of mtbe in
silicalite, mordenite, and zeolite beta, J. Phys. Chem. B. 110 (2006) 14458–14462.
[277] K.A. Sashkina, E.V. Parkhomchuk, N.A. Rudina, V.N. Parmon, The role of zeolite Fe-
ZSM-5 porous structure for heterogeneous Fenton catalyst activity and stability,
Microporous Mesoporous Mater. 189 (2014) 181–188.
doi:10.1016/j.micromeso.2013.11.033.
[278] L. Sanchez-Prado, R. Barro, C. Garcia-Jares, M. Llompart, M. Lores, C. Petrakis, et
al., Sonochemical degradation of triclosan in water and wastewater, 2008.
doi:10.1016/j.ultsonch.2008.01.007.
[279] O.B. Mathre, Destruction of cyanide in aqueous solutions, 1971.
[280] E. Yazici, H. Deveci, Factors affecting decomposition of hydrogen peroxide, in: Proc.
XII Th Int. Miner. Process. Symp., 2010: pp. 609–616.
doi:10.13140/RG.2.1.1530.0648.
[281] J.K. Kim, F. Martinez, I.S. Metcalfe, The beneficial role of use of ultrasound in
heterogeneous Fenton-like system over supported copper catalysts for degradation of
p-chlorophenol, Catal. Today. 124 (2007) 224–231. doi:10.1016/j.cattod.2007.03.040.
[282] G. Zhang, I. Hua, The impact of particulates on the aqueous sonication of

S. Adityosulindro (2017) / Doctoral Thesis / INP Toulouse
REFERENCES
244
bromobenzene, Chemosphere. 46 (2002) 59–66. doi:10.1016/S0045-6535(01)00079-0.
[283] J. Hartmann, P. Bartels, U. Mau, M. Witter, W. V Tümpling, J. Hofmann, et al.,
Degradation of the drug diclofenac in water by sonolysis in presence of catalysts.,
Chemosphere. 70 (2008) 453–61. doi:10.1016/j.chemosphere.2007.06.063.
[284] A. Keck, E. Gilbert, R. Köster, Influence of particles on sonochemical reactions in
aqueous solutions, Ultrasonics. 40 (2002) 661–665. doi:10.1016/S0041-
624X(02)00195-6.
[285] A. Grönroos, H. Kyllönen, K. Korpijärvi, P. Pirkonen, T. Paavola, J. Jokela, et al.,
Ultrasound assisted method to increase soluble chemical oxygen demand (SCOD) of
sewage sludge for digestion, Ultrason. Sonochem. 12 (2005) 115–120.
doi:10.1016/j.ultsonch.2004.05.012.
[286] S.J. Doktycz, K.S. Suslick, Interparticle collisions driven by ultrasound, Science (80-.
). 247 (1990) 1067–1069.
[287] K.S. Suslick, S.J. Doktycz, E.B. Flint, On the origin of sonoluminescence and
sonochemistry, Ultrasonics. 28 (1990) 280–290.
[288] T. Leong, M. Ashokkumar, S. Kentish, The fundamentals of power ultrasound - A
Review, Acoust. Aust. 39 (2011) 54–63.
[289] T.J. Mason, Practical sonochemistry: user’s guide to applications in chemistry and
chemical engineering, E. Horwood, 1991.
[290] M. Bobu, A. Yediler, I. Siminiceanu, S. Schulte-Hostede, Degradation studies of
ciprofloxacin on a pillared iron catalyst, Appl. Catal. B Environ. 83 (2008) 15–23.
doi:10.1016/j.apcatb.2008.01.029.
[291] J. Deng, J. Jiang, Y. Zhang, X. Lin, C. Du, Y. Xiong, FeVO4 as a highly active
heterogeneous Fenton-like catalyst towards the degradation of Orange II, Appl. Catal.
B Environ. 84 (2008) 468–473. doi:10.1016/j.apcatb.2008.04.029.
[292] K.S. Suslick, D.J. Casadonte, Heterogeneous sonocatalysis with nickel powder, J. Am.
Chem. Soc. 109 (1987) 3459–3461. doi:10.1021/ja00245a047.
[293] P. Forzatti, Catalyst deactivation, Catal. Today. 52 (1999) 165–181.
doi:10.1016/S0920-5861(99)00074-7.

APPENDIX

This page is intentionally left blank
Figure I. Separation of IBP and transformation products by HPLC/UV
Figure II. Calibration curve of ibuprofen
y = 3.5064x + 0.0598
R² = 0.9999
0
10
20
30
40
50
60
70
80
0 5 10 15 20
Ch
rom
ato
gra
m a
rea (
mA
U.m
in)
Ibuprofen (mg/L)
Ibuprofen (IBP)
4-isobutylacetophenone
2-hydroxy-IBP
1-hydroxy-IBP

Figure III. Calibration curve of total carbon (TC)
Figure IV. Calibration curve of inorganic carbon (IC)
y = 2.4057x + 0.7482
R² = 0.9998
0
4
8
12
16
20
0 1 2 3 4 5 6 7
Pea
k a
rea (
mV
.min
)
Total carbon (mg/L)
y = 29.809x + 8.1919
R² = 0.9995
0
10
20
30
40
50
60
70
0 0.2 0.4 0.6 0.8 1 1.2 1.4 1.6 1.8 2
Pea
k a
rea (
mV
.min
)
Inorganic carbon (mg/L)

Figure V. Calibration curve of hydrogen peroxide (H2O2)
y = 0.6582x + 0.0088
R² = 0.9998
0
0.2
0.4
0.6
0.8
1
1.2
1.4
0 0.5 1 1.5 2
Ab
sorb
an
ce
Hydrogen peroxide (mM)

Figure VI. Example of experiment with error bars
Degradation of IBP by Fenton oxidation: (A) IBP and (B) TOC concentration-time profiles, and (C) H2O2 consumption
([IBP]0 = 20 mg/L, pH0 = 2.6, T = 25°C, [Fe2+]0 = 0.134 mM and [H2O2]0 = 6.4 mM)
0.0
0.2
0.4
0.6
0.8
1.0
0 30 60 90 120 150 180
IBP
/IB
Po
Time (min)
A
F(+)
0.0
0.2
0.4
0.6
0.8
1.0
0 30 60 90 120 150 180
TO
C/T
OC
o
Time(min)
B
F(+)
0
2
4
6
8
F(+)
[H2O
2] (m
M)
C
Consumed
Remaining