Embed Size (px)
Citation preview
Jurnal Ekonomi Malaysia 51(2) 2017 47 - 62http://dx.doi.org/10.17576/JEM-2017-5001-5
Does Cost Efficiency Affect Liquidity Risk in Banking? Evidence from Selected OIC Countries
(Adakah Kos Kecekapan Mempengaruhi Risiko Kecairan dalam Perbankan? Bukti dari Negara-negara OIC Terpilih)
Syajarul Imna Mohd AminUniversiti Kebangsaan Malaysia
Shamsher Mohamad Mohamed Eskandar Shah
International Centre for Education in Islamic Finance (INCEIF)
ABSTRACT
Cost efficiency plays a significant role in bank risk taking behaviour. This paper examines the effect of cost efficiency on the liquidity risk of Islamic banks and conventional banks in 16 OIC countries from 1999 to 2013. The findings suggest that cost efficiency has a positive effect on liquidity risk. Other significant factors of liquidity risk include capital, bank specialization, credit risk, profitability, size, GDP and inflation whereas market concentration is not significant contributor to banking liquidity risk. There is weak evidence to support the notion that Islamic banks have higher level of liquidity risk than conventional banks. The findings imply the need to provide liquidity, probably through a well-functioning money market to lower liquidity risk in banking.
Keywords: Cost efficiency; Islamic banking; liquidity risk
ABSTRAK
Kecekapan kos memainkan peranan penting dalam gelagat pengambilan risiko bank. Kertas ini mengkaji kesan kecekapan kos terhadap risiko kecairan perbankan Islam dan konvensional di 16 negara-negara OIC dari 1999 hingga 2013. Hasil kajian menunjukkan kecekapan kos memberi kesan positif ke atas risiko kecairan. Faktor-faktor signifikan lain yang mempengaruhi risiko kecairan termasuklah modal, pengkhususan bank, risiko kredit, keuntungan, saiz, pertumbuhan GDP dan inflasi, manakala faktor penumpuan pasaran adalah tidak signifikan. Terdapat bukti yang tidak kukuh untuk menyokong anggapan bahawa risiko kecairan perbankan Islam lebih tinggi berbanding perbankan konvensional. Hasil kajian menggambarkan keperluan untuk menyediakan kecairan, melalui pasaran wang yang mapan untuk mengurangkan risiko kecairan perbankan.
Kata kunci: Kecekapan kos; perbankan Islam; risiko kecairan
INTRODUCTION
Despite its double digit growth outpacing the conventional counterparts, Islamic banks face constraints in managing liquidity risk (Ali 2013; Mohammad et al. 2013). In the absence of financial market liquidity1, activities involving asset marketability and fund raising incurs uncompetitive cost to Islamic banks. These limitations limit their lending and investment activities that potentially reduce profitability compared their conventional peers. The literature suggests that although Islamic banks were resilient to the adversities of the 2008 crisis, the subsequent tightening of liquidity and credit in the global financial system had adversely affected a large number of financial institutions including Islamic banks (Ali 2013; Beck et al. 2013; Hasan & Dridi 2010). A main concern highlighted from this evidence is the need for prudential liquidity risk management in Islamic banking specifically
and the banking sector in general. For economies which are much dependent on the banking sector to provide funding for investments and growth, constraints on banking liquidity will consequence in financial instability. This paper attempts to address the issue of determinants of liquidity risk that is unique to Islamic banking.
Beck et al. (2013) explained that Islamic banks hold higher liquidity to buffer against short-term obligations compared to conventional banks due to their limitation of liquidity management facility. Consequently, the higher costs of holding liquidity reduces profits and hence expected performance. On the contrary, evidence show that Islamic banks have higher profitability than conventional banks both in normal times (Ramlan & Adnan 2016; Siraj & Pillai 2012) and crisis periods (Bourkhis & Nabi 2013). One explanation to reconcile this inconsistency is the better cost efficiency in the Islamic banking institutions. Although Islamic banks
JEM 51(2)Dis 2017 05.indd 47 3/27/18 1:23 PM
48 Jurnal Ekonomi Malaysia 51(2)
operate alongside the conventional banks, their different principles, risk profile and regulatory framework (Turk-Ariss 2010) could impact their level of cost efficiency and liquidity risk differently from their conventional peers.
The evidence on the role of cost efficiency in explaining conventional bank risk taking behaviour is inconclusive. Some studies found that efficiency result in low bank risk (Berger & De Young 1997; Miah & Sharmeen 2015; Rossi et al. 2005; William 2004) while others (Alam 2012; Fiordelisi et al. 2009) show that efficiency encourage bank risk taking. Emerging studies focusing on efficiency-liquidity risk relationship found mix evidence (Altunbas et al. 2000, 2007; Brissimis et al. 2008; Khalib et al. 2016; Radic et al. 2012; Said 2013; Sarmiento & Galan 2015).To date, no comprehensive evidence had been documented as to whether efficiency differences between bank types have any influence on their risk and performance. This paper examines the impact of cost efficiency on liquidity risk in conventional and Islamic banks especially across a large sample of OIC countries. Most previous studies examined the impact of liquidity risk on efficiency and not the impact of efficiency on liquidity risk.
Altunbas et al. (2007) documented positive efficiency-liquidity risk relationship in both directions. While Khalib et al. (2016) found efficiency has no significantly related with liquidity risk in short term but negatively related in long term. This paper differs from Altunbas et al. (2007) and Khalib et al. (2016) studies in several aspects. First, they focused only on conventional European banks from 1992 to 2000 (Altunbas et al. 2007) and banks in Malaysia (Khalib et al. 2016), we focus on the difference between Islamic banks and conventional banks in selected 16 OIC countries from 1999 to 2013. This is important as the role of institutional factors do expose Islamic banks into different levels of efficiency that could have resultant impact on their liquidity risk differently from their conventional counterparts. Second, we focus on cross-countries study that largely from emerging countries. Third, while their study measured efficiency using the parametric Stochastic Frontier Analysis (SFA), we used the non-parametric Data Envelopment Analysis (DEA). The advantages of using DEA to compute efficiency are: 1) it imposes neither assumptions about the distributional and the functional form of the frontier nor the random error, minimizing the specification errors; 2) unlike the econometrics that entails a large sample to ensure statistical reliability, DEA
can accommodate small sample units and provide more accurate measure of relative efficiency especially in the case of Islamic banks with limited data and imperfection of developing countries (Bhattacharyya et al.1997).
The findings of this paper contribute to the literature in significant ways. First, this paper offers empirical evidence on the link between efficiency and liquidity risk as an extension of knowledge on determinants of liquidity risk in banking. Second, it provides evidence
that some liquidity risk determinants are specific to the different banking approach (i.e. Islamic banks vs. conventional banks. Third, the findings highlight the need of mechanisms that could enhance the liquidity requirements of the Islamic banks, for instance liquid money market. Section 2 provides a brief review of related literature, section 3 discusses the data and the methodology and section 4 summarizes findings and implications.
LITERATURE REVIEW
Berger & Humphrey (1997) highlights three main approaches of banking activities including asset approach (intermediation approach), production approach (value added approach) and user-cost approach. The intermediation approach considers banks as financial intermediaries between depositors and debtors. Banks transforms deposits and other borrowed funds into loans and other assets by making use of physical capital and labour. This approach assumes loans and other earning assets as outputs; while deposits along with capital and labour are categorized as inputs (Sealey & Lindley 1977). The value added approach assumes that liability and asset share the same output characteristics, depending on the substantial value added that each category contributes. Otherwise, it is considered either as inputs or intermediate products. Based on value added approach, bank is a producer of services (outputs) to account holders. As such loans, other assets and transaction deposit accounts are treated as outputs while capital, labour, and interest expenses as inputs.
The user-cost approach assumes that inputs and outputs characteristic are determined based on their net contribution to the bank income (Hancock 1991). If the earning of an asset is more than the opportunity cost of funds (or if the cost of a liability is less than the opportunity cost), then they are considered as outputs, or else, they are assumed as inputs. For instance, under this rule, demand deposit is regarded as output since its stated rates usually below the money market rates; while time deposit is considered as input as its rates are usually higher than market rates. Nevertheless, the user-cost approach has some restrictions such that the input and output classification is subject to significant measurement error2. Following this, many studies examined bank efficiency in local country (Rozzani & Abdul Rahman 2013; Sufian 2007a, b, 2009, 2011) and in multiple countries (Al-Jarrah & Molyneux 2007; Bader et al. 2007; Johnes et al. 2014); and relate efficiency with bank risk (Alam 2012; Berger & De Young 1997; Fiordelisi et al. 2009; Miah & Sharmeen 2015; Rossi et al. 2005; William 2004).
The literature on bank liquidity risk determinants are largely on conventional banking (Angora & Roulet 2011; Berger & Bouwman 2009, 2017; Berger et al.
JEM 51(2)Dis 2017 05.indd 48 3/27/18 1:23 PM
49Does Cost Efficiency Affect Liquidity Risk in Banking? Evidence from Selected OIC Countries
2016; Bonfim & Kim 2014; Chen et al. 2015; Cucinelli 2013; Hackethal et al. 2010; Horvath et al. 2014, 2016; Klomp & De Haan 2012, 2014; Lei & Song 2013; Roman & Sargu 2015; Vodova 2011) and only recently some documentation on Islamic banking. For instance, studies on Pakistani Islamic banks, provide evidence of significant factors explaining liquidity risk such as profitability (Akhtar et al. 2011; Iqbal 2012), size (Iqbal 2012; Ramzan & Zafar 2014), financial leverage (Ahmed et al. 2011; Iqbal 2012), and tangibility and age (Ahmed et al. 2011). Whereas liquidity risk of Islamic banks in Malaysia is positively affected by previous liquidities, profitability and GDP growth and negatively affected by financing ratio, size, and inflation rate (Mohamad et al. 2013). While Yaacob et al. (2016) found that capital and financing affect liquidity risk of Islamic banks in Malaysia in short term and the effect of GDP and inflation are evidenced both in short and long-term. For studies on multiple countries involving banks in GCC, South East Asia, Brunei, Egypt and Turkey, Alman and Oehler (2010) found that liquidity transformation of Islamic banks is negatively determined by financial leverage, risk and interbank-demand. Limited to Islamic banks in GCC
countries (1998-2008), Al-Khouri (2012) documented that large banks with high capital provide most of the liquidity while profitability reduced the liquidity created by banks. For a comparative evidence between Islamic banks and conventional banks in five Gulf countries (2006-2013), Ghenimi and Omri (2015) indicated that for Islamic banks, the influence factors of return on equity (ROE), net interest margin, capital, and inflation rate are positive; while ROA, NPL, size and GDP growth exert negative effect on liquidity risk. The results are consistent with conventional banks except for the factors of size and GDP growth that had negative impact on bank liquidity risk.
The literature on the efficiency-bank risk relationship is mostly on conventional banks. Altunbas et al. (2000) examined efficiency and risk relationship in Japanese commercial banks (1993-1996), using Stochastic Cost Frontier technique to compute scale and X-inefficiencies, and include risk factors i.e. credit risk and liquidity risk in the cost frontier model. The findings show that scale efficiency estimations tend to be overstated without risk factors in the model but not for X-inefficiency which appears less sensitive. Radic et al. (2011) analysed cost and profit efficiency of investment banks in G7 countries and Switzerland (2001-2007) by incorporating risks, bank-specific and macroeconomic factors found that efficiency is underestimated without taking care of bank risk i.e. liquidity and capital risk factors in the model. With respect to bank specific factors, size is significant in improving efficiency while more concentrated market is less likely to be cost and profit efficient. Sarmiento and Galan (2015) employed SFA to examine the impact of risk on efficiency of Columbian banks from 2002 to 2012 and reported that cost and profit efficiency tend to
be over-estimated when risk measures are not accurately modelled. It is evidenced that the magnitude effect of credit risk, market risk, liquidity and capitalization on efficiency varies with size and affiliation. Specifically, it shows that credit risk lead to reduced cost efficiency and the cost is lower for large and local banks. In terms of profit efficiency, it is positively related with credit risk especially for large and foreign banks. It is also evidenced that high capital is associated with high level of efficiency in both cost and profit, particularly for small and local banks. Large and foreign banks are found to have greater incentive to assume more market risk. Moreover, large banks are more efficient than small banks and less affected by crisis.
Brissimis et al. (2008) extended previous studies by examining the impact of competition and bank risk taking on ten newly acceded EU countries performance i.e. efficiency, total factor productivity growth and net interest margin over the period of 1994 to 2005. The bank risk was surrogated by credit risk, liquidity risk and capital risk. It is evidenced that banking sector reform and competition has positive effect on efficiency. Whereas, the effect of the reform on total factor productivity growth is significant only at the end of the reform process, indicating the long-term effect of technology improvements. Further, capital and credit risk exert negative impact on bank performance while high liquidity reduces bank performance. Said (2013) examined the correlation between various bank’s risks and efficiency of Islamic banks in MENA region from 2006 to 2009. The study used three-stage approach; used DEA to measure efficiency, analysed credit, liquidity, and operational risk using financial ratios, and employed Pearson Correlation Coefficient to test the risk and efficiency relationship. It is found that only credit risk and operational risk have significant negative correlation with efficiency. Whereas, no significant relationship was observed between liquidity risk and efficiency.
The existing studies on efficiency determinants and bank risk yield mix results. However, no study examined bank risk determinants, especially liquidity risk, by including efficiency in the model. Closest to this study was that of Altunbas et al. (2007) and Khalib et al. (2016). Altunbas et al. (2007) employed the SUR approach in examining bidirectional relationship between capital-risk-efficiency on banks from 15 European countries from 1992 to 2000. The study used both credit risk and liquidity risk to proxy for bank risk and employed SFA to estimate cost inefficiency. It was discovered that inefficient score is related to increase in capital and decrease in risk. It shows that both risk factors and inefficiency is simultaneously determined. With respect to the link between risk and capital, its positive relationship reflects the need of regulatory capital requirement to restrict risk taking activities. Besides, there was evidence that financial strength factor has positive impact on capital and bank risk taking. In comparison between types of banks, the capital-risk-efficiency relationship is almost the same for
JEM 51(2)Dis 2017 05.indd 49 3/27/18 1:23 PM
50 Jurnal Ekonomi Malaysia 51(2)
commercial and savings banks. While for co-operative banks, capital levels are found to be inversely related to risks and inefficient banks tend to hold less capital. Khalib et al. (2016) examined cost efficiency and liquidity risk of Islamic banks and commercial banks in Malaysia 1994-2014 using panel static technique. They estimated cost efficiency using SFA method and Basel III liquidity risk
measures (liquidity coverage ratio and net stable funding ratio). The results evidenced that cost efficiency poses no significant effect in short term and, yet negative effect in long term, suggesting that the implication of costs efficiency take time to reduce liquidity risk in banking.
Overall, the literature provides general guidance on risk-efficiency relationship on concentrated sample in
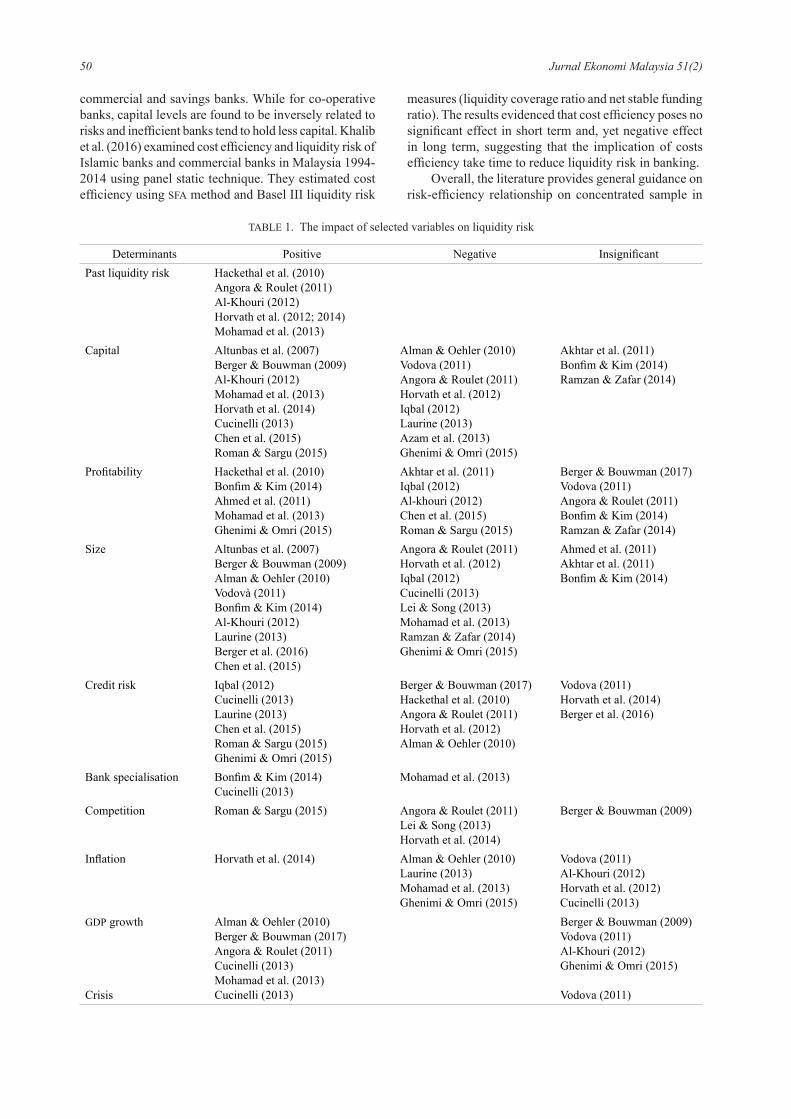
TABLE 1. The impact of selected variables on liquidity risk
Determinants Positive Negative InsignificantPast liquidity risk Hackethal et al. (2010)
Angora & Roulet (2011)Al-Khouri (2012)Horvath et al. (2012; 2014)Mohamad et al. (2013)
Capital Altunbas et al. (2007)Berger & Bouwman (2009) Al-Khouri (2012)Mohamad et al. (2013)Horvath et al. (2014)Cucinelli (2013)Chen et al. (2015)Roman & Sargu (2015)
Alman & Oehler (2010)Vodova (2011)Angora & Roulet (2011)Horvath et al. (2012)Iqbal (2012)Laurine (2013)Azam et al. (2013)Ghenimi & Omri (2015)
Akhtar et al. (2011)Bonfim & Kim (2014)Ramzan & Zafar (2014)
Profitability Hackethal et al. (2010)Bonfim & Kim (2014)Ahmed et al. (2011)Mohamad et al. (2013)Ghenimi & Omri (2015)
Akhtar et al. (2011)Iqbal (2012)Al-khouri (2012)Chen et al. (2015)Roman & Sargu (2015)
Berger & Bouwman (2017)Vodova (2011)Angora & Roulet (2011)Bonfim & Kim (2014)Ramzan & Zafar (2014)
Size Altunbas et al. (2007)Berger & Bouwman (2009) Alman & Oehler (2010)Vodovà (2011) Bonfim & Kim (2014)Al-Khouri (2012)Laurine (2013)Berger et al. (2016)Chen et al. (2015)
Angora & Roulet (2011)Horvath et al. (2012)Iqbal (2012)Cucinelli (2013)Lei & Song (2013)Mohamad et al. (2013)Ramzan & Zafar (2014)Ghenimi & Omri (2015)
Ahmed et al. (2011)Akhtar et al. (2011)Bonfim & Kim (2014)
Credit risk Iqbal (2012)Cucinelli (2013)Laurine (2013)Chen et al. (2015)Roman & Sargu (2015)Ghenimi & Omri (2015)
Berger & Bouwman (2017)Hackethal et al. (2010) Angora & Roulet (2011)Horvath et al. (2012)Alman & Oehler (2010)
Vodova (2011)Horvath et al. (2014) Berger et al. (2016)
Bank specialisation Bonfim & Kim (2014)Cucinelli (2013)
Mohamad et al. (2013)
Competition Roman & Sargu (2015) Angora & Roulet (2011) Lei & Song (2013)Horvath et al. (2014)
Berger & Bouwman (2009)
Inflation Horvath et al. (2014) Alman & Oehler (2010)Laurine (2013)Mohamad et al. (2013)Ghenimi & Omri (2015)
Vodova (2011)Al-Khouri (2012)Horvath et al. (2012)Cucinelli (2013)
GDP growth
Crisis
Alman & Oehler (2010)Berger & Bouwman (2017)Angora & Roulet (2011)Cucinelli (2013)Mohamad et al. (2013)Cucinelli (2013)
Berger & Bouwman (2009)Vodova (2011)Al-Khouri (2012)Ghenimi & Omri (2015)
Vodova (2011)
JEM 51(2)Dis 2017 05.indd 50 3/27/18 1:23 PM
51Does Cost Efficiency Affect Liquidity Risk in Banking? Evidence from Selected OIC Countries
conventional banking. The evidence on the relationship between liquidity risk and efficiency is inconclusive. There is still a gap on whether different efficiency level between distinct bank types could have resultant impact on liquidity risk profile of a bank that could provide some insights on bank risk taking behaviour. With regards to other liquidity risk determinants, previous studies suggest different factors based on country level and cross-country analyses. The common factors affecting liquidity risk in banking include; capital, size, asset quality, profitability, inflation, GDP growth, competition, and crisis. To summarize, Table 1 provides a brief description of the variables and their expected relationship to liquidity risk.
METHODOLOGY
The dataset for this study includes Islamic and conventional banks from selected 16 OIC (namely, Bahrain, Bangladesh, Brunei, Egypt, Jordan, Kuwait, Indonesia, Malaysia, Pakistan, Qatar, Saudi Arabia, Sudan, United Arab Emirates (U.A.E), Tunisia, Turkey and Yemen) over a 15-year period (1999 to 2013). The selected countries practice dual banking systems, and had the yearly data. Bank-based data is sourced from Bankscope, Fitch Ratings and Bureau Van Dijk3. The macroeconomic data such as inflation rate and real GDP
growth was collected from the World Development Indicators (WDI), World Bank. The market concentration ratios were computed using the inputs from Bankscope database. Based on these criterion, the final sample comprises of 78 Islamic banks with 572 observations and 251 conventional banks with 3203 observations.
Cost efficiency estimations were made using DEA approach, the combination of piece-wise linear technology and mathematical programming on the actual multiple input-output observations of a bank (Charnes et al.1978). The obtained cost efficiency estimates are then compared with the most cost efficient bank in the sample. This way, the calculated efficiency scores are in the form of relative measure. A benchmark cost frontier is constructed by a linear combination of a list of best performers. Units that lie on the frontier are the cost efficient bank and those that do not are recognized
as cost inefficient. We applied the input oriented with variable return to scale (VRS) for the cost minimization model as follows4:
min Σmi=1 ci0xi0
s.t. xi0 ≥ Σnj=1 xijλj, (i = 1, ..., m)
yr0 ≤ Σnj=1 yrjλj, (r = 1, ..., s)
Σnj=1 λj = 1
λj ≥ 0, (1)
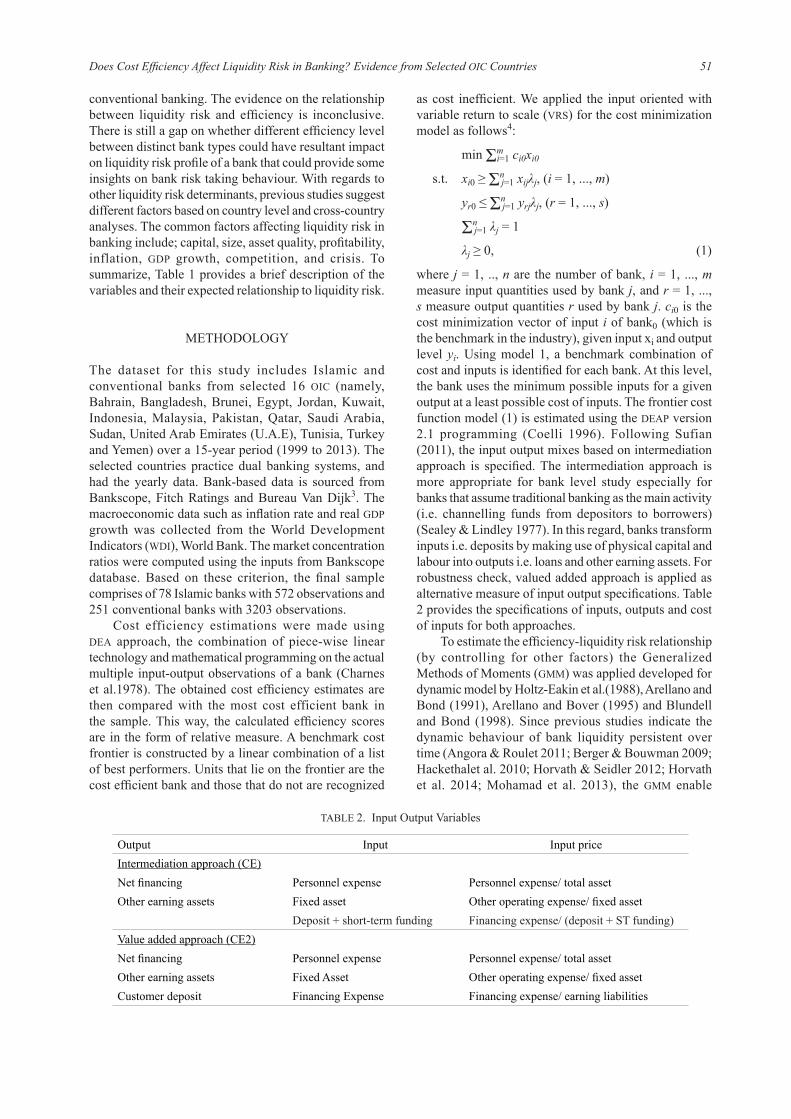
where j = 1, .., n are the number of bank, i = 1, ..., m measure input quantities used by bank j, and r = 1, ..., s measure output quantities r used by bank j. ci0 is the cost minimization vector of input i of bank0 (which is the benchmark in the industry), given input xi and output level yi. Using model 1, a benchmark combination of cost and inputs is identified for each bank. At this level, the bank uses the minimum possible inputs for a given output at a least possible cost of inputs. The frontier cost function model (1) is estimated using the DEAP version 2.1 programming (Coelli 1996). Following Sufian (2011), the input output mixes based on intermediation approach is specified. The intermediation approach is more appropriate for bank level study especially for banks that assume traditional banking as the main activity (i.e. channelling funds from depositors to borrowers) (Sealey & Lindley 1977). In this regard, banks transform inputs i.e. deposits by making use of physical capital and labour into outputs i.e. loans and other earning assets. For robustness check, valued added approach is applied as alternative measure of input output specifications. Table 2 provides the specifications of inputs, outputs and cost of inputs for both approaches.
To estimate the efficiency-liquidity risk relationship (by controlling for other factors) the Generalized Methods of Moments (GMM) was applied developed for dynamic model by Holtz-Eakin et al.(1988), Arellano and Bond (1991), Arellano and Bover (1995) and Blundell and Bond (1998). Since previous studies indicate the dynamic behaviour of bank liquidity persistent over time (Angora & Roulet 2011; Berger & Bouwman 2009; Hackethalet al. 2010; Horvath & Seidler 2012; Horvath et al. 2014; Mohamad et al. 2013), the GMM enable
TABLE 2. Input Output Variables
Output Input Input priceIntermediation approach (CE)Net financing Personnel expense Personnel expense/ total assetOther earning assets Fixed asset Other operating expense/ fixed asset
Deposit + short-term funding Financing expense/ (deposit + ST funding)Value added approach (CE2)Net financing Personnel expense Personnel expense/ total assetOther earning assets Fixed Asset Other operating expense/ fixed assetCustomer deposit Financing Expense Financing expense/ earning liabilities
JEM 51(2)Dis 2017 05.indd 51 3/27/18 1:23 PM
52 Jurnal Ekonomi Malaysia 51(2)
the study to incorporate lags of dependent variable as explanatory variables (or instruments) to control for the dynamic process. By modelling an appropriate behaviour specification, a new or different link between dependent and explanatory variables can be discovered. As Beck et al. (2000) outlined, the advantages of applying the dynamic GMM estimator are: First, the model is efficient in allowing the influence of time series variation. Second, it permits for unobserved individual-specific effects to be captured. Third, it controls for endogeneity problems by introducing internal instruments in the model. Fourth, the dynamic panel framework suit cases with large cross-section and short time series (N>T), as the case with the sample in this study. Consequently, the GMM’s results help to avoid any bias from time series dynamics, heterogeneity of banks, endogeneity and large data files with small T. Therefore, the adoption of dynamic GMM
is appropriate as it produces efficient and consistent parameter estimates for panel approach.
The selected control variables are adopted from previous relevant studies. Our empirical framework can be specified as:
LRit = αi+β1LRit–1+ β2CEit+ β3Bit+ β4Mit+ βnDn
+ ft+ εit (2) εit = vi+ µit
where LR is liquidity risk and LRit–1 is one-year lagged of liquidity risk. The lagged dependent variable is included to capture the lagging effect as the liquidity policy take time to change and likely to reflect decisions made on the basis of historical experience. The single lagged year is considered reasonable, given the frequency of the data is on annual basis. CE is cost efficiency measured by DEA
using intermediation approach. For robust findings, we
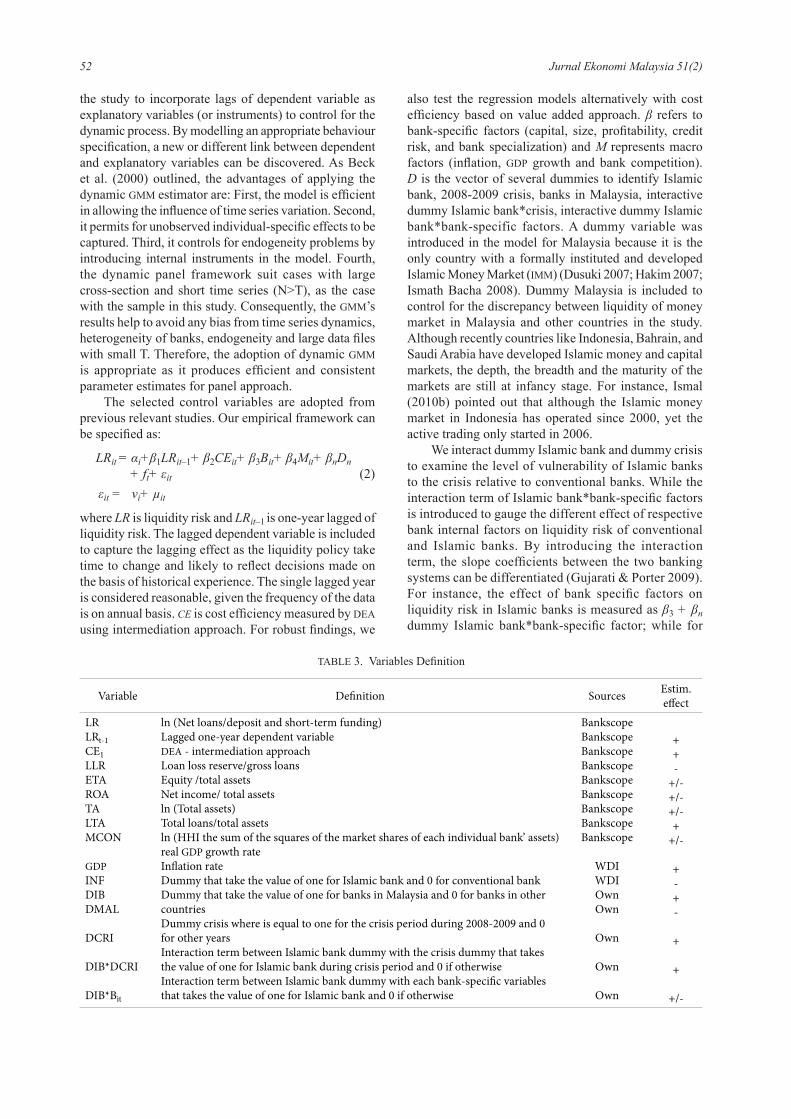
also test the regression models alternatively with cost efficiency based on value added approach. β refers to bank-specific factors (capital, size, profitability, credit risk, and bank specialization) and M represents macro factors (inflation, GDP growth and bank competition). D is the vector of several dummies to identify Islamic bank, 2008-2009 crisis, banks in Malaysia, interactive dummy Islamic bank*crisis, interactive dummy Islamic bank*bank-specific factors. A dummy variable was introduced in the model for Malaysia because it is the only country with a formally instituted and developed Islamic Money Market (IMM) (Dusuki 2007; Hakim 2007; Ismath Bacha 2008). Dummy Malaysia is included to control for the discrepancy between liquidity of money market in Malaysia and other countries in the study. Although recently countries like Indonesia, Bahrain, and Saudi Arabia have developed Islamic money and capital markets, the depth, the breadth and the maturity of the markets are still at infancy stage. For instance, Ismal (2010b) pointed out that although the Islamic money market in Indonesia has operated since 2000, yet the active trading only started in 2006.
We interact dummy Islamic bank and dummy crisis to examine the level of vulnerability of Islamic banks to the crisis relative to conventional banks. While the interaction term of Islamic bank*bank-specific factors is introduced to gauge the different effect of respective bank internal factors on liquidity risk of conventional and Islamic banks. By introducing the interaction term, the slope coefficients between the two banking systems can be differentiated (Gujarati & Porter 2009). For instance, the effect of bank specific factors on liquidity risk in Islamic banks is measured as β3 + βn dummy Islamic bank*bank-specific factor; while for
TABLE 3. Variables Definition
Variable Definition Sources Estim. effect
LRLRt-1CE1LLR ETA ROATALTAMCON
GDP INFDIBDMAL
DCRI
DIB*DCRI
DIB*Bit
ln (Net loans/deposit and short-term funding)Lagged one-year dependent variable DEA - intermediation approachLoan loss reserve/gross loans Equity /total assets Net income/ total assetsln (Total assets)Total loans/total assets ln (HHI the sum of the squares of the market shares of each individual bank’ assets) real GDP growth rate Inflation rateDummy that take the value of one for Islamic bank and 0 for conventional bank Dummy that take the value of one for banks in Malaysia and 0 for banks in other countriesDummy crisis where is equal to one for the crisis period during 2008-2009 and 0 for other yearsInteraction term between Islamic bank dummy with the crisis dummy that takes the value of one for Islamic bank during crisis period and 0 if otherwiseInteraction term between Islamic bank dummy with each bank-specific variables that takes the value of one for Islamic bank and 0 if otherwise
Bankscope Bankscope Bankscope Bankscope Bankscope Bankscope BankscopeBankscope Bankscope
WDIWDIOwnOwn
Own
Own
Own
++-
+/-+/-+/-+
+/-
+-+-
+
+
+/-
JEM 51(2)Dis 2017 05.indd 52 3/27/18 1:23 PM
53Does Cost Effi ciency Affect Liquidity Risk in Banking? Evidence from Selected OIC Countries
conventional banks, the effect is measured as β3. α is constant while ε, v, and μ refer to random disturbance, unobserved bank specifi c effects, and idiosyncratic error, respectively. i and t is bank and time respectively. ft is year dummies to control for specifi c time effect. Table 3 provides the list of variables which we have used in the regression models.
RESULTS AND DISCUSSION
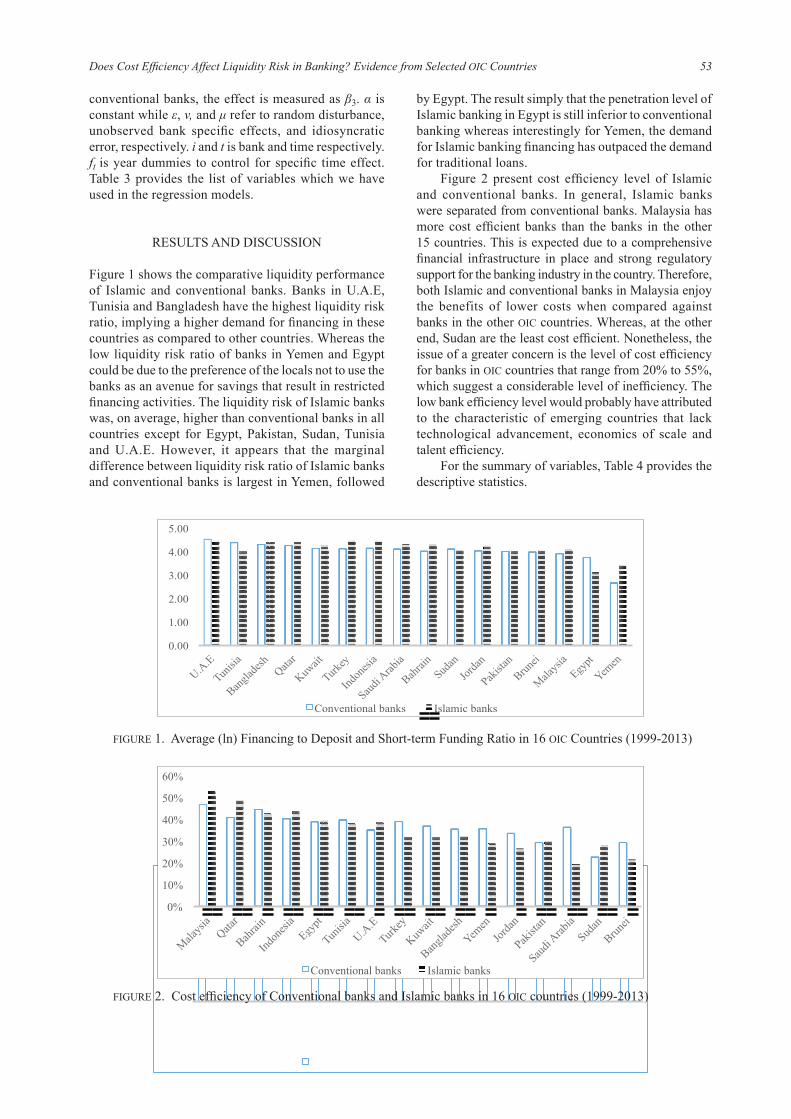
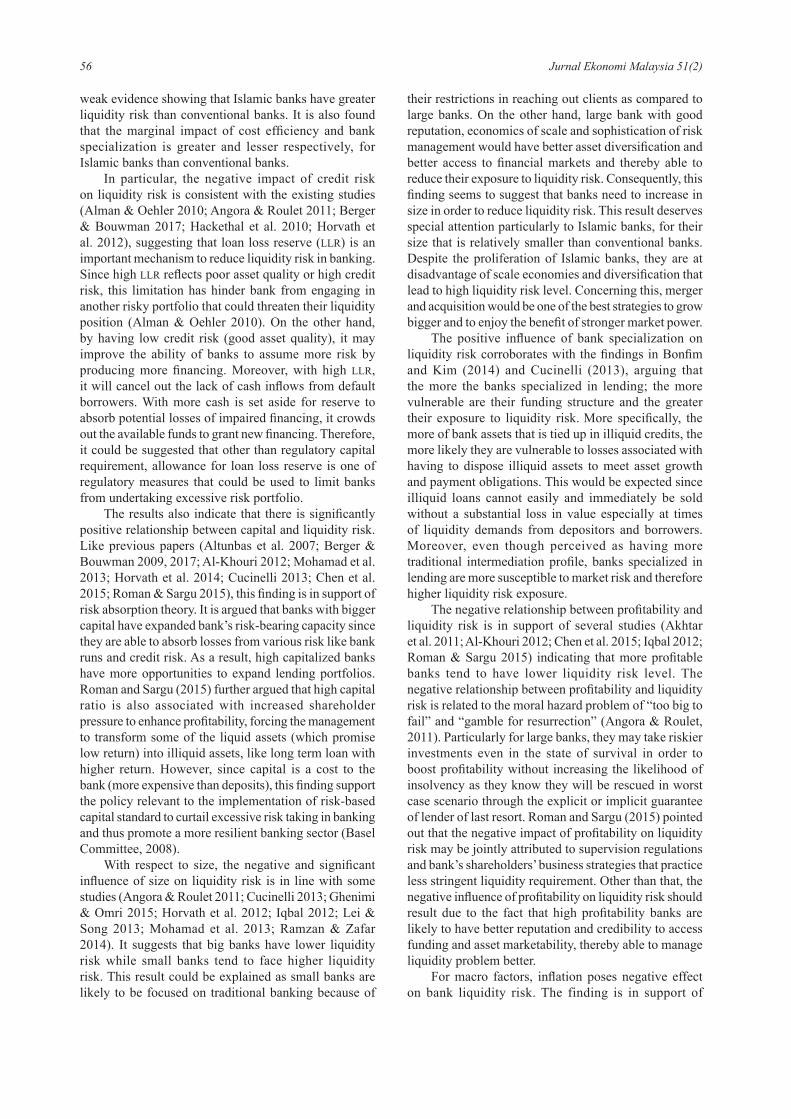
Figure 1 shows the comparative liquidity performance of Islamic and conventional banks. Banks in U.A.E, Tunisia and Bangladesh have the highest liquidity risk ratio, implying a higher demand for fi nancing in these countries as compared to other countries. Whereas the low liquidity risk ratio of banks in Yemen and Egypt could be due to the preference of the locals not to use the banks as an avenue for savings that result in restricted fi nancing activities. The liquidity risk of Islamic banks was, on average, higher than conventional banks in all countries except for Egypt, Pakistan, Sudan, Tunisia and U.A.E. However, it appears that the marginal difference between liquidity risk ratio of Islamic banks and conventional banks is largest in Yemen, followed
by Egypt. The result simply that the penetration level of Islamic banking in Egypt is still inferior to conventional banking whereas interestingly for Yemen, the demand for Islamic banking fi nancing has outpaced the demand for traditional loans.
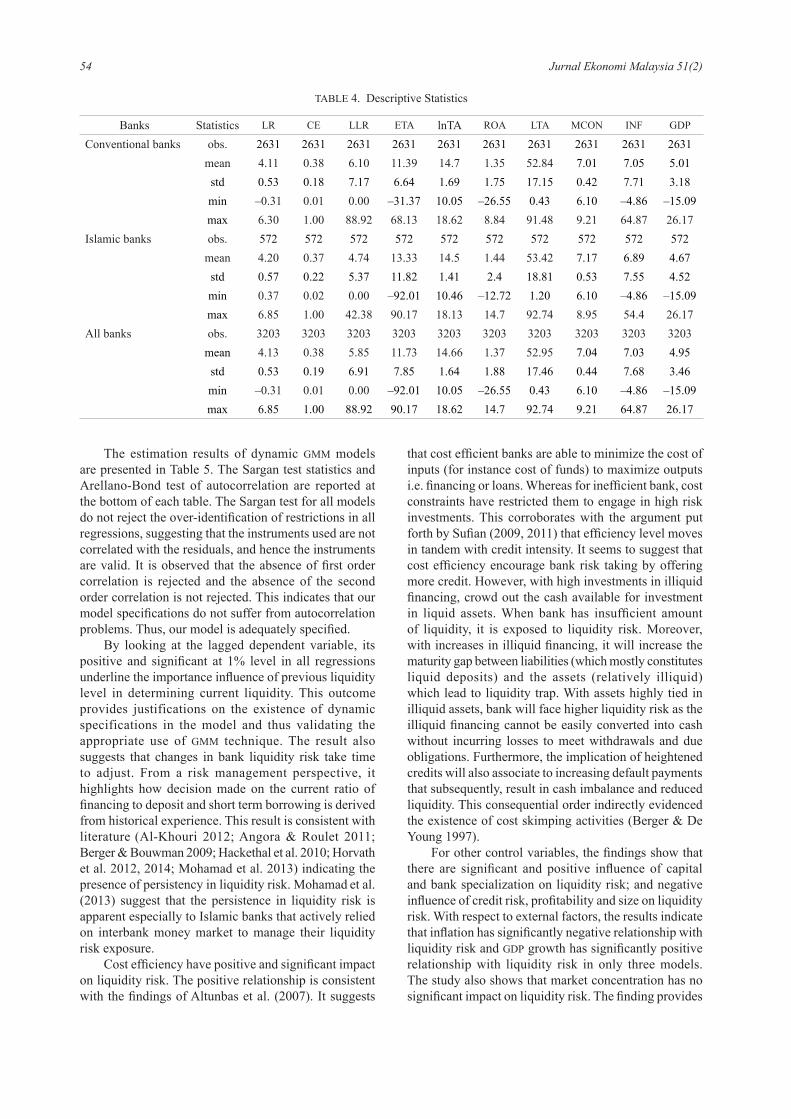
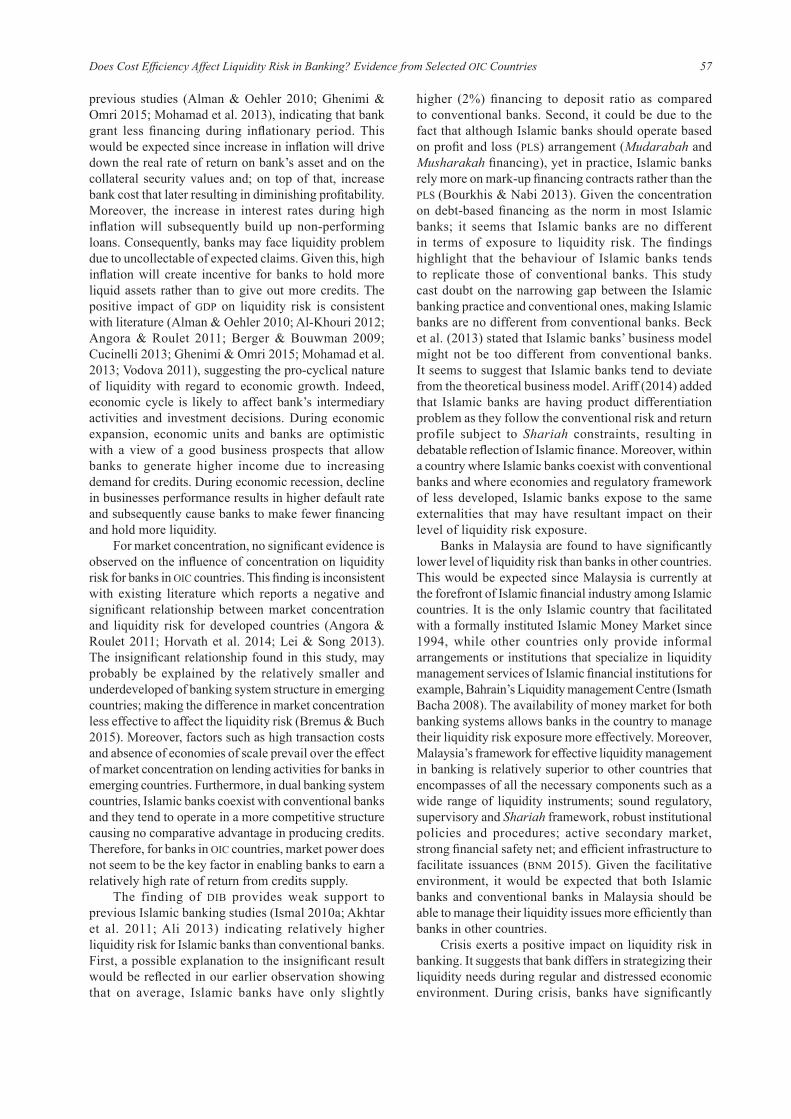
Figure 2 present cost effi ciency level of Islamic and conventional banks. In general, Islamic banks were separated from conventional banks. Malaysia has more cost effi cient banks than the banks in the other 15 countries. This is expected due to a comprehensive fi nancial infrastructure in place and strong regulatory support for the banking industry in the country. Therefore, both Islamic and conventional banks in Malaysia enjoy the benefits of lower costs when compared against banks in the other OIC countries. Whereas, at the other end, Sudan are the least cost effi cient. Nonetheless, the issue of a greater concern is the level of cost effi ciency for banks in OIC countries that range from 20% to 55%, which suggest a considerable level of ineffi ciency. The low bank effi ciency level would probably have attributed to the characteristic of emerging countries that lack technological advancement, economics of scale and talent effi ciency.
For the summary of variables, Table 4 provides the descriptive statistics.
FIGURE 1. Average (ln) Financing to Deposit and Short-term Funding Ratio in 16 OIC Countries (1999-2013)
7
RESULTS AND DISCUSSION
Figure 1 shows the comparative liquidity performance of Islamic and conventional banks. Banks in U.A.E, Tunisia and Bangladesh have the highest liquidity risk ratio, implying a higher demand for financing in these countries as compared to other countries. Whereas the low liquidity risk ratio of banks in Yemen and Egypt could be due to the preference of the locals not to use the banks as an avenue for savings that result in restricted financing activities. The liquidity risk of Islamic banks was, on average, higher than conventional banks in all countries except for Egypt, Pakistan, Sudan, Tunisia and U.A.E. However, it appears that the marginal difference between liquidity risk ratio of Islamic banks and conventional banks is largest in Yemen, followed by Egypt. The result simply that the penetration level of Islamic banking in Egypt is still inferior to conventional banking whereas interestingly for Yemen, the demand for Islamic banking financing has outpaced the demand for traditional loans.
FIGURE 1. Average (ln) Financing to Deposit and Short-term Funding Ratio in 16 OIC Countries (1999-2013)
Figure 2 present cost efficiency level of Islamic and conventional banks. In general, Islamic banks were separated from conventional banks. Malaysia has more cost efficient banks than the banks in the other 15 countries. This is expected due to a comprehensive financial infrastructure in place and strong regulatory support for the banking industry in the country. Therefore, both Islamic and conventional banks in Malaysia enjoy the benefits of lower costs when compared against banks in the other OIC countries. Whereas, at the other end, Sudan are the least cost efficient. Nonetheless, the issue of a greater concern is the level of cost efficiency for banks in OIC countries that range from 20% to 55%, which suggest a considerable level of inefficiency. The low bank efficiency level would probably have attributed to the characteristic of emerging countries that lack technological advancement, economics of scale and talent efficiency.
FIGURE 2. Cost efficiency of Conventional banks and Islamic banks in 16 OIC countries (1999-2013)
0.00
1.00
2.00
3.00
4.00
5.00
Conventional banks Islamic banks
0%
10%
20%
30%
40%
50%
60%
Conventional banks Islamic banks
FIGURE 2. Cost effi ciency of Conventional banks and Islamic banks in 16 OIC countries (1999-2013)
JEM 51(2)Dis 2017 05.indd 53 3/27/18 1:23 PM
54 Jurnal Ekonomi Malaysia 51(2)
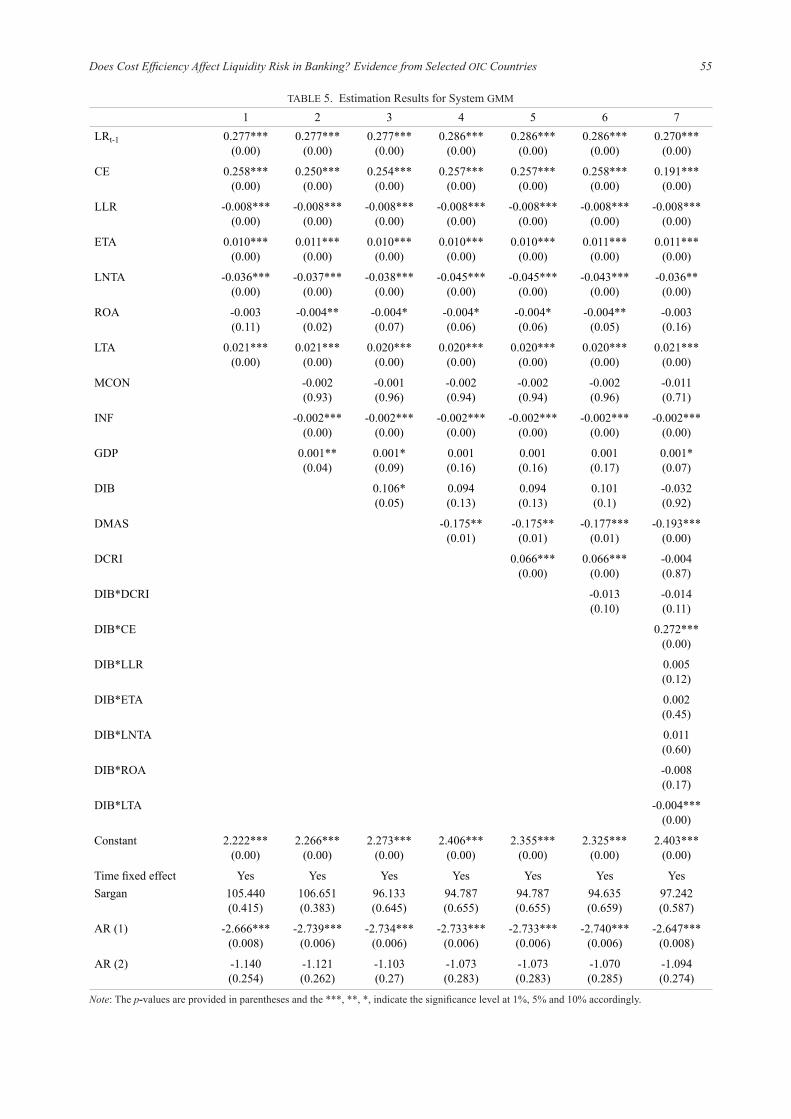
The estimation results of dynamic GMM models are presented in Table 5. The Sargan test statistics and Arellano-Bond test of autocorrelation are reported at the bottom of each table. The Sargan test for all models do not reject the over-identification of restrictions in all regressions, suggesting that the instruments used are not correlated with the residuals, and hence the instruments are valid. It is observed that the absence of first order correlation is rejected and the absence of the second order correlation is not rejected. This indicates that our model specifications do not suffer from autocorrelation problems. Thus, our model is adequately specified.
By looking at the lagged dependent variable, its positive and significant at 1% level in all regressions underline the importance influence of previous liquidity level in determining current liquidity. This outcome provides justifications on the existence of dynamic specifications in the model and thus validating the appropriate use of GMM technique. The result also suggests that changes in bank liquidity risk take time to adjust. From a risk management perspective, it highlights how decision made on the current ratio of financing to deposit and short term borrowing is derived from historical experience. This result is consistent with literature (Al-Khouri 2012; Angora & Roulet 2011; Berger & Bouwman 2009; Hackethal et al. 2010; Horvath et al. 2012, 2014; Mohamad et al. 2013) indicating the presence of persistency in liquidity risk. Mohamad et al. (2013) suggest that the persistence in liquidity risk is apparent especially to Islamic banks that actively relied on interbank money market to manage their liquidity risk exposure.
Cost efficiency have positive and significant impact on liquidity risk. The positive relationship is consistent with the findings of Altunbas et al. (2007). It suggests
that cost efficient banks are able to minimize the cost of inputs (for instance cost of funds) to maximize outputs i.e. financing or loans. Whereas for inefficient bank, cost constraints have restricted them to engage in high risk investments. This corroborates with the argument put forth by Sufian (2009, 2011) that efficiency level moves in tandem with credit intensity. It seems to suggest that cost efficiency encourage bank risk taking by offering more credit. However, with high investments in illiquid financing, crowd out the cash available for investment in liquid assets. When bank has insufficient amount of liquidity, it is exposed to liquidity risk. Moreover, with increases in illiquid financing, it will increase the maturity gap between liabilities (which mostly constitutes liquid deposits) and the assets (relatively illiquid) which lead to liquidity trap. With assets highly tied in illiquid assets, bank will face higher liquidity risk as the illiquid financing cannot be easily converted into cash without incurring losses to meet withdrawals and due obligations. Furthermore, the implication of heightened credits will also associate to increasing default payments that subsequently, result in cash imbalance and reduced liquidity. This consequential order indirectly evidenced the existence of cost skimping activities (Berger & De Young 1997).
For other control variables, the findings show that there are significant and positive influence of capital and bank specialization on liquidity risk; and negative influence of credit risk, profitability and size on liquidity risk. With respect to external factors, the results indicate that inflation has significantly negative relationship with liquidity risk and GDP growth has significantly positive relationship with liquidity risk in only three models. The study also shows that market concentration has no significant impact on liquidity risk. The finding provides
TABLE 4. Descriptive Statistics
Banks Statistics LR CE LLR ETA lnTA ROA LTA MCON INF GDP
Conventional banks obs. 2631 2631 2631 2631 2631 2631 2631 2631 2631 2631mean 4.11 0.38 6.10 11.39 14.7 1.35 52.84 7.01 7.05 5.01std 0.53 0.18 7.17 6.64 1.69 1.75 17.15 0.42 7.71 3.18min –0.31 0.01 0.00 –31.37 10.05 –26.55 0.43 6.10 –4.86 –15.09max 6.30 1.00 88.92 68.13 18.62 8.84 91.48 9.21 64.87 26.17
Islamic banks obs. 572 572 572 572 572 572 572 572 572 572mean 4.20 0.37 4.74 13.33 14.5 1.44 53.42 7.17 6.89 4.67std 0.57 0.22 5.37 11.82 1.41 2.4 18.81 0.53 7.55 4.52min 0.37 0.02 0.00 –92.01 10.46 –12.72 1.20 6.10 –4.86 –15.09max 6.85 1.00 42.38 90.17 18.13 14.7 92.74 8.95 54.4 26.17
All banks obs. 3203 3203 3203 3203 3203 3203 3203 3203 3203 3203mean 4.13 0.38 5.85 11.73 14.66 1.37 52.95 7.04 7.03 4.95std 0.53 0.19 6.91 7.85 1.64 1.88 17.46 0.44 7.68 3.46min –0.31 0.01 0.00 –92.01 10.05 –26.55 0.43 6.10 –4.86 –15.09max 6.85 1.00 88.92 90.17 18.62 14.7 92.74 9.21 64.87 26.17
JEM 51(2)Dis 2017 05.indd 54 3/27/18 1:23 PM
55Does Cost Efficiency Affect Liquidity Risk in Banking? Evidence from Selected OIC Countries
TABLE 5. Estimation Results for System GMM
1 2 3 4 5 6 7LRt-1 0.277***
(0.00)0.277***
(0.00)0.277***
(0.00)0.286***
(0.00)0.286***
(0.00)0.286***
(0.00)0.270***
(0.00)
CE 0.258***(0.00)
0.250***(0.00)
0.254***(0.00)
0.257***(0.00)
0.257***(0.00)
0.258***(0.00)
0.191***(0.00)
LLR -0.008***(0.00)
-0.008***(0.00)
-0.008***(0.00)
-0.008***(0.00)
-0.008***(0.00)
-0.008***(0.00)
-0.008***(0.00)
ETA 0.010***(0.00)
0.011***(0.00)
0.010***(0.00)
0.010***(0.00)
0.010***(0.00)
0.011***(0.00)
0.011***(0.00)
LNTA -0.036***(0.00)
-0.037***(0.00)
-0.038***(0.00)
-0.045***(0.00)
-0.045***(0.00)
-0.043***(0.00)
-0.036**(0.00)
ROA -0.003(0.11)
-0.004**(0.02)
-0.004*(0.07)
-0.004*(0.06)
-0.004*(0.06)
-0.004**(0.05)
-0.003(0.16)
LTA 0.021***(0.00)
0.021***(0.00)
0.020***(0.00)
0.020***(0.00)
0.020***(0.00)
0.020***(0.00)
0.021***(0.00)
MCON -0.002(0.93)
-0.001(0.96)
-0.002(0.94)
-0.002(0.94)
-0.002(0.96)
-0.011(0.71)
INF -0.002***(0.00)
-0.002***(0.00)
-0.002***(0.00)
-0.002***(0.00)
-0.002***(0.00)
-0.002***(0.00)
GDP 0.001**(0.04)
0.001*(0.09)
0.001(0.16)
0.001(0.16)
0.001(0.17)
0.001*(0.07)
DIB 0.106*(0.05)
0.094(0.13)
0.094(0.13)
0.101(0.1)
-0.032(0.92)
DMAS -0.175**(0.01)
-0.175**(0.01)
-0.177***(0.01)
-0.193***(0.00)
DCRI 0.066***(0.00)
0.066***(0.00)
-0.004(0.87)
DIB*DCRI -0.013(0.10)
-0.014(0.11)
DIB*CE 0.272***(0.00)
DIB*LLR 0.005(0.12)
DIB*ETA 0.002(0.45)
DIB*LNTA 0.011(0.60)
DIB*ROA -0.008(0.17)
DIB*LTA -0.004***(0.00)
Constant 2.222***(0.00)
2.266***(0.00)
2.273***(0.00)
2.406***(0.00)
2.355***(0.00)
2.325***(0.00)
2.403***(0.00)
Time fixed effect Yes Yes Yes Yes Yes Yes YesSargan 105.440
(0.415)106.651(0.383)
96.133(0.645)
94.787(0.655)
94.787(0.655)
94.635(0.659)
97.242(0.587)
AR (1) -2.666***(0.008)
-2.739***(0.006)
-2.734***(0.006)
-2.733***(0.006)
-2.733***(0.006)
-2.740***(0.006)
-2.647***(0.008)
AR (2) -1.140(0.254)
-1.121(0.262)
-1.103(0.27)
-1.073(0.283)
-1.073(0.283)
-1.070(0.285)
-1.094(0.274)
Note: The p-values are provided in parentheses and the ***, **, *, indicate the significance level at 1%, 5% and 10% accordingly.
JEM 51(2)Dis 2017 05.indd 55 3/27/18 1:23 PM
56 Jurnal Ekonomi Malaysia 51(2)
weak evidence showing that Islamic banks have greater liquidity risk than conventional banks. It is also found that the marginal impact of cost efficiency and bank specialization is greater and lesser respectively, for Islamic banks than conventional banks.
In particular, the negative impact of credit risk on liquidity risk is consistent with the existing studies (Alman & Oehler 2010; Angora & Roulet 2011; Berger & Bouwman 2017; Hackethal et al. 2010; Horvath et al. 2012), suggesting that loan loss reserve (LLR) is an important mechanism to reduce liquidity risk in banking. Since high LLR reflects poor asset quality or high credit risk, this limitation has hinder bank from engaging in another risky portfolio that could threaten their liquidity position (Alman & Oehler 2010). On the other hand, by having low credit risk (good asset quality), it may improve the ability of banks to assume more risk by producing more financing. Moreover, with high LLR, it will cancel out the lack of cash inflows from default borrowers. With more cash is set aside for reserve to absorb potential losses of impaired financing, it crowds out the available funds to grant new financing. Therefore, it could be suggested that other than regulatory capital requirement, allowance for loan loss reserve is one of regulatory measures that could be used to limit banks from undertaking excessive risk portfolio.
The results also indicate that there is significantly positive relationship between capital and liquidity risk. Like previous papers (Altunbas et al. 2007; Berger & Bouwman 2009, 2017; Al-Khouri 2012; Mohamad et al. 2013; Horvath et al. 2014; Cucinelli 2013; Chen et al. 2015; Roman & Sargu 2015), this finding is in support of risk absorption theory. It is argued that banks with bigger capital have expanded bank’s risk-bearing capacity since they are able to absorb losses from various risk like bank runs and credit risk. As a result, high capitalized banks have more opportunities to expand lending portfolios. Roman and Sargu (2015) further argued that high capital ratio is also associated with increased shareholder pressure to enhance profitability, forcing the management to transform some of the liquid assets (which promise low return) into illiquid assets, like long term loan with higher return. However, since capital is a cost to the bank (more expensive than deposits), this finding support the policy relevant to the implementation of risk-based capital standard to curtail excessive risk taking in banking and thus promote a more resilient banking sector (Basel Committee, 2008).
With respect to size, the negative and significant influence of size on liquidity risk is in line with some studies (Angora & Roulet 2011; Cucinelli 2013; Ghenimi & Omri 2015; Horvath et al. 2012; Iqbal 2012; Lei & Song 2013; Mohamad et al. 2013; Ramzan & Zafar 2014). It suggests that big banks have lower liquidity risk while small banks tend to face higher liquidity risk. This result could be explained as small banks are likely to be focused on traditional banking because of
their restrictions in reaching out clients as compared to large banks. On the other hand, large bank with good reputation, economics of scale and sophistication of risk management would have better asset diversification and better access to financial markets and thereby able to reduce their exposure to liquidity risk. Consequently, this finding seems to suggest that banks need to increase in size in order to reduce liquidity risk. This result deserves special attention particularly to Islamic banks, for their size that is relatively smaller than conventional banks. Despite the proliferation of Islamic banks, they are at disadvantage of scale economies and diversification that lead to high liquidity risk level. Concerning this, merger and acquisition would be one of the best strategies to grow bigger and to enjoy the benefit of stronger market power.
The positive influence of bank specialization on liquidity risk corroborates with the findings in Bonfim and Kim (2014) and Cucinelli (2013), arguing that the more the banks specialized in lending; the more vulnerable are their funding structure and the greater their exposure to liquidity risk. More specifically, the more of bank assets that is tied up in illiquid credits, the more likely they are vulnerable to losses associated with having to dispose illiquid assets to meet asset growth and payment obligations. This would be expected since illiquid loans cannot easily and immediately be sold without a substantial loss in value especially at times of liquidity demands from depositors and borrowers. Moreover, even though perceived as having more traditional intermediation profile, banks specialized in lending are more susceptible to market risk and therefore higher liquidity risk exposure.
The negative relationship between profitability and liquidity risk is in support of several studies (Akhtar et al. 2011; Al-Khouri 2012; Chen et al. 2015; Iqbal 2012; Roman & Sargu 2015) indicating that more profitable banks tend to have lower liquidity risk level. The negative relationship between profitability and liquidity risk is related to the moral hazard problem of “too big to fail” and “gamble for resurrection” (Angora & Roulet, 2011). Particularly for large banks, they may take riskier investments even in the state of survival in order to boost profitability without increasing the likelihood of insolvency as they know they will be rescued in worst case scenario through the explicit or implicit guarantee of lender of last resort. Roman and Sargu (2015) pointed out that the negative impact of profitability on liquidity risk may be jointly attributed to supervision regulations and bank’s shareholders’ business strategies that practice less stringent liquidity requirement. Other than that, the negative influence of profitability on liquidity risk should result due to the fact that high profitability banks are likely to have better reputation and credibility to access funding and asset marketability, thereby able to manage liquidity problem better.
For macro factors, inflation poses negative effect on bank liquidity risk. The finding is in support of
JEM 51(2)Dis 2017 05.indd 56 3/27/18 1:23 PM
57Does Cost Efficiency Affect Liquidity Risk in Banking? Evidence from Selected OIC Countries
previous studies (Alman & Oehler 2010; Ghenimi & Omri 2015; Mohamad et al. 2013), indicating that bank grant less financing during inflationary period. This would be expected since increase in inflation will drive down the real rate of return on bank’s asset and on the collateral security values and; on top of that, increase bank cost that later resulting in diminishing profitability. Moreover, the increase in interest rates during high inflation will subsequently build up non-performing loans. Consequently, banks may face liquidity problem due to uncollectable of expected claims. Given this, high inflation will create incentive for banks to hold more liquid assets rather than to give out more credits. The positive impact of GDP on liquidity risk is consistent with literature (Alman & Oehler 2010; Al-Khouri 2012; Angora & Roulet 2011; Berger & Bouwman 2009; Cucinelli 2013; Ghenimi & Omri 2015; Mohamad et al. 2013; Vodova 2011), suggesting the pro-cyclical nature of liquidity with regard to economic growth. Indeed, economic cycle is likely to affect bank’s intermediary activities and investment decisions. During economic expansion, economic units and banks are optimistic with a view of a good business prospects that allow banks to generate higher income due to increasing demand for credits. During economic recession, decline in businesses performance results in higher default rate and subsequently cause banks to make fewer financing and hold more liquidity.
For market concentration, no significant evidence is observed on the influence of concentration on liquidity risk for banks in OIC countries. This finding is inconsistent with existing literature which reports a negative and significant relationship between market concentration and liquidity risk for developed countries (Angora & Roulet 2011; Horvath et al. 2014; Lei & Song 2013). The insignificant relationship found in this study, may probably be explained by the relatively smaller and underdeveloped of banking system structure in emerging countries; making the difference in market concentration less effective to affect the liquidity risk (Bremus & Buch 2015). Moreover, factors such as high transaction costs and absence of economies of scale prevail over the effect of market concentration on lending activities for banks in emerging countries. Furthermore, in dual banking system countries, Islamic banks coexist with conventional banks and they tend to operate in a more competitive structure causing no comparative advantage in producing credits. Therefore, for banks in OIC countries, market power does not seem to be the key factor in enabling banks to earn a relatively high rate of return from credits supply.
The finding of DIB provides weak support to previous Islamic banking studies (Ismal 2010a; Akhtar et al. 2011; Ali 2013) indicating relatively higher liquidity risk for Islamic banks than conventional banks. First, a possible explanation to the insignificant result would be reflected in our earlier observation showing that on average, Islamic banks have only slightly
higher (2%) financing to deposit ratio as compared to conventional banks. Second, it could be due to the fact that although Islamic banks should operate based on profit and loss (PLS) arrangement (Mudarabah and Musharakah financing), yet in practice, Islamic banks rely more on mark-up financing contracts rather than the PLS (Bourkhis & Nabi 2013). Given the concentration on debt-based financing as the norm in most Islamic banks; it seems that Islamic banks are no different in terms of exposure to liquidity risk. The findings highlight that the behaviour of Islamic banks tends to replicate those of conventional banks. This study cast doubt on the narrowing gap between the Islamic banking practice and conventional ones, making Islamic banks are no different from conventional banks. Beck et al. (2013) stated that Islamic banks’ business model might not be too different from conventional banks. It seems to suggest that Islamic banks tend to deviate from the theoretical business model. Ariff (2014) added that Islamic banks are having product differentiation problem as they follow the conventional risk and return profile subject to Shariah constraints, resulting in debatable reflection of Islamic finance. Moreover, within a country where Islamic banks coexist with conventional banks and where economies and regulatory framework of less developed, Islamic banks expose to the same externalities that may have resultant impact on their level of liquidity risk exposure.
Banks in Malaysia are found to have significantly lower level of liquidity risk than banks in other countries. This would be expected since Malaysia is currently at the forefront of Islamic financial industry among Islamic countries. It is the only Islamic country that facilitated with a formally instituted Islamic Money Market since 1994, while other countries only provide informal arrangements or institutions that specialize in liquidity management services of Islamic financial institutions for example, Bahrain’s Liquidity management Centre (Ismath Bacha 2008). The availability of money market for both banking systems allows banks in the country to manage their liquidity risk exposure more effectively. Moreover, Malaysia’s framework for effective liquidity management in banking is relatively superior to other countries that encompasses of all the necessary components such as a wide range of liquidity instruments; sound regulatory, supervisory and Shariah framework, robust institutional policies and procedures; active secondary market, strong financial safety net; and efficient infrastructure to facilitate issuances (BNM 2015). Given the facilitative environment, it would be expected that both Islamic banks and conventional banks in Malaysia should be able to manage their liquidity issues more efficiently than banks in other countries.
Crisis exerts a positive impact on liquidity risk in banking. It suggests that bank differs in strategizing their liquidity needs during regular and distressed economic environment. During crisis, banks have significantly
JEM 51(2)Dis 2017 05.indd 57 3/27/18 1:23 PM
58 Jurnal Ekonomi Malaysia 51(2)
higher financing to deposit and short term funding ratio while during normal period, their illiquidity ratio decrease. This finding is consistent with that of Reinhart and Rogoff’s (2008) that there is not only a rise in leverage during a financial crisis but also the persistence of asset price inflation. On the same note, Lehmann et al. (2011) showed that many banks suffered from liquidity shortage during the recent Global crisis due to extreme loans-to-deposit ratios that had been extended to households and to their parent banks. Based on this results, it can be argued that during the peak of economic uncertainties, there was a ‘flight to quality’, where economic units with surplus were looking for safe securities in bank. Meanwhile, there were also increasing numbers of deficit units especially those of surviving businesses and households that were in need of financing. Therefore, without certainty of the business cycle, banks have created more liquidity (than they should have) to the public especially credits, during crisis.
The results show that there is no significant difference between liquidity risk in Islamic banks and conventional banks during crisis. The insignificant IB*Crisis variable could be generalized to the fact that both banks are specialized in lending activities and therefore behave in similar way during both good and bad times. This could also be explained by the herding behaviour, where the new and smaller Islamic banks tend to follow the decision made by the bigger and more experienced conventional banks. The collective risk-taking strategies would be the consequence of increasing demand for financing during crisis and due to the explicit or implicit guarantee of the lender of last resort (Bonfim & Kim 2014). Previous studies (Hasan & Dridi 2012; Ali 2013; Beck et al. 2013) argued that although many have claimed that Islamic banks were more resilient to the impact of toxic subprime crisis in 2008, however they were affected by the second round effect of the crisis due to the fact that many Islamic banking contracts were backed by real estate and property; leading to higher liquidity risk. Therefore, there is no significant difference observed of the impact of crisis on liquidity risk in Islamic banks and conventional banks.
By comparing the individual impact of each bank internal factors on liquidity risk between Islamic banks and conventional banks, the findings are mix. Based on Table 5, it shows that only the impact of efficiency and bank specialization are significant in differentiating liquidity risk level between the two banking systems. Further, the impact of capital, credit risk, and profitability on liquidity risk are the same for Islamic banks and conventional banks. There are two important notes from these findings. Firstly, the significantly positive coefficient of interactive term Islamic banks*CE1 shows that the marginal effect of cost efficiency on liquidity risk is more for Islamic banks as compared to conventional banks. In other words, cost efficiency will increase more financing to deposit rate in Islamic banks than conventional banks.
While the significantly negative coefficient of Islamic banks*Bank specialization suggests that the marginal impact of bank specialization on liquidity risk is less in Islamic banks than conventional banks. It indicates that the effect of bank specialization will raise the liquidity risk in conventional banks more than in Islamic banks. Secondly, given that the explanatory power of efficiency on changes in liquidity risk is the highest as compared to explanatory power of bank specialization, it suggests that efficiency is the most important factor to influence bank liquidity risk particularly for Islamic banks. Whereas, the results based on Table 6 indicates that the liquidity risk of Islamic banks can be differentiated from its conventional peers by the factors of credit risk, profitability and bank specialization. In particular, the marginal effect of credit risk explains liquidity risk of Islamic banks more than conventional banks. Whereas liquidity risk in conventional banks are mostly affected by profitability and bank specialization than Islamic banks.
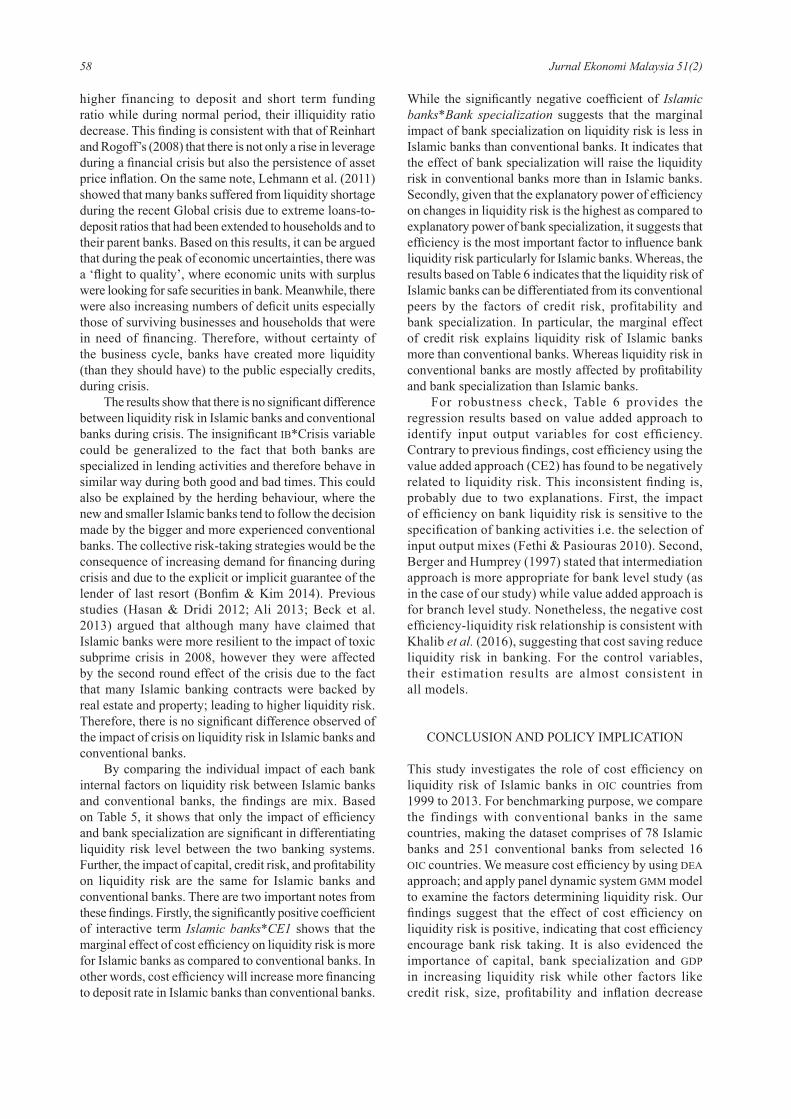
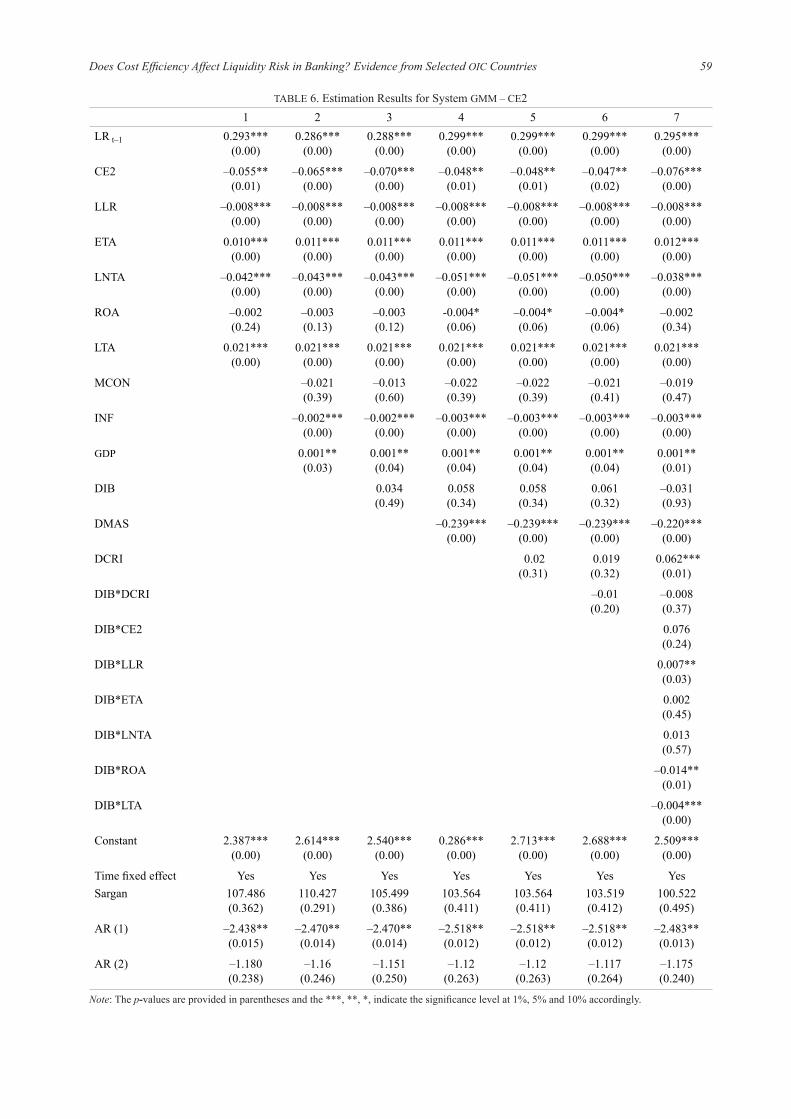
For robustness check, Table 6 provides the regression results based on value added approach to identify input output variables for cost efficiency. Contrary to previous findings, cost efficiency using the value added approach (CE2) has found to be negatively related to liquidity risk. This inconsistent finding is, probably due to two explanations. First, the impact of efficiency on bank liquidity risk is sensitive to the specification of banking activities i.e. the selection of input output mixes (Fethi & Pasiouras 2010). Second, Berger and Humprey (1997) stated that intermediation approach is more appropriate for bank level study (as in the case of our study) while value added approach is for branch level study. Nonetheless, the negative cost efficiency-liquidity risk relationship is consistent with Khalib et al. (2016), suggesting that cost saving reduce liquidity risk in banking. For the control variables, their estimation results are almost consistent in all models.
CONCLUSION AND POLICY IMPLICATION
This study investigates the role of cost efficiency on liquidity risk of Islamic banks in OIC countries from 1999 to 2013. For benchmarking purpose, we compare the findings with conventional banks in the same countries, making the dataset comprises of 78 Islamic banks and 251 conventional banks from selected 16 OIC countries. We measure cost efficiency by using DEA
approach; and apply panel dynamic system GMM model to examine the factors determining liquidity risk. Our findings suggest that the effect of cost efficiency on liquidity risk is positive, indicating that cost efficiency encourage bank risk taking. It is also evidenced the importance of capital, bank specialization and GDP
in increasing liquidity risk while other factors like credit risk, size, profitability and inflation decrease
JEM 51(2)Dis 2017 05.indd 58 3/27/18 1:23 PM
59Does Cost Efficiency Affect Liquidity Risk in Banking? Evidence from Selected OIC Countries
TABLE 6. Estimation Results for System GMM – CE21 2 3 4 5 6 7
LR t–1 0.293***(0.00)
0.286***(0.00)
0.288***(0.00)
0.299***(0.00)
0.299***(0.00)
0.299***(0.00)
0.295***(0.00)
CE2 –0.055**(0.01)
–0.065***(0.00)
–0.070***(0.00)
–0.048**(0.01)
–0.048**(0.01)
–0.047**(0.02)
–0.076***(0.00)
LLR –0.008***(0.00)
–0.008***(0.00)
–0.008***(0.00)
–0.008***(0.00)
–0.008***(0.00)
–0.008***(0.00)
–0.008***(0.00)
ETA 0.010***(0.00)
0.011***(0.00)
0.011***(0.00)
0.011***(0.00)
0.011***(0.00)
0.011***(0.00)
0.012***(0.00)
LNTA –0.042***(0.00)
–0.043***(0.00)
–0.043***(0.00)
–0.051***(0.00)
–0.051***(0.00)
–0.050***(0.00)
–0.038***(0.00)
ROA –0.002(0.24)
–0.003(0.13)
–0.003(0.12)
-0.004*(0.06)
–0.004*(0.06)
–0.004*(0.06)
–0.002(0.34)
LTA 0.021***(0.00)
0.021***(0.00)
0.021***(0.00)
0.021***(0.00)
0.021***(0.00)
0.021***(0.00)
0.021***(0.00)
MCON –0.021(0.39)
–0.013(0.60)
–0.022(0.39)
–0.022(0.39)
–0.021(0.41)
–0.019(0.47)
INF –0.002***(0.00)
–0.002***(0.00)
–0.003***(0.00)
–0.003***(0.00)
–0.003***(0.00)
–0.003***(0.00)
GDP 0.001**(0.03)
0.001**(0.04)
0.001**(0.04)
0.001**(0.04)
0.001**(0.04)
0.001**(0.01)
DIB 0.034(0.49)
0.058(0.34)
0.058(0.34)
0.061(0.32)
–0.031(0.93)
DMAS –0.239***(0.00)
–0.239***(0.00)
–0.239***(0.00)
–0.220***(0.00)
DCRI 0.02(0.31)
0.019(0.32)
0.062***(0.01)
DIB*DCRI –0.01(0.20)
–0.008(0.37)
DIB*CE2 0.076(0.24)
DIB*LLR 0.007**(0.03)
DIB*ETA 0.002(0.45)
DIB*LNTA 0.013(0.57)
DIB*ROA –0.014**(0.01)
DIB*LTA –0.004***(0.00)
Constant 2.387***(0.00)
2.614***(0.00)
2.540***(0.00)
0.286***(0.00)
2.713***(0.00)
2.688***(0.00)
2.509***(0.00)
Time fixed effect Yes Yes Yes Yes Yes Yes YesSargan 107.486
(0.362)110.427(0.291)
105.499(0.386)
103.564(0.411)
103.564(0.411)
103.519(0.412)
100.522(0.495)
AR (1) –2.438**(0.015)
–2.470**(0.014)
–2.470**(0.014)
–2.518**(0.012)
–2.518**(0.012)
–2.518**(0.012)
–2.483**(0.013)
AR (2) –1.180(0.238)
–1.16(0.246)
–1.151(0.250)
–1.12(0.263)
–1.12(0.263)
–1.117(0.264)
–1.175(0.240)
Note: The p-values are provided in parentheses and the ***, **, *, indicate the significance level at 1%, 5% and 10% accordingly.
JEM 51(2)Dis 2017 05.indd 59 3/27/18 1:23 PM
60 Jurnal Ekonomi Malaysia 51(2)
liquidity risk. The findings imply the need of developed money market to facilitate liquidity risk exposure, as indicated by low liquidity risk experienced by banks in Malaysia. Finally, we find that the liquidity risk of Islamic banks is no different to conventional banks’. The findings seem to imply the shift of Islamic banking business model towards the conventional model; heavily depend on debt based financing. This requires product restructuring towards a genuine Shariah based products that emphasize on value proposition of Islamic financial intermediation. The Islamic banking products should constitute features of authenticity, distinct and competitive so that the industry could have a meaningful progress. Concerning the current development of liquidity facilities for Islamic banking, efforts in product developments and innovations are critical for an effective way of managing liquidity risk exposure.
The findings provide several benefits towards economic and policy intuitive. First, managers will be better guided on effective liquidity risk management by striking a balance between profitability, stability and liquidity. Investors and stakeholders will have better information on their investments (bank) and the level of liquidity risk in these banks. Second, given the current state of liquidity in Islamic banking and how different level of efficiency of different bank types affects bank risk taking, this study provides an avenue for policy makers to revise the current supervisory and regulatory framework on managing bank liquidity risk in both banking systems that has direct implications on the current capital regulatory requirements in Basel III and IFSB standards on issues of solvency. This is relevant concerning the sustainability of the whole financial system in the future and how Islamic banks manage their exposure to liquidity risk.
However, there are several limitations of the study. The lack of data availability for Islamic banks involving multiple countries only allow the study to compute liquidity risk using the traditional financial ratio i.e. financing to deposit and short term funding, thus excluding other liquidity management mechanisms involving market funding and off-balance sheet activities. There is still an avenue for this research to be extended in the future, with more comprehensive data and re-evaluate the determinants of liquidity risk and how its behaviour might change in the event where more product innovations and developed money market is available. Within a competitive and conducive environment, it is interesting to examine whether there will be an adjustment of Islamic banking practice towards conventional banks or they will be well distinguished and specialized in their own unique way. In addition, more sophisticated measure could be used to measure liquidity risk for more reliable results. The application of robustness tests using several alternative measures of liquidity risk will provide better understanding on factors affecting liquidity risk in banking.
NOTE
1 As compared to conventional banks, Islamic banks face higher level of risk in the absence of risk management tools and developed institutional infrastructure such as Shariah compliant derivative instruments, interbank market and money market (IFSB, 2012). Moreover, the safety nets and resolution regimes remain underdeveloped, for instance the availability of Islamic deposit insurance scheme and discount windows from lender of last resort facility.
2 First, the net interest (between bank rates and market rates) may change over time in the cost of economic performance of a country. Consequently, an output of today can turn into an input in the next day if the sign of net interest change. Second, the calculation of marginal revenues and cost for each item especially liability is somehow a difficult task.
3 Following Beck et al. (2013), we used the data from the non-consolidated income statements and balance sheets whenever they are available. Otherwise, the data from consolidated statements are referred. Non-consolidated data are favorable because they have more detailed categories than consolidated data. Besides, it is bank-level data instead of bank-group data and therefore avoids the double counting of subsidiaries in the dataset. In addition, only banks with at least three consecutive years of observations are included.
4 Input oriented cost efficiency address the objective of minimizing the input prices without changing the production of output volumes.
REFERENCES
Ahmed, N., Ahmed, Z., & Naqvi, I. H. 2011. Liquidity risk and Islamic banks: Evidence from Pakistan. Interdisciplinary Journal of Research in Busines 1(9): 99-102.
Aigner, D., Lovell, C.K. & Schmidt, P.1977. Formulation and estimation of stochastic frontier production function models. Journal of Econometrics 6(1): 21-37.
Akhtar, M. F., Ali, K., & Sadaqat, S. 2011. Liquidity risk management: A comparative study between conventional and Islamic banks of Pakistan. Interdisciplinary Journal of Research in Business 1(1): 35-44.
Alam, N. 2012. Efficiency and risk-taking in dual banking system: Evidence from emerging markets. International Review of Business Research Papers 8(4): 94-111.
Ali, S.S. 2013. State of liquidity management in Islamic financial institutions. Islamic Economic Studies 21(1): 63-98.
Alman, M. & Oehler, A. 2010. Liquidity transformation factors of Islamic banks: An empirical analysis. Bamberg University, Bamberg.
Altunbas, Y., Liu, M.H., Molyneux, P. & Seth, R. 2000. Efficiency and risk in Japanese banking. Journal of Banking & Finance 24(10):1605-1628.
Altunbas, Y., Carbo, S., Gardener, E.P.M., & Molyneux, P. 2007. Examining the relationships between capital, risk and efficiency in European banking. European Financial Management 13(1): 49-70.
Al-Jarrah, I. & Molynex, P. 2007. Efficiency in Arabian banking. Jordan Journal of Business Administration 3(3): 373-390.
Al-Khouri, R. 2012. Bank characteristics and liquidity transformation: The case of GCC banks. International Journal of Economics and Finance 4(12): 114-120.
JEM 51(2)Dis 2017 05.indd 60 3/27/18 1:23 PM
61Does Cost Efficiency Affect Liquidity Risk in Banking? Evidence from Selected OIC Countries
Angora, A. & Roulet, C. 2011. Transformation risk and its determinants: A new approach based on the Basel III liquidity management framework. Universite de Limoges.
Arellano, M., & Bond, S. 1991. Some tests of specification for panel data: Monte Carlo evidence and an application to employment equations. Review of Economic Studies 58: 277-297.
Arellano, M., & Bover, O. 1995. Another look at the instrumental variable estimation of error-components models. Journal of Econometrics 68: 29-51.
Ariff, M. 2014. Whither Islamic Banking? The World Economy 37(6): 733-746.
Bader, M.K.I., Shamsher, M., & Ariff, M. 2007. Cost, revenue, and profit efficiency of conventional versus Islamic banks: International evidence using Data Envelopment Analysis. Islamic Economic Studies 15(2): 23-76.
Basel Committee. 2008. Principles for sound liquidity risk management and supervision. BIS, Basel.
BNM. 2015. Financial stability and payment system report 2014.Bank Negara Malaysia
Beck, T., Levine, R. & Loayza, N. 2000. Finance and the sources of growth. Journal of Financial Economics 58(1): 261-300.
Beck, T., Demirgüç-Kunt, A., & Merrouche, O. 2013. Islamic vs. conventional banking: Business model, efficiency and stability. Journal of Banking & Finance 37: 433-447.
Berger, A.N., & De Young, R. 1997. Problem loans and cost efficiency in commercial banks. Journal of Banking and Finance 21: 849-870.
Berger, A.N. & Humphrey, D.B. 1997. Efficiency of financial institutions: International survey and directions for future research. European Journal of Operational Research 98(2):175-212.
Berger, A.N., & Bouwman, C.H. 2009. Bank liquidity creation. Review of Financial Studies 22(9): 3779-3837.
Berger, A.N., Bouwman, C.H., Kick, T. & Schaeck, K. 2016. Bank liquidity creation following regulatory interventions and capital support. Journal of Financial Intermediation 26: 115-141.
Berger, A.N. & Bouwman, C.H. 2017. Bank liquidity creation, monetary policy, and financial crises. Journal of Financial Stability 30: 139-155.
Bhattacharyya, A., Lovell, C.A.K., & Sahay, P. 1997. The impact of liberalization on the productive efficiency of Indian commercial banks. European Journal of Operational Research 98: 332-345.
Blundell, R., & Bond, S. 1998. Initial conditions and moment restrictions in dynamic panel data models. Journal of Econometrics 87(1): 115-143.
Bonfim, D., & Kim, M. 2014. Liquidity risk in banking: Is there herding? European Banking Center Discussion Paper 452.
Bourkhis, K., & Nabi, M.S. 2013. Islamic and conventional banks’ soundness during the 2007–2008 financial crisis. Review of Financial Economics 22: 68-77.
Bremus, F., & Buch, C. M. 2015. Banking market structure and macroeconomic stability: Are low income countries special? Pacific Economic Review 20(1): 73-100.
Brissimis, S.N., Delis, M.D. & Papanikolaou, N.I. 2008. Exploring the nexus between banking sector reform and performance: Evidence from newly acceded EU countries. Journal of Banking & Finance 32(12): 2674-2683.
Charnes A., Cooper, W.W., & Rhodes, E. 1978. Measuring the efficiency of decision making units. European Journal of Operational Research 2 :429-444.
Chen, T.H., Chou, H.H., Chang, Y., & Fang, H. 2015. The effect of excess lending on bank liquidity: Evidence from China. International Review of Economics & Finance 36: 54-68.
Coelli, T. 1996. A guide to DEAP version 2.1: a data envelopment analysis (computer) program. Centre for Efficiency and Productivity Analysis, University of New England, Australia.
Cucinelli, D. 2013. The determinants of bank liquidity risk within the context of Euro area. Interdisciplinary Journal of Research in Business 2(10): 51-64.
Dusuki, A. W. 2007. Commodity Murabahah Programme (CMP): An innovative approach to liquidity management. Journal of Islamic Economics, Banking and Finance
3(1): 1-23.Farrell, J. 1957. The measurement of productive efficiency.
Journal of the Royal Statistical Society 120: 253-281.Fiordelisi, F., Marques-Ibanez, D. & Molyneux, P. 2009.
Efficiency and risk taking in European banking.Ghenimi, A., & Omri, M. A. B. 2015. Liquidity Risk
Management: A Comparative Study between Islamic and Conventional Banks. Journal of Business Management and Economics 3(6): 25-30.
Gujarati, D.N. & Porter, D. 2009. Basic Econometrics. Mc Graw-Hill International Edition.
Hackethal, A., Rauch, C., Steffen, S. & Tyrell, M. 2010. Determinants of bank liquidity creation. Social Science Research Network.
Hakim, S.R. 2007. Islamic money market instruments. In: Hasan, M. K.,& Lewis, M. K. Handbook of Islamic Banking. Edward Elgar Publishing Inc USA, 161-171.
Hancock, D. 1991. A theory of production for the financial firm. Boston: Kluwer Academic Publishers.
Hasan, M., & Dridi, J. 2010. The effects of the global crisis on Islamic and conventional banks: A comparative study. IMF Working Paper.
Holtz-Eakin, D., Newey, W., & Rosen, H. 1988. Estimating vector autoregressions with panel data. Econometrica 56: 1371-1395.
Horvath, R., Seidler, J. & Weill, L.2014. Bank capital and liquidity creation: Granger-causality evidence. Journal of Financial Services Research 45(3): 341-361.
Horvath, R., Seidler, J. & Weill, L. 2016. How bank competition influences liquidity creation. Economic Modelling 52: 155-161.
Iqbal, A. 2012. Liquidity risk management: A comparative. Global Journal of Management and Business Research 12(5): 54-64.
Ismal, R. 2010a. Assessment of liquidity management in Islamic banking industry. International Journal of Islamic and Middle Eastern Finance and Management 3(2): 147-167.
Ismal, R. (2010b). How do Islamic banks manage liquidity risk? An empirical survey on the Indonesian Islamic banking industry. Kyoto Bulletin of Islamic Area Studie 3(2): 54-81.
Ismath Bacha, O. (2008). The Islamic Interbank Money Market and a dual banking system: The Malaysian experience. International Journal of Islamic and Middle Eastern Finance and Management 1(3): 210-226.
JEM 51(2)Dis 2017 05.indd 61 3/27/18 1:23 PM
62 Jurnal Ekonomi Malaysia 51(2)
Johnes, J., Izzeldin, M., & Pappas, V. 2014. A comparison of performance of Islamic and conventional banks 2004-2009. Journal of Economic Behavior and Organization 103: 93-107.
Khalib, M, Abdul Rahman, A. & Janor, H. 2016. Impak kecekapan kos terhadap risiko kecairan dalam institusi perbankan di Malaysia. Jurnal Pengurusan 47: 67-79.
Klomp, J., De Haan, J. 2012. Banking risk and regulation: Does one size fit all? Journal of Banking and Finance
36: 3197-3212.Klomp, J. &De Haan, J. 2014. Bank regulation, the quality of
institutions, and banking risk in emerging and developing countries: An empirical analysis. Emerging Markets Finance and Trade 50(6): 19-40.
Lehmann, A., Levi, M., & Tabak, P. 2011). Basel III and regional financial integration in emerging Europe: An overview of key issues. EBRD Working Paper 132.
Lei, A. C. H., & Song, Z. 2013. Liquidity creation and bank capital structure in China. Global Finance Journal 24(3): 188-202.
Miah, M.D., & Sharmeen, K. 2015. Relationship between risk and efficiciency: Comparative analysis between Islamic and conventional banks of Bangladesh. International Journal of Islamic and Middle Eastern Finance and Management 8(2): 203-221.
Mohamad, A.A.S., Mohamad, M.T. & Samsudin, M.L. 2013. How Islamic banks of Malaysia managing liquidity? An emphasis on confronting economic cycles. International Journal of Business and Social Science 4(7).
Radic, N., Fiordelisi, F., Girardone, C. 2012. Efficiency and risk-taking in pre-crisis investment banks. Journal Financial Services Research 41(1-2): 81-101.
Ramlan, H. & Adnan, M.S. 2016. The profitability of Islamic and conventional bank: Case study in Malaysia. Procedia Economics and Finance 35: 359-367.
Ramzan, M., & Zafar, M.I. 2014. Liquidity risk management in Islamic banks: A study of Islamic banks of Pakistan. Interdisciplinary Journal of Contemporary Research in Business 5(12): 199-215.
Reinhart, C.M., & Rogoff, K.S. 2008. Is the 2007 U.S. sub-prime financial crisis so different? An international historical comparison. The American Economic Review 98(2): 339-344.
Roman, A., & Sargu, A.C. 2015. The impact of bank-specific factors on the commercial banks liquidity: Empirical evidence from CEE countries. Procedia Economics and Finance 20(15): 571-579.
Rossi, M., Schwaiger, & Winkler, G. 2005. Managerial behavior and cost/profit efficiency in the banking sectors of Central and Eastern European countries. Oesterr. Nationalbank.
Rozzani, N., & Rahman, R.A. 2013. Determinants of bank efficiency: Conventional versus Islamic. International Journal of Business and Management 8(14): 98-110.
Said, A. 2013. Risks and efficiency in the Islamic banking systems: The case of selected Islamic banks in MENA
region. International Journal of Economics and Financial Issues 3(1): 66-73.
Sarmiento, M. & Galan, J.E. 2015. The influence of risk-taking on bank efficiency: Evidence from Colombia.Center for Economic Research Tilburg 2015-036.
Sealey, C., &. Lindley, J.T. 1977. Inputs, outputs, and a theory of production cost a depository financial institutions. Journal of Finance 32: 1251-66.
Siraj, K., & Pillai P.S. 2012. Comparative study on performance of Islamic banks and conventional banks in GCC region. Journal of Applied Finance & Banking 2(3):123-151.
Sufian, F. 2007a. The efficiency of Islamic banking industry in Malaysia: Foreign vs. domestic banks. Humanomics
23: 174-92.Sufian, F. 2007b. The efficiency of Islamic banking industry:
A non-parametric analysis with non-discretionary input variable. Islamic Economic Studies 14(1-2): 53-75.
Sufian, F. 2009. Determinants of bank efficiency during unstable macroeconomic environment: Empirical evidence from Malaysia. Research in International Business and Finance 23: 54-77.
Sufian, F. 2011. Benchmarking the efficiency of the Korean banking sector: A DEA approach. Benchmarking: An International Journal 18(1): 107-127.
Turk-Ariss, R. 2010. Competitive conditions in Islamic and conventional banking: A global perspective. Review of Financial Economics 19: 101-108.
Vodova, P. 2011. Liquidity of Czech commercial banks and its determinants. International Journal of Mathematical Models and Methods in Applied Sciences 5(6): 1060-1067.
William, J. (2004). Determining management behaviour in European banking. Journal of Banking Finance 28: 2427-2440.
Yaacob, S.F., Abdul Rahman, A. & Abdul Karim, Z. 2016. The determinants of liquidity risk: A panel study of Islamic banks in Malaysia. Journal of Contemporary Issues and Thought 6: 73-82.
Syajarul Imna Mohd Amin*School of ManagementFaculty of Economics and Management Universiti Kebangsaan Malaysia 43600 UKM, Bangi, SelangorMALAYSIA E-mail: [email protected]
Shamsher Mohamad Ramadili MohdInternational Centre for Islamic Finance (INCEIF)
The Global University of Islamic FinanceLorong University A,59100 Kuala LumpurMALAYSIAE-mail: [email protected]
Mohamed Eskandar Shah Mohd. RasidInternational Centre for Islamic Finance (INCEIF)
The Global University of Islamic FinanceLorong University A,59100 Kuala LumpurMALAYSIAE-mail: [email protected]
*Corresponding author
JEM 51(2)Dis 2017 05.indd 62 3/27/18 1:23 PM