Embed Size (px)
Citation preview

The GerontologistCite journal as: The Gerontologist doi:10.1093/geront/gnt129
Page 1 of 11
© The Author 2013. Published by Oxford University Press on behalf of The Gerontological Society of America. All rights reserved. For permissions, please e-mail: [email protected].
The Role of Organizational Culture in Retaining Nursing Workforce
Jane Banaszak-Holl, PhD,*,1 Nicholas G. Castle, PhD,2 Michael K. Lin, PhD,3 Nijika Shrivastwa, MPH,4 and Gretchen Spreitzer, PhD,5
1Department of Health Management and Policy, University of Michigan School of Public Health, Institute of Gerontology, University of Michigan Medical School, Ann Arbor.
2Department of Health Policy and Management, University of Pittsburgh School of Public Health, Pittsburgh, Pennsylvania.3Providigm, LLC, Denver, Colorado.
4Department of Epidemiology, University of Michigan School of Public Health, Ann Arbor.5Department of Management and Organizations, University of Michigan Ross Business School, Ann Arbor.
*Address correspondence to Jane Banaszak-Holl, PhD, Department of Health Management and Policy, University of Michigan School of Public Health, Institute of Gerontology, University of Michigan Medical School, 1415 Washington Heights Avenue, Ann Arbor, MI 48109-2029. E-mail: [email protected]
Received April 26, 2013; Accepted September 24, 2013Decision Editor: Rachel Pruchno, PhD
Purpose of the Study: We examined how organizational culture in nursing homes affects staff turnover, because culture is a first step to creating satisfactory work environments. Design and Methods: Nursing home administrators were asked in 2009 to report on facility culture and staff turnover. We received responses from 419 of 1,056 adminis-trators contacted. Respondents reported the strength of cultural values using scales from a Competing Values Framework and percent of staff leaving annu-ally for Registered Nurse (RN), Licensed Practice Nurse (LPN), and nursing aide (NA) staff. We esti-mated negative binomial models predicting turnover. Results: Turnover rates are lower than found in past but remain significantly higher among NAs than among RNs or LPNs. Facilities with stronger market values had increased turnover among RNs and LPNs, and among NAs when turnover was adjusted for facil-ities with few staff. Facilities emphasizing hierarchi-cal internal processes had lower RN turnover. Group and developmental values focusing on staff and innovation only lowered LPN turnover. Finally, effects on NA turnover become insignificant when turnover was adjusted if voluntary turnover was reported. Implications: Organizational culture had differen-tial effects on the turnover of RN, LPN, and NA staff that should be addressed in developing culture-change
strategies. More flexible organizational culture values were important for LPN staff only, whereas unexpect-edly, greater emphasis on rigid internal rules helped facilities retain RNs. Facilities with a stronger focus on customer needs had higher turnover among all staff.
Key Words: Long-term care, Nursing staff turnover, Organizational culture
In this study, we examine how organizational culture affects staff turnover within U.S. nursing homes, where organizational culture can be best described as a critical first step towards creating satisfactory work environments. Understanding the effects of organizational culture on turnover is important because cultural values pervade all aspects of organizational life, even when manage-ment is not physically present. Broader organiza-tional culture provides a key mechanism by which top management integrate managerial actions into strategic organizational design. This study builds on past research on staff satisfaction and turnover, which has examined a number of ways in which managerial actions define the work environment. At the same time, we examine staff turnover more recently than previous work and provide an updated view of staff turnover within nursing homes.
The Gerontologist Advance Access published November 11, 2013 at U
niversity of Michigan on M
arch 21, 2014http://gerontologist.oxfordjournals.org/
Dow
nloaded from

Page 2 of 11 The Gerontologist
Nursing staff turnover is a critical issue in main-taining high-quality nursing home services, as nurs-ing homes persistently facing high staff turnover have lower quality of care (Harrington & Swan, 2003; Castle & Engberg, 2005) and increased use of temporary agency or contract staff (Castle, Engberg, & Men, 2008). Furthermore, high turno-ver reduces facilities’ ability to maintain manda-tory staffing levels (Harrington & Swan, 2003; Seblega et al., 2010). Whereas turnover itself is problematic, its presence also is affected by and in turn affects the general work climate (Brannon, Zinn, Mor & Davis, 2002). Researchers have argued that the nursing home industry experiences high rates of turnover because working conditions can be both emotionally and physically challenging (Eaton, 2000), wages and financial incentives for these jobs are low relative to other health care set-tings (Kaye, Chapman, Newcomer & Harrington, 2006), and a nursing workforce shortage makes replacing staff difficult (Lapane & Hughes, 2006).
Past research has found that managerial prac-tices affect staff turnover in nursing homes (Castle, Engberg, Anderson & Men, 2007). In an early study, Banaszak-Holl and Hines (1996) found that nurse aide turnover was lower in facilities that involved nurse aides in care planning. More recently, researchers have found that staffing levels (Castle et al., 2007), training opportunities (Grant et al., 1996), work climate (Brannon, Zinn, Mor & Davis, 2002; Donoghue & Castle, 2009), and com-munication with management (Anderson, Corazzini & McDaniel, 2004; Donoghue & Castle, 2006) affect turnover rates. This body of evidence sug-gests that management is an appropriate target for interventions to reduce staff turnover. These studies have examined impact on overall turnover rates as well as adjusting for involuntary exits (Donoghue & Castle, 2006) and for differences between high and low turnover rates (Brannon, Zinn, Mor & Davis, 2002), suggesting that managerial factors have broad importance for staff behavior.
Our analysis builds most closely on Donoghue and Castle’s study (2009) of how managerial styles affect turnover rates. They identified three styles of facility leadership (i.e., consensus building, con-sultative, and autocratic) and found that facilities with consensus and consultative leaders have lower turnover rates than facilities with autocratic lead-ers. Although facility managers made a difference in how they treat employees, the cultural environment they create goes beyond their style of relationship building and persists even when they are not visibly
present. For example, past researchers have argued that too strong of a focus on corporate-driven incen-tives influences working conditions and subsequent satisfaction and turnover (Brannon et al., 2002). Organizational culture more generally includes the promotion of values relevant to strategic focus and the way work is done, whereas specific leadership styles are more closely linked to interpersonal rela-tionships. With a heavy focus in the current long term–care market on whether nursing homes can strategically change with increasing standards of care, organizational culture and its impact on staff behavior will be key for transformation of care.
The Role of Organizational Culture
Developing organizational culture is a basic managerial tool for improving the work envi-ronment by emphasizing core values necessary for individual and organizational effectiveness. Organizational culture is closely related to but should not be confused as equivalent to the con-cept of organizational climate. Climate refers spe-cifically to the level of consensus among employees on cultural values (Reichers & Schneider, 1990) and the everyday enactment of cultural beliefs (Denison, 1996; Glisson & James, 2002), whereas organizational culture refers specifically to organi-zational values as promoted by top management. Top management takes the first step in developing organizational culture and then communicates cul-tural importance through role modeling, standard operating procedures, and strategies for change.
We measure nursing home culture using the Competing Values Framework (CVF), a commonly used, validated survey instrument for studying organizational culture (Cameron & Quinn, 2006). The systematic study of organizational culture in large samples has developed mostly in the last 25 years (Martin, 2002; Scott et al., 2003), and the CVF is one of the primary instruments for study-ing culture and its effect on performance in health care settings (Davies et al., 2007; Zazzali et al., 2007). Scott-Cawiezell and colleagues (2005) used the CVF to study nursing home cultures in 31 Colorado nursing homes. The CVF dichotomizes the values held by top managers along two dimen-sions which when juxtaposed create four cultural archetypes. The internal versus external dimen-sion reflects whether organizations focus attention internally (such as on improving work processes) or focus attention externally (such as on scan-ning the environment to monitor competition and
at University of M
ichigan on March 21, 2014
http://gerontologist.oxfordjournals.org/D
ownloaded from

Page 3 of 11
new opportunities). The stability versus flexibility dimension indicates whether managers enforce adherence to the status quo (such as enforcing existing rules or processes) or whether they pro-vide flexibility in adapting work to immediate needs and the changing environment (Zuckerman, Dowling & Richardson, 2000).
Juxtaposing the two value dimensions within the CVF results in four competing or diametrically opposed cultural types: a group culture, a develop-mental culture, a hierarchical culture, and a market culture. Group cultures (high internal focus and flexibility) have participative leaders, members moti-vated by membership and attachment to the group, and emphasize member development and commit-ment. Developmental cultures (high external focus and flexibility) have entrepreneurial leaders, mem-bers motivated by growth and creativity needs, and emphasize growth and resource acquisition. Market cultures (high external focus and stability) have directive leaders and members who are motivated by competition, and emphasize productivity and effi-ciency. Hierarchical cultures (high internal focus and stability) have conservative leaders, members moti-vated to follow rules and maintain order, and a focus on control, and efficiency as markers of effectiveness.
Figure 1 shows the juxtaposition of the CVF’s two dimensions and four cultural types. A focus on “competing” values implies that managers grapple with conflicting priorities although scholars now recognize that high performing organizations may promote multiple and sometimes conflicting values
(Davies et al., 2007; Shortell et al., 2004; Zazzali et al., 2007).
Organizational culture reflects value systems that become embedded in managerial practices, work processes and ultimately patient care, and the key values associated with a particular culture may resonate or not with the clinical staff in a facility. For example, values key to a group culture include a focus on staff cohesion, internal communication, and individual development; these values may be particularly important for clinical staff who manage difficult problems in patient care and depend upon a team of clinical staff in order to provide excellent care (Scott-Cawiezell et al., 2005). We subsequently develop several hypotheses, given that professional nursing norms fit with flexible work environments and, furthermore, that clinical professionals will react positively to work environments that encour-age their participation and engagement (Anderson, Corazzini & McDaniel, 2004; Brannon, Zinn, Mor & Davis, 2002; Donoghue & Castle, 2009). It may be that participatory environments also make it more difficult to fire employees who do not fit or who have problems, and subsequently we expect this relationship to hold regardless of whether turnover is voluntary or involuntary (Donoghue & Castle, 2007). Subsequently, we expect
Hypothesis 1: Facilities with stronger group or developmental cultural values will have lower turnover rates.
Furthermore, we expect that facilities with organizational cultures emphasizing a focus on meeting performance targets and cost controls will be less likely to retain staff and may even encourage staff turnover through downsizing and involuntary firings when staff make mistakes. Nursing staff may question whether organizational performance is in the best interest of residents and may also feel less committed to organizations with relatively rigid cultural values and thus may be more likely to leave the organization. Thus, we suggest that
Hypothesis 2: Facilities with stronger hierarchi-cal or market cultural values will have higher turnover rates.
Again, we expect this relationship to hold regardless of whether turnover is voluntary or involuntary.
Methods
The nursing homes included in this study had been surveyed previously in 2005 and 2006
Figure 1. Competing values framework dimensions and cultural types.
at University of M
ichigan on March 21, 2014
http://gerontologist.oxfordjournals.org/D
ownloaded from

Page 4 of 11 The Gerontologist
regarding their turnover rates (Castle, 2008). We selected a random sample of the nursing homes pre-viously surveyed, and surveys were sent to them in the period from late fall 2008 through early 2009. The original sample was nationally representa-tive of U.S. nursing home facilities based upon a comparison to the Online Survey Certification and Reporting (OSCAR) database. In this round, surveys were mailed to both the nursing home administrators (NHAs) and Directors of Nursing (DONs) in facilities. The NHA and DON were surveyed regarding organizational culture because they play a primary role in the creation of organi-zational values and managing human resources (Davies et al., 2007; Banaszak-Holl et al., 2010). NHAs were also asked to report staff turnover for their facilities. We limited survey length in order to minimize response burden because previous research has shown that response rates among nursing home staff are not high. Human-subject involvement was approved by the Institutional Review Board Committees at the Universities of Michigan and Pittsburgh.
Our follow-up and incentive payment meth-ods were based on Dillman’s (2000) recommen-dations that token payments, representations of goodwill, and rigorous follow-up methods are the most effective tools for reducing respondent loss (Dillman, 2000). We included a $5 gift card as a token of appreciation with all mailed surveys. Of the contacted facilities, 37 had closed since the last contact and were thus dropped from the study. Telephone call reminders were made to nonre-spondents in the four months following the initial survey mailing and a second mailing was sent to all nonrespondents. Excluding the closed facili-ties, our final sample came from 1,056 facilities or 2,112 contacted individuals. Among individuals, 38.7% or 817 responded to the survey, including 419 NHAs and 398 DONs. Results are reported here for the 419 facilities with NHA responses.
We matched survey data to the 2009 OSCAR data, which includes all nursing home facilities that are Medicaid and Medicare certified. OSCAR is the most comprehensive source of facility-level information on nursing homes and from these data, we drew information on organizational char-acteristics including facility size and ownership and aggregate resident mix. Past research based on the earlier sample found that despite lower par-ticipation among poorer quality facilities, nonre-sponse did not jeopardize generalizability (Castle & Engberg, 2006). We further examined whether
facility characteristics affected response rates for this survey round using available OSCAR data. We found that respondents and nonrespondents differed on a few variables (Banaszak-Holl et al., 2013), with respondent facilities more likely to come from geographic areas with lower per capita incomes, somewhat less likely to be for profit and reported slightly higher occupancy rates. In addi-tion, Appendix A (Supplementary Material) com-pares our responding facilities to the U.S. nursing home population in 2009, which shows some statistically significant differences between these groups: responding facilities were more likely to be nonprofit and had more beds and higher occupancy and fewer Medicare residents than U.S. nursing homes overall. These differences limit the general-izability of our study as we discuss in limitations.
Variable Constructs
This study uses turnover measures comparable to those developed in the National Nursing Home Turnover Study or NNHTS (Castle, Engberg, Anderson, & Men, 2007). Traditionally, much of the research on staff turnover has used small sam-ples of facilities; the NNHTS is one exception in which researchers collected turnover data from a large number of facilities across multiple time points (Castle, 2008). The NNHTS and other large surveys have revealed that collecting turnover data can be difficult; although, NHAs track turnover data rou-tinely through administrative processes. We inter-viewed several NHAs when designing the survey, who reported tracking the percent staff turnover administratively. Subsequently, we asked NHAs to identify the percent of staff who leave the organiza-tion within 12- and 6-month periods for staffing categories of Registered Nurses (RNs), Licensed Practice Nurses (LPNs), and nurse aides (NAs) separately. These questions differ slightly from the original NNHTS questions in which NHAs were asked to report the number of staff experiencing turnover. There are no published results compar-ing reporting methods using either the number or percent of staff who leave, and we recognize that comparisons to the NNHTS are limited.
The NNHTS developed a method of request-ing turnover data separately for RNs, LPNs, and NAs in several forms, including 6- and 12-month reports and overall as well as within categories of full and part-time staff and for contract staff sep-arately. These details provide some indication of how turnover rates vary within as well as across
at University of M
ichigan on March 21, 2014
http://gerontologist.oxfordjournals.org/D
ownloaded from

Page 5 of 11
facilities. In this study, we found NHAs reluctant to provide detailed turnover information across all the subcategories of staffing, and subsequently, we report analyses using overall 12-month turnover measures. For example, administrators were much less likely to provide 6-month turnover rates than 12-month turnover rates in our survey. In examin-ing the impact of culture, we look at the effects on the estimated count of staff leaving during the 12-month window, by multiplying reports of per-cent turnover by reported Full-time Equivalents (FTEs) within staff categories.
We have compared the turnover rates from our study with a number of earlier studies over the last decade, including those reported by Donoghue (2010), Castle (2008), and Donoghue and Castle (2009). Our turnover rates are consistent with reports in these studies, which all used national sampling frameworks. For example, our estimated turnover rates are within 10% of those from 2007 (Donoghue and Castle, 2009), 2 years previous. Overall, comparisons across these studies appear to indicate a slight downward trend in staff turno-ver across the decade; although, a full meta-analy-sis is needed to make conclusive statements about trends.
We did find that NHAs from facilities with few (i.e., <5) staff in any particular nursing category (either RN, LPN, or NA) were more likely to report relatively small percentages of staff turnover (e.g., in a facility with only one RN, the 12-month turn-over rate may be reported as low as 1%). To adjust for potential underreporting of turnover within the facilities with the fewest staff, we adjusted reports of percent turnover by a factor of 10 when staff-ing in a category fell below 5 employees. In doing this, we sought to realistically adjust the turnover reports upwards while still using count models to predict the impact of culture. We have tried alter-native methods for analyzing these data. For exam-ple, turnover was categorized by quartile, into the lowest, second lowest, second highest, and highest quartiles in order to minimize assumptions about the data distribution, and then quartile member-ship was predicted using an ordinal logistic model; the effects of culture were similar (these results are available from the authors upon request). The adjusted counts are reported because they provide a meaningful way to discuss the impact of culture on differences in turnover.
Although only 22% of responding NHAs pro-vided separate estimates for voluntary turnover, past research has argued that it is important to
adjust for voluntary turnover (Castle, 2006). We replaced turnover rates with the estimated volun-tary turnover rates when available and found some changes in the relationship between culture and turnover, as reported and discussed in sensitivity analyses.
Culture Measures.—Reliable and valid CVF sur-vey instruments use a set of value statements for each cultural type to which respondents assign priority or importance (Yeung et al., 1991; Scott et al., 2003). The CVF measures have been demonstrated to have reli-ability of the order of .70 or higher using Cronbach’s alpha and the validity of these measures has been established in other industries using multitrait, multi-method analyses (Spreitzer & Quinn, 1991). Each of the four cultural values in the CVF is identified using four Likert-scaled questions. In these questions, respond-ents were asked to rate on a scale from 1 (strongly disa-gree) to 7 (strongly agree) whether “possible values are operating and emphasized in your nursing home as a whole.” Subsequently, a nursing home may score high on more than one cultural type. For example, a nurs-ing home administrator may evaluate values of both a group and developmental culture as strong within their facility.
For a group culture, respondents were asked about values emphasizing: (a) human relations, teamwork, and cohesion; (b) employee concerns and ideas; (c) participation and open discussion; and (d) morale. For a developmental culture, val-ues included: (a) innovation and change, (b) new ideas, (c) creative problem solving, and (d) decen-tralization. For a market culture, values included: (a) outcome excellence and quality, (b) getting the job done, (c) goal achievement and (d) doing one’s best. For a hierarchical culture, values included: (a) order, (b) stability and continuity, (c) dependability and reliability, and (d) predictable outcomes.
Relative strength of culture, and whether having a predominantly stronger culture in one domain affects turnover. Reports of the average values for facilities on the cultural items have been reported elsewhere (Banaszak-Holl et al., 2013).
Controls.—Control variables include those from our survey, OSCAR data, and American Health Care Association (AHCA) reports of the average 2007 turn-over rates by state. OSCAR measures include whether the facility is chain owned or for profit (both coded as dummy variables), whether the facility is hospital based, number of beds in the facility, occupancy rate
at University of M
ichigan on March 21, 2014
http://gerontologist.oxfordjournals.org/D
ownloaded from
Page 6 of 11 The Gerontologist
defined as number of residents relative to the number of beds, and the percent of residents within the facil-ity covered by Medicare, Medicaid (private pay is used as excluded category). We also controlled for whether a facility routinely tracked turnover which prelimi-nary analyses showed was related to higher turnover rates. In our survey, 86% tracked turnover information routinely, with 52% using computer systems and 43% using written records, and some facilities using both methods. We originally planned to control for NHA and DON tenure at a facility, as measured by whether they had been there 2 years or less, but these variables did not significantly affect results. Finally, we included a control for historical rates of turnover within a facil-ity’s state using the average state turnover rates in 2007 as reported by the AHCA (2008).
Methods of Analysis.—Predictors of the number of staff leaving in a 12-month window are modeled using negative binomial count models (Cameron & Trivedi, 1998). Models were estimated using STATA’s nbreg procedure (see Long & Freese, 2003), and in results, we report several measures of model good-ness of fit, including the overdispersion coefficient and the Log Ratio Chi-square test. Parameter effects from the multivariate models are reported as incidence risk ratio (IRRs). Sample size is fewer than the 419 origi-nal respondents because several NHAs did not report staff FTEs or other measures; in the tables, sample size is reported. We also ran multivariate models using the original questions on percent staff turnover to reduce missing data, but the general significance and direction
of parameter estimates did not change. Here, we report models predicting numbers of turnovers.
Findings
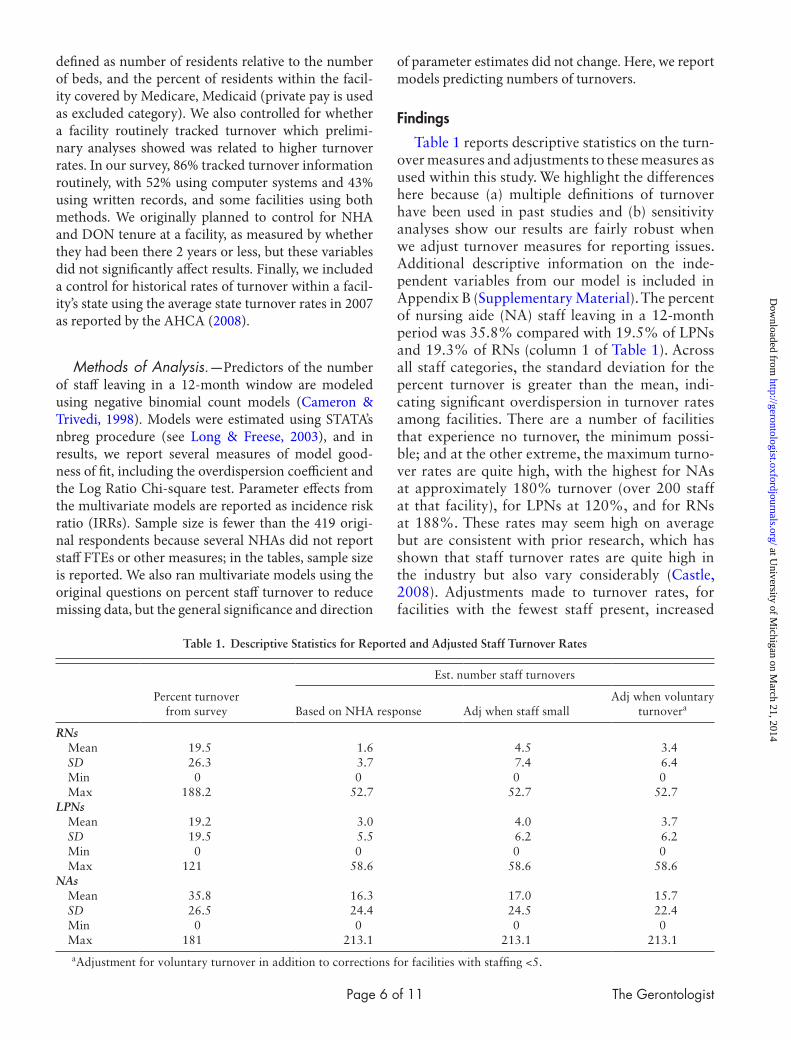
Table 1 reports descriptive statistics on the turn-over measures and adjustments to these measures as used within this study. We highlight the differences here because (a) multiple definitions of turnover have been used in past studies and (b) sensitivity analyses show our results are fairly robust when we adjust turnover measures for reporting issues. Additional descriptive information on the inde-pendent variables from our model is included in Appendix B (Supplementary Material). The percent of nursing aide (NA) staff leaving in a 12-month period was 35.8% compared with 19.5% of LPNs and 19.3% of RNs (column 1 of Table 1). Across all staff categories, the standard deviation for the percent turnover is greater than the mean, indi-cating significant overdispersion in turnover rates among facilities. There are a number of facilities that experience no turnover, the minimum possi-ble; and at the other extreme, the maximum turno-ver rates are quite high, with the highest for NAs at approximately 180% turnover (over 200 staff at that facility), for LPNs at 120%, and for RNs at 188%. These rates may seem high on average but are consistent with prior research, which has shown that staff turnover rates are quite high in the industry but also vary considerably (Castle, 2008). Adjustments made to turnover rates, for facilities with the fewest staff present, increased
Table 1. Descriptive Statistics for Reported and Adjusted Staff Turnover Rates
Percent turnover from survey
Est. number staff turnovers
Based on NHA response Adj when staff smallAdj when voluntary
turnovera
RNs Mean 19.5 1.6 4.5 3.4 SD 26.3 3.7 7.4 6.4 Min 0 0 0 0 Max 188.2 52.7 52.7 52.7LPNs Mean 19.2 3.0 4.0 3.7 SD 19.5 5.5 6.2 6.2 Min 0 0 0 0 Max 121 58.6 58.6 58.6NAs Mean 35.8 16.3 17.0 15.7 SD 26.5 24.4 24.5 22.4 Min 0 0 0 0 Max 181 213.1 213.1 213.1
aAdjustment for voluntary turnover in addition to corrections for facilities with staffing <5.
at University of M
ichigan on March 21, 2014
http://gerontologist.oxfordjournals.org/D
ownloaded from

Page 7 of 11
estimated numbers of staff leaving and had the big-gest impact on RN turnover rates. Adjusting next to voluntary turnover rates reduces the turnover rates across categories but has the biggest impact on the estimated NA turnover. This is not surpris-ing. Because, as largely unskilled workers, NAs experience substantially more involuntary turno-ver than either RNs or LPNs, and eliminating these events from our counts affects the NA turnover more than LPN or RN turnover rates.
Table 2 reports the IRR from multivariate neg-ative binomial models predicting the effects of culture and facility-level controls on unadjusted turnover rates for RNs, LPNs, and NAs. For both RNs and LPNs, stronger market cultural values increased turnover rates significantly (these values are statistically significant at p ≤ .05). For RNs, turnover rates were also substantially reduced by stronger hierarchical values within the facility (sta-tistically significant at p ≤ .01). In this case, turnover rates dropped by over 10% for each unit increase in cultural value strength. Hierarchical values did not affect the turnover rates for either LPNs or NAs. At the same time, developmental values had a significant impact on the turnover of LPNs with stronger values leading to slightly lower turnover rates. Group values, unexpectedly, did not affect
turnover rates and no cultural factor was predic-tive in the model of NA turnover.
These results partially support our hypotheses regarding the impact of cultural values on turno-ver rates. In particular, we find that Hypothesis 1 proposing that facilities with stronger group and developmental cultures have lower turnover rates holds only among LPNs and not for RNs or NAs. And, although Hypothesis 2 proposed that facili-ties with stronger hierarchical cultures would have higher turnover rates, we found the opposite in models of RN turnover, and the relationship was not supported for either LPN or NA turnover rates. Furthermore, hypothesis 2 proposed further that market values would increase turnover rates, which was true for RNs and LPNs only.
Among the control variables included in Table 2, the number of beds in the facility, occupancy rate, and the state average turnover rate in 2007 had statistically significant effects on the turnover rates of LPNs and NAs, whereas the tracking of turnover significantly predicted NA turnover. The overdispersion coeffi-cient, alpha, is significantly greater than zero and sta-tistically significant in all of our models; furthermore, the χ2 statistic is highly significant indicating that in general our models produce a better fit than one in which these factors do not predict turnover rates.
Table 2. Negative Binomial Models Predicting Staff Turnover Rates
(1) (2) (3)
RN turnover LPN turnover Nursing aide turnover
Rate ratio SE Rate ratio SE Rate ratio SE
Intercept .198 (.224) .257 (.241) .653 (.476)Tracks turnover 1.25 (.209) 1.19 (.168) 1.22 (.139)*Chain-owned 1.15 (.206) 1.08 (.157) .918 (.110)For-profit .847 (.168) .968 (.163) .900 (.125)# Beds 1.01 (.002)*** 1.01 (.002)*** 1.01 (.001)***Occupancy Rate 1.84 (1.17) 4.61 (2.67)** 3.06 (1.36)**Prop. Medicare 2.33 (2.12) 2.12 (1.59) 1.89 (1.08)Prop. Medicaid 1.18 (.610) 1.14 (.508) 1.54 (.542)Hospital-based .723 (.277) .898 (.295) .658 (.178)State Avg07 turnover 1.01 (.012) 1.01 (.006)* 1.01 (.003)**Cultural value scales Group .992 (.051) .934 (.044) .980 (.038) Developmental 1.02 (.033) .949 (.027)* .999 (.023) Market 1.12 (.066)** 1.12 (.057)** 1.06 (.042) Hierarchical .883 (.039)*** .963 (.036) .971 (.030)Model statistics α(Overdispersion coeffic) 1.21 (.155)*** 1.007 (.112)*** .882 (.094)*** Likelihood χ2 (12) 45.30 80.42 101.54 p-value χ2 0.00 0.00 0.00Observations 305 306 309
Notes: We use RN for Registered Nurse and LPN for Licensed Practice Nurse in our findings. Tests of significance: *p ≤ .10, **p ≤ .05, ***p ≤ .01
at University of M
ichigan on March 21, 2014
http://gerontologist.oxfordjournals.org/D
ownloaded from
Page 8 of 11 The Gerontologist
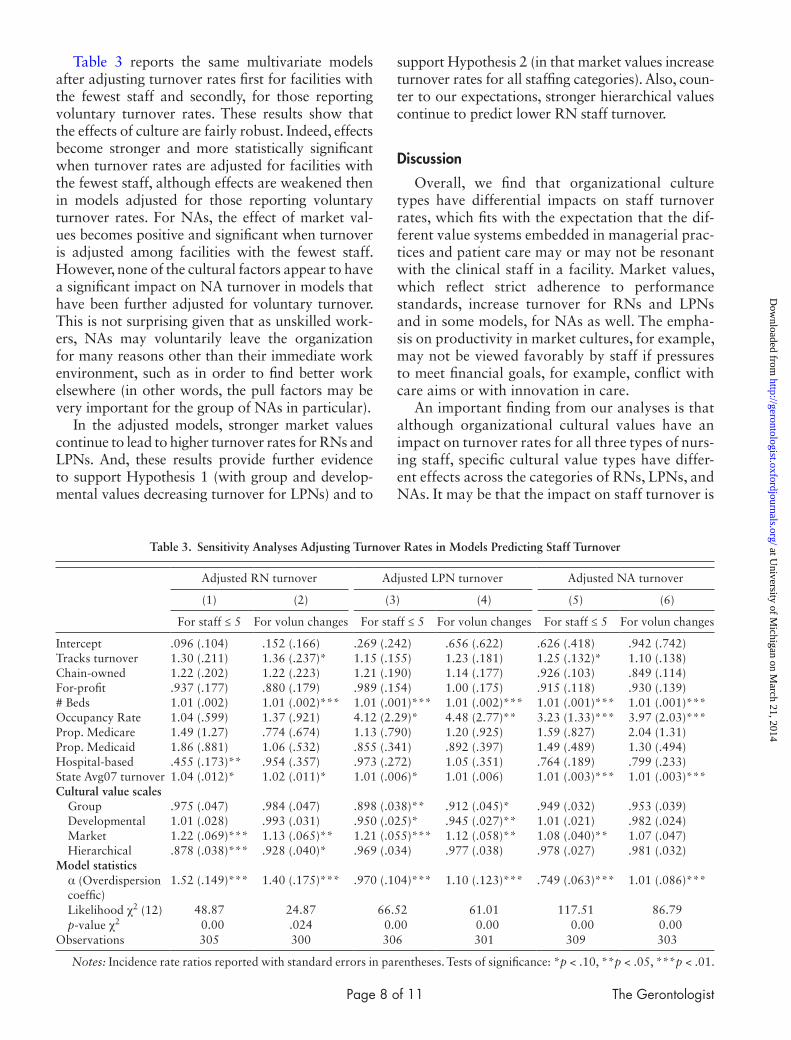
Table 3 reports the same multivariate models after adjusting turnover rates first for facilities with the fewest staff and secondly, for those reporting voluntary turnover rates. These results show that the effects of culture are fairly robust. Indeed, effects become stronger and more statistically significant when turnover rates are adjusted for facilities with the fewest staff, although effects are weakened then in models adjusted for those reporting voluntary turnover rates. For NAs, the effect of market val-ues becomes positive and significant when turnover is adjusted among facilities with the fewest staff. However, none of the cultural factors appear to have a significant impact on NA turnover in models that have been further adjusted for voluntary turnover. This is not surprising given that as unskilled work-ers, NAs may voluntarily leave the organization for many reasons other than their immediate work environment, such as in order to find better work elsewhere (in other words, the pull factors may be very important for the group of NAs in particular).
In the adjusted models, stronger market values continue to lead to higher turnover rates for RNs and LPNs. And, these results provide further evidence to support Hypothesis 1 (with group and develop-mental values decreasing turnover for LPNs) and to
support Hypothesis 2 (in that market values increase turnover rates for all staffing categories). Also, coun-ter to our expectations, stronger hierarchical values continue to predict lower RN staff turnover.
Discussion
Overall, we find that organizational culture types have differential impacts on staff turnover rates, which fits with the expectation that the dif-ferent value systems embedded in managerial prac-tices and patient care may or may not be resonant with the clinical staff in a facility. Market values, which reflect strict adherence to performance standards, increase turnover for RNs and LPNs and in some models, for NAs as well. The empha-sis on productivity in market cultures, for example, may not be viewed favorably by staff if pressures to meet financial goals, for example, conflict with care aims or with innovation in care.
An important finding from our analyses is that although organizational cultural values have an impact on turnover rates for all three types of nurs-ing staff, specific cultural value types have differ-ent effects across the categories of RNs, LPNs, and NAs. It may be that the impact on staff turnover is
Table 3. Sensitivity Analyses Adjusting Turnover Rates in Models Predicting Staff Turnover
Adjusted RN turnover Adjusted LPN turnover Adjusted NA turnover
(1) (2) (3) (4) (5) (6)
For staff ≤ 5 For volun changes For staff ≤ 5 For volun changes For staff ≤ 5 For volun changes
Intercept .096 (.104) .152 (.166) .269 (.242) .656 (.622) .626 (.418) .942 (.742)Tracks turnover 1.30 (.211) 1.36 (.237)* 1.15 (.155) 1.23 (.181) 1.25 (.132)* 1.10 (.138)Chain-owned 1.22 (.202) 1.22 (.223) 1.21 (.190) 1.14 (.177) .926 (.103) .849 (.114)For-profit .937 (.177) .880 (.179) .989 (.154) 1.00 (.175) .915 (.118) .930 (.139)# Beds 1.01 (.002) 1.01 (.002)*** 1.01 (.001)*** 1.01 (.002)*** 1.01 (.001)*** 1.01 (.001)***Occupancy Rate 1.04 (.599) 1.37 (.921) 4.12 (2.29)* 4.48 (2.77)** 3.23 (1.33)*** 3.97 (2.03)***Prop. Medicare 1.49 (1.27) .774 (.674) 1.13 (.790) 1.20 (.925) 1.59 (.827) 2.04 (1.31)Prop. Medicaid 1.86 (.881) 1.06 (.532) .855 (.341) .892 (.397) 1.49 (.489) 1.30 (.494)Hospital-based .455 (.173)** .954 (.357) .973 (.272) 1.05 (.351) .764 (.189) .799 (.233)State Avg07 turnover 1.04 (.012)* 1.02 (.011)* 1.01 (.006)* 1.01 (.006) 1.01 (.003)*** 1.01 (.003)***Cultural value scales Group .975 (.047) .984 (.047) .898 (.038)** .912 (.045)* .949 (.032) .953 (.039) Developmental 1.01 (.028) .993 (.031) .950 (.025)* .945 (.027)** 1.01 (.021) .982 (.024) Market 1.22 (.069)*** 1.13 (.065)** 1.21 (.055)*** 1.12 (.058)** 1.08 (.040)** 1.07 (.047) Hierarchical .878 (.038)*** .928 (.040)* .969 (.034) .977 (.038) .978 (.027) .981 (.032)Model statistics α (Overdispersion
coeffic)1.52 (.149)*** 1.40 (.175)*** .970 (.104)*** 1.10 (.123)*** .749 (.063)*** 1.01 (.086)***
Likelihood χ2 (12) 48.87 24.87 66.52 61.01 117.51 86.79 p-value χ2 0.00 .024 0.00 0.00 0.00 0.00Observations 305 300 306 301 309 303
Notes: Incidence rate ratios reported with standard errors in parentheses. Tests of significance: *p < .10, **p < .05, ***p < .01.
at University of M
ichigan on March 21, 2014
http://gerontologist.oxfordjournals.org/D
ownloaded from

Page 9 of 11
mediated by how satisfied staff are in their work environment, how closely they connect to cultural values, or how much culture affects their ability to perform their jobs. Our results suggest that dif-ferent professional groups may perceive the same workplace environment differently. For example, we found that hierarchical cultural values had an impact on RN turnover but not on LPN or NA turnover. Previous research has suggested that hierarchical values are not conducive to provid-ing excellent patient care (Scott-Cawiezell et al., 2005); however, it may be that stronger bureau-cratic rules support the administrative roles of RNs. By making the RN’s role easier, hierarchi-cal cultures may reduce their turnover while at the same time, having less of an effect on how much aides or LPNs are satisfied with or can manage their work roles. Alternatively, a hierarchical cul-ture emphasizes elements of organizational struc-ture and hierarchy that can create a stable work environment, which may protect RNs from being fired for performance issues and where profession-ally trained nurses are comfortable, even if such cultures do not necessarily lead to a highly com-mitted staff. Future research could further identify how cultural environments shape the attitudinal responses of staff differently.
Further consideration needs to be given to our finding that RN turnover was reduced by the pres-ence of stronger hierarchical cultures and that stronger market values increased turnover for all categories of staff. Market-centered values reflect greater attention to the needs of customers and con-sequently; such values may lead to greater pressures on staff and higher turnover rates. In other words, the demand for patient-centered approaches may strain nursing home staff. Many nursing homes increase employee flexibility in decision making as part of patient-centered approaches. Furthermore, our finding that strong market values increase turnover while values favoring flexibility decrease turnover suggests that balancing competing values is an important issue for nursing homes.
We also found that developmental values were important for LPN turnover across models and that group values were important in adjusted models of LPN turnover. At the same time, group values were not important for either RN or NA turnover, which may be because LPNs, as profes-sionals working closely with both RNs and NAs, may find the greater emphasis on collaborative environments more important than either the RNs or NAs find.
The NA model adjusted for voluntary turno-ver had little of significance in it and none of the cultural value factors were predictive under these conditions. This may be partly because NAs are more likely to leave for better job opportunities elsewhere, which we are unable to control. Further research exploring how cultural values relate spe-cifically to differences in the voluntary exit rates of RNs, LPNs, and NAs would be very useful.
Limitations and Conclusions
Our study is limited specifically to a focus on how top management in facilities report organi-zational culture, which is fundamentally different from how employees interpret culture. Managers provide the first step of setting expectations for employees’ perceptions of the workplace. However, we do not have attitudinal measures of employees’ perceptions and response to the work environment. We recognize the limitation that top management may not always effectively communicate cultural values, and staff may not comply with cultural norms. There is a trade-off between surveying a large number of facilities (and only a single or few respondents within each facility) and collecting responses from a large number of employees in each facility. Our choice here was to identify substantial differences across a large number of facilities in cul-tural values and turnover rates rather than to col-lect more detailed information on the development of work environments within facilities.
We selected the former approach in order to address the importance of cultural values across the industry and leave it to future work to pre-dict more accurately intraorganizational differ-ences in staff turnover. Our results suggest ways in which response to cultural values may be different depending on how workers perceive their environ-ments and also on whether substantial voluntary turnover occurs. Subsequently, our research indi-cates important factors to consider when selecting a few facilities in which to collect more data inter-nally. For example, markets in which NAs experi-ence extensive voluntary turnover due to economic conditions may not be the best for understanding how facility culture effects staff turnover.
We also rely on NHAs to report staff turno-ver rates overall across occupational groups and within subgroups of full and part-time staff and contract employees. Most NHAs provided overall turnover rates only, and routinely tracked these numbers within their electronic administrative
at University of M
ichigan on March 21, 2014
http://gerontologist.oxfordjournals.org/D
ownloaded from

Page 10 of 11 The Gerontologist
data. Analyses were done to test the sensitivity of results to challenging key elements of our turnover data and for the most part, the effects of organiza-tional culture persist. Reporting of turnover rates though is known to have inaccuracies (Castle, 2008). And although some instruments use numer-ous questions to address this concern, we choose to limit our questionnaire in order to reduce response burden. Thus, it is likely that some inaccuracies are inherent to the turnover data we have collected and future research should identify alternative sources of turnover data, including direct use of facilities’ administrative databases.
In returning to generalizability, respondents were more likely to include facilities in areas with lower per capita incomes and less likely to be for profit, which affects our ability to generalize to for profits in the US population of nursing homes. For-profit facilities are underrepresented in our sample and may face competing values because market demands may affect internal organiza-tional cultures and alternatively the structure of internal labor markets, probably more common in chain organizations, can also effect internal cul-tural norms. In addition, our sample is more likely to include larger facilities and those with higher occupancy rates and fewer Medicare residents. It is unclear whether we should expect those addi-tional differences to be related to organizational culture, and further analyses should explore this possibility.
Our results have immediate implication for facilities considering culture change in that facil-ity management should be attuned that the cul-tural values they promote affect staff turnover differentially. Subsequently, and in line with cur-rent business practices emphasizing the promotion of competing values in order to create a balanced work environment (Cameron & Quinn, 2006), nursing home administrators can stress the impor-tance of a number of competing cultural values in order to address the needs of RN, LPN, and NA staff. The remaining challenge is to effectively inte-grate different values into core practices for the work place.
Supplementary Material
Supplementary material can be found at: http://gerontologist.oxfordjournals.org.
Funding
This work was supported by a grant from the National Institute on Aging [R03 AG028475-01A2].
Acknowledgements
Special thanks to Divya Pamnani and Sun Jung Kim for their help with data analyses. This project has been approved by the University of Michigan Institutional Review Board.
ReferencesAmerican Health Care Association. (2008). Report of findings: 2007
AHCA survey, nursing staff vacancy, and turnover in nursing facili-ties. Report by the AHCA Department of Research on July 21, 2008. Retrieved on April 20, 2013, from http://www.ahcancal.org/research_data/staffing/Pages/default.aspx
Anderson, R. A., Corazzini, K. N., & McDaniel, R. R. Jr. (2004). Complexity science and the dynamics of climate and communication: reducing nursing home turnover. The Gerontologist, 44, 378–388. doi:10.1093/geront/44.3.378
Banaszak-Holl, J., & Hines, M. A. (1996). Factors associated with nurs-ing home staff turnover. The Gerontologist, 36, 512–517. doi:10.1093/geront/36.4.512
Banaszak-Holl, J., Bradley, E., Nembhard, I., & Taylor, L. (2010). Leadership and management: A framework for action. In L. R. Burns, E. H. Bradley, & B. J. Weiner (Eds.) Shortell and Kaluzny’s Health Care Management: Organization design and behavior (6th ed., pp 33–62). Clifton Park, NY: Delmar Cengage.
Banaszak-Holl, J., Castle, N. G., Lin, M., & Spreitzer, G. (2013). An assessment of cultural values and resident-centered culture change in U.S. nursing facilities. Health Care Management Review, 38, 295–305. doi:10.1097/HMR.0b013e3182678fb0
Brannon, D., Zinn, J. S., Mor, V., & Davis, J. (2002). An exploration of job, organizational, and environmental factors associated with high and low nursing assistant turnover. The Gerontologist, 42, 159–68. doi:10.1093/geront/42.2.159
Cameron, K. S. & Quinn, R. E. (2006). Diagnosing and changing organi-zational culture. San Francisco: Jossey-Bass.
Cameron, A. C. & Trivedi, P. K. (1998). Regression analysis of count data. Cambridge, UK: Cambridge University Press.
Castle, N. G. (2008). State differences and facility differences in nursing home staff turnover. Journal of Applied Gerontology, 27, 609–630. doi:10.1177/0733464808319711
Castle, N. G., & Engberg, J. (2005). Staff turnover and quality of care in nursing homes. Medical Care, 43, 616–626.
Castle, N. G., & Engberg, J. (2006). Organizational characteristics associ-ated with staff turnover in nursing homes. The Gerontologist, 46(1), 62–73.
Castle, N. G., Engberg, J., Anderson, R., & Men, A. (2007). Job satisfac-tion of nurse aides in nursing homes: intent to leave and turnover. The Gerontologist, 47, 193–204. doi:10.1093/geront/47.2.193
Castle, N. G., Engberg, J., & Aiju Men,. (2008). Nurse aide agency staff-ing and quality of care in nursing homes. Medical Care Research and Review: MCRR, 65, 232–252. doi:10.1177/1077558707312494
Davies, H. T., Mannion, R., Jacobs, R., Powell, A. E., & Marshall, M. N. (2007). Exploring the relationship between senior management team culture and hospital performance. Medical Care Research and Review: MCRR, 64(1), 46–65. doi:10.1177/1077558706296240
Denison, D. R. (1996). What is the difference between organizational cul-ture and organizational climate? A native’s point of view on a decade of paradigm wars. Academy of Management Review, 21, 619–654. doi:10.5465/AMR.1996.9702100310
Dillman, D. A. (2000). Mail and internet surveys: The tailored design method, Second edition. New York: Wiley and Sons.
Donoghue, C. (2010). Nursing home staff turnover and retention: An analysis of national level data. Journal of Applied Gerontology, 29(1), 89–106. doi:10.1177/0733464809334899
Donoghue, C. & Castle, N. G. (2006). Voluntary and involuntary nurs-ing home staff turnover. Research on Aging, 28, 454–472. doi: 10.1177/0164027505284164
Donoghue, C., & Castle, N. G. (2007). Organizational and environmental effects on voluntary and involuntary turnover. Health Care Management Review, 32, 360–369. doi: 10.1097/01.HMR.0000296791.16257.44
Donoghue, C., & Castle, N. G. (2009). Leadership styles of nursing home administrators and their association with staff turnover. The Gerontologist, 49, 166–174. doi:10.1093/geront/gnp021
Eaton, S. C. (2000). Beyond ‘unloving care:’ Linking human resource management and patient care quality in nursing homes. International Journal of Human Resource Management, 3, 591–616.
at University of M
ichigan on March 21, 2014
http://gerontologist.oxfordjournals.org/D
ownloaded from

Page 11 of 11
Glisson, C. & James, L. R. (2002). The cross-level effects of culture and climate in human service teams. Journal of Organizational Behavior, 23, 767–794. doi:10.1002/job.162
Grant, L. A., Kane, R. A., Potthoff, S. J., & Ryden, M. (1996). Staff training and turnover in Alzheimer special care units: comparisons with non-special care units. Geriatric nursing (New York, N.Y.), 17, 278–282. doi: 10.1016/S0197-4572(96)80241–2
Harrington, C., & Swan, J. H. (2003). Nursing home staffing, turnover, and case mix. Medical Care Research and Review: MCRR, 60, 366–92. doi:10.1177/1077558703254692
Kaye, H. S., Chapman, S., Newcomer, R. J., & Harrington, C. (2006). The personal assistance workforce: Trends in supply and demand. Health affairs (Project Hope), 25, 1113–1120. doi:10.1377/hlthaff.25.4.1113
Lapane, K. L., & Hughes, C. M. (2007). Considering the employee point of view: perceptions of job satisfaction and stress among nursing staff in nursing homes. Journal of the American Medical Directors Association, 8(1), 8–13. doi:10.1016/j.jamda.2006.05.010
Long, J. S., & Freese, J. (2003). Regression Models for Categorical Dependent Variables Using Stata. Rev. ed. College Station, TX: Stata Press.
Martin, J. (2002). Organizational culture: Mapping the terrain. Thousand Oaks, CA: Sage.
Reichers, A. E., & Schneider, B. (1990). Climate and culture: An evolution of constructs. In B. Schneider (Ed.), Organizational culture and climate (pp. 5–39). San Francisco: Jossey-Bass.
Scott, T., Mannion, R., Davies, H., & Marshall, M. (2003). The quantita-tive measurement of organizational culture in health care: a review
of the available instruments. Health Services Research, 38, 923–945. doi:10.1111/1475–6773.00154
Scott-Cawiezell, J., Jones, K., Moore, L., & Vojir, C. (2005). Nursing home culture: a critical component in sustained improvement. Journal of Nursing Care Quality, 20, 341–348.
Seblega, B. K., Zhang, N. J., Unruh, L. Y., Breen, G. M., Seung Chun Paek, & Wan, T. T. (2010). Changes in nursing home staffing levels, 1997 to 2007. Medical Care Research and Review: MCRR, 67, 232–246. doi:10.1177/1077558709342253
Shortell, S. M., Marsteller, J. A., Lin, M., Pearson, M. L., Wu, S. Y., Mendel, P., . . . Rosen, M. (2004). The role of perceived team effective-ness in improving chronic illness care. Medical Care, 42, 1040–1048.
Spreitzer, G. M. & Quinn, R. E. (1991). The psychometrics of the compet-ing values culture instrument and an analysis of the impact of organi-zational culture on quality of life. Research in Organizational Change and Development, 5, 115–142.
Yeung, A. K. O., Brockbank, J. W., & Ulrich, D. O. (1991). Organizational culture and human resource practices. Research in Organizational Change and Development, 5, 59–81.
Zazzali, J. L., Alexander, J. A., Shortell, S. M., & Burns, L. R. (2007). Organizational culture and physician satisfaction with dimensions of group practice. Health Services Research, 42(3 Pt 1), 1150–1176. doi:10.1111/j.1475-6773.2006.00648.x
Zuckerman, H. S., Dowling, W. L. & Richardson, M. L. (2000). The mana-gerial role. In S. M. Shortell and A. D. Kaluzny (Eds.), Health care management: Organization design and behavior (4th edition). Albany, NY: Delmar.
at University of M
ichigan on March 21, 2014
http://gerontologist.oxfordjournals.org/D
ownloaded from