Embed Size (px)
Citation preview

DPDK Summit China 2017

Network Acceleration and Performance Improvement
Lou, FangliangZTE

Agenda
Performance optimization concepts and methods第一
Performance optimization crisis第二
Software Performance Lean Measurements第三
Enhance software parallel scalability第四

Performance Optimization Concepts
RFC2544协议性能测试定义

Difficulties of Processing Packet
Software to achieve high-speed packet forwarding is difficult, the smaller the average packet arrival interval is smaller, the higher the CPU processing time requirements, the above table to 2G clock speed CPU, for example, a command cycle is 0.5ns, CPU Access to DDR memory is 140 * 0.5 = 70ns, CPU access L3 cache time is 40 * 0.5 = 20ns. And a 64byte packet arrived at the average time in 16.8ns, this multi-software message processing put forward a very high requirements: in an access time need 70ns, 16.8ns to deal with a packet。
报文长度 网卡线速 最大PPS 报文平均间隔
换算指令周期
64byte 10G 14.88M 67.2ns 134cyc
512byte 10G 2.35M 425.6ns 861cyc64byte 40G 59M 16.8ns 33cyc
512byte 40G 9.4M 106ns 212cyc
容量访问延迟
(cyc)访问时间
(2G)指令cache 32K 5/7 2.5nsL1 cache 32K 5/7 2.5nsL2 cache 256K 12 6nsLLC(L3) 20M 40 20ns
DDR 128G 140 70ns

Tradition Optimization
雕琢软件细节
挖掘平台潜力
构建卓越架构
•Compile the potential of mining CPU instructions / specific calculations using a specific instruction set•Compile Select the appropriate compiler to carefully select the optimization strategy•Process No Locked Parallel Processing Flattened Process Design Cured Framework Code•Memory control memory read and write times space for time•Algorithm main process focus optimization
•CPU frequency \ more kernel \ CPU new technology•Memory faster read and write speed \ multi -channel \ cache optimization•NIC packet classification \programmable•OS cloud system \ kernel optimization \ nuclear isolation
•Control media separation build•Unlocked, ConflictlessParallel Processing Architecture•Reasonable memory access range•Statistical Design Based on Traffic Model

Agenda
Performance optimization concepts and methods第一
Performance optimization crisis第二
Software Performance Lean Measurements第三
Enhance software parallel scalability第四

Crisis
From each version of the performance point of view, due to the addition of some features, DU performance has been declining; each version of the performance tuning work, although there are certain enhancements, very painful repetitive labor;
The future increase in demand for media, DU software, increased complexity, but also reduce performance; bottleneck in the DU core, how to avoid this?
0
1
2
3
4
5
6
7
DU 单元性能

Software Performance Lean Measurement Method
Software Performance Lean Measurement Method: Where is the performance of the ceiling? Does performance optimization have space? Is it worthwhile to spend more effort on further research? Often encountered problems, the code modified a line, the performance suddenly dropped a lot of length, how to avoid these problems?
Today we propose a software performance lean measurement optimization method through the theoretical quantitative calculation, the model can be more accurate calculation of optimization goals.

Agenda
Performance optimization concepts and methods第一
Performance optimization crisis第二
Software Performance Lean Measurements第三
Enhance software parallel scalability第四

Instruction four - layer water structure
Assuming an instruction requires a clock cycle, the following procedure takes a few iterations over a loop?
while (1){
mov $0x1, %eaxmov $0x2, %ebxmov $0x3, %ecx
}
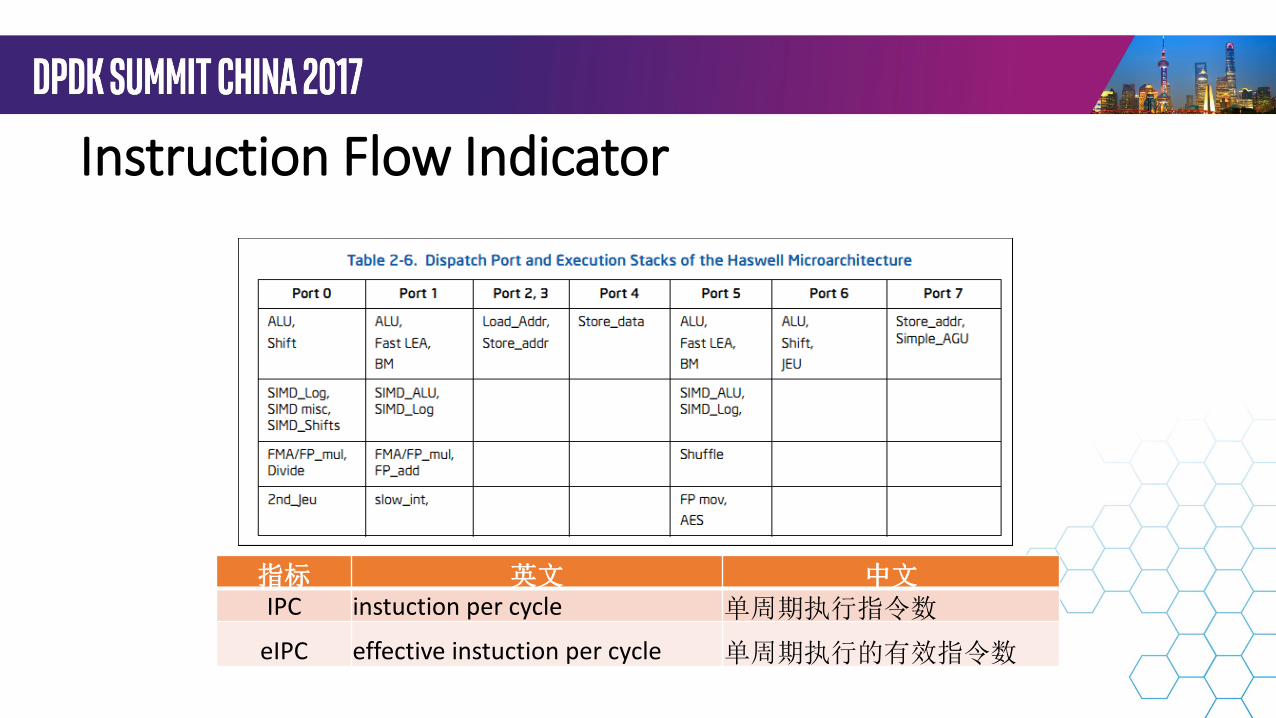
Instruction Flow Indicator
指标 英文 中文IPC instuction per cycle 单周期执行指令数
eIPC effective instuction per cycle 单周期执行的有效指令数

Out of Order Execution -> Order to Commit
Out of order to use other "executable" instructions to fill the gaps in the time, and then reorder the results at the end of the operation, in order to achieve the results of instruction execution in order to submit the code.
Out of order execution:Use the following steps to disrupt the order:(1). get the instruction ;(2). The instruction is sent to a sequence of instructions (execution of a buffer or a reserved station);(3). The instruction waits for a direct data operation object in the sequence to be fetched, and then the instruction sequence is allowed to leave the buffer before entering the old instruction and before;(4). The instruction is assigned to a suitable functional unit and executed by him(5). The result is placed in a sequence;(6) The result of this instruction is written to the register only if all the instructions before the instruction have written their results to the register. This process is called a graduation or retirement period

Cache
Cache is the cache (Cache Memory), in order to solve the read physical memory delay, because the modern CPU processing speed and memory access speed.

Cache Miss
As shown above, when the prefetch is not performed, the execution unit is forced to wait due to the delay of reading the memory from the front side bus (FSB).
After prefetching in advance, the data required by the execution unit has been read in advance to the cache and read the data directly in the cache. So that the execution unit eliminates the latency of memory access.
指标 英文 中文Cache miss Cache miss Cache 没有命中的概率

Cache Prefetch

Metrics

Metrics
[1] eIPC indicators higher, the better the performance;[2] IPP indicators lower, the better performance;[3] When the CPU occupancy rate is low, the performance and occupancy rate are close to the linear relationship because the eIPC and IPP can be considered unchanged; when the CPU occupancy rate is high, the performance and occupancy rate are non-linear, because eIPC and IPP (Due to the greater flow of concurrent processing will increase, will affect the eIPC and IPP indicators);

Data Collection MethodIntel CPU built-in hardware Performance Monitoring Unit (PMU)Provides a lot of hardware event counters (such as Haswell provides 334 hardware event counters) You can monitor the CPU instruction execution in detail, such as the number of Cache-miss, the number of branch prediction failures,Number of successful Retire instructions.

Tools
Perf
VTune

CASE 1: Quick Feedback, Timely Correction
CI to monitor the performance of media performance indicators to monitor, quickly find defects, which version, which led to a decline in the joint. Timely correction

CASE 2: Guidance Coding
This code can only be functional verification, the efficiency is very poor, mainly due to two reasons: the innermost layer of the temp for the calculation of the cycle, the dependencies between the various iterations can not be parallel processing; Calculate temp, the B matrix by B [k * M + i] reference is to press B line to jump to take the data, if the B number of columns is large, will lead to access to memory when the span is large, can not use hardware pre- Take, will lead to a lot of cache-miss.
Calculate the for loop of ptmp [i], the dependency of each iteration can be processed in parallel; Calculate ptmp [i], the B matrix is accessed by column, you can use hardware prefetching, cache-miss greatly reduced.

CASE 2: Guidance Coding

Case3 : Guide the Software Architecture Design.
We believe that the CPU instruction execution level, the effect of performance optimization is ultimately reflected in two aspects:
Features: The total number of instructions executed at this node is constant, but the concurrency increases significantly;
Features: The number of instructions executed by this node has been significantly reduced;
(1) eIPC (effective instruction per cycle) indicators, that is, the code should make full use of CPU pipelines to improve the number of instructions within a clock cycle can be implemented, such as the use of VPP architecture, loop expansion and reduce the code between the statements, Hardware and software prefetching.
(2) IPP (instruction per packet) indicators of the reduction, that is to say as much as possible to reduce the number of instructions required to deal with the use of efficient instructions, algorithms or architecture decomposition, such as the use of SIMD instructions, ahead of time rather than the cycle of each iteration Calculation, the drive burst transceiver (one call to send and receive multiple messages), node split, traffic unloading, etc.,

Agenda
Performance optimization concepts and methods第一
Performance optimization crisis第二
Software Performance Lean Measurements第三
Enhance software parallel scalability第四

Amdahl LawA program (or an algorithm) can be divided into the following two parts by whether it can be parallelized:Can be parallelizedCan not be parallelizedDefined as follows:T = total time of serial executionB = can not be parallel to the total timeT-B = total time of the parallel partWhen a parallel portion of a program is executed using N threads or CPUs, the total time taken is:T (N) = B + (T - B) / N

Amdahl LawAs can be seen from Amdahl's law, the parallelizable part of the program can run faster by using more
hardware (more threads or CPUs). For non-parallelizable parts, only by optimizing the code to achieve the purpose of speed. Therefore, you can optimize the non-parallel part of the program to improve your running speed and parallel ability. You can do nothing on the algorithm to do some changes, if possible, you can also move some of the parallel to the release of the part.Optimize the serial componentIf you optimize the serialization of a program, you can also use Amdal's law to calculate the program execution time after optimization. If the parallel part can be optimized by a factor O, the Amdar law looks like this:T (O, N) = B / O + (1 - B / O) / NIn the non-parallel part of the program occupies the B / O time, so the parallel part of the account of the 1 - B / O time. If B is 0.1, O is 2, N is 5, the calculation looks like such:T (2,5) = 0.4 / 2 + (1 - 0.4 / 2) / 5
= 0.2 + (1 - 0.4 / 2) / 5= 0.2 + (1 - 0.2) / 5 = 0.2 + 0.8 / 5 = 0.2 + 0.16 = 0.36

Two Models
•Parallel processing•Multi-threaded parallel processing•No lock•Unique messages are distributed to the same thread to achieve no lock. Eliminate lock waiting time

Serial Parallelization
The distribution thread is split into driver thread and parse thread, running on both HTs to improve performance 。
接收
解析
发送
接收
解析
发送
接收
解析
发送
接收
解析
发送

…
Offload Model
A-1
A-2
A-3
B-1
B-2
B-3
C-1
C-2
C-3
PKT
PKT
PKT
表示决策点, 该点消耗计算资源
但是被优化处理节点
Fixed action,Improve performance
首包决策,固化执行路径
PKT
The first package for policy access,Follow the package
fixed action

Software Parallel Scalability OptimizationFor a stream, not every message requires the whole process to determine the processing, only the first report to get the forwarding strategy can be, and the rest of the traffic all unloaded to a fixed vector node processing node;For vector nodes to handle nodes, require extremely high performance, the code needs to be optimized to the simplest, and the code is optimized by white boxing metrics.The details of the measurement will be detailed later

Effect
CPU occupancy rate dropped by 70%Code parallelism increased by 3 times,Cache miss drops by 54%.Single thread processing capacity close to 2Mpps
HT吞吐量带宽(Gbps)(512BYTE)
HT包处理能力(Mpps)
代码执行并行度(IPC) cache miss
优化前 1.664G 0.436 0.4197 63.80%
优化后 8G 2.M 1.22 9.49%
0
2
4
6
8
10
优化前 优化后
HT吞吐量带宽
0
0.5
1
1.5
2
2.5
优化前 优化后
HT包处理能力
0
0.2
0.4
0.6
0.8
1
1.2
1.4
优化前 优化后
代码执行并行度
0.00%
10.00%
20.00%
30.00%
40.00%
50.00%
60.00%
70.00%
优化前 优化后
cache miss

Content Review
A software performance of the lean measurement optimization method: to guide the code to write the level of the definition of indicators, Optimize the code based on these metrics. Raise the code to perform parallelism, reduce cache miss.A Theorem: Amdahl's Law, Determine the Direction of Optimization, Eliminate System Bottlenecks, and Pursuit of Performance Parallel Expansion.DPDK opens up new ways and new ideas for code performance optimization;

Network Platforms Group
DPDK China Summit 2017 Shanghai,
34
Thanks!!
欢迎关注DPDK开源社区


![Orchestrating Virtualized Network Functionsperformance [11], [12]. NFV provides ample opportunities for network optimization and cost reduction. Previously, middle-boxes were hardware](https://img.pdfslide.tips/doc/110x75/5ed155afefd7b2537304c8d8/orchestrating-virtualized-network-functions-performance-11-12-nfv-provides.jpg)