Embed Size (px)
Citation preview
CLIMATE CHANGE RESEARCH STRATEGY FOR ATMOSPHERIC
PROCESSES IMPACTING THE LAKE TAHOE BASIN
Final Report Round 9 Submitted for the Tahoe Science Consortium
Award 08‐DG‐11272164‐022
Prepared by: Kenneth E. Kunkel1, Affiliate Research Professor
1Desert Research Institute
2215 Raggio Parkway, Reno, NV
February 10, 2014

1
CLIMATE CHANGE RESEARCH STRATEGY FOR ATMOSPHERIC
PROCESSES
Kenneth E. Kunkel1, Affiliate Research Professor Division of Atmospheric Sciences
Desert Research Institute
Executive Summary
Increasing atmospheric concentrations of greenhouse gases have the potential to cause large changes in
the future climate of the Lake Tahoe Basin (LTB). It is likely that some of these changes will be outside of
the range of historical experience by the middle of the 21st Century. This means that management
strategies adapted to that historical experience may fail. Also, ecological systems adapted to the
historical climate may face new stressors with adverse consequences. It is critically important that the
potential changes in climate be considered by managers in formulating long‐term plans and strategies.
This document outlines a climate change research strategy specific to the LTB. The document considers
one aspect of an overall climate change research strategy, specifically, the effects of climate change on
atmospheric processes. This can be incorporated into the existing Science Plan as a new research
strategy chapter. The overall goal is to assess scientific and management information needs, and
develop a strategy to address key uncertainties that challenge land and resource managers in the LTB.
The primary atmospheric processes to be discussed include:
a. Changes in precipitation frequency, magnitude, and seasonality.
b. Relative frequency of rain vs. snow events
c. Changes in extreme temperature and precipitation episodes.
d. Changes in decadal scale temperature and precipitation variability.
e. Impact on elevation‐related temperature regimes.
f. Impact of climate change on air quality
g. Impact of climate change on fire regimes.
The research strategy should consider the major scientific gaps in knowledge as well as the immediate
needs for actionable information. The following overarching questions, arising from a consideration of
existing trends in the basin and gaps in our knowledge about causes, provide an overall framework:
What are possible high impact climate extremes that are outside the envelope of historical
experience? Given the expectations of continued warming and associated shifts in other climate
conditions, how bad could future extremes be? Could some future extremes be so far outside
the envelope of historical experience that they would simply overwhelm the present‐day
adaptive resources of the basin?
1 Permanent Affiliation: NOAA Cooperative Institute for Climate and Satellites, North Carolina State University and National Climatic Data Center, Asheville, NC
2
Is the Lake Tahoe basin warming at a faster rate than surrounding areas? If so, what is the
likelihood that this will continue? Will future anthropogenically‐forced changes to the climate
system accelerate or ameliorate this trend?
What is the relative importance of local vs. remote processes in determining the air quality of
the basin? What are the meteorological conditions under which remote sources of pollution can
significantly affect basin air quality? What is the risk that future climate patterns could change
sufficiently to alter the role of remote sources?
What will be the specific characteristics of changes in seasonality? Warming will shift the
temperature climate to conditions similar to present‐day lower elevation locations, but such
conditions are very different on the eastern side of the Sierras compared to the western side.
Will future conditions in the basin resemble one or the other? Or, will there be large‐scale
circulation changes that create climate conditions unlike either present‐day lower elevation
conditions?
What are the unique challenges for high‐elevation lakes and basins that will be posed by global
warming? Can Lake Tahoe Basin research lead to insights with broad applicability to similar mid‐
latitude high‐elevation areas?
The proposed research strategy is:
General Climate Change Effects
Incorporate observational datasets into the modeling database. These should primarily include
long‐term datasets that are typically used in examining historical trends in the basin.
Create a centralized database of relevant data from the new global climate simulations being
produced for the fifth assessment report of the IPCC and make available for use by all Tahoe
researchers. This will include simulations for the historical 20th Century and the future under
various scenarios of greenhouse gas emissions. Data variables should be selected based on a
survey of the needs of Tahoe researchers.
Create a centralized database of relevant data from simulations produced by regional climate
models (RCMs) or statistical downscaling strategies and make available for use by all Tahoe
researchers. Data variables should be selected based on a survey of the needs of Tahoe
researchers.
Apply statistical downscaling techniques to RCM data, if this is not done as part of the National
Climate Assessment (see Section 7). Although RCMs are an improvement over GCMs in terms of
spatial resolution, biases remain and resolution is inadequate for many modeling applications.
Thus, statistical downscaling is needed to remove biases and create higher resolution data.
Select and apply a set of metrics to evaluate the accuracy of model simulations of the present‐
day Tahoe climate. These metrics can be used by researchers to potentially eliminate some
models with poor performance. Since the proposed metrics examine relatively large‐scale
features, the results will have applicability to the entire Sierra Nevada range and adjacent areas.
Identify the large scale atmospheric circulation patterns associated with historical extreme
precipitation events, heat waves, and severe fire events. The emphasis should be on model
3
variables that are believed to be simulated with relatively high fidelity, generally large scale
fields of winds, temperature, and humidity. Therefore, these results will also have applicability
to the entire Sierra Nevada range and adjacent areas.
Analyze the historical and future simulations of the global climate models to determine changes
in the frequencies of patterns causing extreme events. Work with managers to identify the
kinds of information needed for decision‐making. These results will have applicability to the
entire Sierra Nevada range and adjacent areas.
Perform high resolution RCM simulations for climate model extreme events in both the
historical and future simulations. Characterize differences in surface variables relevant to the
extreme event (e.g. precipitation for extreme precipitation; temperature for heat waves;
temperature, wind, and humidity for severe fires).
Apply the information gained from model research on precipitation extremes to estimates of
future precipitation design values.
Explore the possibility for very high impact extreme events arising from the coincident
occurrence of multiple extreme types. These are conditions which have not occurred in the
historical record, but are conceivable given future changes in climate. Examine the entire suite
of GCM simulations to determine the potential risk of such extremes
Climate Change Effects on Air Quality
Two possible research strategies are proposed. It is recommended that a workshop be conducted to
discuss these strategies and decide on the best approach.
The following tasks comprise a high‐risk, but high‐reward path that is designed to produce a modeling
system to address all probable future outcomes.
All available emissions and meteorology data collected in the basin should be compiled. An
emissions database should be created using available data and best guesses where data are
unavailable. Using SMOKE or other emissions tools, an emissions file should be created for
input to the AQM.
Improve the emissions inventory for mobile source emissions factor models by assembling
information on Tahoe‐specific vehicle model year distributions, emission factors, and activity
data.
Implement a modern Lake Tahoe air quality modeling system (LTAQMS), to include an emissions
processing model, mesoscale meteorology model (MMM), and an air quality model (AQM). This
initial implementation will be preliminary, based on available data and process understanding.
The WRF, CWRF, or another MMM should be configured through a literature search.
Run a series of sensitivity experiments with the LTAQMS to identify sensitivity to input emissions
data, choice of parameterizations in the air quality model, choice of parameterizations in the
MMM, and uncertainties in the basin conditions. These can provide the necessary information
to inform a monitoring strategy. Furthermore, routine monitoring of some critical processes is
unlikely to be possible, such as overlake processes. However, these can be studied in short‐term

4
focused studies. Model sensitivity simulations can identify the key scientific and observational
data issues that require field experiments to improve understanding and narrow uncertainties.
Design an observational (ongoing monitoring and intensive field campaigns) strategy, based on
the sensitivity experiments, to reduce those uncertainties to which the model simulations are
most sensitive and critical to management decisions.
Implement routine monitoring where necessary to support modeling development.
Plan an intensive field study to gather specialized data to support modeling development.
An alternative low‐risk research strategy will add to knowledge but will not address all possible future
outcomes and will include the following tasks:
Compile a list of ozone exceedance events.
Analyze the regional atmospheric conditions and determine the usual conditions associated with
such events. The elements to be investigated will include wind speed and direction,
atmospheric stability, temperature, pressure, and air quality conditions upstream of the basin.
Determine the historical frequency of conditions associated with high ozone events
Analyze GCM simulations of the present‐day climate to determine the extent to which they can
produce the observed frequency of conditions associated with high ozone events.
Analyze GCM simulations of the future to determine changes in the frequency of conditions
associated with high ozone events.
5
1. Introduction
Increasing atmospheric concentrations of greenhouse gases have the potential to cause large changes in
the future climate of the Lake Tahoe Basin (LTB). It is likely that some of these changes will be outside of
the range of historical experience by the middle of the 21st Century. This means that management
strategies adapted to that historical experience may fail. Also, ecological systems adapted to the
historical climate may face new stressors with adverse consequences. It is critically important that the
potential changes in climate be considered by managers in formulating long‐term plans and strategies.
There are large uncertainties and many unknowns about the future path of climate conditions and
research is required to narrow these uncertainties and address unknowns to support more effective
adaptation and mitigation strategies.
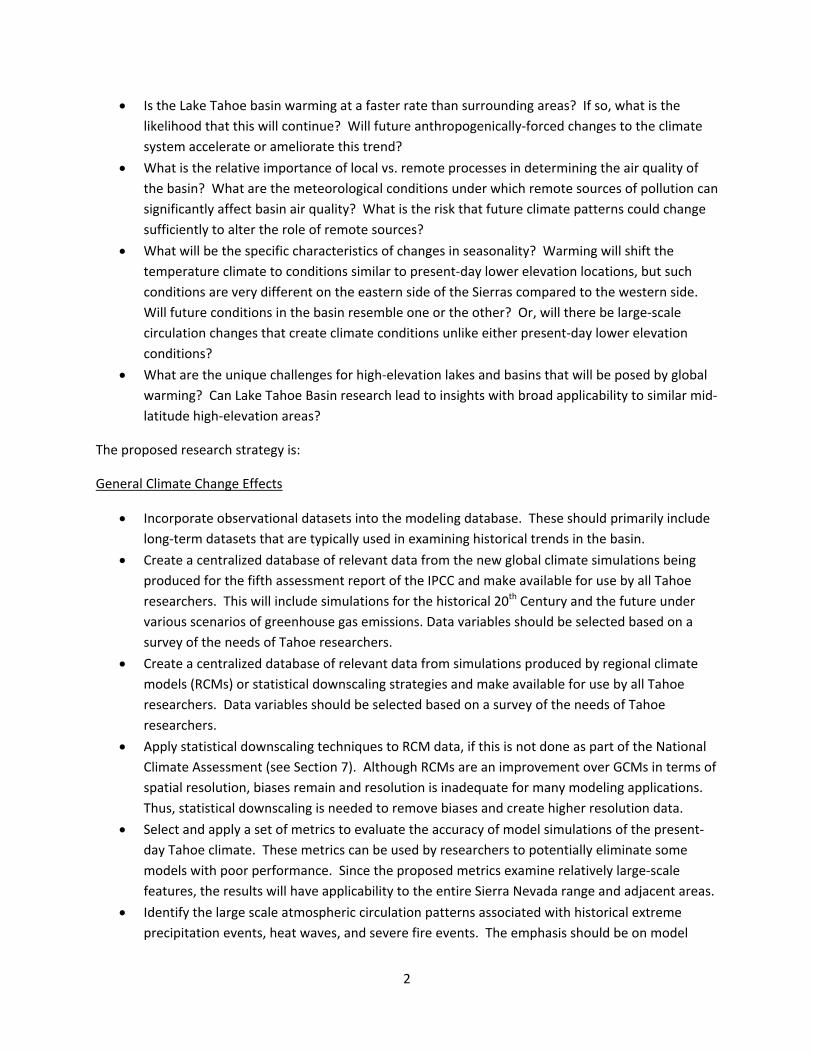
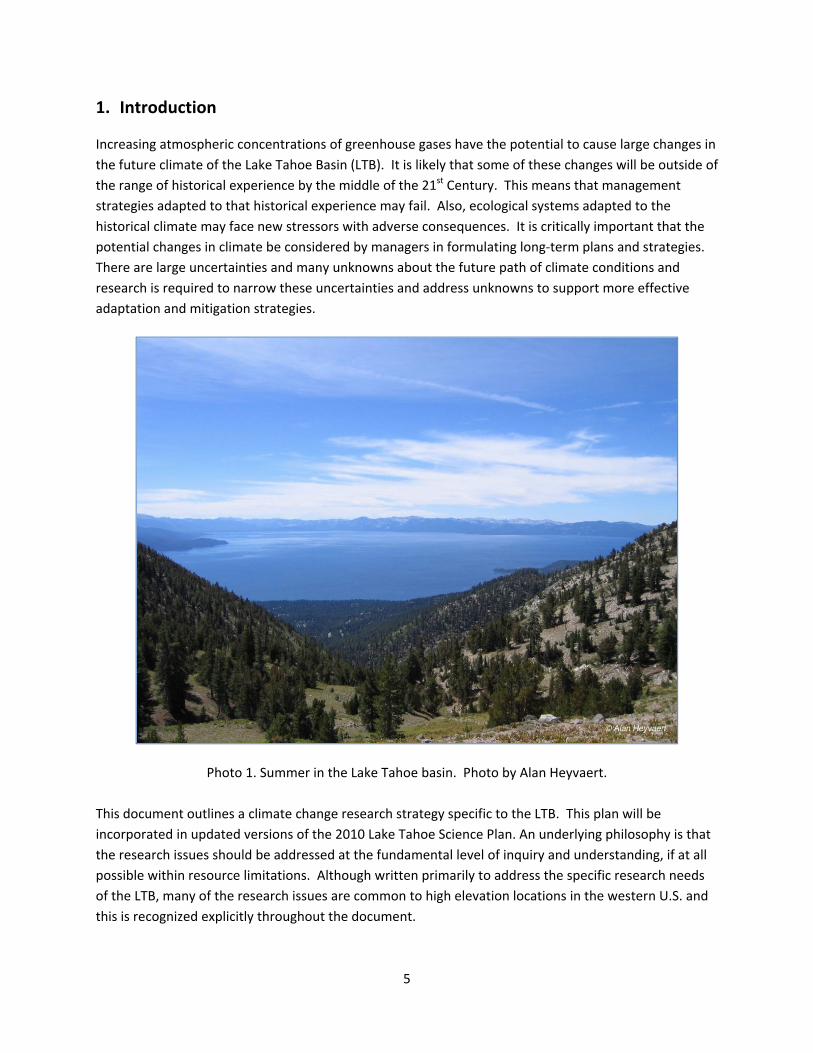
Photo 1. Summer in the Lake Tahoe basin. Photo by Alan Heyvaert.
This document outlines a climate change research strategy specific to the LTB. This plan will be
incorporated in updated versions of the 2010 Lake Tahoe Science Plan. An underlying philosophy is that
the research issues should be addressed at the fundamental level of inquiry and understanding, if at all
possible within resource limitations. Although written primarily to address the specific research needs
of the LTB, many of the research issues are common to high elevation locations in the western U.S. and
this is recognized explicitly throughout the document.
6
The overall goal is to assess scientific and management information needs, and develop a strategy to
address key uncertainties that challenge land and resource managers in the LTB. The document
considers one aspect of an overall climate change research strategy, specifically, the effects of climate
change on atmospheric processes. The primary atmospheric processes to be discussed include:
a. Changes in precipitation frequency, magnitude, and seasonality. Some global climate
models (GCMs) show more sporadic, but heavier, precipitation events. This could impact
soil erosion and runoff characteristics.
b. Relative frequency of rain vs. snow events. Increasing temperatures are likely to shift the
frequencies toward more rain events, causing changes in runoff timing. This would have
large impacts on the seasonality of runoff and groundwater recharge (Huntington et. al.
2012, Mejia et al. 2012. In addition, Coats et al. (2010) showed that the percentage of
precipitation falling as snow, averaged over the basin, decreased from >30% at the
beginning of the 21st Century to about 10% at the end of the 21st Century, based on the
GCM of the NOAA Geophysical Fluid Dynamics Laboratory (GFDL).
c. Changes in decadal scale temperature and precipitation variability. This is an issue of great
uncertainty but increases in such variability are possible and would create great challenges
for managers due to increased stresses on ecosystems and reliability of water supplies.
Coats et al. (2010) found differences among the model simulations. One simulation, from
the GFDL model using a high emissions scenario, showed a slight increase in precipitation
until the middle of the 21st Century and a decreasing trend thereafter. The other three
simulations analyzed did not have a mid‐century maximum, indicating the uncertainties
surrounding this aspect.
d. Impact on elevation‐related temperature regimes. Increasing temperatures are likely at all
elevations, changing the existing temperature regimes and causing possible large impacts on
ecosystems and biodiversity
e. Impact of climate change on air quality. Some of the potential changes, such as increasing
temperature, would have adverse effects on air quality due to increased pollutant
emissions, changes in atmospheric chemical reactions, atmospheric instability, and other
processes, which will require more aggressive strategies to meet air quality standards.
However, the complex interactions among the different climate conditions make it difficult
to subjectively judge the net direction of future changes.
f. Impact of climate change on fire regimes. An earlier spring snowmelt and increased
summer temperatures are likely future outcomes. Both of these would increase the
vulnerability of the region to forest fires. These impacts may be mitigated by other
processes and proactive management actions. The GFDL high emissions simulation analyzed
by Coats et al. (2010) shows increasing drought intensity by the end of the 21st Century.
This strategy is organized into two major areas: (a) climate change relating to all aspects of basin
management and (b) climate change effects on air quality. The latter topic is treated separately because
of the specific scientific challenges that need to be addressed. Although the treatment of air quality is in
the context of climate change, the research strategy for contemporary needs is very similar and thus the
7
strategy in most respects is applicable to both short‐term and long‐term needs. Air quality can have
effects on human health, ecosystem health, and water quality in the basin.
2. Review of Past Work
Recent historical climate changes provide a context for the proposed research strategy. A major change
in many areas of the western U.S., including the LTB, has been a shift to earlier snowmelt in response to
rising temperatures (Cayan et al. 2001; Hamlet et al. 2005; Mote et al. 2005; Pierce et al. 2008). There
has been a trend to more rain events relative to snow events (Knowles et al. 2006). There has also been
increased rainfall intensity, increased interannual variability, and an increase in the temperature of Lake
Tahoe (Coats et al. 2006; Coats 2010). The increase in the temperature of the lake is primarily an
increase in the annual minimum temperature, which is potentially critical because a continuation of this
trend would reduce the frequency of lake overturning. An interesting feature is that air temperature in
the basin has been increasing faster than most of the surrounding area. Coats (2010) put forward two
possible hypotheses for this phenomenon, one related to differential enhanced absorption of long‐wave
radiation and the other related to deposition of black carbon on the snowpack.
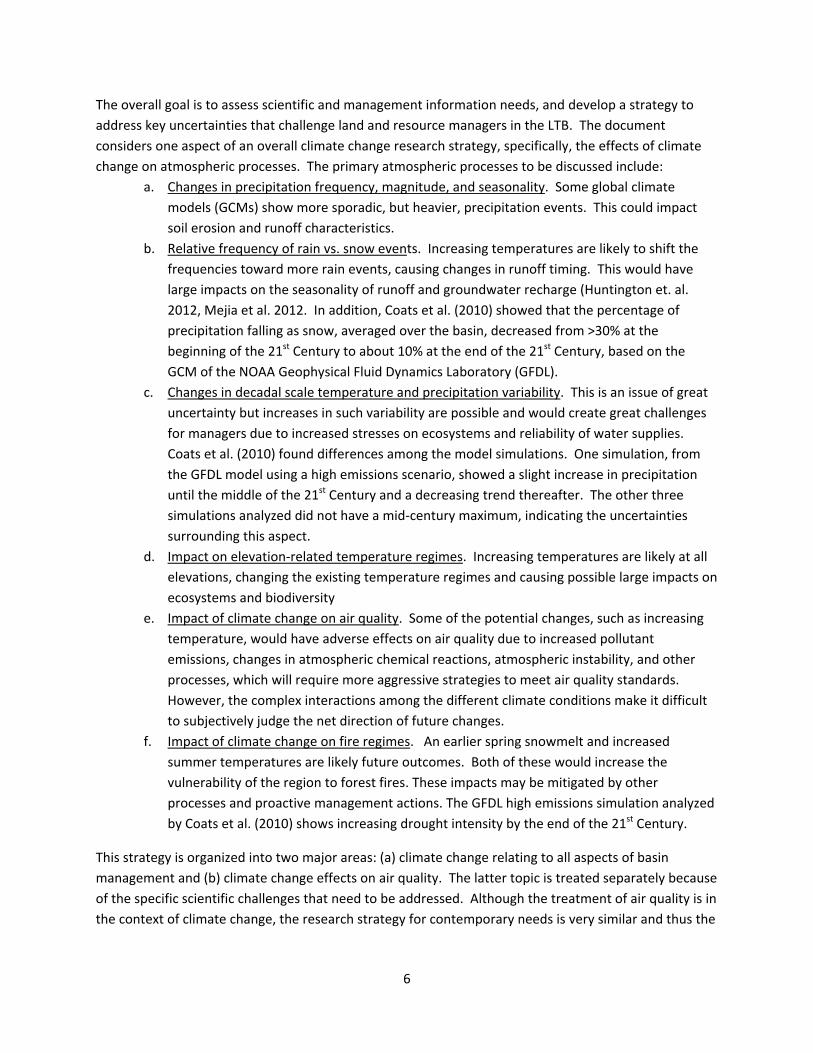
Time series for Tahoe City are illustrative of observed changes at lake level. Temperature (Fig. 1) exhibits a general upward trend, although there is substantial decadal‐scale variability. A linear fit to the
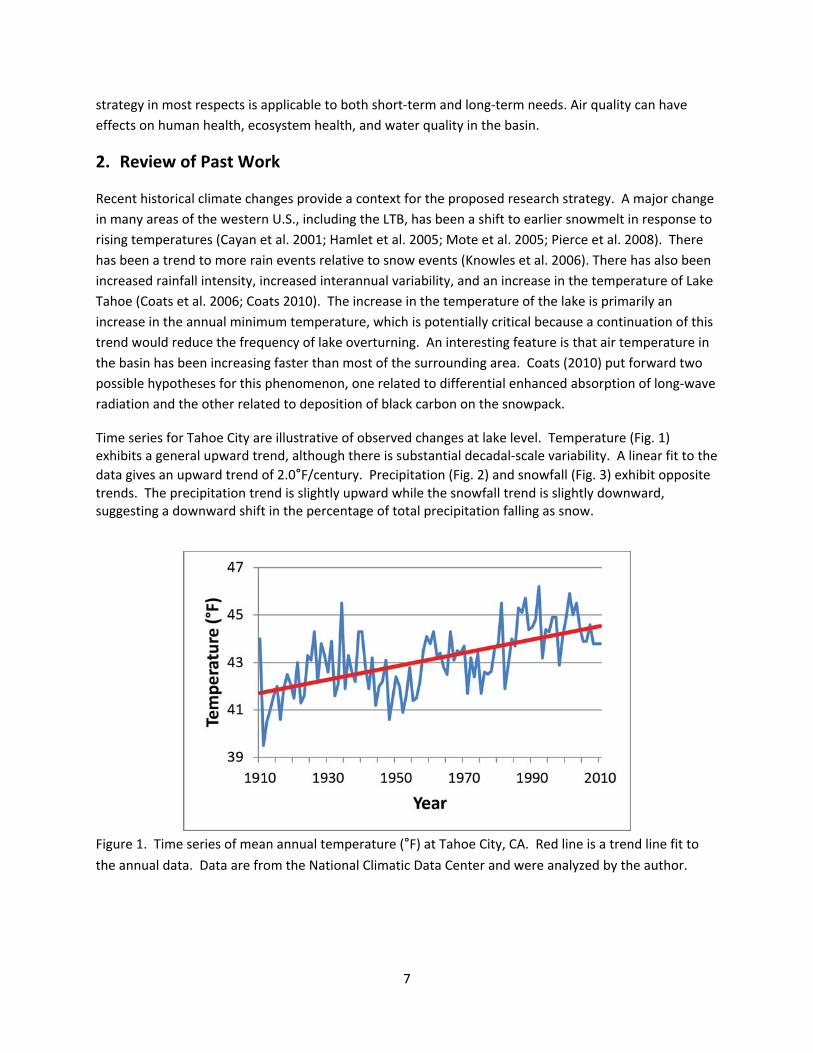
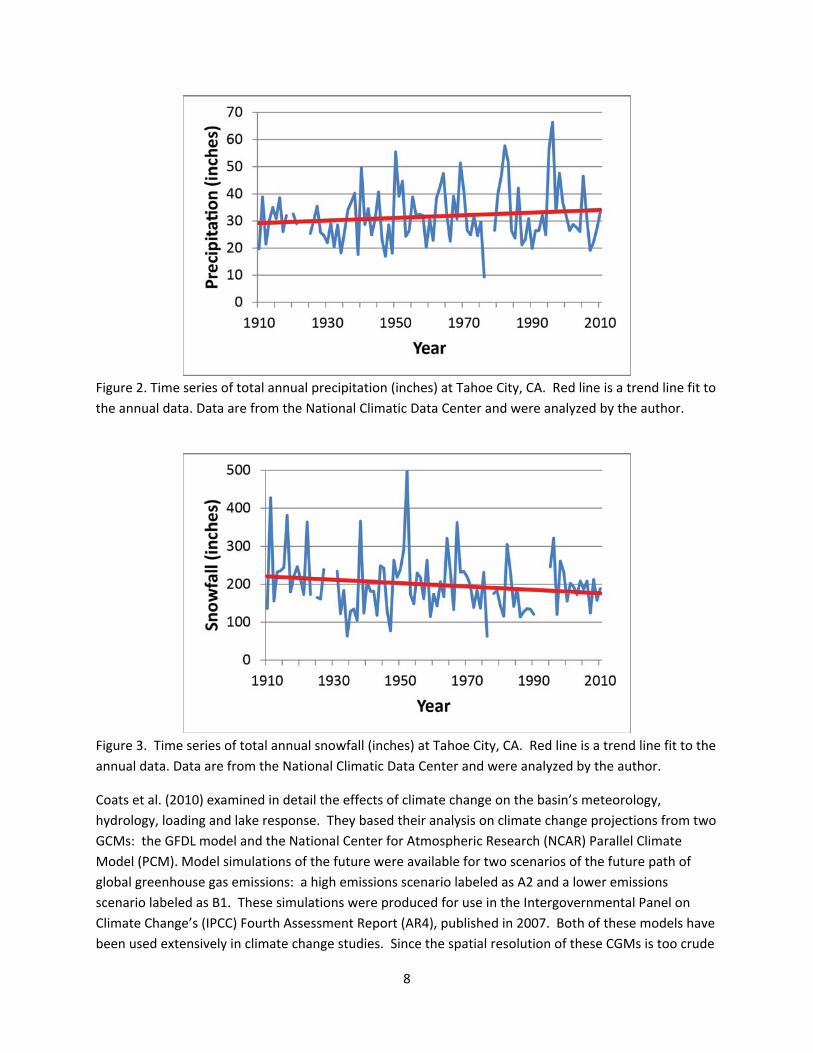
data gives an upward trend of 2.0°F/century. Precipitation (Fig. 2) and snowfall (Fig. 3) exhibit opposite trends. The precipitation trend is slightly upward while the snowfall trend is slightly downward, suggesting a downward shift in the percentage of total precipitation falling as snow.
Figure 1. Time series of mean annual temperature (°F) at Tahoe City, CA. Red line is a trend line fit to
the annual data. Data are from the National Climatic Data Center and were analyzed by the author.
8
Figure 2. Time series of total annual precipitation (inches) at Tahoe City, CA. Red line is a trend line fit to
the annual data. Data are from the National Climatic Data Center and were analyzed by the author.
Figure 3. Time series of total annual snowfall (inches) at Tahoe City, CA. Red line is a trend line fit to the
annual data. Data are from the National Climatic Data Center and were analyzed by the author.
Coats et al. (2010) examined in detail the effects of climate change on the basin’s meteorology,
hydrology, loading and lake response. They based their analysis on climate change projections from two
GCMs: the GFDL model and the National Center for Atmospheric Research (NCAR) Parallel Climate
Model (PCM). Model simulations of the future were available for two scenarios of the future path of
global greenhouse gas emissions: a high emissions scenario labeled as A2 and a lower emissions
scenario labeled as B1. These simulations were produced for use in the Intergovernmental Panel on
Climate Change’s (IPCC) Fourth Assessment Report (AR4), published in 2007. Both of these models have
been used extensively in climate change studies. Since the spatial resolution of these CGMs is too crude

9
to adequately study basin effects in detail, a relatively sophisticated downscaling methodology known as
“constructed analogs” (Hidalgo et al. 2008) was applied to the model outputs to produce simulated data
records at a 1/8° grid resolution and daily time resolution. These downscaled data were used to drive
existing lake clarity, watershed, and pollutant load reduction models.
All of the model simulations show upward trends in temperature, with GFDL larger than PCM and the A2
scenario larger than the B1. Trends in annual precipitation are mixed among the simulations. The
increasing temperatures result in a continuation of the recently‐observed trend from snowfall to rain
and toward earlier snowmelt and runoff. There is also some increase in drought severity towards the
end of the century.
There are significant hydrologic responses to these changes in climate conditions (Huntington et al 2012,
Mejia et al 2012). One of these is a downward shift in the hydrologic flow‐duration curve for the A2
scenario in the last third of the century. There are also dramatic increases in flood magnitude in the
middle third of the century, especially with the B1 scenario. This apparently results from an increase in
the risk of rain‐on‐snow events as temperatures warm. This risk decreases toward the end of the
century because of a general decrease in snowpack amounts. In the GFDL A2 simulation, the lake
surface level falls below the natural rim by the end of the Century with resulting declines in minimum 5‐
day flows on the Truckee River. These hydrologic and climate changes will create stresses on terrestrial
and aquatic ecosystems, including increased risk of wildfire, increased tree mortality from insects and
diseases, increased erosion and sediment yields, and losses of aquatic habitat.
The Coates et al (2010) study did not find any meaningful increase in sediment and nutrient loading to
Lake Tahoe, and perhaps even a decrease due to the estimated decline in water yield. They estimate a
modest decline in BMP performance for fine sediment particle load reductions (i.e. increase in average
pollutant load), but any diminished performance will be relatively small and load reduction should still
be significant. One of the most significant results of this study is that by the middle of the 21st Century
(after about 2050) Lake Tahoe could cease to mix to the bottom. This would in turn result in complete
oxygen depletion in the deep waters and an increase in sediment release of nitrogen and phosphorus.
Annual loading of soluble reactive phosphorus under sustained conditions of lake stratification (no deep
mixing) and anoxic sediments could be twice the current load from all other sources. Loading of
ammonium under these conditions could increase the amount of biological available nitrogen that
enters the lake by 25 percent. This effect on the Lake Tahoe’s nutrient budgets could have a dramatic
and long‐lasting impact on the food web and trophic status of Lake Tahoe. The resulting annual Secchi
depth in the later portion of the 21st Century could be in the range of 15‐20 m as compared to
measured values of 21‐22 m since 2000.
The above results provide a general picture of change in the basin. All simulations agree on increases in
temperature; thus, impacts related to temperature changes are highly likely. Although there is great
uncertainty about changes in precipitation, the temperature increases alone will drive significant
hydrologic changes. Their study was not able to ascertain the quantitative impact of rainfall‐mediated
erosion on loading. The study found that storm water facilities would meet national standards if they
were sized using the 20‐year 1‐hour design standard, but this standard is likely to change in a future
10
climate. A major limitation of the Coats et al. (2010) study was the use of only two GCMs. The Fourth
Assessment Report (AR4) of the Intergovernmental Panel on Climate Change (IPCC) utilized model
simulations of the future for 25 different GCMs from 18 different modeling groups. Model simulations
for the IPCC Fifth Assessment Report (AR5) are now available and include a large number of simulations.
Past evaluations of model accuracy in simulating the present‐day climate have found that a single
model’s skill varies widely depending on the metric chosen. In fact, numerous comparisons have found
the best “model” is a simple mean of all available models (multi‐model mean).
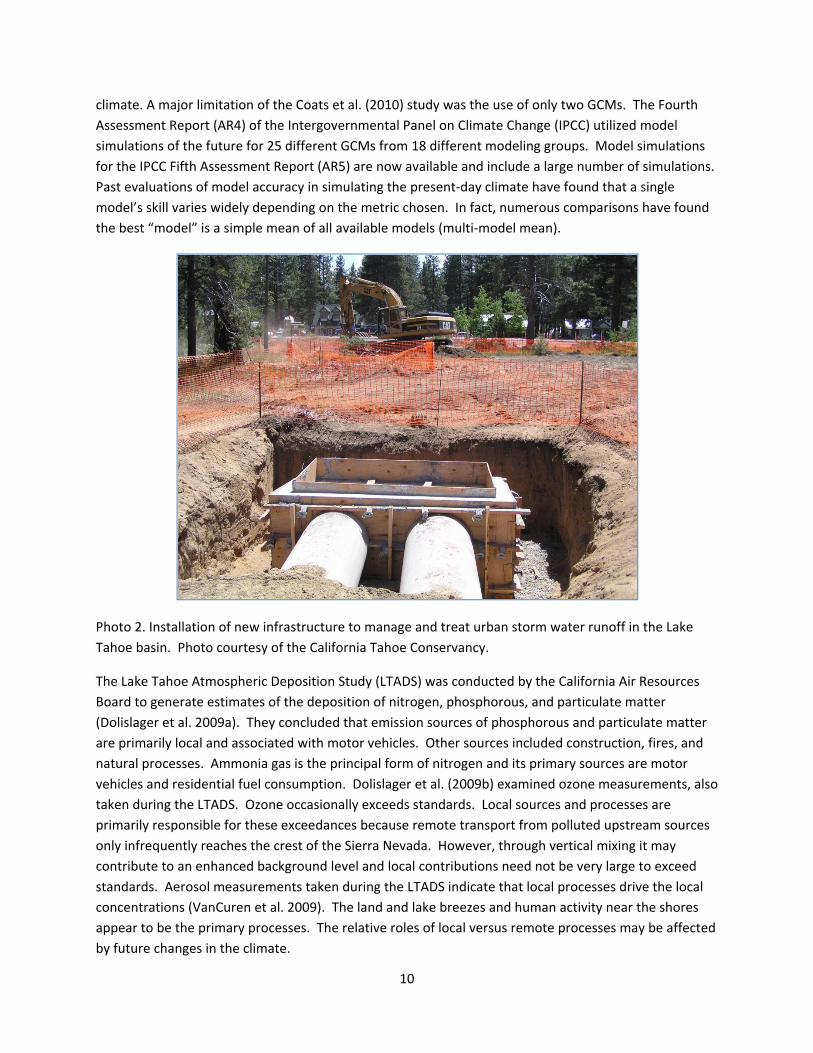
Photo 2. Installation of new infrastructure to manage and treat urban storm water runoff in the Lake
Tahoe basin. Photo courtesy of the California Tahoe Conservancy.
The Lake Tahoe Atmospheric Deposition Study (LTADS) was conducted by the California Air Resources
Board to generate estimates of the deposition of nitrogen, phosphorous, and particulate matter
(Dolislager et al. 2009a). They concluded that emission sources of phosphorous and particulate matter
are primarily local and associated with motor vehicles. Other sources included construction, fires, and
natural processes. Ammonia gas is the principal form of nitrogen and its primary sources are motor
vehicles and residential fuel consumption. Dolislager et al. (2009b) examined ozone measurements, also
taken during the LTADS. Ozone occasionally exceeds standards. Local sources and processes are
primarily responsible for these exceedances because remote transport from polluted upstream sources
only infrequently reaches the crest of the Sierra Nevada. However, through vertical mixing it may
contribute to an enhanced background level and local contributions need not be very large to exceed
standards. Aerosol measurements taken during the LTADS indicate that local processes drive the local
concentrations (VanCuren et al. 2009). The land and lake breezes and human activity near the shores
appear to be the primary processes. The relative roles of local versus remote processes may be affected
by future changes in the climate.
11
The El Nino‐Southern Oscillation (ENSO) climate mode of variability has large effects on the climate of
the western United States. With regard to ENSO, the LTB is located in a transition zone between areas to
the north and the south with opposing ENSO effects on cold season precipitation. However, research
has indicated an interesting ENSO effect on the ratio of high elevation to low elevation precipitation
(Kelly Redmond, personal communication). This ratio tends to be higher during a La Nina. No
explanation of this effect has been found. There is no certainty that the small ENSO effects on the LTB
will continue into the future.
3. Research Needs
Hymanson and Collopy (2010) identified research needs and priorities for the LTB. A brief summary of
their analysis is given here.
Air Quality
Gertler et al. (2010) identified a number of needs related to air quality. Air quality can be affected by
changes in any number of climate characteristics, including temperature (affecting chemical reaction
and biogenic emissions rates), wind speed and direction (affecting transport of pollutants), drought
frequency and intensity (affecting fire frequency and intensity), low‐level inversions (affecting
ventilation of the basin), and seasonality of snowmelt timing and duration (affecting fire frequency and
intensity and perhaps the number of vehicles during the cold season), to name some prominent
examples. The quantification of climate changes on air quality is difficult because of the complexity of
the physical and chemical processes of relevance, a situation which could be addressed with modeling.
The only model adapted for use in the Tahoe basin is the Lake Tahoe Atmospheric Model, a heuristic
model that is based on statistical input. There is a need for an appropriate air quality model
incorporating physical and chemical processes to be developed that can utilize the full suite of
meteorological, chemical, and particulate data. This will enable managers and scientists to better assess
air pollutant trends, estimate impacts, and support the development of effective regulations that will
assist in meeting air quality and other environmental goals.
The development of an air quality model based on physical and chemical processes faces a major
challenge with respect to validation. The data that are needed for validation are lacking in spatial and
temporal coverage and in terms of the types of variables. This is true for both chemical and
meteorological variables, but the deficiency is most severe for chemical species. There are a number of
processes with significant uncertainties. These uncertainties need to be reduced in order to effectively
build a modeling system for climate change applications. Two key examples are:
a. Atmospheric deposition to the lake is the major source of nitrogen and a substantial source of
phosphorous and particulate matter. There is, however, significant uncertainty in deposition flux
estimates. To reduce this uncertainty, they recommend that focused studies (i.e., gradient or
eddy‐correlation studies, along with measurements of key species) be conducted of the sources
and pathways of particle deposition to better inform models and restoration efforts.
b. Mobile source emissions are a major source of pollutants in the basin. To improve the emissions
inventory, it is recommended that Tahoe‐specific vehicle model year distributions, emission
12
factors, and activity data be conducted for use in mobile source emission factor models. These
results will reduce the uncertainty in the emissions inventory and enable regulators to develop
more effective strategies to reduce pollution in the basin.
Water Quality
For applications related to water quality modeling, the following specific research needs were identified:
a. How will the hydrologic changes associated with Tahoe basin warming affect flood frequency,
channel change, and sediment/nutrient transport?
b. How will the shift in snowmelt timing and sediment delivery interact with increasing lake
temperature and thermal stability to affect lake biology and water clarity? How will the insertion
depth of stream inflow be affected?
c. How will the increase in lake temperature and thermal stability affect Lake Tahoe’s dissolved
oxygen (DO) profile? Is it possible for the lake to go anaerobic at the bottom?
d. Does Lake Tahoe enhance the rate of climate change in the basin?
e. What impact will potential changes to watershed hydrology and pollutant loading have on
current management strategies to restore Lake Tahoe’s water clarity?
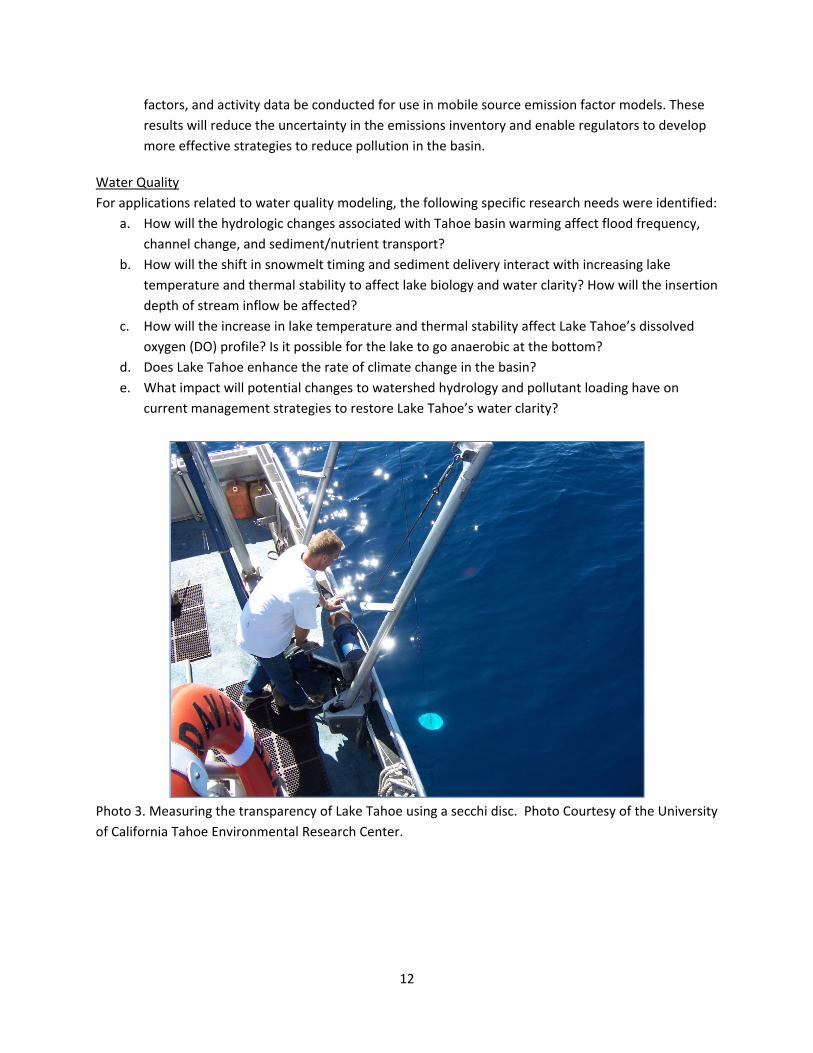
Photo 3. Measuring the transparency of Lake Tahoe using a secchi disc. Photo Courtesy of the University
of California Tahoe Environmental Research Center.
13
These lead to the following research priorities related to climate change:
a. Apply predictive scenario testing for evaluating potential effects from climate change within the
new and developing management models used for water quality in the Tahoe basin. In
particular, models could be used to evaluate basinwide Best Management Practices (BMP)
effectiveness and load reduction strategies based on the expected changes to temperature,
precipitation, and hydrology.
b. Limnological processes in Lake Tahoe such as stratification, depth of mixing, particle distribution
and aggregation, species succession, aquatic habitat based on water temperature, and
meteorology are all recommended for reevaluation in light of climate change and possible
management response to the impacts of climate change.
Soil Conservation
For the effects of climate change as related to soil conservation, the following needs and concerns were
identified:
a. There is concern that anthropogenic activities over the last century have resulted in nontypical
ecosystem structure throughout the basin of which the distribution, character, variability, and
potential response to climate change have not been evaluated. Consequently, strategic efforts
directed toward long‐term site restoration in response to a quasi‐natural state will be the more
likely scenario. Quantitative assessment of what can and cannot be accomplished on a long‐
term basis is recommended.
b. More comprehensive localized point source precipitation, surface runoff, erosion, and nutrient
transport data is recommended to quantify potential discharge loads as a function of amount,
type (snow vs. rainfall), frequency, and precipitation intensity. It is recommended that research
and monitoring projects be designed to address potential changes in hydrologic parameters as a
result of climate change.
c. The implications of climate change on slope stability parameters should be investigated. It is
recommended that surface soil stability, compaction, soil structure and aggregate stability,
infiltrability and runoff, and potential for mass wasting all be tested under scenarios of different
temperature and moisture regimes to estimate the potential effects of climate change on soil
erosion in the Lake Tahoe basin. Rapid melting of a smaller snowpack would lead to a decrease
in soil moisture during summer months owing to an earlier runoff. Less rainfall and therefore
less soil moisture is associated with an increase in microparticle percentage and a decrease in
aggregate stability. Hence, a decrease in snowpack could ultimately lead to increased instability
of slopes and a higher incidence of erosion in the Lake Tahoe basin. Better characterization of
amount, rate, duration, and seasonal occurrence of rainfall precipitation could help to delineate
shifts in the local climatic precipitation phase and the potential impact on erosion, model
estimations, and BMP design criteria.
Ecology and Biodiversity
The integrity of animal and plant communities serves as a critical measure of the effectiveness of
implementation policies designed to protect and restore ecosystem processes in the Lake Tahoe basin.
14
The conservation of plants and animals in the Tahoe basin is wholly dependent on the conservation of
its terrestrial and aquatic ecosystems.
Climate change is a key uncertainty, and arguably poses a high environmental and economic risk.
Investigation of this requires modeling of potential responses – plant and animal ranges and associated
effects on population sizes, species interactions, and ecological services ‐ to potential climate change
and associated broad‐scale environmental responses. Such modeling is likely to require information on
a broad range of atmospheric processes and conditions.
Climate Change Information Needs
The above needs related to air quality, water quality, soil conversation, and ecology and biodiversity
lead to a number of considerations related to climate information needs:
a. Certain types of impacts models require high temporal and spatial resolution climate data.
These include air quality and hydrology models. Temporal resolution of daily, or even higher,
may be required. Climate elements needed for future time periods may include temperature,
precipitation, soil moisture, solar and infrared radiation, wind, and evapotranspiration.
b. Changes in precipitation extremes will affect many processes including erosion, flooding, and
water quantity and quality. There are theoretical reasons to expect changes, but model
simulation of precipitation is an area of considerable uncertainty
c. The mountainous topography of the basin is at scales that are not resolved in climate models.
Therefore, the translation of climate model data to the specific needs of the above applications
will be needed.
d. Forest fire risks are highly sensitive to climate. Increases in temperature, changes in the
seasonality of snowpack melting, and changes in the frequency and intensity of droughts are
simulated by many climate models and would have large effects on such risks.
e. Changes in the climatology of snowpack are likely. Increases in temperature will affect the
average elevation of the snow‐rain line and also the timing of snowmelt at all elevations.
Changes in total annual snowfall could occur but this is an area of high uncertainty.
The effects of climate change on Lake Tahoe processes and management strategies must take into
account the uncertainties that currently exist and will continue to exist regarding future climate
outcomes. These arise from uncertainties about the socio‐economic path of human society and
scientific uncertainties about the sensitivity of the climate system to increases in greenhouse gas
concentrations and other human influences. A number of past assessments of climate change effects
here and elsewhere have tended to focus on the projections from one or two global climate models. For
future Lake Tahoe work related to climate change, there are at least three important considerations: (a)
there are a large number of global climate model simulations available for analysis, (b) no single model
has been found to be superior by a broad set of evaluation metrics; and (c) typically the multi‐model
mean is the best estimate of conditions.
In the context of this document, the term “climate model” is used for a computer program whose code
represents the complex physics equations that determine the motion and evolution of the atmosphere.
15
A global climate model (GCM) breaks the entire global atmosphere into a set of boxes and solves the
equations to determine basic atmospheric properties (temperature, wind, pressure, humidity, etc.) for
each box at a particular time. The model then steps forward in time (a typical time step is of the order
of an hour) and repeats the calculations. These models also include interactions with the oceans and
land surface. The use of these models to simulate potential future climate outcomes requires very large
amounts of computer time, principally because of the large number of time steps and grid boxes.
Regional climate models (RCMs) are similar in most respects to GCMs. The fundamental difference is
that RCMs simulate the evolution of the climate system for only a small part of the globe (e.g. North
America). Within this domain, RCMs typically use much higher spatial resolution so that regional and
local processes can be simulated with greater fidelity. Since only a small portion of the globe is
simulated, the higher spatial resolution is more achievable in the usual situation where computer
resources are limited. However, the climate system is global and the regional simulation cannot be
done in isolation. The atmospheric conditions on the sides of the RCM domain have to be specified and
coarser GCM simulations are used to provide these conditions. This means that any errors in the GCM
simulation of the large‐scale conditions will be inherited by the RCM.
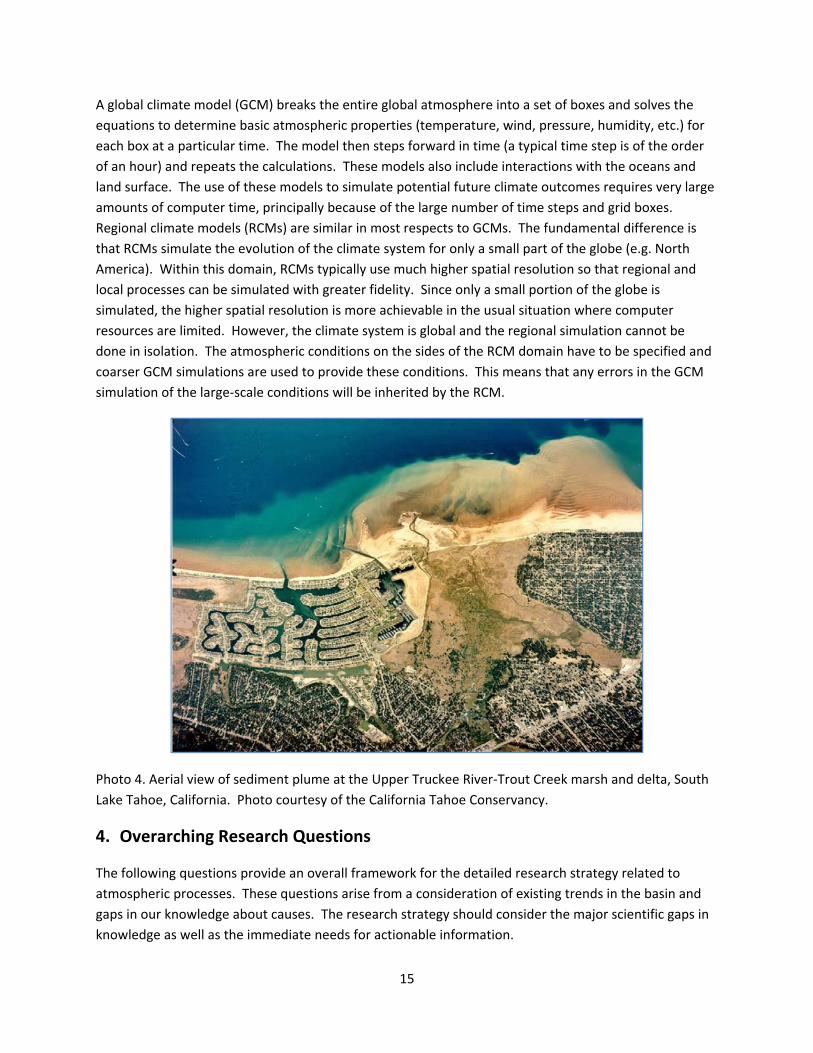
Photo 4. Aerial view of sediment plume at the Upper Truckee River‐Trout Creek marsh and delta, South
Lake Tahoe, California. Photo courtesy of the California Tahoe Conservancy.
4. Overarching Research Questions
The following questions provide an overall framework for the detailed research strategy related to
atmospheric processes. These questions arise from a consideration of existing trends in the basin and
gaps in our knowledge about causes. The research strategy should consider the major scientific gaps in
knowledge as well as the immediate needs for actionable information.
16
What are possible high impact climate extremes that are outside the envelope of historical
experience? Given the expectations of continued warming and associated shifts in other climate
conditions, how bad could future extremes be? Could some future extremes be so far outside the
envelope of historical experience that they would simply overwhelm the present‐day adaptive
resources of the basin? Two examples illustrate the types of phenomena:
(1) the combination of drought, heat, and wind that is conducive to wildfires. One can envision
three conditions coming together in the following worst case scenario. Winter drought
produces much below normal snowpack. Early spring warmth (much warmer than any historical
episodes due to overall global warming) results in the complete melting of the snowpack by
mid‐spring. A late spring dry front with very strong winds (something that can happen in today’s
climate) fans a small fire into a catastrophic wildfire that cannot be contained because of the
strong winds.
(2) the combination of extreme precipitation, winter warmth, snowmelt, and flooding arising
from strong winter storms with a tropical moisture source (atmospheric river). A possible
scenario might proceed as follows. Early winter storms produce above normal snowpack. Then
a very warm and strong storm system with a tropical moisture source occurs. Because of overall
global warming, there is the likelihood that the most extreme of these systems (which are part
of the present‐day climate) will be both warmer and wetter than any systems in the historical
record. Thus, the amount of rain as well as the extent of snowmelt could be unprecedented and
overwhelm flood control systems and strategies.
Why is the Lake Tahoe basin warming faster than surrounding areas? What is the likelihood that
this will continue? Will future anthropogenically‐forced changes to the climate system accelerate or
ameliorate this trend?
What is the relative importance of local vs. remote processes in determining the air quality of the
basin? What are the meteorological conditions under which remote sources of pollution can
significantly affect basin air quality? What is the risk that future climate patterns could change
sufficiently to alter the role of remote sources?
What will be the specific characteristics of changes in seasonality? Warming will shift the
temperature climate to conditions similar to present‐day lower elevation locations, but such
conditions are very different on the eastern side of the Sierras compared to the western side. Will
future conditions in the basin resemble one or the other? Or, will there be large‐scale circulation
changes that create climate conditions unlike either present‐day lower elevation conditions?
What are the unique challenges for high‐elevation lakes and basins that will be posed by global
warming? Can Lake Tahoe Basin research lead to insights with broad applicability to similar mid‐
latitude high‐elevation areas?
The following three sections describe the specific research effort proposed to address the impacts of
climate change on the LTB. It is divided into three subsections: (1) tasks related to the specific climate
elements of relevance; (2) tasks related to air quality; and (3) issues related to the use of climate model
data.
17
5. The Effects of Climate Change On General Climate Conditions
This section describes proposed research efforts focused on the types of general climate change
information needed to address a range of Lake Tahoe issues.
a. Changes in precipitation frequency and magnitude
Precipitation simulation remains one of the most challenging aspects of climate modeling. These
challenges are even larger when considering the simulation of extreme precipitation events. LTB
extreme precipitation is primarily a cold season phenomenon, although warm season extremes, while
rare and usually localized, can be important. The occurrence of extreme cold season precipitation
accumulations are driven by the frequency and intensity of low pressure systems traveling eastward
from the Pacific and often coupled to tropical plumes of moisture. This can be highly influenced by the
occurrence, or lack thereof, of a small number of very strong systems. The large‐scale patterns will
generally determine the overall number of systems, but the occurrence of the most intense systems
may be influenced by more local processes, such as the interaction of the large‐scale flow with the local
topography and the temperature of the ocean surface just off the Pacific coast. Atmospheric “rivers”,
narrow regions of very high water vapor content caught up in the mid‐latitude flow whose sources are
tropical and subtropical regions of the Pacific Ocean, are often associated with the most extreme
episodes (Dettinger et al. 2011). However, these rivers may not be properly captured in global models.
The adequacy of a model’s ability to simulate these Pacific low pressure systems is largely related to
correct modeling of jet stream characteristics. This is generally considered an area of strength for global
models. However, there has been little systematic assessment of models’ ability to simulate
atmospheric rivers. A key question to address is whether models can simulate these rivers for the
present‐day climate and thus provide confidence in their simulation of any future changes. In an analysis
of 7 future GCM simulations, Dettinger (2011) found that years with many atmospheric river episodes
increase, atmospheric rivers with higher‐than‐historical water‐vapor transport rates increase, and
atmospheric river storm‐temperatures increase. These findings raise the possibility for more frequent
and severe floods in the LTB.
Confident estimates of changes in the most extreme precipitation events are difficult. However, the
large scale patterns are closely related to the extremes. One can examine climate simulations of the
future and identify the occurrence of large scale wind flow patterns that are related to the most
extreme events in the present‐day climate. A second factor to examine is available water vapor content,
which is likely to be higher in the future. Thus, potential extreme events may be more frequent in the
future even if the overall large‐scale wind flow conditions are the same. This is the approach used by
Dettinger in his atmospheric river analysis and one that is under consideration to examine precipitation
extremes on a national basis (a focus of the author’s current research).
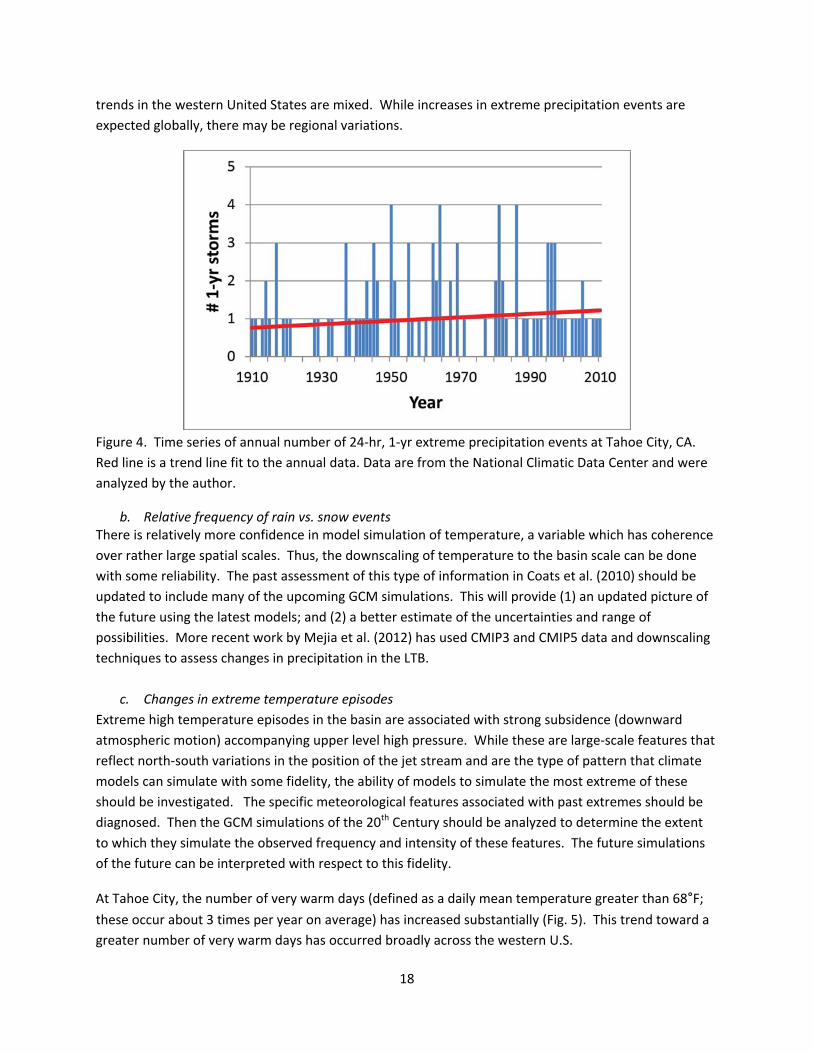
Figure 4 shows a time series of the number of daily 1‐yr storms (storms that produce precipitation
exceeding a threshold expected to occur about once per year; this threshold is about 2.4 inches) at
Tahoe City, CA. There is a slight upward trend, although it is not statistically significant. On a larger
scale, much of the eastern half of the United States exhibits highly statistically significant trends while
18
trends in the western United States are mixed. While increases in extreme precipitation events are
expected globally, there may be regional variations.
Figure 4. Time series of annual number of 24‐hr, 1‐yr extreme precipitation events at Tahoe City, CA.
Red line is a trend line fit to the annual data. Data are from the National Climatic Data Center and were
analyzed by the author.
b. Relative frequency of rain vs. snow events There is relatively more confidence in model simulation of temperature, a variable which has coherence
over rather large spatial scales. Thus, the downscaling of temperature to the basin scale can be done
with some reliability. The past assessment of this type of information in Coats et al. (2010) should be
updated to include many of the upcoming GCM simulations. This will provide (1) an updated picture of
the future using the latest models; and (2) a better estimate of the uncertainties and range of
possibilities. More recent work by Mejia et al. (2012) has used CMIP3 and CMIP5 data and downscaling
techniques to assess changes in precipitation in the LTB.
c. Changes in extreme temperature episodes
Extreme high temperature episodes in the basin are associated with strong subsidence (downward
atmospheric motion) accompanying upper level high pressure. While these are large‐scale features that
reflect north‐south variations in the position of the jet stream and are the type of pattern that climate
models can simulate with some fidelity, the ability of models to simulate the most extreme of these
should be investigated. The specific meteorological features associated with past extremes should be
diagnosed. Then the GCM simulations of the 20th Century should be analyzed to determine the extent
to which they simulate the observed frequency and intensity of these features. The future simulations
of the future can be interpreted with respect to this fidelity.
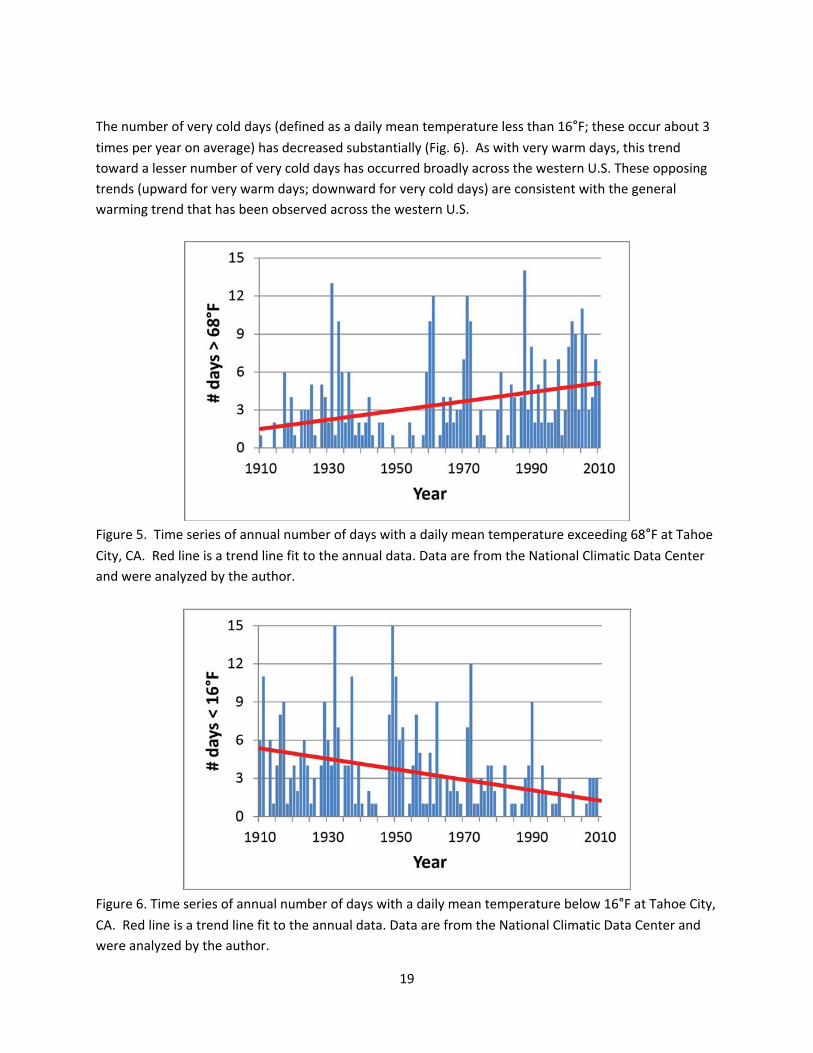
At Tahoe City, the number of very warm days (defined as a daily mean temperature greater than 68°F;
these occur about 3 times per year on average) has increased substantially (Fig. 5). This trend toward a
greater number of very warm days has occurred broadly across the western U.S.
19
The number of very cold days (defined as a daily mean temperature less than 16°F; these occur about 3
times per year on average) has decreased substantially (Fig. 6). As with very warm days, this trend
toward a lesser number of very cold days has occurred broadly across the western U.S. These opposing
trends (upward for very warm days; downward for very cold days) are consistent with the general
warming trend that has been observed across the western U.S.
Figure 5. Time series of annual number of days with a daily mean temperature exceeding 68°F at Tahoe
City, CA. Red line is a trend line fit to the annual data. Data are from the National Climatic Data Center
and were analyzed by the author.
Figure 6. Time series of annual number of days with a daily mean temperature below 16°F at Tahoe City,
CA. Red line is a trend line fit to the annual data. Data are from the National Climatic Data Center and
were analyzed by the author.

20
d. Changes in decadal scale temperature and precipitation variability
Perhaps the biggest climate change threat is that multi‐year extreme wet and dry episodes will change
in frequency and/or intensity. Coats et al. (2010) showed results that varied considerably among
simulations, indicating the need for investigation of additional model simulations. Model evaluations of
this could take multiple paths. A first step is to characterize the unique large‐scale features (wind flow,
temperature of the ocean surface) associated with past occurrences of extreme decadal‐scale
conditions. This would logically be done for the cold (wet) season. Then, an examination of model
reproduction of consecutive wet and dry seasons with similar conditions could yield useful information.
The Palmer Drought Severity Index for northeastern California (Fig. 7) shows historical multi‐year
variability. A wet period in the early part of the 20th Century followed by dryness in the 1920s‐1930s is a
notable multi‐decadal shift. In recent decades, wet periods in the early 1980s and mid 1990s were
interspersed with severe droughts in the late 1980s and early and late 2000s.
Figure 7. Time series of the Palmer Drought Severity Index for northeast California. Data and graph are
from the National Climatic Data Center.
e. Impact on elevation‐related temperature regimes
Coats et al. (2010) examined the basic effects of climate change on temperature. A more detailed
analysis would examine the vertical displacement of key temperature regimes of ecological relevance.
Compared to changes in mean temperature, changes in the vertical decrease of temperature are likely
to be small (although not necessarily zero) and probably can be ignored when considering the other
sources of uncertainty. Thus, changing temperature by an equal amount at every level is likely to be an
appropriate and straightforward approach.
21
f. Impact of climate change on air quality
The potential impact of climate on air quality is quite complicated, involving several dimensions.
Temperature will likely play a central role because of its control on many reaction and biogenic
emissions rates. Changes in the frequency and duration of stagnant weather conditions could occur and
this would have major effects on air quality. There could be more subtle, but equally important, effects.
For example, changes in snowfall amounts, which may not have a direct effect on air quality, could
result in changes in the number of Tahoe visitors, and therefore change vehicular emissions. An
evaluation of the potential impacts on air quality can best be examined through modeling tools that are
built on basic physics and chemistry principles. This is discussed in much greater detail later. But, we
can say at this point that evaluation of this aspect may require detailed (high spatial and temporal
resolution) data to examine in a comprehensive way.
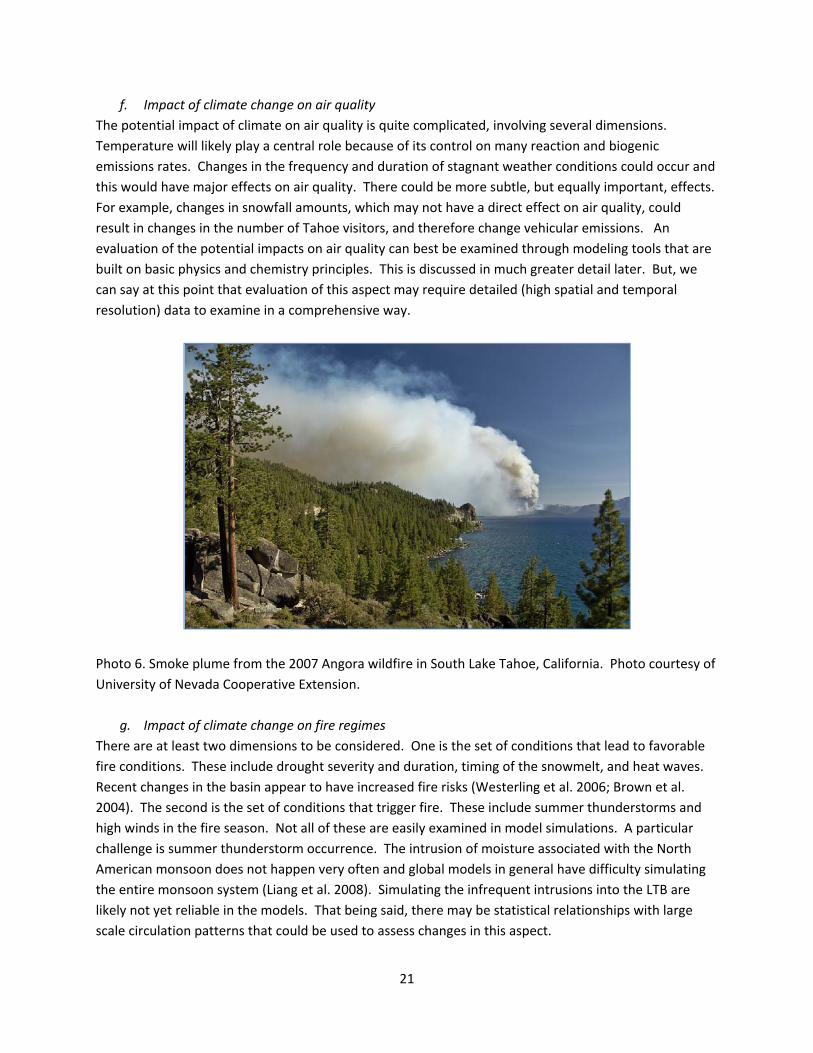
Photo 6. Smoke plume from the 2007 Angora wildfire in South Lake Tahoe, California. Photo courtesy of
University of Nevada Cooperative Extension.
g. Impact of climate change on fire regimes
There are at least two dimensions to be considered. One is the set of conditions that lead to favorable
fire conditions. These include drought severity and duration, timing of the snowmelt, and heat waves.
Recent changes in the basin appear to have increased fire risks (Westerling et al. 2006; Brown et al.
2004). The second is the set of conditions that trigger fire. These include summer thunderstorms and
high winds in the fire season. Not all of these are easily examined in model simulations. A particular
challenge is summer thunderstorm occurrence. The intrusion of moisture associated with the North
American monsoon does not happen very often and global models in general have difficulty simulating
the entire monsoon system (Liang et al. 2008). Simulating the infrequent intrusions into the LTB are
likely not yet reliable in the models. That being said, there may be statistical relationships with large
scale circulation patterns that could be used to assess changes in this aspect.
22
The examination of these diverse climate conditions leads to the following proposed research strategy.
General Climate Change Effects
Incorporate observational datasets into the modeling database. These should primarily include
long‐term datasets that are typically used in examining historical trends in the basin
Create a centralized database of relevant data from the new global climate simulations being
produced for the fifth assessment report of the IPCC and make available for use by all Tahoe
researchers. This will include simulations for the historical 20th Century and the future under
various assumptions for greenhouse gas emissions. Data variables should be selected based on
a survey of the needs of Tahoe researchers. At a minimum, data variables will include (a)
monthly time series of global model data at the model’s native resolution for grid points within
and near the basin; (b) time series of statistically downscaled data to be produced from the
global model simulations for grid points within and near the basin. These data should be made
available in a variety of common and easy to use formats including text files and Excel
spreadsheets, as well as scientific formats such as netcdf. A series of standard summary
products should be produced. The purpose of this and the following task is to minimize the
work by researchers in accessing climate change information.
Create a centralized database of relevant data from simulations produced by regional climate
models (RCMs) and make available for use by all Tahoe researchers. Data variables should be
selected based on a survey of the needs of Tahoe researchers. At a minimum, data variables will
include monthly and daily time series of regional model data at the model’s native resolution for
grid points within and near the basin. These data should be available in a variety of common
and easy to use formats including text files and Excel spreadsheets, as well as scientific formats
such as netcdf.
Apply statistical downscaling techniques to RCM data, if this is not done as part of the National
Climate Assessment (see Section 7). Although RCMs are an improvement over GCMs in terms of
spatial resolution, biases remain and resolution is inadequate for many modeling applications.
Thus, statistical downscaling is needed to remove biases and create higher resolution data.
Select and apply a set of metrics to evaluate the accuracy of model simulations of the present‐
day Tahoe climate. These metrics can be used by researchers to potentially eliminate some
models with poor performance. (see Section 7 for a more comprehensive discussion). Since the
proposed metrics examine relatively large‐scale features, the results will have applicability to
the entire Sierra Nevada range and adjacent areas.
Identify the large scale atmospheric circulation patterns associated with historical extreme
precipitation events, heat waves, and severe fire events. The emphasis should be on model
variables that are believed to be simulated with relatively high fidelity, generally large scale
fields of winds, temperature, and humidity. Therefore, these results will also have applicability
to the entire Sierra Nevada range and adjacent areas.
Analyze the historical and future simulations of the global climate models to determine changes
in the frequencies of patterns causing extreme events. Work with managers to identify the
23
kinds of information needed for decision‐making. These results will have applicability to the
entire Sierra Nevada range and adjacent areas.
Perform high resolution RCM simulations for climate model extreme events in both the
historical and future simulations. Characterize differences in surface variables relevant to the
extreme event (precipitation for extreme precipitation; temperature for heat waves;
temperature, wind, and humidity for severe fires). The domain of the RCM needs to be large
enough to allow for a full representation of regional processes. The highest resolution nest
should cover an area the size of much of Nevada and California and the analysis of the results
can be done and applied for this entire region.
Apply the information gained from model research on precipitation extremes to estimates of
future precipitation design values.
Explore the possibility for very high impact extreme events arising from the coincident
occurrence of multiple extreme types. These are conditions which have not occurred in the
historical record, but are conceivable given future changes in climate. Examine the entire suite
of GCM simulations to determine the potential risk of such extremes.
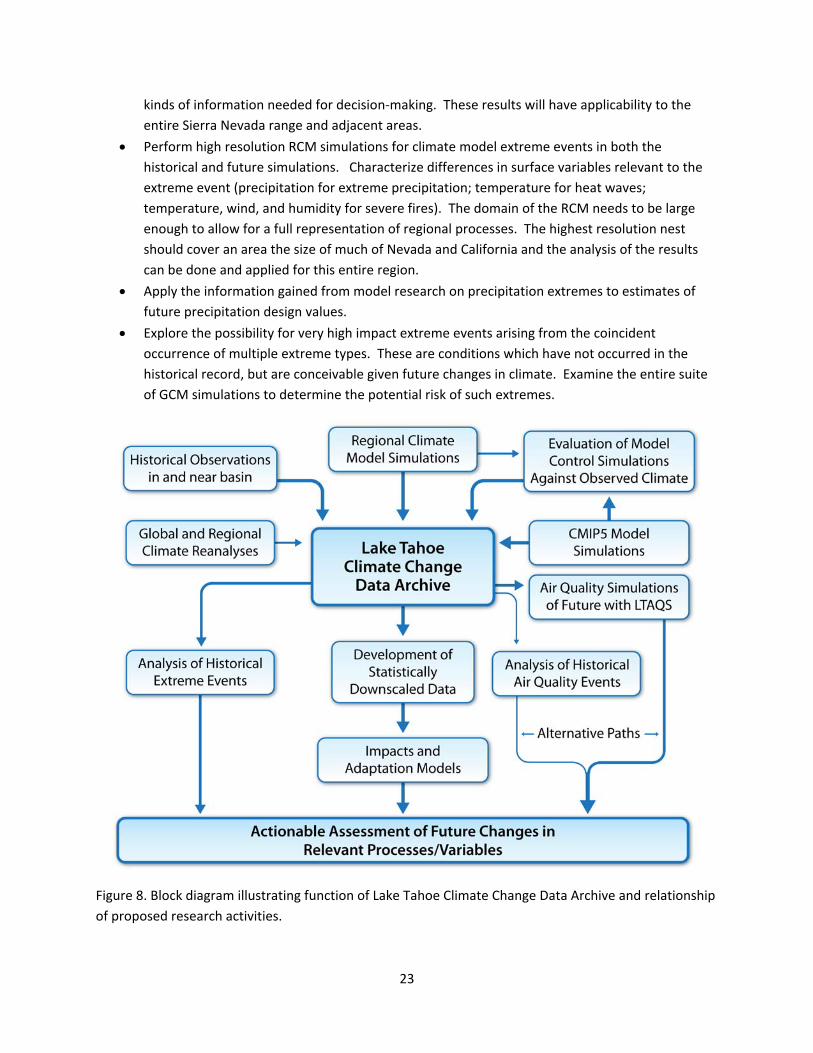
Figure 8. Block diagram illustrating function of Lake Tahoe Climate Change Data Archive and relationship
of proposed research activities.
24
The overall flow of the research described above is summarized in the block diagram of Fig. 8. The Lake
Tahoe Climate Change Data Archive serves as a central function that supports the overall research
enterprise. Historical observations and model (both global and regional) simulations are stored here to
provide a central resource for research scientists. All components of the proposed atmospheric
research, including historical event analysis, development of data sets for impacts and adaptation
models, and air quality model research, will benefit from this central service. The ultimate goal of the
enterprise is to provide actionable assessments of future changes in relevant processes and variables.
6. The Effects of Climate Change on Air Quality
The many outstanding issues related to air quality call for an integrated research approach involving
modeling, monitoring, and field experiments. These issues are intertwined and an approach to address
these must be carefully considered. While this document points to possible directions in this regard, the
challenges are formidable and a workshop to discuss these may be appropriate before committing to a
research path. The practical challenge is resources. The needs seem to vastly outweigh the likely
availability of resources. Because of the scientific and resource challenges, the immediate
recommendation is that a workshop be held as soon as possible to establish priorities.
Gertler et al. (2010) identified a host of issues with regard to data availability. A key issue is the lack of
good spatial and temporal data coverage of most relevant variables. There is a long list of needed
chemical data. In addition, the large topographic and surface cover variations in the basin are likely
associated with similar large changes in meteorological conditions relevant to air quality. The
establishment of a better knowledge of the necessary physical and chemical conditions is a formidable
observational challenge. A careful strategy based on model sensitivity studies may promote more rapid
progress on this. Given resource constraints, this is likely to involve strategic expansion of monitoring
stations as well as focused studies to increase knowledge about uncertain processes.
The current heuristic LTAM model used for basin studies provides one resource for possible sensitivity
studies. However, this model has fundamental limitations. In particular, the relationships at the
foundation of the model are simply empirical and do not involve chemical transformations; thus, in
general it will not apply in a future situation with conditions outside the range of historical experience
nor can it identify processes of high uncertainty or high sensitivity to parameterizations and data.
There are several research paths that could be followed. Two will be described below. One is a high‐
risk, high‐reward path that is likely to involve considerable resources, but if successful would deliver a
tool that would be applicable for the full range of future climate outcomes. The second is a low‐risk
path that is likely to lead to some insights into future effects of climate change on future air quality with
only modest expenditure of resources. However, this path would not likely provide information on all
possible future outcomes.
a. Air quality model development (high‐risk, high‐reward)
25
The implementation of a community air quality model that is based on fundamental physical and
chemical properties would provide a versatile tool to investigate air quality effects for the full range of
potential future climate outcomes. There are several choices including WRF‐CHEM, CMAQ, and CAMx.
Any of these would serve well. If there is expertise in the LTB research community on a particular
model, that could be a deciding advantage. If not, the WRF‐CHEM is more computationally intensive
without a commensurate increase in accuracy (Prof. Xin‐Zhong Liang, U. of Maryland, personal
communication) and one of the other models may be more suitable. The CMAQ, by virtue of its support
by the US EPA, may be the most appropriate choice, but as noted above other considerations may affect
that decision.
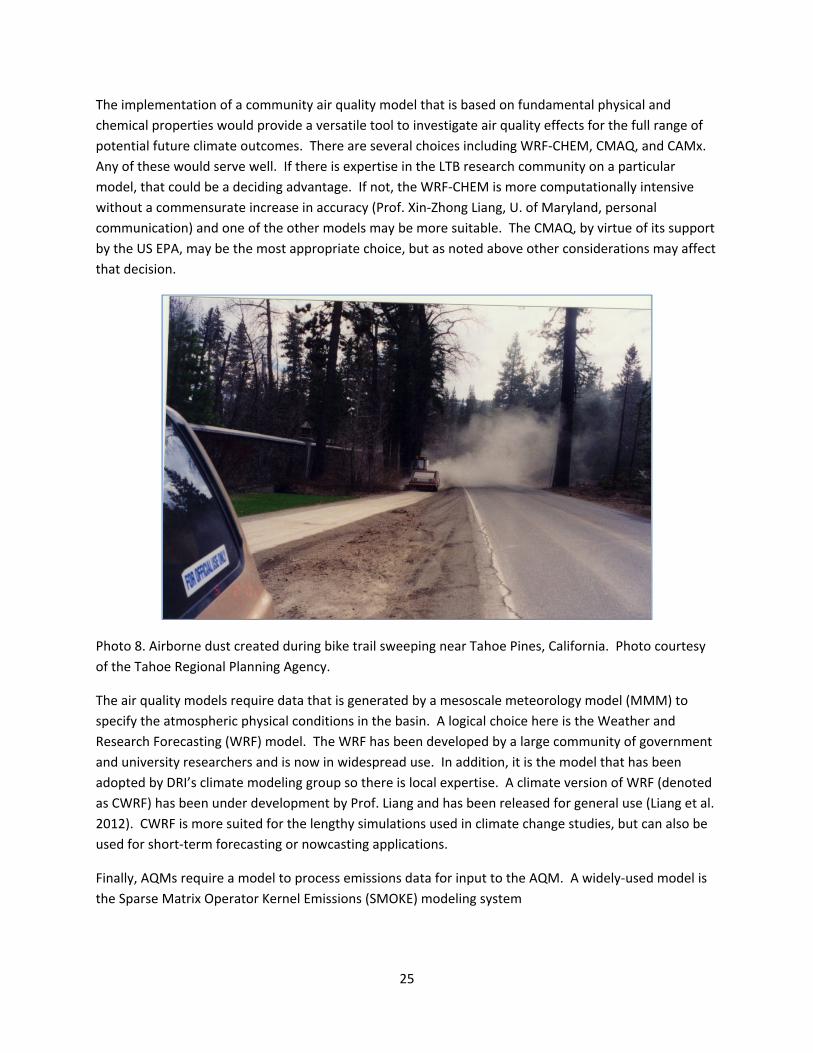
Photo 8. Airborne dust created during bike trail sweeping near Tahoe Pines, California. Photo courtesy
of the Tahoe Regional Planning Agency.
The air quality models require data that is generated by a mesoscale meteorology model (MMM) to
specify the atmospheric physical conditions in the basin. A logical choice here is the Weather and
Research Forecasting (WRF) model. The WRF has been developed by a large community of government
and university researchers and is now in widespread use. In addition, it is the model that has been
adopted by DRI’s climate modeling group so there is local expertise. A climate version of WRF (denoted
as CWRF) has been under development by Prof. Liang and has been released for general use (Liang et al.
2012). CWRF is more suited for the lengthy simulations used in climate change studies, but can also be
used for short‐term forecasting or nowcasting applications.
Finally, AQMs require a model to process emissions data for input to the AQM. A widely‐used model is
the Sparse Matrix Operator Kernel Emissions (SMOKE) modeling system

26
If the implementation of an air quality modeling system is pursued, it must be recognized that this is not
a simple task and the data may be inadequate at this stage to provide a very accurate simulation of
conditions in the basin. In addition, the implementation of a MMM has its own set of challenges and
tasks. However, even with large uncertainties in input data, sensitivity studies using this model can
provide insights.
Some of issues that have to be addressed to implement a combined climate‐air quality modeling
include:
Specification of emissions, including types and dependence on time and space. Emissions data
for all relevant species needed by the modeling system are not likely to be adequate. In these
cases, intelligent estimates will be required. Later tasks will address the sensitivity to the
estimated emissions, indicating where observations will be of greatest value.
Surface boundary conditions (vegetation type, lake bed, soil properties). These will be required
by WRF or CWRF. It is assumed here that data are available to specify these with acceptable
accuracy. A soil survey of the LTB was recently completed and is available on‐line. Information
is available at http://soildatamart.nrcs.usda.gov/Metadata.aspx?Survey=CA693&UseState=CA
Model physics parameterization choices. Both WRF and CWRF have a number of options for
specification of the parameterized model processes (surface interactions, boundary layer,
radiation, clouds, etc.). The model results can be quite sensitive to the combination. A suite of
sensitivity experiments is necessary to select a configuration that provides acceptably accurate
simulations.
Verification data. Model simulations must be verified against observational data to insure its
adequacy for management applications. At the present time, data are inadequate to verify all of
the key processes. The approach to address this is given below.
An iterative approach is envisioned to achieve a modeling system of acceptable accuracy for use in
management decision‐making. Whether this can be achieved in the 3‐5 year time frame of the plan,
given the likely level of resources, is uncertain. Nevertheless, the proposed modeling system would
provide a major improvement in the tools available to inform management of the basin. A block
diagram illustrating the approach is shown in Fig. 9.
The steps in the process are envisioned as follows:
All available emissions and meteorology data collected in the basin should be compiled. An
emissions database should be created using available data and best guesses where data are
unavailable. Using SMOKE or other emissions tools, an emissions file should be created for
input to the AQM.
Improve the emissions inventory for mobile source emissions factor models by assembling
information on Tahoe‐specific vehicle model year distributions, emission factors, and activity
data.
Implement a modern Lake Tahoe air quality modeling system (LTAQMS), to include an emissions
processing model, mesoscale meteorology model (MMM), and an air quality model (AQM). This
initial implementation will be preliminary, based on available data and process understanding.
27
The WRF, CWRF, or another MMM should be configured through a literature search.
Run a series of sensitivity experiments with the LTAQMS to identify sensitivity to input emissions
data, choice of parameterizations in the air quality model, choice of parameterizations in the
MMM, and uncertainties in the basin conditions. These can provide the necessary information
to inform a monitoring strategy. Furthermore, routine monitoring of some critical processes is
unlikely to be possible, such as overlake processes. However, these can be studied in short‐term
focused studies. Model sensitivity simulations can identify the key scientific and observational
data issues that require field experiments to improve understanding and narrow uncertainties.
Design an observational (ongoing monitoring and intensive field campaigns) strategy, based on
the sensitivity experiments, to reduce those uncertainties to which the model simulations are
most sensitive and critical to management decisions.
Implement routine monitoring where necessary to support modeling development.
Plan an intensive field study to gather specialized data to support modeling development.
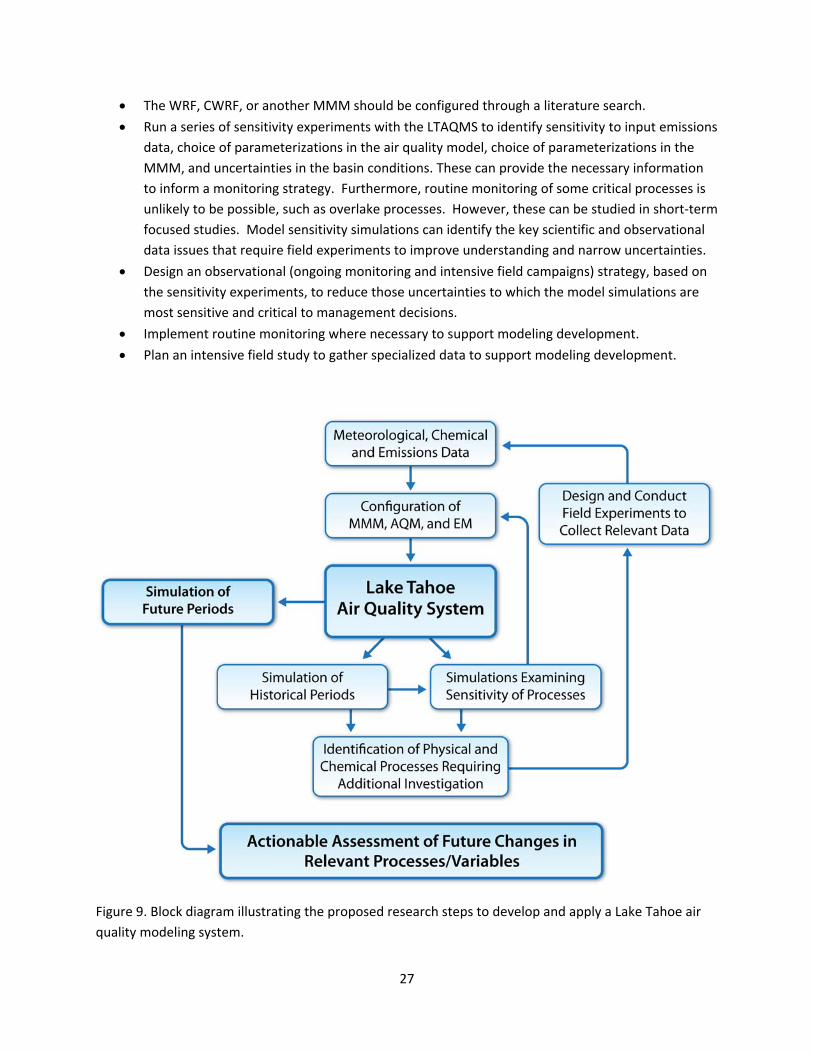
Figure 9. Block diagram illustrating the proposed research steps to develop and apply a Lake Tahoe air
quality modeling system.
28
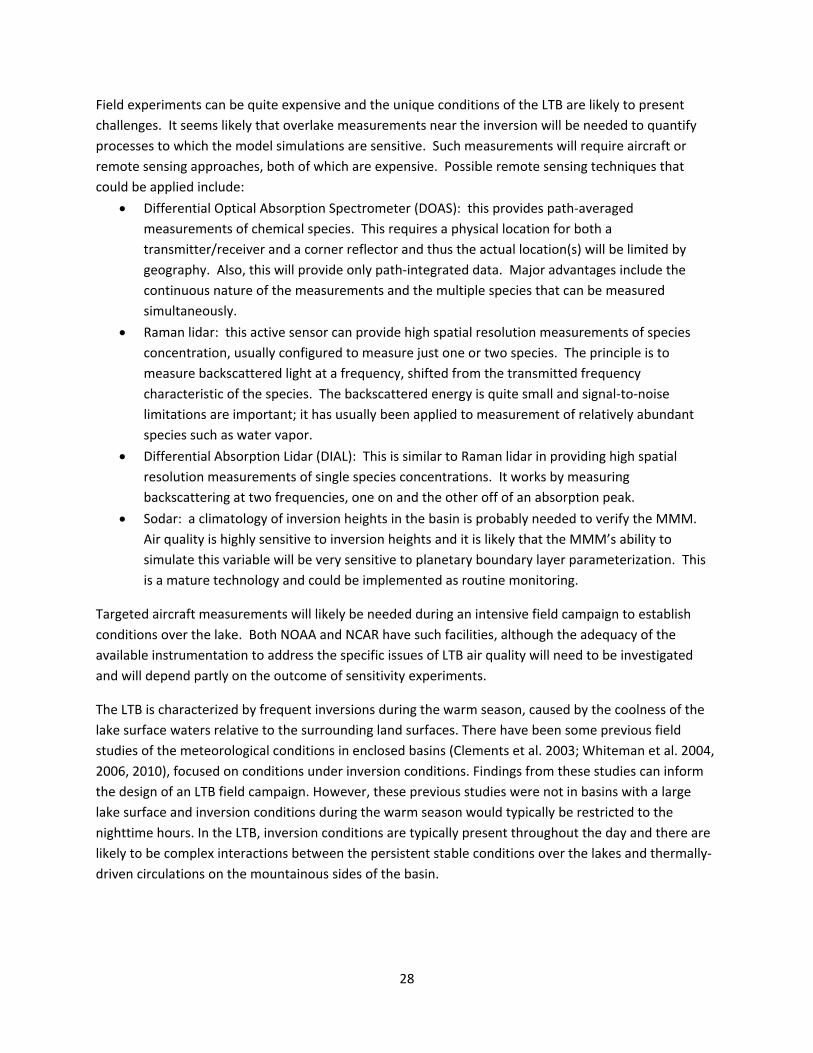
Field experiments can be quite expensive and the unique conditions of the LTB are likely to present
challenges. It seems likely that overlake measurements near the inversion will be needed to quantify
processes to which the model simulations are sensitive. Such measurements will require aircraft or
remote sensing approaches, both of which are expensive. Possible remote sensing techniques that
could be applied include:
Differential Optical Absorption Spectrometer (DOAS): this provides path‐averaged
measurements of chemical species. This requires a physical location for both a
transmitter/receiver and a corner reflector and thus the actual location(s) will be limited by
geography. Also, this will provide only path‐integrated data. Major advantages include the
continuous nature of the measurements and the multiple species that can be measured
simultaneously.
Raman lidar: this active sensor can provide high spatial resolution measurements of species
concentration, usually configured to measure just one or two species. The principle is to
measure backscattered light at a frequency, shifted from the transmitted frequency
characteristic of the species. The backscattered energy is quite small and signal‐to‐noise
limitations are important; it has usually been applied to measurement of relatively abundant
species such as water vapor.
Differential Absorption Lidar (DIAL): This is similar to Raman lidar in providing high spatial
resolution measurements of single species concentrations. It works by measuring
backscattering at two frequencies, one on and the other off of an absorption peak.
Sodar: a climatology of inversion heights in the basin is probably needed to verify the MMM.
Air quality is highly sensitive to inversion heights and it is likely that the MMM’s ability to
simulate this variable will be very sensitive to planetary boundary layer parameterization. This
is a mature technology and could be implemented as routine monitoring.
Targeted aircraft measurements will likely be needed during an intensive field campaign to establish
conditions over the lake. Both NOAA and NCAR have such facilities, although the adequacy of the
available instrumentation to address the specific issues of LTB air quality will need to be investigated
and will depend partly on the outcome of sensitivity experiments.
The LTB is characterized by frequent inversions during the warm season, caused by the coolness of the
lake surface waters relative to the surrounding land surfaces. There have been some previous field
studies of the meteorological conditions in enclosed basins (Clements et al. 2003; Whiteman et al. 2004,
2006, 2010), focused on conditions under inversion conditions. Findings from these studies can inform
the design of an LTB field campaign. However, these previous studies were not in basins with a large
lake surface and inversion conditions during the warm season would typically be restricted to the
nighttime hours. In the LTB, inversion conditions are typically present throughout the day and there are
likely to be complex interactions between the persistent stable conditions over the lakes and thermally‐
driven circulations on the mountainous sides of the basin.
29
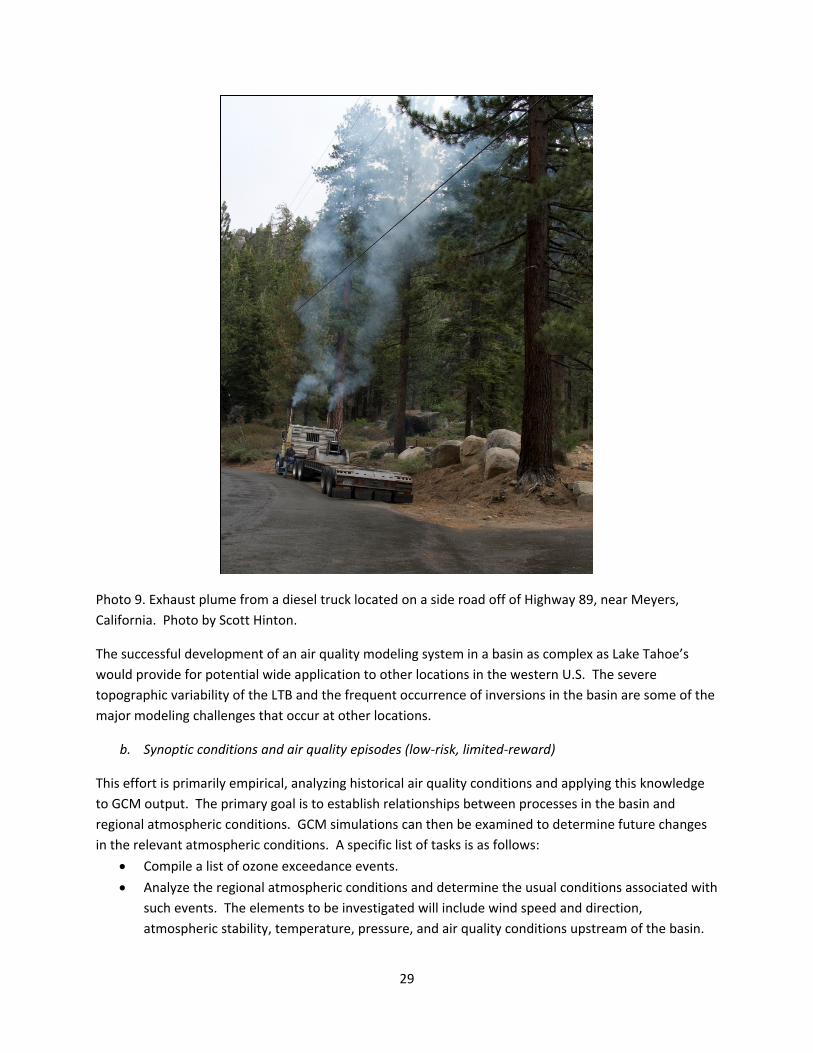
Photo 9. Exhaust plume from a diesel truck located on a side road off of Highway 89, near Meyers,
California. Photo by Scott Hinton.
The successful development of an air quality modeling system in a basin as complex as Lake Tahoe’s
would provide for potential wide application to other locations in the western U.S. The severe
topographic variability of the LTB and the frequent occurrence of inversions in the basin are some of the
major modeling challenges that occur at other locations.
b. Synoptic conditions and air quality episodes (low‐risk, limited‐reward)
This effort is primarily empirical, analyzing historical air quality conditions and applying this knowledge
to GCM output. The primary goal is to establish relationships between processes in the basin and
regional atmospheric conditions. GCM simulations can then be examined to determine future changes
in the relevant atmospheric conditions. A specific list of tasks is as follows:
Compile a list of ozone exceedance events.
Analyze the regional atmospheric conditions and determine the usual conditions associated with
such events. The elements to be investigated will include wind speed and direction,
atmospheric stability, temperature, pressure, and air quality conditions upstream of the basin.
30
Determine the historical frequency of conditions associated with high ozone events
Analyze GCM simulations of the present‐day climate to determine the extent to which they can
produce the observed frequency of conditions associated with high ozone events.
Analyze GCM simulations of the future to determine changes in the frequency of conditions
associated with high ozone events.
7. Considerations in the Use of Climate Model Simulations
The Fourth Assessment Report (AR4) of the Intergovernmental Panel on Climate Change (IPCC) utilized
model simulations of the future for 25 different GCMs from 18 different modeling groups. Model
simulations for the IPCC Fifth Assessment Report (AR5) have become available in recent years and an
even larger number of simulations are available. Past evaluations of model accuracy in simulating the
present‐day climate have found that a single model’s skill varies widely depending on the metric chosen.
In fact, numerous comparisons have found the best “model” is a simple mean of all available models
(multi‐model mean).
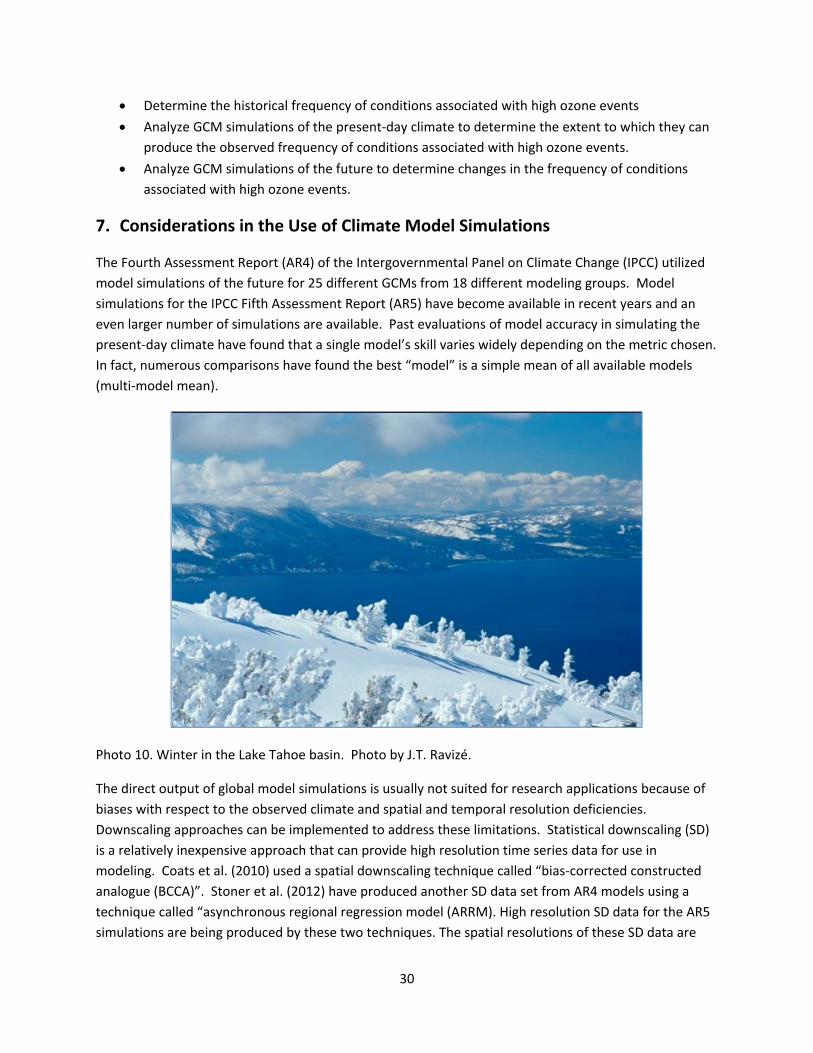
Photo 10. Winter in the Lake Tahoe basin. Photo by J.T. Ravizé.
The direct output of global model simulations is usually not suited for research applications because of
biases with respect to the observed climate and spatial and temporal resolution deficiencies.
Downscaling approaches can be implemented to address these limitations. Statistical downscaling (SD)
is a relatively inexpensive approach that can provide high resolution time series data for use in
modeling. Coats et al. (2010) used a spatial downscaling technique called “bias‐corrected constructed
analogue (BCCA)”. Stoner et al. (2012) have produced another SD data set from AR4 models using a
technique called “asynchronous regional regression model (ARRM). High resolution SD data for the AR5
simulations are being produced by these two techniques. The spatial resolutions of these SD data are
31
1/8° for both BCCA and ARRM and additionally 4 km for BCCA; time resolutions are daily (for the 1/8°)
and monthly (for 4 km). The one important limitation is that the variables will only include maximum
temperature, minimum temperature, and precipitation.
The other important tool to consider is dynamic downscaling using regional climate models (RCMs). By
their nature, SD methods are based on adjustments of historical data and do not inherently have any
ability to produce new types of weather sequences and combinations arising from the physics of the
climate system. Global climate models can produce new conditions, but their crude spatial resolution
limits their ability to produce realistic conditions in the LTB because of the high topographic variability.
RCMs can be run at much higher resolutions and provide the necessary realism for some important
phenomena. DRI’s regional modeling program is planning simulations as high as 4 km resolution
(compared to the typical 100‐200 km resolution available from global models in AR5). However, RCMs
are computationally intensive and thus expensive to run. Nevertheless, RCM simulations of selected
periods may be important and necessary to provide better insights about certain important phenomena
such as winter storms and summer monsoon moisture intrusions. There is access to RCM simulations
done by other groups. One ongoing activity is the North American Regional Climate Change Assessment
Program (NARCCAP; http://www.narccap.ucar.edu/index.html), which provides general access to
simulations from 11 combinations of global and regional models.
Another potentially important source of data are the periodic national assessments of climate change.
The next National Climate Assessment (NCA) report will be released in 2014. An idea that is currently
under consideration is to provide easy accessibility to analyses of downscaling datasets, both SD and
RCM. Lake Tahoe research activities can capitalize on this availability and make a broader range of
downscaled data available. The vision is to provide such data in easily‐accessible forms. However, it is
still worthwhile to extract data for the region of interest to LTB researchers and make that available on a
dedicated web site/server.
The use of model information to guide basin management decisions faces a formidable challenge.
Models are imperfect, yet they are the best tool available for assessing the future. As a general rule, it is
advisable to use many models for assessment. But, not all models are equal and evaluation of the
quality of model simulations, specifically focused on the basin, will provide some level of confidence in
future projections. Past assessment of model capabilities to simulate climate has not led to
identification of the best model or models, as model performance is often highly variable with respect to
the climate aspect studied. However, it seems prudent to eliminate models which poorly simulate the
present‐day climate for conditions important to the basin.
An assessment of model fidelity in reproducing key climate features important to Lake Tahoe Basin
conditions should be made. There are a wide range of possible metrics that could be chosen to evaluate
model performance. A general principle for choice of such metrics is that they represent large‐scale
features that global models are best at. The representation of the local climate conditions can be
accomplished through statistical or dynamical downscaling, but this is only appropriate if the large‐scale
features are represented properly in the global model. A few suggested metrics follow. A proposed
research effort could well identify other metrics that meet the general principle above.
32
(1) Seasonal location of jet stream at 120W. The relative north‐south location of the axis of
maximum wind speeds in the upper troposphere is an important indication of the paths of weather‐
producing systems. Proper simulation of this feature is essential for simulation of the precipitation
climatology.
(2) Frequency of low pressure storms crossing the Sierra Nevada Mts between 35 and 45°N. This
metric is not independent of (1), but rather is a surface indicator of weather‐producing conditions. As
with (1), proper simulation of this feature is essential for simulation of the precipitation climatology.
(3) Variability of the lower troposphere temperature over basin. An important feature of
atmospheric conditions is the variability of weather and the oscillation between quiet and highly‐active
conditions. This is characterized by waves, or north‐south undulations, in the upper atmospheric wind
flow. This is directly tied to temperature fluctuations in the atmosphere
(4) Frequency of occurrence, duration, and intensity of atmospheric rivers. These are integral
features of the most intense precipitation‐producing systems and model fidelity in reproducing these is
essential to assessment of extreme precipitation events. One could examine only those occurring in the
central Sierra Nevada. However, since these are relatively rare phenomena, occurrence of these in a
wider longitudinal and latitudinal band may be worthwhile. This may provide more insight into whether
the model is simulating properly the connections between the subtropics and mid‐latitudes in the
eastern Pacific.
(5) Blocking. This is a phenomenon in which the normal west‐to‐east progression of weather
systems slows or stops in an area and results in stagnating weather conditions. This can lead to drought,
heat waves, adverse air quality, and other extreme conditions. This metric would consist of some
measure of the frequency and duration of such patterns over western North America.
(6) Connections to larger‐scale patterns. Weather conditions in the LTB are influenced by the El
Nino‐Southern Oscillation (ENSO) and Pacific‐Decadal Oscillation (PDO) phenomena, both of which are
identified with oscillations of the ocean temperatures in the Pacific. Models do not universally capture
the correct character of these. It may not be necessary for a specific effort on this as it is very likely that
other groups will perform such model evaluations because of their effects over very large areas.
8. Selected Applications to Mitigation and Adaptation Strategies
Burning prescriptions. The information to be generated will provide guidance to help select
probable scenarios for changes to burning prescriptions. If more precipitation comes as rain,
then prescribed burning may be able to occur later in the year. However, a hotter, drier
summer could preclude fall burning
Water quality BMP design. More variability and greater extreme events may necessitate
changes to BMP designs. A particular area of vulnerability is the potential for increases in the
intensity of extreme precipitation events. As noted above, this is considered a highly likely
outcome from a global perspective. If this occurs in the basin, current strategies for mitigating
33
runoff of fine particles into the lake will be less effective. The proposed research is intended to
lead to more confident estimates for potential future changes in this key variable. Incorporation
of such information into design of runoff control structures would lead to more effective control
over the lifetime of those structures.
Vegetation management practices. The effects of long‐term climate change on future weather
patterns and the resulting conditions will produce a different, perhaps radically different,
environment for the support of vegetation in the Tahoe basin. Such changes as the increased
risk of wildfire frequency, extent, and intensity, increases in temperature, and earlier snowmelt
could shift the distribution and range of forest flora and fauna and reduce forest biodiversity.
The details of these changes are all‐important with respect to management of the basin and the
proposed research aims to illuminate these details.
Riparian management. If precipitation extremes were to increase, this would lead to increased
erosion risk. Efforts to restore channels and protect banks should consider this potential for
increased precipitation extremes. A goal of this research program is to narrow uncertainties so
that such information can be incorporated into such programs.
9. Acknowledgement
DRI faculty Dr. Alan Gertler and Dr. John Mejia provided helpful suggestions during the drafting and final
review of this report. DRI would also like to acknowledge the support of USDA ‐ Forest Service for this
project under Award Number: 08‐DG‐11272164‐022.
10. References
2NDNATURE and Environmental Incentives, 2010: Lake Tahoe Climate Change Science Synthesis –
Aquatic Resources.
Brown T.J., Hall, B. L., and Westerling, A. L. 2004. The impact of twenty‐first century climate change
on wildland fire danger in the western United States: an applications perspective. Climatic Change
62: 365‐388.
Cayan D. R., Kammerdiener, S., Dettinger, M., Caprio, J., and Peterson, D. 2001. Changes in the onset of
spring in Western United States. Bull. Amer. Meteor. Soc. 82: 319‐415.
Cayan, D.R., Maurer, E.P., Dettinger, M.D., Tyree, M., Hayhoe, K. 2008. Climate change scenarios for the
California region. Climatic Change, 87 (Suppl 1): S21‐42. doi10.1007/s10584‐007‐9377‐6 .
Clements, C. B., C. D. Whiteman, and J. D. Horel, 2003: Cold‐air‐pool structure and evolution in a
mountain basin: Peter Sinks, Utah. J. Appl. Meteor., 42, 752‐768.
Coats, R., J. Perez‐Losada, G. Schladow, R. Richards and C. Goldman. 2006. The warming of Lake Tahoe.
Climate Change 76: 121‐148.
34
Coats R. 2010. Climate change in the Tahoe basin: regional trends, impacts and drivers Climatic Change
DOI 10.1007/s10584‐010‐9828‐3.
Coats, R., J. Reuter, M. Dettinger, J. Riverson, G. Sahoo, G. Schladow, B. Wolfe, and M. Costa‐Cabral,
2011: The Effects of Climate Change on Lake Tahoe in the 21st Century: Meteorology, Hydrology,
Loading, and Lake Response. University of California‐Davis, Tahoe Environmental Research Center, 200
pp., http://terc.ucdavis.edu/publications/Climate_Change_Report_2010.pdf.
Dettinger, Michael, 2011. Climate change, atmospheric rivers, and floods in California – A multimodel
analysis of storm frequency and magnitude changes. Journal of the American Water Resources
Association, 47, 514‐523. DOI: 10.1111/j.1752‐1688.2011.00546.x
Dettinger, M.D., Ralph, F.M., Das, T., Neiman, P.J., and Cayan, D., 2011: Atmospheric rivers, floods, and the water resources of California: Water, 3, 455‐478.
Dolislager, L.J., R. VanCuren, J.R. Pederson, A. Lashgari, and E. McCauley, 2009: A summary of the Lake
Tahoe Atmospheric Deposition Study. Atmospheric Environment, doi: 10.1016/j.atmosenv.2009.09.020.
Dolislager, L.J., R. VanCuren, J.R. Pederson, A. Lashgari, and E. McCauley, 2009: An assessment of ozone
concentrations within and near the Lake Tahoe air basin. Atmospheric Environment, doi:
10.1016/j.atmosenv.2009.07.017.
Gertler, A.W., T.A. Cahill, T.M. Cahill, S.S. Cliff, C. Emmett, J. Koracin, H. Kuhns, J.V. Molenar, J.
Quashnick, and J.E. Reuter, 2010: Chapter 3: Air Quality. in An Integrated Science Plan for the Lake
Tahoe Basin: Conceptual Framework and Research Strategies, Z. Hymanson and M.W. Collopy (eds), pp.
37‐82.
Hamlet A.F., Mote, P. W.,Clark, M. P., and Lettenmaier, D. P. 2005. Effects of Tempearture and
Precipitation Variablility on Snowpack Trends in the Western United States. Jour. Clim. 18: 4545‐
4561.
Hidalgo, H.G., M.D. Dettinger, and D.R. Cayan (2008): Downscaling with constructed analogues:
Daily precipitation and temperature fields over the United States. Pier Final Project Report,
California Energy Commission (CEC) report no. CEC‐500‐2008‐123. Publication available at:
http://www.energy.ca.gov/2007publications/CEC‐500‐2007‐123/CEC‐500‐2007‐123.PDF.
Huntington, J.L. and R.G. Niswonger. (2012). Role of surface‐water and groundwater interactions on
projected summertime streamflow in snow dominated regions: An integrated modeling
approach, Water Resources Research, 48, W11524, doi:10.1029/2012WR012319.
Hymanson, Z.P. and M.W. Collopy (eds), 2010: An Integrated Science Plan for the Lake Tahoe Basin:
Conceptual Framework and Research Strategies. General Technical Report PSW‐GTR‐226, United States
Department of Agriculture, Forest Service, Pacific Southwest Research Station, 368 pp.
35
Knowles N, Dettinger, M., and Cayan., D. 2006. Trends in snowfall versus rainfall in the western
United States. J. Clim. 19: 4545‐4559.
Liang, X.‐Z., J.Zhu, K.E. Kunkel, M.Ting, and J.X.L. Wang, 2008:. Do CGCMs simulate the North
American monsoon precipitation seasonal‐interannual variations. J. Climate, 21, 3755‐3775.
Liang, X.‐Z., M. Xu, X. Yuan, T. Ling, H.I. Choi, F. Zhang, L. Chen, S. Liu, S. Su, F. Qiao, Y. He, J.X.L.
Wang, K.E. Kunkel, W.Gao, E. Joseph, V. Morris, T.‐W. Yu, J. Dudhia, and J. Michalakes, 2012:
Regional Climate‐Weather Research and Forecasting Model (CWRF). Bull. Amer. Meteor. Soc. 93,
1363‐1387.
Mejia, J. F., Huntington, J., Hatchett, B., Koracin, D. and Niswonger, R. G. (2012), Linking Global
Climate Models to an Integrated Hydrologic Model: Using an Individual Station Downscaling Approach.
Journal of Contemporary Water Research & Education, 147: 17–27. doi: 10.1111/j.1936‐
704X.2012.03100.x
Mote P.W., Hamlet, A. F., Clark, M., and Lettenmaier, D. 2005. Declining mountain snowpack in
western north america. Bull. Amer. Meteor. Soc. 86: 19‐49.
Pierce DW, Barnett, T.P., Hidalgo, H., Das, T., Bonfils, C., Santer, B., Bala, G., Dettinger, M., Cayan,
D., Mirin, A, Wood, A., and Nozawa, T. 2008. Attribution of declining western U.S. snowpack to
human effects. Jour. Clim. 21: 6425‐6444.
Stewart I, Cayan, D. R. ,and Dettinger, M. 2005. Changes toward earlier streamflow timing across
western North America. Jour. Clim. 18: 1136‐1155.
Stoner, A. M.K., K. Hayhoe, X. Yang, and D. Wuebbles, 2012: An asynchronous regional regression
model for statistical downscaling of daily climate variables. Int. J. Climatology, doi:
10.1002/joc.3603.
VanCuren, R., J. Pederson, A. Lashgari, L. Dolislager, and E. McCauley, 2009: Aerosol generation and
circulation in the shore zone of a large alpine lake‐2‐Aerosol distributions over Lake Tahoe, CA.
Atmospheric Environment, doi: 10.1016/j.atmosenv.2009.08.049.
Westerling AL, Hidalgo, H. G., Cayan, D. R., and Swetnam, T. 2006. Warming and earlier spring
increases western U.S. forest wildfire activity. Scienceexpress 10.1126/science.1128834: 1‐9.
Whiteman, C. D., S. Eisenbach, B. Pospichal, and R. Steinacker, 2004: Comparison of vertical soundings
and sidewall air temperature measurements in a small Alpine basin. J. Appl. Meteor., 43, 1635‐1647.