Embed Size (px)
Citation preview
DUBAI REAL ESTATE MARKET OVERVIEW
Q1 2017
REAL ESTATE SERVICES
2 3
CONTENTSDemand Drivers 4
Macro Trends 6
Residential Sector 8
Project Focus 14
Office Sector 16
Retail Sector 20
Hospitality Sector 22
Definitions & Methodology 24
Contact Information 25
Supply - Photo Gallery 26
Development Location Map 28
Residential
�� During Q1 2017, over 5,500 new residential units were added to the market, taking the total residential supply of Dubai to over 500,000 units, an increase by 1.2% quarter-on-quarter. We anticipate a further c.14,500 new units to enter the market during the course of next nine months of the year.
�� In Q1 2017, a total of 3,304 existing residential units were transacted at a cumulative value of AED5.4 billion, as compared AED4.54 billion during the same period in 2016 equating to an increase of 19% year-on-year.
�� Residential sales rates during the quarter have dropped marginally by 1.5% while year-on-year the drop is around 5%.
�� Average residential rents dropped by 2% quarter-on-quarter and 5% year-on-year. The drop has been primarily due to deflationary pressure across smaller sized units which remained highest portion of the new supply to enter over the past six months.
Office
�� Less than 50,000 sq.ft. of office space entered during this quarter, the lowest addition over the past few years, taking the Dubai office stock to 93.9 million sq.ft. Looking at ongoing construction activity, c.3.0 million sq.ft. of office space is expected to be added over the next 9 months of 2017.
�� Office sale rates across major freehold locations registered a drop of 1% quarter-on-quarter and 4%
year-on-year. The highest yearly drop was recorded across Jumeirah Lakes Towers and Downtown Dubai areas.
�� Average office rents dropped by 1% quarter-on-quarter and 6% year-on-year. The drop has been primarily due to strata office space which has struggled to maintain healthy occupancy and rental rates.
Retail
�� Rental renewals and new rates remain relatively flat, driving property operators to monitor and manage expenses cautiously with rental revenue pressure expected to continue throughout the year.
�� With shopping mall occupancy rates showing a marginal decline across the market, operators are shifting focus to increase specialty leasing of Kiosks, RMU, advertising and Pop up stores to assist in compensating on unit rental income.
Hotel
�� During Q1 2017, over 1,600 rooms were added taking the total supply to over 104,000 rooms and apartments.
�� Q1 2017 has seen hotel revenues remaining flat despite rising occupancy, largely due to declining ADR’s and non-room revenues. With pressure on hotel revenues expected to persist across 2017, hotel operators are shifting attention to tighten on operational expenses.
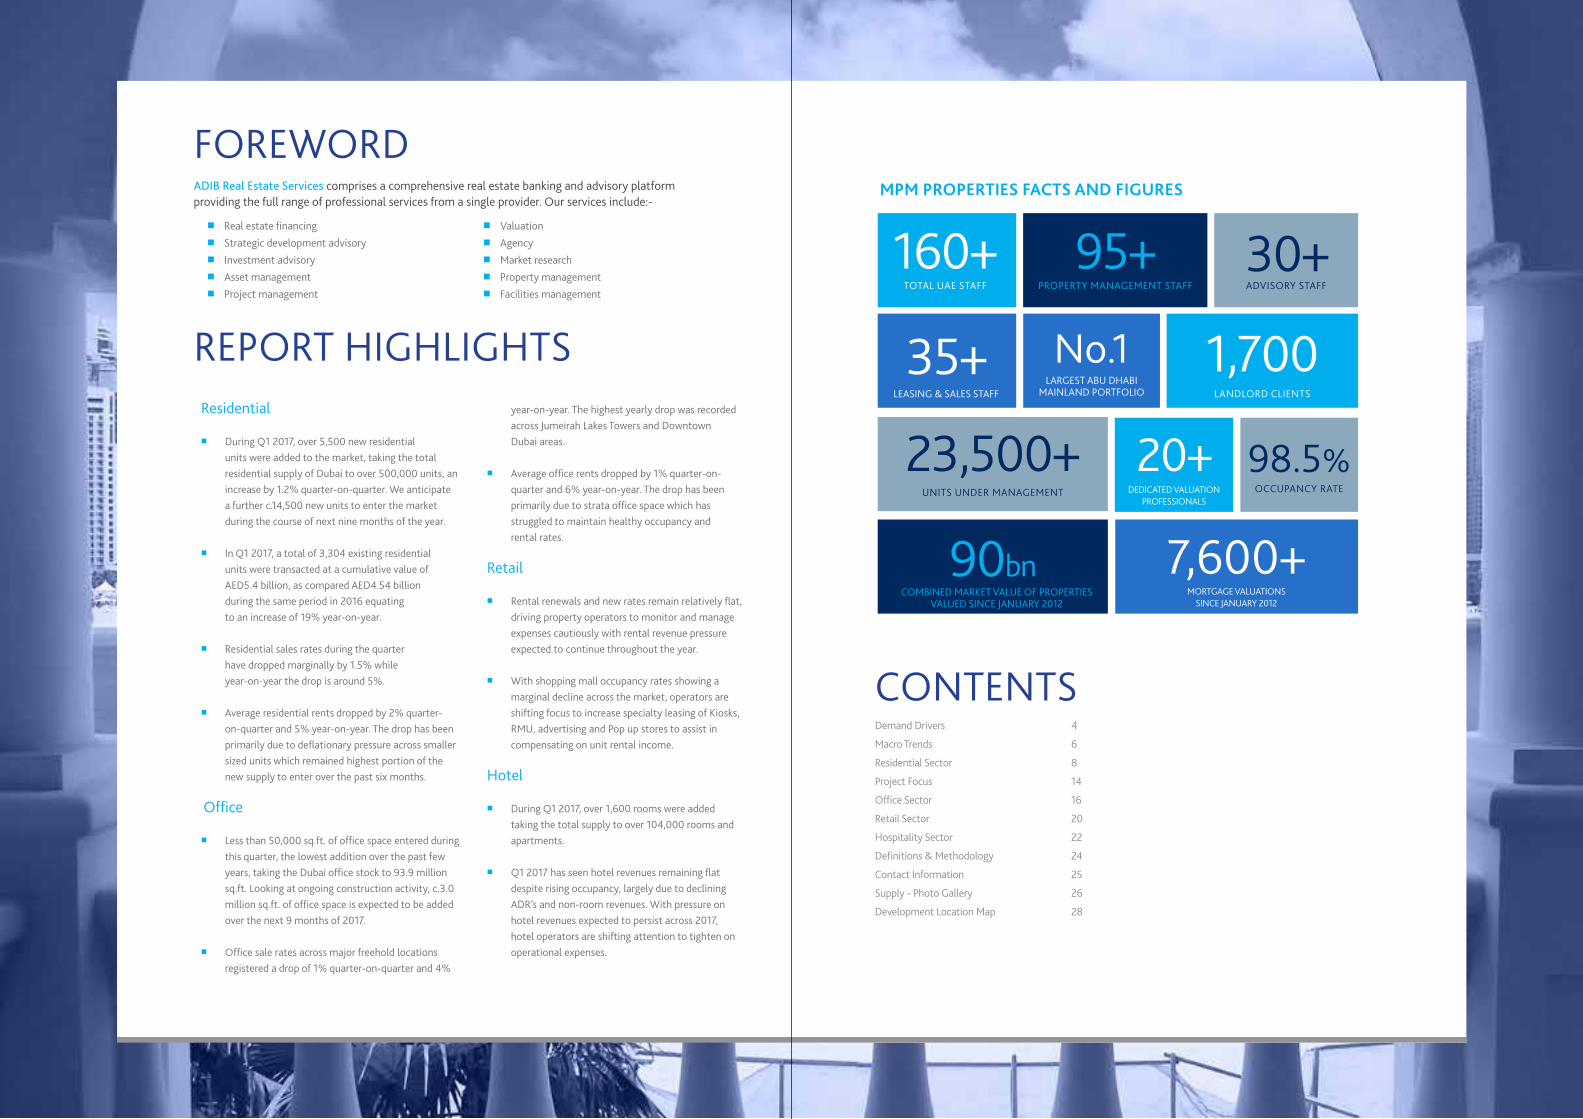
FOREWORD ADIB Real Estate Services comprises a comprehensive real estate banking and advisory platform providing the full range of professional services from a single provider. Our services include:-
�� Real estate financing�� Strategic development advisory�� Investment advisory�� Asset management�� Project management
�� Valuation�� Agency�� Market research�� Property management�� Facilities management
MPM PROPERTIES FACTS AND FIGURES
TOTAL UAE STAFF PROPERTY MANAGEMENT STAFF ADVISORY STAFF
UNITS UNDER MANAGEMENT
LEASING & SALES STAFF LANDLORD CLIENTS
COMBINED MARKET VALUE OF PROPERTIES VALUED SINCE JANUARY 2012
MORTGAGE VALUATIONS SINCE JANUARY 2012
DEDICATED VALUATION PROFESSIONALS
OCCUPANCY RATE
LARGEST ABU DHABI MAINLAND PORTFOLIO
160+
7,600+
No.1
98.5%20+
30+
90bn
35+
23,500+
95+
1,700
REAL ESTATE SERVICES | DUBAI REAL ESTATE MARKET OVERVIEWQ1 2017
4
REAL ESTATE SERVICES | DUBAI REAL ESTATE MARKET OVERVIEW Q1 2017
5
DEMAND DRIVERS
REAL ESTATE AND CONSTRUCTION�� His Highness Sheikh Mohammed bin Rashid Al
Maktoum, Vice President and Prime Minister of the UAE and Ruler of Dubai led the ground breaking ceremony for the Meydan One mall. The mall, once complete, will offer retail space for over 620 outlets, including a hypermarket and department stores, a 21-screen cinema, multipurpose sports facilities for football, basketball and indoor cricket and over 12,000 car parking spaces. Some of the key components of
the development include a one kilometer long indoor ski slope and 380 meter long dancing water fountain.
�� The Dubai Electricity and Water Authority inaugurated the second phase of the Mohammed bin Rashid Al Maktoum solar park worth AED1.2 billion, which will generate 200 megawatt clean energy, sufficient to power 50,000 homes in Dubai.
TOURISM INITIATIVES �� Figures from the Department of Tourism and
Commerce Marketing (Dubai Tourism) indicate a 12.3% rise in visitors to Dubai YTD February 2017 versus the same period last year. During the period YTD February 2017, Dubai had 3.01 million overnight visitors. 20% of the visitors originated from GCC countries, 22% from Western European countries and 18% from South Asia. In terms of top source market, India led with 388,000 visitors followed by Saudi Arabia with 300,000 visitors
and the United Kingdom remained third with 227,000 visitors.
�� His Highness Sheikh Mohammed bin Rashid Al Maktoum, Vice President and Prime Minister of the UAE and Ruler of Dubai, approved Cabinet Decree No 24 for 2017. As per the decree, Russian nationals will now be offered on arrival entry visa for 30 days, renewable for a further 30 days.
TRANSPORTATION �� His Highness Sheikh Mohammed bin Rashid Al
Maktoum, Vice President and Prime Minister of the UAE and Ruler of Dubai approved road works along a 12 kilometre stretch of Tripoli Road to link Sheikh Mohammed bin Zayed Road and Emirates Road. The AED500 million road improvement project will ease traffic flow between Dubai and Sharjah.
�� Dubai International Airport handled 6.9 million passengers in February 2017, up by 8.8% compared to 6.3 million passengers in February 2016. During the first two months, passenger traffic increased by 9.3% to 14.98 million passengers, up from 13.71 million passengers during the same period last year.
FREEZONES �� University of Wollongong in Dubai announced
construction of a new dedicated building offering 200,000 sq.ft. of campus facilities. This new facility is located in close proximity to the University’s current campus and is expected to be in operation by early 2020.
�� The Arslanian Group, a leading player in the international rough diamond business has become the 1,000th member of the Dubai Diamond Exchange (DDE), the GCC’s only diamond and coloured stones trading platform.
GOVERNMENT INITIATIVES�� Under directives from His Highness Sheikh
Mohammed bin Rashid Al Maktoum, Vice President and Prime Minister of the UAE and Ruler of Dubai, Dubai Holding signed an agreement with Dubai Municipality to develop the largest public park in Dubailand area spread over a land area of 1.4 million sq.m. The park when complete will have 30 kilometers of pathways, 20 kilometers jogging track, more than 14 kilometers of cycle tracks and 7 kilometers of nature trails along with 55 playgrounds, events area, shops, restaurants and cafes.
�� Shaikh Hamdan bin Mohammad bin Rashid Al Maktoum, Crown Prince of Dubai and Chairman of Dubai Executive Council, approved a low-income housing policy aimed at providing housing facilities for low income residents both Emiratis and expatriates workers, in strategic sectors in Dubai.
�� Indian nationals holding the United States of America green card or visa with at least six months validity will soon be able to get UAE entry visa on arrival with a validity of 14 days and an option for one time extension for the same period.
REAL ESTATE SERVICES | DUBAI REAL ESTATE MARKET OVERVIEWQ1 2017
6
REAL ESTATE SERVICES | DUBAI REAL ESTATE MARKET OVERVIEW Q1 2017
7
INVESTOR ANALYSISMACRO TRENDS
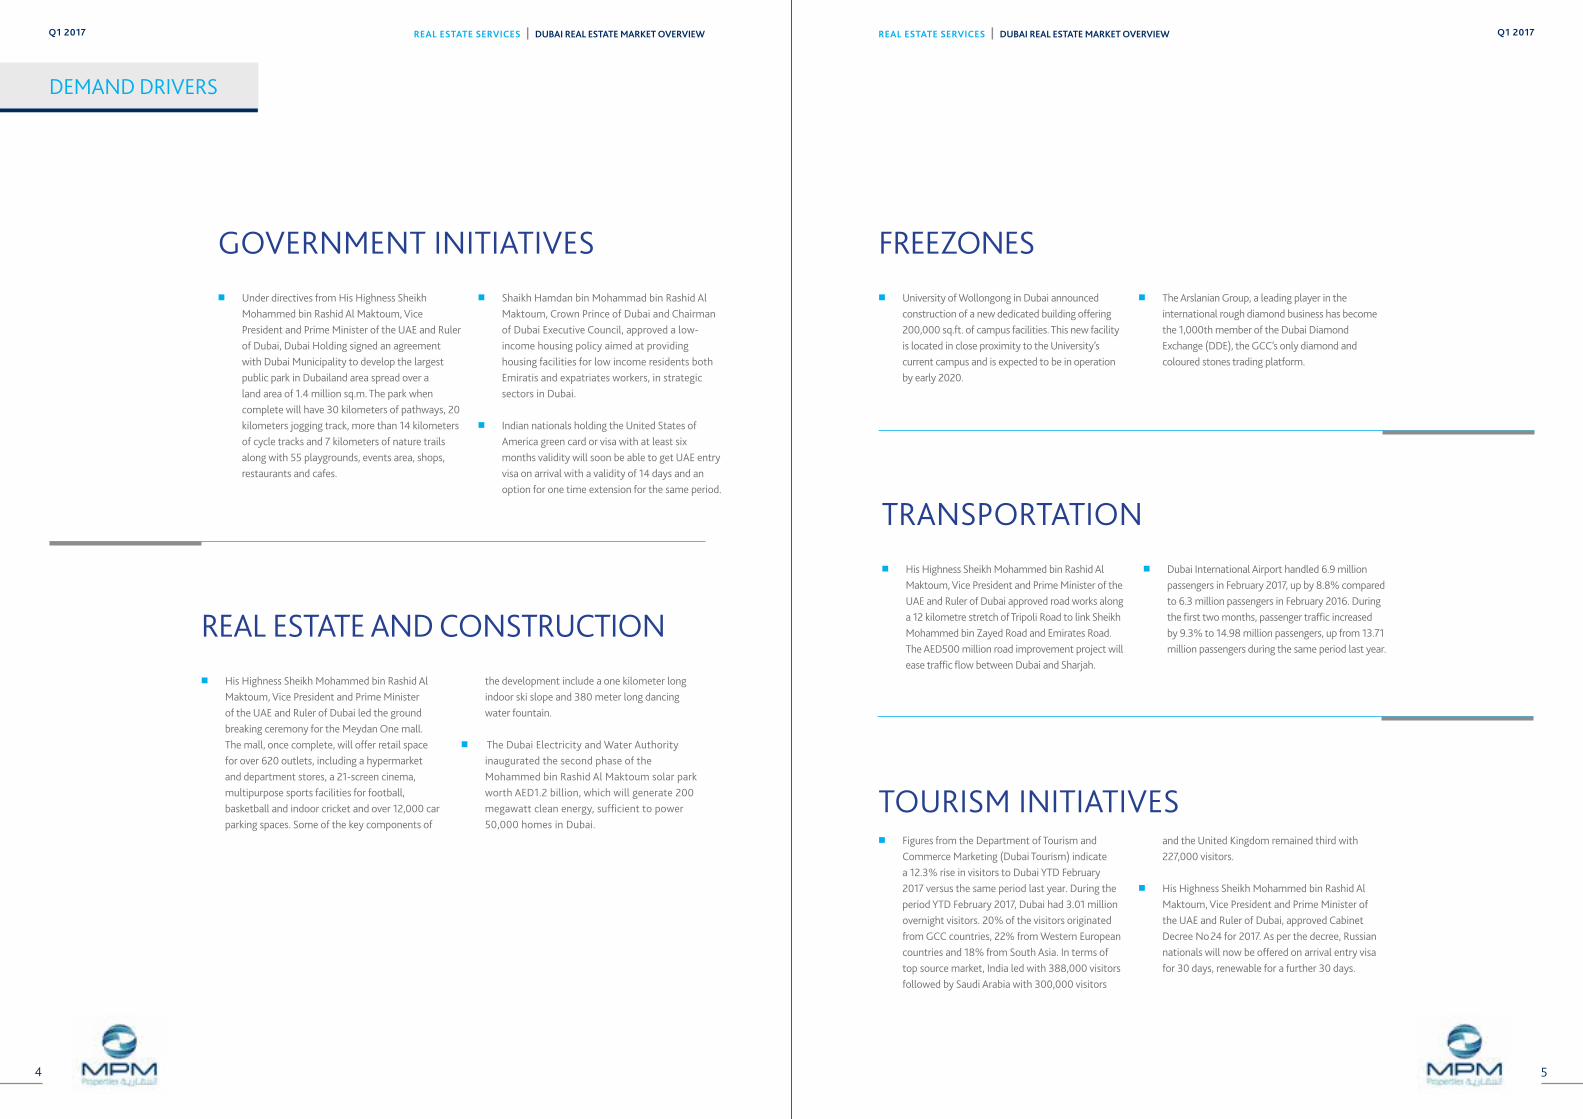
DUBAI POPULATION (GROWTH & HOUSEHOLD SIZE)
Population Growth Rate
2009 2010 2011 2012 2013 2014 2016 Q1 20172015
3.0
2.5
2.0
1.5
1.0
0.5
0
8.0
7.0
6.0
5.0
4.0
3.0
2.0
1.0
0PO
PU
LA
TIO
N (
MIL
LIO
NS
)
GR
OW
TH
RA
TE
(%
PA
)
AN
D H
OU
SE
HO
LD
SIZ
E
Household Size
Source: Dubai Statistics Center
1,771
1,9
05
2,0
03
2,1
06
2,2
14
2,3
27
2,4
47
2,5
93
2,6
49
DUBAI CONSTRUCTIONACTIVITY %YoY
GDP Construction
%Y
oY
DUBAI CPI VS RENTALCONTRIBUTION TO CPI Q1 2017
CPIHousingContributionto CPISource: Dubai Statistics Center
Source: Dubai Statistics Center
20
06
20
07
20
08
20
09
20
10
20
11
20
12
20
13
20
14
20
15
20
1
20
16
20
17e
120.00
100.00
80.00
JA
N 1
5
JU
N 1
5
JA
N 1
6
JU
N 1
6
JA
N 1
7
-20%
-15%
-10%
-5%
0%
5%
10%
15%
20%
25%
0
2,000
4,000
6,000
8,000
10,000
12,000
Valu
e (
in M
illio
ns)
Sales Transactions
Tra
nsa
cti
on
s
DUBAI LAND TRANSACTIONSVOLUME vs VALUE
Sales Value
0
5,000
10,000
15,000
20,000
25,000
30,000
DUBAI LAND TRANSACTIONSQoQ% CHANGE
Sales Transactions
Q4Q3Q2Q1 Q1Q4Q3Q2Q1Q4Q3Q2Q1Q4Q3Q2Q1Q4Q32012 2013 2014 2015 2016 17
Q2Q1 Q4Q3Q2Q1 Q1Q4Q3Q2Q1Q4Q3Q2Q1Q4Q3Q2Q1Q4Q32012 2013 2014 2015 2016 2017
Q2Q1-30-20-10
01020304050607080
Source: DLD and MPM Properties Research
* Established Real estate
Source: Dubai Statistics Center and MPM Properties Research Source: DLD and MPM Properties Research
DUBAI GDP SHARE BREAKDOWN BY ECONOMIC SECTORS - 2017 YTD
TOP NATIONALITIES INVESTING IN DUBAI PROPERTY IN 2016
Tra
nsa
cti
on
Valu
eA
ED
mill
ion
TOP LOCATIONS - RESIDENTIAL TRANSACTION VALUE
Q4 2016 Q1 2017
Source: DLD
Bu
sin
ess
Bay
Ju
meir
ah
Vill
ag
e
Du
bai
Sp
ort
s C
ity
Ju
meir
ah
Lakes
To
wers
Ara
bia
nR
an
ch
es
Palm
Ju
meir
ah
Ju
meir
ah
Beach
Resi
den
ce
Du
bai
Mari
na
Do
wn
tow
nD
ub
ai
Em
irate
sL
ivin
g0
100200300400500600700800
KuwaitEgypt QatarPakistanUnitedKingdom
SaudiArabia
IndiaUAE0
5
10
15
20
25
Source: DLD
6%
29%
22%15%
11%
12%
5%
REAL ESTATE SERVICES | DUBAI REAL ESTATE MARKET OVERVIEWQ1 2017
8
REAL ESTATE SERVICES | DUBAI REAL ESTATE MARKET OVERVIEW Q1 2017
9
RESIDENTIAL SECTOR
RESIDENTIAL SUPPLY �� During Q1 2017, over 5,500 new residential
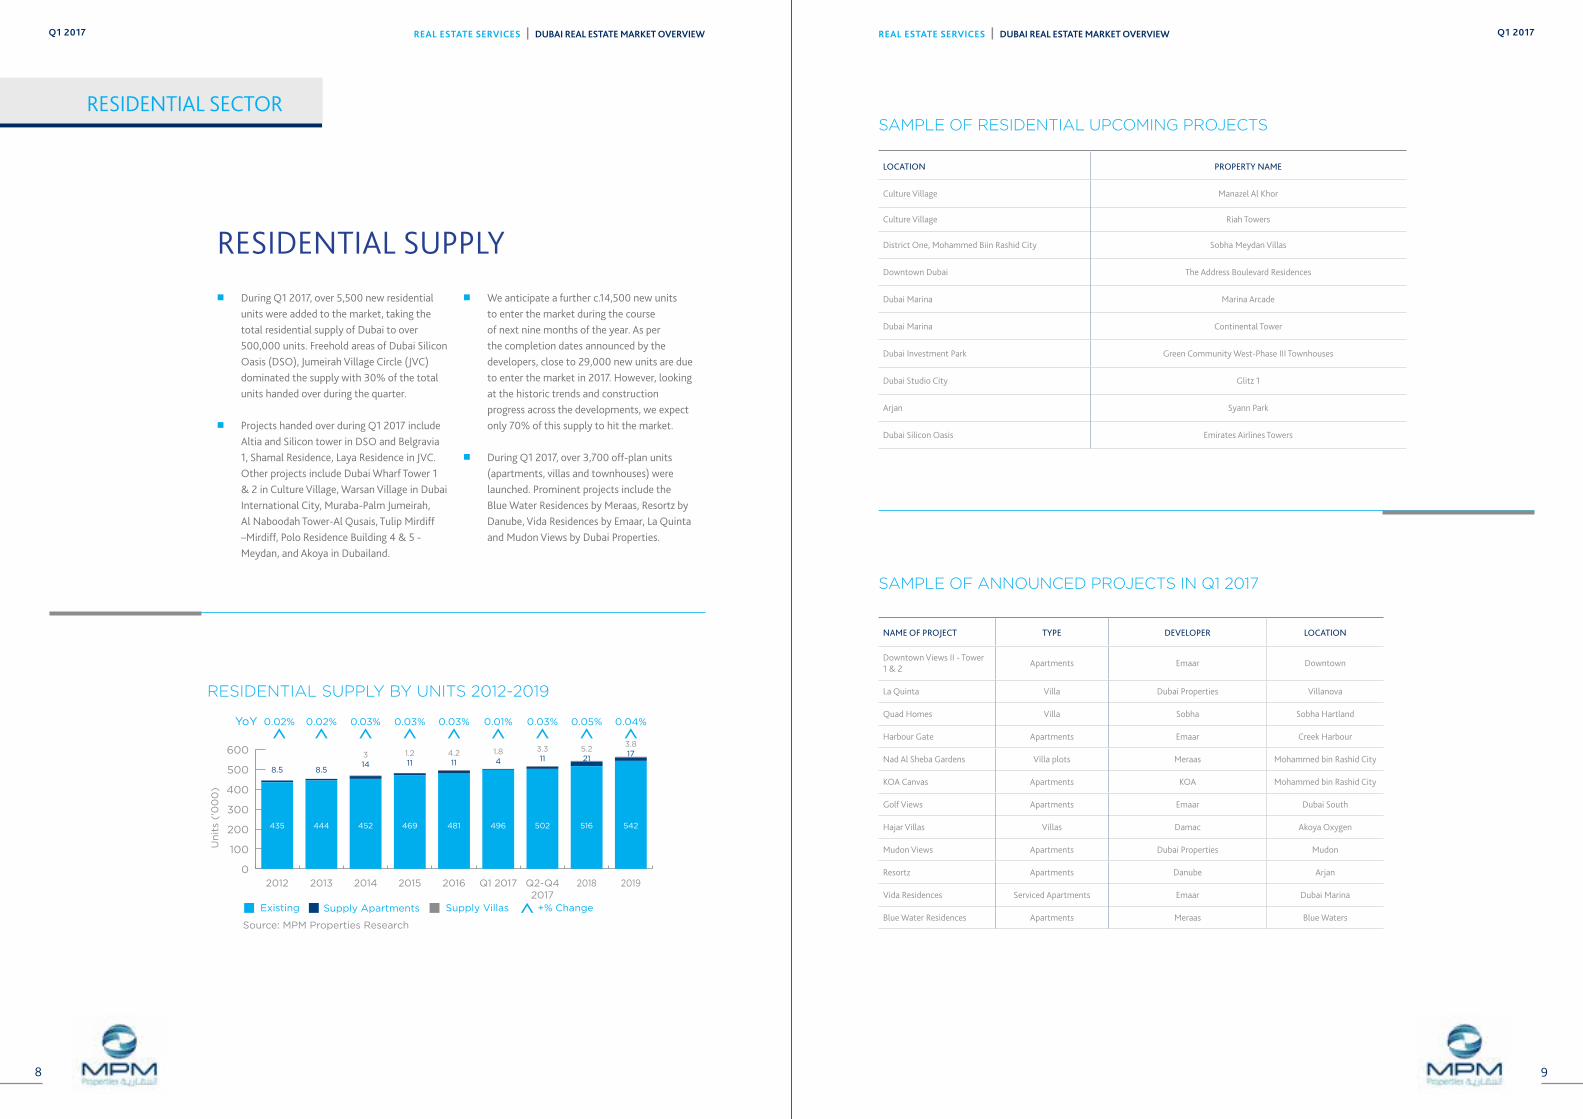
units were added to the market, taking the total residential supply of Dubai to over 500,000 units. Freehold areas of Dubai Silicon Oasis (DSO), Jumeirah Village Circle (JVC) dominated the supply with 30% of the total units handed over during the quarter.
�� Projects handed over during Q1 2017 include Altia and Silicon tower in DSO and Belgravia 1, Shamal Residence, Laya Residence in JVC. Other projects include Dubai Wharf Tower 1 & 2 in Culture Village, Warsan Village in Dubai International City, Muraba-Palm Jumeirah, Al Naboodah Tower-Al Qusais, Tulip Mirdiff –Mirdiff, Polo Residence Building 4 & 5 - Meydan, and Akoya in Dubailand.
�� We anticipate a further c.14,500 new units to enter the market during the course of next nine months of the year. As per the completion dates announced by the developers, close to 29,000 new units are due to enter the market in 2017. However, looking at the historic trends and construction progress across the developments, we expect only 70% of this supply to hit the market.
�� During Q1 2017, over 3,700 off-plan units (apartments, villas and townhouses) were launched. Prominent projects include the Blue Water Residences by Meraas, Resortz by Danube, Vida Residences by Emaar, La Quinta and Mudon Views by Dubai Properties.
0
100
200
300
400
500
600
2014 2015 2016 Q2-Q42017
Q1 2017 2018 2019
Source: MPM Properties Research
Supply Apartments
RESIDENTIAL SUPPLY BY UNITS 2012-2019
Existing Supply Villas +% Change
0.02% 0.03% 0.03% 0.03% 0.01% 0.03% 0.05% YoY 0.02%
2012 2013
435 444 452 469 481 496 502 516 542
8.5 8.514 11 11 4 113 1.2 4.2 1.8 3.3
0.04%
215.2
173.8
SAMPLE OF RESIDENTIAL UPCOMING PROJECTS
SAMPLE OF ANNOUNCED PROJECTS IN Q1 2017
NAME OF PROJECT TYPE DEVELOPER LOCATION
Downtown Views II - Tower 1 & 2
Apartments Emaar Downtown
La Quinta Villa Dubai Properties Villanova
Quad Homes Villa Sobha Sobha Hartland
Harbour Gate Apartments Emaar Creek Harbour
Nad Al Sheba Gardens Villa plots Meraas Mohammed bin Rashid City
KOA Canvas Apartments KOA Mohammed bin Rashid City
Golf Views Apartments Emaar Dubai South
Hajar Villas Villas Damac Akoya Oxygen
Mudon Views Apartments Dubai Properties Mudon
Resortz Apartments Danube Arjan
Vida Residences Serviced Apartments Emaar Dubai Marina
Blue Water Residences Apartments Meraas Blue Waters
LOCATION PROPERTY NAME
Culture Village Manazel Al Khor
Culture Village Riah Towers
District One, Mohammed Biin Rashid City Sobha Meydan Villas
Downtown Dubai The Address Boulevard Residences
Dubai Marina Marina Arcade
Dubai Marina Continental Tower
Dubai Investment Park Green Community West-Phase III Townhouses
Dubai Studio City Glitz 1
Arjan Syann Park
Dubai Silicon Oasis Emirates Airlines Towers
REAL ESTATE SERVICES | DUBAI REAL ESTATE MARKET OVERVIEWQ1 2017
10
REAL ESTATE SERVICES | DUBAI REAL ESTATE MARKET OVERVIEW Q1 2017
11
RESIDENTIAL SECTOR
Th
eG
reen
s
Ju
meir
ah
Beach
Resi
den
ce
Bu
sin
ess
Bay
Du
bai
Mari
na
Th
eV
iew
s
Palm
Ju
meir
ah
DIF
C
Old
To
wn
Do
wn
tow
nD
ub
ai
APARTMENT AVERAGE SALES PRICES (Q1 2017)
AND PERCENTAGE CHANGE
AE
D/s
q.ft.
Source: MPM Properties Research
-2.4% -2.7% -1.4% -1.6% -1.8% 0.0% 0.0% 0.0%-1.6% QoQ
YoY -5% -6% -1% -5% -2% -4% -4% -2%-8%
0
500
1,000
1,5002,000
2,500
2,0
50
1,8
25
1,775
1,5
25
1,5
25
1,3
75
1,25
0
1.3
50
1,225
AVERAGE APARTMENT ANNUAL RENTS Q1 2017
Source: MPM Properties Research
SALE PRICES �� In Q1 2017, a total of 3,304 existing
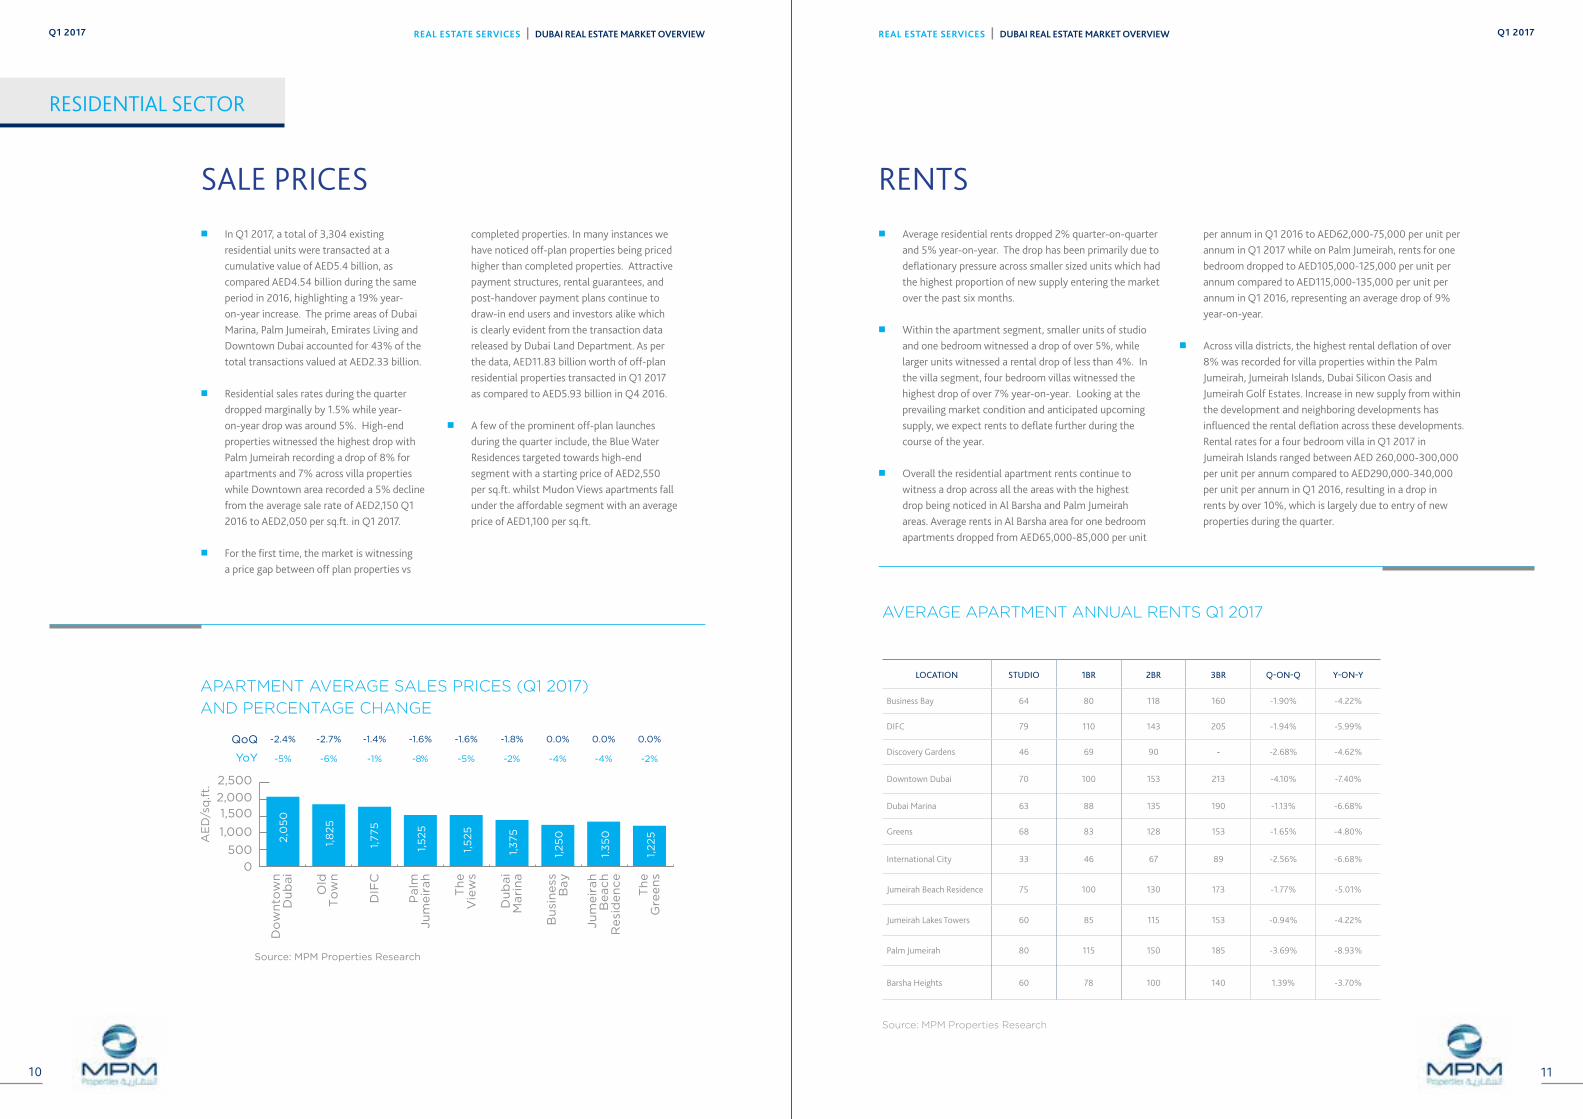
residential units were transacted at a cumulative value of AED5.4 billion, as compared AED4.54 billion during the same period in 2016, highlighting a 19% year-on-year increase. The prime areas of Dubai Marina, Palm Jumeirah, Emirates Living and Downtown Dubai accounted for 43% of the total transactions valued at AED2.33 billion.
�� Residential sales rates during the quarter dropped marginally by 1.5% while year-on-year drop was around 5%. High-end properties witnessed the highest drop with Palm Jumeirah recording a drop of 8% for apartments and 7% across villa properties while Downtown area recorded a 5% decline from the average sale rate of AED2,150 Q1 2016 to AED2,050 per sq.ft. in Q1 2017.
�� For the first time, the market is witnessing a price gap between off plan properties vs
completed properties. In many instances we have noticed off-plan properties being priced higher than completed properties. Attractive payment structures, rental guarantees, and post-handover payment plans continue to draw-in end users and investors alike which is clearly evident from the transaction data released by Dubai Land Department. As per the data, AED11.83 billion worth of off-plan residential properties transacted in Q1 2017 as compared to AED5.93 billion in Q4 2016.
�� A few of the prominent off-plan launches during the quarter include, the Blue Water Residences targeted towards high-end segment with a starting price of AED2,550 per sq.ft. whilst Mudon Views apartments fall under the affordable segment with an average price of AED1,100 per sq.ft.
RENTS �� Average residential rents dropped 2% quarter-on-quarter
and 5% year-on-year. The drop has been primarily due to deflationary pressure across smaller sized units which had the highest proportion of new supply entering the market over the past six months.
�� Within the apartment segment, smaller units of studio and one bedroom witnessed a drop of over 5%, while larger units witnessed a rental drop of less than 4%. In the villa segment, four bedroom villas witnessed the highest drop of over 7% year-on-year. Looking at the prevailing market condition and anticipated upcoming supply, we expect rents to deflate further during the course of the year.
�� Overall the residential apartment rents continue to witness a drop across all the areas with the highest drop being noticed in Al Barsha and Palm Jumeirah areas. Average rents in Al Barsha area for one bedroom apartments dropped from AED65,000-85,000 per unit
per annum in Q1 2016 to AED62,000-75,000 per unit per annum in Q1 2017 while on Palm Jumeirah, rents for one bedroom dropped to AED105,000-125,000 per unit per annum compared to AED115,000-135,000 per unit per annum in Q1 2016, representing an average drop of 9% year-on-year.
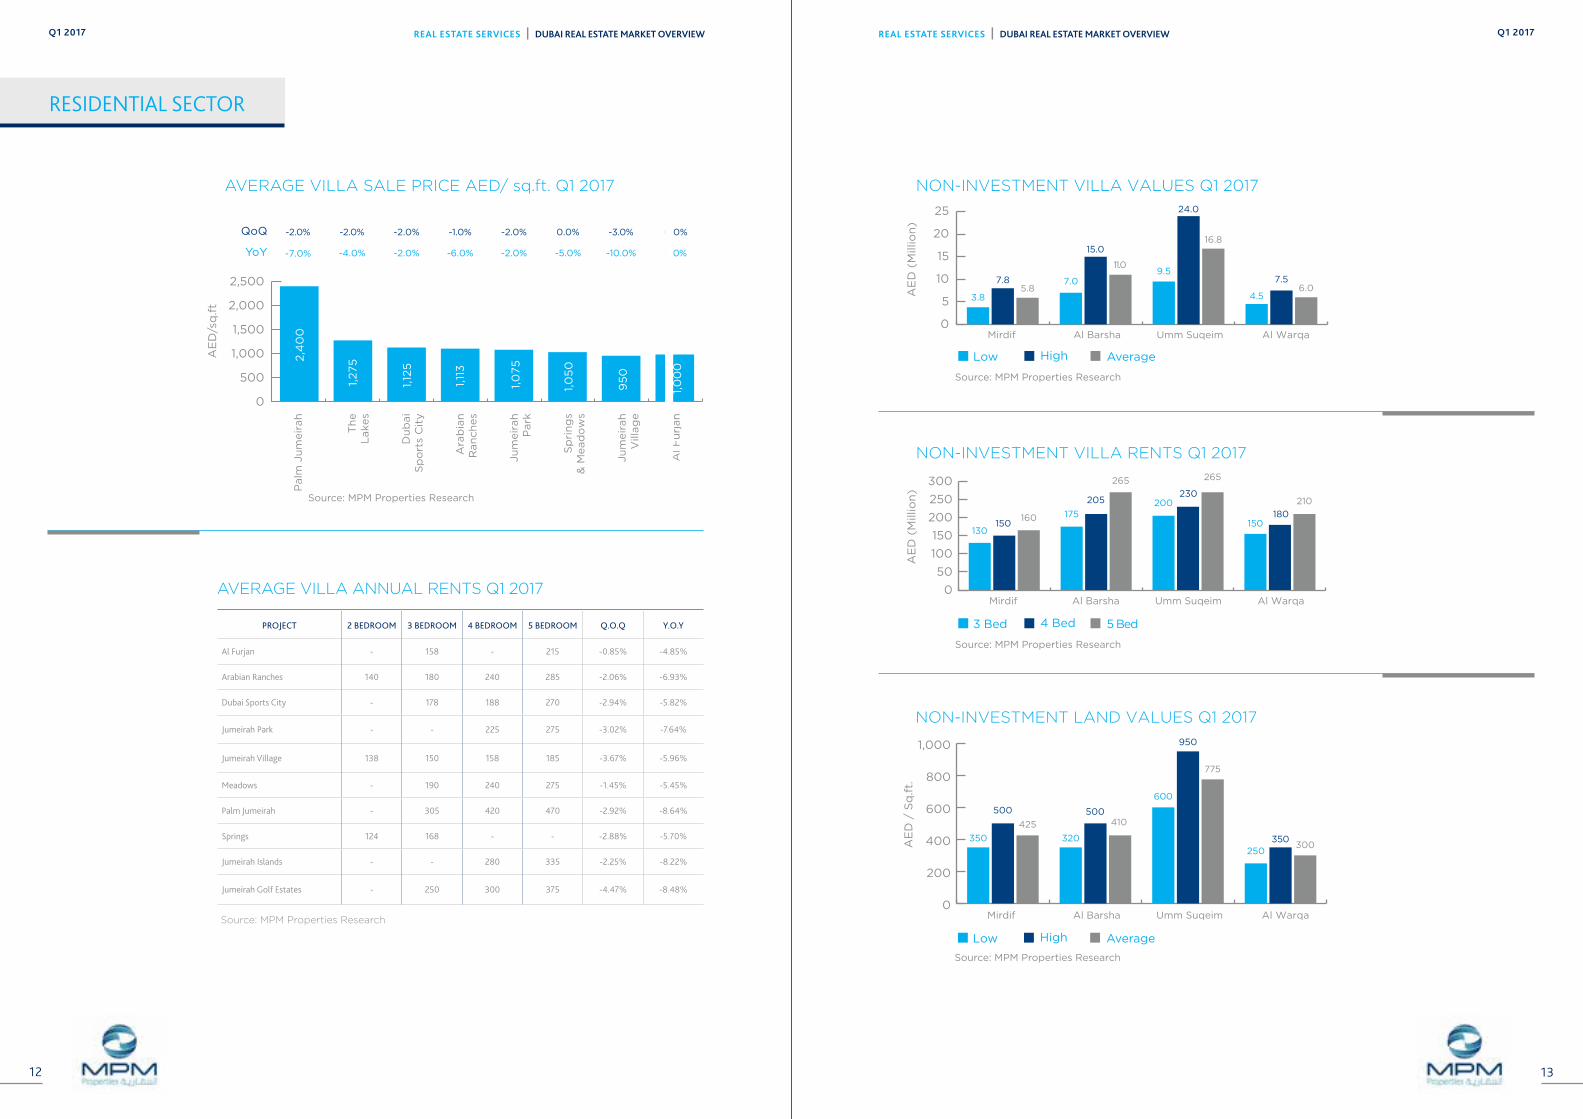
�� Across villa districts, the highest rental deflation of over 8% was recorded for villa properties within the Palm Jumeirah, Jumeirah Islands, Dubai Silicon Oasis and Jumeirah Golf Estates. Increase in new supply from within the development and neighboring developments has influenced the rental deflation across these developments. Rental rates for a four bedroom villa in Q1 2017 in Jumeirah Islands ranged between AED 260,000-300,000 per unit per annum compared to AED290,000-340,000 per unit per annum in Q1 2016, resulting in a drop in rents by over 10%, which is largely due to entry of new properties during the quarter.
LOCATION STUDIO 1BR 2BR 3BR Q-ON-Q Y-ON-Y
Business Bay 64 80 118 160 -1.90% -4.22%
DIFC 79 110 143 205 -1.94% -5.99%
Discovery Gardens 46 69 90 - -2.68% -4.62%
Downtown Dubai 70 100 153 213 -4.10% -7.40%
Dubai Marina 63 88 135 190 -1.13% -6.68%
Greens 68 83 128 153 -1.65% -4.80%
International City 33 46 67 89 -2.56% -6.68%
Jumeirah Beach Residence 75 100 130 173 -1.77% -5.01%
Jumeirah Lakes Towers 60 85 115 153 -0.94% -4.22%
Palm Jumeirah 80 115 150 185 -3.69% -8.93%
Barsha Heights 60 78 100 140 1.39% -3.70%
REAL ESTATE SERVICES | DUBAI REAL ESTATE MARKET OVERVIEWQ1 2017
12
REAL ESTATE SERVICES | DUBAI REAL ESTATE MARKET OVERVIEW Q1 2017
13
RESIDENTIAL SECTOR
PROJECT 2 BEDROOM 3 BEDROOM 4 BEDROOM 5 BEDROOM Q.O.Q Y.O.Y
Al Furjan - 158 - 215 -0.85% -4.85%
Arabian Ranches 140 180 240 285 -2.06% -6.93%
Dubai Sports City - 178 188 270 -2.94% -5.82%
Jumeirah Park - - 225 275 -3.02% -7.64%
Jumeirah Village 138 150 158 185 -3.67% -5.96%
Meadows - 190 240 275 -1.45% -5.45%
Palm Jumeirah - 305 420 470 -2.92% -8.64%
Springs 124 168 - - -2.88% -5.70%
Jumeirah Islands - - 280 335 -2.25% -8.22%
Jumeirah Golf Estates - 250 300 375 -4.47% -8.48%
0
500
1,000
1,500
2,000
2,500
Al F
urj
an
Ju
meir
ah
Vill
ag
e
Sp
rin
gs
& M
ead
ow
s
Ju
meir
ah
Park
Ara
bia
nR
an
ch
es
Du
bai
Sp
ort
s C
ity
Th
eL
akes
Palm
Ju
meir
ah
AVERAGE VILLA SALE PRICE AED/ sq.ft. Q1 2017
AE
D/s
q.ft
Source: MPM Properties Research
-3.0%
-10.0%
-1.0%
-6.0%
-2.0%
-2.0%
-2.0%
-2.0%
0.0%
0.0%
-2.0%
-7.0%
0.0%
-5.0%
-2.0%
-4.0%
QoQ
YoY
2,4
00
1,275
1,12
5
1,11
3
1,0
75
1,0
50
95
0
1,0
00
AVERAGE VILLA ANNUAL RENTS Q1 2017
Source: MPM Properties Research
0
200
400
600
800
1,000
350
500
425
320
500410
600
950
775
250350
300
NON-INVESTMENT LAND VALUES Q1 2017
AE
D /
Sq
.ft.
Source: MPM Properties Research
Mirdif Al Barsha Umm Suqeim Al Warqa
HighLow Average
0
50
100
150
200
250
300
NON-INVESTMENT VILLA RENTS Q1 2017
AE
D (
Mill
ion
)
Source: MPM Properties Research
4 Bed3 Bed 5 Bed
Al WarqaUmm SuqeimAl BarshaMirdif
150180
210200230
265
175
205
265
130150
160
3.8
7.85.8
7.0
15.0
11.09.5
24.0
16.8
4.5
7.56.0
NON-INVESTMENT VILLA VALUES Q1 2017
25
20
15
10
5
0
AE
D (
Mill
ion
)
Source: MPM Properties Research
Mirdif Al Barsha Umm Suqeim Al Warqa
HighLow Average
REAL ESTATE SERVICES | DUBAI REAL ESTATE MARKET OVERVIEW Q1 2017
1514
Q2 2015
AMENITIES AND FACILITIES
PAYMENT PLAN
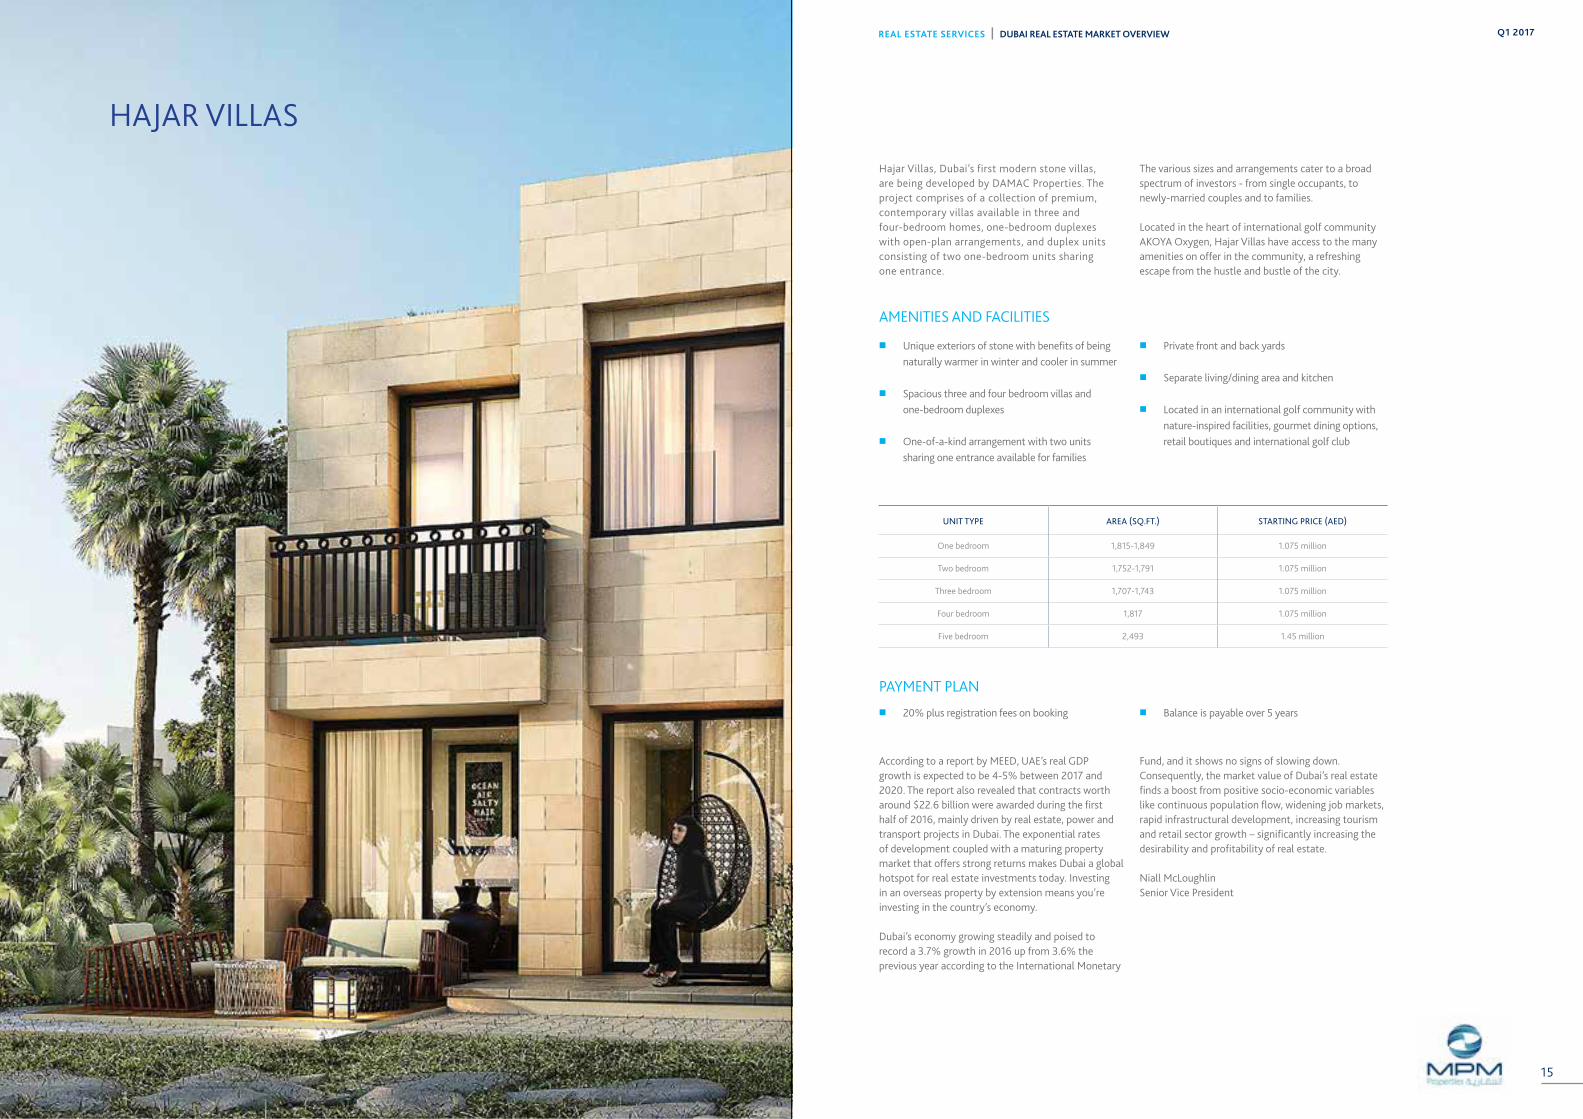
Hajar Villas, Dubai’s first modern stone villas, are being developed by DAMAC Properties. The project comprises of a collection of premium, contemporary villas available in three and four-bedroom homes, one-bedroom duplexes with open-plan arrangements, and duplex units consisting of two one-bedroom units sharing one entrance.
The various sizes and arrangements cater to a broad spectrum of investors - from single occupants, to newly-married couples and to families.
Located in the heart of international golf community AKOYA Oxygen, Hajar Villas have access to the many amenities on offer in the community, a refreshing escape from the hustle and bustle of the city.
According to a report by MEED, UAE’s real GDP growth is expected to be 4-5% between 2017 and 2020. The report also revealed that contracts worth around $22.6 billion were awarded during the first half of 2016, mainly driven by real estate, power and transport projects in Dubai. The exponential rates of development coupled with a maturing property market that offers strong returns makes Dubai a global hotspot for real estate investments today. Investing in an overseas property by extension means you’re investing in the country’s economy.
Dubai’s economy growing steadily and poised to record a 3.7% growth in 2016 up from 3.6% the previous year according to the International Monetary
Fund, and it shows no signs of slowing down. Consequently, the market value of Dubai’s real estate finds a boost from positive socio-economic variables like continuous population flow, widening job markets, rapid infrastructural development, increasing tourism and retail sector growth – significantly increasing the desirability and profitability of real estate.
Niall McLoughlinSenior Vice President
�� Unique exteriors of stone with benefits of being naturally warmer in winter and cooler in summer
�� Spacious three and four bedroom villas and one-bedroom duplexes
�� One-of-a-kind arrangement with two units sharing one entrance available for families
�� Private front and back yards
�� Separate living/dining area and kitchen
�� Located in an international golf community with nature-inspired facilities, gourmet dining options, retail boutiques and international golf club
�� 20% plus registration fees on booking �� Balance is payable over 5 years
UNIT TYPE AREA (SQ.FT.) STARTING PRICE (AED)
One bedroom 1,815-1,849 1.075 million
Two bedroom 1,752-1,791 1.075 million
Three bedroom 1,707-1,743 1.075 million
Four bedroom 1,817 1.075 million
Five bedroom 2,493 1.45 million
HAJAR VILLAS
REAL ESTATE SERVICES | DUBAI REAL ESTATE MARKET OVERVIEWQ1 2017
16
REAL ESTATE SERVICES | DUBAI REAL ESTATE MARKET OVERVIEW Q1 2017
17
OFFICE SUMMARY �� The prime office rents remained stable during
the quarter. However, we have witnessed a rising trend of landlords offering incentives of 1-3 months rent-free period and flexible payment terms.
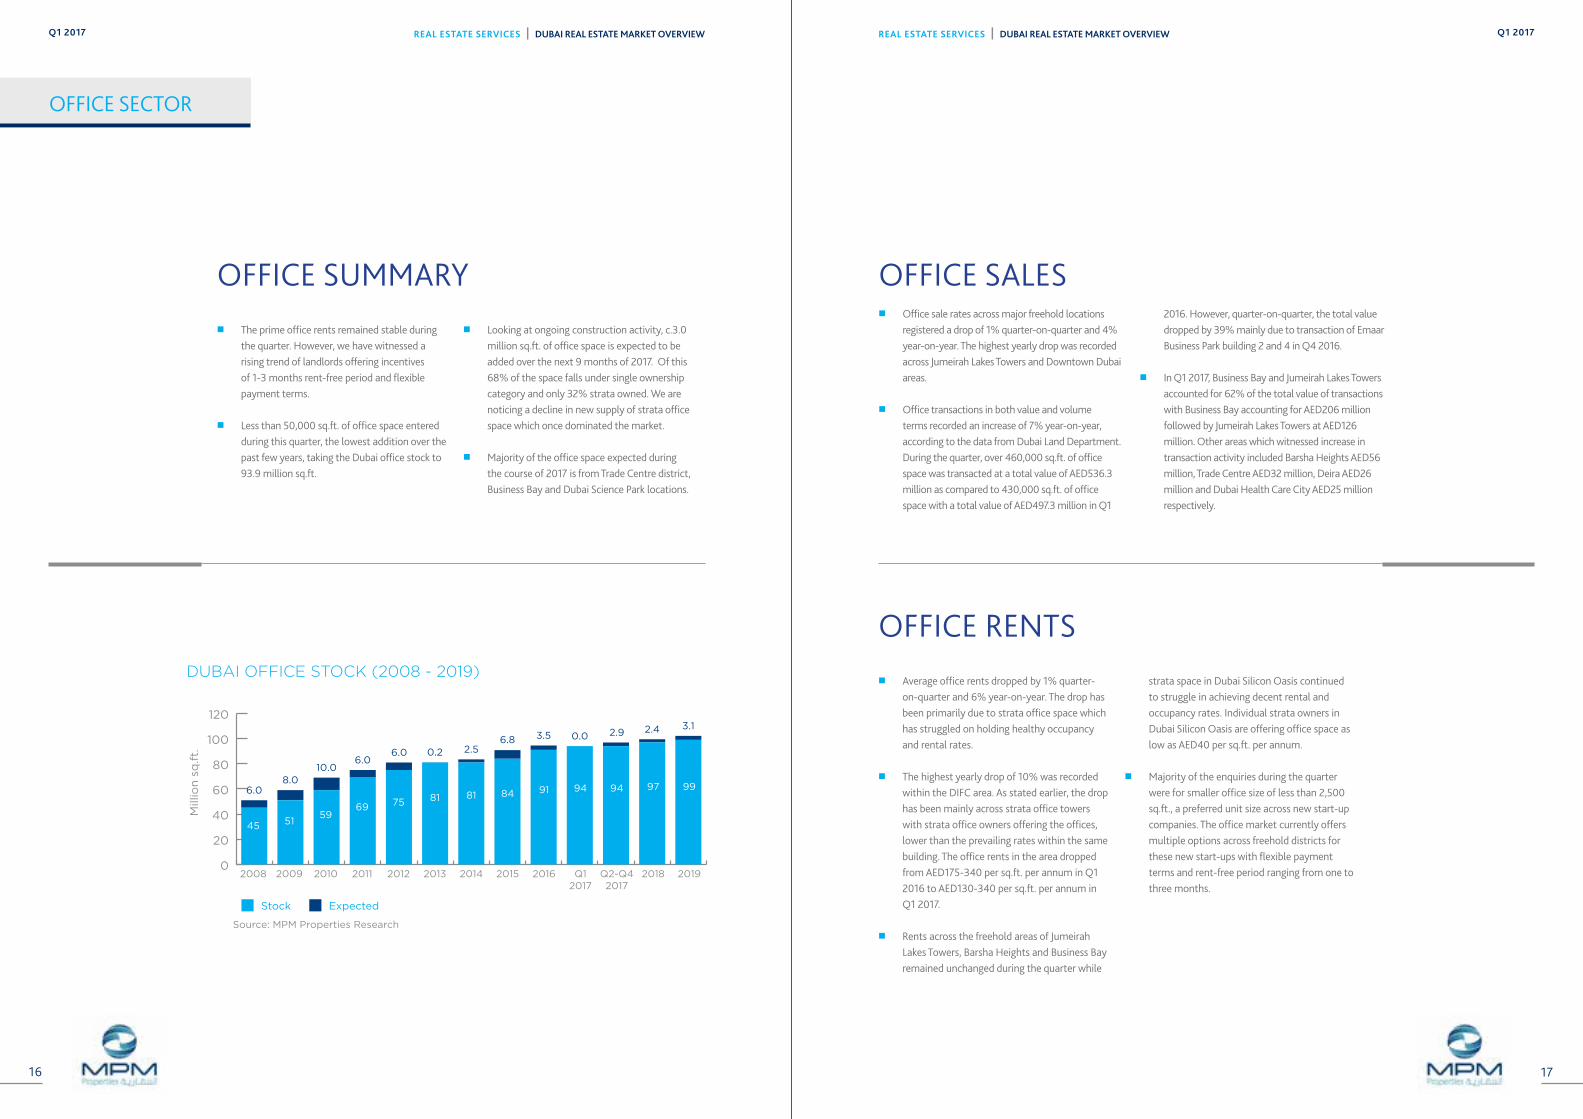
�� Less than 50,000 sq.ft. of office space entered during this quarter, the lowest addition over the past few years, taking the Dubai office stock to 93.9 million sq.ft.
�� Looking at ongoing construction activity, c.3.0 million sq.ft. of office space is expected to be added over the next 9 months of 2017. Of this 68% of the space falls under single ownership category and only 32% strata owned. We are noticing a decline in new supply of strata office space which once dominated the market.
�� Majority of the office space expected during the course of 2017 is from Trade Centre district, Business Bay and Dubai Science Park locations.
OFFICE SALES �� Office sale rates across major freehold locations
registered a drop of 1% quarter-on-quarter and 4% year-on-year. The highest yearly drop was recorded across Jumeirah Lakes Towers and Downtown Dubai areas.
�� Office transactions in both value and volume terms recorded an increase of 7% year-on-year, according to the data from Dubai Land Department. During the quarter, over 460,000 sq.ft. of office space was transacted at a total value of AED536.3 million as compared to 430,000 sq.ft. of office space with a total value of AED497.3 million in Q1
2016. However, quarter-on-quarter, the total value dropped by 39% mainly due to transaction of Emaar Business Park building 2 and 4 in Q4 2016.
�� In Q1 2017, Business Bay and Jumeirah Lakes Towers accounted for 62% of the total value of transactions with Business Bay accounting for AED206 million followed by Jumeirah Lakes Towers at AED126 million. Other areas which witnessed increase in transaction activity included Barsha Heights AED56 million, Trade Centre AED32 million, Deira AED26 million and Dubai Health Care City AED25 million respectively.
OFFICE SECTOR
0
20
40
60
80
100
120
DUBAI OFFICE STOCK (2008 - 2019)
Mill
ion
sq
.ft.
20092008 2010 2011 2012 2013 2014 2015 2016 Q12017
Stock Expected
Source: MPM Properties Research
2018 2019
2.42.90.03.56.82.50.26.0
6.010.0
8.06.0 97
3.1
99949491848181756959
5145
Q2-Q42017
OFFICE RENTS �� Average office rents dropped by 1% quarter-
on-quarter and 6% year-on-year. The drop has been primarily due to strata office space which has struggled on holding healthy occupancy and rental rates.
�� The highest yearly drop of 10% was recorded within the DIFC area. As stated earlier, the drop has been mainly across strata office towers with strata office owners offering the offices, lower than the prevailing rates within the same building. The office rents in the area dropped from AED175-340 per sq.ft. per annum in Q1 2016 to AED130-340 per sq.ft. per annum in Q1 2017.
�� Rents across the freehold areas of Jumeirah Lakes Towers, Barsha Heights and Business Bay remained unchanged during the quarter while
strata space in Dubai Silicon Oasis continued to struggle in achieving decent rental and occupancy rates. Individual strata owners in Dubai Silicon Oasis are offering office space as low as AED40 per sq.ft. per annum.
�� Majority of the enquiries during the quarter were for smaller office size of less than 2,500 sq.ft., a preferred unit size across new start-up companies. The office market currently offers multiple options across freehold districts for these new start-ups with flexible payment terms and rent-free period ranging from one to three months.
REAL ESTATE SERVICES | DUBAI REAL ESTATE MARKET OVERVIEWQ1 2017
18
REAL ESTATE SERVICES | DUBAI REAL ESTATE MARKET OVERVIEW Q1 2017
19
Sheikh Mohamed Bin Zayed Rd.
Sheikh Mohamed Bin Zayed Rd.
Sheikh Mohamed Bin Zayed Rd.
Al Khail Road
Al Khail Road
daoR mi equS
mm
U
Sheikh Zayed Rd.
Sheikh Zayed Rd.
Sheikh Zayed Rd.
Arabian RanchesDubai
Land
DubaiLand
DubaiLand
DubaiLand
DubaiLand
Nad AlSheba 2
Nad Al Sheba
DubaiSilicon Oasis
InternationalCity
DragonMark
MushrifNational Park
Murdif
FestivalCity
TOSHARJAH
TOHATTA & OMAN
TOAL AIN
TOABU DHABI
TheLagoons
Business Bay Za’abeel
Garhoud
Al Qusais
Port Saeed
Rigga
Ras Al Khor
Al Marqadh
LegendsAl Barari
City of ArabiaGlobal Village
MotorCity
DubaiSport City
DubaiInvestment
Park 1
Jumeirah GolfEstates
Jumeirah GolfEstates
IMPZ
DubaiInvestment
Park 2
JumeirahVillage
JumeirahVillage South
The Meadows
Emirates Hills
The Springs
TheGardens
Jebel Ali Village
Jebel Ali Port
Jebel Ali Freezone
Jebel AliIndustrial Area
Dubai World Central Airport
DiscoveryGardens
JumeirahPark
JumeirahIslands
BarshaHeightsThe
Lakes
TheGreens
Naif
Al Raffa
SatwaJumeirah
Al WaslAl Safa
Umm Suqeim
The PalmJumeirah
Al SufouhMedia / Internet
CityJumeirah Lake
Towers
Dubai Marina
Burj Al Arab
The World
The Palm Deira
Al QuozIndustrial Area
Al Barsha
Al Quoz
Emirates Towers
DIFCBurj Khalifa
Karama
OudMetha
Al Mamzar
Port Rashid
DubaiInternational
Airport
OFFICE SECTOR
0
50
100
150
200
250
300
350
DIC
& D
MC
Bars
ha
Heig
hts
Ju
meir
ah
Lake T
ow
ers
Bu
sin
ess
Bay
Sh
eik
hZ
ayed
Rd
Do
wn
tow
nD
ub
ai
DIF
C
OFFICE RENTS AED/sq.ft. Q1 2017
AE
D/s
q.ft.
High Low
Source: MPM Properties Research
130
130
34
0
24
0
85
180
65 14
0 190
55
70 11
0
120 17
5
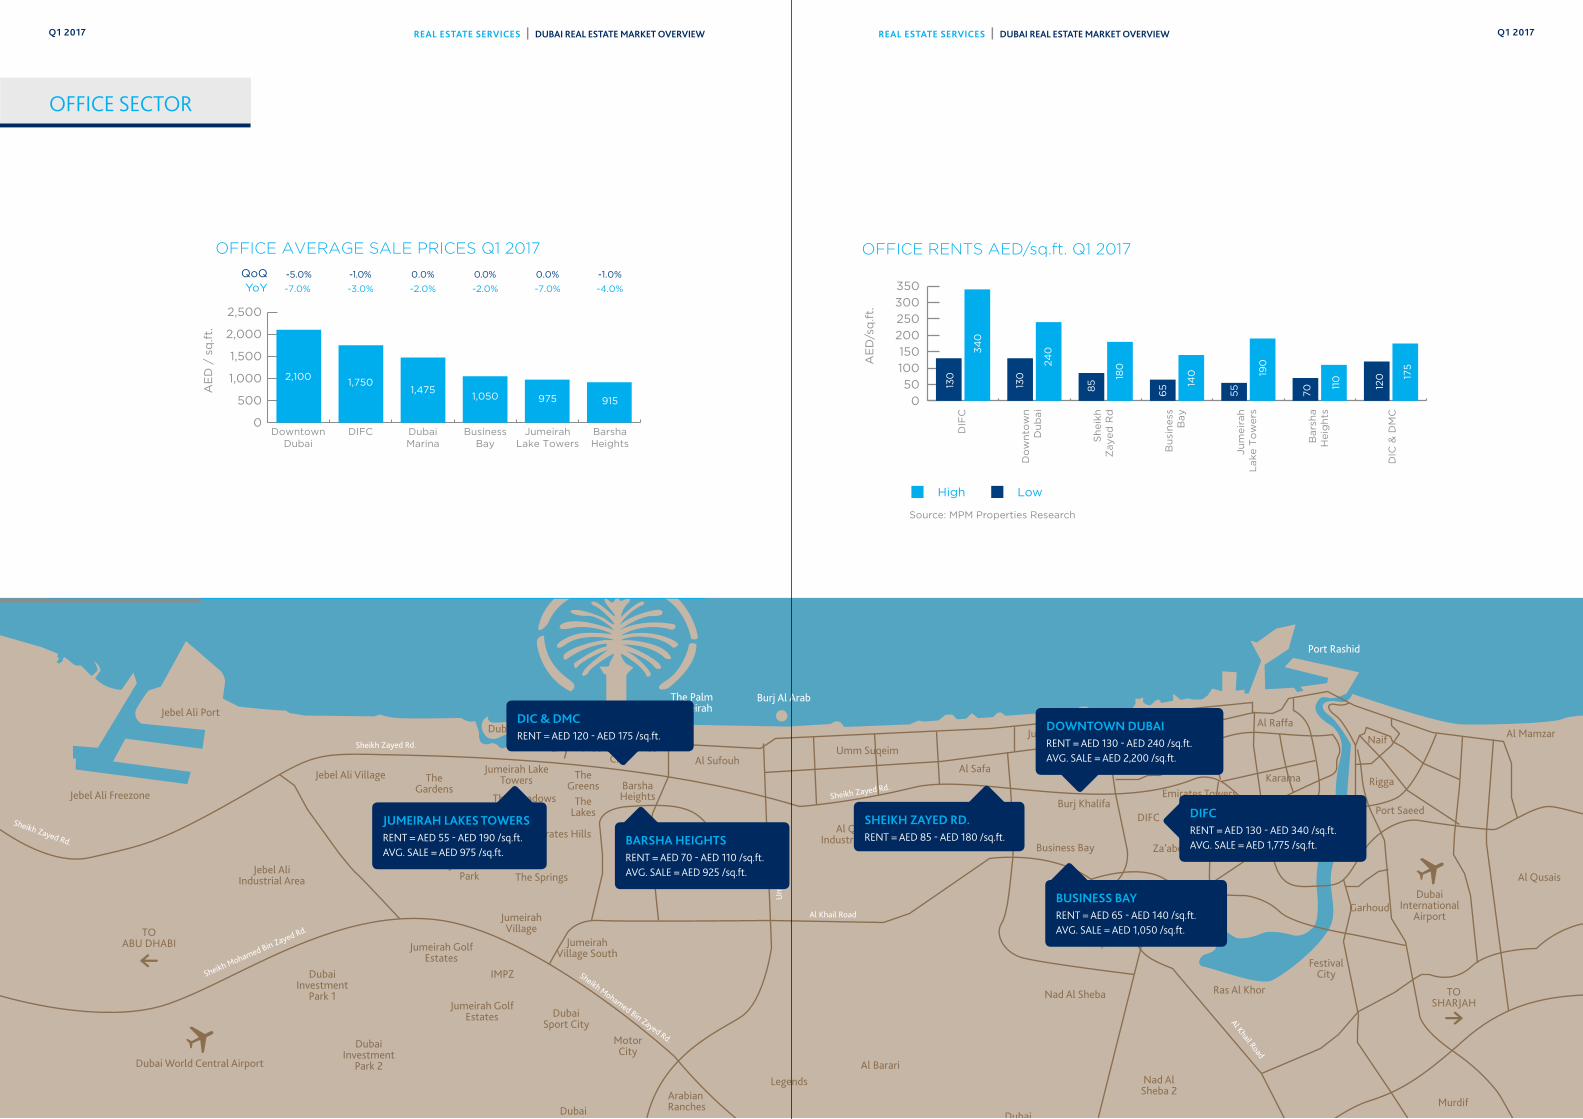
SHEIKH ZAYED RD.RENT = AED 85 - AED 180 /sq.ft.
DIC & DMCRENT = AED 120 - AED 175 /sq.ft.
BARSHA HEIGHTSRENT = AED 70 - AED 110 /sq.ft.AVG. SALE = AED 925 /sq.ft.
JUMEIRAH LAKES TOWERSRENT = AED 55 - AED 190 /sq.ft.AVG. SALE = AED 975 /sq.ft.
DOWNTOWN DUBAIRENT = AED 130 - AED 240 /sq.ft.AVG. SALE = AED 2,200 /sq.ft.
DIFCRENT = AED 130 - AED 340 /sq.ft.AVG. SALE = AED 1,775 /sq.ft.
BUSINESS BAYRENT = AED 65 - AED 140 /sq.ft.AVG. SALE = AED 1,050 /sq.ft.
0
500
1,000
1,500
2,000
2,500
BarshaHeights
JumeirahLake Towers
BusinessBay
DubaiMarina
DIFCDowntownDubai
OFFICE AVERAGE SALE PRICES Q1 2017
AE
D /
sq
.ft.
-5.0%
-7.0%
-1.0%
-3.0%
0.0%
-2.0%
0.0%
-2.0%
0.0%
-7.0%
-1.0%
-4.0%
QoQ YoY
2,1001,750
1,4751,050 975 915
REAL ESTATE SERVICES | DUBAI REAL ESTATE MARKET OVERVIEWQ1 2017
20
REAL ESTATE SERVICES | DUBAI REAL ESTATE MARKET OVERVIEW Q1 2017
21
RETAIL SECTOR
PRIME SHOPPING MALL AVERAGE RENTS – Q1 2017
An
ch
ors
Cin
em
a
Hyp
erm
ark
et
Min
i M
ajo
rs
Fla
gsh
ips
Rest
au
ran
ts
Fo
od
Co
urt
Lin
e S
ho
ps
1,2001,1001000900800700600500400300200100
0
AE
D/s
q.ft.
Source: MPM Properties Research
Source: MPM Properties Research
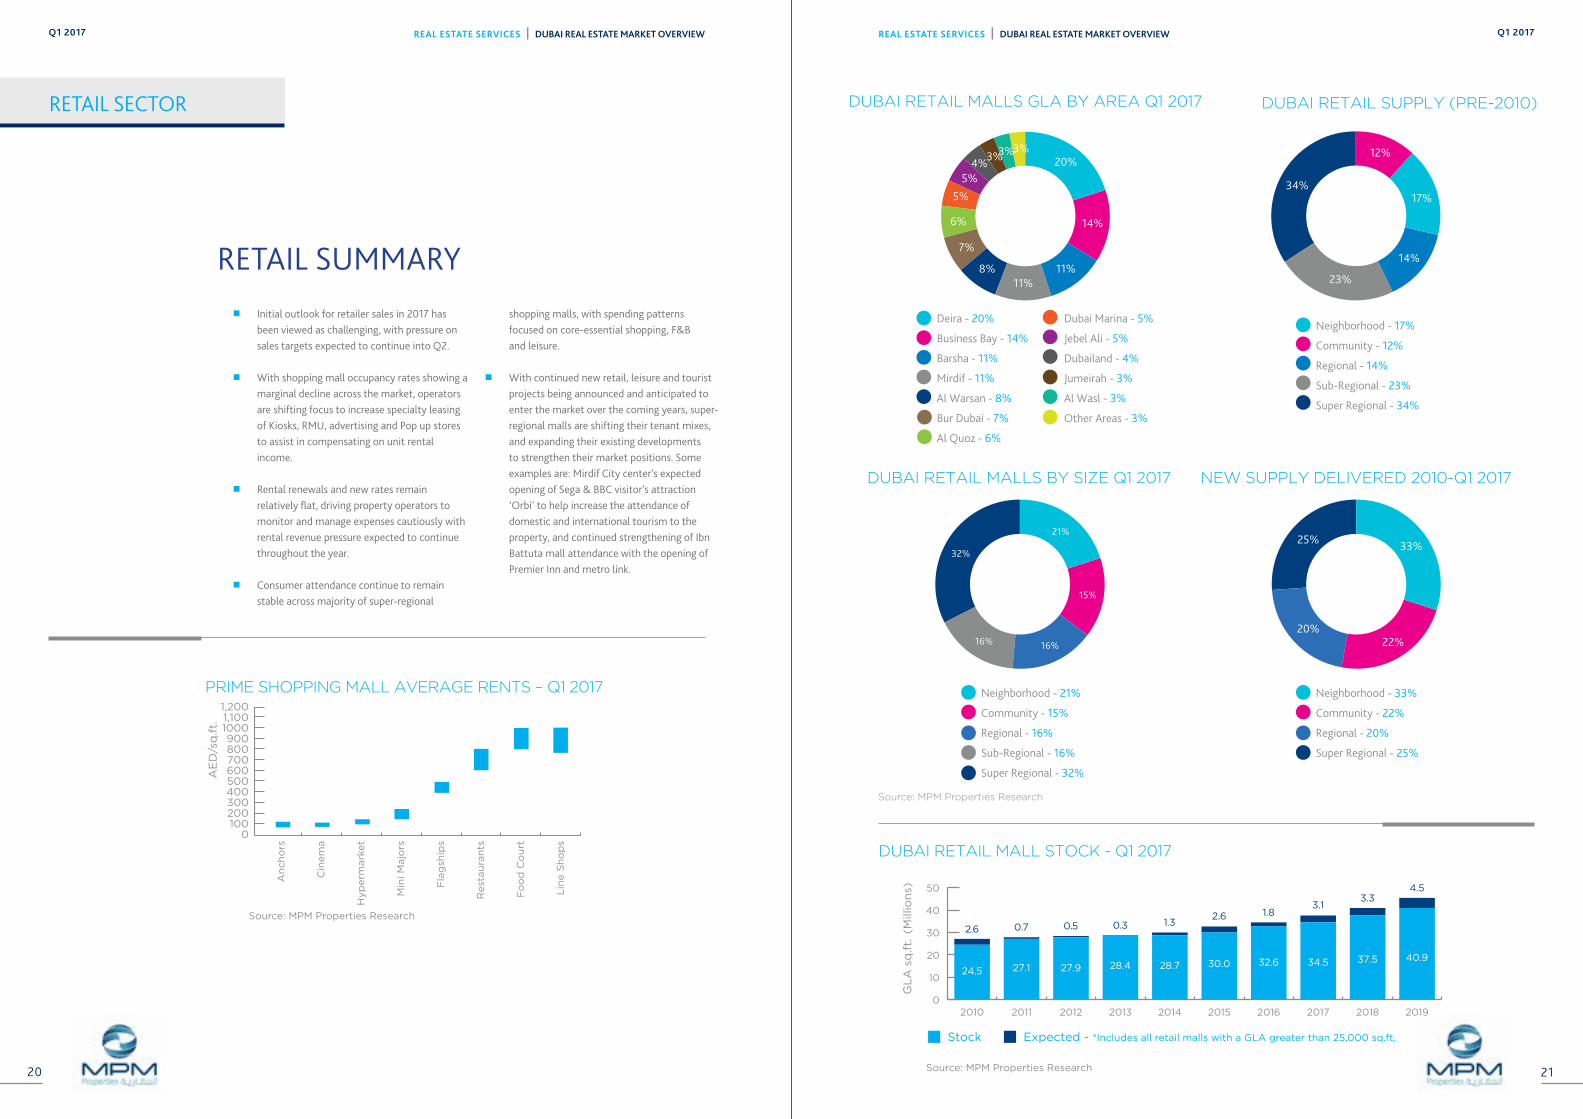
�� Initial outlook for retailer sales in 2017 has been viewed as challenging, with pressure on sales targets expected to continue into Q2.
�� With shopping mall occupancy rates showing a marginal decline across the market, operators are shifting focus to increase specialty leasing of Kiosks, RMU, advertising and Pop up stores to assist in compensating on unit rental income.
�� Rental renewals and new rates remain relatively flat, driving property operators to monitor and manage expenses cautiously with rental revenue pressure expected to continue throughout the year.
�� Consumer attendance continue to remain stable across majority of super-regional
shopping malls, with spending patterns focused on core-essential shopping, F&B and leisure.
�� With continued new retail, leisure and tourist projects being announced and anticipated to enter the market over the coming years, super-regional malls are shifting their tenant mixes, and expanding their existing developments to strengthen their market positions. Some examples are: Mirdif City center’s expected opening of Sega & BBC visitor’s attraction ‘Orbi’ to help increase the attendance of domestic and international tourism to the property, and continued strengthening of Ibn Battuta mall attendance with the opening of Premier Inn and metro link.
0
10
20
30
40
50
24.5 27.1 27.9 28.4 28.7 30.0 32.6 34.5
3.1
37.5 40.9
3.34.5
DUBAI RETAIL MALL STOCK - Q1 2017
GL
A s
q.ft.
(Mill
ion
s)
Stock Expected - *Includes all retail malls with a GLA greater than 25,000 sq.ft.
Source: MPM Properties Research
2010 2011 2012 2013 2014 2015 2016 2017 2018 2019
2.62.6 0.7 0.5 0.3 1.3
1.8
RETAIL SUMMARY
DUBAI RETAIL MALLS GLA BY AREA Q1 2017
12%
17%
14%
23%
34%
Neighborhood - 33%
Community - 22%
Regional - 20%
Super Regional - 25%
DUBAI RETAIL MALLS BY SIZE Q1 2017
DUBAI RETAIL SUPPLY (PRE-2010)
NEW SUPPLY DELIVERED 2010-Q1 2017
Neighborhood - 21%
Community - 15%
Regional - 16%
Sub-Regional - 16%
Super Regional - 32%
33%
22%20%
25%21%
15%
16%16%
32%
20%
11%
14%
7%
11%
4%5%
5%
3%
6%
3%
8%
3%
Deira - 20%
Business Bay - 14%
Barsha - 11%
Mirdif - 11%
Al Warsan - 8%
Bur Dubai - 7%
Al Quoz - 6%
Dubai Marina - 5%
Jebel Ali - 5%
Dubailand - 4%
Jumeirah - 3%
Al Wasl - 3%
Other Areas - 3%
Neighborhood - 17%
Community - 12%
Regional - 14%
Sub-Regional - 23%
Super Regional - 34%
REAL ESTATE SERVICES | DUBAI REAL ESTATE MARKET OVERVIEWQ1 2017
22
REAL ESTATE SERVICES | DUBAI REAL ESTATE MARKET OVERVIEW Q1 2017
23
HOSPITALITY SECTOR
DUBAI HOTELS PERFORMANCE - 2017 YTD
ADR RevPAR
Source: MPM Properties Research
Occupancy
100.0%90.0%80.0%70.0%60.0%50.0%40.0%30.0%20.0%10.0%0%
AE
D
Occu
pan
cy
0
200
400
600
800
1,000
1,200
Jan
-14
Feb
Mar
Ap
rM
ay
Ju
nJu
lA
ug
Sep
Oct
No
vD
ec
Jan
-15
Feb
Mar
Ap
rM
ay
Ju
nJu
lA
ug
Sep
Oct
No
vD
ec
Jan
-16
Feb
Mar
Ap
rM
ay
Ju
nJu
lA
ug
Sep
Oct
No
vD
ec
Jan
-17
Feb
Mar
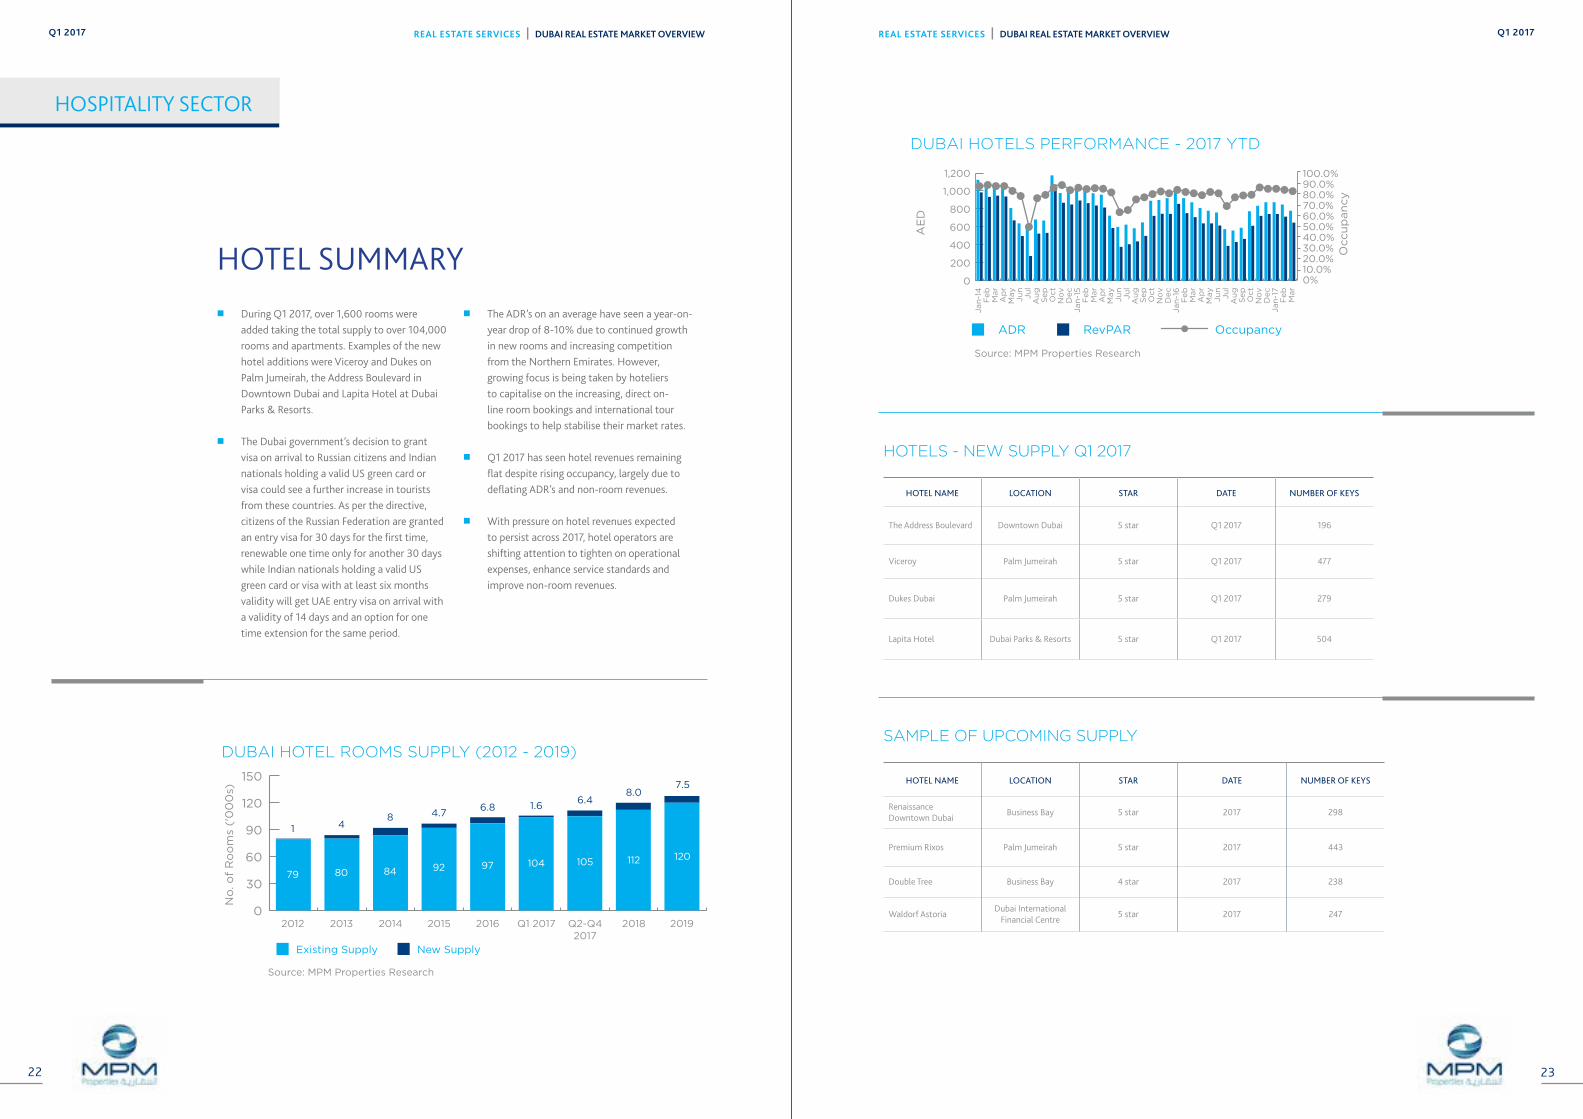
HOTEL SUMMARY �� During Q1 2017, over 1,600 rooms were
added taking the total supply to over 104,000 rooms and apartments. Examples of the new hotel additions were Viceroy and Dukes on Palm Jumeirah, the Address Boulevard in Downtown Dubai and Lapita Hotel at Dubai Parks & Resorts.
�� The Dubai government’s decision to grant visa on arrival to Russian citizens and Indian nationals holding a valid US green card or visa could see a further increase in tourists from these countries. As per the directive, citizens of the Russian Federation are granted an entry visa for 30 days for the first time, renewable one time only for another 30 days while Indian nationals holding a valid US green card or visa with at least six months validity will get UAE entry visa on arrival with a validity of 14 days and an option for one time extension for the same period.
�� The ADR’s on an average have seen a year-on-year drop of 8-10% due to continued growth in new rooms and increasing competition from the Northern Emirates. However, growing focus is being taken by hoteliers to capitalise on the increasing, direct on-line room bookings and international tour bookings to help stabilise their market rates.
�� Q1 2017 has seen hotel revenues remaining flat despite rising occupancy, largely due to deflating ADR’s and non-room revenues.
�� With pressure on hotel revenues expected to persist across 2017, hotel operators are shifting attention to tighten on operational expenses, enhance service standards and improve non-room revenues.
HOTEL NAME LOCATION STAR DATE NUMBER OF KEYS
The Address Boulevard Downtown Dubai 5 star Q1 2017 196
Viceroy Palm Jumeirah 5 star Q1 2017 477
Dukes Dubai Palm Jumeirah 5 star Q1 2017 279
Lapita Hotel Dubai Parks & Resorts 5 star Q1 2017 504
HOTEL NAME LOCATION STAR DATE NUMBER OF KEYS
Renaissance Downtown Dubai
Business Bay 5 star 2017 298
Premium Rixos Palm Jumeirah 5 star 2017 443
Double Tree Business Bay 4 star 2017 238
Waldorf AstoriaDubai International
Financial Centre5 star 2017 247
HOTELS - NEW SUPPLY Q1 2017
SAMPLE OF UPCOMING SUPPLY
0
30
60
90
120
150
DUBAI HOTEL ROOMS SUPPLY (2012 - 2019)
No
. o
f R
oo
ms
('0
00
s)
Existing Supply New Supply
Source: MPM Properties Research
418 4.7
6.8 1.66.4
Q1 2017 Q2-Q42017
2018 2019201620152012 2013 2014
79 80 84 92 97 104 105
8.0
112
7.5
120
REAL ESTATE SERVICES | DUBAI REAL ESTATE MARKET OVERVIEWQ1 2017
24
REAL ESTATE SERVICES | DUBAI REAL ESTATE MARKET OVERVIEW Q1 2017
25
DEFINITIONS & METHODOLOGY
RESEARCH STUDY AREA
The geographic extent of the study area covers the key districts in Dubai.
RESIDENTIAL
New residential developments are classified as delivered and thus entered into the new supply category when they are made available for occupation. This is verified via a combination of site inspections and discussion with the developer and hence our supply numbers do take into consideration the phased release of large projects.
Rental and sales trend analysis is based on transactional data derived from the MPM Properties Agency team and data sourced from developers and owners.
OFFICES
New office developments are classified as delivered and thus entered into the new supply category when they are available for tenant fit-outs.
Given the general lack of transparency in the local market rents quoted are headline rents, thus exclude any rent free period of other financial
incentives that may have been negotiated between the parties. The rents quoted are also exclusive of service charges.
RETAIL
New retail developments are classified as delivered and thus entered into the new supply category when the first units are open and trading.
Our classification of malls is based on our own assessment having regard to size and the catchment area which the mall typically penetrates.
HOSPITALITY
New hotels are classified as delivered and thus entered into the new supply category when they are opened and trading. All trading performance data is provided by DTCM.
FUTURE SUPPLY PROJECTIONS
Our future supply projections across all sectors are based on a combination of regular site inspections and discussions with developers.
BESPOKE CLIENT RESEARCH ADDING VALUE TO YOUR PROPERTY INTERESTSThe ADIB Real Estate Services team covers all sectors of the real estate market. We provide bespoke market research to our valued clients to meet their specific requirements.
We provide reports, information and presentations derived from primary market data that directly assist our clients to save or make money from real estate and shape strategies to enhance value.
DISCLAIMER:
The information contained in this report has been obtained from and is based upon sources that MPM Properties believes to be reliable, however, no warranty or representation, expressed or implied, is made to the accuracy or completeness of the information contained herein, and same is submitted subject to errors, omissions, change of price, rental or other conditions, withdrawal without notice, and to any special listing conditions imposed by our principals. MPM Properties will not be held responsible for any third-party contributions. All opinions and estimates included in this report constitute MPM Properties, as of the date of this report and are subject
to change without notice. Figures contained in this report are derived from a basket of locations highlighted in this report and therefore represent a snapshot of the Dubai market. Due care and attention has been used in the preparation of forecast information. However, actual results may vary from forecasts and any variation may be materially positive or negative. Forecasts, by their very nature, involve risk and uncertainty because they relate to future events and circumstances which are beyond MPM Properties’ control. For a full in-depth study of the market, please contact MPM Properties team.
A collaborative team providing our integrated services
BALAJI NAGARAJ MSC MRICS Head of Residential Valuation Dubai & Northern Emirates T: +971 (0)4 371 9463 M: +971 (0)55 196 2396 [email protected]
CHARLES ANDREW CHAMBERS CEO T: +971 (0)2 610 0545 M: +971 (0)56 6773521 [email protected]
ABDULLAH SAID AL KUWEITI Business Development Director T: +971 (0)2 610 1554 M: +971 (0)50 623 5854 [email protected]
MOHAMMED FAHEEM Manager Strategic Advisory & Research T: +971 (0)4 371 9471 M: +971 (0)50 384 5220 [email protected]
WAHIDA KARAMA Head of Property Operations T: +971 (02) 610 0435 M: +971 (0)50 765 7679 [email protected]
FRANK O’DWYER MBA (Hons); BEng.COO T: +971 (0)2 610 0402 M: +971 (0)50 812 1070 [email protected]
DOMINIC BARLOW Head of Retail, Hospitality & Leisure T: +971 (0)2 510 0655 M: +971 (0)56 288 1458 [email protected]
JUBRAN AL HASHMI Head of Property Services T: +971 (0)2 610 0232 M: +971 (0)50 122 0041 [email protected]
VINEET KUMAR Director of Agency – Dubai T: +971 (0)4 371 9462 M: +971 (0)50 651 6491 [email protected]
VAIBHAV SHARMA MCOM; MDBA Chief Strategy Officer T: +971 (0)2 412 8914 M: +971 (0)50 660 9295 [email protected]
ALI ABDULLAH ABDUL RAHMAN Acting Regional Head – Northern Emirates T: 971 (0)6 597 2514 M: +971 (0)50 656 2486 [email protected]
MOHAMED AL ZOUBI Head of Development Advisory BSc Civil Engineering T: +971 (0)2 610 0564 M: +971 (0)50 310 3570 [email protected]
YOUSEF AL ZAROONI Regional Head – Al Ain T: +971 (0)3 708 8636 M: +971 (0)50 600 1002 [email protected]
PAUL MAISFIELD BSC (HONS) MRICS Head of UK Real Estate T: +44 (0) 20 7590 2234 M: +44 (0)7802 404868 [email protected]
REAL ESTATE SERVICES | DUBAI REAL ESTATE MARKET OVERVIEWQ1 2017
26
REAL ESTATE SERVICES | DUBAI REAL ESTATE MARKET OVERVIEW Q1 2017
27
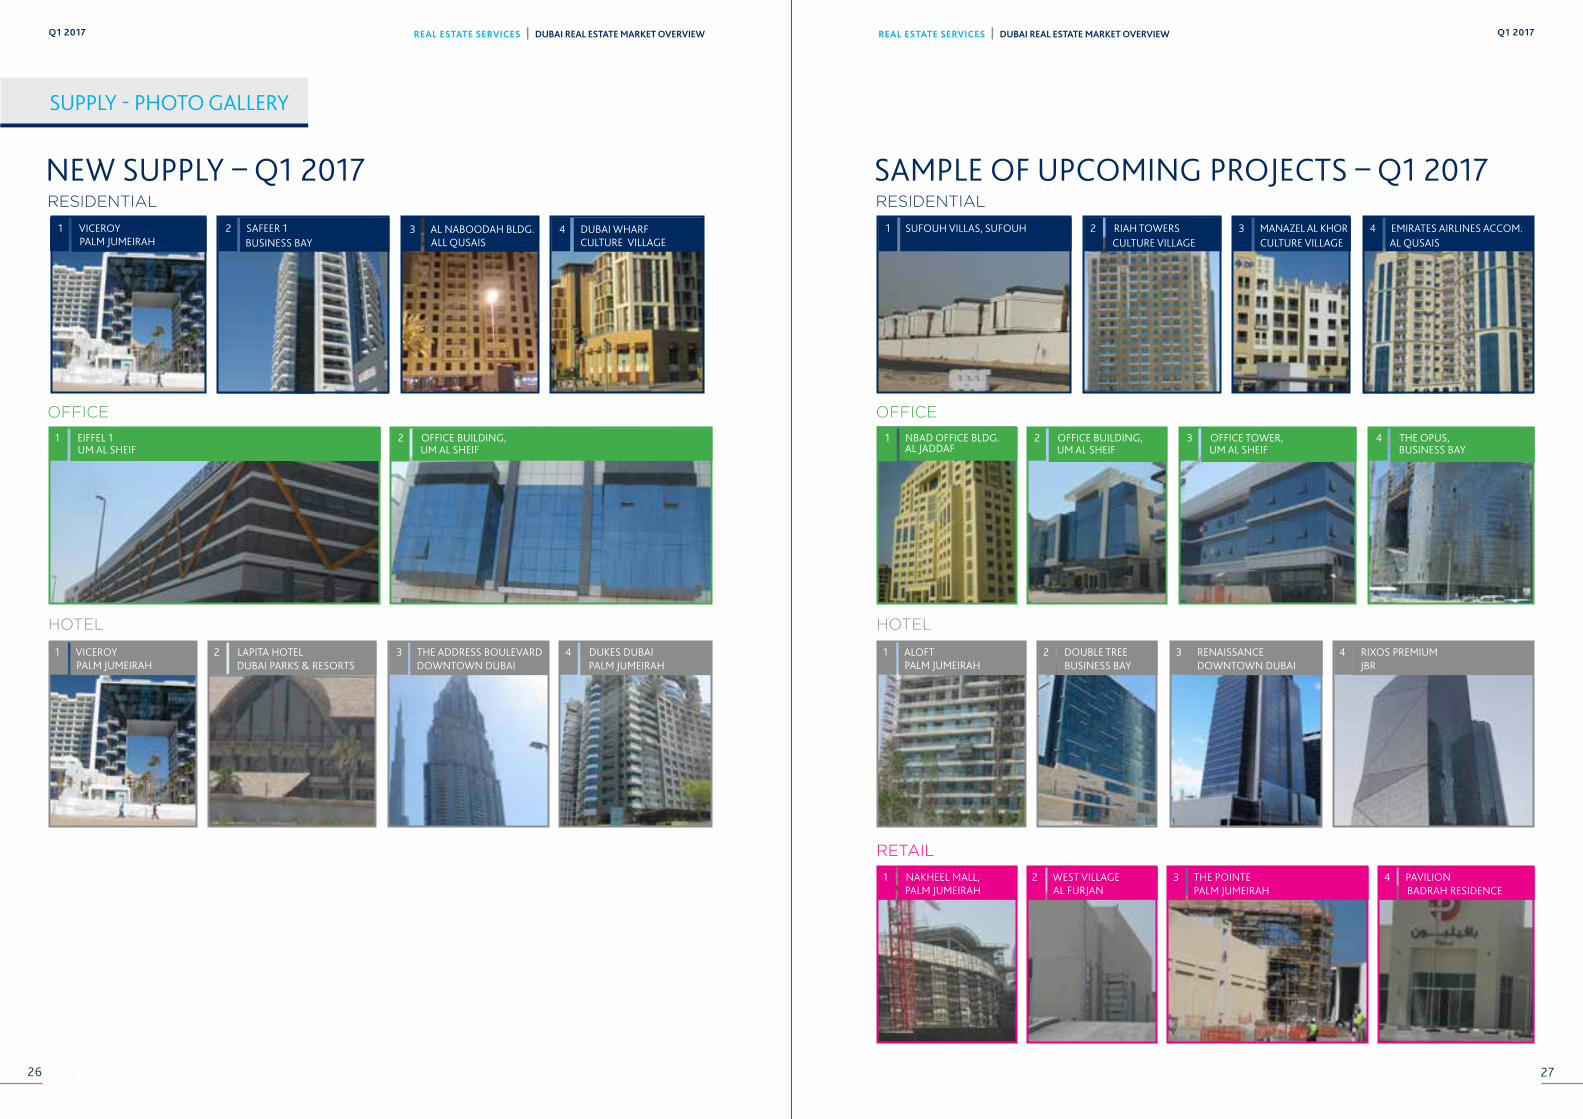
SAMPLE OF UPCOMING PROJECTS – Q1 2017RESIDENTIAL
RETAIL
HOTEL
3 MANAZEL AL KHOR CULTURE VILLAGE
4 EMIRATES AIRLINES ACCOM. AL QUSAIS
1 SUFOUH VILLAS, SUFOUH 2 RIAH TOWERS CULTURE VILLAGE
OFFICE
1 NAKHEEL MALL, PALM JUMEIRAH
2 WEST VILLAGE AL FURJAN
3 THE POINTE PALM JUMEIRAH
4 PAVILION BADRAH RESIDENCE
1 ALOFT PALM JUMEIRAH
2 DOUBLE TREE BUSINESS BAY
3 RENAISSANCE DOWNTOWN DUBAI
4 RIXOS PREMIUM JBR
1 NBAD OFFICE BLDG. AL JADDAF
2 OFFICE BUILDING, UM AL SHEIF
4 THE OPUS, BUSINESS BAY
3 OFFICE TOWER, UM AL SHEIF
SUPPLY - PHOTO GALLERY
NEW SUPPLY – Q1 2017RESIDENTIAL
HOTEL
3 AL NABOODAH BLDG. ALL QUSAIS
4 DUBAI WHARF CULTURE VILLAGE
2 SAFEER 1 BUSINESS BAY
1 VICEROY PALM JUMEIRAH
OFFICE
1 EIFFEL 1 UM AL SHEIF
1 VICEROY PALM JUMEIRAH
2 LAPITA HOTEL DUBAI PARKS & RESORTS
4 DUKES DUBAI PALM JUMEIRAH
3 THE ADDRESS BOULEVARD DOWNTOWN DUBAI
2 OFFICE BUILDING, UM AL SHEIF
REAL ESTATE SERVICES | DUBAI REAL ESTATE MARKET OVERVIEWQ1 2017
28
REAL ESTATE SERVICES | DUBAI REAL ESTATE MARKET OVERVIEW Q1 2017
29
TOABU DHABI
Jebel Ali Port
Jebel Ali FreezoneBarshaHeights
Al Mamzar
Al Qusais
1
2
32 1
33
4
34
1
2
33
1
4
2
2
1
1
4
4
2
4
1
2
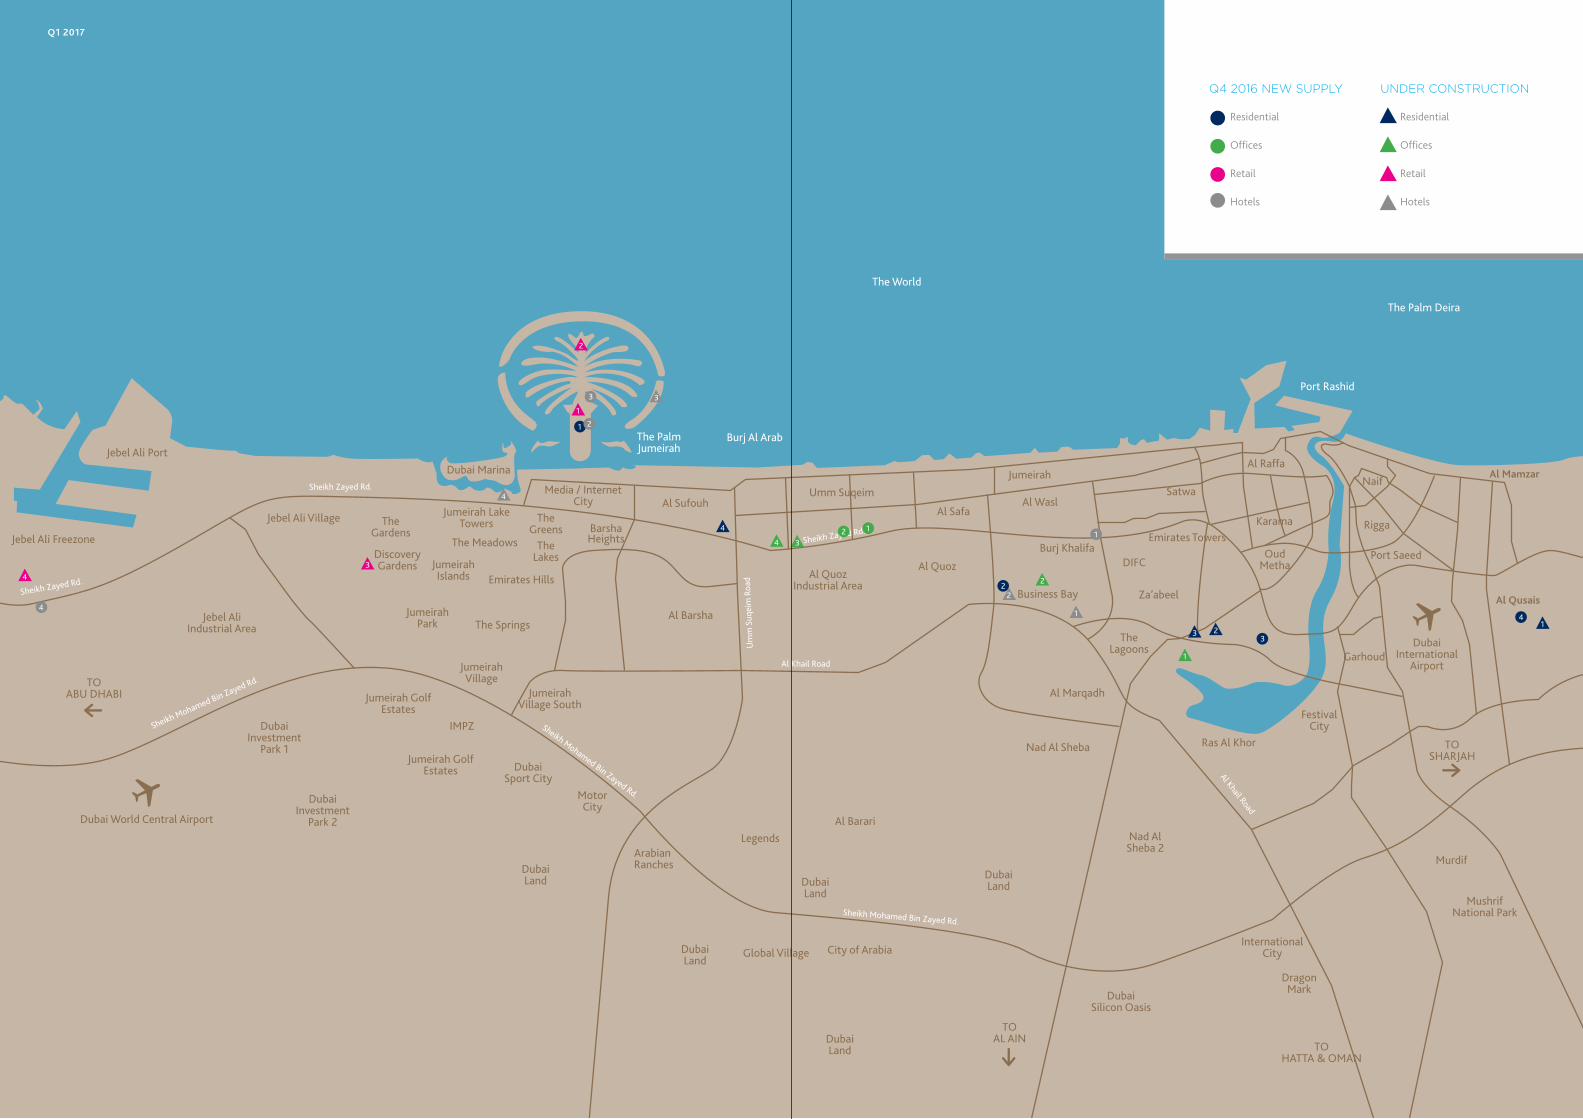
Residential
Offices
Retail
Hotels
Q4 2016 NEW SUPPLY
Residential
Offices
Retail
Hotels
UNDER CONSTRUCTION
Q1 2017
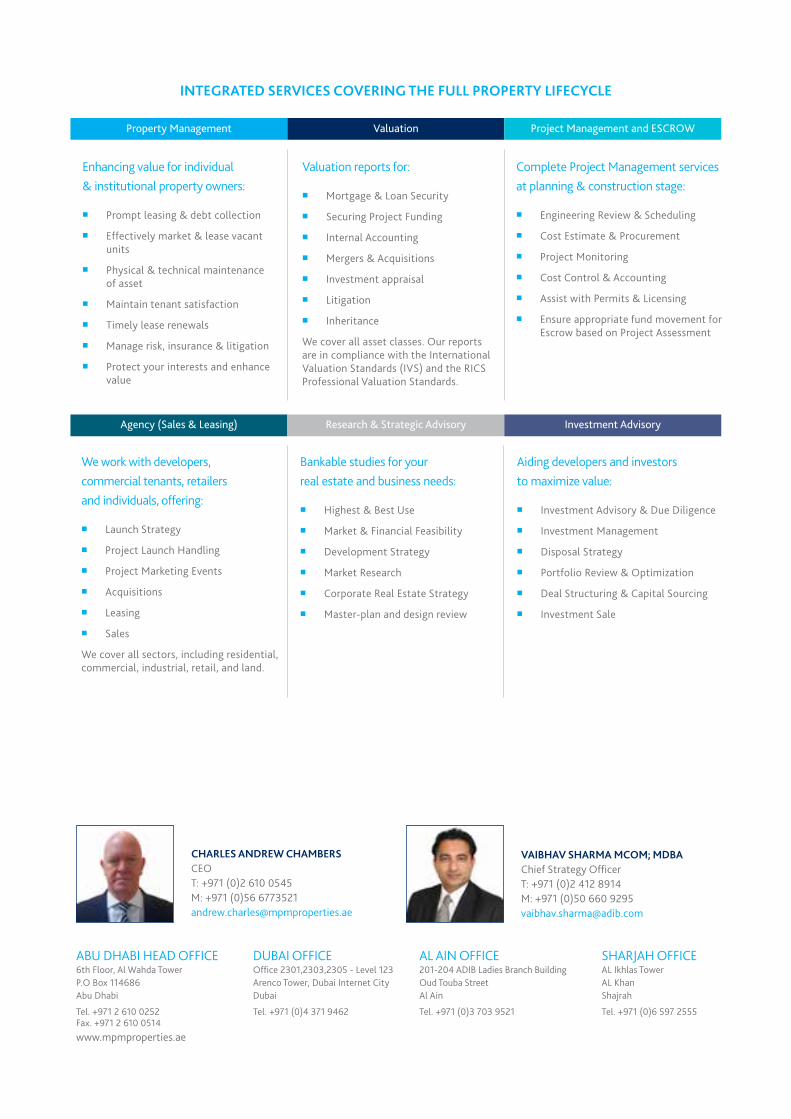
INTEGRATED SERVICES COVERING THE FULL PROPERTY LIFECYCLE
Property Management
Investment Advisory
Project Management and ESCROW
Research & Strategic AdvisoryAgency (Sales & Leasing)
Valuation
VAIBHAV SHARMA MCOM; MDBA Chief Strategy Officer T: +971 (0)2 412 8914 M: +971 (0)50 660 9295 [email protected]
ABU DHABI HEAD OFFICE 6th Floor, Al Wahda Tower P.O Box 114686 Abu Dhabi
Tel. +971 2 610 0252Fax. +971 2 610 0514 www.mpmproperties.ae
DUBAI OFFICE Office 2301,2303,2305 - Level 123 Arenco Tower, Dubai Internet City Dubai
Tel. +971 (0)4 371 9462
AL AIN OFFICE 201-204 ADIB Ladies Branch Building Oud Touba Street Al Ain
Tel. +971 (0)3 703 9521
SHARJAH OFFICE AL Ikhlas Tower AL Khan Shajrah
Tel. +971 (0)6 597 2555
Enhancing value for individual & institutional property owners:
�� Prompt leasing & debt collection
�� Effectively market & lease vacant units
�� Physical & technical maintenance of asset
�� Maintain tenant satisfaction
�� Timely lease renewals
�� Manage risk, insurance & litigation
�� Protect your interests and enhance value
Complete Project Management services at planning & construction stage:
�� Engineering Review & Scheduling
�� Cost Estimate & Procurement
�� Project Monitoring
�� Cost Control & Accounting
�� Assist with Permits & Licensing
�� Ensure appropriate fund movement for Escrow based on Project Assessment
Aiding developers and investors to maximize value:
�� Investment Advisory & Due Diligence
�� Investment Management
�� Disposal Strategy
�� Portfolio Review & Optimization
�� Deal Structuring & Capital Sourcing
�� Investment Sale
We work with developers, commercial tenants, retailers and individuals, offering:
�� Launch Strategy
�� Project Launch Handling
�� Project Marketing Events
�� Acquisitions
�� Leasing
�� Sales
We cover all sectors, including residential, commercial, industrial, retail, and land.
Bankable studies for your real estate and business needs:
�� Highest & Best Use
�� Market & Financial Feasibility
�� Development Strategy
�� Market Research
�� Corporate Real Estate Strategy
�� Master-plan and design review
Valuation reports for:
�� Mortgage & Loan Security
�� Securing Project Funding
�� Internal Accounting
�� Mergers & Acquisitions
�� Investment appraisal
�� Litigation
�� Inheritance
We cover all asset classes. Our reports are in compliance with the International Valuation Standards (IVS) and the RICS Professional Valuation Standards.
CHARLES ANDREW CHAMBERS CEO T: +971 (0)2 610 0545 M: +971 (0)56 6773521 [email protected]