Embed Size (px)
Citation preview
EDUCATION STATUS REPORT – TAMIL NADU
ELEMENTARY EDUCATION Prepared by Anju Gupta, Independent Development Consultant Catalyst Management Services (CMS) | CEI - India
Education Status Report- Tamil Nadu
2
CONTENTS
ABBRIVIATIONS…………………………………………………………………………………………………………………….3
1. INTRODCUTION…………………………………………………………………………………………………………………5
2. EDUCATION STATUS IN INDIA………………………………………………………………………………………….5
3. STATUS OF ELEMENTARY EDUCATION IN TAMIL NADU……………………………………………………7
4. LITERACY IN TAMIL NADU……………………………………………………………………………………………...8
5. NUMBER OF SCHOOLS…………………………………………………………………………………………………….9
6. ENROLMENT……………………………………………………………………………………………………………......12
7. EDUCATIONAL DEVELOPMENT INDEX………………………………………………….....................16
8. EDUCATIONAL EXPENDITURE……………………………………………………………………………………....21
9. ASER 2012 REPORT…………………………………………………………………………………………………………21 10. CONCLUSION…………………………………………………………………………………………………………………23

Education Status Report- Tamil Nadu
3
Abbreviations
ASER Annual Status of Education Report
Avr. Average
BRCs Block Resource Center
CRC Cluster Resource Center
DISE District Information system for Education
DPEP District Primary Education Programme
EBBs Educationally Backward Blocks
ECE Early Childhood Education
EGS Education Guarantee Scheme
Enr. Enrollment
GER Gross Enrollment Ratio
Govt. Government
GPI Gender Parity Index
ICDS Integrated Child Development Scheme
KGBV Kasturba Gandhi Balika Vidyalay
MIS Management Information System
MHRD Ministry of Human Resource Development
NLM National Literacy Mission
NER Net Enrollment Ratio
NPE National Policy of Education
NPEGEL National Program for Education of Girls at Elementary Level
OBC Other Backward Caste
P. Primary
PTR Pupil-Teacher Ratio
Pvt. Private
POA Program of Action
RTE Right To Education
RMSA
Rashtriya Madhyamik Shiksha Abhiyan
SC Schedule Caste
Sch. School
SCR Student Class-room ration
SEMIS Secondary Education Management Information System
Sec./H.Sec. Secondary/ Higher Secondary
ST Schedule Tribe

Education Status Report- Tamil Nadu
4
SSA Sarva Shiksha Abhiyaan
TLM Teaching learning Material
Unrec. Unrecognized
UP Upper Primary
Education Status Report- Tamil Nadu
5
1. Introduction
A completed primary education is a basic human right and is necessary for enjoying many other
rights. It is transformative and empowering and a means for accessing broad economic, social,
political and cultural benefits. Education contributes to building more just societies through
reducing poverty and inequalities. No country has ever climbed the human development ladder
without steady investment in education. Primary education is a powerful driver for the realization
of all the Millennium Development Goals (MDGs) and for sustainable development more broadly.
MDG 2 is to achieve universal primary education. Every child has the right to go to school, but
millions are still being left behind. Universal primary education involves entering school at an
appropriate age, progressing through the system and completing a full cycle. Today, there are over
30 million more children in school than in the beginning of the decade. There have been some
remarkable success stories. Primary school enrolments have increased dramatically in sub-Saharan
Africa as well as in South and West Asia.
United Nations Fact Sheet 2013 shows that Enrolment in primary education in developing regions
reached 90 per cent in 2010, up from 82 per cent in 1999, which means more kids than ever are
attending primary school. In 2011, 57 million children of primary school age were out of school.
Even as countries with the toughest challenges have made large strides, progress on primary
school enrolment has slowed. Between 2008 and 2011, the number of out-of-school children of
primary age fell by only 3 million. Globally, 123 million youth (aged 15 to 24) lack basic reading and
writing skills. 61 per cent of them are young women. Gender gaps in youth literacy rates are also
narrowing. Globally, there were 95 literate young women for every 100 young men in 2010,
compared with 90 women in 19901.
2. Education Status in India
India made a Constitutional commitment to provide free and compulsory education to all children
up to the age of 14 nearly sixty years ago. The goal, which was expected to be achieved by 1960,
remains elusive, even now. Yet, one has to admit that developments in recent years have had
significant impacts on the situation, raising the hope that universal basic education could be a
reality within a reasonable period of time. Three factors seem to be making a distinct difference in
the growth trajectory of elementary education in the country. The Indian government lays
emphasis on primary education up to the age of fourteen years, referred to as elementary
education in India. Education has also been made free for children for 6 to 14 years of age or up to
class VIII under the Right of Children to Free and Compulsory Education Act 2009. Education in
India is provided by the public sector as well as the private sector, with control and funding
1 http://www.un.org/millenniumgoals/education.shtml
Education Status Report- Tamil Nadu
6
coming from three levels: central, state, and local. The various articles of the Indian
Constitution provide for education as a fundamental right. The Indian government has banned
child labour in order to ensure that the children do not enter unsafe working conditions. However,
both free education and the ban on child labour are difficult to enforce due to economic disparity
and social conditions. 80% of all recognized schools at the elementary stage are government run
or supported, making it the largest provider of education in the country.
With the improved coverage, the number of schools imparting elementary education dealt with
under DISE increased many fold. From 8, 53,601 schools in 2002 – 2003, their number has
increased to 11, 96,663 schools in 2006 – 2007, 12, 50,775 schools in 2007 – 2008, 12, 85,576
schools in 2008 – 09. In the current year, 2012 – 2013, as many as 13, 06,992 schools imparting
elementary education across 633 Districts of the country as covered under DISE. Of the total
schools, about 87.30 percent schools are located in the rural areas. The increase in the number of
schools is also reflected in the ratio of primary to upper primary schools which clearly shows the
impact of Sarva Shiksha Abhiyan under which a large number of schools have been opened in the
recent past. Improvements in the physical access to elementary education by providing primary
and upper primary schools seems to have also impacted on the ratio of upper primary sections to
lower primary sections. In 1957, at the time of the First AIES (NCERT, 1967) there was only one
upper primary school for every six primary schools. Ratio of Primary and Upper Primary Schools in
India for the year 2008 – 2009 is One Upper Primary School for every set of 2.27 Primary Schools
compared to 2.45 in 2006 – 2007 and 2.42 schools in 2007 – 2008. Most of the states have the
ratio equivalent to almost two, all of which suggests that by and large schooling facilities have
been created and are available across the country. As a whole, India’s ratio is satisfactory, but
there are few states, such as Arunachal Pradesh (4.16) and West Bengal (5.48), where the ratio
still needs to be improved significantly.
However, due to a shortage of resources and lack of political will, this system suffers from massive
gaps including high pupil to teacher ratios, shortage of infrastructure and poor levels of teacher
training. Figures released by the Indian government in 2011 show that there were 5,816,673
elementary school teachers in India. As of March 2012 there were 2,127,000 secondary school
teachers in India. There have been several efforts to enhance quality made by the government.
The District Education Revitalization Programme (DERP) was launched in 1994 with an aim to
universalize primary education in India by reforming and vitalizing the existing primary education
system. 85% of the DERP was funded by the central government and the remaining 15 percent
was funded by the states. The DERP, which had opened 160000 new schools including 84000
alternative education schools delivering alternative education to approximately 3.5 million
children, was also supported by UNICEF and other international programmes. As per the Annual
Status of Education Report (ASER) 2012, 96.5% of all rural children between the ages of 6-14 were
enrolled in school. This is the fourth annual survey to report enrollment above 96%. 83% of all
Education Status Report- Tamil Nadu
7
rural 15-16 year olds were enrolled in school. However, going forward, India will need to focus
more on quality.
This primary education scheme has also shown a high Gross Enrollment Ratio of 93–95% for the
last three years in some states. Significant improvement in staffing and enrollment of girls has also
been made as a part of this scheme. The current scheme for Universalization of Education for All is
the Sarva Shiksha Abhiyan which is one of the largest education initiatives in the world. Enrollment
has been enhanced, but the levels of quality remain low. According to current estimates, 80% of
all schools are government schools making the government the major provider of education.
However, because of poor quality of public education, 27% of Indian children are privately
educated. With more than 50% children enrolling in private schools in urban areas, the balance
has already tilted towards private schooling in cities; even in rural areas, nearly 20% of the
children in 2004-5 were enrolled in private schools. According to some research, private schools
often provide superior results at a multiple of the unit cost of government schools. However,
others have suggested that private schools fail to provide education to the poorest families, a
selective being only a fifth of the schools and have in the past ignored Court orders for their
regulation. On an All-India level, there are roughly 200 million children in the 6-14 age group, of
which only 120 million are in schools and net attendance in the primary level is estimated to be
merely 66 percent of enrolment.
3. Status of Elementary Education in Tamil Nadu
Tamil Nadu is geographically the 11th largest state in India with an area of 130,058 square
kilometers accounting for 4% of the national area. It has a long coastline extending up to 1000
Kms. Climatically the state falls into a semi – humid and a semi – arid zone. For an education
administration, there are 385 CD Blocks, 64 Educational Districts, 385 Block Resource Centres in
CD Blocks, 27 Urban BRCs in Urban Areas, 4,088 Cluster Resource Centres, 43,133 Village
Education Committees (They are now in forming School Management Committees across the
Elementary Schools in Tamilnadu), 17,371 Revenue Villages and 13,230 Panchayaths. As per
Census 2001, Tamil Nadu is one of the better off states in India in terms of high overall literacy
rate of 73% and also a high female literacy rate of about 65%. Tamil Nadu has India’s highest
student enrolment rate in primary (up to Grade V) and upper primary level (up to Grade VIII)
education.
The School education structure in Tamil Nadu has four levels namely Primary, Upper Primary,
Secondary and Higher Secondary. At operational level considerable variations are found in the
patterns of schooling across the different states of India, at the elementary level. Several states
follow patterns in which elementary schooling consists of Seven Years, divided in to four years of
primary followed by three years of upper primary. In Tamilnadu, elementary school is generally
Education Status Report- Tamil Nadu
8
divided into two parts with five years of primary schooling (Grades I – V), followed by three years
of upper primary (VI – VIII).
4. Literacy in Tamil Nadu
Literacy is the key for socio economic progress and it is an important indicator for human
development. The literacy rate of India grew to 74.04 percent in 2011from 12 percent at the end
of British period 1947. India currently has the largest illiterate population in the world and the
country stand well below the world average literacy rate of 84%. The 2011 census shows that 2001
– 2011 decadal literacy growth of 9.2 percent, which is slower than the previous decade.
Tamil Nadu is one of the most literate states in India. The state performed reasonably in terms of
literacy growth during the decade 2001 – 2011. According to 2011 Census, Literacy rate in Tamil
Nadu has been upward trend and is 80.09 percent as per 2011 population census. Of that, male
literacy stands at 86.77 percent while female literacy is at 73.14 percent. In 2011, literacy rate in
Tamil Nadu stood at 73.45 percent of which male and female were 83.28 percent and 64.91
percent literate respectively. In actual numbers, total literates in Tamil Nadu stands at 51,837,507
of which males were 28.040,491 and females were 23,797,016. Some districts in Tamil Nadu have
a higher literacy rate such as Kanyakumari (91.75%), Chennai (90.18%), Tuticorin (86.16%), The
Nilgiris (85.20%) and Kancheepuram (84.49%). Dharmapuri is the District has the literacy rate of
64.71 percent and stood first from the bottom. The male literacy rate in Dharmapuri is 69.91
percent and the female literacy rate 60.03 percent. There are 13 Districts in Tamil Nadu have the
female literacy rate below 70% namely Dharmapuri, Ariyallur, Villupuram, Krishnagiri, Erode,
Salem, Thiruvannamalai, Perambalur, Namakkal, Karur, Dindigul, Pudukkottai, and Theni2. In 12
Districts of Tamilnadu, the gender gap is more than 20%.
According to 2001 census, the population of SCs and STs in Tamilnadu, there are 1,18,57,504 SCs
and 6,51,321 STs are living in the state3.
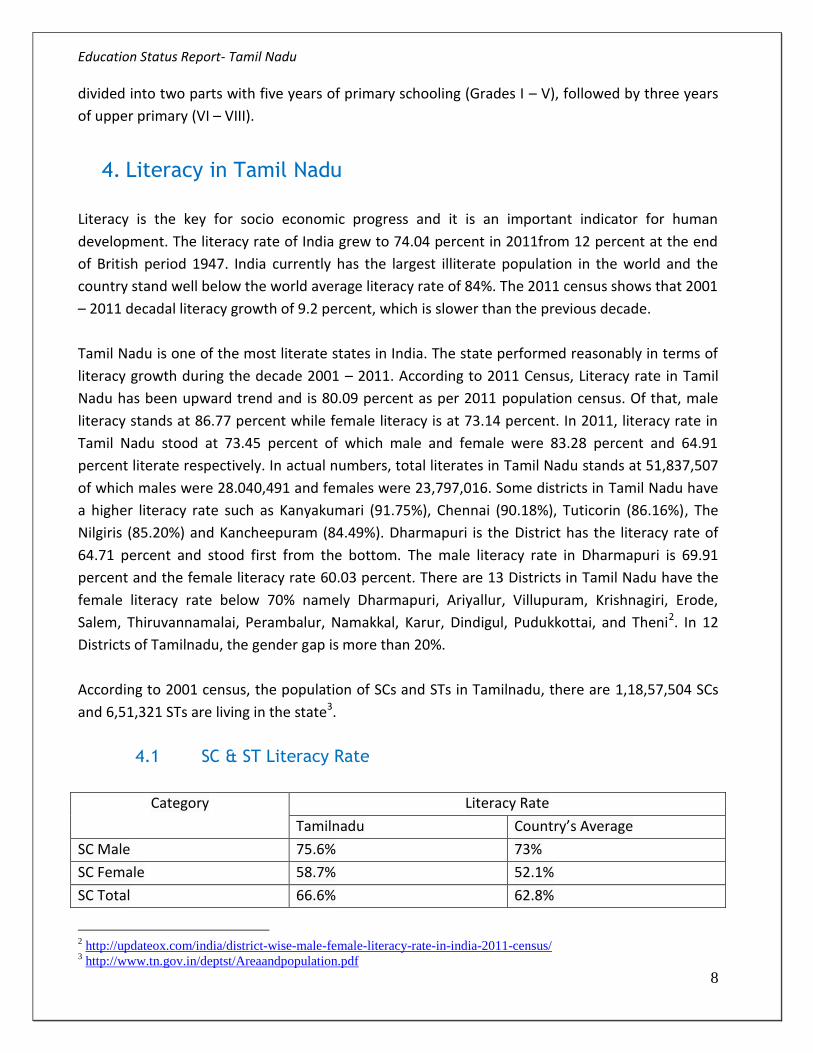
4.1 SC & ST Literacy Rate
Category Literacy Rate
Tamilnadu Country’s Average
SC Male 75.6% 73%
SC Female 58.7% 52.1%
SC Total 66.6% 62.8%
2 http://updateox.com/india/district-wise-male-female-literacy-rate-in-india-2011-census/
3 http://www.tn.gov.in/deptst/Areaandpopulation.pdf

Education Status Report- Tamil Nadu
9
ST Male 55.8% 70.7%
ST Female 39.2% 52.1%
ST Total 48.8% 61.6%
Source: GoI, NSSO, Primary Data (2009 – 2010)
4. Number of Schools4
In Tamil Nadu, there is substantial growth in number of schools to address the accessibility of
education for the vulnerable poor. Almost all the habitation covered education facilities with the
Government frequently monitoring the needs of education facilities in each and every habitation
across the state. The Government has been taking lot of initiative to address the issue, leading to
positive results in terms accessibility and affordability. The government is the major provider in
school education and private management is also contributing substantially to achieve the goal. As
per the Performance Statistics of School Education – Tamil Nadu, during the previous academic
year there were a total of 55667 schools including Primary, Upper Primary, High Schools and
Higher Secondary Schools. In that more than 63% of the schools were run by the Government and
the rest are private aided or private unaided schools. 13505795 students are studying in these
schools in all categories i.e. Government, Private and Private Aided / Primary, Middle Schools,
High School and Higher Secondary Schools. It shows the common man depending / preferring to
send their ward to Government schools.
4 Elementary Education in India, Progress toward UEE (Arun .C Mehta) - Analytical Tables 2010 - 2011
34226 10491
3703
69
6686
Number of Schools (55175)
Primary Only
Primary with UP
Primary with UP & Sec. / H. Sec
UP Only
UP with Sec. / H. Sec
Education Status Report- Tamil Nadu
10
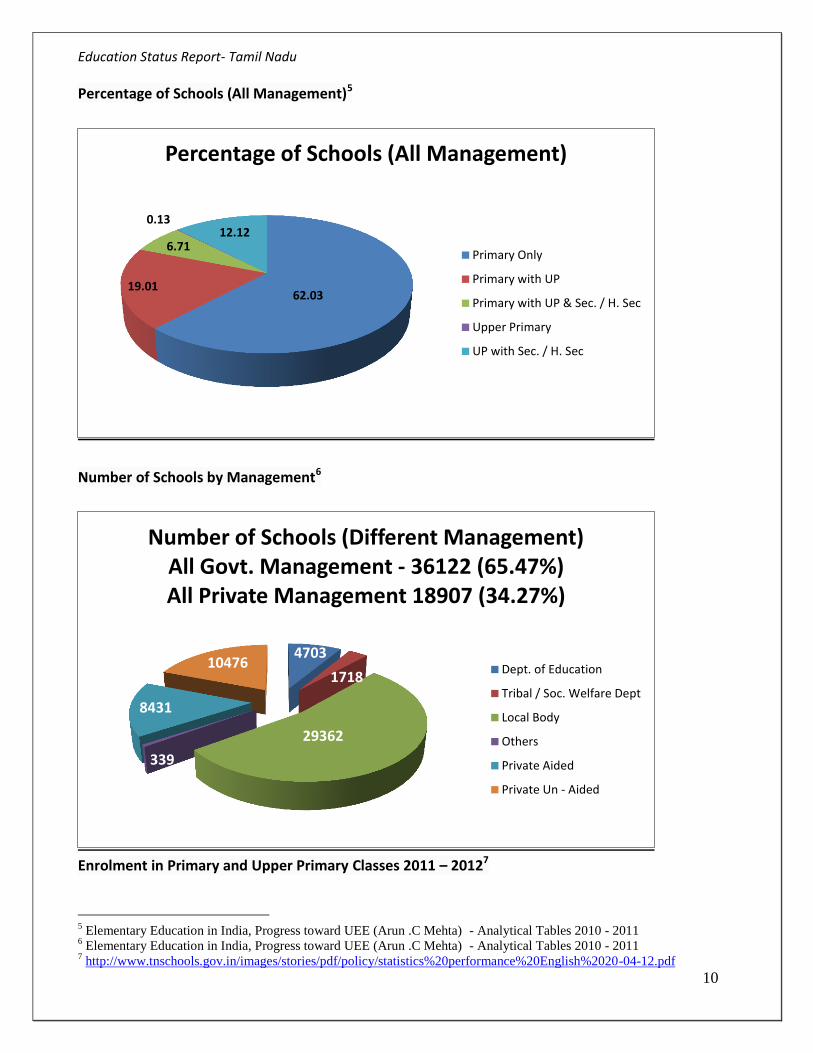
Percentage of Schools (All Management)5
Number of Schools by Management6
Enrolment in Primary and Upper Primary Classes 2011 – 20127
5 Elementary Education in India, Progress toward UEE (Arun .C Mehta) - Analytical Tables 2010 - 2011
6 Elementary Education in India, Progress toward UEE (Arun .C Mehta) - Analytical Tables 2010 - 2011
7 http://www.tnschools.gov.in/images/stories/pdf/policy/statistics%20performance%20English%2020-04-12.pdf
62.03 19.01
6.71
0.13 12.12
Percentage of Schools (All Management)
Primary Only
Primary with UP
Primary with UP & Sec. / H. Sec
Upper Primary
UP with Sec. / H. Sec
4703
1718
29362
339
8431
10476
Number of Schools (Different Management) All Govt. Management - 36122 (65.47%) All Private Management 18907 (34.27%)
Dept. of Education
Tribal / Soc. Welfare Dept
Local Body
Others
Private Aided
Private Un - Aided
Education Status Report- Tamil Nadu
11
State /
Country
Primary
School
Upper
Primary
Primary
(All Govt.
Management)
Primary (All
Private
Management)
Upper Primary
(All Govt.
Management)
Upper Primary
(All Private
Management)
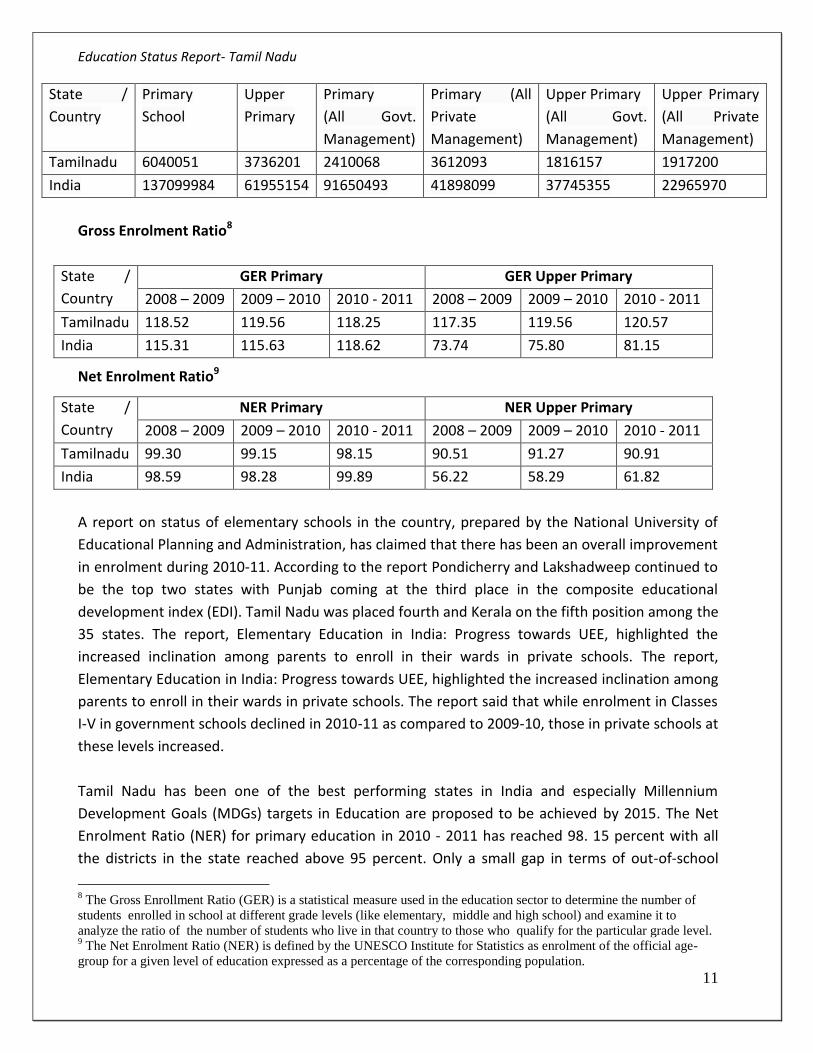
Tamilnadu 6040051 3736201 2410068 3612093 1816157 1917200
India 137099984 61955154 91650493 41898099 37745355 22965970
Gross Enrolment Ratio8
State /
Country
GER Primary GER Upper Primary
2008 – 2009 2009 – 2010 2010 - 2011 2008 – 2009 2009 – 2010 2010 - 2011
Tamilnadu 118.52 119.56 118.25 117.35 119.56 120.57
India 115.31 115.63 118.62 73.74 75.80 81.15
Net Enrolment Ratio9
State /
Country
NER Primary NER Upper Primary
2008 – 2009 2009 – 2010 2010 - 2011 2008 – 2009 2009 – 2010 2010 - 2011
Tamilnadu 99.30 99.15 98.15 90.51 91.27 90.91
India 98.59 98.28 99.89 56.22 58.29 61.82
A report on status of elementary schools in the country, prepared by the National University of
Educational Planning and Administration, has claimed that there has been an overall improvement
in enrolment during 2010-11. According to the report Pondicherry and Lakshadweep continued to
be the top two states with Punjab coming at the third place in the composite educational
development index (EDI). Tamil Nadu was placed fourth and Kerala on the fifth position among the
35 states. The report, Elementary Education in India: Progress towards UEE, highlighted the
increased inclination among parents to enroll in their wards in private schools. The report,
Elementary Education in India: Progress towards UEE, highlighted the increased inclination among
parents to enroll in their wards in private schools. The report said that while enrolment in Classes
I-V in government schools declined in 2010-11 as compared to 2009-10, those in private schools at
these levels increased.
Tamil Nadu has been one of the best performing states in India and especially Millennium
Development Goals (MDGs) targets in Education are proposed to be achieved by 2015. The Net
Enrolment Ratio (NER) for primary education in 2010 - 2011 has reached 98. 15 percent with all
the districts in the state reached above 95 percent. Only a small gap in terms of out-of-school
8 The Gross Enrollment Ratio (GER) is a statistical measure used in the education sector to determine the number of
students enrolled in school at different grade levels (like elementary, middle and high school) and examine it to
analyze the ratio of the number of students who live in that country to those who qualify for the particular grade level. 9 The Net Enrolment Ratio (NER) is defined by the UNESCO Institute for Statistics as enrolment of the official age-
group for a given level of education expressed as a percentage of the corresponding population.
Education Status Report- Tamil Nadu
12
children remains to be filled to achieve the target of universal elementary education. As per the
statistics, enrolment is not an issue in Tamil Nadu and the Government trying to attract parents in
different approaches including providing awareness to the public about the importance of
education and how it helps to their ward for their future.
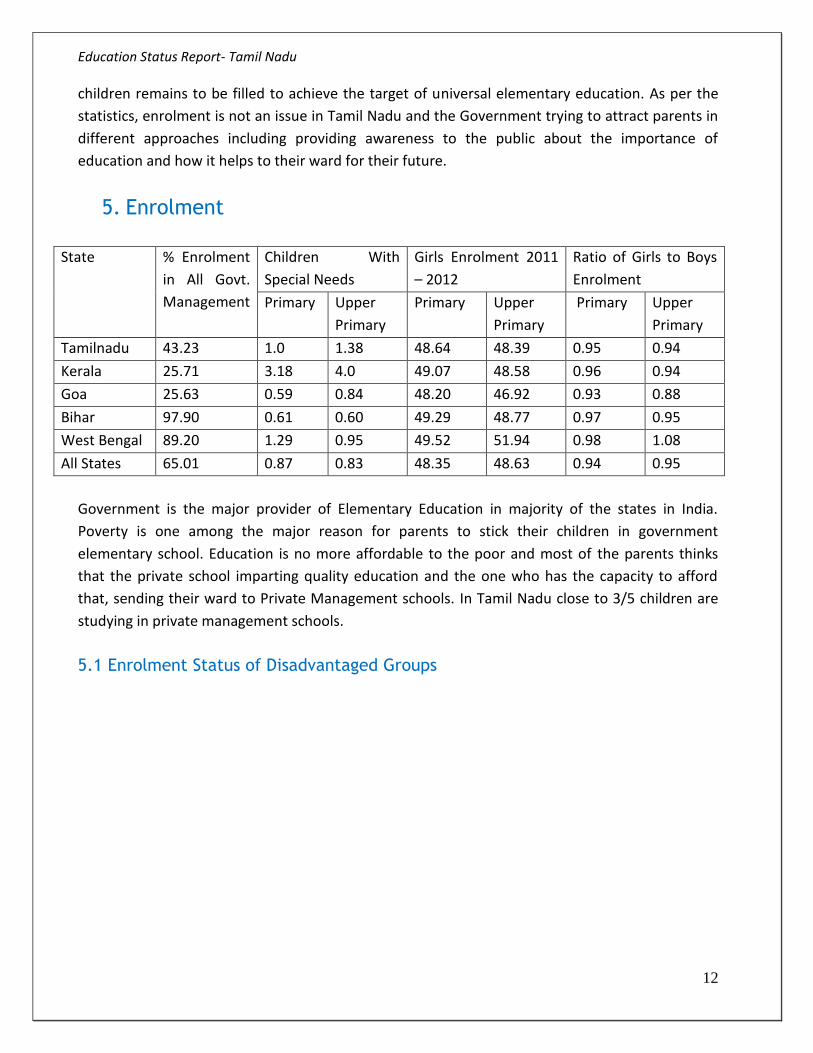
5. Enrolment
State % Enrolment
in All Govt.
Management
Children With
Special Needs
Girls Enrolment 2011
– 2012
Ratio of Girls to Boys
Enrolment
Primary Upper
Primary
Primary Upper
Primary
Primary Upper
Primary
Tamilnadu 43.23 1.0 1.38 48.64 48.39 0.95 0.94
Kerala 25.71 3.18 4.0 49.07 48.58 0.96 0.94
Goa 25.63 0.59 0.84 48.20 46.92 0.93 0.88
Bihar 97.90 0.61 0.60 49.29 48.77 0.97 0.95
West Bengal 89.20 1.29 0.95 49.52 51.94 0.98 1.08
All States 65.01 0.87 0.83 48.35 48.63 0.94 0.95
Government is the major provider of Elementary Education in majority of the states in India.
Poverty is one among the major reason for parents to stick their children in government
elementary school. Education is no more affordable to the poor and most of the parents thinks
that the private school imparting quality education and the one who has the capacity to afford
that, sending their ward to Private Management schools. In Tamil Nadu close to 3/5 children are
studying in private management schools.
5.1 Enrolment Status of Disadvantaged Groups

Education Status Report- Tamil Nadu
13
It is important that access and equity go together in order to make UEE a reality. Almost all
programmes and plans aim at bridging gender and social gaps in enrolment, retention and
learning achievement at the primary stage. Special interventions and strategies have been
adopted to include girls, SC/ST children, working children, children with special needs, urban
deprived children, children from minority groups, children living below the poverty line, migratory
children and children in the hardest-to-reach groups. These are indeed children who have
historically remained excluded from education and are at a high risk of dropping out even after
enrolment if special attention is not paid.
Enrolment Status of Disadvantaged Groups – Boys & Girls 2011 – 2012
24.25
1.71
69.14
5.7
Status of Enrolment in Class I - VIII (All Class)
Scheduled Caste
Scheduled Tribes
OBC
Muslim
0
20
40
60
80
100
120
Scheduled Caste Scheduled Tribe Other BackwardCaste
Muslim
51.11 52.01 51.51 51.5
48.89 47.99 48.49 49.5
Girls
Boys
Education Status Report- Tamil Nadu
14
The above graph shows that the enrolment status of disadvantaged groups boys and girls. There is
not much difference between the sex of the students in terms of enrolment.
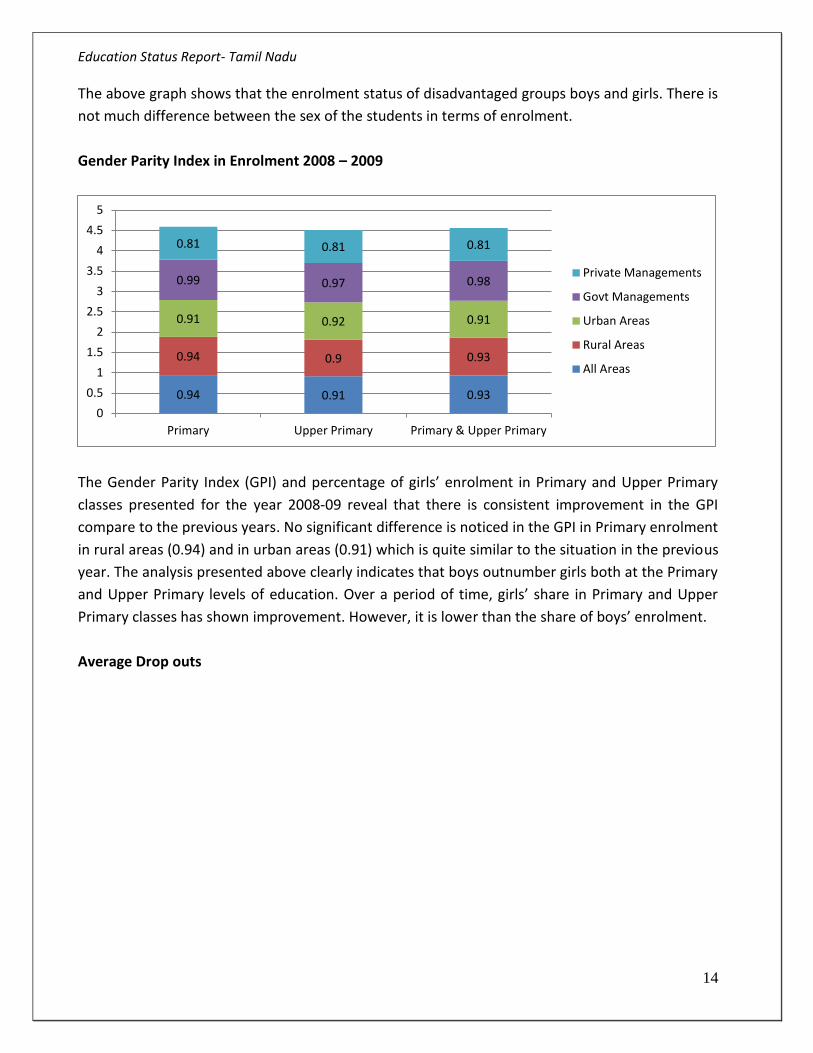
Gender Parity Index in Enrolment 2008 – 2009
The Gender Parity Index (GPI) and percentage of girls’ enrolment in Primary and Upper Primary
classes presented for the year 2008-09 reveal that there is consistent improvement in the GPI
compare to the previous years. No significant difference is noticed in the GPI in Primary enrolment
in rural areas (0.94) and in urban areas (0.91) which is quite similar to the situation in the previous
year. The analysis presented above clearly indicates that boys outnumber girls both at the Primary
and Upper Primary levels of education. Over a period of time, girls’ share in Primary and Upper
Primary classes has shown improvement. However, it is lower than the share of boys’ enrolment.
Average Drop outs
0.94 0.91 0.93
0.94 0.9 0.93
0.91 0.92 0.91
0.99 0.97 0.98
0.81 0.81 0.81
0
0.5
1
1.5
2
2.5
3
3.5
4
4.5
5
Primary Upper Primary Primary & Upper Primary
Private Managements
Govt Managements
Urban Areas
Rural Areas
All Areas
Education Status Report- Tamil Nadu
15
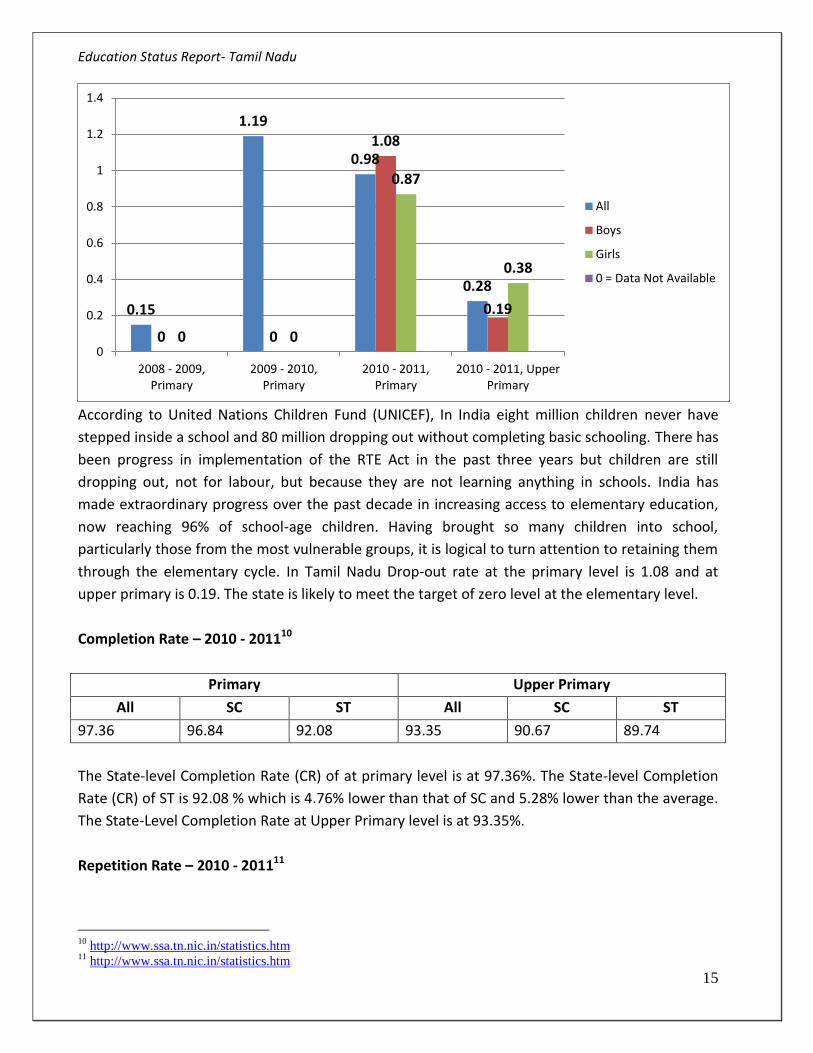
According to United Nations Children Fund (UNICEF), In India eight million children never have
stepped inside a school and 80 million dropping out without completing basic schooling. There has
been progress in implementation of the RTE Act in the past three years but children are still
dropping out, not for labour, but because they are not learning anything in schools. India has
made extraordinary progress over the past decade in increasing access to elementary education,
now reaching 96% of school-age children. Having brought so many children into school,
particularly those from the most vulnerable groups, it is logical to turn attention to retaining them
through the elementary cycle. In Tamil Nadu Drop-out rate at the primary level is 1.08 and at
upper primary is 0.19. The state is likely to meet the target of zero level at the elementary level.
Completion Rate – 2010 - 201110
Primary Upper Primary
All SC ST All SC ST
97.36 96.84 92.08 93.35 90.67 89.74
The State-level Completion Rate (CR) of at primary level is at 97.36%. The State-level Completion
Rate (CR) of ST is 92.08 % which is 4.76% lower than that of SC and 5.28% lower than the average.
The State-Level Completion Rate at Upper Primary level is at 93.35%.
Repetition Rate – 2010 - 201111
10
http://www.ssa.tn.nic.in/statistics.htm 11
http://www.ssa.tn.nic.in/statistics.htm
0.15
1.19
0.98
0.28
0 0
1.08
0.19
0 0
0.87
0.38
0
0.2
0.4
0.6
0.8
1
1.2
1.4
2008 - 2009,Primary
2009 - 2010,Primary
2010 - 2011,Primary
2010 - 2011, UpperPrimary
All
Boys
Girls
0 = Data Not Available
Education Status Report- Tamil Nadu
16
Primary Upper Primary
All SC ST All SC ST
1.65 2.25 6.59 4.85 7.34 8.28
The State-level Repetition Rate (RR) of All at primary level is at 1.65%. The State-level RR of SC is at
2.25%. The State-level RR of ST is at 6.59%. The State-Level Repetition Rate of all at Upper Primary
Level is at 4.85.
Transition Rate 2011 – 2012: -12
Transition Rate from Primary to Upper Primary - All 98.20
The Transition Rate for Primary to Upper Primary has been calculated based on the number of
children who passed the V grade from Primary Section and the number of children who joined in
VI grade in the Upper Primary Sections.
Retention Rate 2011 - 201213
Retention at Primary Level 99 %
Retention at Elementary Level 98.21%
6. Education Development Index (EDI)
In India, DISE provides information on various schools based inputs and processes as well some
indicators related to outcomes. Based on the DISE data, an effort has also been made by the
National University of Educational Planning and Administration (NUEPA) and the Government of
India (MHRD, Department of School Education and Literacy) to compute an Educational
Development Index (EDI), separately for Primary and Upper Primary levels of education and also a
composite index for the entire Elementary education for which the Government of India
constituted a Working Group on EDI in 2005-06 of which NUEPA was also a member. It identified
indicators and developed computation methodology. The basic purpose of computing an EDI is to
know comparative status of a state vis-à-vis other states with regard to different aspects of
Universalization.
Education Development Index14 2011 – 2012, Tamilnadu
12
http://ssa.nic.in/pabminutes-documents/Pab%20Minutes%202013-14/Tamil%20Nadu/Annexure-V%20-
%20result_frame_work.pdf 13
http://ssa.nic.in/pabminutes-documents/Pab%20Minutes%202013-14/Tamil%20Nadu/Annexure-V%20-
%20result_frame_work.pdf
Education Status Report- Tamil Nadu
17
Primary Level - All Schools: All Managements
Access Infrastructure Teacher Outcome
Index Rank Index Rank Index Rank Index Rank
0.152 29 0.748 1 0.871 5 0.935 1
Education Development Index 2011 – 2012, Tamilnadu
Upper Primary Level - All Schools: All Managements
Access Infrastructure Teacher Outcome
Index Rank Index Rank Index Rank Index Rank
0.269 31 0.802 4e 0.847 13 0.824 1
Composite Education Development Index 2011 – 2012, Tamilnadu
All Schools: All Managements
Primary Level Upper Primary Level Composite – Primary & Upper Primary
Index Rank Index Rank Index Rank
0.680 1 0.699 5 0.689 3
Composite Primary and Upper Primary education EDI amongst 35 states in India is concerned; the
top five ranking states are Lakshadweep (0.716), Karnataka (0.693), Tamil Nadu (0.689),
Pondicherry (0.675) and Daman & Diu (0.675).
Alternative Educational Facilities in Tamilnadu
Recent years have witnessed some positive developments with respect to girls’ education in India.
For instance, since the beginning of 1990s, progress in girls’ enrolment has been faster than that
of boys. In the 6-11 age group, this could possibly be explained by the fact that the GER for boys
was already around or above 100% and was, therefore, in a stabilization phase. Despite positive
trends in the enrolment of girls, however, gender disparity does not seem to have reduced
significantly over the years. The National Programme for Education of Girls at Elementary Level
(NPEGEL) is a focused intervention of Government of India, to reach the “Hardest to Reach” girls,
especially those not in school. Launched in July 2003, it is an important component of SSA, which
provides additional support for enhancing girl’s education over and above the investments for
girl’s education through normal SSA interventions. The scheme is being implemented in the EBBs
14
Components (Access, Infrastructure, Teachers & Outcomes) used for constructing EDI initially were pre-determined
by the MHRD, Government of India. Overall 23 indicators in these Four Components.
Education Status Report- Tamil Nadu
18
where the level of rural female literacy is less than the national average and gender gap is above
the national average; in blocks of districts which are not covered under EBBs but where at least 5
per cent of population is SC/ST and where SC/ST female literacy is below 10 per cent; and also in
select urban slums. The programme provides for development of a “model school” in every cluster
with more intense community mobilization and supervision of girls enrolment in schools. Gender
sensitization of teachers, development of gender-sensitive learning materials, and provision of
need-based incentives like escorts, stationery, workbooks and uniforms are some of the
endeavors under the programme. About 3272 educationally backward blocks are covered under
the Scheme in the 24 States including Tamilnadu. In Tamil Nadu there are 37 Blocks in 11 Districts
declared as Educationally Backward Blocks by The Government of India. There are 61 Kasturba
Gandhi Balika Vidyalaya in the state and 4162 Girls Student got an opportunity to continue their
studies without any disturbances.
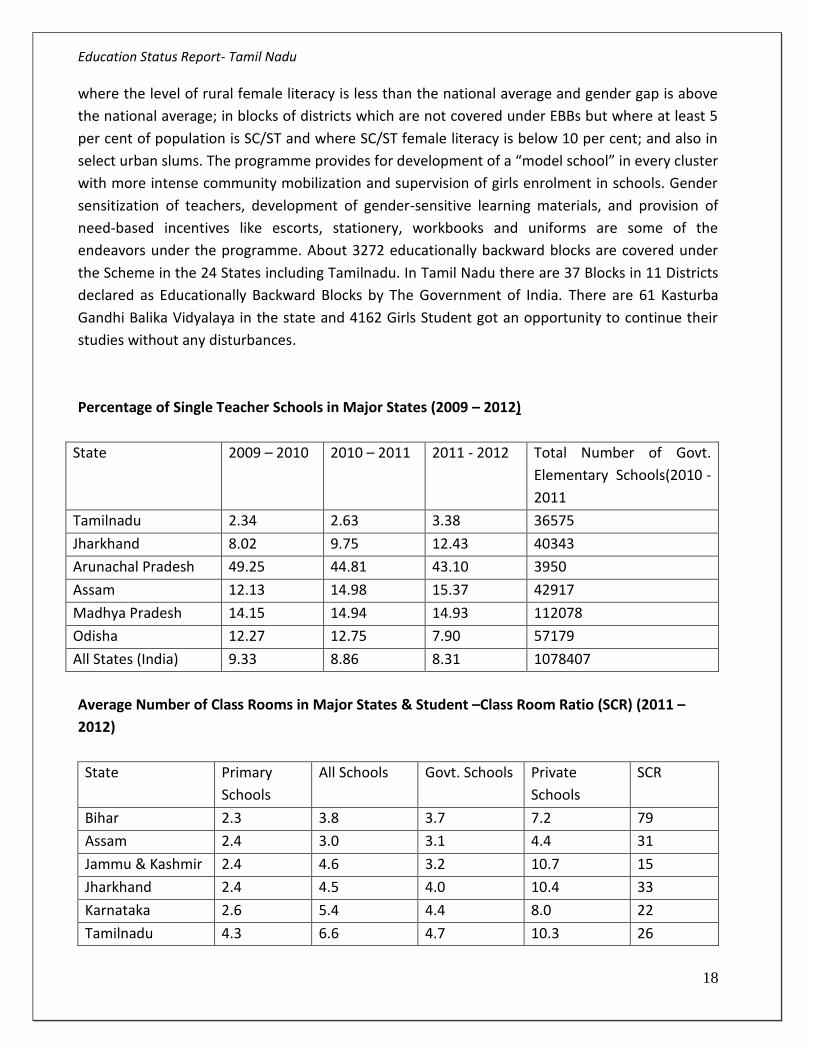
Percentage of Single Teacher Schools in Major States (2009 – 2012)
State 2009 – 2010 2010 – 2011 2011 - 2012 Total Number of Govt.
Elementary Schools(2010 -
2011
Tamilnadu 2.34 2.63 3.38 36575
Jharkhand 8.02 9.75 12.43 40343
Arunachal Pradesh 49.25 44.81 43.10 3950
Assam 12.13 14.98 15.37 42917
Madhya Pradesh 14.15 14.94 14.93 112078
Odisha 12.27 12.75 7.90 57179
All States (India) 9.33 8.86 8.31 1078407
Average Number of Class Rooms in Major States & Student –Class Room Ratio (SCR) (2011 –
2012)
State Primary
Schools
All Schools Govt. Schools Private
Schools
SCR
Bihar 2.3 3.8 3.7 7.2 79
Assam 2.4 3.0 3.1 4.4 31
Jammu & Kashmir 2.4 4.6 3.2 10.7 15
Jharkhand 2.4 4.5 4.0 10.4 33
Karnataka 2.6 5.4 4.4 8.0 22
Tamilnadu 4.3 6.6 4.7 10.3 26
Education Status Report- Tamil Nadu
19
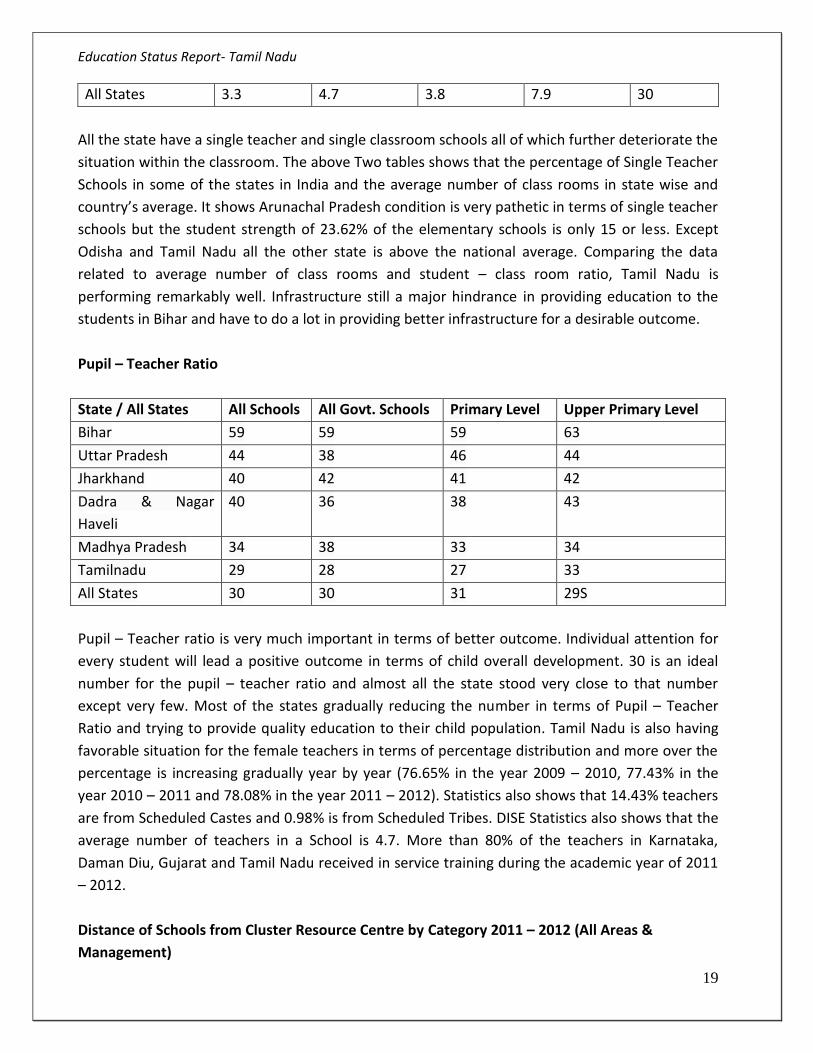
All States 3.3 4.7 3.8 7.9 30
All the state have a single teacher and single classroom schools all of which further deteriorate the
situation within the classroom. The above Two tables shows that the percentage of Single Teacher
Schools in some of the states in India and the average number of class rooms in state wise and
country’s average. It shows Arunachal Pradesh condition is very pathetic in terms of single teacher
schools but the student strength of 23.62% of the elementary schools is only 15 or less. Except
Odisha and Tamil Nadu all the other state is above the national average. Comparing the data
related to average number of class rooms and student – class room ratio, Tamil Nadu is
performing remarkably well. Infrastructure still a major hindrance in providing education to the
students in Bihar and have to do a lot in providing better infrastructure for a desirable outcome.
Pupil – Teacher Ratio
State / All States All Schools All Govt. Schools Primary Level Upper Primary Level
Bihar 59 59 59 63
Uttar Pradesh 44 38 46 44
Jharkhand 40 42 41 42
Dadra & Nagar
Haveli
40 36 38 43
Madhya Pradesh 34 38 33 34
Tamilnadu 29 28 27 33
All States 30 30 31 29S
Pupil – Teacher ratio is very much important in terms of better outcome. Individual attention for
every student will lead a positive outcome in terms of child overall development. 30 is an ideal
number for the pupil – teacher ratio and almost all the state stood very close to that number
except very few. Most of the states gradually reducing the number in terms of Pupil – Teacher
Ratio and trying to provide quality education to their child population. Tamil Nadu is also having
favorable situation for the female teachers in terms of percentage distribution and more over the
percentage is increasing gradually year by year (76.65% in the year 2009 – 2010, 77.43% in the
year 2010 – 2011 and 78.08% in the year 2011 – 2012). Statistics also shows that 14.43% teachers
are from Scheduled Castes and 0.98% is from Scheduled Tribes. DISE Statistics also shows that the
average number of teachers in a School is 4.7. More than 80% of the teachers in Karnataka,
Daman Diu, Gujarat and Tamil Nadu received in service training during the academic year of 2011
– 2012.
Distance of Schools from Cluster Resource Centre by Category 2011 – 2012 (All Areas &
Management)
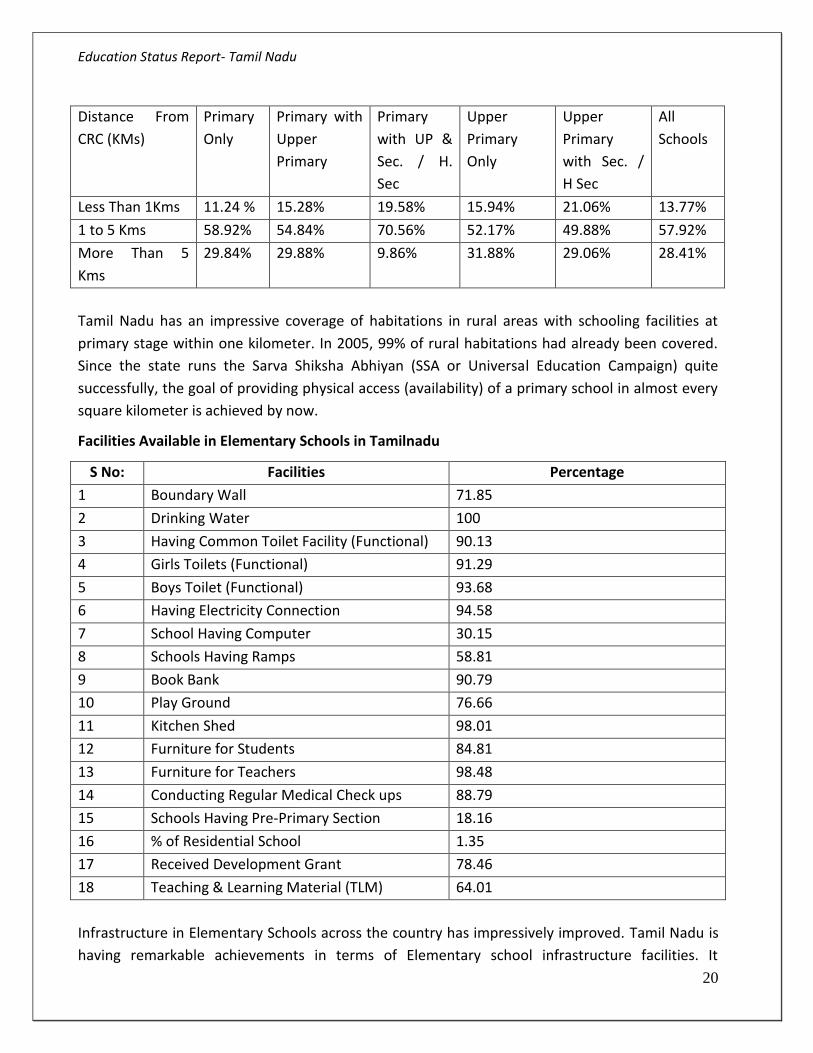
Education Status Report- Tamil Nadu
20
Distance From
CRC (KMs)
Primary
Only
Primary with
Upper
Primary
Primary
with UP &
Sec. / H.
Sec
Upper
Primary
Only
Upper
Primary
with Sec. /
H Sec
All
Schools
Less Than 1Kms 11.24 % 15.28% 19.58% 15.94% 21.06% 13.77%
1 to 5 Kms 58.92% 54.84% 70.56% 52.17% 49.88% 57.92%
More Than 5
Kms
29.84% 29.88% 9.86% 31.88% 29.06% 28.41%
Tamil Nadu has an impressive coverage of habitations in rural areas with schooling facilities at
primary stage within one kilometer. In 2005, 99% of rural habitations had already been covered.
Since the state runs the Sarva Shiksha Abhiyan (SSA or Universal Education Campaign) quite
successfully, the goal of providing physical access (availability) of a primary school in almost every
square kilometer is achieved by now.
Facilities Available in Elementary Schools in Tamilnadu
S No: Facilities Percentage
1 Boundary Wall 71.85
2 Drinking Water 100
3 Having Common Toilet Facility (Functional) 90.13
4 Girls Toilets (Functional) 91.29
5 Boys Toilet (Functional) 93.68
6 Having Electricity Connection 94.58
7 School Having Computer 30.15
8 Schools Having Ramps 58.81
9 Book Bank 90.79
10 Play Ground 76.66
11 Kitchen Shed 98.01
12 Furniture for Students 84.81
13 Furniture for Teachers 98.48
14 Conducting Regular Medical Check ups 88.79
15 Schools Having Pre-Primary Section 18.16
16 % of Residential School 1.35
17 Received Development Grant 78.46
18 Teaching & Learning Material (TLM) 64.01
Infrastructure in Elementary Schools across the country has impressively improved. Tamil Nadu is
having remarkable achievements in terms of Elementary school infrastructure facilities. It

Education Status Report- Tamil Nadu
21
definitely helps the smooth shift to quality education once the Government completes their task
in providing reasonable infrastructure across the state.
7. Educational Expenditure15
During the Eleventh Five-Year Plan the Government’s (GOI and states) budget for SSA increased
nearly 3-fold from 21,360 Crores in FY 2007-08 to 61,734 Crores in FY2011-12. In this period, the
per student allocation has more than tripled from an India average of Rs. 1,598 in FY 2007 – 2008
to Rs. 4,746 in FY2011 – 2012. Allocations are keeping in pace but only 61 percent of allocation
were spent in FY 2011 – 2012. Comparison between FY 2007 – 2008 and 2011 – 2012 the former
spent 87 % of the total allocation and the later spent 62%. There are wide variations in per-
student allocation across states. In Tamil Nadu per-student allocation is Rs. 4,47516 in FY 2011 –
2012.
8. ASER 201217
and Tamil Nadu
Reading
% Children by Class and Reading Level All Schools – 2012
Standard Not Even Letter Letter Word Level – 1 (Std I Text) Level 2 (Std II Text) Total
I 56.6 29.6 9.9 3.0 0.8 100
II 24.8 31.6 31.6 9.1 2.9 100
III 10.8 19.6 39.5 21.9 8.2 100
IV 5.5 11.0 34.7 30.3 18.6 100
V 3.3 6.6 26.6 33.6 29.9 100
VI 2.5 3.8 16.2 30.9 46.6 100
VII 1.2 2.5 13.9 28.2 54.2 100
VIII 0.6 1.6 10.0 22.5 65.2 100
Total 12.6 12.8 22.7 23.0 29.0 100
Reading and Comprehension in English
% Children by Class and Reading Level in English All Schools – 2012
Standard Not Even Capital Letter Capital Letter Small Word Simple Words Easy
Sentences
Tota
l
I 58.1 15.8 19.6 5.6 0.9 100
II 28.2 22.7 31.0 13.3 4.9 100
15
http://mospi.nic.in/mospi_new/upload/sel_socio_eco_stats_ind_2001_28oct11.pdf 16
http://www.academia.edu/2948921/Sarva_Shiksa_Abhiyan_SSA_2013-14 17
The ASER study, facilitated by non-governmental organization Pratham, seeks to look at learning outcomes in
children in the age group 6 to 14, by testing their ability in reading and arithmetic, using simple tests.
Education Status Report- Tamil Nadu
22
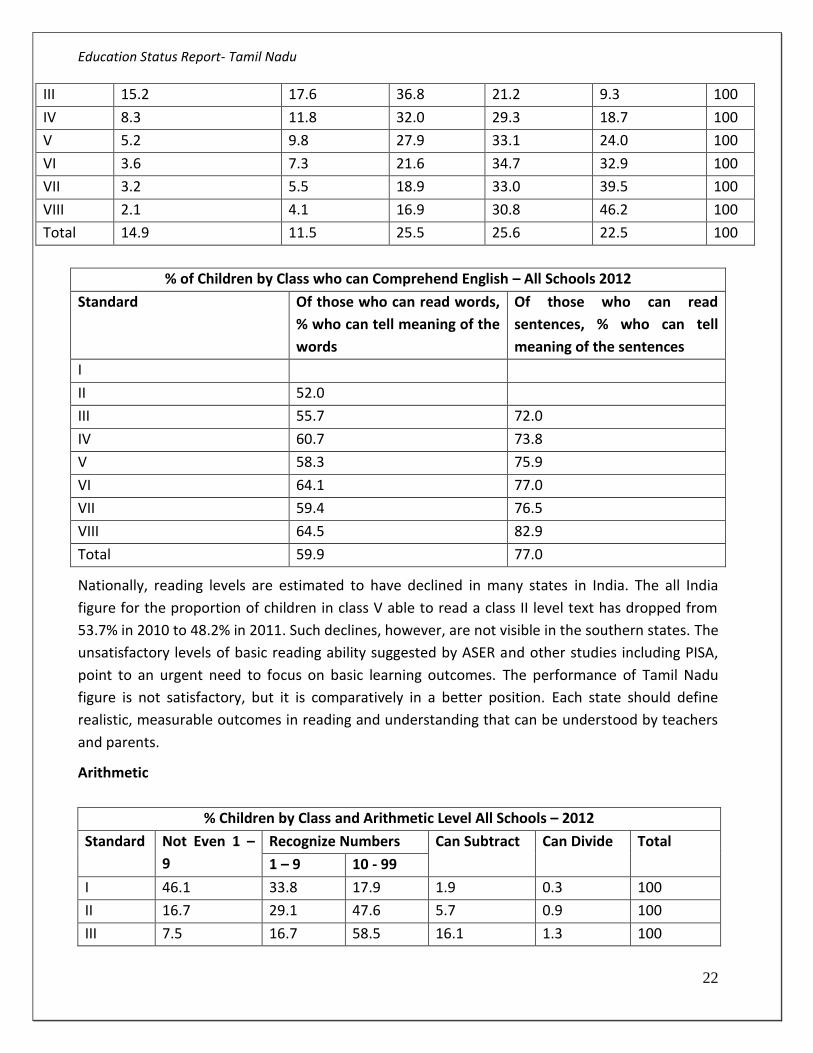
III 15.2 17.6 36.8 21.2 9.3 100
IV 8.3 11.8 32.0 29.3 18.7 100
V 5.2 9.8 27.9 33.1 24.0 100
VI 3.6 7.3 21.6 34.7 32.9 100
VII 3.2 5.5 18.9 33.0 39.5 100
VIII 2.1 4.1 16.9 30.8 46.2 100
Total 14.9 11.5 25.5 25.6 22.5 100
% of Children by Class who can Comprehend English – All Schools 2012
Standard Of those who can read words,
% who can tell meaning of the
words
Of those who can read
sentences, % who can tell
meaning of the sentences
I
II 52.0
III 55.7 72.0
IV 60.7 73.8
V 58.3 75.9
VI 64.1 77.0
VII 59.4 76.5
VIII 64.5 82.9
Total 59.9 77.0
Nationally, reading levels are estimated to have declined in many states in India. The all India
figure for the proportion of children in class V able to read a class II level text has dropped from
53.7% in 2010 to 48.2% in 2011. Such declines, however, are not visible in the southern states. The
unsatisfactory levels of basic reading ability suggested by ASER and other studies including PISA,
point to an urgent need to focus on basic learning outcomes. The performance of Tamil Nadu
figure is not satisfactory, but it is comparatively in a better position. Each state should define
realistic, measurable outcomes in reading and understanding that can be understood by teachers
and parents.
Arithmetic
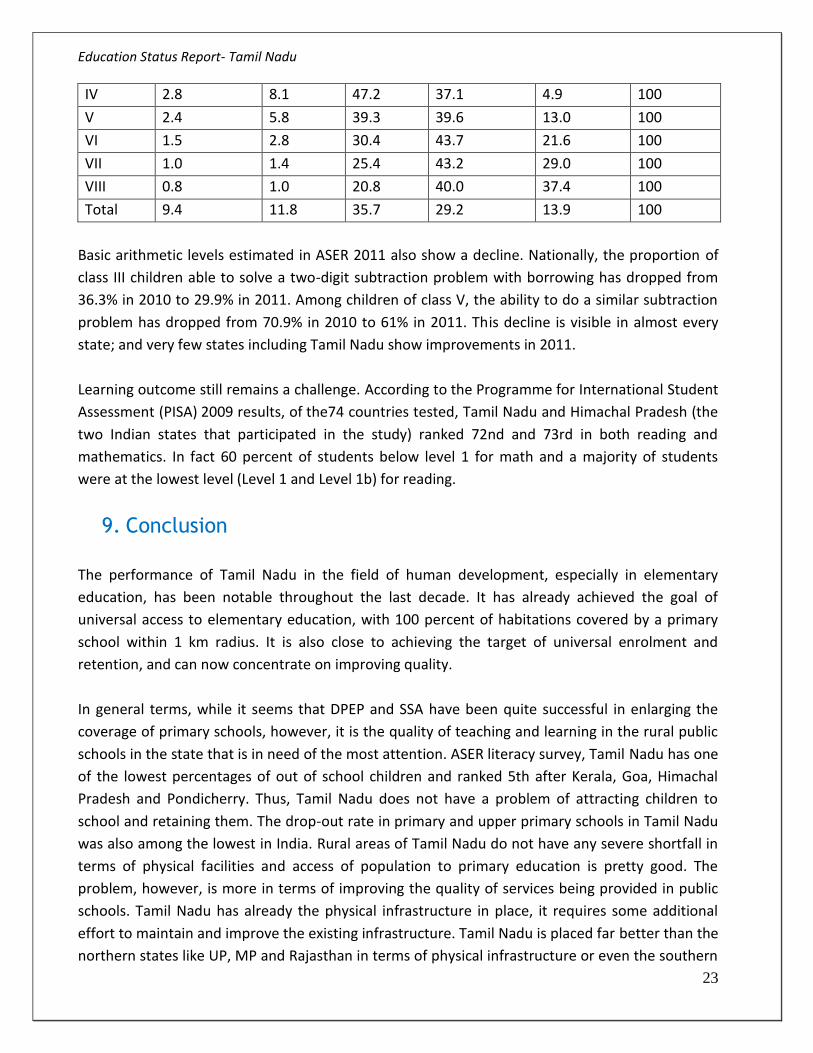
% Children by Class and Arithmetic Level All Schools – 2012
Standard Not Even 1 –
9
Recognize Numbers Can Subtract Can Divide Total
1 – 9 10 - 99
I 46.1 33.8 17.9 1.9 0.3 100
II 16.7 29.1 47.6 5.7 0.9 100
III 7.5 16.7 58.5 16.1 1.3 100
Education Status Report- Tamil Nadu
23
IV 2.8 8.1 47.2 37.1 4.9 100
V 2.4 5.8 39.3 39.6 13.0 100
VI 1.5 2.8 30.4 43.7 21.6 100
VII 1.0 1.4 25.4 43.2 29.0 100
VIII 0.8 1.0 20.8 40.0 37.4 100
Total 9.4 11.8 35.7 29.2 13.9 100
Basic arithmetic levels estimated in ASER 2011 also show a decline. Nationally, the proportion of
class III children able to solve a two-digit subtraction problem with borrowing has dropped from
36.3% in 2010 to 29.9% in 2011. Among children of class V, the ability to do a similar subtraction
problem has dropped from 70.9% in 2010 to 61% in 2011. This decline is visible in almost every
state; and very few states including Tamil Nadu show improvements in 2011.
Learning outcome still remains a challenge. According to the Programme for International Student
Assessment (PISA) 2009 results, of the74 countries tested, Tamil Nadu and Himachal Pradesh (the
two Indian states that participated in the study) ranked 72nd and 73rd in both reading and
mathematics. In fact 60 percent of students below level 1 for math and a majority of students
were at the lowest level (Level 1 and Level 1b) for reading.
9. Conclusion
The performance of Tamil Nadu in the field of human development, especially in elementary
education, has been notable throughout the last decade. It has already achieved the goal of
universal access to elementary education, with 100 percent of habitations covered by a primary
school within 1 km radius. It is also close to achieving the target of universal enrolment and
retention, and can now concentrate on improving quality.
In general terms, while it seems that DPEP and SSA have been quite successful in enlarging the
coverage of primary schools, however, it is the quality of teaching and learning in the rural public
schools in the state that is in need of the most attention. ASER literacy survey, Tamil Nadu has one
of the lowest percentages of out of school children and ranked 5th after Kerala, Goa, Himachal
Pradesh and Pondicherry. Thus, Tamil Nadu does not have a problem of attracting children to
school and retaining them. The drop-out rate in primary and upper primary schools in Tamil Nadu
was also among the lowest in India. Rural areas of Tamil Nadu do not have any severe shortfall in
terms of physical facilities and access of population to primary education is pretty good. The
problem, however, is more in terms of improving the quality of services being provided in public
schools. Tamil Nadu has already the physical infrastructure in place, it requires some additional
effort to maintain and improve the existing infrastructure. Tamil Nadu is placed far better than the
northern states like UP, MP and Rajasthan in terms of physical infrastructure or even the southern
Education Status Report- Tamil Nadu
24
states, such as Karnataka and Andhra Pradesh. This is not surprising because the state has been
spending considerably higher amounts per capita than most states for the past several years.
Tamil Nadu needs to pay greater attention to two key aspects: one, to get all the children from the
poor families and special focus groups, such as girls and children from the SC and ST communities
that are out of school into school and two, to strive much harder to attain and sustain higher
levels of quality in their primary schools. The quality can achieve through a drastic changes in the
learning methods and techniques, making classroom activities more experimental and enjoyable
for the children, improved teacher training, and of course upgrading the school infrastructure.