Embed Size (px)
Citation preview

2 | P a g e
II nnii tt
ii aatt ii
nngg
CCoo
vvee
rr aagg
ee
tt iiaa
tt iinn
gg CC
oovv
eerr aa
ggee
tt iinn
gg CC
oovv
eerr aa
ggee
gg CC
oovv
eerr aa
ggee
CCoo
vvee
rr aagg
ee
vvee
rr aagg
ee
rr aagg
ee
ggee
NCL Industries Ltd
II nn
ii ttii aa
ttii nn
gg CC
oovv
eerraa
ggee
–– 11
55 SS
eepp
ttee
mmbb
eerr 22
0011
55
4
Recommendation BUY Cementing the Turnaround
NCL Industries Limited is a south based small cement company. The company operates through four related business divisions such as cement, cement boards, ready-mix-concrete and energy (hydro power) division. Its brand “Nagarjuna” enjoys a brand loyalty and a premium position in the region. NCL operates two cement plants, one at Telangana and another at Andhra Pradesh State with combine capacity of 1.95MT with cement contribution of 82% in the total sales. The company also has two hydro power plants situated in state of Andhra Pradesh and Karnataka with 7.5 MW and 8.25MW, respectively.
Investment Rationale:
The Southern market will drive slow and steady growth with prices holding at high levels The southern markets, specifically in Telangana and Andhra Pradesh have seen a strong pricing discipline in last the 6-9 months. Stable prices in the southern markets and cost control have contributed to a better performance of NCL and helped it to turn the corner. Southern region, which had witnessed the highest capacity addition of around 125 MT in the last five years, will see a considerable slowdown in fresh capacity addition by only 6 MTPA to 7 MTPA in the next two years.
Better utilization and realization through its product mix NCL has been in the cement market for nearly three decades and had established one of the largest networks of 1500 dealers to penetrate the southern region under the brand image of “Nagarjuna”. NCL is one of the few cement manufactures approved by Indian railway to produce and supply cement for railway sleepers. The company has added advantage of being one of the plants located just 40kms away to the proposed capital of Andhra Pradesh (Amaravati) and this will act as demand driver for the company. All in all, we feel NCL’s volume growth can be higher than the regional growth in demand for cement segment. This will help the company to improve utilization of plant and result in higher profitability.
Valuation
At the current market price (CMP) of Rs 92, the stock is trading at 3.8x its FY16E EV/EBITDA. We value NCL’s business at 5x FY16E EV/EBITDA and have arrived at a price target of Rs 131, implying an upside potential of 43% in a year. NCL looks like an attractive investment opportunity among small-cap stocks. We Initiate coverage on NCL Industries ltd with BUY Rating
CMP Rs 92
Target Price Rs 131
Sector Cement
Stock Details
BSE Code 502168
NSE Code NCLIND
Bloomberg Code NCLI IN
Market Cap (Rs cr) 338
Free Float (%) 49.6
52- wk HI/Lo (Rs) 113/30
Avg. volume BSE (Quarterly) 86,090
Face Value (Rs) 10
Dividend (FY 15) 0%
Shares o/s (Cr) 3.67
Relative Performance 1Mth 3Mth 1Yr
NCL -9.3% 57.7% 176.2%
Sensex -7.9% -2.7% -4.5%
Shareholding Pattern (%) 30th
June’15
Promoters Holding 50.4
Institutional (Incl. FII) 0.1
Corporate Bodies 7.3
Public & others 42.2
Varsha Bang 39268173 Research Analyst [email protected]
Year
Net Sales (Rs cr)
Growth (%)
EBITDA (Rs cr)
Margin (%)
Adj PAT (Rs cr)
Margin (%)
EPS (Rs) PE (x) $EV/ton EV/EBITDA
FY14 408.7 (3.0%) 28.0 6.9% (40.8) (10.0%) (11.7) (7.8) 41.5 19.0
FY15 533.9 30.6% 70.2 13.1% 8.9 1.7% 2.6 35.9 38.3 7.0
FY16E 628.9 17.8% 123.7 19.7% 52.7 8.4% 14.4 6.4 36.9 3.8
FY17E 716.4 13.9% 147.4 20.6% 74.7 10.4% 20.3 4.5 32.1 2.8
3 | P a g e
II nnii tt
ii aatt ii
nngg
CCoo
vvee
rr aagg
ee
tt iiaa
tt iinn
gg CC
oovv
eerr aa
ggee
tt iinn
gg CC
oovv
eerr aa
ggee
gg CC
oovv
eerr aa
ggee
CCoo
vvee
rr aagg
ee
vvee
rr aagg
ee
rr aagg
ee
ggee
NCL Industries Ltd
II nn
ii ttii aa
ttii nn
gg CC
oovv
eerraa
ggee
–– 11
55 SS
eepp
ttee
mmbb
eerr 22
0011
55
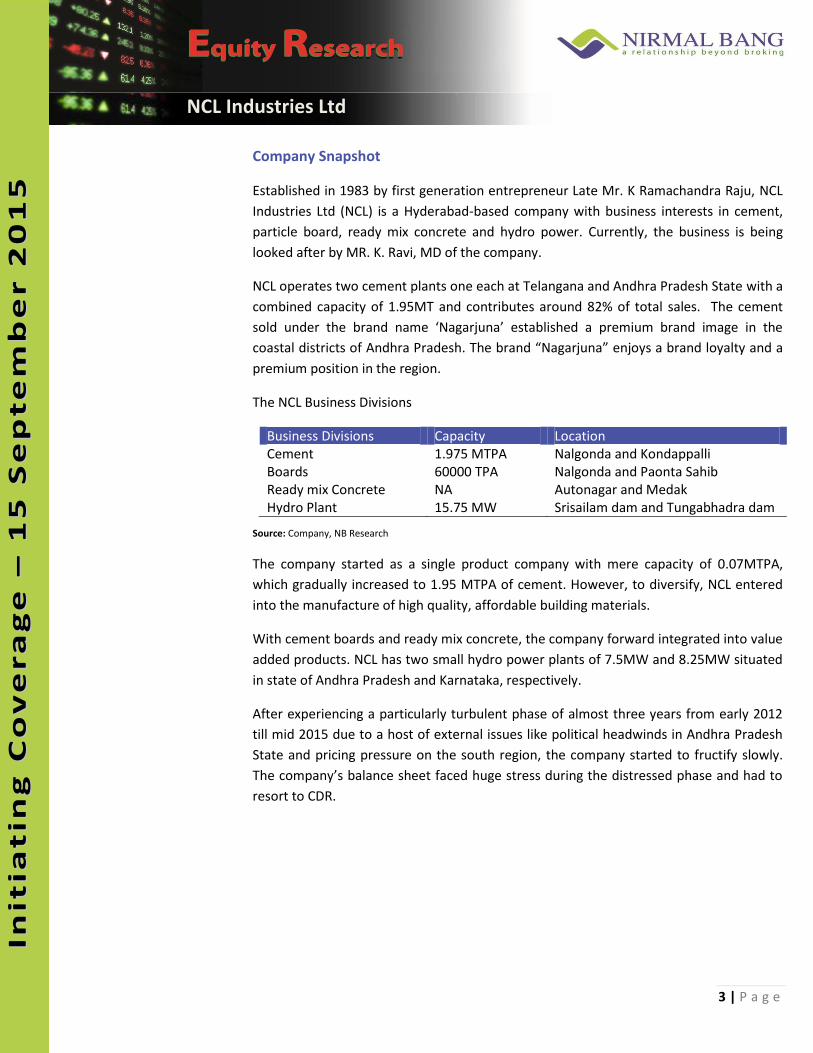
Company Snapshot
Established in 1983 by first generation entrepreneur Late Mr. K Ramachandra Raju, NCL
Industries Ltd (NCL) is a Hyderabad-based company with business interests in cement,
particle board, ready mix concrete and hydro power. Currently, the business is being
looked after by MR. K. Ravi, MD of the company.
NCL operates two cement plants one each at Telangana and Andhra Pradesh State with a
combined capacity of 1.95MT and contributes around 82% of total sales. The cement
sold under the brand name ‘Nagarjuna’ established a premium brand image in the
coastal districts of Andhra Pradesh. The brand “Nagarjuna” enjoys a brand loyalty and a
premium position in the region.
The NCL Business Divisions
Business Divisions Capacity Location Cement 1.975 MTPA Nalgonda and Kondappalli Boards 60000 TPA Nalgonda and Paonta Sahib Ready mix Concrete NA Autonagar and Medak Hydro Plant 15.75 MW Srisailam dam and Tungabhadra dam
Source: Company, NB Research
The company started as a single product company with mere capacity of 0.07MTPA,
which gradually increased to 1.95 MTPA of cement. However, to diversify, NCL entered
into the manufacture of high quality, affordable building materials.
With cement boards and ready mix concrete, the company forward integrated into value
added products. NCL has two small hydro power plants of 7.5MW and 8.25MW situated
in state of Andhra Pradesh and Karnataka, respectively.
After experiencing a particularly turbulent phase of almost three years from early 2012
till mid 2015 due to a host of external issues like political headwinds in Andhra Pradesh
State and pricing pressure on the south region, the company started to fructify slowly.
The company’s balance sheet faced huge stress during the distressed phase and had to
resort to CDR.

4 | P a g e
II nnii tt
ii aatt ii
nngg
CCoo
vvee
rr aagg
ee
tt iiaa
tt iinn
gg CC
oovv
eerr aa
ggee
tt iinn
gg CC
oovv
eerr aa
ggee
gg CC
oovv
eerr aa
ggee
CCoo
vvee
rr aagg
ee
vvee
rr aagg
ee
rr aagg
ee
ggee
NCL Industries Ltd
II nn
ii ttii aa
ttii nn
gg CC
oovv
eerraa
ggee
–– 11
55 SS
eepp
ttee
mmbb
eerr 22
0011
55
Investment Rationale:
The Southern market will drive slow and steady growth with prices holding at high
levels
Due to the cyclical nature of the cement industry, the cement prices have shown large
fluctuations in the last couple of years, which has given enough of ache to the existing
players in the southern region.
The southern markets has witnessed a serious downturn in cement prices during FY12-
15 , due to overcapacity, weakness in demand, slow growth in economy, slowdown in
the construction activity etc, which has impacting the demand for cement in southern
markets. Apart from this due to higher supply of cement the price remain under pressure
during the period. However, the above trend is changing as the cement prices have
raised sharply in the southern region in the last 6-9 months.
Stable Pricing continues……….. The southern markets, specifically in Telangana and Andhra Pradesh have seen a strong
pricing discipline in last the 6-9 months. Stable prices in the southern markets and cost
control have contributed to a better performance of NCL and helped it to turn the
corner.
Exhibit 2: Cement Prices In The Southern Region
Source: Company, NB Research
The cement industry in the southern India is stable and steadily growing due to demand,
supply and price stability. Southern region, which had witnessed the highest capacity
addition of around 125 MT in the last five years, will see a considerable slowdown in
fresh capacity addition by only 6 MTPA to 7 MTPA in the next two years.
5 | P a g e
II nnii tt
ii aatt ii
nngg
CCoo
vvee
rr aagg
ee
tt iiaa
tt iinn
gg CC
oovv
eerr aa
ggee
tt iinn
gg CC
oovv
eerr aa
ggee
gg CC
oovv
eerr aa
ggee
CCoo
vvee
rr aagg
ee
vvee
rr aagg
ee
rr aagg
ee
ggee
NCL Industries Ltd
II nn
ii ttii aa
ttii nn
gg CC
oovv
eerraa
ggee
–– 11
55 SS
eepp
ttee
mmbb
eerr 22
0011
55
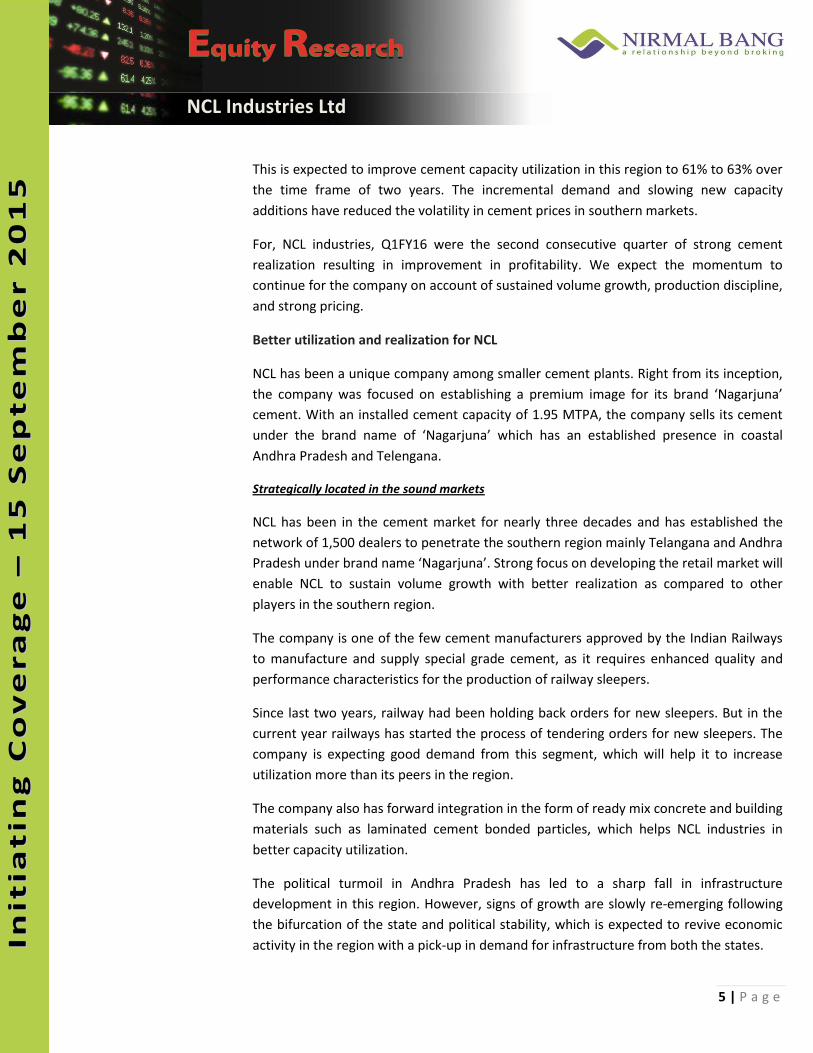
This is expected to improve cement capacity utilization in this region to 61% to 63% over
the time frame of two years. The incremental demand and slowing new capacity
additions have reduced the volatility in cement prices in southern markets.
For, NCL industries, Q1FY16 were the second consecutive quarter of strong cement
realization resulting in improvement in profitability. We expect the momentum to
continue for the company on account of sustained volume growth, production discipline,
and strong pricing.
Better utilization and realization for NCL
NCL has been a unique company among smaller cement plants. Right from its inception,
the company was focused on establishing a premium image for its brand ‘Nagarjuna’
cement. With an installed cement capacity of 1.95 MTPA, the company sells its cement
under the brand name of ‘Nagarjuna’ which has an established presence in coastal
Andhra Pradesh and Telengana.
Strategically located in the sound markets
NCL has been in the cement market for nearly three decades and has established the
network of 1,500 dealers to penetrate the southern region mainly Telangana and Andhra
Pradesh under brand name ‘Nagarjuna’. Strong focus on developing the retail market will
enable NCL to sustain volume growth with better realization as compared to other
players in the southern region.
The company is one of the few cement manufacturers approved by the Indian Railways
to manufacture and supply special grade cement, as it requires enhanced quality and
performance characteristics for the production of railway sleepers.
Since last two years, railway had been holding back orders for new sleepers. But in the
current year railways has started the process of tendering orders for new sleepers. The
company is expecting good demand from this segment, which will help it to increase
utilization more than its peers in the region.
The company also has forward integration in the form of ready mix concrete and building
materials such as laminated cement bonded particles, which helps NCL industries in
better capacity utilization.
The political turmoil in Andhra Pradesh has led to a sharp fall in infrastructure
development in this region. However, signs of growth are slowly re-emerging following
the bifurcation of the state and political stability, which is expected to revive economic
activity in the region with a pick-up in demand for infrastructure from both the states.
6 | P a g e
II nnii tt
ii aatt ii
nngg
CCoo
vvee
rr aagg
ee
tt iiaa
tt iinn
gg CC
oovv
eerr aa
ggee
tt iinn
gg CC
oovv
eerr aa
ggee
gg CC
oovv
eerr aa
ggee
CCoo
vvee
rr aagg
ee
vvee
rr aagg
ee
rr aagg
ee
ggee
NCL Industries Ltd
II nn
ii ttii aa
ttii nn
gg CC
oovv
eerraa
ggee
–– 11
55 SS
eepp
ttee
mmbb
eerr 22
0011
55
NCL has the added advantage of being one of the plants close to the proposed capital of
Andhra Pradesh (Amaravati). The new capital will require a lot of infrastructure
development, which can create additional demand for cement.
One of NCL’s plants is located just 40 km away from the proposed capital and will act as
demand driver for the company. All in all, we feel NCL’s volume growth can be higher
than the regional growth in demand for cement. This will help the company to improve
utilization of plant and result in higher profitability.
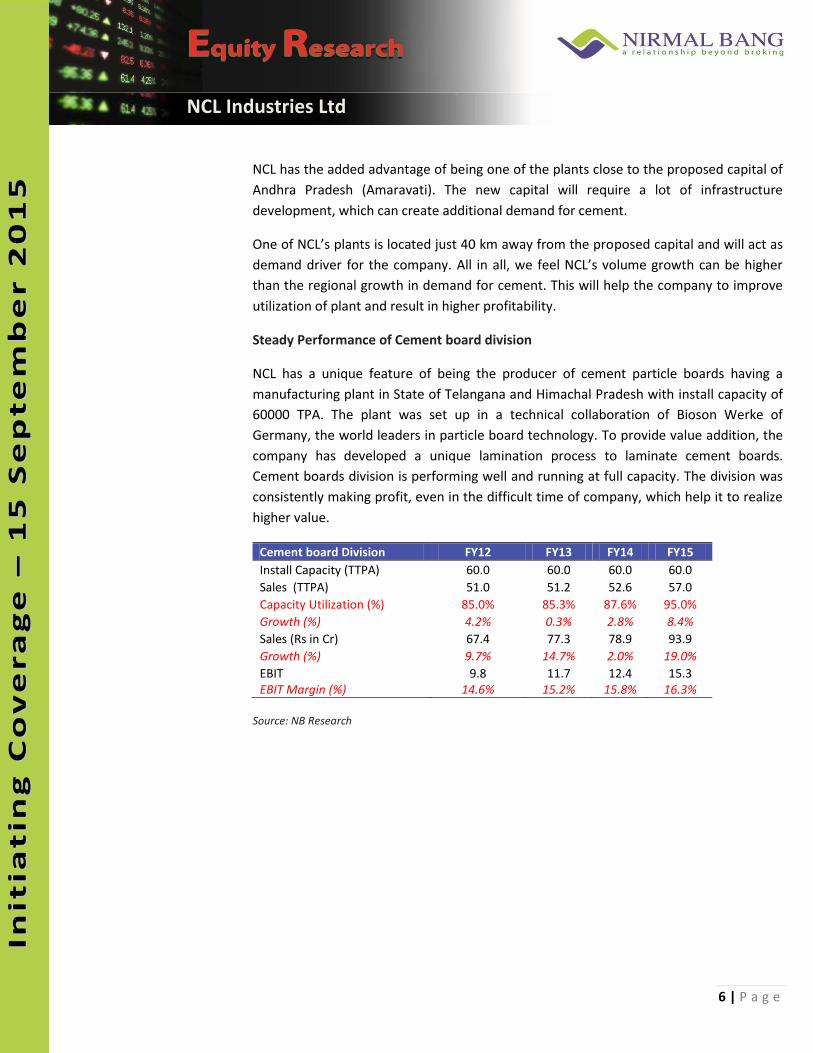
Steady Performance of Cement board division
NCL has a unique feature of being the producer of cement particle boards having a
manufacturing plant in State of Telangana and Himachal Pradesh with install capacity of
60000 TPA. The plant was set up in a technical collaboration of Bioson Werke of
Germany, the world leaders in particle board technology. To provide value addition, the
company has developed a unique lamination process to laminate cement boards.
Cement boards division is performing well and running at full capacity. The division was
consistently making profit, even in the difficult time of company, which help it to realize
higher value.
Cement board Division FY12 FY13 FY14 FY15
Install Capacity (TTPA) 60.0 60.0 60.0 60.0
Sales (TTPA) 51.0 51.2 52.6 57.0
Capacity Utilization (%) 85.0% 85.3% 87.6% 95.0%
Growth (%) 4.2% 0.3% 2.8% 8.4%
Sales (Rs in Cr) 67.4 77.3 78.9 93.9
Growth (%) 9.7% 14.7% 2.0% 19.0%
EBIT 9.8 11.7 12.4 15.3 EBIT Margin (%) 14.6% 15.2% 15.8% 16.3%
Source: NB Research
7 | P a g e
II nnii tt
ii aatt ii
nngg
CCoo
vvee
rr aagg
ee
tt iiaa
tt iinn
gg CC
oovv
eerr aa
ggee
tt iinn
gg CC
oovv
eerr aa
ggee
gg CC
oovv
eerr aa
ggee
CCoo
vvee
rr aagg
ee
vvee
rr aagg
ee
rr aagg
ee
ggee
NCL Industries Ltd
II nn
ii ttii aa
ttii nn
gg CC
oovv
eerraa
ggee
–– 11
55 SS
eepp
ttee
mmbb
eerr 22
0011
55
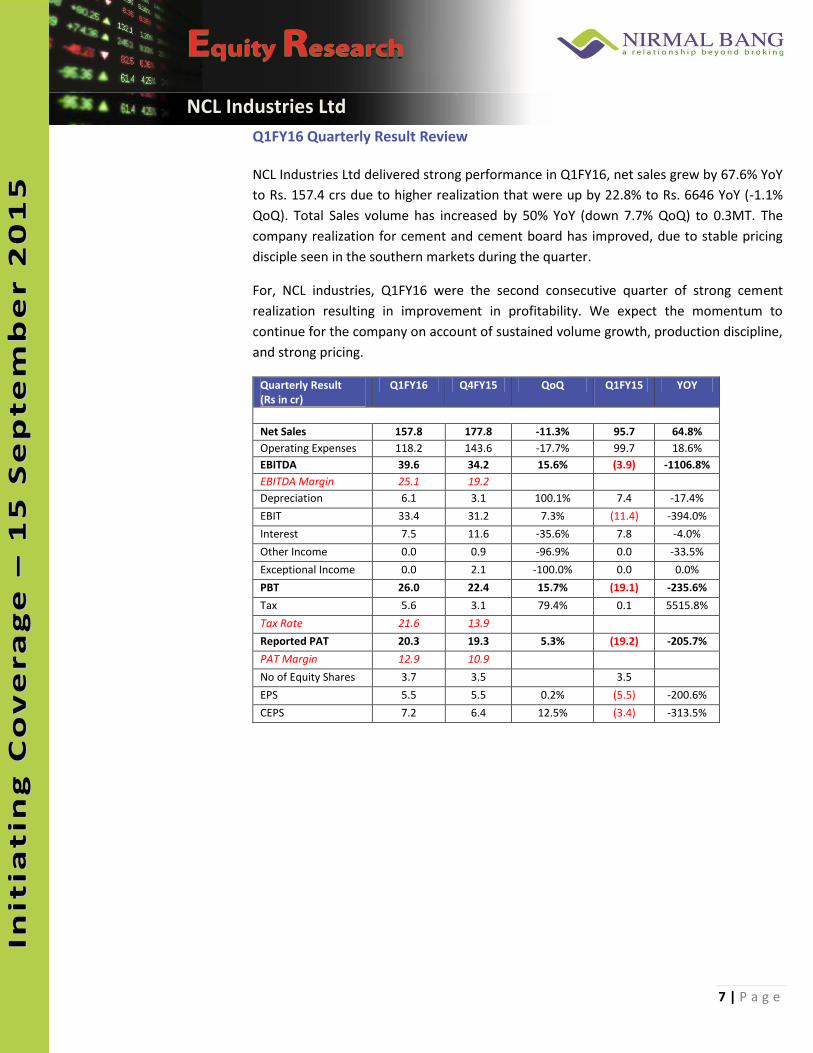
Q1FY16 Quarterly Result Review NCL Industries Ltd delivered strong performance in Q1FY16, net sales grew by 67.6% YoY
to Rs. 157.4 crs due to higher realization that were up by 22.8% to Rs. 6646 YoY (-1.1%
QoQ). Total Sales volume has increased by 50% YoY (down 7.7% QoQ) to 0.3MT. The
company realization for cement and cement board has improved, due to stable pricing
disciple seen in the southern markets during the quarter.
For, NCL industries, Q1FY16 were the second consecutive quarter of strong cement
realization resulting in improvement in profitability. We expect the momentum to
continue for the company on account of sustained volume growth, production discipline,
and strong pricing.
Quarterly Result (Rs in cr)
Q1FY16 Q4FY15 QoQ Q1FY15 YOY
Net Sales 157.8 177.8 -11.3% 95.7 64.8%
Operating Expenses 118.2 143.6 -17.7% 99.7 18.6%
EBITDA 39.6 34.2 15.6% (3.9) -1106.8%
EBITDA Margin 25.1 19.2
Depreciation 6.1 3.1 100.1% 7.4 -17.4%
EBIT 33.4 31.2 7.3% (11.4) -394.0%
Interest 7.5 11.6 -35.6% 7.8 -4.0%
Other Income 0.0 0.9 -96.9% 0.0 -33.5%
Exceptional Income 0.0 2.1 -100.0% 0.0 0.0%
PBT 26.0 22.4 15.7% (19.1) -235.6%
Tax 5.6 3.1 79.4% 0.1 5515.8%
Tax Rate 21.6 13.9
Reported PAT 20.3 19.3 5.3% (19.2) -205.7%
PAT Margin 12.9 10.9
No of Equity Shares 3.7 3.5 3.5
EPS 5.5 5.5 0.2% (5.5) -200.6%
CEPS 7.2 6.4 12.5% (3.4) -313.5%
8 | P a g e
II nnii tt
ii aatt ii
nngg
CCoo
vvee
rr aagg
ee
tt iiaa
tt iinn
gg CC
oovv
eerr aa
ggee
tt iinn
gg CC
oovv
eerr aa
ggee
gg CC
oovv
eerr aa
ggee
CCoo
vvee
rr aagg
ee
vvee
rr aagg
ee
rr aagg
ee
ggee
NCL Industries Ltd
II nn
ii ttii aa
ttii nn
gg CC
oovv
eerraa
ggee
–– 11
55 SS
eepp
ttee
mmbb
eerr 22
0011
55
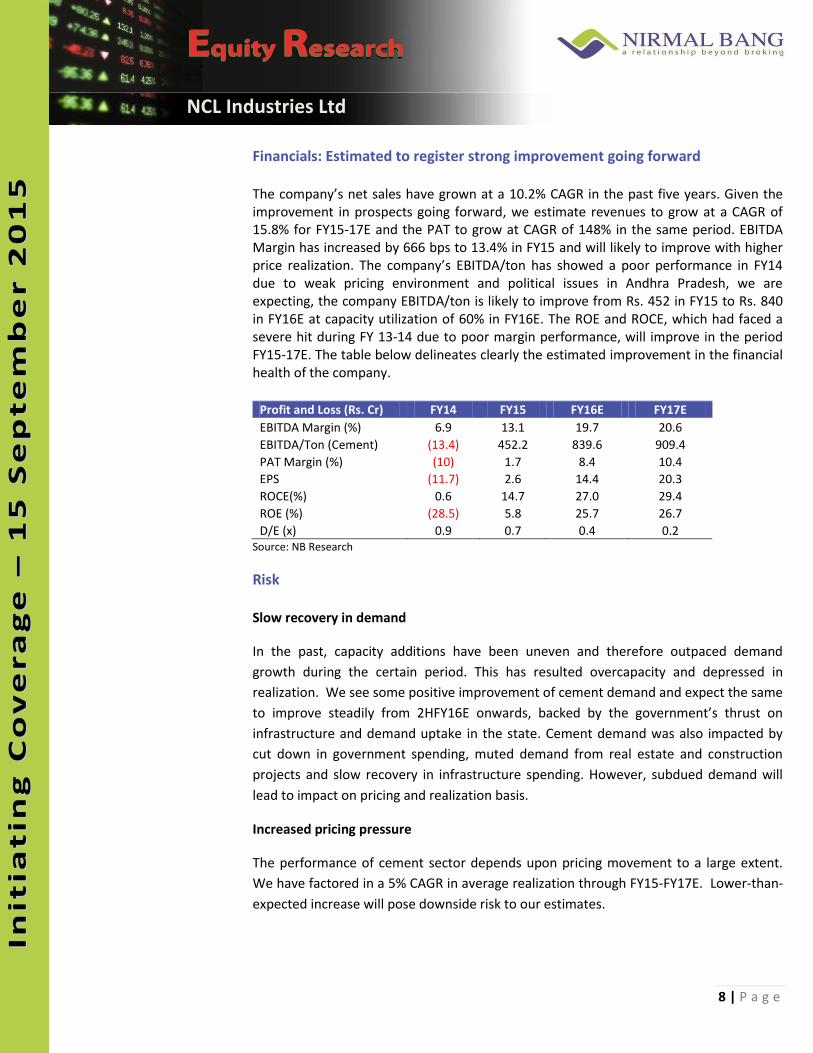
Financials: Estimated to register strong improvement going forward The company’s net sales have grown at a 10.2% CAGR in the past five years. Given the improvement in prospects going forward, we estimate revenues to grow at a CAGR of 15.8% for FY15-17E and the PAT to grow at CAGR of 148% in the same period. EBITDA Margin has increased by 666 bps to 13.4% in FY15 and will likely to improve with higher price realization. The company’s EBITDA/ton has showed a poor performance in FY14 due to weak pricing environment and political issues in Andhra Pradesh, we are expecting, the company EBITDA/ton is likely to improve from Rs. 452 in FY15 to Rs. 840 in FY16E at capacity utilization of 60% in FY16E. The ROE and ROCE, which had faced a severe hit during FY 13-14 due to poor margin performance, will improve in the period FY15-17E. The table below delineates clearly the estimated improvement in the financial health of the company.
Profit and Loss (Rs. Cr) FY14 FY15 FY16E FY17E
EBITDA Margin (%) 6.9 13.1 19.7 20.6
EBITDA/Ton (Cement) (13.4) 452.2 839.6 909.4
PAT Margin (%) (10) 1.7 8.4 10.4
EPS (11.7) 2.6 14.4 20.3
ROCE(%) 0.6 14.7 27.0 29.4
ROE (%) (28.5) 5.8 25.7 26.7
D/E (x) 0.9 0.7 0.4 0.2 Source: NB Research
Risk Slow recovery in demand
In the past, capacity additions have been uneven and therefore outpaced demand
growth during the certain period. This has resulted overcapacity and depressed in
realization. We see some positive improvement of cement demand and expect the same
to improve steadily from 2HFY16E onwards, backed by the government’s thrust on
infrastructure and demand uptake in the state. Cement demand was also impacted by
cut down in government spending, muted demand from real estate and construction
projects and slow recovery in infrastructure spending. However, subdued demand will
lead to impact on pricing and realization basis.
Increased pricing pressure
The performance of cement sector depends upon pricing movement to a large extent.
We have factored in a 5% CAGR in average realization through FY15-FY17E. Lower-than-
expected increase will pose downside risk to our estimates.
9 | P a g e
II nnii tt
ii aatt ii
nngg
CCoo
vvee
rr aagg
ee
tt iiaa
tt iinn
gg CC
oovv
eerr aa
ggee
tt iinn
gg CC
oovv
eerr aa
ggee
gg CC
oovv
eerr aa
ggee
CCoo
vvee
rr aagg
ee
vvee
rr aagg
ee
rr aagg
ee
ggee
NCL Industries Ltd
II nn
ii ttii aa
ttii nn
gg CC
oovv
eerraa
ggee
–– 11
55 SS
eepp
ttee
mmbb
eerr 22
0011
55
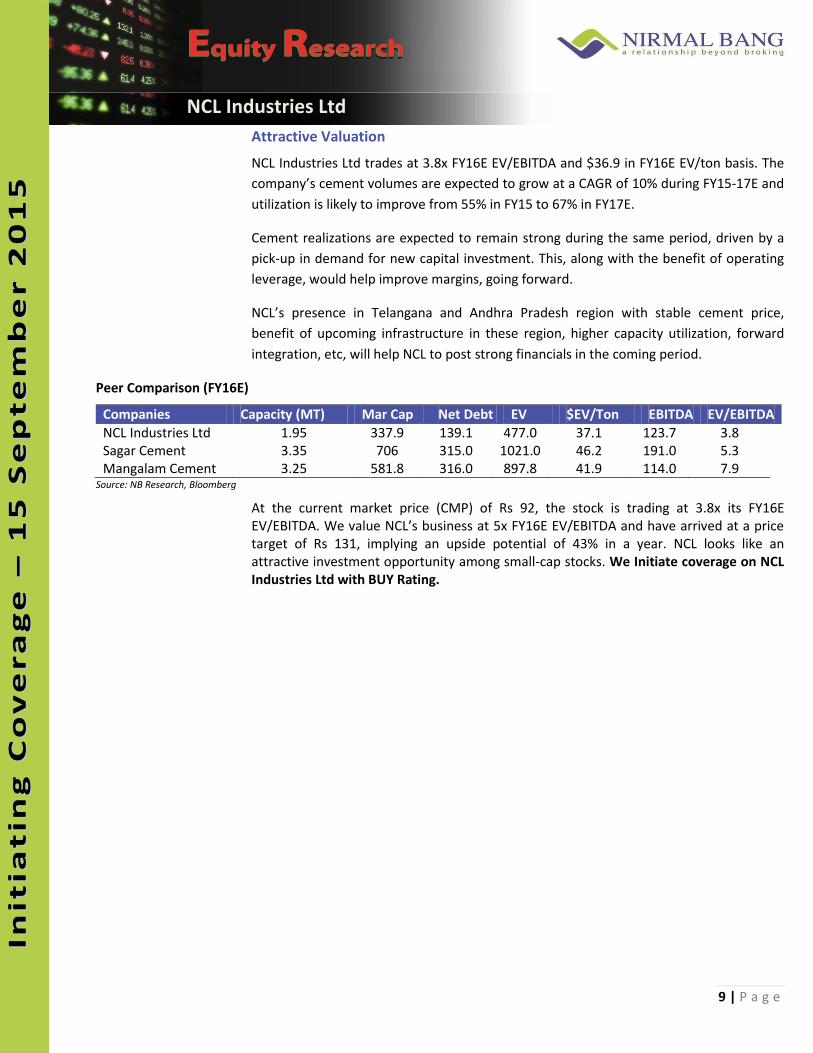
Attractive Valuation
NCL Industries Ltd trades at 3.8x FY16E EV/EBITDA and $36.9 in FY16E EV/ton basis. The
company’s cement volumes are expected to grow at a CAGR of 10% during FY15-17E and
utilization is likely to improve from 55% in FY15 to 67% in FY17E.
Cement realizations are expected to remain strong during the same period, driven by a
pick-up in demand for new capital investment. This, along with the benefit of operating
leverage, would help improve margins, going forward.
NCL’s presence in Telangana and Andhra Pradesh region with stable cement price,
benefit of upcoming infrastructure in these region, higher capacity utilization, forward
integration, etc, will help NCL to post strong financials in the coming period.
Peer Comparison (FY16E)
Companies Capacity (MT) Mar Cap Net Debt EV $EV/Ton EBITDA EV/EBITDA
NCL Industries Ltd 1.95 337.9 139.1 477.0 37.1 123.7 3.8 Sagar Cement 3.35 706 315.0 1021.0 46.2 191.0 5.3 Mangalam Cement 3.25 581.8 316.0 897.8 41.9 114.0 7.9
Source: NB Research, Bloomberg
At the current market price (CMP) of Rs 92, the stock is trading at 3.8x its FY16E EV/EBITDA. We value NCL’s business at 5x FY16E EV/EBITDA and have arrived at a price target of Rs 131, implying an upside potential of 43% in a year. NCL looks like an attractive investment opportunity among small-cap stocks. We Initiate coverage on NCL Industries Ltd with BUY Rating.
10 | P a g e
II nnii tt
ii aatt ii
nngg
CCoo
vvee
rr aagg
ee
tt iiaa
tt iinn
gg CC
oovv
eerr aa
ggee
tt iinn
gg CC
oovv
eerr aa
ggee
gg CC
oovv
eerr aa
ggee
CCoo
vvee
rr aagg
ee
vvee
rr aagg
ee
rr aagg
ee
ggee
NCL Industries Ltd
II nn
ii ttii aa
ttii nn
gg CC
oovv
eerraa
ggee
–– 11
55 SS
eepp
ttee
mmbb
eerr 22
0011
55
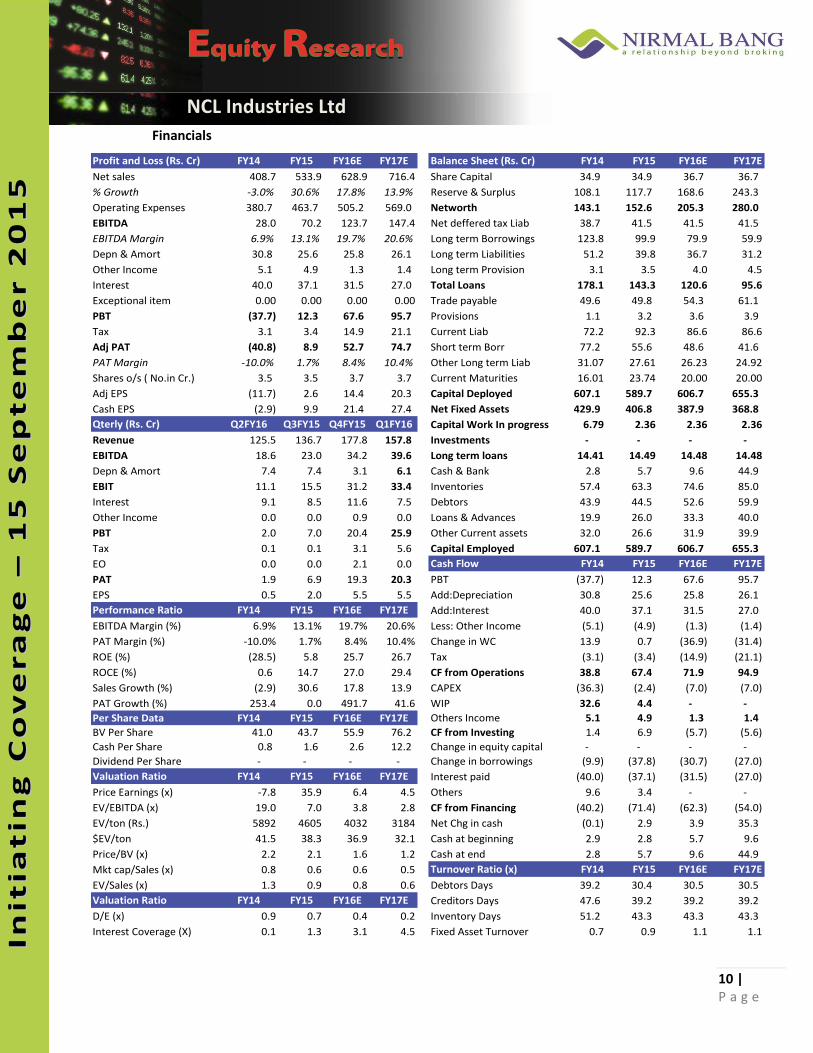
Financials
Profit and Loss (Rs. Cr) FY14 FY15 FY16E FY17E Balance Sheet (Rs. Cr) FY14 FY15 FY16E FY17E
Net sales 408.7 533.9 628.9 716.4 Share Capital 34.9 34.9 36.7 36.7
% Growth -3.0% 30.6% 17.8% 13.9% Reserve & Surplus 108.1 117.7 168.6 243.3
Operating Expenses 380.7 463.7 505.2 569.0 Networth 143.1 152.6 205.3 280.0
EBITDA 28.0 70.2 123.7 147.4 Net deffered tax Liab 38.7 41.5 41.5 41.5
EBITDA Margin 6.9% 13.1% 19.7% 20.6% Long term Borrowings 123.8 99.9 79.9 59.9
Depn & Amort 30.8 25.6 25.8 26.1 Long term Liabilities 51.2 39.8 36.7 31.2
Other Income 5.1 4.9 1.3 1.4 Long term Provision 3.1 3.5 4.0 4.5
Interest 40.0 37.1 31.5 27.0 Total Loans 178.1 143.3 120.6 95.6
Exceptional item 0.00 0.00 0.00 0.00 Trade payable 49.6 49.8 54.3 61.1
PBT (37.7) 12.3 67.6 95.7 Provisions 1.1 3.2 3.6 3.9
Tax 3.1 3.4 14.9 21.1 Current Liab 72.2 92.3 86.6 86.6
Adj PAT (40.8) 8.9 52.7 74.7 Short term Borr 77.2 55.6 48.6 41.6
PAT Margin -10.0% 1.7% 8.4% 10.4% Other Long term Liab 31.07 27.61 26.23 24.92
Shares o/s ( No.in Cr.) 3.5 3.5 3.7 3.7 Current Maturities 16.01 23.74 20.00 20.00
Adj EPS (11.7) 2.6 14.4 20.3 Capital Deployed 607.1 589.7 606.7 655.3
Cash EPS (2.9) 9.9 21.4 27.4 Net Fixed Assets 429.9 406.8 387.9 368.8
Qterly (Rs. Cr) Q2FY16 Q3FY15 Q4FY15 Q1FY16 Capital Work In progress 6.79 2.36 2.36 2.36
Revenue 125.5 136.7 177.8 157.8 Investments - - - -
EBITDA 18.6 23.0 34.2 39.6 Long term loans 14.41 14.49 14.48 14.48
Depn & Amort 7.4 7.4 3.1 6.1 Cash & Bank 2.8 5.7 9.6 44.9
EBIT 11.1 15.5 31.2 33.4 Inventories 57.4 63.3 74.6 85.0
Interest 9.1 8.5 11.6 7.5 Debtors 43.9 44.5 52.6 59.9
Other Income 0.0 0.0 0.9 0.0 Loans & Advances 19.9 26.0 33.3 40.0
PBT 2.0 7.0 20.4 25.9 Other Current assets 32.0 26.6 31.9 39.9
Tax 0.1 0.1 3.1 5.6 Capital Employed 607.1 589.7 606.7 655.3
EO 0.0 0.0 2.1 0.0 Cash Flow FY14 FY15 FY16E FY17E
PAT 1.9 6.9 19.3 20.3 PBT (37.7) 12.3 67.6 95.7
EPS 0.5 2.0 5.5 5.5 Add:Depreciation 30.8 25.6 25.8 26.1
Performance Ratio FY14 FY15 FY16E FY17E Add:Interest 40.0 37.1 31.5 27.0
EBITDA Margin (%) 6.9% 13.1% 19.7% 20.6% Less: Other Income (5.1) (4.9) (1.3) (1.4)
PAT Margin (%) -10.0% 1.7% 8.4% 10.4% Change in WC 13.9 0.7 (36.9) (31.4)
ROE (%) (28.5) 5.8 25.7 26.7 Tax (3.1) (3.4) (14.9) (21.1)
ROCE (%) 0.6 14.7 27.0 29.4 CF from Operations 38.8 67.4 71.9 94.9
Sales Growth (%) (2.9) 30.6 17.8 13.9 CAPEX (36.3) (2.4) (7.0) (7.0)
PAT Growth (%) 253.4 0.0 491.7 41.6 WIP 32.6 4.4 - -
Per Share Data FY14 FY15 FY16E FY17E Others Income 5.1 4.9 1.3 1.4
BV Per Share 41.0 43.7 55.9 76.2 CF from Investing 1.4 6.9 (5.7) (5.6)
Cash Per Share 0.8 1.6 2.6 12.2 Change in equity capital - - - -
Dividend Per Share - - - - Change in borrowings (9.9) (37.8) (30.7) (27.0)
Valuation Ratio FY14 FY15 FY16E FY17E Interest paid (40.0) (37.1) (31.5) (27.0)
Price Earnings (x) -7.8 35.9 6.4 4.5 Others 9.6 3.4 - -
EV/EBITDA (x) 19.0 7.0 3.8 2.8 CF from Financing (40.2) (71.4) (62.3) (54.0)
EV/ton (Rs.) 5892 4605 4032 3184 Net Chg in cash (0.1) 2.9 3.9 35.3
$EV/ton 41.5 38.3 36.9 32.1 Cash at beginning 2.9 2.8 5.7 9.6
Price/BV (x) 2.2 2.1 1.6 1.2 Cash at end 2.8 5.7 9.6 44.9
Mkt cap/Sales (x) 0.8 0.6 0.6 0.5 Turnover Ratio (x) FY14 FY15 FY16E FY17E
EV/Sales (x) 1.3 0.9 0.8 0.6 Debtors Days 39.2 30.4 30.5 30.5
Valuation Ratio FY14 FY15 FY16E FY17E Creditors Days 47.6 39.2 39.2 39.2
D/E (x) 0.9 0.7 0.4 0.2 Inventory Days 51.2 43.3 43.3 43.3
Interest Coverage (X) 0.1 1.3 3.1 4.5 Fixed Asset Turnover 0.7 0.9 1.1 1.1
11 | P a g e
II nnii tt
ii aatt ii
nngg
CCoo
vvee
rr aagg
ee
tt iiaa
tt iinn
gg CC
oovv
eerr aa
ggee
tt iinn
gg CC
oovv
eerr aa
ggee
gg CC
oovv
eerr aa
ggee
CCoo
vvee
rr aagg
ee
vvee
rr aagg
ee
rr aagg
ee
ggee
NCL Industries Ltd
II nn
ii ttii aa
ttii nn
gg CC
oovv
eerraa
ggee
–– 11
55 SS
eepp
ttee
mmbb
eerr 22
0011
55
Disclaimer:
Nirmal Bang Securities Private Limited (hereinafter referred to as “NBSPL”) is a registered Member of National Stock Exchange of India
Limited, Bombay Stock Exchange Limited and MCX stock Exchange Limited. NBSPL is in the process of making an application with SEBI for
registering as a Research Entity in terms of SEBI (Research Analyst) Regulations, 2014.
NBSPL or its associates including its relatives/analyst hold beneficial ownership of more than 1% in the company covered by Analyst.
NBSPL or its associates/analyst has not received any compensation from the company covered by Analyst during the past twelve months.
NBSPL /analyst has not served as an officer, director or employee of company covered by Analyst and has not been engaged in market making
activity of the company covered by Analyst.
The views expressed are based solely on information available publicly and believed to be true. Investors are advised to independently evaluate
the market conditions/risks involved before making any investment decision.
This document, at best, represents Analyst opinion and is meant for general information only. NBSPL, its directors, officers or employees shall
not in any way be responsible for the contents stated herein. NBSPL expressly disclaims any and all liabilities that may arise from information,
errors or omissions in this connection. This document is not to be considered as an offer to sell or a solicitation to buy any securities.
Nirmal Bang Research (Division of Nirmal Bang Securities Pvt. Ltd.)
B-2, 301/302, Marathon Innova, Opp. Peninsula Corporate Park
Off. Ganpatrao Kadam Marg Lower Parel (W), Mumbai-400013 Board No. : 91 22 3926 8000/8001
Fax. : 022 3926 8010


![· QSa RS W\RcQW` ZO `\W\S`OZWhOQW]\ \]`[OZ RSZ VcSa] g RS ^`SdS\W` SZ `O_cWbWa[]% =Og dO`WOa QZOaSa RS JWbO[W\O 9% ^S`] RS W[^]`](https://img.pdfslide.tips/doc/110x75/5b8094f87f8b9ae6088dcb75/-qsa-rs-wrcqw-zo-wsozwhoqw-oz-rsz-vcsa-g-rs-sdsw-sz-ocwbwa.jpg)


![( f ¡ [ $* Èj€¦ · ]l [ 6¢ " ¢! / g f Ú 8 Ð ! !k !g [1920 - Rs. 1 1940 -Rs. 10](https://img.pdfslide.tips/doc/110x75/5f506d44cc9b672d07606ed5/-f-j-l-6-g-f-8-k-g-1920-rs-1-1940-rs.jpg)