Embed Size (px)
Citation preview

IGTC2003Tokyo TS-044
-1-
Early pre-stall investigation by sensitive stall warning technique
Nobuyuki TAHARA and Masahiro KUROSAKI1 Yutaka OHTA, Eisuke OUTA and Hibiki SHINOHARA2
1 Ishikawajima-Harima Heavy Industries Co., Ltd.
229 Tonogaya, Mizuho, Nishitama-gun, Tokyo, 190-1297, JAPAN FAX: +81-42-568-7403, E-Mail: [email protected]
2 Waseda University
ABSTRACT
Hopeful measure to detect stall inception earlier than short spikes was originated. It has several distinctive features such as using pressure transducers not fragile hot-wire anemometers, light calculation load and fail-safe indications in case of sensor failures. But the most advantageous features are its earliest detectability to find slight disturbances in stable axisymmetric flow and reliability even for blade rows with manufacturing errors.
By applying that sensitive measure simultaneously at multiple circumferential locations on the single-stage low-speed compressor, the pre-born phase of rotating stall could be analyzed by observing disturbance development on the casing wall or the moving rotor blades. The tip leakage was confirmed to play an important role for stall initiation by observing pressure disturbances appeared early at the locations where the tip clearance was large. Disturbances were considered not to rotate but to expand their stationary region on the duct as airflow rates were reduced. NOMENCLATURE φ = Flow coefficient ψ = Pressure rise coefficient t = time Trev = Revolution time of the rotor Sxx = Auto-correlation coefficients
INTRODUCTION
Operation of compressors is limited to the range of negative slope of pressure rise versus mass flow rate characteristics. Near the peak of pressure rise, so called rotating stall or surge occurs, resulting in abrupt and significant decrease in performance. Over the past decade, a lot of research and developing efforts have been exerted for active stall control that enables to expand the stable working range of compressors beyond the natural stall point by control technologies. Especially, stall warning measures for catching the inceptions of imminent stall are strongly expected.
In axial flow compressors, there are two different routes to rotating stall; one way starts from long-wavelength inception and the other from short-wavelength inception.
The first stall inception referred to as ‘modal’ is long scale disturbances essentially two-dimensional perturbation of a whole compression system. It rotates at less than 50 percent of the rotor speed and can be observed from several tens to more than 100 rotor-revolutions prior to stall.
The second inception is referred to as ‘spike’ that is narrow width three-dimensional disturbances originally reported by Day(1991) as far as the authors know. As it appears suddenly several rotor revolutions before unrecoverable deep stall, it is difficult for the current actuating technologies to avoid stall even if the first appearance of spikes was successfully detected.
To develop measures for detecting earlier stall inception than spike is an inevitable technical step for active stall control to overcome for its practical applications. The authors have studied practical measures for detecting stall inception earlier than spikes by applying pressure sensors on the casing wall, different from theoretical researchers using delicate hot-wire anemometers. The promising measure by observing disturbances in the passing pressure profiles of the rotor blades have been developed and its effectiveness was demonstrated by successful closed loop tests on the single-stage research compressor. This paper presents several findings discovered during the development research for that stall warning technology.
0.37 kg/s Airflow rate
Table 1 Compressor features
151 mmAq {1.48 kPa} Pressure rise
12,000 rpm Rotational speed
NACA65 Airfoil configuration
24.5 mm Chord of stator blades
15 Number of stator blades
30.0 mm Chord of rotor blade
12 Number of rotor blades
80.0 mm Diameter of rotor hub
130.0 mm Diameter of rotor
Specification Article
Copyright©2003 by GTSJ Manuscript Received on June 06, 2003
Proceedings of the International Gas Turbine Congress 2003 TokyoNovember 2-7, 2003
IGTC2003Tokyo TS-044
-2-
PRESSURE-FIELD STRUCTURE IN ROTOR BLADE PASSAGE
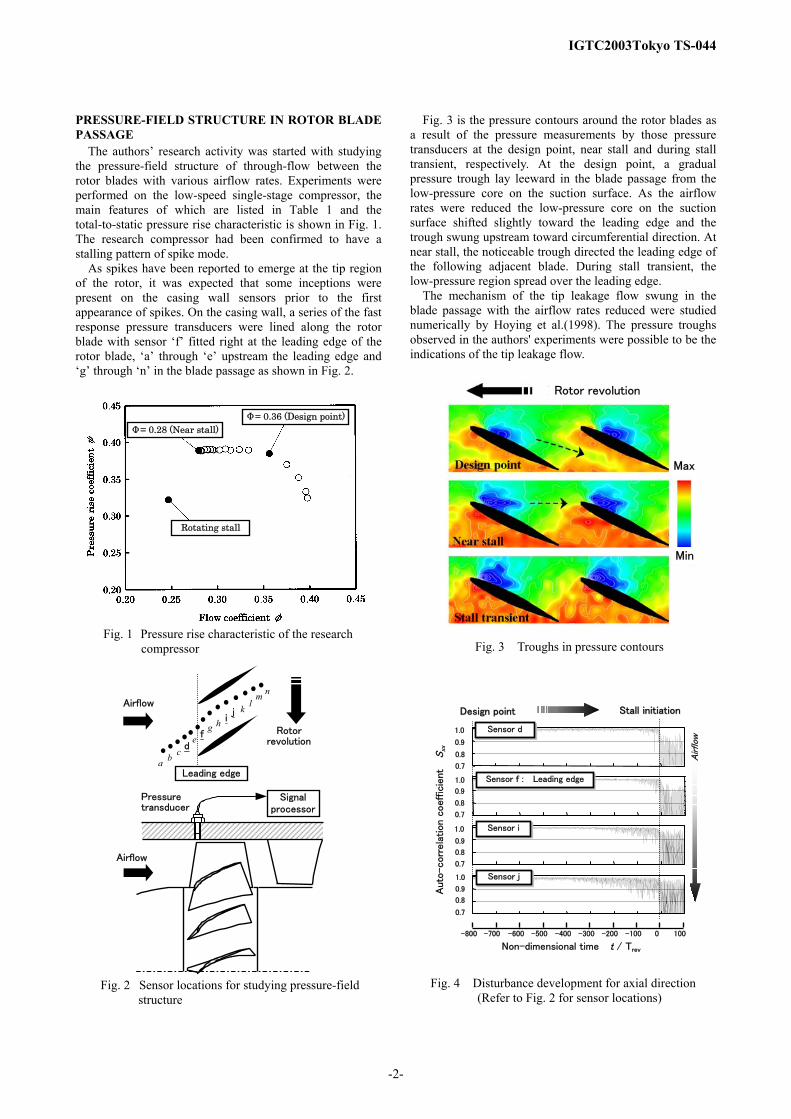
The authors’ research activity was started with studying the pressure-field structure of through-flow between the rotor blades with various airflow rates. Experiments were performed on the low-speed single-stage compressor, the main features of which are listed in Table 1 and the total-to-static pressure rise characteristic is shown in Fig. 1. The research compressor had been confirmed to have a stalling pattern of spike mode.
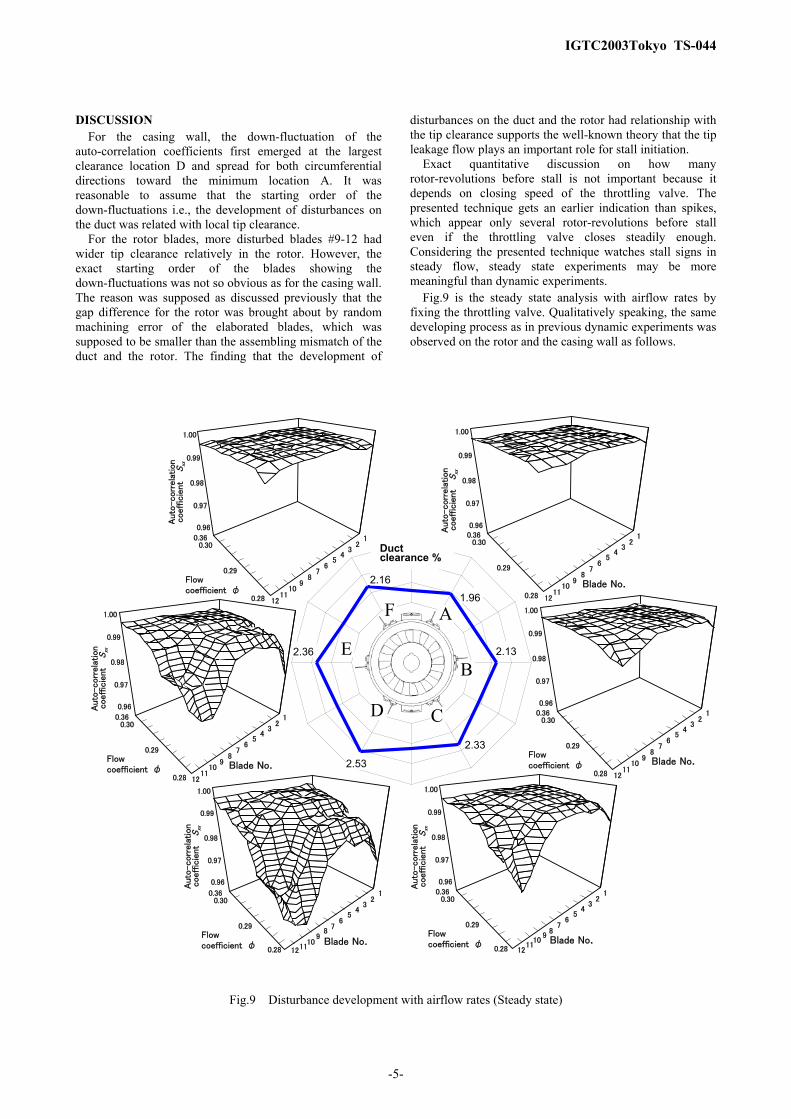
As spikes have been reported to emerge at the tip region of the rotor, it was expected that some inceptions were present on the casing wall sensors prior to the first appearance of spikes. On the casing wall, a series of the fast response pressure transducers were lined along the rotor blade with sensor ‘f’ fitted right at the leading edge of the rotor blade, ‘a’ through ‘e’ upstream the leading edge and ‘g’ through ‘n’ in the blade passage as shown in Fig. 2.
Fig. 1 Pressure rise characteristic of the research compressor
Fig. 2 Sensor locations for studying pressure-field structure
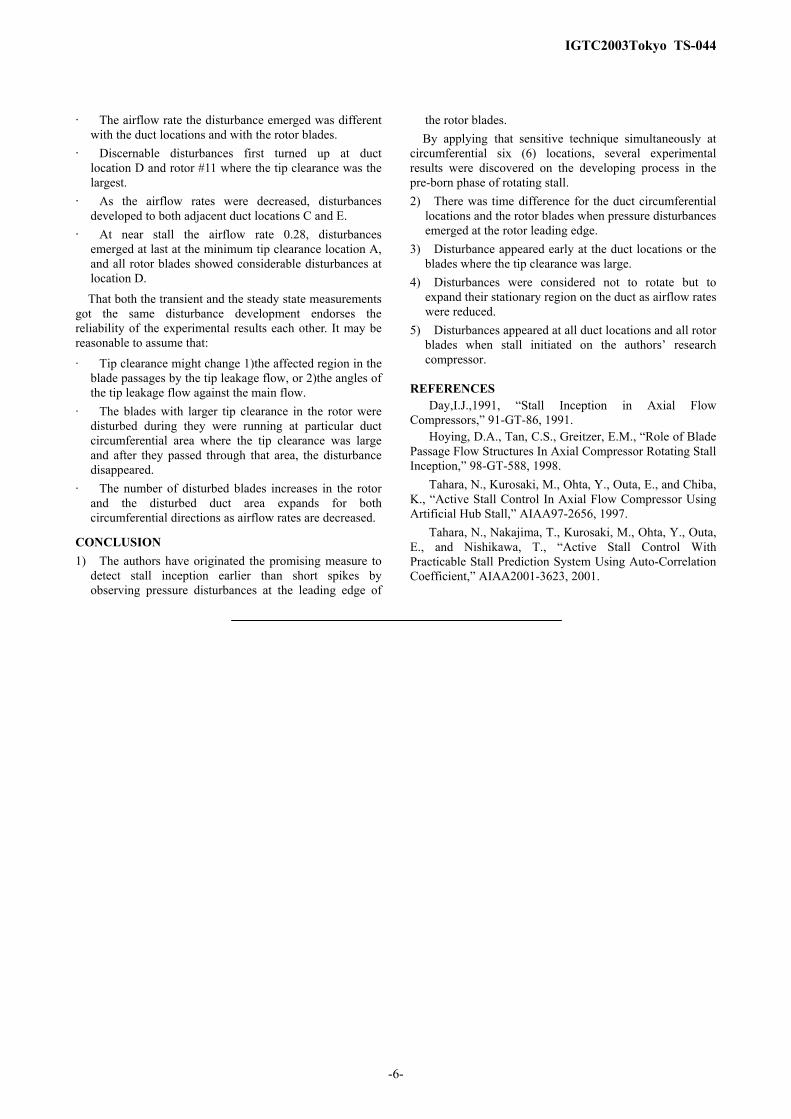
Fig. 3 is the pressure contours around the rotor blades as a result of the pressure measurements by those pressure transducers at the design point, near stall and during stall transient, respectively. At the design point, a gradual pressure trough lay leeward in the blade passage from the low-pressure core on the suction surface. As the airflow rates were reduced the low-pressure core on the suction surface shifted slightly toward the leading edge and the trough swung upstream toward circumferential direction. At near stall, the noticeable trough directed the leading edge of the following adjacent blade. During stall transient, the low-pressure region spread over the leading edge.
The mechanism of the tip leakage flow swung in the blade passage with the airflow rates reduced were studied numerically by Hoying et al.(1998). The pressure troughs observed in the authors' experiments were possible to be the indications of the tip leakage flow.
Fig. 3 Troughs in pressure contours
Fig. 4 Disturbance development for axial direction (Refer to Fig. 2 for sensor locations)
Airflow Rotor
revolution
a b c d e f
g h i j k l
m n
Leading edge
Pressure transducer
Signal processor
Airflow
Auto
-corr
ela
tion c
oeff
icie
nt
S
xx
-800 -700 -600 -500 -400 -300 -200 -100 0 100
DDeessiiggnn ppooiinntt SSttaallll iinniittiiaattiioonn
Non-dimensional time t / Trev
0.7
0.8
0.9
1.0 Sensor i
0.7
0.8
0.9
1.0 Sensor j
0.7
0.8
0.9
Sensor f : Leading edge 1.0
0.8
0.9
1.0
0.7
Sensor d
Airflow
Min
Max
Rotor revolution
Rotating stall
Φ= 0.28 (Near stall) Φ= 0.36 (Design point)

IGTC2003Tokyo TS-044
-3-
If the direction or the positions of the pressure troughs are identified, imminent stall can be recognized at earlier stage than spikes. The authors came up with the idea of estimating the position of the pressure troughs from the rotor blades running in advance with the calculating load as small as possible. It evaluates the magnitude of pressure disturbances in the blade passage with the auto-correlation coefficients.
The artfulness here was that one-blade-pitch pressure profiles of the current and one rotor-revolution before of the same blade passages were compared in order to eliminate the uniqueness of each blade. This technique would be advantageous for finding the slightest changes in axisymmetric flow even for blade rows with inevitable manufacturing errors.
Fig. 4 is the analyzed result at several axial locations of the duct. Abscissa is time normalized by rotor speed during throttling airflow from the design point to stall for about 4 seconds. All series of the auto-correlation coefficients started with over 0.98 at higher airflow rates. That robustness of the parameter was achieved by that artful technique for comparing the pressure profiles. As the airflow rates were reduced, the mid-chord sensor ‘j’ showed the down-fluctuations first, and then sensor ‘i’ followed. About 100 rotor-revolutions after the down-fluctuations appeared at the leading edge sensor ‘f’, the aspect changed with significant fluctuations of the auto-correlation coefficients at all axial locations simultaneously. That was the onset of rotating stall.
As expected, the down-fluctuations, needless to say, disturbances in the blade passages by tip leakage flow expanded upstream as the airflow rates were reduced and stall occurred when the down-fluctuations reached the leading edge. It was considered that the proposed measure for estimating the positions of the pressure troughs had a good correlation with the actual pressure troughs swung in the blade passage.
The authors decided to place pressure transducers at the rotor leading edge for their stall warning system as that axial location was supposed to have an important meaning for stall initiation although the detail physical phenomena was still unknown. CLOSED LOOP TESTS WITH ‘1’ FEEDBACK SENSOR
The proposed measure for detecting stall inception is hopeful for active stall control for the following reasons. 1) It provides earlier indication than spikes. 2) Computing load is not heavy for on-line calculation. 3) It will provide fail-safe indications in case of sensor
failures or signal noise. Closed loop tests were attempted to substantiate the
effectiveness of the developed measure. The tests were done at the same compressor on which the pressure-field structure was studied. The actuation scheme to suppress stall development was unique, which formed artificial standing stall by placing a blockage around a hub in front of a compressor to divert the airflow toward the tip of blades that are susceptible to stall initiation. The detail work was reported by the authors’ previous papers(1997,2001). Pressure disturbances at the rotor leading edge were watched by the auto-correlation coefficients and the actuation device started its activation at the moment the
coefficients decreased below the pre-determined threshold. At first, presuming disturbances to be carried on the rotor
blades as cells of rotating stall, one pressure transducer for circumferential direction was considered enough for detecting stall inception. The closed loop tests were successful in most cases, however, sometimes they failed not only against the severe demonstrations of inserting the 90-degree distortion plate in front of the compressor dynamically at near stall but also against easy cases slowly closing the throttle valve downstream the compressor. A lot of successful or failed experiences implied that the failures were related with the circumferential location of the feedback sensor. There might be time difference with the circumferential locations when stall inception showed up.
DISTURBANCE DEVELOPMENT ON CASING WALL
In order to confirm the assumption in which stall inception has time difference with circumferential locations, the detailed analysis with the auto-correlation coefficients was performed simultaneously at six (6) circumferential locations on the casing wall. The sensor locations on the duct are A through F in Fig. 5.
Fig. 5 Sensor locations on the duct
Fig. 6 Disturbance development on the casing wall
A
B
F
E
DC
ROTATING DIRECTION
TRIGGER
#1
#2
#3
#4 #5 #6
#7
#8
#9
#10 #11 #12
Non-dimensional time t / Trev
SSttaallll iinniittiiaattiioonn DDeessiiggnn ppooiinntt
Rot
or d
irec
tion
Location A
Location B
Location C
Location D
Location E
Location F
Auto
-corr
ela
tion c
oeff
icie
nt
S
xx
0.7
0.8
1.0
0.9
0.7
0.8
1.0
0.9
-900 -700 -500 -400 -300 -200 -100 0 100-600-800
-900 -700 -500 -400 -300 -200 -100 0 100-600-800
-900 -700 -500 -400 -300 -200 -100 0 100-600-800
-900 -700 -500 -400 -300 -200 -100 0 100-600-800
-900 -700 -500 -400 -300 -200 -100 0 100-600-800
-900 -700 -500 -400 -300 -200 -100 0 100-600-8000.7
0.8
1.0
0.9
0.7
0.8
1.0
0.9
0.7
0.8
1.0
0.9
0.7
0.8
1.0
0.9

IGTC2003Tokyo TS-044
-4-
Fig. 6 shows the analyzed results during closing the throttle valve at the same rate as the previous experiments. As anticipated, the moment when the down-fluctuations emerged was different with duct circumferential locations. The auto-correlation coefficients were stable over 0.98 at all duct locations at higher airflow rates. The down-fluctuations first showed up on sensor D about 300 rotor revolutions before the stall initiation. Then sensor E and C followed, which are located adjacent to sensor D.
As the airflow rates were decreased, the down-fluctuations spread for both circumferential directions. About 40 rotor revolutions after the down-fluctuations were appreciable on sensor A, stall initiated. Time difference when pressure disturbances showed up with the duct locations was as much as 260 rotor revolutions between the earliest D and the latest A at the throttling rate of that experiment.
Fig. 7 Disturbance development on the rotor blades
DISTURBANCE DEVELOPMENT ON ROTOR BLADES The proposed measure has an amazing feature that can
reveal the development of disturbances even on the moving rotor, for example, ability to identify the order of which blades disturbances appeared first or last in the rotor. As explained previously at studying the pressure-field structure, the artful technique of the presented measure was to compare one-blade-pitch pressure profiles of the current and
one rotor-revolution before of the same blade passages. Disturbances are exhibited on each rotor blade by sorting the auto-correlation coefficients with blades at a particular duct location.
Based on the electrical pulsations triggered once per rotor revolution, 12 rotor blades were identified as #1 for the first after the pulsation, #2 for the second and so on as illustrated in Fig. 5. The same data explored at location D that was the most disturbed location in Fig. 6 was sorted with blades #1 through #12 to make Fig. 7. The plots in Fig. 7 look sparse as compared with Fig. 6 because the data quantity of each blade in Fig. 7 is one-twelfth of that of location D in Fig. 6.
The starting order of the down-fluctuations among the rotor blades was less distinct than among the duct locations investigated in Fig.6. Careful examination identified that disturbances emerged on blade #11 first, however, the last emerged blade were indefinable. As the airflow rates were decreased, the down-fluctuation grew up on each blade and it became evident that disturbances existed on all rotor blades just before the stall initiation. TIP CLEARANCE MEASUREMENT
What caused the development of disturbances on the casing wall or the rotor? As the presented technique was developed for estimating the positions of the tip leakage flow in the blade passage and had a good correlation with them, it was natural to suppose that the development of disturbances on the casing wall or the rotor was attributed to tip leakage. Comprehensive measurement for the tip clearance was conducted on the research compressor.
Fig. 8 Averaged clearance Such data matrix was formed as the gaps at all duct
locations A through F against all rotor blades #1 through #12 were filled. Then the gaps were averaged for the duct locations and the blades respectively to get Fig. 8. For the duct locations, the tip clearance difference was large between the maximum D and the minimum A as compared to for the rotor blades. Considering that the distribution was smooth and location D and A were apart with 180 degrees, it was supposed that the gap difference for the duct was caused by the assembling mismatch of the rotor and the duct. On the other hand for the blades, the difference between the maximum #11 and the minimum #1 was smaller and the distribution was random. It was supposed that the gap difference for the blades was brought about by machining error of the blades. In general, dispersion of elaborately manufactured blade heights is smaller than the assembling mismatch.
1.5
2
2.5
3
1 2 3 4 5 6 7 8 9 10 11 12
1.5
2
2.5
3
A B C D E F
Duct locations Blade No.
Tip
cle
aran
ce
/ C
ode
lengt
h
%
0.7 0.8
1.0 0.9
0.7 0.8
1.0 0.9
0.7 0.8
1.0 0.9
0.7 0.8
1.0 0.9
0.7 0.8
1.0 0.9
0.7 0.8
1.0 0.9
1.0
-900 -700 -500 -400 -300 -200 -100 0 100-600 -800
Non-dimensional time t / Trev
SSttaallll iinniittiiaattiioonnDDeessiiggnn ppooiinntt
Rot
or d
irec
tion
0.7 0.8
1.0 0.9
0.7 0.8
1.0 0.9
0.7 0.8
1.0 0.9
0.7 0.8
0.9
Blade 1
Blade 2
Blade 3
Blade 4
Blade 5
Blade 6
Blade 7
Blade 8
Blade 9
Blade 10
Blade 11
Blade 12
Auto
-corr
ela
tion c
oeff
icie
nt
S
xx
0.7 0.8
1.0 0.9
0.7 0.8
1.0 0.9
IGTC2003Tokyo TS-044
-5-
DISCUSSION For the casing wall, the down-fluctuation of the
auto-correlation coefficients first emerged at the largest clearance location D and spread for both circumferential directions toward the minimum location A. It was reasonable to assume that the starting order of the down-fluctuations i.e., the development of disturbances on the duct was related with local tip clearance.
For the rotor blades, more disturbed blades #9-12 had wider tip clearance relatively in the rotor. However, the exact starting order of the blades showing the down-fluctuations was not so obvious as for the casing wall. The reason was supposed as discussed previously that the gap difference for the rotor was brought about by random machining error of the elaborated blades, which was supposed to be smaller than the assembling mismatch of the duct and the rotor. The finding that the development of
disturbances on the duct and the rotor had relationship with the tip clearance supports the well-known theory that the tip leakage flow plays an important role for stall initiation.
Exact quantitative discussion on how many rotor-revolutions before stall is not important because it depends on closing speed of the throttling valve. The presented technique gets an earlier indication than spikes, which appear only several rotor-revolutions before stall even if the throttling valve closes steadily enough. Considering the presented technique watches stall signs in steady flow, steady state experiments may be more meaningful than dynamic experiments.
Fig.9 is the steady state analysis with airflow rates by fixing the throttling valve. Qualitatively speaking, the same developing process as in previous dynamic experiments was observed on the rotor and the casing wall as follows.
Fig.9 Disturbance development with airflow rates (Steady state)
0.96
0.97
0.98
0.99
1.00
Auto
-corr
ela
tion
coeffic
ient
S
xx
12 11 10
9 8
76
54
32
1
Blade No.
0.96
0.97
0.98
0.99
1.00
Auto
-corr
ela
tion
coeffic
ient
S
xx
1211
109
87
6 5
4 3
2 1
Blade No.
0.96
0.97
0.98
0.99
1.00
Auto
-corr
ela
tion
coeffic
ient
S
xx
12 11
10 9
8 7
6 5
4 3
2 1
Blade No.
0.96
0.97
0.98
0.99
1.00
12 11
10 9
87
65
43
21
Blade No.
0.96
0.97
0.98
0.99
1.00
Auto
-corr
ela
tion
coeffic
ient
S
xx
12 11
10 9
8 7
65
43
21
0.96
0.97
0.98
0.99
1.00
Auto
-corr
ela
tion
coeffic
ient
S
xx
1211
10 9
8 7
6 5
4 3
2 1
Blade No.
2.53
1.96
2.16
2.36 2.13
2.33
A
B
CD
E
F
0.36 0.30
0.28
0.29 Flow coefficient φ
0.360.30
0.28
0.29Flow coefficient φ
0.360.30
0.28
0.29 Flow coefficient φ
0.36 0.30
0.28
0.29 Flow coefficient φ
0.360.30
0.28
0.29
0.36 0.30
0.28
0.29Flow coefficient φ
Duct clearance %
IGTC2003Tokyo TS-044
-6-
· The airflow rate the disturbance emerged was different with the duct locations and with the rotor blades.
· Discernable disturbances first turned up at duct location D and rotor #11 where the tip clearance was the largest.
· As the airflow rates were decreased, disturbances developed to both adjacent duct locations C and E.
· At near stall the airflow rate 0.28, disturbances emerged at last at the minimum tip clearance location A, and all rotor blades showed considerable disturbances at location D. That both the transient and the steady state measurements
got the same disturbance development endorses the reliability of the experimental results each other. It may be reasonable to assume that: · Tip clearance might change 1)the affected region in the
blade passages by the tip leakage flow, or 2)the angles of the tip leakage flow against the main flow.
· The blades with larger tip clearance in the rotor were disturbed during they were running at particular duct circumferential area where the tip clearance was large and after they passed through that area, the disturbance disappeared.
· The number of disturbed blades increases in the rotor and the disturbed duct area expands for both circumferential directions as airflow rates are decreased.
CONCLUSION 1) The authors have originated the promising measure to
detect stall inception earlier than short spikes by observing pressure disturbances at the leading edge of
the rotor blades. By applying that sensitive technique simultaneously at
circumferential six (6) locations, several experimental results were discovered on the developing process in the pre-born phase of rotating stall. 2) There was time difference for the duct circumferential
locations and the rotor blades when pressure disturbances emerged at the rotor leading edge.
3) Disturbance appeared early at the duct locations or the blades where the tip clearance was large.
4) Disturbances were considered not to rotate but to expand their stationary region on the duct as airflow rates were reduced.
5) Disturbances appeared at all duct locations and all rotor blades when stall initiated on the authors’ research compressor.
REFERENCES
Day,I.J.,1991, “Stall Inception in Axial Flow Compressors,” 91-GT-86, 1991.
Hoying, D.A., Tan, C.S., Greitzer, E.M., “Role of Blade Passage Flow Structures In Axial Compressor Rotating Stall Inception,” 98-GT-588, 1998.
Tahara, N., Kurosaki, M., Ohta, Y., Outa, E., and Chiba, K., “Active Stall Control In Axial Flow Compressor Using Artificial Hub Stall,” AIAA97-2656, 1997.
Tahara, N., Nakajima, T., Kurosaki, M., Ohta, Y., Outa, E., and Nishikawa, T., “Active Stall Control With Practicable Stall Prediction System Using Auto-Correlation Coefficient,” AIAA2001-3623, 2001.