Embed Size (px)
Citation preview
Early Statistical Detection of Bio-Terrorism Attacks by Tracking OTC Medication Sales
Galit Shmueli
Dept. of Statistics and CALD Carnegie Mellon University
With Stephen Fienberg (Statistics)
Anna Goldenberg & Rich Caruana (CS)
Overview
Current bio-surveillance systems– Monitoring traditional data– Using simple SPC methods
Early detection– Use of non-traditional data– Building a flexible, automated detection system– Evaluating the system
Results and enhancements
Traditional Data Sources
Public health sources– School absence records– Sentinel practices– Laboratory data
Medical sources– Patient visits at urgent care, outpatient clinics, emergency
rooms
Speed of detection: weeks after the actual occurrence– Rate of data arrival
Why is detection slow?
Data arrives late– Projects using electronic reporting systems:
Influenza surveillance system (U of Utah) Tracking ICD9 codes (U of Pittsburgh) Future: increasing availability of electronic means for
gathering surveillance data
Data available on weekly or monthly scale Data are nation-wide Signature of outbreak in data is late!
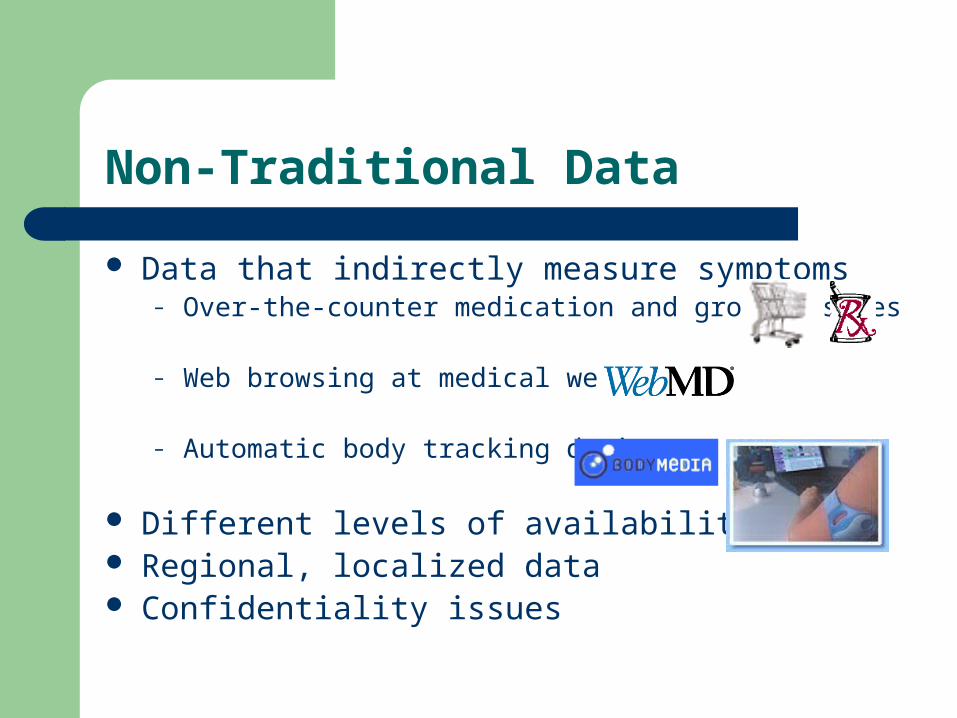
Non-Traditional Data
Data that indirectly measure symptoms– Over-the-counter medication and grocery sales
– Web browsing at medical websites
– Automatic body tracking devices
Different levels of availability Regional, localized data Confidentiality issues
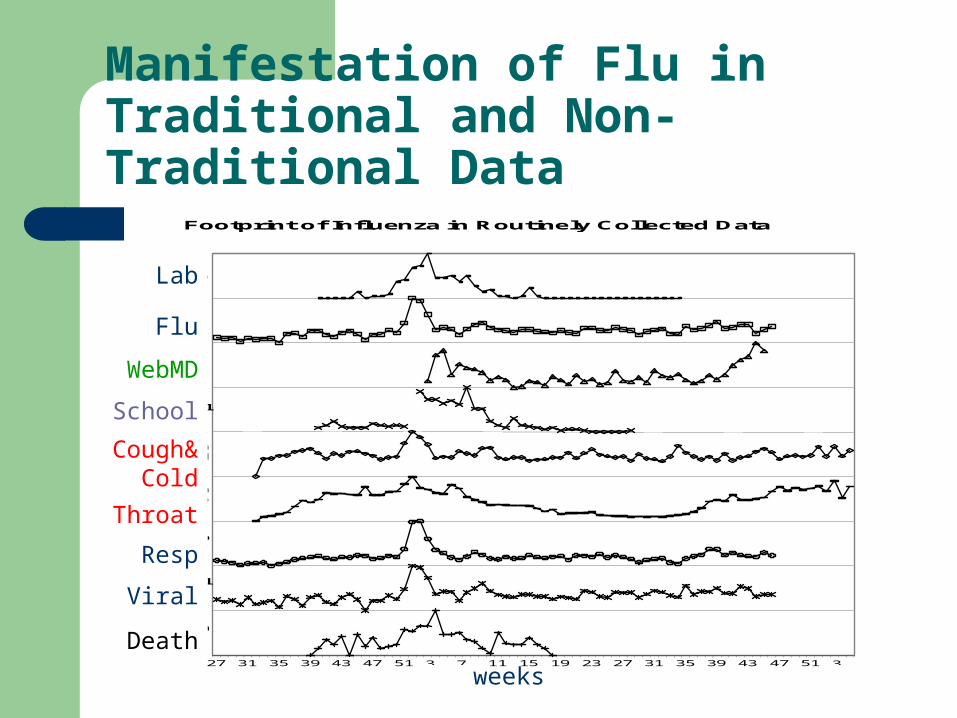
Manifestation of Flu in Traditional and Non-Traditional Data
27 31 35 39 43 47 51 3 7 11 15 19 23 27 31 35 39 43 47 51 3
Death
Lab
Flu
WebMD
School
Cough & Cold
Cough Syrup
Resp
Viral
Footprint of Influenza in Routinely Collected Data
Lab
Flu
WebMD
School
Cough&Cold
Throat
Resp
Viral
Death
weeks
OTC Medication and Grocery Sales
Benefits– Manifestation of outbreak is very early– Timeliness in collection and reporting (daily)– Extremely detailed (basket-level)
Drawbacks – No info about epidemic manifestation in sales data– Requires knowledge about marketing efforts (sales, discounts)– If outbreak replicates sales patterns – hard to detect (Holidays
are a big challenge)– Hard to model!
Prior Uses of Non-Traditional Data
Diarrheal Disease Surveillance: data from 38 drug stores in NY (Mikol et al., 2000)
Monitoring near-real-time satellite vegetation and climate data for predicting emerging Rift Valley Fever epidemics in East Africa (DoD and NASA, 2001)
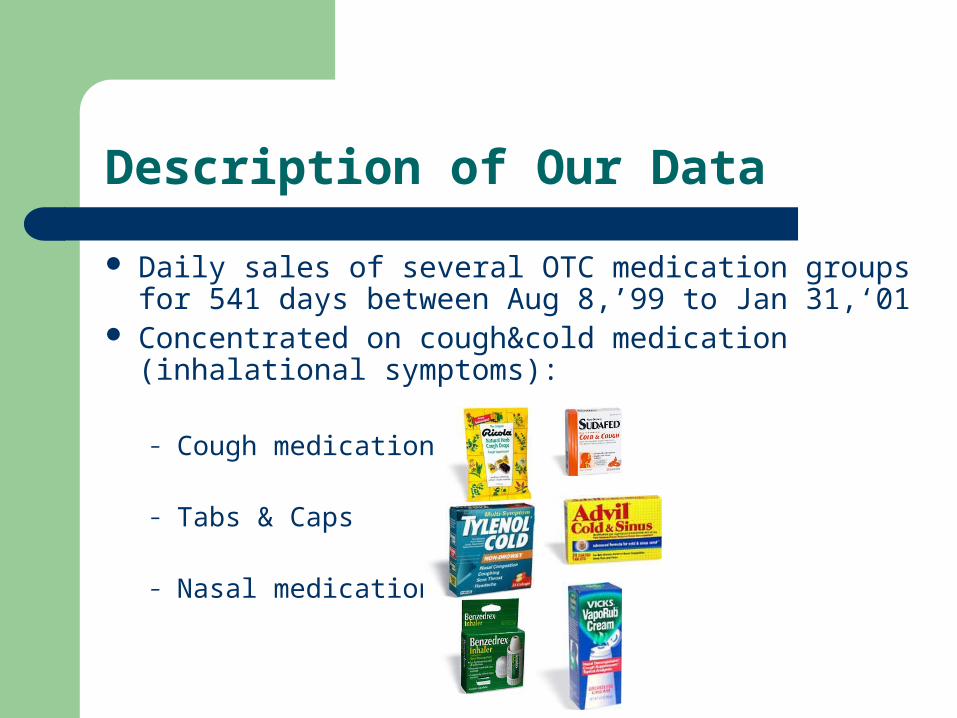
Description of Our Data
Daily sales of several OTC medication groups for 541 days between Aug 8,’99 to Jan 31,‘01
Concentrated on cough&cold medication (inhalational symptoms):
– Cough medication
– Tabs & Caps
– Nasal medication
Hypothetical Scenario of an Inhalational Anthrax Attack
Symptoms: almost all typical to flu!– fever – fatigue– cough – mild chest discomfort– but no runny nose (!)
Death may occur within 24-36 hours
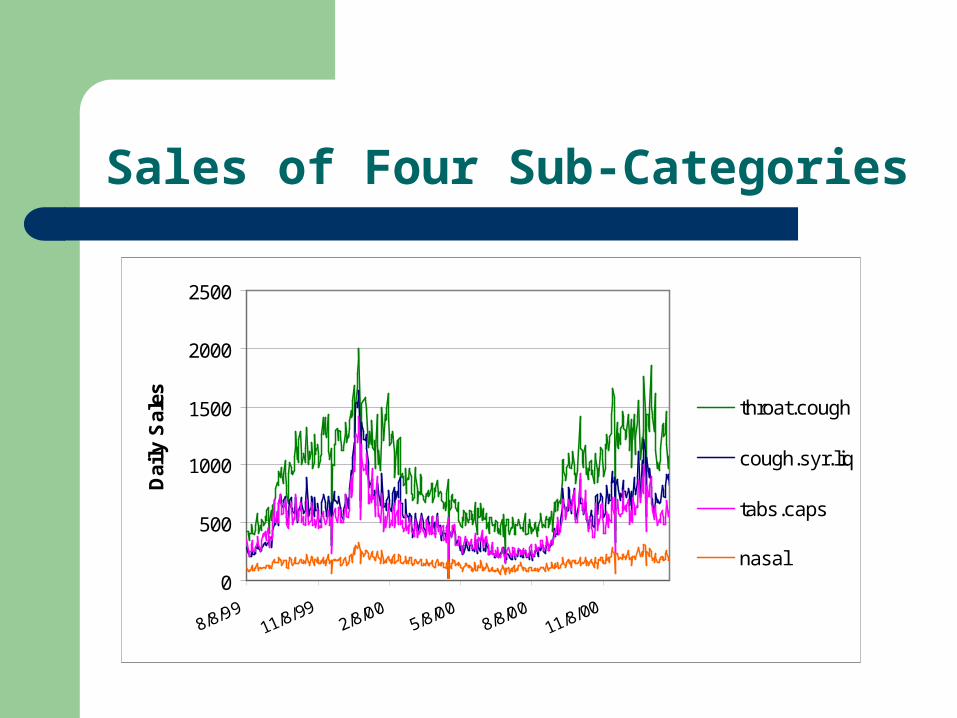
Sales of Four Sub-Categories
0
500
1000
1500
2000
2500
8/8/9911/8/99
2/8/005/8/00
8/8/0011/8/00
Dai
ly S
ales throat.cough
cough.syr.liq
tabs.caps
nasal
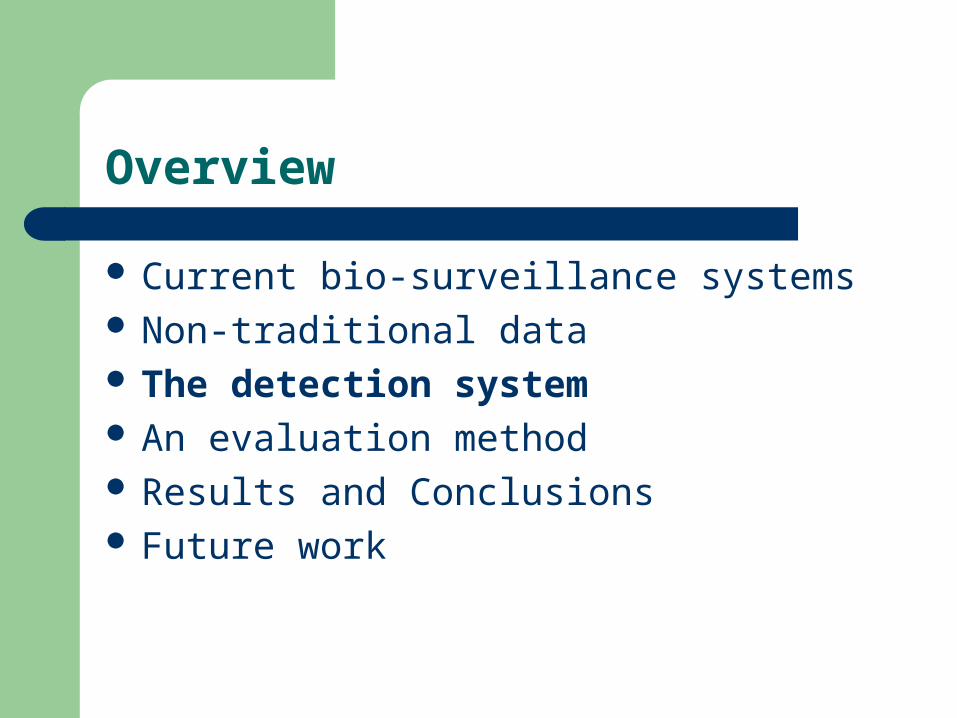
Overview
Current bio-surveillance systems Non-traditional data The detection system An evaluation method Results and Conclusions Future work
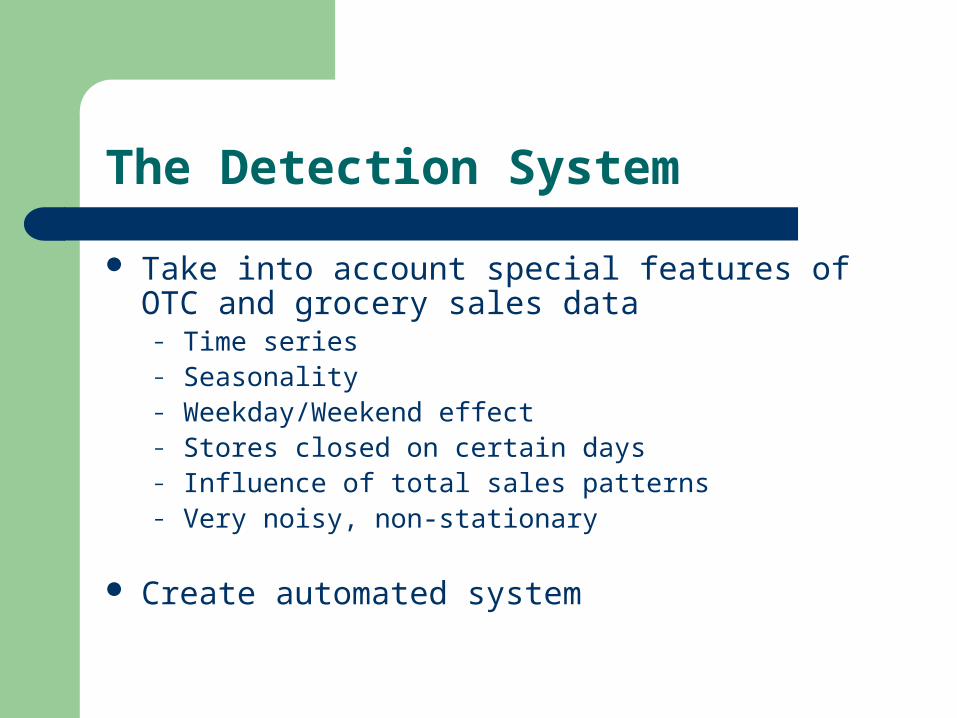
The Detection System
Take into account special features of OTC and grocery sales data
– Time series – Seasonality– Weekday/Weekend effect– Stores closed on certain days– Influence of total sales patterns– Very noisy, non-stationary
Create automated system
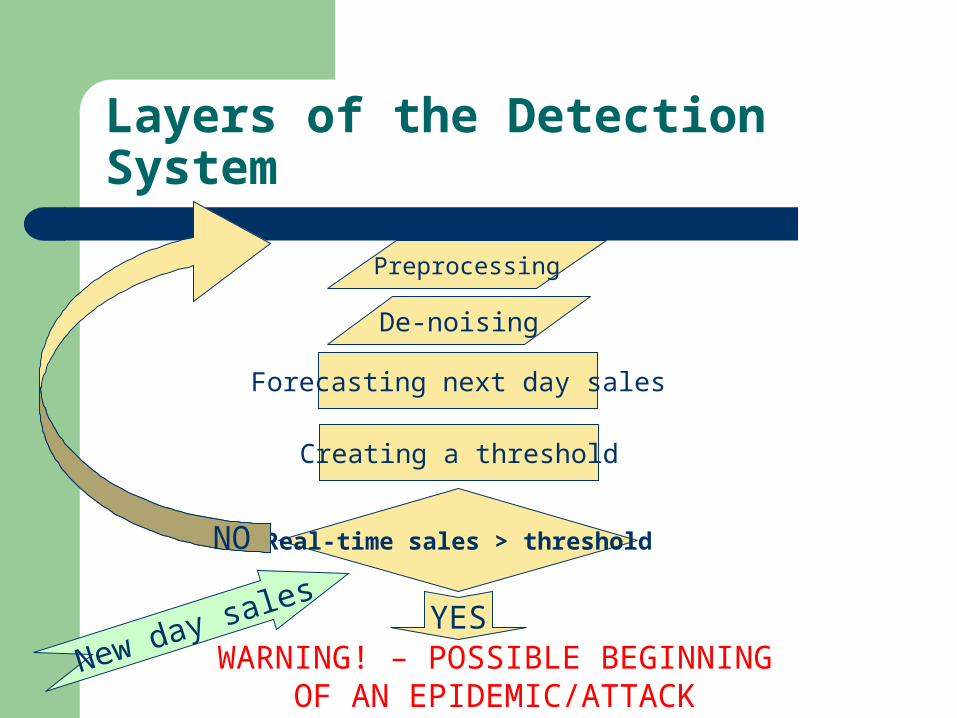
Layers of the Detection System
WARNING! – POSSIBLE BEGINNING OF AN EPIDEMIC/ATTACK
YES
Real-time sales > threshold
Preprocessing
Forecasting next day sales
Creating a threshold
New day sales
NO
De-noising
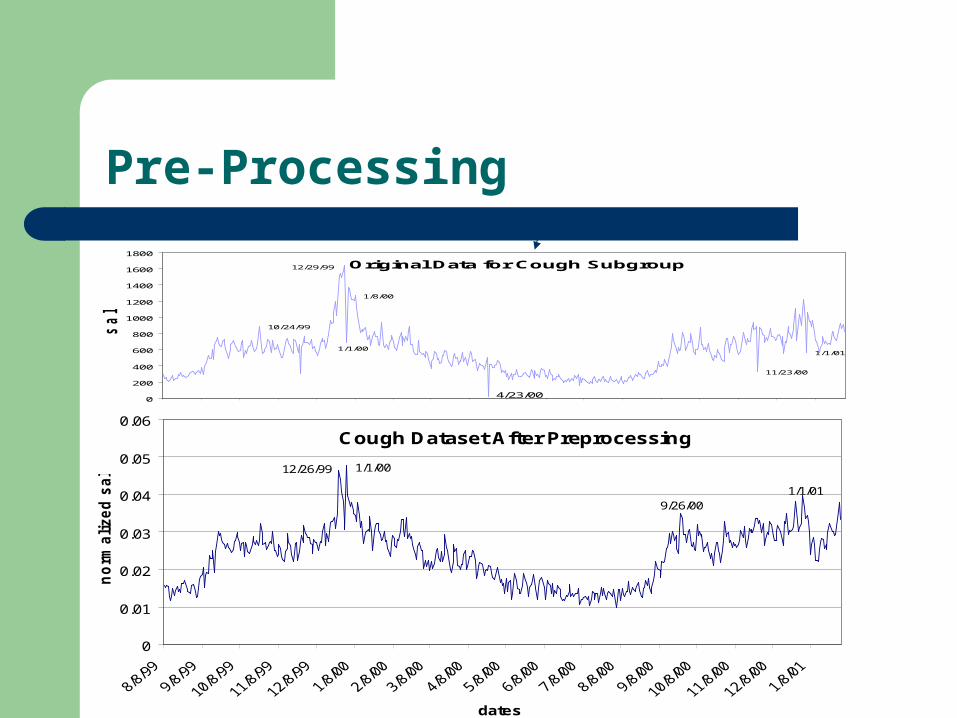
Pre-Processing
Original Data for Cough Subgroup
1/8/00
12/29/99
1/1/01
11/23/00
4/23/00
10/24/99
1/1/00
0
200
400
600
800
1000
1200
1400
1600
1800
sale
s
Cough Dataset After Preprocessing
1/1/019/26/00
1/1/0012/26/99
0
0.01
0.02
0.03
0.04
0.05
0.06
dates
no
rma
lized
sale
s
De-Noising
Target: obtain main features of data, reduce noise to improve predictability
Selected method: Discrete Cosine Transform with horizontal filtering
How much to de-noise?– Retain minimal coefficient set that
Maximizes accuracy Optimizes predictability
– Use cross-validation and MSE-based criteria
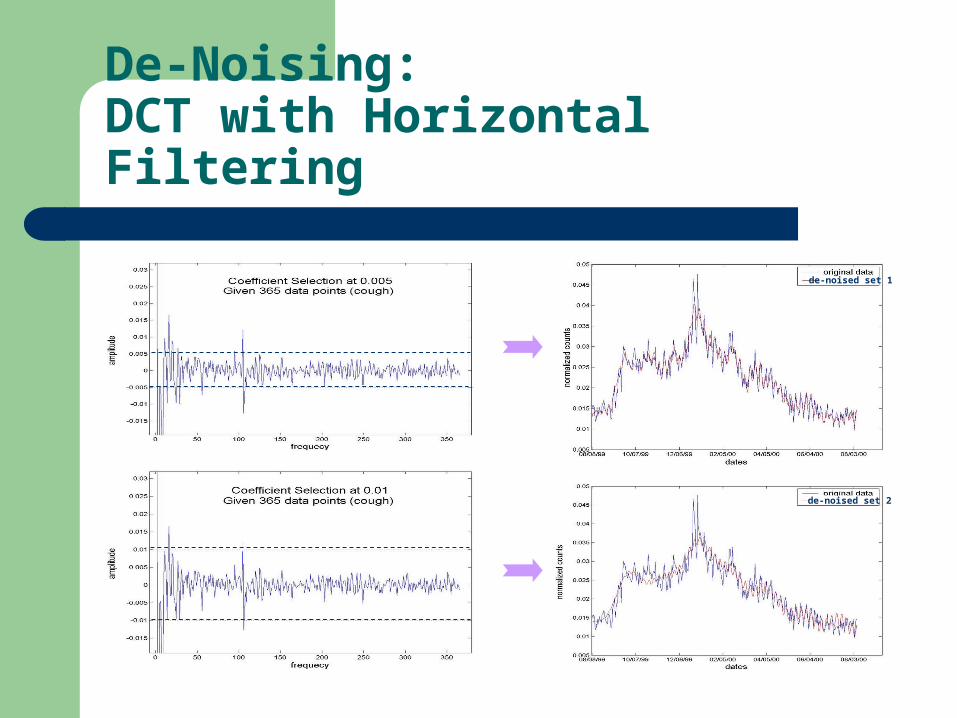
De-Noising: DCT with Horizontal Filtering
de-noised set 2
de-noised set 1
Forecasting
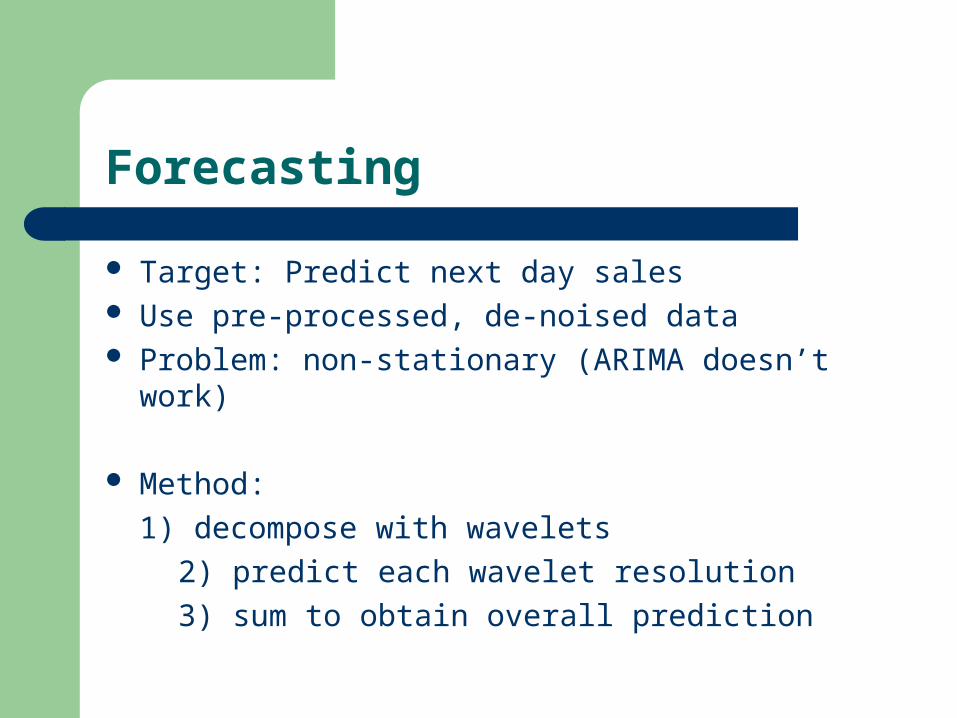
Target: Predict next day sales Use pre-processed, de-noised data Problem: non-stationary (ARIMA doesn’t work)
Method:
1) decompose with wavelets
2) predict each wavelet resolution
3) sum to obtain overall prediction
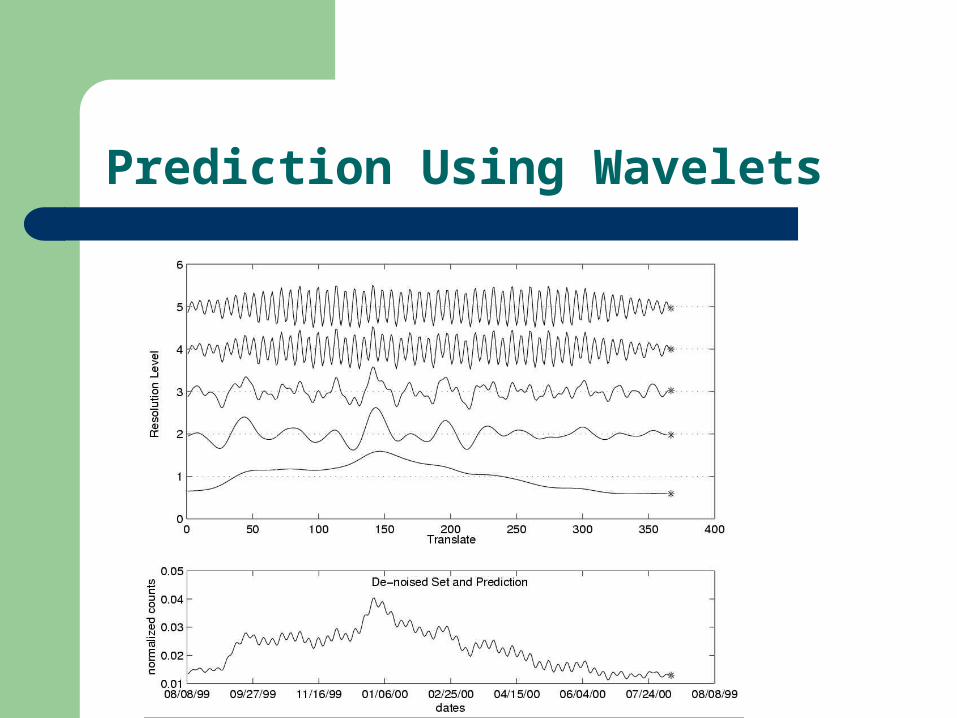
Prediction Using Wavelets
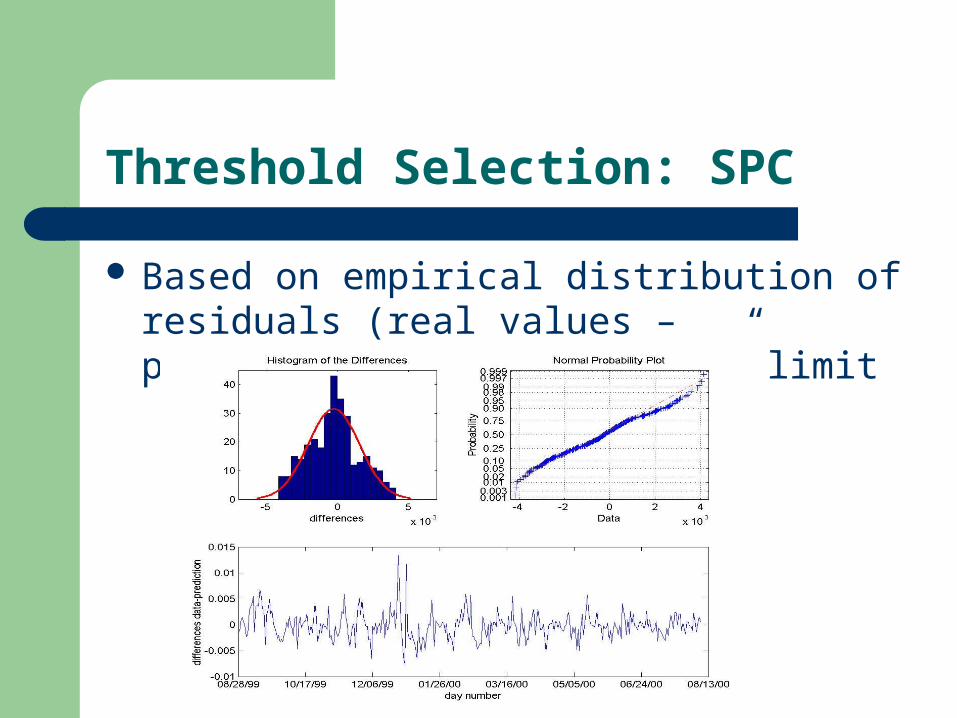
Threshold Selection: SPC
Based on empirical distribution of residuals (real values – predictions), we fit a “3σ” limit
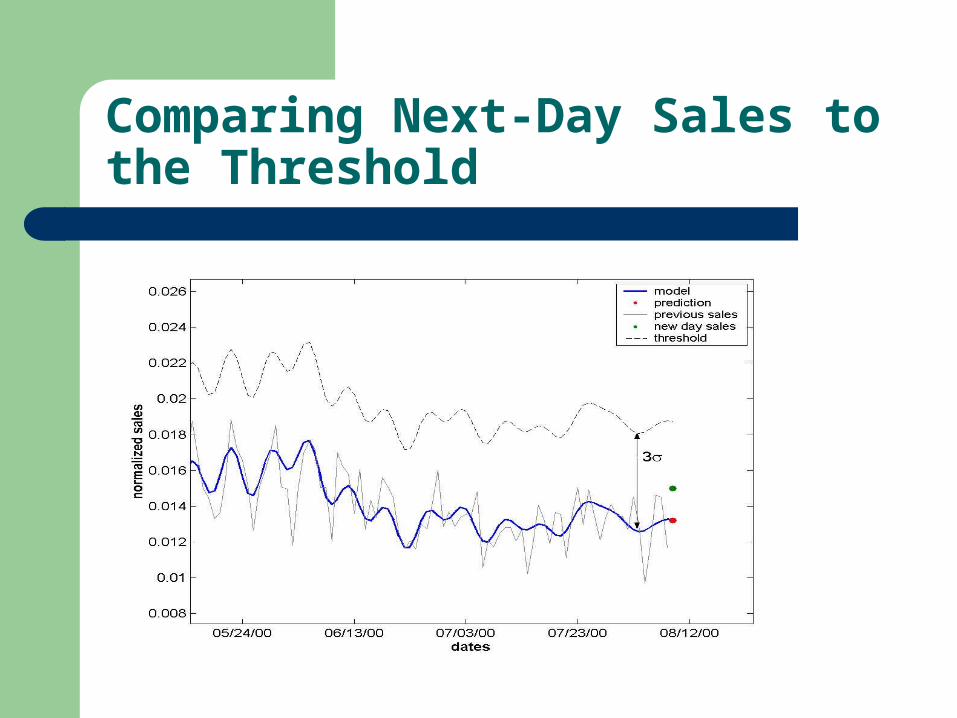
Comparing Next-Day Sales to the Threshold
Overview
Current bio-surveillance systems Non-traditional data The detection system An evaluation method Results and Conclusions Ongoing work (basket-level data) Future work
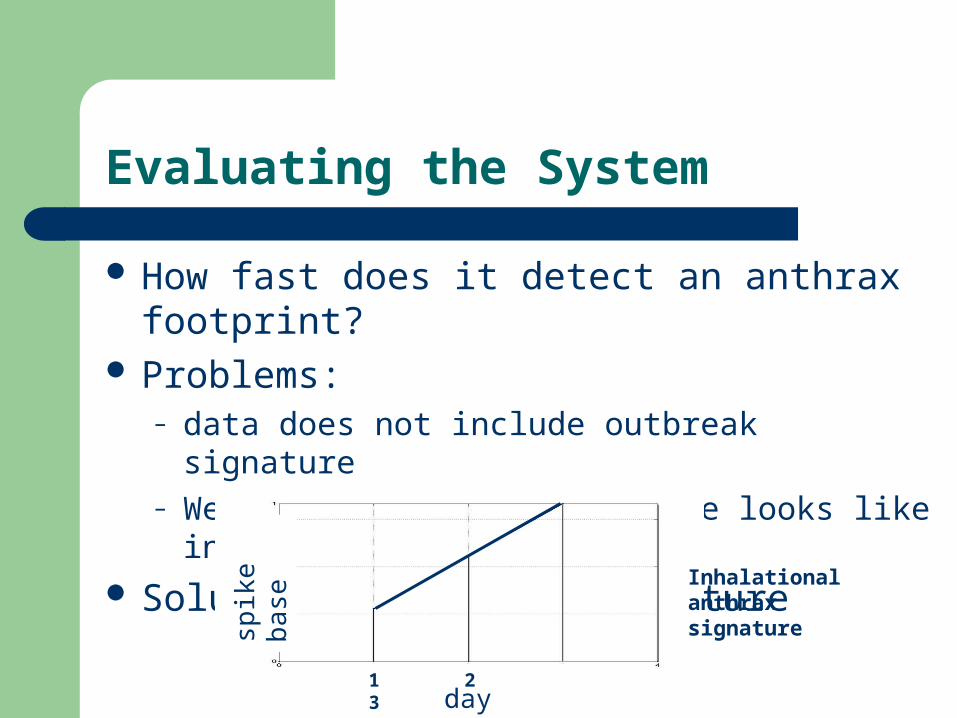
Evaluating the System
How fast does it detect an anthrax footprint? Problems:
– data does not include outbreak signature– We don’t know what signature looks like in such data
Solution: simulated signature
1 2 3day
spik
e ba
se
Inhalational anthrax signature
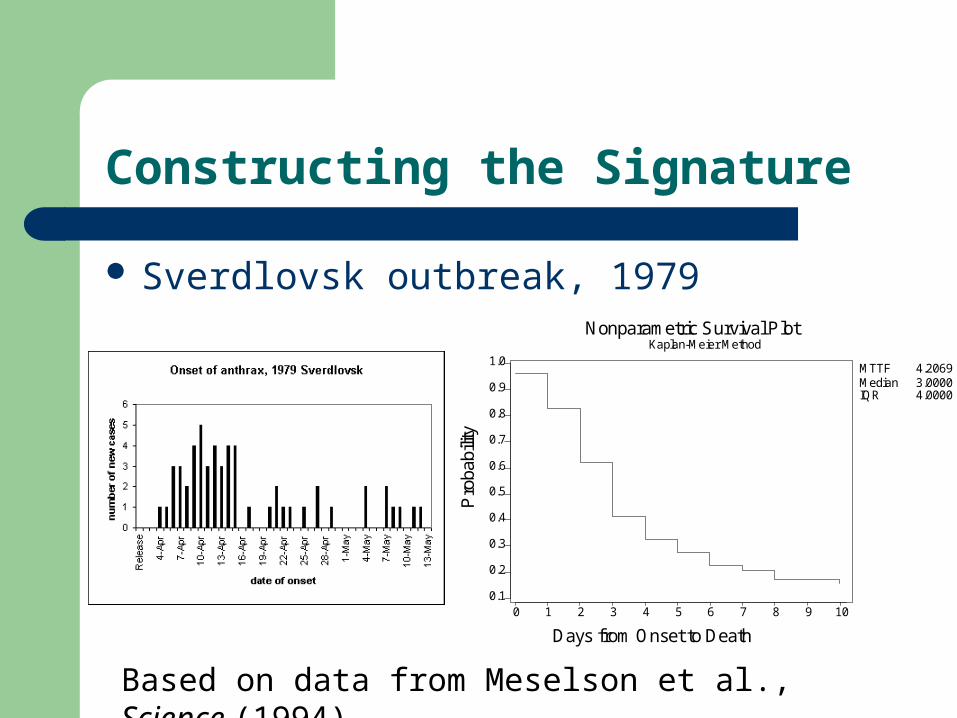
Constructing the Signature
Sverdlovsk outbreak, 1979
0 1 2 3 4 5 6 7 8 9 100.1
0.2
0.3
0.4
0.5
0.6
0.7
0.8
0.9
1.0
Days from Onset to Death
Pro
babi
lity
Nonparametric Survival PlotKaplan-Meier Method
MTTFMedianIQR
4.2069 3.0000 4.0000
Based on data from Meselson et al., Science (1994)
Anthrax Signature in OTC Sales
Add signature at each data point sequentially, and look at rate of detection
Try different slopes, heights Compare different
configurations of system for different signatures
slope = 1/3Detects 100% of spikes within 3 days for height = 1.3(data range)
Results and Conclusions
The detection system – works with grocery data– detects simulated footprint quickly– has low false alarm rate
The system is flexible (tools are interchangeable)
Almost fully automated, efficient computation “Perfect bio-attack” is on holiday

Future Work
Combine with traditional medical and public health data sources
Aggregated data: Track several series simultaneously
Basket data: Utilize other features of grocery data such as spatial factor, customer information