Embed Size (px)
Citation preview
EBARA (6361)May 10, 2013
Results Presentation for Fiscal Year Ended March 31, 2013
Results Presentation for Fiscal Year ended March 31, 2013
2.
Projection and Management Strategy
1.
Summary of ResultsSenior Managing Executive OfficerResponsible for Finance&
Accounting
President and Representative Director
Tetsuji Fujimoto
Toichi Maeda
Contents
Results Presentation for Fiscal Year ended March 31, 2013
2.
Projection and Management Strategy
1.
Summary of Results
President and Representative Director
Toichi Maeda
Senior Managing Executive OfficerResponsible for Finance&
Accounting
Tetsuji Fujimoto
Results Presentation for Fiscal Year ended March 31, 2013
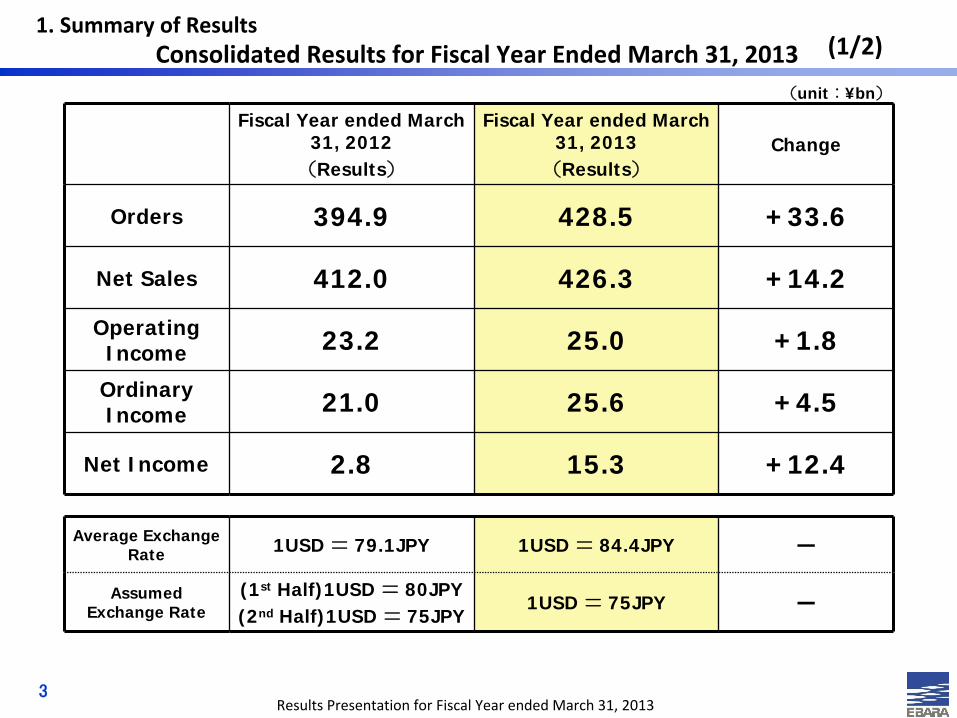
Consolidated Results for Fiscal Year Ended March 31, 2013
Fiscal Year ended March 31, 2012
(Results)
Fiscal Year ended March 31, 2013
(Results)
Change
Orders 394.9 428.5 +33.6
Net Sales 412.0 426.3 +14.2
Operating Income 23.2 25.0 +1.8
Ordinary Income 21.0 25.6 +4.5
Net Income 2.8 15.3 +12.4
Average Exchange Rate 1USD = 79.1JPY 1USD = 84.4JPY ―
Assumed Exchange Rate
(1st Half)1USD = 80JPY(2nd Half)1USD = 75JPY
1USD = 75JPY ―
(unit:¥bn)
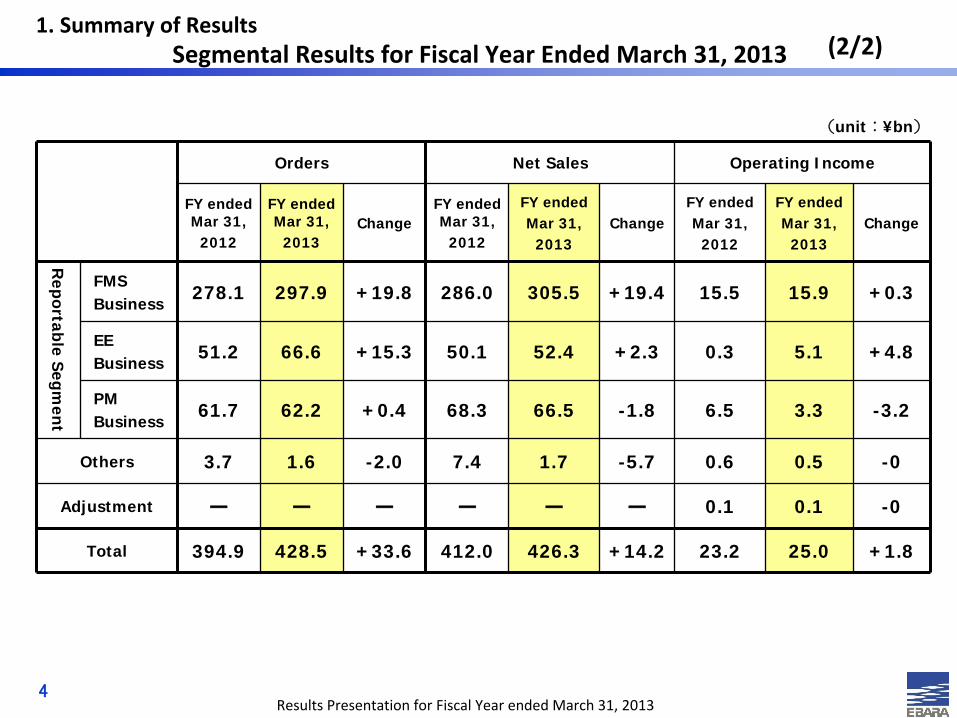
1. Summary of Results (1/2)
3
Results Presentation for Fiscal Year ended March 31, 2013
(unit:¥bn)
Orders Net Sales Operating Income
FY ended Mar 31,
2012
FY ended Mar 31,
2013Change
FY ended Mar 31,
2012
FY endedMar 31,
2013Change
FY endedMar 31,
2012
FY endedMar 31,
2013Change
Reportable Segm
ent
FMSBusiness
278.1 297.9 +19.8 286.0 305.5 +19.4 15.5 15.9 +0.3
EEBusiness
51.2 66.6 +15.3 50.1 52.4 +2.3 0.3 5.1 +4.8
PMBusiness
61.7 62.2 +0.4 68.3 66.5 -1.8 6.5 3.3 -3.2
Others 3.7 1.6 -2.0 7.4 1.7 -5.7 0.6 0.5 -0
Adjustment ― ― ― ― ― ― 0.1 0.1 -0
Total 394.9 428.5 +33.6 412.0 426.3 +14.2 23.2 25.0 +1.8
(2/2)
4
Segmental Results for Fiscal Year Ended March 31, 2013 1. Summary of Results
Results Presentation for Fiscal Year ended March 31, 2013
262.1
278.1
297.9
250
260
270
280
290
300
310
320
268.9
286.0
305.5
250
260
270
280
290
300
310
320
21.5
15.515.9
12
14
16
18
20
22
'11/03results
'12/03results
'13/03results
unit:¥bn
(1/6)
5
'11/03results
'12/03results
'13/03results
'11/03results
'12/03results
'13/03results
【Orders】Increased in YoY results
・Compressors & Turbine business still maintained a preferable level of sales for emerging countries
・Sales increased in compressors & Turbines business
・Compressors & Turbines and Chillers business
・Active investments in oil, gas and chemical markets
【Sales】Increased in YoY resutls
・Chillers business increased sales for China
【Operating Income】Slightly increased in YoY results
・Depreciation of Yen(JPY)
steadily changed in emerging countries incl. China
・Pumps business: Sales from less‐profitable projectwere posted
+19.8
+19.4
+0.3
FMS Results for Fiscal Year Ended March 31, 2013
Orders
Sales
Operating
Income
FMS business ・・・Fluid Machinery & Systems business
1. Summary of Results
Results Presentation for Fiscal Year ended March 31, 2013
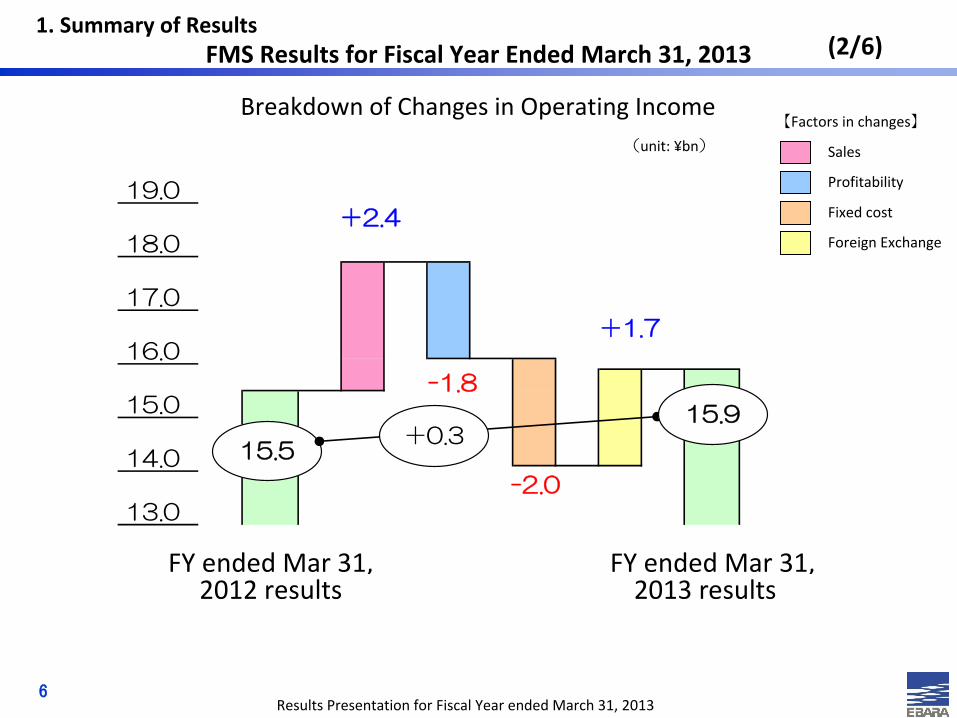
(2/6)
Sales
Profitability
Fixed cost
Foreign Exchange
【Factors in changes】
6
FMS Results for Fiscal Year Ended March 31, 2013
FY ended Mar 31, FY ended Mar 31,2012 results 2013 results
18.0
14.0
15.0
16.0
19.0
17.0
13.0
15.5
+2.4
-1.8
+1.7
-2.0
15.9+0.3
1. Summary of Results
Breakdown of Changes in Operating Income(unit: ¥bn)
Results Presentation for Fiscal Year ended March 31, 2013
82.5
51.2
66.6
40
50
60
70
80
90
50.1
52.451.6
40
50
60
70
0.9
0.3
5.1
0
2
4
6
8
・ O&M: making stable earnings
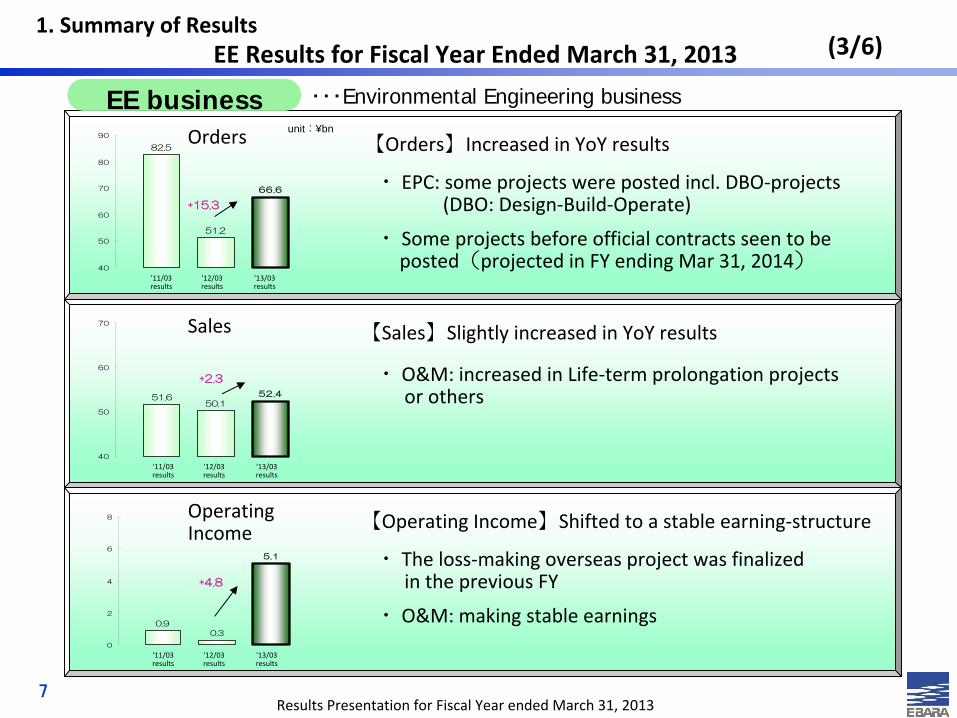
・ EPC: some projects were posted incl. DBO‐projects(DBO: Design‐Build‐Operate)
・ Some projects before official contracts seen to beposted(projected in FY ending Mar 31, 2014)
【Sales】Slightly increased in YoY results
【Operating Income】Shifted to a stable earning‐structure
(3/6)
7
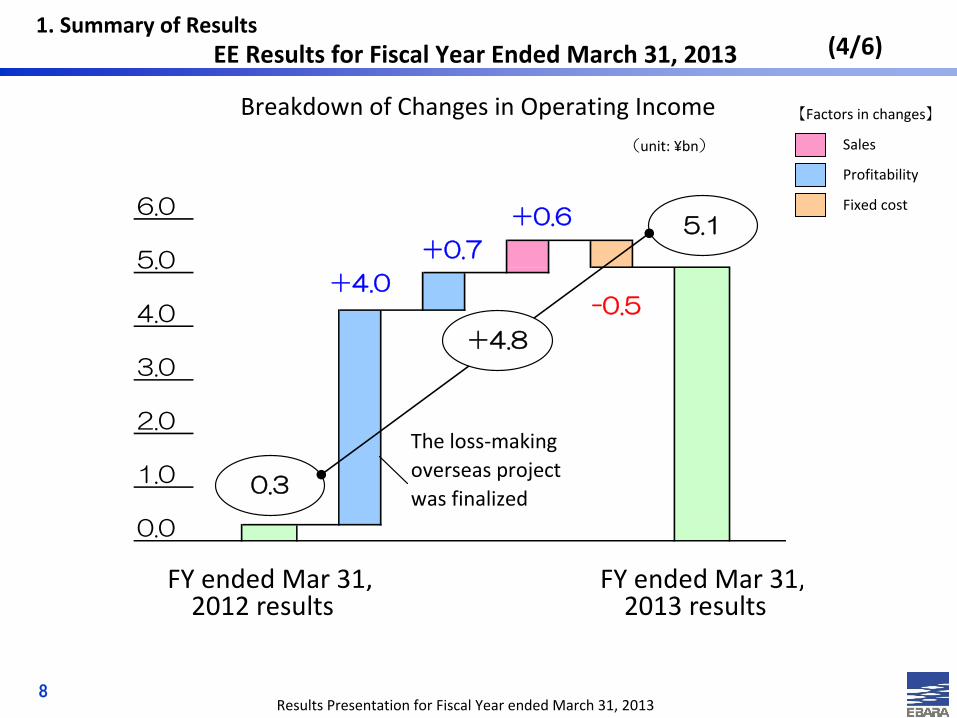
・ The loss‐making overseas project was finalizedin the previous FY
・ O&M:
increased in Life‐term prolongation projectsor others
+2.3
+15.3
+4.8
【Orders】Increased in YoY results
EE Results for Fiscal Year Ended March 31, 2013
unit:¥bn
'11/03results
'12/03results
'13/03results
'11/03results
'12/03results
'13/03results
'11/03results
'12/03results
'13/03results
Orders
Sales
Operating
Income
EE business ・・・Environmental Engineering business
1. Summary of Results
Results Presentation for Fiscal Year ended March 31, 2013
(4/6)
(unit: ¥bn)
8
Sales
Profitability
Fixed cost
【Factors in changes】
EE Results for Fiscal Year Ended March 31, 2013 1. Summary of Results
Breakdown of Changes in Operating Income
FY ended Mar 31, FY ended Mar 31,2012 results 2013 results
1.0
0.0
5.0
4.0
3.0
2.0
6.0
+0.7
-0.5+4.0
+0.6
The loss‐makingoverseas projectwas finalized
0.3
5.1
+4.8
Results Presentation for Fiscal Year ended March 31, 2013
74.6
61.7 62.2
40
50
60
70
80
67.9 68.366.5
40
50
60
70
80
8.0
6.5
3.3
0
2
4
6
8
10
(5/6)
9
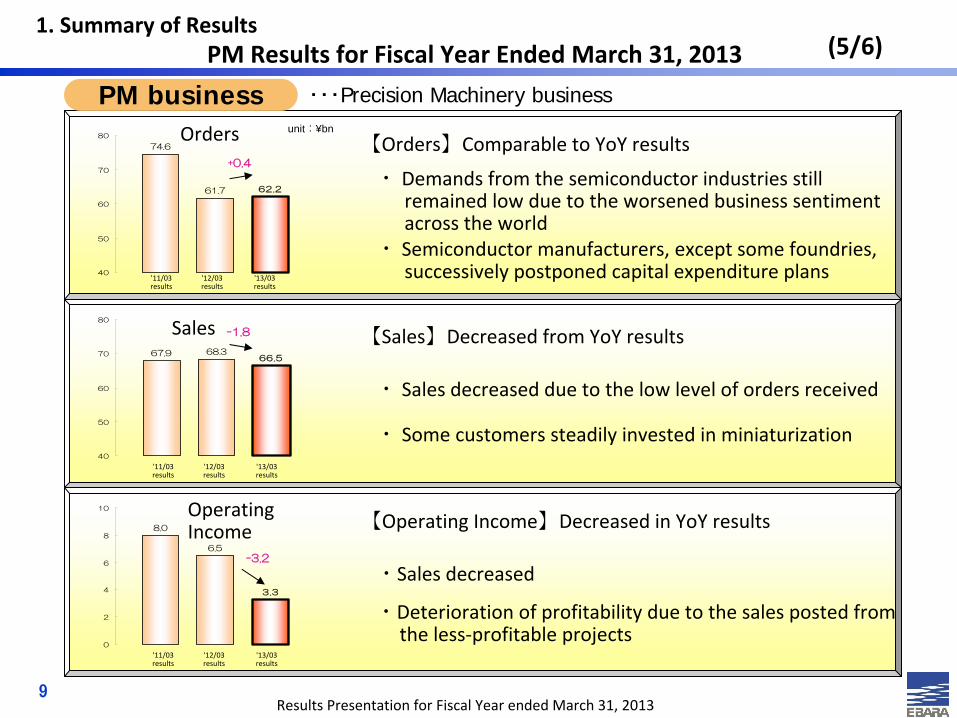
【Orders】Comparable to YoY results
【Sales】Decreased from YoY results
・Deterioration of profitability due to the sales posted fromthe less‐profitable projects
・ Demands from the semiconductor industries still
remained low due to the worsened business sentiment across the world
・ Semiconductor manufacturers, except some foundries,successively postponed capital expenditure plans
・ Sales decreased due to the low level of orders received
・ Some customers steadily invested in miniaturization
【Operating Income】Decreased in YoY results
・Sales decreased-3.2
+0.4
-1.8
PM Results for Fiscal Year Ended March 31, 2013
unit:¥bn
'11/03results
'12/03results
'13/03results
'11/03results
'12/03results
'13/03results
'11/03results
'12/03results
'13/03results
Orders
Sales
Operating
Income
PM business ・・・Precision Machinery business
1. Summary of Results
Results Presentation for Fiscal Year ended March 31, 2013
(6/6)
Sales
Profitability
【Factors in changes】
10
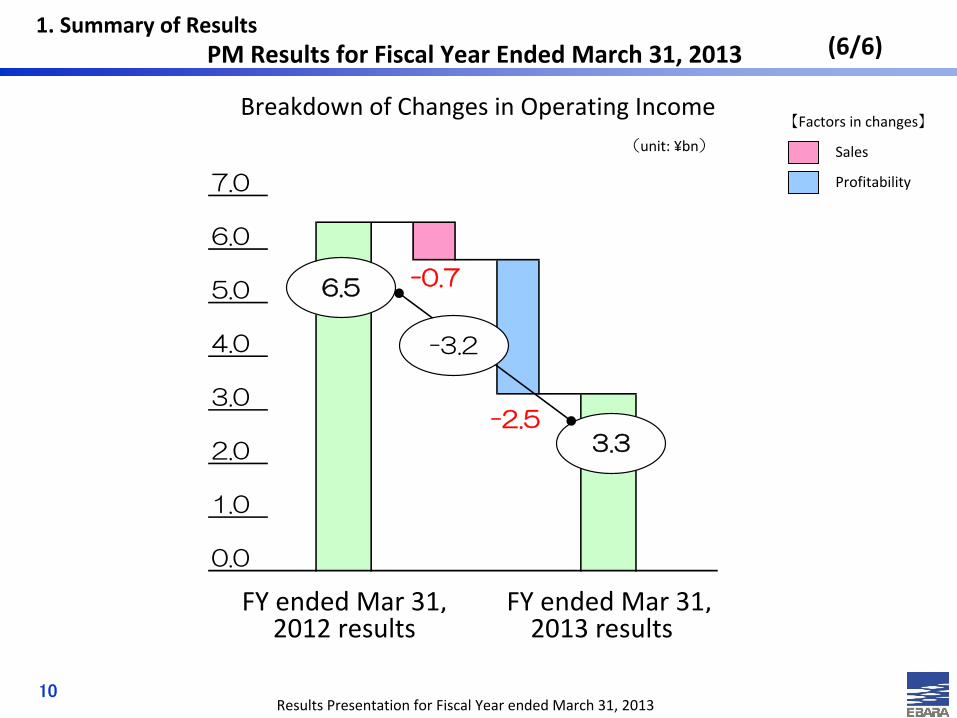
PM Results for Fiscal Year Ended March 31, 2013 1. Summary of Results
Breakdown of Changes in Operating Income(unit: ¥bn)
FY ended Mar 31, FY ended Mar 31,2012 results 2013 results
1.0
0.0
7.0
6.0
5.0
4.0
3.0
2.0
6.5 -0.7
-2.53.3
-3.2
Results Presentation for Fiscal Year ended March 31, 2013
FY endedMar 31, 2012
FY endedMar 31, 2013
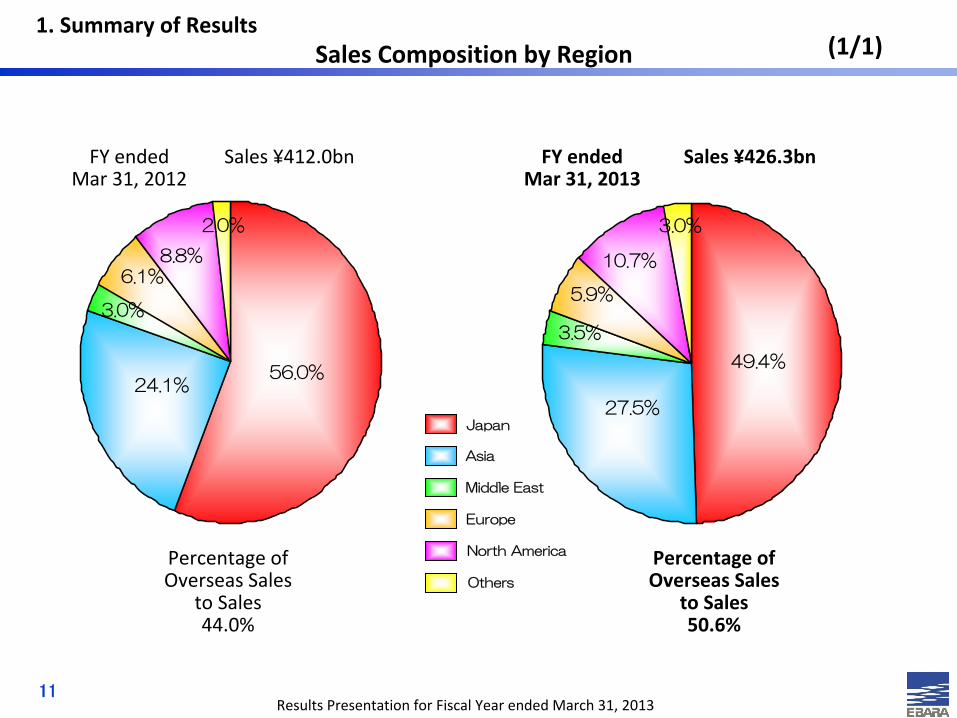
Japan
Asia
Middle East
Europe
North America
Others
Percentage ofOverseas Sales
to Sales44.0%
Percentage ofOverseas Sales
to Sales50.6%
Sales
¥412.0bn Sales
¥426.3bn
(1/1)
24.1%
3.0%
6.1%8.8%
2.0%
56.0%
27.5%
3.5%
5.9%
10.7%
3.0%
49.4%
11
Sales Composition by Region 1. Summary of Results
Results Presentation for Fiscal Year ended March 31, 2013
0
100
200
300
400
500
600
FY ended Mar 31,2012 FY ended Mar 31,2013
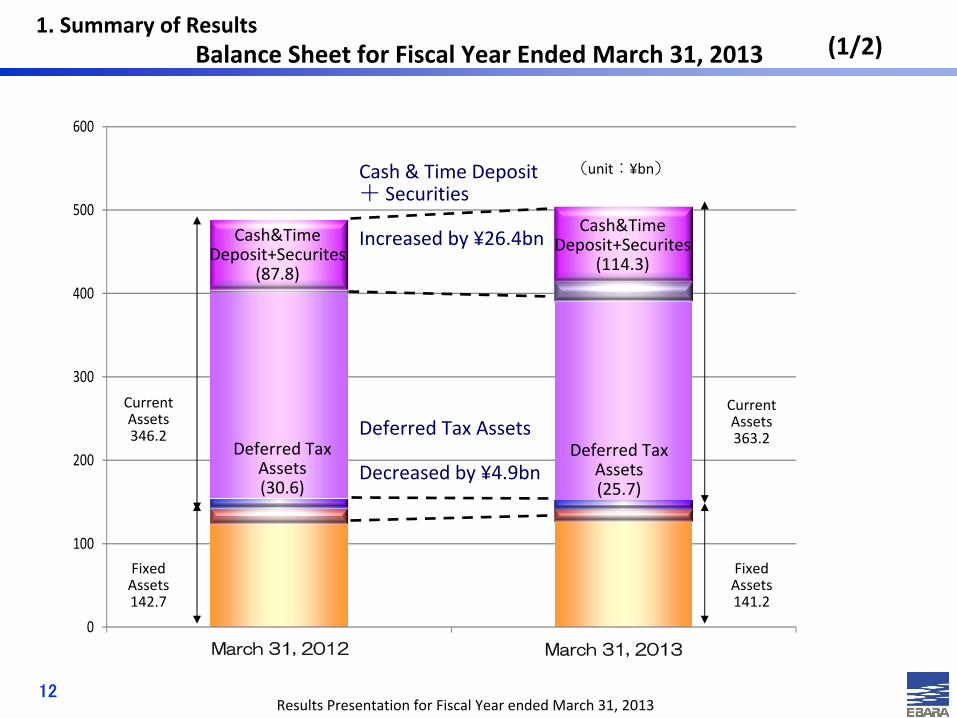
(1/2)
Cash & Time Deposit
+ Securities
Increased by ¥26.4bn
12
(unit:¥bn)
March 31, 2012
Cash&Time
Deposit+Securites
(114.3)
Cash&Time
Deposit+Securites
(87.8)
Current
Assets363.2
Current
Assets346.2
Fixed
Assets142.7
Deferred Tax Assets
Decreased by ¥4.9bnDeferred Tax
Assets(30.6)
Deferred Tax
Assets(25.7)
FixedAssets141.2
March 31, 2013
Balance Sheet for Fiscal Year Ended March 31, 2013 1. Summary of Results
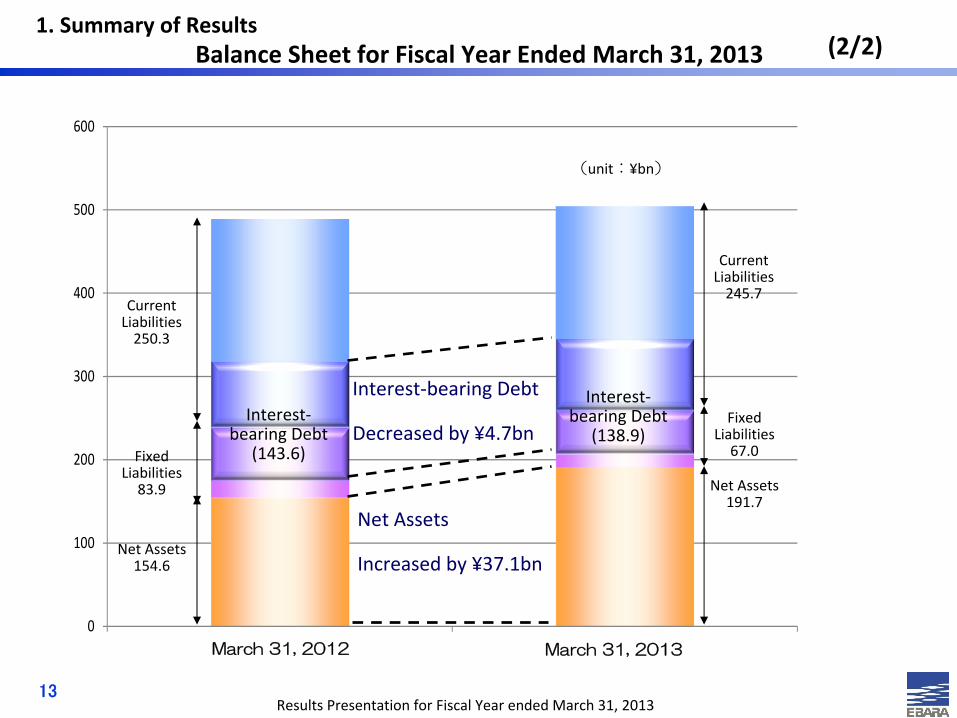
Results Presentation for Fiscal Year ended March 31, 2013
0
100
200
300
400
500
600
FY ended Mar 31,2012 FY ended Mar 31,2013
(2/2)
March 31, 2012
13
Interest‐bearing Debt
Decreased by ¥4.7bn
Net Assets
Increased by ¥37.1bn
Current
Liabilities245.7
Interest‐
bearing Debt
(138.9)Fixed
Liabilities67.0
Net Assets191.7
CurrentLiabilities250.3
Interest‐
bearing Debt
(143.6)Fixed
Liabilities83.9
Net Assets154.6
March 31, 2013
Balance Sheet for Fiscal Year Ended March 31, 2013
(unit:¥bn)
1. Summary of Results
Results Presentation for Fiscal Year ended March 31, 2013
Capital Expenditure /Depreciation & Amortization Expenses
Research and Development
Expenses
'12/3results
'13/3results
'14/3plan
'12/3results
'13/3results
'14/3plan
(unit:¥bn)(unit:¥bn)
12.712.3
3.8
5.012.312.3
(1/2)
14
Supplementary information
Capital Expenditure (1st Half)
Capital Expenditure (2nd Half)
Depreciation & Amortization (1st Half)
Depreciation & Amortization (2nd Half)
R&D Investment (1st Half)
R&D Investment (2nd Half)
1. Summary of Results
3.86.2 5.5 5.6
8.56.5 6.8 6.7
19.5
14.0
0.0
5.0
10.0
15.0
20.0
1.72.3
2.1
2.76.5
0.0
2.5
5.0
7.5
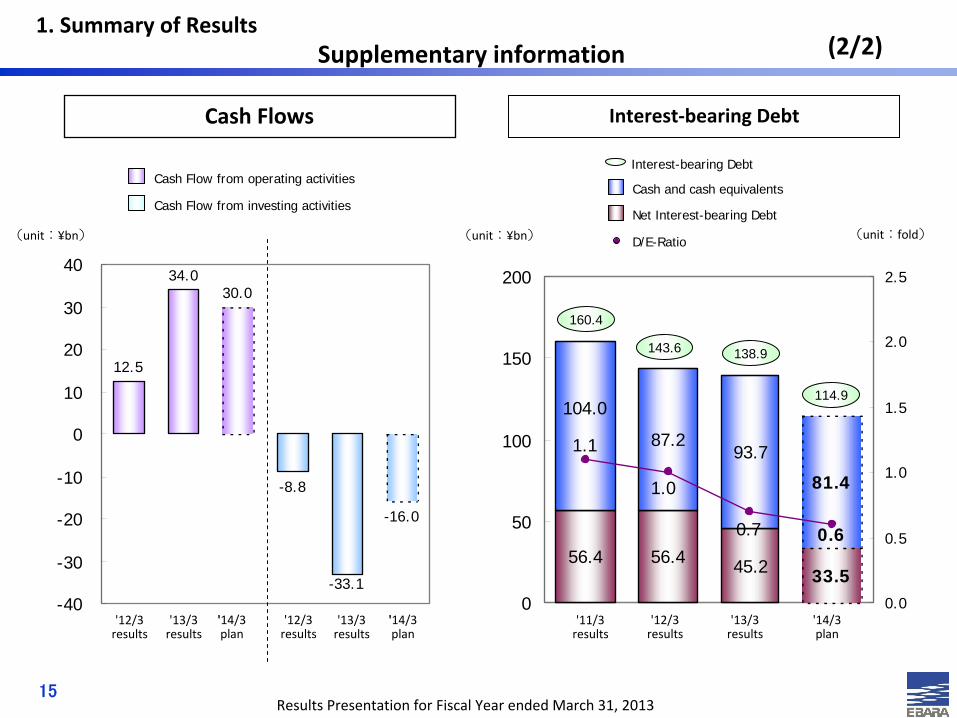
Results Presentation for Fiscal Year ended March 31, 2013
12.5
34.030.0
-16.0
-33.1
-8.8
-40
-30
-20
-10
0
10
20
30
40
Cash Flows
'14/3plan
'12/3results
'14/3plan
'12/3results
'13/3results
'13/3results
Interest‐bearing Debt
'11/3results
'12/3results
'13/3results
'14/3plan
(unit:¥bn) (unit:fold)(unit:¥bn)
(2/2)
15
Supplementary information
56.4 56.4 45.2
87.293.7
33.5
104.0
81.4
1.1
1.0
0.7 0.6
0
50
100
150
200
0.0
0.5
1.0
1.5
2.0
2.5
1. Summary of Results
160.4
143.6 138.9
114.9
Cash and cash equivalents
Net Interest-bearing Debt
D/E-Ratio
Interest-bearing DebtCash Flow from operating activities
Cash Flow from investing activities
Results Presentation for Fiscal Year ended March 31, 2013
2.
Projection and Management Strategy
1.
Summary of ResultsSenior Managing Executive OfficerResponsible for Finance&
Accounting
President and Representative Director
Tetsuji Fujimoto
Toichi Maeda
Results Presentation for Fiscal Year ended March 31, 2013
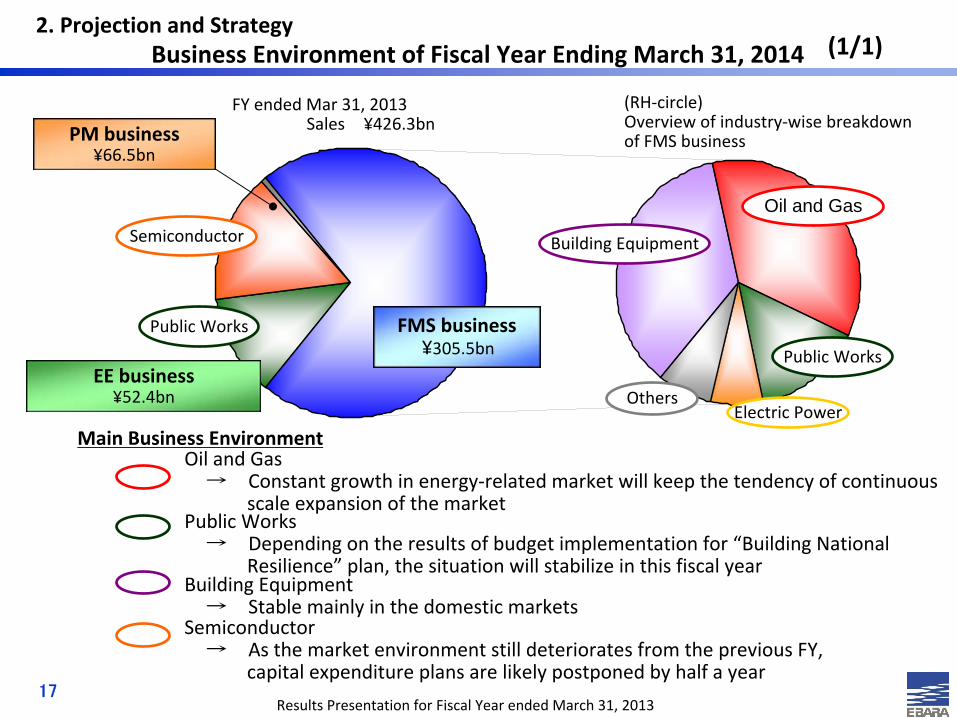
FMS business¥305.5bn Public Works
Oil and Gas
Building Equipment
Electric PowerOthers
Semiconductor
FY ended Mar 31, 2013Sales
¥426.3bn
Main Business EnvironmentOil and Gas
→
Constant growth in energy‐related market will keep the tendency of continuous scale expansion
of the market Public Works
→
Depending on the results of budget implementation for “Building NationalResilience”
plan, the situation will stabilize in this fiscal year
Semiconductor→
As the market environment still deteriorates from the previous FY,capital expenditure plans are likely postponed by half a year
2. Projection and Strategy
(RH‐circle)Overview of industry‐wise breakdownof FMS business
Building Equipment→
Stable mainly in the domestic markets
(1/1)
PM business¥66.5bn
17
EE business¥52.4bn
Public Works
Business Environment of Fiscal Year Ending March 31, 2014
Results Presentation for Fiscal Year ended March 31, 2013
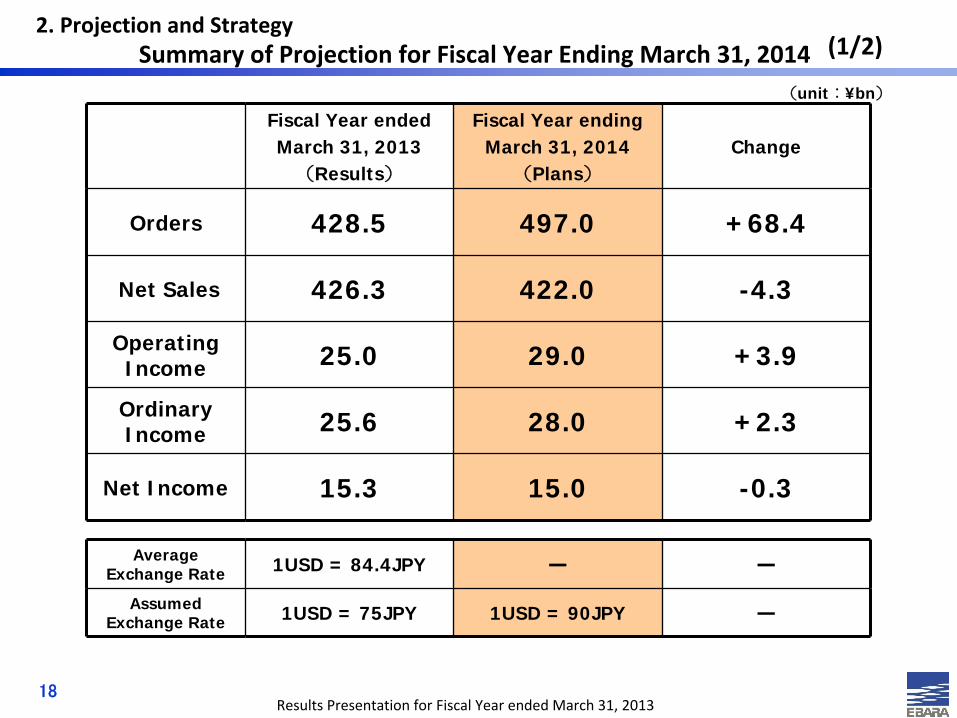
Fiscal Year endedMarch 31, 2013
(Results)
Fiscal Year endingMarch 31, 2014
(Plans)
Change
Orders 428.5 497.0 +68.4
Net Sales 426.3 422.0 -4.3
Operating Income 25.0 29.0 +3.9
Ordinary Income 25.6 28.0 +2.3
Net Income 15.3 15.0 -0.3
Average Exchange Rate 1USD = 84.4JPY ― ―
Assumed Exchange Rate 1USD = 75JPY 1USD = 90JPY ―
(1/2)
18
(unit:¥bn)
Summary of Projection for Fiscal Year Ending March 31, 20142. Projection and Strategy
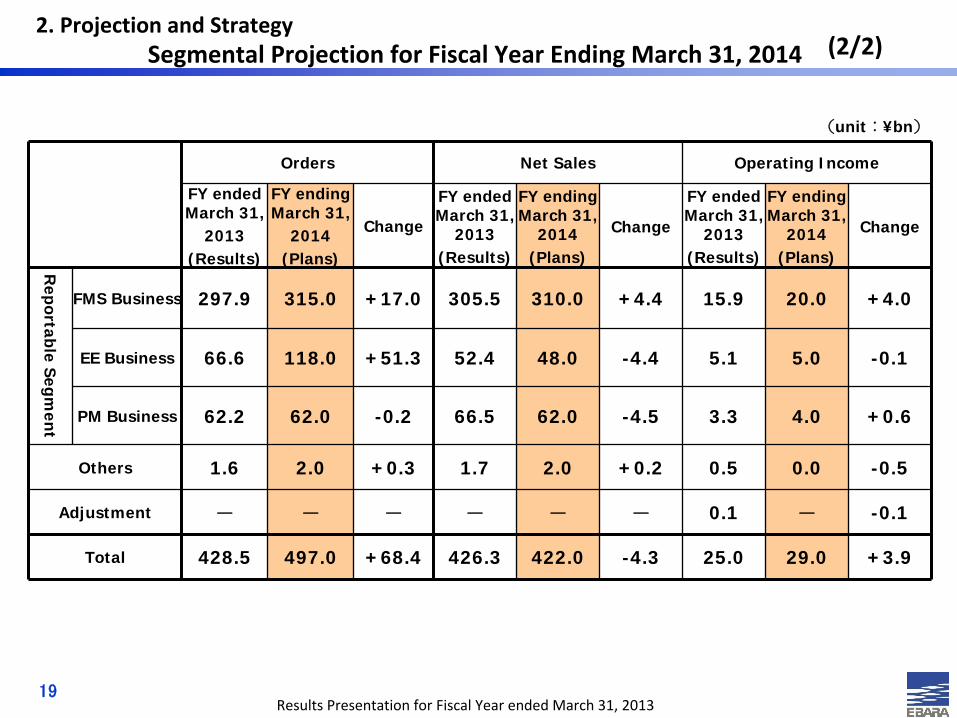
Results Presentation for Fiscal Year ended March 31, 2013
(unit:¥bn)
Orders Net Sales Operating Income
FY ended March 31,
2013(Results)
FY ending March 31,
2014(Plans)
Change
FY ended March 31,
2013(Results)
FY ending March 31,
2014(Plans)
Change
FY ended March 31,
2013(Results)
FY ending March 31,
2014(Plans)
Change
Reportable Segm
ent
FMS Business 297.9 315.0 +17.0 305.5 310.0 +4.4 15.9 20.0 +4.0
EE Business 66.6 118.0 +51.3 52.4 48.0 -4.4 5.1 5.0 -0.1
PM Business 62.2 62.0 -0.2 66.5 62.0 -4.5 3.3 4.0 +0.6
Others 1.6 2.0 +0.3 1.7 2.0 +0.2 0.5 0.0 -0.5
Adjustment - - - - - - 0.1 - -0.1
Total 428.5 497.0 +68.4 426.3 422.0 -4.3 25.0 29.0 +3.9
19
(2/2)Segmental Projection for Fiscal Year Ending March 31, 2014 2. Projection and Strategy

Results Presentation for Fiscal Year ended March 31, 2013
278.1
297.9
315.0
250
260
270
280
290
300
310
320
286.0
305.5310.0
250
260
270
280
290
300
310
320
15.515.9
20.0
12
14
16
18
20
22
(1/3)
20
【Projection of Orders】Exceed the results of FY ended Mar 31, 2013
・Add up Energy‐related investment (Shale‐gas or others)
・Demand expansion in Asian region
【Projection of Sales】Exceed the results of FY ended Mar 31, 2013
・Pumps and Chillers business sales expand in Asia region
・Compressors & Turbines business sales expand inregions where the investment is increased such asNorth America or China
【Projection of Operating Income】Target the results of FY ended Mar 31, 2013 or more
・Sales increase
・Improvement of profitability
+17.0
+4.4
+4.0
FMS Projection for Fiscal Year Ending March 31, 2014
Orders
Sales
Operating
Income
'12/03results
'13/03results
'14/03plan
'12/03results
'13/03results
'14/03plan
'12/03results
'13/03results
'14/03plan
unit:¥bn
FMS business ・・・Fluid Machinery & Systems business
2. Projection and Strategy
Results Presentation for Fiscal Year ended March 31, 2013
51.2
66.6
118.0
40
60
80
100
120
140
52.4
48.050.1
40
50
60
70
0.3
5.1 5.0
0
2
4
6
8
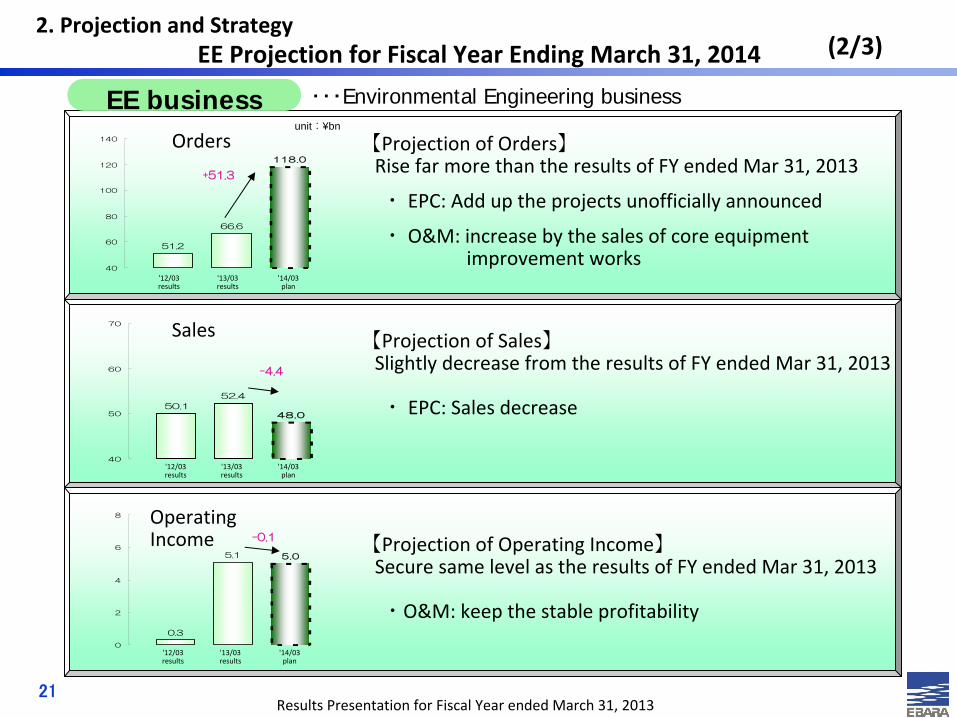
【Projection of Orders】Rise far more than the results of FY ended Mar 31, 2013
・ EPC: Add up the projects unofficially announced
・ O&M: increase by the sales of core equipment improvement works
【Projection of Sales】Slightly decrease from the results of FY ended Mar 31, 2013
・ EPC: Sales decrease
【Projection of Operating Income】Secure same level as the results of FY ended Mar 31, 2013
・O&M: keep the stable profitability
(2/3)
21
+51.3
-4.4
-0.1
EE Projection for Fiscal Year Ending March 31, 2014
Orders
Sales
Operating
Income
'12/03results
'13/03results
'14/03plan
unit:¥bn
'12/03results
'13/03results
'14/03plan
'12/03results
'13/03results
'14/03plan
EE business ・・・Environmental Engineering business
2. Projection and Strategy
Results Presentation for Fiscal Year ended March 31, 2013
61.7 62.2 62.0
40
50
60
70
80
68.366.5
62.0
40
50
60
70
80
3.3
4.0
6.5
0
2
4
6
8
10
(3/3)
22
【Projection of Orders】Same as the results of FY ended Mar 31, 2013
・ Demands from the semiconductor industry still remain
low across the world
・ Some of our major customers continue investingin minimization
【Projection of Sales】Fall below the results of FY ended Mar 31, 2013
・ Sales are sluggish due to less back orders in FY endedMar 31, 2013
【Projection of Operating Income】Target the results of
FY ended Mar 31, 2013 or more
・ Improve the profitability caused by the less‐profitableproducts
・ Development on minimization will continue withinlimited range
-0.2
-4.5
+0.6
PM Projection for Fiscal Year Ending March 31, 2014
Orders
Sales
Operating
Income
unit:¥bn
PM business ・・・Precision Machinery business
'12/03results
'13/03results
'14/03plan
'12/03results
'13/03results
'14/03plan
'12/03results
'13/03results
'14/03plan
2. Projection and Strategy
Results Presentation for Fiscal Year ended March 31, 2013
(1/4)
23
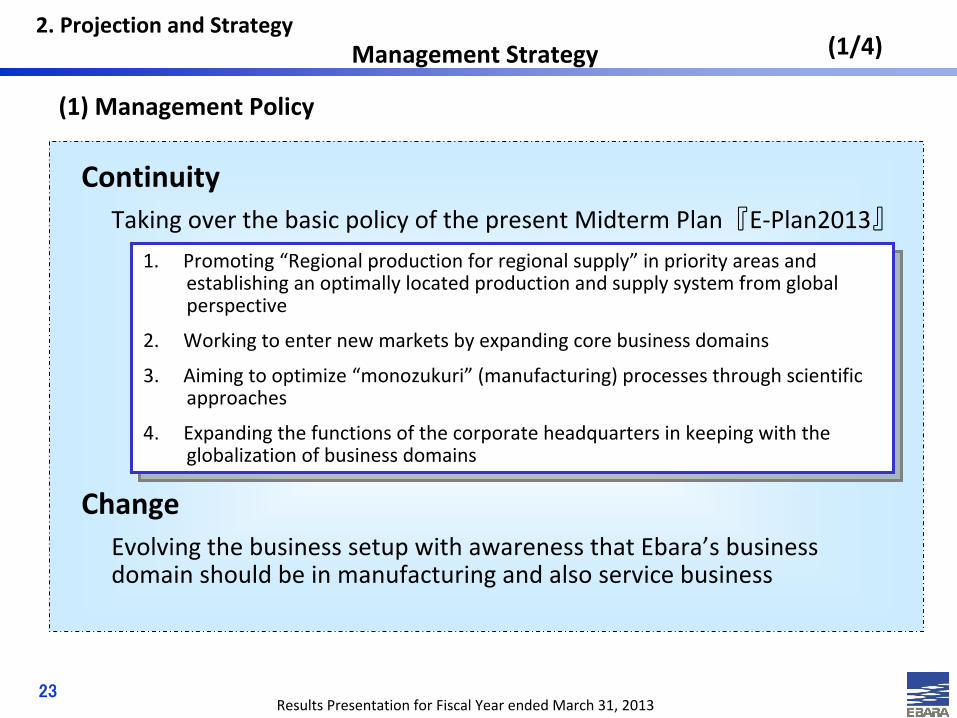
Continuity
Change
Taking over the basic policy of the present
Midterm Plan『E‐Plan2013』
Evolving the business setup with awareness that Ebara’s business domain should be in manufacturing and also service business
(1) Management Policy
1. Promoting “Regional production for regional supply”
in priority areas andestablishing an optimally located production and supply
system from globalperspective
2. Working to enter new markets by expanding core business domains
3. Aiming to optimize “monozukuri”
(manufacturing) processes through scientificapproaches
4. Expanding the functions of the corporate headquarters in keeping with theglobalization of business domains
Management Strategy2. Projection and Strategy
Results Presentation for Fiscal Year ended March 31, 2013
▲
24
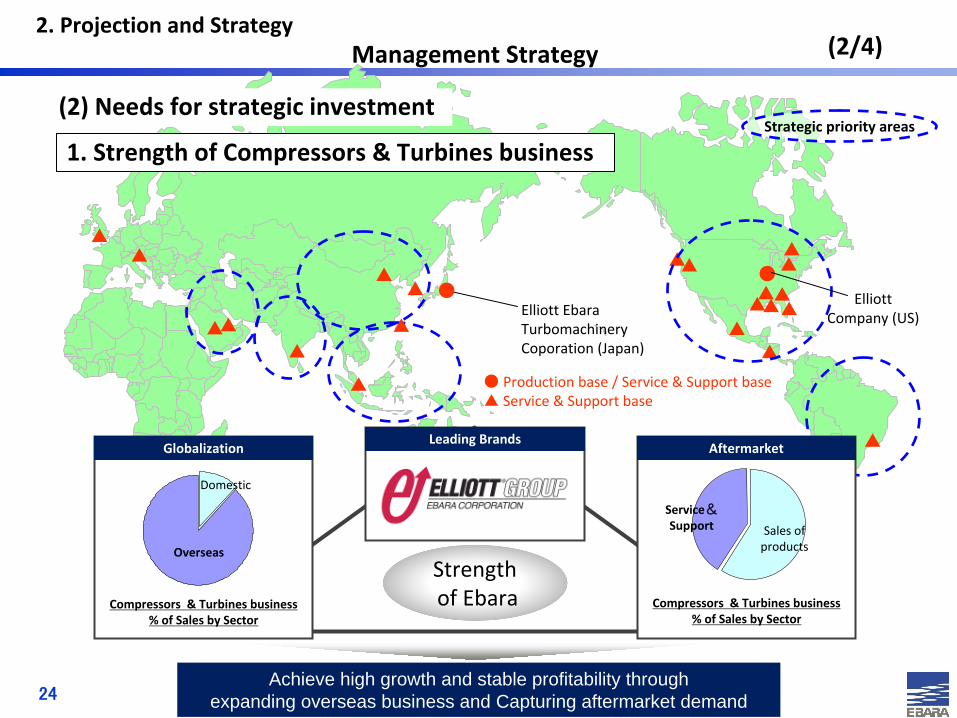
▲Elliott EbaraTurbomachineryCoporation (Japan)
●
▲▲
▲
▲
▲
▲
▲
▲
▲
▲
▲
▲
▲▲
▲▲▲
▲
● Production base
/ Service & Support base▲ Service & Support base
Strengthof Ebara
GlobalizationLeading Brands
Aftermarket
Compressors & Turbines business
% of Sales by Sector
Compressors & Turbines business
% of Sales by Sector
Overseas
Service&
Support
Domestic
Sales of
products
● Elliott
Company (US)
▲
Strategic priority areas
1. Strength of Compressors & Turbines business
(2/4)
(2) Needs for strategic investment
Management Strategy2. Projection and Strategy
Achieve high growth and stable profitability through expanding overseas business and Capturing aftermarket demand
Results Presentation for Fiscal Year ended March 31, 2013
◎
◎
25
◎
◎◎
◎
◎
◎
◎
◎
◎
◎
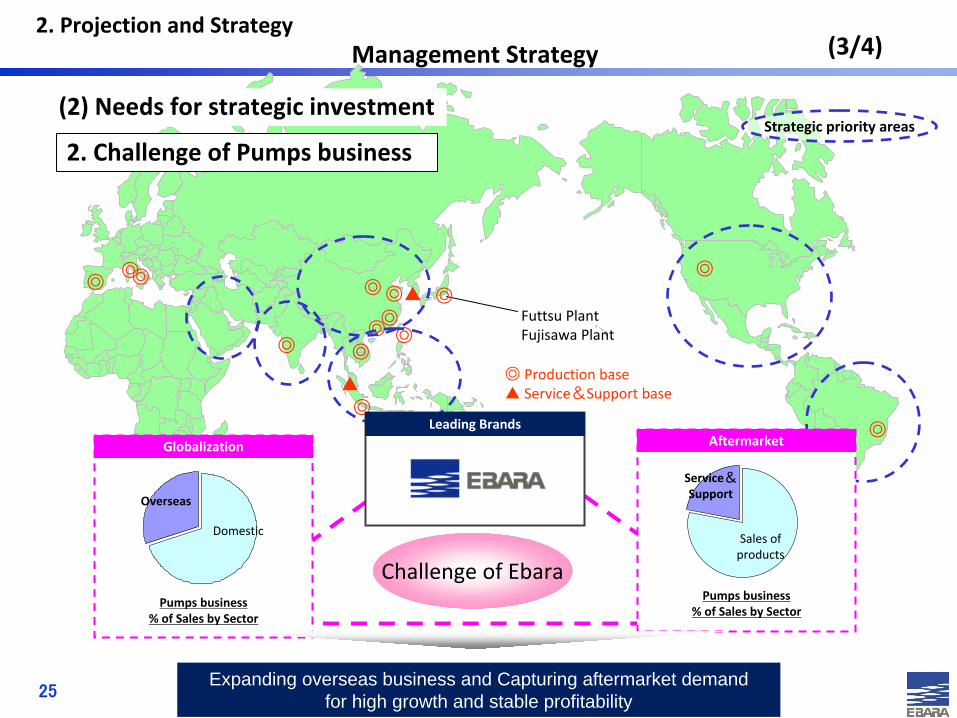
Futtsu PlantFujisawa Plant
◎ Production base▲ Service&Support base
◎
▲
▲
Challenge of Ebara
Globalization
Leading BrandsAftermarket
Pumps business
% of Sales by Sector
Pumps business
% of Sales by Sector
Overseas
Service&
Support
DomesticSales of
products
◎
2. Challenge of Pumps business
(3/4)
(2) Needs for strategic investment Strategic priority areas
Management Strategy2. Projection and Strategy
Expanding overseas business and Capturing aftermarket demand for high growth and stable profitability
Results Presentation for Fiscal Year ended March 31, 2013
(4/4)
26
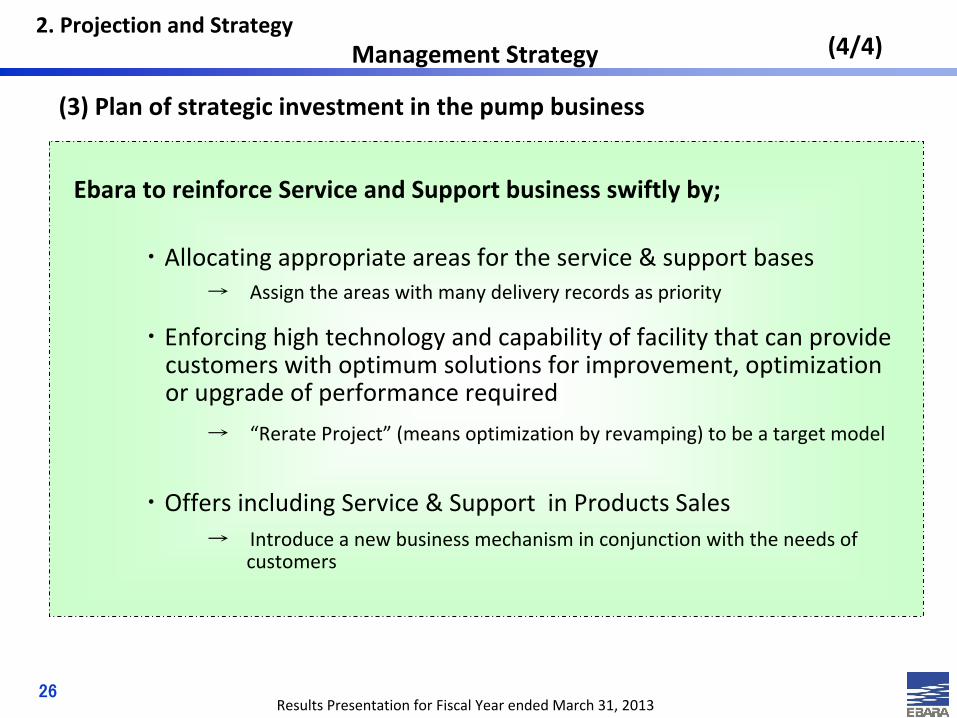
(3) Plan of strategic investment in the pump business
Ebara to reinforce Service and Support business swiftly
by;
・Enforcing high technology and capability of facility that can provide customers with optimum solutions for improvement, optimization or upgrade of performance required
・Offers including Service & Support in Products Sales
・Allocating appropriate areas for the service & support bases→
Assign the areas with many delivery records as priority
→
“Rerate Project”
(means optimization by revamping)
to be a target model
→
Introduce a new business
mechanism in conjunction with the needs of customers
Management Strategy2. Projection and Strategy
Results Presentation for Fiscal Year ended March 31, 2013
This release contains forward‐looking statements which involve certain risks and
uncertainties that could cause actual results to differ materially from those
projected. Readers are cautioned not to place undue reliance on these forward‐
looking statements which are valid only as of the date thereof. EBARA undertakes
no obligation to republish revised forward‐looking statements to reflect events or
circumstances after the date thereof or to reflect the occurrence of unanticipated
events.