Embed Size (px)
Citation preview
投資家の皆様へ
Note on forward-looking statementsThis investors’ guide was prepared on July 1, 2008. Forward-looking statements, including business strategies and business forecasts, were made by the Company’s management, based on information available at that time, and may be revised due to changes in the business environment. Therefore, please be advised that the Company cannot guarantee the accuracy or the credibility of the statements. For the latest information, please refer to our information releases or our website.
01
TOP MESSAGE
Top Message ……………………………………………… 01Topics ……………………………………………………… 02Introduction of Business …………………………………… 03 Semiconductor Products and Electronic Components, etc. … 03 Computer Network Equipment, Software …………… 07 Development Business ………………………………… 09Market Information ………………………………………… 10Operational Review and Outlook for the Next Term …… 11Financial Statements ……………………………………… 12Financial Data ……………………………………………… 15Corporate Profile, Stock Information …………………… 18
PROFILE
1965 Tokyo Electron Limited (TEL) starts selling electronic components (Fairchild and others)
September Tokyo Electron Device Limited (TED) starts1990 selling electronic components
July All TEL’s electronic components operation1998 transferred to TED
March Listed on the Second Section of the Tokyo2003 Stock Exchange
January TED (Shanghai) Limited, a subsidiary, established2004 in Shanghai, China
January TED Hong Kong Limited, a subsidiary, established2005 in Hong Kong, China.
October Sales of computer network solutions start2006 by taking over TEL’s computer network operation
CONTENTS
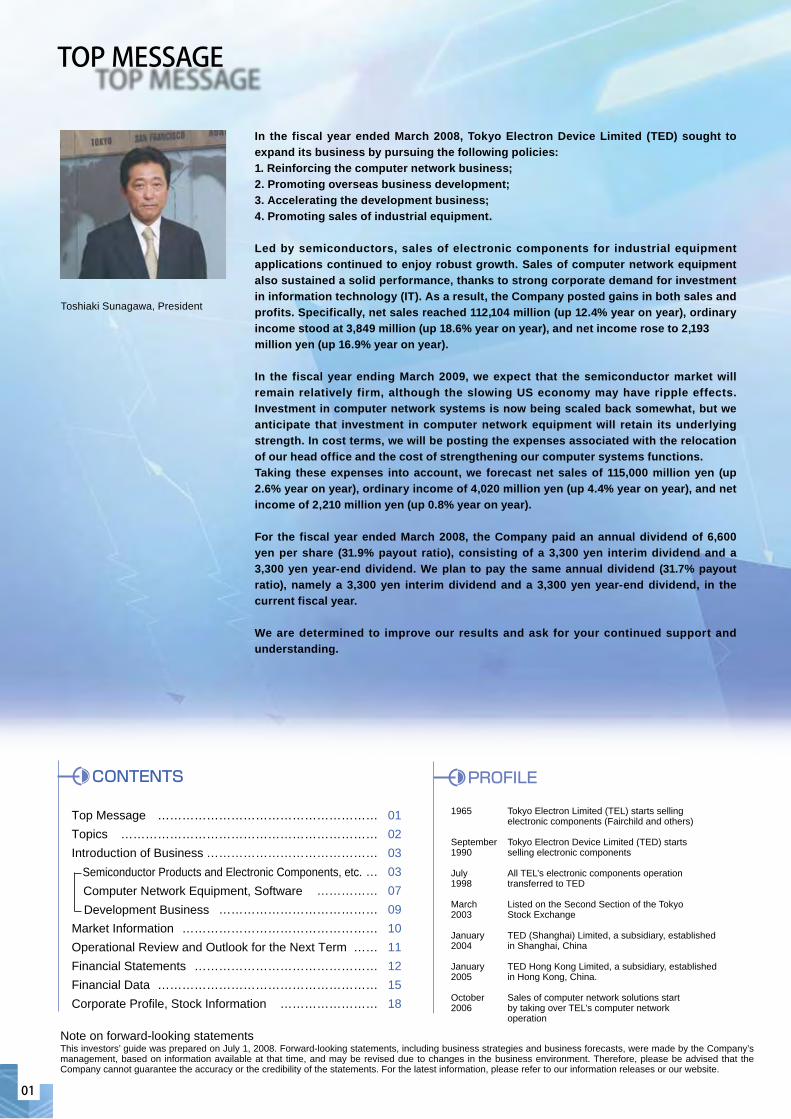
In the fiscal year ended March 2008, Tokyo Electron Device Limited (TED) sought to expand its business by pursuing the following policies:1. Reinforcing the computer network business;2. Promoting overseas business development;3. Accelerating the development business; 4. Promoting sales of industrial equipment.
Led by semiconductors, sales of electronic components for industrial equipment applications continued to enjoy robust growth. Sales of computer network equipment also sustained a solid performance, thanks to strong corporate demand for investment in information technology (IT). As a result, the Company posted gains in both sales and profits. Specifically, net sales reached 112,104 million (up 12.4% year on year), ordinary income stood at 3,849 million (up 18.6% year on year), and net income rose to 2,193million yen (up 16.9% year on year).
In the fiscal year ending March 2009, we expect that the semiconductor market will remain relatively firm, although the slowing US economy may have ripple effects. Investment in computer network systems is now being scaled back somewhat, but we anticipate that investment in computer network equipment will retain its underlying strength. In cost terms, we will be posting the expenses associated with the relocation of our head office and the cost of strengthening our computer systems functions.Taking these expenses into account, we forecast net sales of 115,000 million yen (up 2.6% year on year), ordinary income of 4,020 million yen (up 4.4% year on year), and net income of 2,210 million yen (up 0.8% year on year).
For the fiscal year ended March 2008, the Company paid an annual dividend of 6,600 yen per share (31.9% payout ratio), consisting of a 3,300 yen interim dividend and a 3,300 yen year-end dividend. We plan to pay the same annual dividend (31.7% payout ratio), namely a 3,300 yen interim dividend and a 3,300 yen year-end dividend, in the current fiscal year.
We are determined to improve our results and ask for your continued support and understanding.
Toshiaki Sunagawa, President
PAN ELECTRON LTD.
02
Tokyo Electron Device
In August 2008, the Company will relocate its head office to Yokohama East Square in front of East Gate of Yokohama Station. By amalgamating with our head office sales bases that have hitherto been dispersed around in Shin-Yokohama, we will improve operational ef f iciency and in-house communication, paving the way for fresh expansion. The present head office (at Tsuzuki-ku in Yokohama City) will be used as our engineering center.
Medium-term Business Plan and Action Policy for the Term
Relocation of Head Office
Dividend Policy
TED believes that returning profits to shareholders is one of its top management priorities and, in principle, pays dividends consistently and continuously. We also attach significance to the distribution of profits in accordance with growth. The basic policy is to pay dividends in accordance with performance aiming for a payout ratio of 30% of consolidated net income.
Corporate Governance
The Company took action to improve its internal control systems for the f iscal year ended March 2008. At the initiative of the Internal Control Committee, which is tasked with strengthening and applying all internal control systems, the Ethics Committee, the Risk Management Committee, and the J-SOX Project have all refined their corporate systems. Meanwhile, we set up a new committee, the Information Security Committee, in May 2008.
March 2008 March 2009(Forecast)
Interim Year-end Interim Year-endDividend per share (yen) 3,300 3,300 3,300 3,300
Payout ratio 31.9% 31.7%
Topics
0
300
600
900
1,200
1,500
1,800(Hundred million yen)
Net sales
Ordinary income
(Hundred million yen)
0
20
40
60
80
100
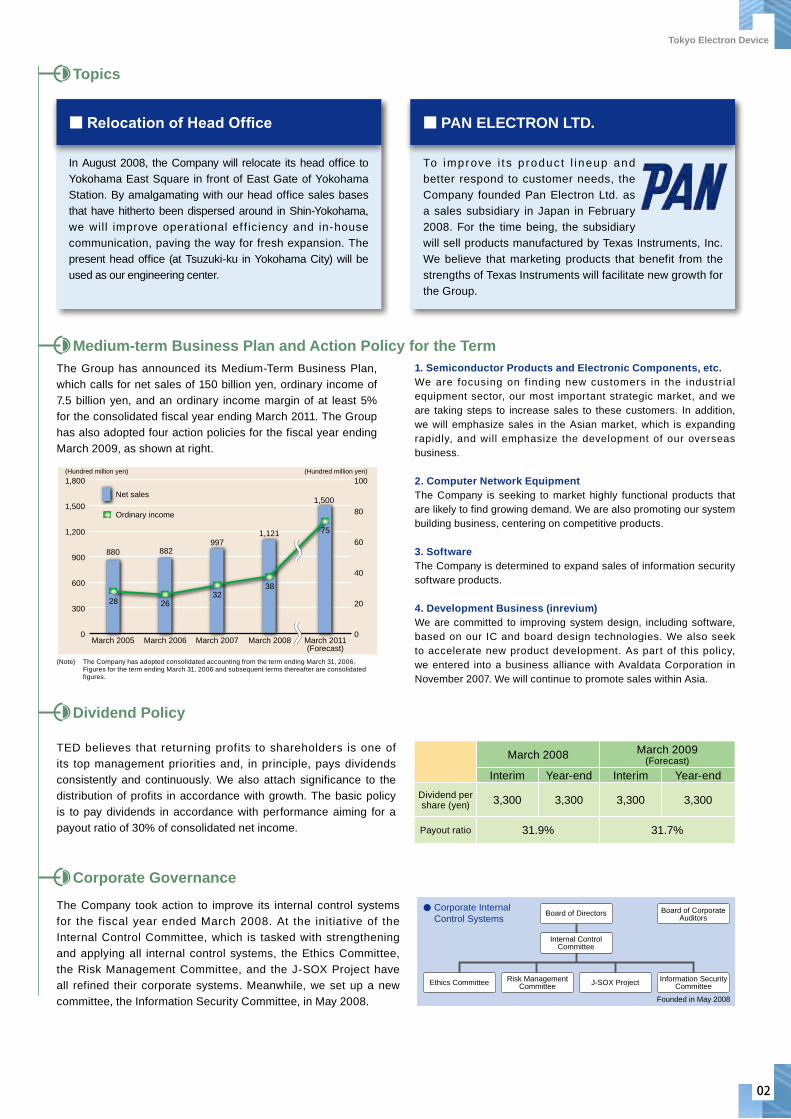
75
1,500
38
1,121
32
997
26
March 2011(Forecast)
March 2008March 2007March 2006
882
28
880
March 2005
To improve i t s p roduc t l ineup and better respond to customer needs, the Company founded Pan Electron Ltd. as a sales subsidiary in Japan in February 2008. For the time being, the subsidiary will sell products manufactured by Texas Instruments, Inc. We believe that marketing products that benefit from the strengths of Texas Instruments will facilitate new growth for the Group.
Corporate Internal
Control SystemsBoard of Directors
Internal ControlCommittee
Ethics CommitteeRisk Management
CommitteeJ-SOX Project
Founded in May 2008
Information SecurityCommittee
Board of CorporateAuditors
(Note) The Company has adopted consolidated accounting from the term ending March 31, 2006. Figures for the term ending March 31, 2006 and subsequent terms thereafter are consolidated figures.
The Group has announced its Medium-Term Business Plan, which calls for net sales of 150 billion yen, ordinary income of 7.5 billion yen, and an ordinary income margin of at least 5% for the consolidated fiscal year ending March 2011. The Group has also adopted four action policies for the fiscal year ending March 2009, as shown at right.
1. Semiconductor Products and Electronic Components, etc.We are focusing on f inding new customers in the industr ial equipment sector, our most important strategic market, and we are taking steps to increase sales to these customers. In addition, we will emphasize sales in the Asian market, which is expanding rapidly, and will emphasize the development of our overseas business.
2. Computer Network EquipmentThe Company is seeking to market highly functional products that are likely to find growing demand. We are also promoting our system building business, centering on competitive products.
3. Software The Company is determined to expand sales of information security software products.
4. Development Business (inrevium) We are committed to improving system design, including software, based on our IC and board design technologies. We also seek to accelerate new product development. As part of this policy, we entered into a business alliance with Avaldata Corporation in November 2007. We will continue to promote sales within Asia.
03
T o k y o E l e c t r o n D e v i c e
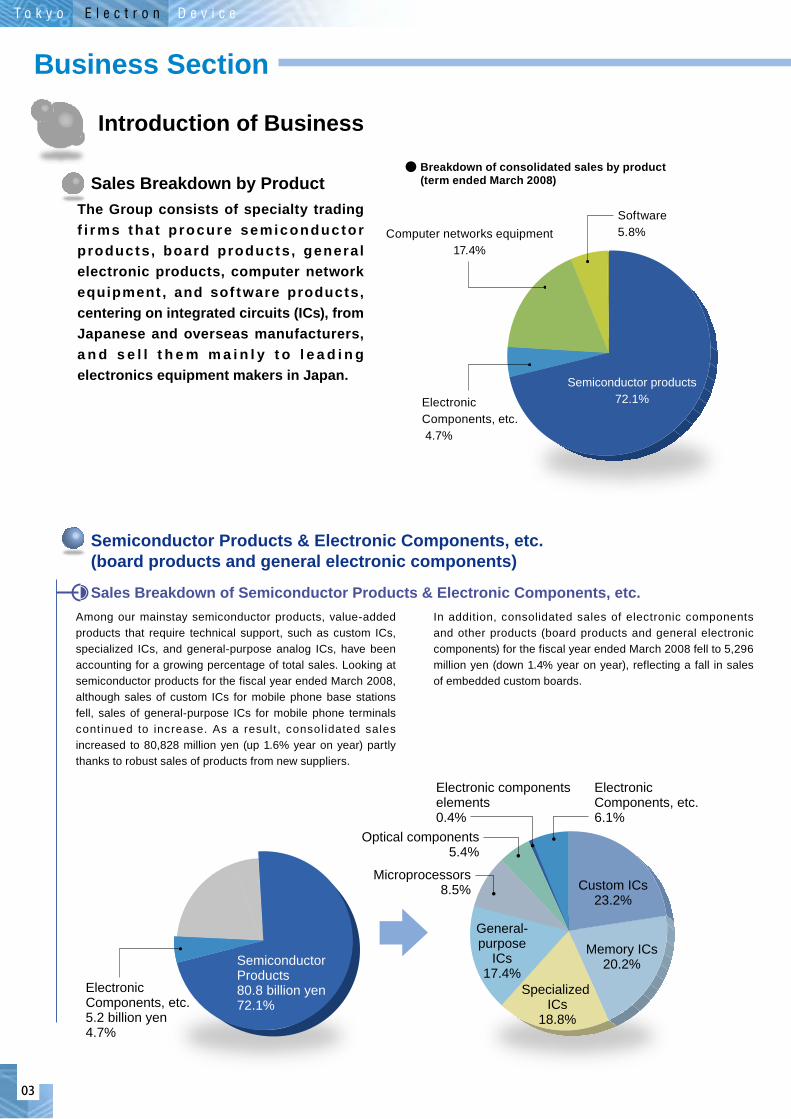
Electronic Components, etc. 6.1%
Electronic Components, etc. 5.2 billion yen4.7%
Semiconductor Products80.8 billion yen72.1%
Electronic components elements0.4%
Optical components5.4%
Microprocessors8.5% Custom ICs
23.2%
Memory ICs20.2%
Specialized ICs
18.8%
General-purpose
ICs17.4%
The Group consists of specialty trading f i r ms tha t p rocure semiconduc tor products, board products, general electronic products, computer network equipment , and sof tware products, centering on integrated circuits (ICs), from Japanese and overseas manufacturers, a n d s e l l t h e m m a i n l y t o l e a d i n g electronics equipment makers in Japan. Semiconductor products
72.1%
Computer networks equipment17.4%
Software5.8%
Electronic Components, etc. 4.7%
Breakdown of consolidated sales by product(term ended March 2008)
Semiconductor Products & Electronic Components, etc. (board products and general electronic components)
Sales Breakdown by Product
Business Section
Sales Breakdown of Semiconductor Products & Electronic Components, etc.
Introduction of Business
Among our mainstay semiconductor products, value-added products that require technical support, such as custom ICs, specialized ICs, and general-purpose analog ICs, have been accounting for a growing percentage of total sales. Looking at semiconductor products for the fiscal year ended March 2008, although sales of custom ICs for mobile phone base stations fell, sales of general-purpose ICs for mobile phone terminals continued to increase. As a result, consolidated sales increased to 80,828 million yen (up 1.6% year on year) partly thanks to robust sales of products from new suppliers.
In addition, consolidated sales of electronic components and other products (board products and general electronic components) for the fiscal year ended March 2008 fell to 5,296 million yen (down 1.4% year on year), reflecting a fall in sales of embedded custom boards.
04
Tokyo Electron Device
Semiconductor Products and Electronic Components, etc.
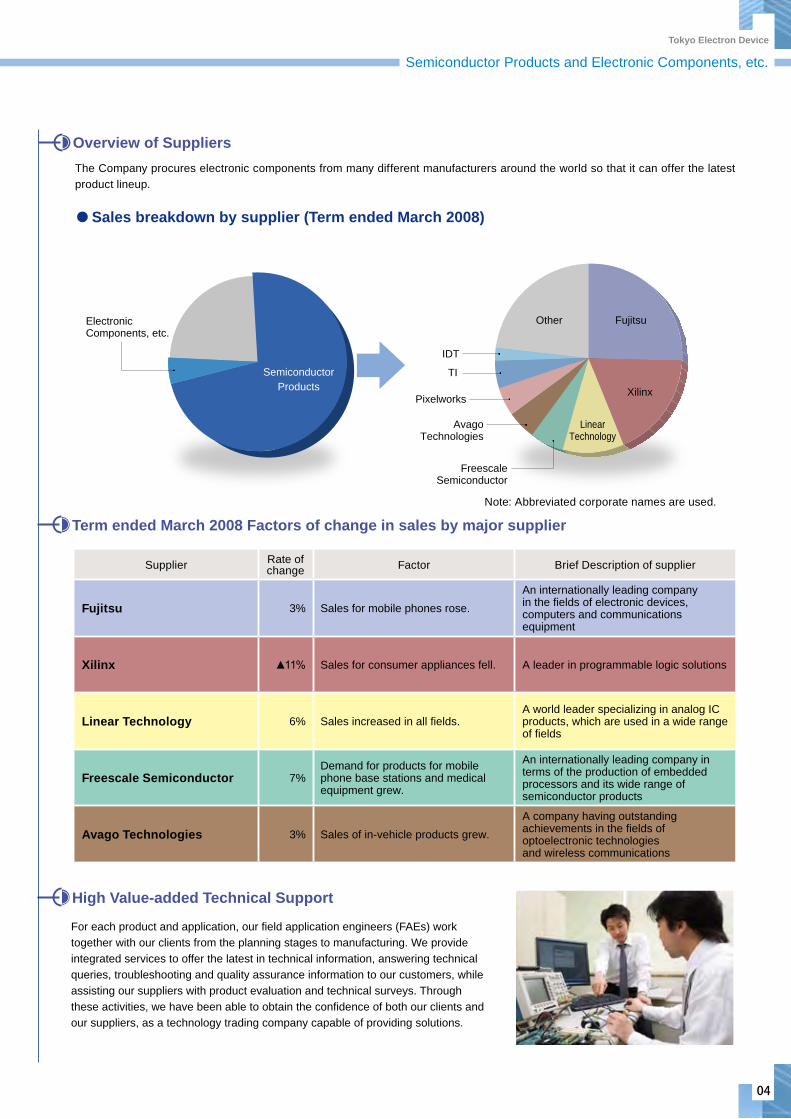
The Company procures electronic components from many different manufacturers around the world so that it can offer the latest product lineup.
Sales breakdown by supplier (Term ended March 2008)
TI
IDT
FreescaleSemiconductor
Electronic Components, etc.
AvagoTechnologies
Pixelworks
FujitsuOther
Xilinx
LinearTechnology
SemiconductorProducts
High Value-added Technical Support
Supplier Rate ofchange Factor Brief Description of supplier
Fujitsu 3% Sales for mobile phones rose.An internationally leading company in the fields of electronic devices, computers and communications equipment
Xilinx ▲11% Sales for consumer appliances fell. A leader in programmable logic solutions
Linear Technology 6% Sales increased in all fields.A world leader specializing in analog IC products, which are used in a wide range of fields
Freescale Semiconductor 7%Demand for products for mobile phone base stations and medical equipment grew.
An internationally leading company in terms of the production of embedded processors and its wide range of semiconductor products
Avago Technologies 3% Sales of in-vehicle products grew. A company having outstanding achievements in the fields of optoelectronic technologies and wireless communications
For each product and application, our field application engineers (FAEs) work together with our clients from the planning stages to manufacturing. We provide integrated services to offer the latest in technical information, answering technical queries, troubleshooting and quality assurance information to our customers, while assisting our suppliers with product evaluation and technical surveys. Through these activities, we have been able to obtain the confidence of both our clients and our suppliers, as a technology trading company capable of providing solutions.
Note: Abbreviated corporate names are used.
Overview of Suppliers
Term ended March 2008 Factors of change in sales by major supplier
05
T o k y o E l e c t r o n D e v i c e
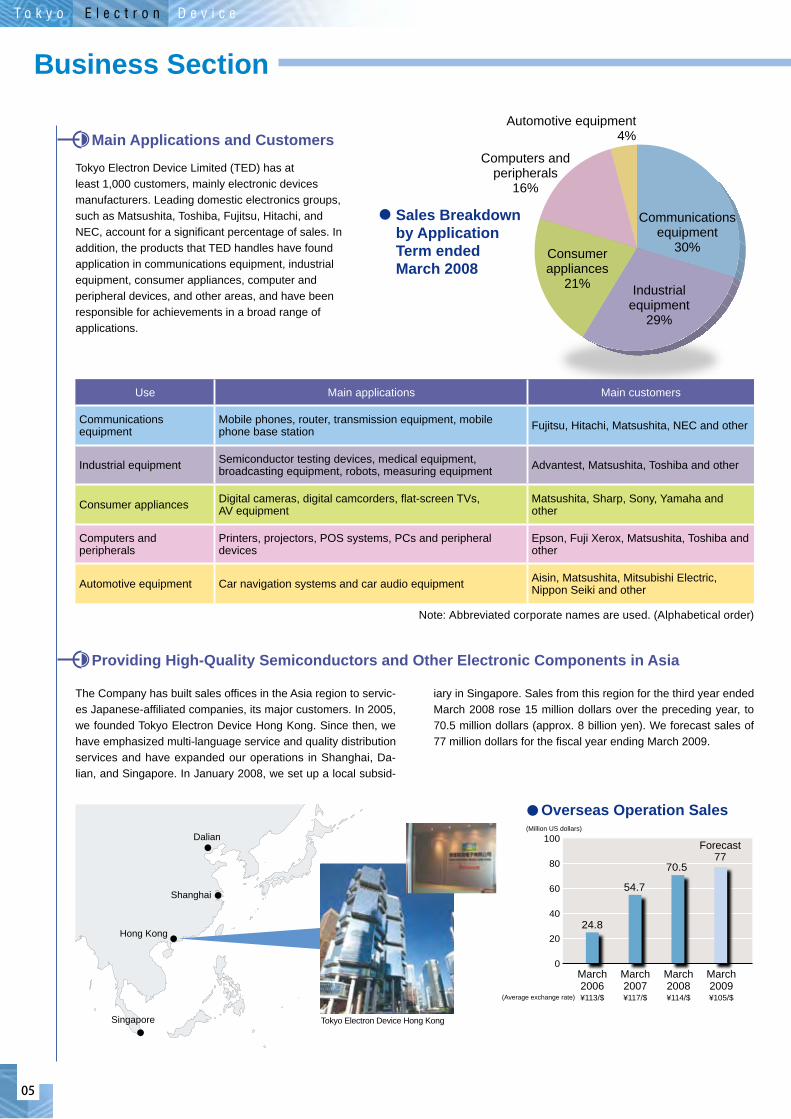
Communicationsequipment
30%
Industrialequipment
29%
Consumerappliances
21%
Computers andperipherals
16%
Automotive equipment4%
Use Main applications Main customers
Communications equipment
Mobile phones, router, transmission equipment, mobile phone base station Fujitsu, Hitachi, Matsushita, NEC and other
Industrial equipment Semiconductor testing devices, medical equipment, broadcasting equipment, robots, measuring equipment Advantest, Matsushita, Toshiba and other
Consumer appliances Digital cameras, digital camcorders, flat-screen TVs, AV equipment
Matsushita, Sharp, Sony, Yamaha and other
Computers and peripherals
Printers, projectors, POS systems, PCs and peripheral devices
Epson, Fuji Xerox, Matsushita, Toshiba and other
Automotive equipment Car navigation systems and car audio equipment Aisin, Matsushita, Mitsubishi Electric, Nippon Seiki and other
Main Applications and Customers
Tokyo Electron Device Limited (TED) has at least 1,000 customers, mainly electronic devices manufacturers. Leading domestic electronics groups, such as Matsushita, Toshiba, Fujitsu, Hitachi, and NEC, account for a significant percentage of sales. In addition, the products that TED handles have found application in communications equipment, industrial equipment, consumer appliances, computer and peripheral devices, and other areas, and have been responsible for achievements in a broad range of applications.
Providing High-Quality Semiconductors and Other Electronic Components in Asia
Dalian
Shanghai
Hong Kong
Singapore
Sales Breakdown by ApplicationTerm ended March 2008
Note: Abbreviated corporate names are used. (Alphabetical order)
Tokyo Electron Device Hong Kong
The Company has built sales offices in the Asia region to servic-es Japanese-affiliated companies, its major customers. In 2005, we founded Tokyo Electron Device Hong Kong. Since then, we have emphasized multi-language service and quality distribution services and have expanded our operations in Shanghai, Da-lian, and Singapore. In January 2008, we set up a local subsid-
iary in Singapore. Sales from this region for the third year ended March 2008 rose 15 million dollars over the preceding year, to 70.5 million dollars (approx. 8 billion yen). We forecast sales of 77 million dollars for the fiscal year ending March 2009.
Overseas Operation Sales
0
20
100
40
60
80
24.8
54.7
70.577
March2006
Forecast
¥113/$
(Million US dollars)
(Average exchange rate)
March2007¥117/$
March2008¥114/$
March2009¥105/$
Business Section
06
Tokyo Electron Device
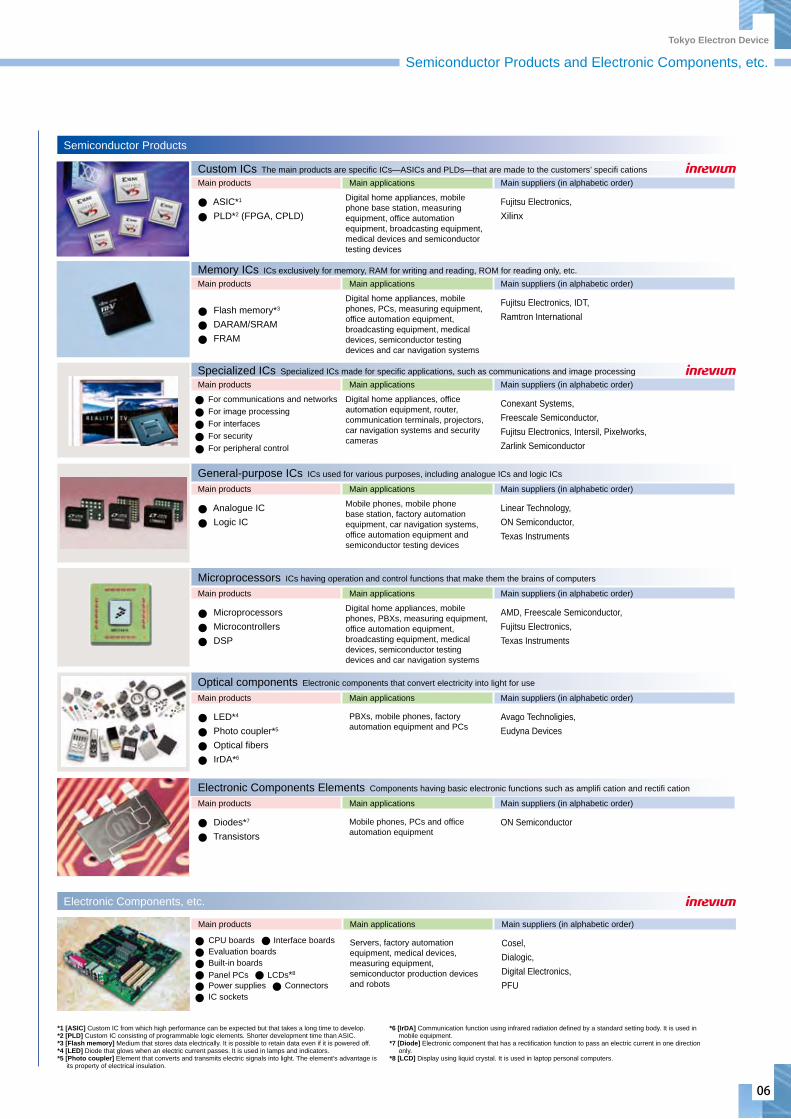
Main products Main applications Main suppliers (in alphabetic order)
CPU boards Interface boards Evaluation boards Built-in boards Panel PCs LCDs*8
Power supplies Connectors IC sockets
Servers, factory automation equipment, medical devices, measuring equipment, semiconductor production devices and robots
Cosel,Dialogic,Digital Electronics,PFU
Custom ICs The main products are specific ICs—ASICs and PLDs—that are made to the customers’ specifi cationsMain products Main applications Main suppliers (in alphabetic order)
ASIC*1
PLD*2 (FPGA, CPLD)
Digital home appliances, mobile phone base station, measuring equipment, office automation equipment, broadcasting equipment, medical devices and semiconductor testing devices
Fujitsu Electronics, Xilinx
Memory ICs ICs exclusively for memory, RAM for writing and reading, ROM for reading only, etc.Main products Main applications Main suppliers (in alphabetic order)
Flash memory*3
DARAM/SRAM FRAM
Digital home appliances, mobile phones, PCs, measuring equipment, office automation equipment, broadcasting equipment, medical devices, semiconductor testing devices and car navigation systems
Fujitsu Electronics, IDT, Ramtron International
Specialized ICs Specialized ICs made for specific applications, such as communications and image processingMain products Main applications Main suppliers (in alphabetic order)
For communications and networks For image processing For interfaces For security For peripheral control
Digital home appliances, office automation equipment, router, communication terminals, projectors, car navigation systems and security cameras
Conexant Systems,Freescale Semiconductor,Fujitsu Electronics, Intersil, Pixelworks,Zarlink Semiconductor
General-purpose ICs ICs used for various purposes, including analogue ICs and logic ICs
Main products Main applications Main suppliers (in alphabetic order)
Analogue IC Logic IC
Mobile phones, mobile phone base station, factory automation equipment, car navigation systems, office automation equipment and semiconductor testing devices
Linear Technology,ON Semiconductor,Texas Instruments
Microprocessors ICs having operation and control functions that make them the brains of computers
Main products Main applications Main suppliers (in alphabetic order)
Microprocessors Microcontrollers DSP
Digital home appliances, mobile phones, PBXs, measuring equipment, office automation equipment, broadcasting equipment, medical devices, semiconductor testing devices and car navigation systems
AMD, Freescale Semiconductor,Fujitsu Electronics, Texas Instruments
Optical components Electronic components that convert electricity into light for use
Main products Main applications Main suppliers (in alphabetic order)
LED*4
Photo coupler*5
Optical fibers IrDA*6
PBXs, mobile phones, factory automation equipment and PCs
Avago Technoligies,Eudyna Devices
Electronic Components Elements Components having basic electronic functions such as amplifi cation and rectifi cation
Main products Main applications Main suppliers (in alphabetic order)
Diodes*7
Transistors
Mobile phones, PCs and officeautomation equipment
ON Semiconductor
Electronic Components, etc.
Semiconductor Products
*1 [ASIC] Custom IC from which high performance can be expected but that takes a long time to develop.*2 [PLD] Custom IC consisting of programmable logic elements. Shorter development time than ASIC.*3 [Flash memory] Medium that stores data electrically. It is possible to retain data even if it is powered off.*4 [LED] Diode that glows when an electric current passes. It is used in lamps and indicators.*5 [Photo coupler] Element that converts and transmits electric signals into light. The element’s advantage is its property of electrical insulation.
*6 [IrDA] Communication function using infrared radiation defined by a standard setting body. It is used in mobile equipment.*7 [Diode] Electronic component that has a rectification function to pass an electric current in one direction only.*8 [LCD] Display using liquid crystal. It is used in laptop personal computers.
Semiconductor Products and Electronic Components, etc.
07
T o k y o E l e c t r o n D e v i c e
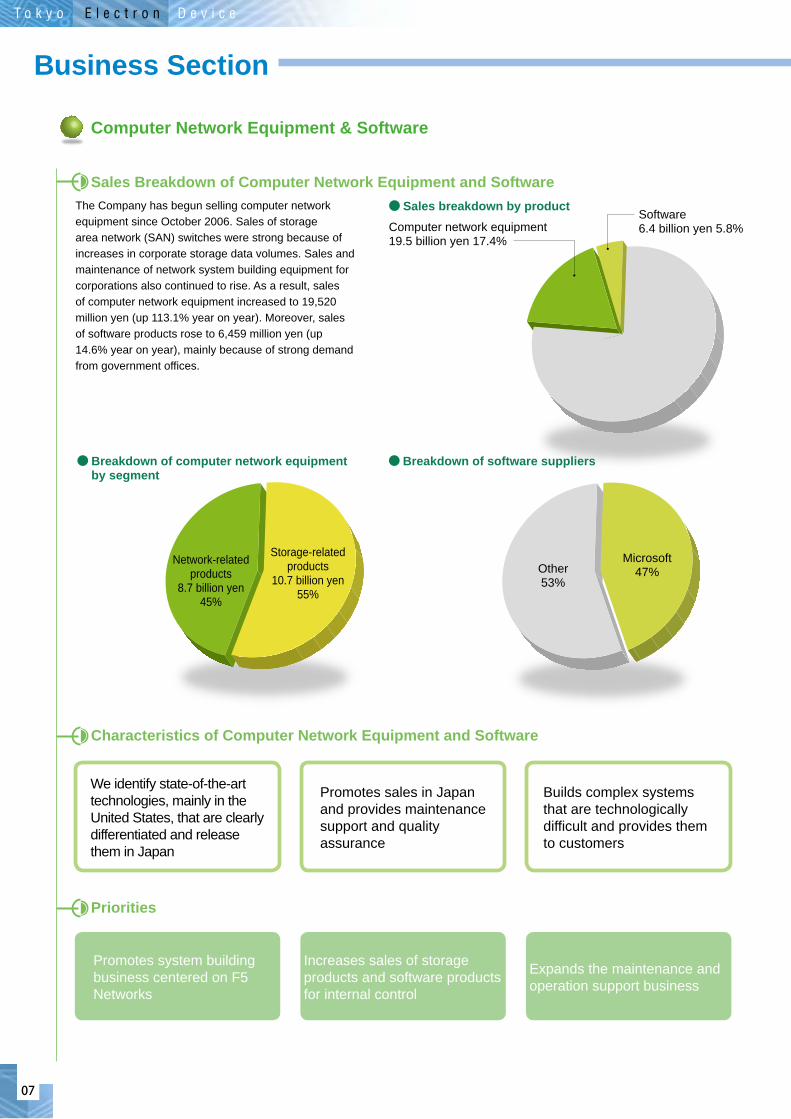
Network-relatedproducts
8.7 billion yen45%
Storage-relatedproducts
10.7 billion yen55%
Software6.4 billion yen 5.8%Computer network equipment
19.5 billion yen 17.4%
Microsoft47%Other
53%
Sales Breakdown of Computer Network Equipment and SoftwareThe Company has begun selling computer network equipment since October 2006. Sales of storage area network (SAN) switches were strong because of increases in corporate storage data volumes. Sales and maintenance of network system building equipment for corporations also continued to rise. As a result, sales of computer network equipment increased to 19,520 million yen (up 113.1% year on year). Moreover, sales of software products rose to 6,459 million yen (up 14.6% year on year), mainly because of strong demand from government offices.
Business Section
Computer Network Equipment & Software
Characteristics of Computer Network Equipment and Software
Priorities
Promotes system building business centered on F5 Networks
Expands the maintenance and operation support business
Increases sales of storage products and software products for internal control
We identify state-of-the-art technologies, mainly in the United States, that are clearly differentiated and release them in Japan
Builds complex systems that are technologically difficult and provides them to customers
Promotes sales in Japan and provides maintenance support and quality assurance
Sales breakdown by product
Breakdown of computer network equipment by segment
Breakdown of software suppliers
08
Tokyo Electron Device
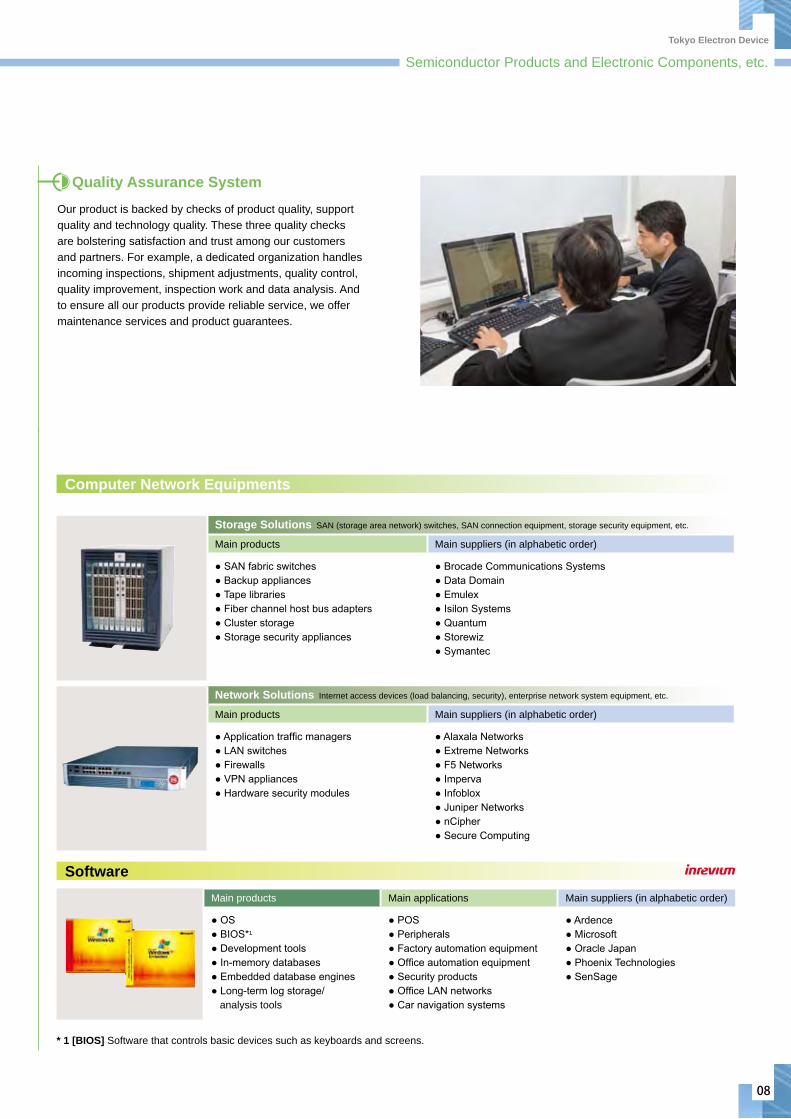
Main products Main applications Main suppliers (in alphabetic order)
● OS● BIOS*1
● Development tools● In-memory databases ● Embedded database engines ● Long-term log storage/ analysis tools
● POS ● Peripherals ● Factory automation equipment ● Office automation equipment ● Security products ● Office LAN networks ● Car navigation systems
● Ardence● Microsoft● Oracle Japan● Phoenix Technologies● SenSage
Our product is backed by checks of product quality, support quality and technology quality. These three quality checks are bolstering satisfaction and trust among our customers and partners. For example, a dedicated organization handles incoming inspections, shipment adjustments, quality control, quality improvement, inspection work and data analysis. And to ensure all our products provide reliable service, we offer maintenance services and product guarantees.
Storage Solutions SAN (storage area network) switches, SAN connection equipment, storage security equipment, etc.
Main products Main suppliers (in alphabetic order)
● SAN fabric switches ● Backup appliances ● Tape libraries ● Fiber channel host bus adapters● Cluster storage ● Storage security appliances
● Brocade Communications Systems ● Data Domain ● Emulex ● Isilon Systems ● Quantum ● Storewiz ● Symantec
Network Solutions Internet access devices (load balancing, security), enterprise network system equipment, etc.
Main products Main suppliers (in alphabetic order)
● Application traffic managers ● LAN switches ● Firewalls ● VPN appliances ● Hardware security modules
● Alaxala Networks ● Extreme Networks ● F5 Networks ● Imperva ● Infoblox ● Juniper Networks ● nCipher ● Secure Computing
Computer Network Equipments
Semiconductor Products and Electronic Components, etc.
Software
Quality Assurance System
* 1 [BIOS] Software that controls basic devices such as keyboards and screens.
09
T o k y o E l e c t r o n D e v i c e
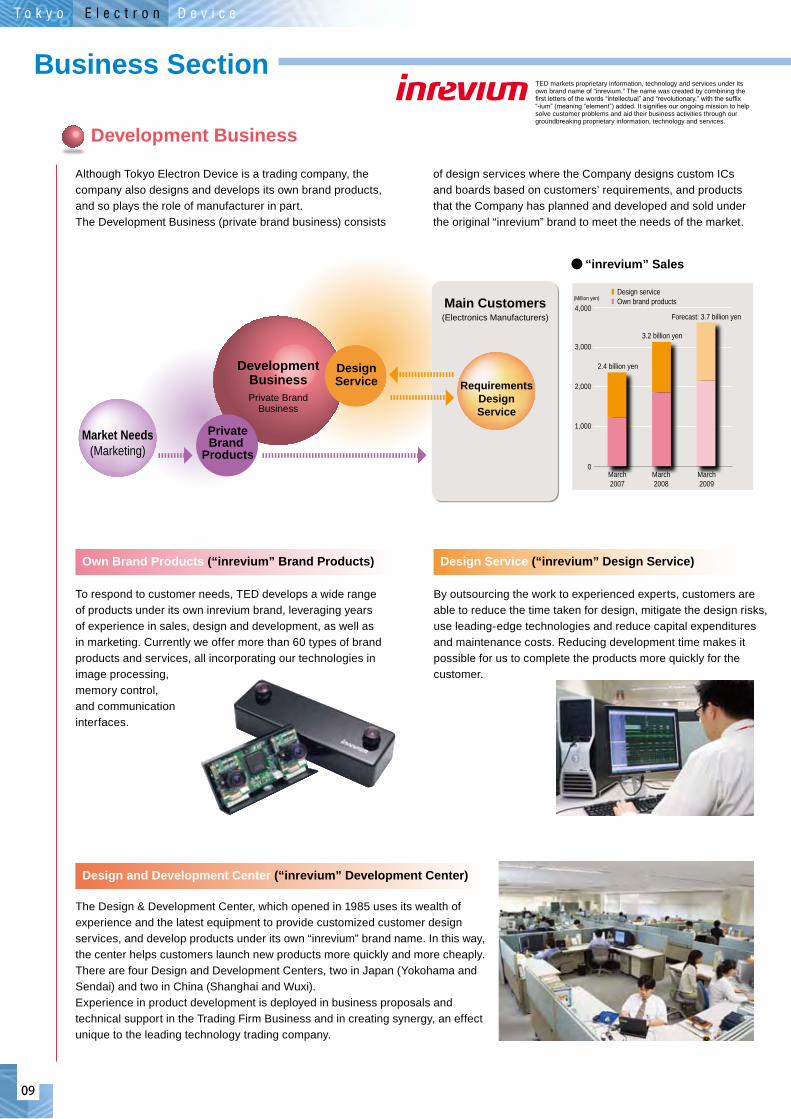
To respond to customer needs, TED develops a wide range of products under its own inrevium brand, leveraging years of experience in sales, design and development, as well as in marketing. Currently we offer more than 60 types of brand products and services, all incorporating our technologies in image processing, memory control, and communication interfaces.
Design Service (“inrevium” Design Service) Own Brand Products (“inrevium” Brand Products)
0
1,000
2,000
3,000
4,000
Design service
March2007
March2008
March2009
Forecast: 3.7 billion yen
3.2 billion yen
2.4 billion yen
(Million yen) Own brand products
Although Tokyo Electron Device is a trading company, the company also designs and develops its own brand products, and so plays the role of manufacturer in part. The Development Business (private brand business) consists
of design services where the Company designs custom ICs and boards based on customers’ requirements, and products that the Company has planned and developed and sold under the original “inrevium” brand to meet the needs of the market.
By outsourcing the work to experienced experts, customers are able to reduce the time taken for design, mitigate the design risks, use leading-edge technologies and reduce capital expenditures and maintenance costs. Reducing development time makes it possible for us to complete the products more quickly for the customer.
Market Needs(Marketing)
PrivateBrand
Products
DevelopmentBusinessPrivate Brand
Business
Main Customers
RequirementsDesignService
DesignService
(Electronics Manufacturers)
Development Business
“inrevium” Sales
The Design & Development Center, which opened in 1985 uses its wealth of experience and the latest equipment to provide customized customer design services, and develop products under its own “inrevium” brand name. In this way, the center helps customers launch new products more quickly and more cheaply. There are four Design and Development Centers, two in Japan (Yokohama and Sendai) and two in China (Shanghai and Wuxi).Experience in product development is deployed in business proposals and technical support in the Trading Firm Business and in creating synergy, an effect unique to the leading technology trading company.
Design and Development Center (“inrevium” Development Center)
TED markets proprietary information, technology and services under its own brand name of “inrevium.” The name was created by combining the first letters of the words “intellectual” and “revolutionary,” with the suffix “-ium” (meaning “element”) added. It signifies our ongoing mission to help solve customer problems and aid their business activities through our groundbreaking proprietary information, technology and services.
Business Section
10
Tokyo Electron Device
Market Information
0
20,000
40,000
60,000
80,000
100,000
120,000
2006 2007(Estimate)
2008(Forecast)
Electronic equipmentSource: JEITA
Electronic component devices
(Hundred million yen)
Production of Japanese Electronics IndustryThe gross domestic product for the Japanese electronics industry for 2008 looks set to reach 21,298.4 billion yen (up 3% year on year), representing the third consecutive year of growth. Although anxieties about the world economy remain, deriving from the increasingly serious subprime lending problem in the United States and soaring prices of crude oil, as well as uncertainties such as falling prices in the global market, the production of semiconductors and other electronic components in Japan is expected to increase a strong 5% year on year because of replacement demand for f lat-screen televisions ahead of the Beijing Olympic Games and growth in demand for digital
products expected to accompany economic growth in emerging countries. Overall growth in electronic equipment demand is also likely to remain firm. Domestic Japanese output of electronics by Japanese manufacturers and their affiliates accounted for 46% of the total electronics production of the industry, indicating a growing shift to overseas production. However, Japan-affiliated makers are expected to continue to produce a high percentage of products that require high reliable quality. Specific examples for 2008 include semiconductors (77% of which are produced in Japan), servers and storages (76%), and electrical instruments (72%).
Server and Storage Production Trends in the World and Japan
0
20,000
40,000
60,000
80,000
100,000
2006
Production by overseas makersProduction by Japanese company
2007(Estimate)
2008(Forecast)
Source: JEITA(Hundred million yen)Global production of servers and storages for 2007 reached 7,399.2 bi l l ion yen. Production by Japanese companies and their affiliates accounted for around 10% of world production, or 735.3 billion yen. Domestic Japanese production is likely to account for 76% of this production by Japan-affiliated firms. Worldwide, spending on IT over the past few years has been growing, indicating stable growth rates. Although the market will be influenced by the shift from mainframes to
open servers, moderate market growth is expected in the coming years because of the ongoing development of networking and action on information security. Although domestic production of servers is fa l l ing with the improvement in the performance of open servers and revisions of legacy systems, demand for servers and storage in general, including growing output of storage systems, is expected to remain almost flat, partly because of demand for large-size storage.
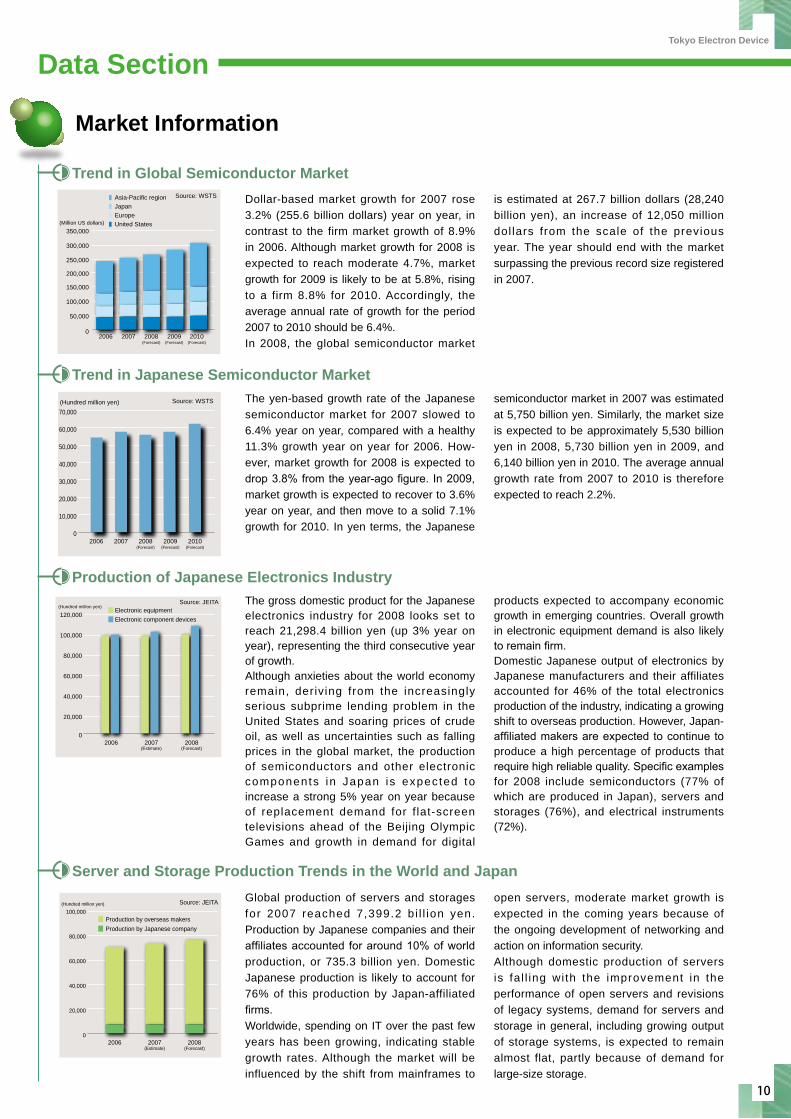
Trend in Global Semiconductor MarketDollar-based market growth for 2007 rose 3.2% (255.6 billion dollars) year on year, in contrast to the firm market growth of 8.9% in 2006. Although market growth for 2008 is expected to reach moderate 4.7%, market growth for 2009 is likely to be at 5.8%, rising to a firm 8.8% for 2010. Accordingly, the average annual rate of growth for the period 2007 to 2010 should be 6.4%.In 2008, the global semiconductor market
is estimated at 267.7 billion dollars (28,240 billion yen), an increase of 12,050 million dol lars from the scale of the previous year. The year should end with the market surpassing the previous record size registered in 2007.
0
50,000
2006 2007
(Million US dollars)
Asia-Pacific regionJapanEuropeUnited States
Source: WSTS
2008(Forecast)
2009(Forecast)
2010(Forecast)
100,000
150,000
200,000
250,000
300,000
350,000
Trend in Japanese Semiconductor MarketThe yen-based growth rate of the Japanese semiconductor market for 2007 slowed to 6.4% year on year, compared with a healthy 11.3% growth year on year for 2006. How-ever, market growth for 2008 is expected to drop 3.8% from the year-ago figure. In 2009, market growth is expected to recover to 3.6% year on year, and then move to a solid 7.1% growth for 2010. In yen terms, the Japanese
semiconductor market in 2007 was estimated at 5,750 billion yen. Similarly, the market size is expected to be approximately 5,530 billion yen in 2008, 5,730 billion yen in 2009, and 6,140 billion yen in 2010. The average annual growth rate from 2007 to 2010 is therefore expected to reach 2.2%.
0
10,000
20,000
30,000
40,000
50,000
60,000
70,000(Hundred million yen)
2006 2007
Source: WSTS
2008(Forecast)
2009(Forecast)
2010(Forecast)
Data Section
11
T o k y o E l e c t r o n D e v i c e
Operational Review and Outlook for the Next Term
Report on Results for the Term under Review (Term Ended March 2008)During the period under review, the Japanese economy susta ined a moderate recovery, large ly because of improvements in corporate revenue. However, domestic business is facing growing uncertainty, on fears of a fallout from the US economic slowdown fueled by the subprime lending problem and soaring prices of raw materials. The Group operates in the electronics industry, which benefited from a continued increase in shipments of notebook PCs and mobile phones. Although flat-screen televisions (PDP, LCD), digital cameras, and other digital home appliances demonstrated strong demand, the continued fall in prices have intensified competition. In addition, the semiconductor market has remained weak since global business confidence began to falter in the second half of the year. Meanwhile, corporate spending on IT remained firm, to respond to demands for information security and increasing data volumes to store. Background factors include legislative improvements to accommodate corporate demand for information security and internal control. In this environment, the Group emphasized sales of high value-
added products, such as custom ICs and general-purpose ICs (analog ICs), for the industrial equipment segment, our most important strategic market. In our inrevium brand business, we sought to win semiconductor design contracts and reinforce inrevium brand product development. Moreover, we took steps to sell computer network equipment and IT-related software products and associated maintenance services, so that we could offer optimal solutions to strategies of corporate customers. As for the development of our business base, we set up a local subsidiary in Singapore in January 2008. The subsidiary aims to bolster our sales infrastructure in the ASEAN region, as part of our overseas business strategy. We also set up a subsidiary in Japan in February 2008 to offer a more extensive product lineup to meet individual customer needs.As a result, sales for the fiscal year ended March 2008 reached 112,104 million yen (rising 12.4% year on year). Operating income stood at 3,678 million yen (up 4.2% year on year), ordinary income was 3,849 million yen (up 18.6% year on year), and net income increased to 2,193 million yen (up 16.9% year-on-year).
Outlook for the Next Term
The Company expects the Japanese economy to slow given the deceleration in the United States, which is linked mainly to the subprime lending problem, and global economic uncertainties deriving from soaring prices of crude oil and raw materials. In the electronics industry, price competition in the digital home appliance segment will continue. Moreover, the outlook for capital investment, including hitherto robust IT spending, is becoming unclear. In response, the Group is determined to boost sales by offering
a more impressive product lineup that responds to customer needs in every particular. We consequently forecast net sales of 115,000 million yen (up 2.6% year on year), operating income of 4,305 million yen (up 17.0% year on year), ordinary income of 4,020 million yen (up 4.4% year on year), and net income 2,210 million yen (up 0.8% year on year), for the consolidated fiscal year ending March 2009.
Data Section
0
20,000
40,000
60,000
80,000
100,000
120,000
(Million yen)
Total 112,104 Total 115,000,
80,828
5,296
19,520
6,459
83,700
5,300
19,500
6,500
March 2008(Forecast)
Performance for the year
ended March 2008
Software
ComputerNetworks
Equipments
SemiconductorProducts
ElectronicComponents, etc.
(Unit: Million yen)
1st half forecast
2nd half forecast
Full year
Net sales 54,600 60,400 115,000
Operating income 1,560 2,745 4,305
Ordinary income 1,410 2,610 4,020
Net income 715 1,495 2,210
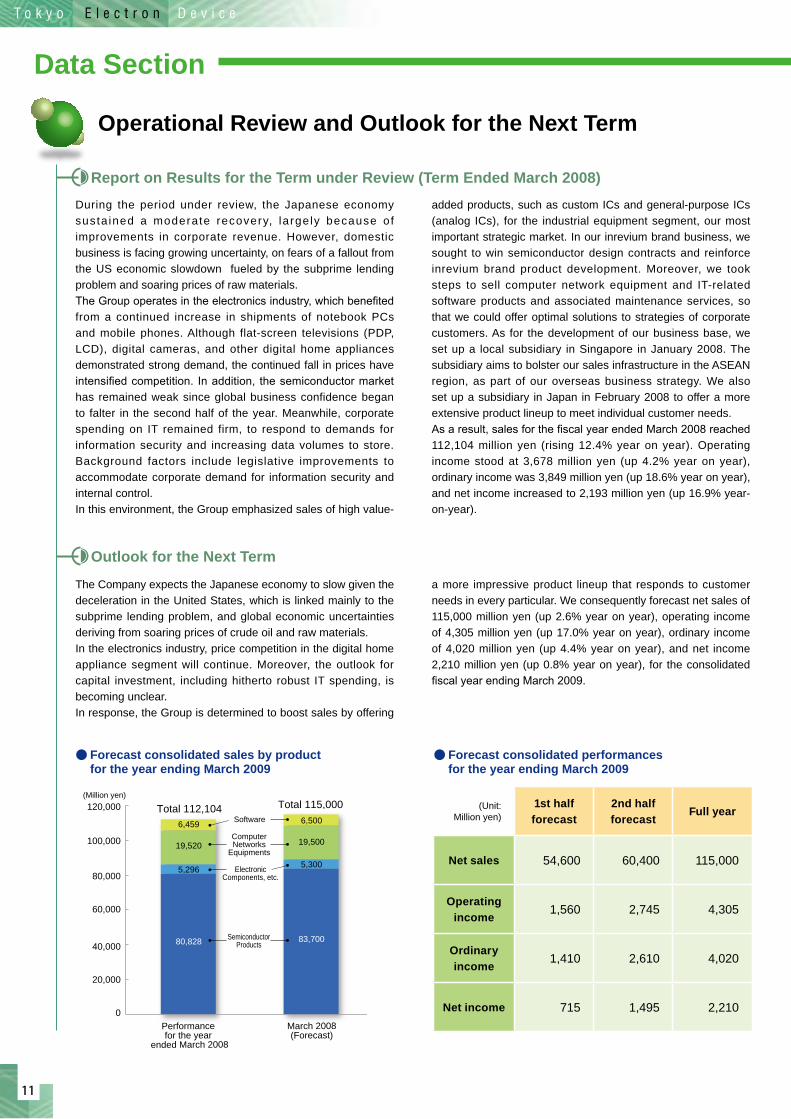
Forecast consolidated sales by product for the year ending March 2009
Forecast consolidated performances for the year ending March 2009
12
Tokyo Electron Device
Consolidated Financial Statements
Assets Previous term Term under review(as of March 31, 2007) (as of March 31, 2008)
Thousand yen Thousand yen
Current assets 43,387,749 47,005,467
Cash and time deposits 1,142,667 1,367,624
Notes and accounts receivable 23,361,816 25,633,561
Inventories 16,888,548 17,649,887
Deferred tax assets 482,330 624,533
Consumption tax receivable 530,177 811,642
Others 988,878 929,676
Allowance for doubtful receivables △ 6,670 △ 11,458
Fixed assets 3,341,910 4,453,012
Property, plant and equipment 1,019,858 1,012,699
Buildings and structures 559,814 550,745
Machinery and equipment 460,043 461,954
Intangible fixed assets 227,334 785,538
Investments and other assets 2,094,717 2,654,774
Investment securities 59,025 119,797
Deferred tax assets 1,497,022 1,401,918
Others 543,766 1,141,758
Allowance for doubtful receivables △ 5,097 △ 8,699
Total assets 46,729,660 51,458,480
Liabilities Previous term Term under review(as of March 31, 2007) (as of March 31, 2008)
Thousand yen Thousand yen
Current liabilities 22,718,370 25,584,200
Accounts payable-trade 12,888,266 13,897,701
Short-term borrowing 1,351,399 6,069,679
Current maturities of long-term borrowing 3,000,000 ー
Accounts payable-non-trade 1,784,735 1,582,518
Accrued income taxes 999,943 1,043,627
Allowance for bonuses 824,157 663,307
Allowance for officers’ bonuses 26,000 44,550
Others 1,843,867 2,282,815
Long-term liabilities 3,954,829 4,269,405
Allowance for retirement and severance benefits 3,615,122 3,859,577
Allowance for officers’ retirement bonuses 111,907 129,928
Others 227,800 279,900
Total liabilities 26,673,199 29,853,605
Net assets
Shareholders’ equity 20,054,514 21,579,799
Capital stock 2,495,750 2,495,750
Capital surplus 5,645,240 5,645,240
Retained earnings 11,913,524 13,438,808
Valuation and translation adjustments 1,945 25,074
Valuation difference on securities △ 115 △ 5,420
Deferred hedge gains or losses △ 1,502 64,622
Foreign exchange adjustment 3,564 △ 34,127
Total net assets 20,056,460 21,604,874
Total liabilities and net assets 46,729,660 51,458,480
Consolidated Balance Sheet
(Note) The above amounts are rounded down to the nearest thousand yen.
Assets
Total assets rose 4,728 million yen from the previous fiscal year, to 51,458 million yen. The increase is attributable mainly to increases in accounts receivable and inventories.
Liabilities
Total liabilities increased 3,180 million yen from the previous fiscal year, to 29,853 million yen. The increase reflects mainly higher short-term borrowings and accounts payable.
Net assets
Total net assets rose 1,548 million yen from the previous fiscal year, to 21,604 million yen. The increase is attributable mainly to an increase in retained earnings associated with the posting of net income.
Data Section
(Note) The above amounts are rounded down to the nearest thousand yen.
13
T o k y o E l e c t r o n D e v i c e
Consolidated Financial Statements
Consolidated Statement of Income
AccountPrevious term Term under reviewFrom April 1, 2006to March 31, 2007
From April 1, 2007to March 31, 2008
Thousand yen Thousand yen
Cash flow from operating activities
Income before income taxes 3,241,280 3,827,964
Depreciation and amortization 287,504 364,982Increase (decrease) in allowance for doubtful receivables △ 1,684 9,666Increase (decrease) in allowance for employee bonuses 346,763 △ 158,364Increase (decrease) in allowance for officers’ bonuses 26,000 18,550Increase (decrease) in allowance forretirement and severance benefits 70,069 244,454Increase (decrease) in allowance forofficers’ retirement bonuses 15,511 18,021
Interest and dividends revenues △ 8,171 △ 2,189
Interest paid 95,152 80,833
Foreign exchange gain or loss 169 1,491Gain or loss from sale of property, plantand equipment 102 △ 133Loss on disposal of property, plant andequipment 5,849 7,507
Increase (decrease) in accounts receivable △ 1,507,127 △ 2,465,392
Increase (decrease) in inventories 730,265 △ 859,855
Increase (decrease) in accounts payable △ 649,981 1,202,636Increase (decrease) in consumption taxes receivable 154,550 △ 281,497
Others 78,671 134,729
Subtotal 2,884,927 2,143,405
Receipts from interest and dividends 8,171 2,189
Interest paid △ 95,020 △ 83,028
Income taxes paid △ 1,143,199 △ 1,680,815
Cash flow from operating activities 1,654,878 381,751
Cash flow from investing activitiesPayment for purchase of property, plantand equipment △ 150,304 △ 373,581Proceeds from sale of property, plant and equipment 1,914 399Payment for acquisition of intangible fixed assets △ 63,854 △ 598,530Payment for acquisition of investmentsecurities △ 59,220 △ 69,702
Payment for loans made △ 600 ー
Others △ 129,365 △ 214,535
Cash flow from investing activities △ 401,430 △ 1,255,951
Cash flow from financing activitiesIncrease (decrease) in short-term borrowings △ 350,173 4,801,944
Repayment of long-term debt ー △ 3,000,000
Dividends paid △ 552,000 △ 667,800
Cash flow from financing activities △ 902,173 1,134,144Effect of exchange rate changes on cash and cash equivalents △ 7,265 △ 34,987Net increase (decrease) in cash and cash equivalents 344,009 224,956Cash and cash equivalents at beginningof year 798,658 1,142,667
Cash and cash equivalents at end of year 1,142,667 1,367,624
Consolidated Statement of Cash Flows
(Note) The above amounts are rounded down to the nearest thousand yen.
Account Previous term Term under reviewFrom April 1, 2006to March 31, 2007
From April 1, 2007to March 31, 2008
Thousand yen Thousand yen
Net sales 99,743,143 112,104,644
Cost of sales 85,636,961 95,147,030
Gross profit 14,106,181 16,957,614Selling, general and administrative expenses 10,575,028 13,278,745
Salaries 3,633,426 4,560,679
Provision for bonuses 826,577 651,225
Provision for officers’ bonuses 26,000 44,550
Transfer from retirement allowance reserve 572,512 573,239
Others 5,516,512 7,449,050
Operating income 3,531,153 3,678,869
Non-operating revenues 40,729 428,745
Interest income 2,495 2,189
Dividends income 5,675 ー
Foreign exchange gain ー 394,956
Revenue from seminars held 7,218 6,173
Insurance bonuses 14,793 18,226
Others 10,546 7,201
Non-operating expenses 326,335 258,348
Interest expenses 95,152 80,833
Loss on transfer of receivables 169,433 167,732
Foreign exchange loss 51,449 ー
Others 10,300 9,782
Ordinary income 3,245,547 3,849,269
Extraordinary gains 1,684 133
Gain from sale of fixed assets ー 133Reversal of allowance for doubtful receivables 1,684 ー
Extraordinary losses 5,951 21,437
Loss from sale of fixed assets 102 ー
Loss from disposal of fixed assets 5,849 7,507
Cost of office restoration ー 13,930
Income before income taxes 3,241,280 3,827,964
Income, residential and enterprise taxes 1,539,969 1,723,550
Corporate tax adjustment △ 175,435 △ 88,669
Net income 1,876,746 2,193,084
(Note) The above amounts are rounded down to the nearest thousand yen.
Data Section
14
Tokyo Electron Device
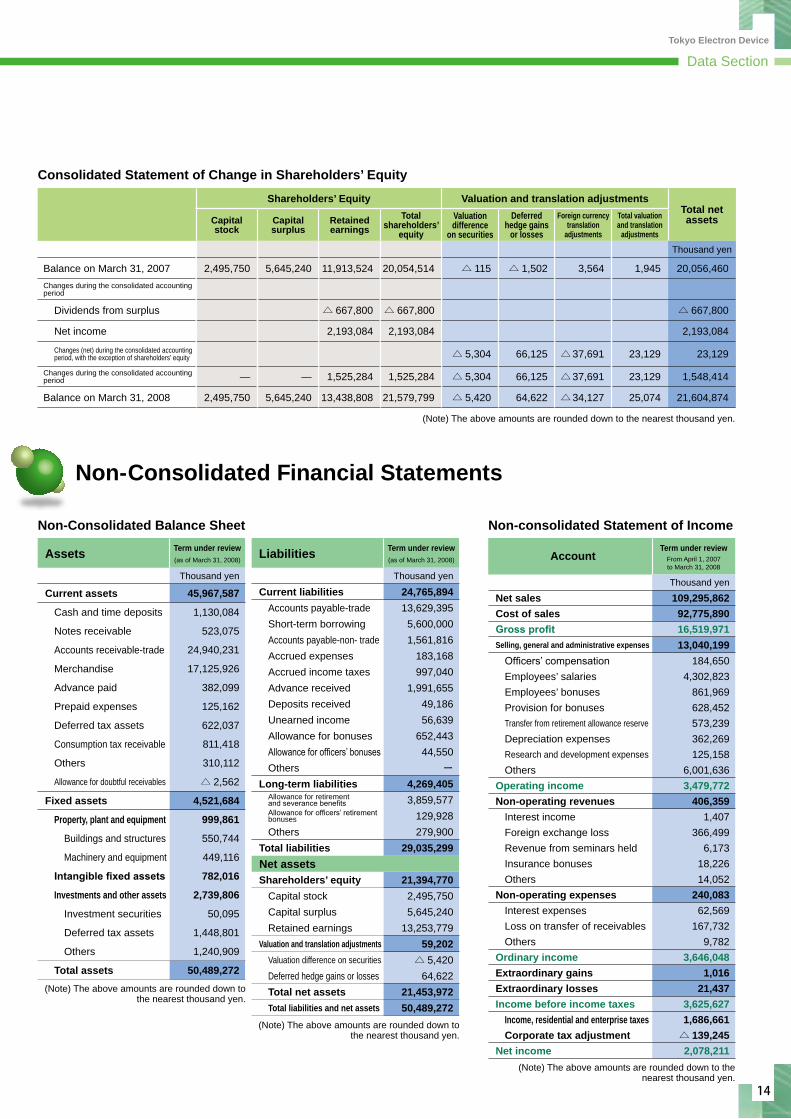
Consolidated Statement of Change in Shareholders’ Equity
Non-Consolidated Financial Statements
(Note) The above amounts are rounded down to the nearest thousand yen.
Assets Term under review(as of March 31, 2008)
Thousand yen
Current assets 45,967,587
Cash and time deposits 1,130,084
Notes receivable 523,075
Accounts receivable-trade 24,940,231
Merchandise 17,125,926
Advance paid 382,099
Prepaid expenses 125,162
Deferred tax assets 622,037
Consumption tax receivable 811,418
Others 310,112
Allowance for doubtful receivables △ 2,562
Fixed assets 4,521,684
Property, plant and equipment 999,861
Buildings and structures 550,744
Machinery and equipment 449,116
Intangible fixed assets 782,016
Investments and other assets 2,739,806
Investment securities 50,095
Deferred tax assets 1,448,801
Others 1,240,909
Total assets 50,489,272
Liabilities Term under review(as of March 31, 2008)
Thousand yen
Current liabilities 24,765,894Accounts payable-trade 13,629,395Short-term borrowing 5,600,000Accounts payable-non- trade 1,561,816Accrued expenses 183,168Accrued income taxes 997,040Advance received 1,991,655Deposits received 49,186Unearned income 56,639Allowance for bonuses 652,443Allowance for officers’ bonuses 44,550Others ー
Long-term liabilities 4,269,405Allowance for retirement and severance benefits 3,859,577Allowance for officers’ retirement bonuses 129,928Others 279,900
Total liabilities 29,035,299Net assetsShareholders’ equity 21,394,770
Capital stock 2,495,750Capital surplus 5,645,240Retained earnings 13,253,779
Valuation and translation adjustments 59,202Valuation difference on securities △ 5,420Deferred hedge gains or losses 64,622Total net assets 21,453,972Total liabilities and net assets 50,489,272
Non-Consolidated Balance Sheet Non-consolidated Statement of Income
AccountTerm under review
From April 1, 2007to March 31, 2008
Thousand yen
Net sales 109,295,862Cost of sales 92,775,890Gross profit 16,519,971Selling, general and administrative expenses 13,040,199
Officers’ compensation 184,650Employees’ salaries 4,302,823Employees’ bonuses 861,969Provision for bonuses 628,452Transfer from retirement allowance reserve 573,239Depreciation expenses 362,269Research and development expenses 125,158Others 6,001,636
Operating income 3,479,772Non-operating revenues 406,359
Interest income 1,407Foreign exchange loss 366,499Revenue from seminars held 6,173Insurance bonuses 18,226Others 14,052
Non-operating expenses 240,083Interest expenses 62,569Loss on transfer of receivables 167,732Others 9,782
Ordinary income 3,646,048Extraordinary gains 1,016Extraordinary losses 21,437Income before income taxes 3,625,627
Income, residential and enterprise taxes 1,686,661Corporate tax adjustment △ 139,245
Net income 2,078,211
(Note) The above amounts are rounded down to the nearest thousand yen.
(Note) The above amounts are rounded down to the nearest thousand yen.
(Note) The above amounts are rounded down to the nearest thousand yen.
Shareholders’ Equity Valuation and translation adjustmentsTotal net assetsCapital
stockCapitalsurplus
Retainedearnings
Total shareholders’
equity
Valuationdifference
on securities
Deferred hedge gains
or losses
Foreign currency translation
adjustments
Total valuation and translation
adjustments
Thousand yen
Balance on March 31, 2007 2,495,750 5,645,240 11,913,524 20,054,514 △ 115 △ 1,502 3,564 1,945 20,056,460Changes during the consolidated accounting period
Dividends from surplus △ 667,800 △ 667,800 △ 667,800
Net income 2,193,084 2,193,084 2,193,084
Changes (net) during the consolidated accounting period, with the exception of shareholders’ equity △ 5,304 66,125 △37,691 23,129 23,129
Changes during the consolidated accounting period — — 1,525,284 1,525,284 △ 5,304 66,125 △37,691 23,129 1,548,414
Balance on March 31, 2008 2,495,750 5,645,240 13,438,808 21,579,799 △ 5,420 64,622 △34,127 25,074 21,604,874
Data Section
15
T o k y o E l e c t r o n D e v i c e
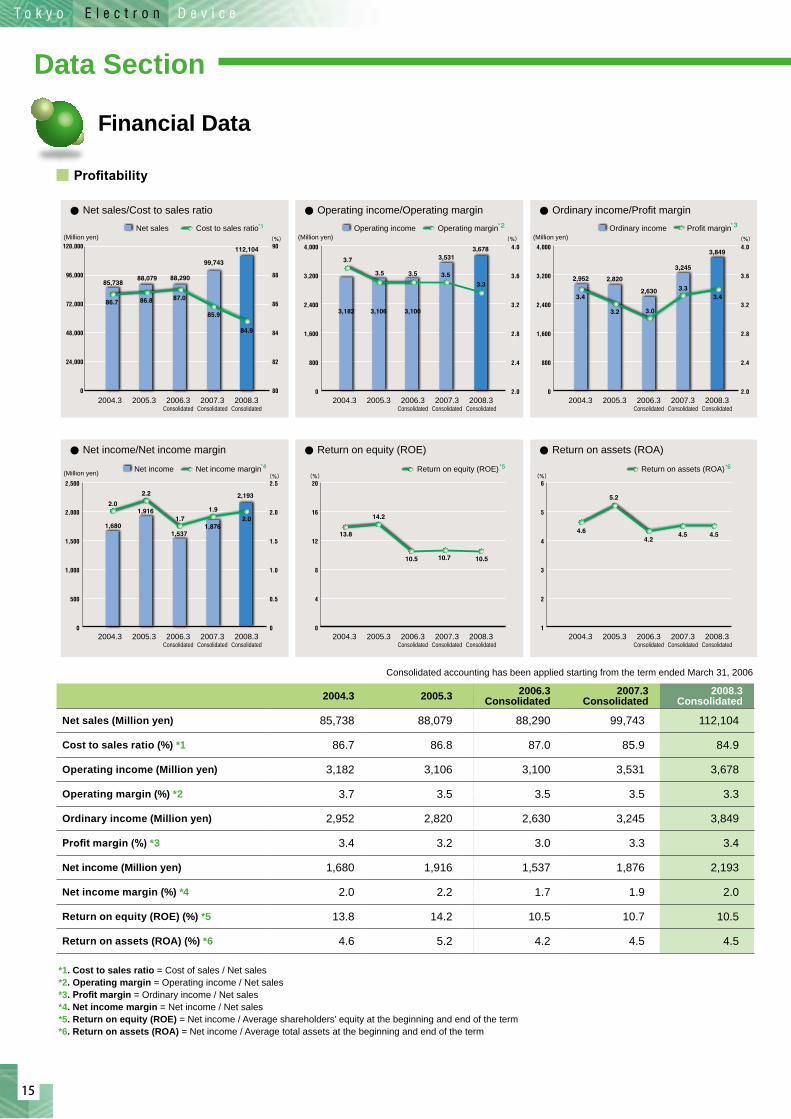
Financial Data
2004.3 2005.3 2006.3 Consolidated
2007.3 Consolidated
2008.3 Consolidated
Net sales (Million yen) 85,738 88,079 88,290 99,743 112,104
Cost to sales ratio (%) *1 86.7 86.8 87.0 85.9 84.9
Operating income (Million yen) 3,182 3,106 3,100 3,531 3,678
Operating margin (%) *2 3.7 3.5 3.5 3.5 3.3
Ordinary income (Million yen) 2,952 2,820 2,630 3,245 3,849
Profit margin (%) *3 3.4 3.2 3.0 3.3 3.4
Net income (Million yen) 1,680 1,916 1,537 1,876 2,193
Net income margin (%) *4 2.0 2.2 1.7 1.9 2.0
Return on equity (ROE) (%) *5 13.8 14.2 10.5 10.7 10.5
Return on assets (ROA) (%) *6 4.6 5.2 4.2 4.5 4.5
Profitability
*1. Cost to sales ratio = Cost of sales / Net sales*2. Operating margin = Operating income / Net sales*3. Profit margin = Ordinary income / Net sales*4. Net income margin = Net income / Net sales*5. Return on equity (ROE) = Net income / Average shareholders’ equity at the beginning and end of the term*6. Return on assets (ROA) = Net income / Average total assets at the beginning and end of the term
(%)
(%)
(%) (%)
2006.3Consolidated
2007.3Consolidated
2008.3Consolidated
2004.3 2005.3
2006.3Consolidated
2007.3Consolidated
2008.3Consolidated
2004.3 2005.3
2006.3Consolidated
2007.3Consolidated
2008.3Consolidated
2004.3 2005.3
2006.3Consolidated
2007.3Consolidated
2008.3Consolidated
2004.3 2005.3
2006.3Consolidated
2007.3Consolidated
2008.3Consolidated
2004.3 2005.3
2006.3Consolidated
2007.3Consolidated
2008.3Consolidated
2004.3 2005.3
Net sales/Cost to sales ratioNet sales Cost to sales ratio
(Million yen) (Million yen) (Million yen)
(Million yen)
0
4
8
12
16
20(%)
1
2
3
4
5
6(%)
0
24,000
48,000
72,000
96,000
120,000
0
800
1,600
2,400
3,200
4,000
0
500
1,000
1,500
2,000
2,500
0
800
1,600
2,400
3,200
4,000
Operating income/Operating marginOperating income Operating margin
Ordinary income/Profit marginOrdinary income Profit margin
Net income/Net income margin
Net income Net income margin
Return on equity (ROE)
Return on equity (ROE)
Return on assets (ROA)
Return on assets (ROA)
86.7 86.8 87.0
85.9
84.9
85,73888,079 88,290
3,182 3,106 3,100
3,5313,678
2,952 2,820
2,630
3,245
3,849
99,743
112,104
3.7
3.5 3.5 3.53.3
3.4 3.4
3.2 3.0
3.3
2.0
2.2
1.71.9
2.01,680
1,916
1,5371,876
2,193
13.8
14.2
10.5 10.510.7
4.6 4.54.2
4.5
5.2
80
82
84
86
88
90
2.0
2.4
2.8
3.2
3.6
4.0
2.0
2.4
2.8
3.2
3.6
4.0
0
0.5
1.0
1.5
2.0
2.5
Consolidated accounting has been applied starting from the term ended March 31, 2006
Data Section
16
Tokyo Electron Device
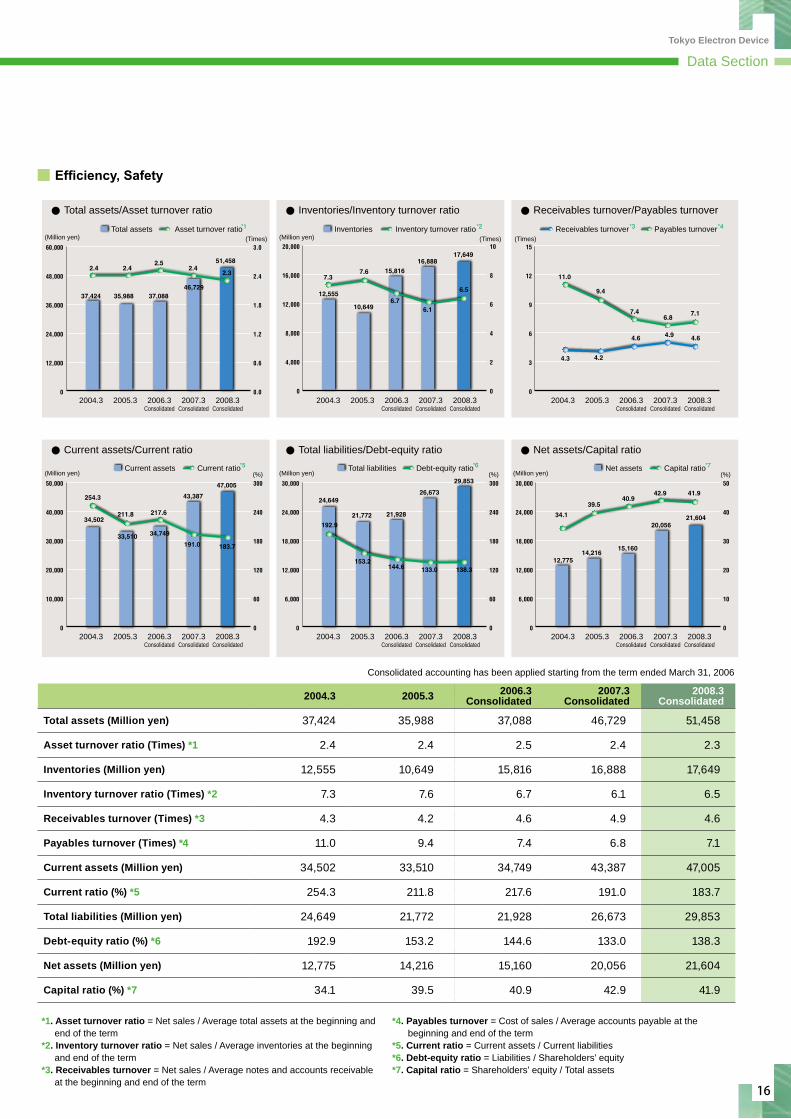
Efficiency, Safety
2004.3 2005.3 2006.3 Consolidated
2007.3 Consolidated
2008.3 Consolidated
Total assets (Million yen) 37,424 35,988 37,088 46,729 51,458
Asset turnover ratio (Times) *1 2.4 2.4 2.5 2.4 2.3
Inventories (Million yen) 12,555 10,649 15,816 16,888 17,649
Inventory turnover ratio (Times) *2 7.3 7.6 6.7 6.1 6.5
Receivables turnover (Times) *3 4.3 4.2 4.6 4.9 4.6
Payables turnover (Times) *4 11.0 9.4 7.4 6.8 7.1
Current assets (Million yen) 34,502 33,510 34,749 43,387 47,005
Current ratio (%) *5 254.3 211.8 217.6 191.0 183.7
Total liabilities (Million yen) 24,649 21,772 21,928 26,673 29,853
Debt-equity ratio (%) *6 192.9 153.2 144.6 133.0 138.3
Net assets (Million yen) 12,775 14,216 15,160 20,056 21,604
Capital ratio (%) *7 34.1 39.5 40.9 42.9 41.9
*1. Asset turnover ratio = Net sales / Average total assets at the beginning and end of the term*2. Inventory turnover ratio = Net sales / Average inventories at the beginning and end of the term*3. Receivables turnover = Net sales / Average notes and accounts receivable at the beginning and end of the term
*4. Payables turnover = Cost of sales / Average accounts payable at the beginning and end of the term*5. Current ratio = Current assets / Current liabilities*6. Debt-equity ratio = Liabilities / Shareholders’ equity*7. Capital ratio = Shareholders’ equity / Total assets
2006.3Consolidated
2007.3Consolidated
2008.3Consolidated
2004.3 2005.3
2006.3Consolidated
2007.3Consolidated
2008.3Consolidated
2004.3 2005.3
2006.3Consolidated
2007.3Consolidated
2008.3Consolidated
2004.3 2005.3
2006.3Consolidated
2007.3Consolidated
2008.3Consolidated
2004.3 2005.3
2006.3Consolidated
2007.3Consolidated
2008.3Consolidated
2004.3 2005.3
2006.3Consolidated
2007.3Consolidated
2008.3Consolidated
2004.3 2005.3
Total assets/Asset turnover ratio
Total assets Asset turnover ratio(Million yen) (Times)
(%) (%) (%)
(Times) (Times)(Million yen)
(Million yen) (Million yen)(Million yen)
Inventories/Inventory turnover ratio
Inventories Inventory turnover ratio
Receivables turnover/Payables turnover
Receivables turnover Payables turnover
Current assets/Current ratio
Current assets Current ratio
Total liabilities/Debt-equity ratio
Total liabilities Debt-equity ratio
Net assets/Capital ratio
Net assets Capital ratio
0
12,000
24,000
36,000
48,000
60,000
0
4,000
8,000
12,000
16,000
20,000
0
3
6
9
12
15
0
10,000
20,000
30,000
40,000
50,000
0
6,000
12,000
18,000
24,000
30,000
0
6,000
12,000
18,000
24,000
30,000
0.0
0.6
1.2
1.8
2.4
3.0
0
60
120
180
240
300
0
60
120
180
240
300
0
10
20
30
40
50
0
2
4
6
8
10
2.4 2.42.5
2.42.3
7.37.6
6.7
4.3 4.2
33,510
254.3
34,749
24,649
21,772 21,928
192.9
153.2144.6
26,673
29,853
133.0 138.3
34,502211.8 217.6
43,387
47,005
191.0 183.7
12,77514,216
15,160
20,05621,60434.1
39.540.9
42.9 41.9
4.6 4.6
7.4
4.9
6.87.1
9.4
11.0
37,424 35,988 37,08846,729
51,458
12,555
10,649
15,816
6.1
6.5
16,88817,649
Consolidated accounting has been applied starting from the term ended March 31, 2006
Data Section
17
T o k y o E l e c t r o n D e v i c e
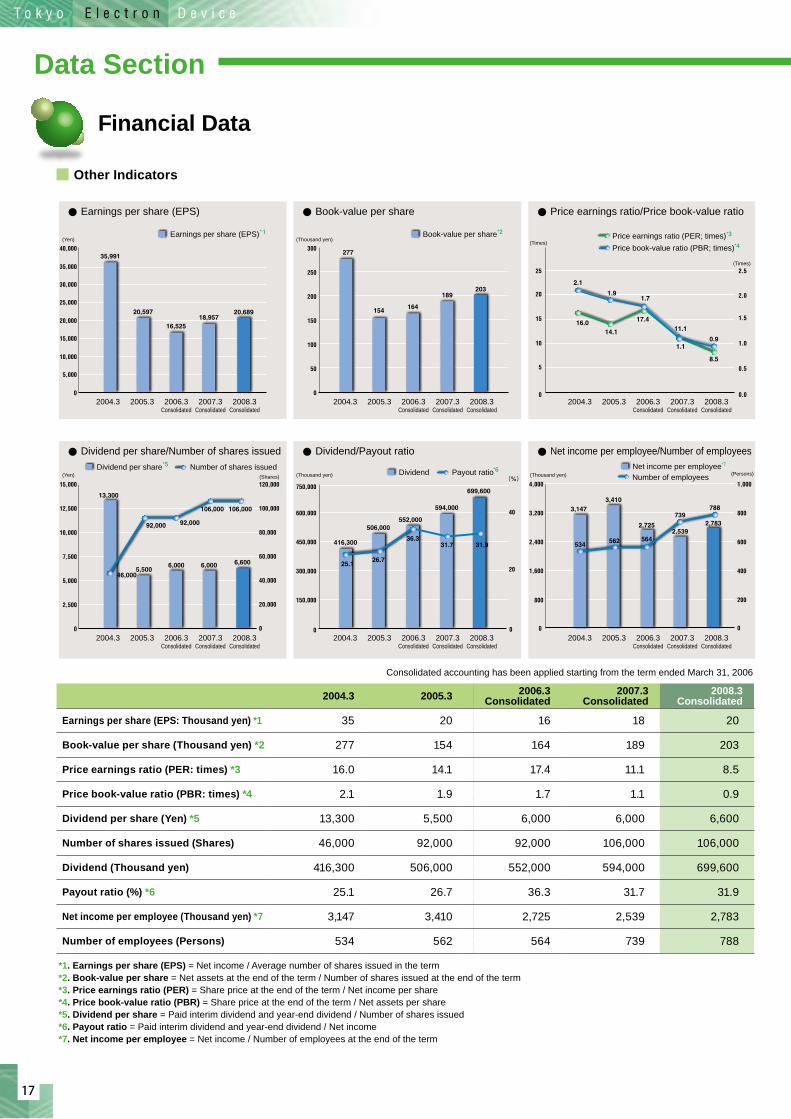
Financial Data
2004.3 2005.3 2006.3 Consolidated
2007.3 Consolidated
2008.3 Consolidated
Earnings per share (EPS: Thousand yen) *1 35 20 16 18 20
Book-value per share (Thousand yen) *2 277 154 164 189 203
Price earnings ratio (PER: times) *3 16.0 14.1 17.4 11.1 8.5
Price book-value ratio (PBR: times) *4 2.1 1.9 1.7 1.1 0.9
Dividend per share (Yen) *5 13,300 5,500 6,000 6,000 6,600
Number of shares issued (Shares) 46,000 92,000 92,000 106,000 106,000
Dividend (Thousand yen) 416,300 506,000 552,000 594,000 699,600
Payout ratio (%) *6 25.1 26.7 36.3 31.7 31.9
Net income per employee (Thousand yen) *7 3,147 3,410 2,725 2,539 2,783
Number of employees (Persons) 534 562 564 739 788
(%)
0.0
0.5
1.0
1.5
2.0
2.5
0
400
1,000
200
800
600
20
40
0
20,000
40,000
60,000
80,000
120,000
100,000
0
40,000
30,000
35,000
20,000
10,000
25,000
15,000
5,000
0
50
100
150
200
250
300
0
5
10
15
25
20
0
2,500
5,000
7,500
10,000
12,500
15,000
0 0
150,000
300,000
600,000
750,000
450,000
0
4,000
3,200
2,400
1,600
800
2.1
14.1
17.411.1
1.10.9
8.5
1.71.9
16.0
35,991
20,597
16,52518,957
20,689
92,000 92,000
106,000 106,000
13,300
5,5006,000 6,000 6,600
277
416,300
506,000552,000
594,000
699,600
3,1473,410
2,7252,539
2,783
154
26.7
36.331.7 31.9
562 564
739788
534
25.1
164
189203
46,000
2006.3Consolidated
2007.3Consolidated
2008.3Consolidated
2004.3 2005.3
2006.3Consolidated
2007.3Consolidated
2008.3Consolidated
2004.3 2005.3
2006.3Consolidated
2007.3Consolidated
2008.3Consolidated
2004.3 2005.3
2006.3Consolidated
2007.3Consolidated
2008.3Consolidated
2004.3 2005.3
2006.3Consolidated
2007.3Consolidated
2008.3Consolidated
2004.3 2005.3
2006.3Consolidated
2007.3Consolidated
2008.3Consolidated
2004.3 2005.3
Earnings per share (EPS)
(Thousand yen)(Thousand yen)(Yen) (Shares)
(Thousand yen) (Times)
(Times)
(Persons)
(Yen)
Book-value per share
Book-value per share
Earnings per share (EPS) Price earnings ratio/Price book-value ratio
Price earnings ratio (PER; times)Price book-value ratio (PBR; times)
Dividend per share/Number of shares issuedDividend per share Number of shares issued
Dividend/Payout ratio
Dividend Payout ratio
Net income per employee/Number of employeesNet income per employeeNumber of employees
Consolidated accounting has been applied starting from the term ended March 31, 2006
Data Section
Other Indicators
*1. Earnings per share (EPS) = Net income / Average number of shares issued in the term*2. Book-value per share = Net assets at the end of the term / Number of shares issued at the end of the term*3. Price earnings ratio (PER) = Share price at the end of the term / Net income per share*4. Price book-value ratio (PBR) = Share price at the end of the term / Net assets per share*5. Dividend per share = Paid interim dividend and year-end dividend / Number of shares issued*6. Payout ratio = Paid interim dividend and year-end dividend / Net income*7. Net income per employee = Net income / Number of employees at the end of the term
18
Tokyo Electron Device
Other domestic companies 58 shareholders (0.97%)
Other domesticcompanies
59,658 shares(56.28%)
Foreign companies etc. 34 shareholders (0.57%)
Foreign companies etc. 2,909 shares (2.75%)
Financial institutions, securities firms, etc. 25 shareholders (0.42%)
Financial institutions, securities firms, etc. 2,123 shares (2.00%)
Individuals etc.5,838 shareholders
(98.04%)
Individuals etc.41,310 shares
(38.97%)
Corporate Profile
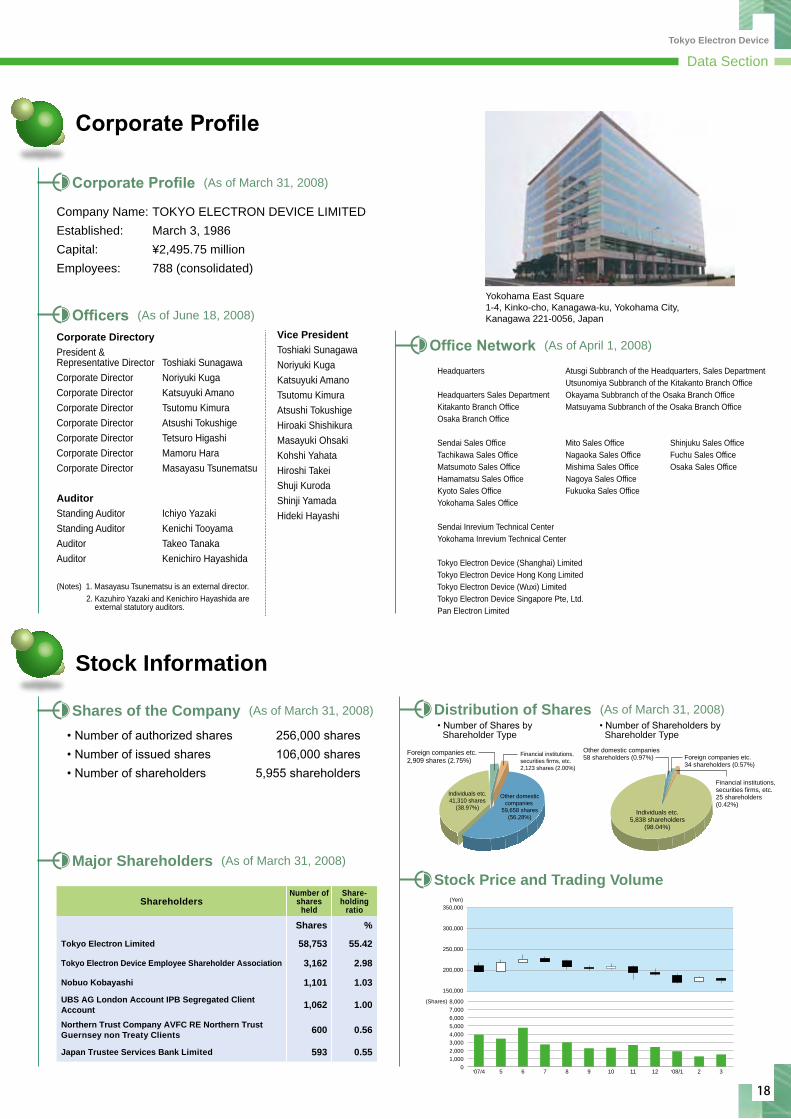
Corporate Profile (As of March 31, 2008)
Company Name: TOKYO ELECTRON DEVICE LIMITEDEstablished: March 3, 1986Capital: ¥2,495.75 millionEmployees: 788 (consolidated)
Headquarters Atusgi Subbranch of the Headquarters, Sales Department Utsunomiya Subbranch of the Kitakanto Branch OfficeHeadquarters Sales Department Okayama Subbranch of the Osaka Branch OfficeKitakanto Branch Office Matsuyama Subbranch of the Osaka Branch OfficeOsaka Branch Office
Sendai Sales Office Mito Sales Office Shinjuku Sales OfficeTachikawa Sales Office Nagaoka Sales Office Fuchu Sales OfficeMatsumoto Sales Office Mishima Sales Office Osaka Sales OfficeHamamatsu Sales Office Nagoya Sales OfficeKyoto Sales Office Fukuoka Sales OfficeYokohama Sales Office
Sendai Inrevium Technical CenterYokohama Inrevium Technical Center
Tokyo Electron Device (Shanghai) LimitedTokyo Electron Device Hong Kong LimitedTokyo Electron Device (Wuxi) LimitedTokyo Electron Device Singapore Pte, Ltd. Pan Electron Limited
Corporate DirectoryPresident &Representative Director Toshiaki SunagawaCorporate Director Noriyuki KugaCorporate Director Katsuyuki AmanoCorporate Director Tsutomu KimuraCorporate Director Atsushi TokushigeCorporate Director Tetsuro HigashiCorporate Director Mamoru HaraCorporate Director Masayasu Tsunematsu
AuditorStanding Auditor Ichiyo YazakiStanding Auditor Kenichi TooyamaAuditor Takeo TanakaAuditor Kenichiro Hayashida
(Notes) 1. Masayasu Tsunematsu is an external director. 2. Kazuhiro Yazaki and Kenichiro Hayashida are external statutory auditors.
Office Network (As of April 1, 2008)Vice PresidentToshiaki SunagawaNoriyuki KugaKatsuyuki AmanoTsutomu KimuraAtsushi TokushigeHiroaki ShishikuraMasayuki OhsakiKohshi YahataHiroshi TakeiShuji KurodaShinji YamadaHideki Hayashi
Stock Information
• Number of authorized shares 256,000 shares • Number of issued shares 106,000 shares • Number of shareholders 5,955 shareholders
• Number of Shares by Shareholder Type
• Number of Shareholders by Shareholder Type
01,0002,0003,0004,0005,0006,0007,0008,000
32’08/112111098765’07/4
150,000
200,000
250,000
300,000
350,000
(Shares)
(Yen)
Officers (As of June 18, 2008)
Shares of the Company (As of March 31, 2008)
Major Shareholders (As of March 31, 2008)
Distribution of Shares (As of March 31, 2008)
Stock Price and Trading VolumeShareholders
Number of shares
held
Share-holding
ratio
Shares %
Tokyo Electron Limited 58,753 55.42
Tokyo Electron Device Employee Shareholder Association 3,162 2.98
Nobuo Kobayashi 1,101 1.03
UBS AG London Account IPB Segregated Client Account 1,062 1.00
Northern Trust Company AVFC RE Northern TrustGuernsey non Treaty Clients 600 0.56
Japan Trustee Services Bank Limited 593 0.55
Yokohama East Square1-4, Kinko-cho, Kanagawa-ku, Yokohama City, Kanagawa 221-0056, Japan
Data Section
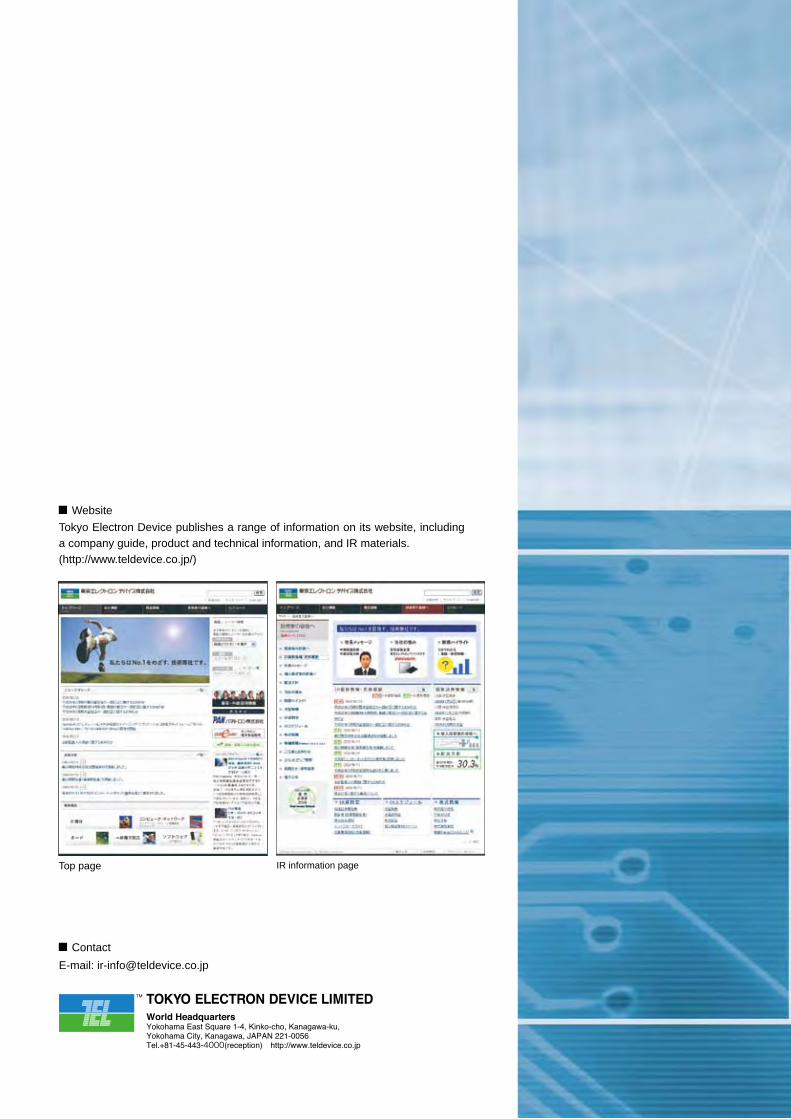
Tokyo Electron Device publishes a range of information on its website, including a company guide, product and technical information, and IR materials. (http://www.teldevice.co.jp/)
Top page IR information page
E-mail: [email protected]
Website
Contact