Embed Size (px)
Citation preview
Bulletin of the Geological Survey ofJapan,voL33(3〉,P.111-123,1982 543.4:549.3:546.22十546.26(265)
馳盈馳躍鯉翻C囎恥膿C醗麗聰電§⑭£M鐡9麗鵬§鯉N憾曲§盤⑬蹴 重恥総C⑱聡意窟窺且聖窺£蟹董£g G正夏8⑪圃且¢留麗戯§£
鑛
難欝
Shigeru TERAs亘IM:A*,Seizo NAKAo**and Tsunekazu MocHlzuKI*
TERAsHIMA,Shigeru,NAKへo,Seizo and MocHlzuKI,Tsmekazu(1982)SulfUr and carbon
contents of manganese nodules丘om the central Paci丑c,GH80-1cruise。B麗JJ。σ60」.
3z67∂。」αψαη,vo1。33(3),P。111-123.
A畏》s瞭麗猷One hundred翫nd eleven manganese nodules丘om the north and south Central
Pacific were analyzed fbr total sulfhr and carbon。These samples were collected along two
tr&cks of2000km long fbr each,ruming丘om east ofthe Wake island to west ofTahiti,in
a Hlakurei-maru cruise,GH:80-1.
Total sulfαr content ranges症om120to1590ppm,and averages650ppm.Manganese
and total sulfhr contentも訂e inverserly corre1&ted fbr the nodules with higher manganese
contents,whereas they appear to have rather positive correlation fbr those with Iower man-
ganese contents。Sulfhr in the nodules is positively correlated with water soluble sodium。
This suggests that sodium su1魚te is the most important form ofsul釦r in the nodules。
The content oftotal carbon varies丘om200to4180ppm and averages730ppm.There
are no clear correlations between total carbon and total sulfhr contents.Sulfhr and carbon
are not enriched in the nodules as compared with the earth crust批nd deep-sea sediments.
These£acts may be due to dif距rent solubility in oxide fbrm ofthese elements。
買齪胸課魍醜量⑫聡
M&ny data have been reported on the
contents of m句or and minor elements in
manganese nodules。But,as to the contents of
sulfUr and carbon,there are fヒw data,and the
geochemical characteristics ofわoth elements
量n the nodules have not been discussed.
亙n this study,111manganese nodules f}om
the north and south Central Pacific were
an&lyzed fbr total sulfUr &nd total carbon.
The samples had been collected along two
tracks of2000km long fbr each,running ffom
eastoftheWakeisland towestofTahitiinthecruise GH80-1,Geological survey of Japan.
In order to know chemical fbrms and/or
occurrences ofboth the elements,water soluble
sodium,non-carbonate carbon,carbonate car-
bon,calcium and barium in some selected
* Geochemistry&Technical Services Department
**Marine Geology Department
samples were determined。
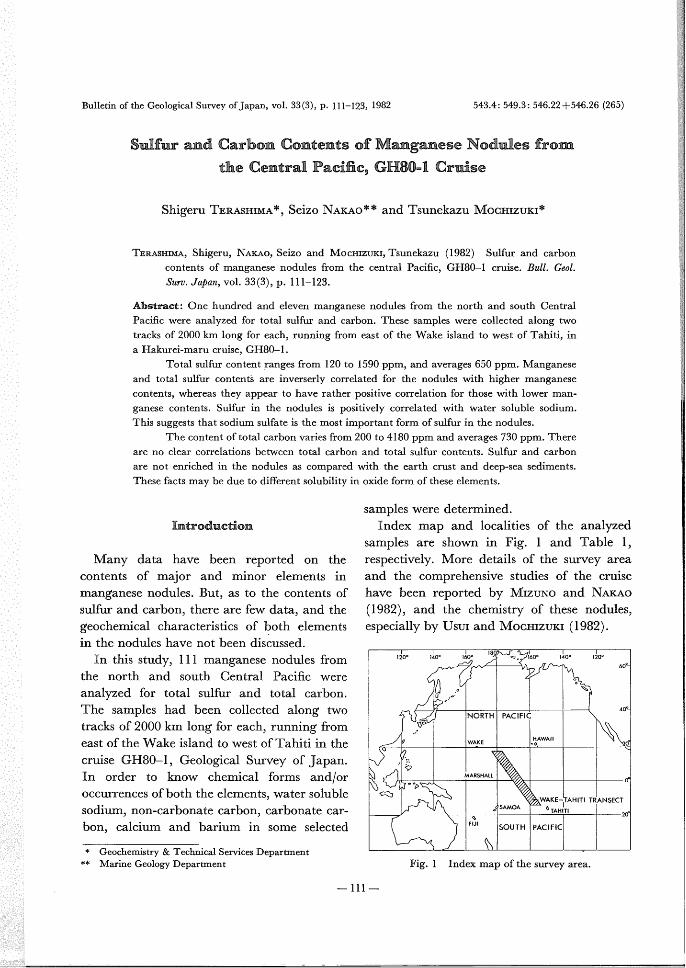
Index map and loc批1ities of the analyzed
samples are shown in Fig.l and Table l,
respecti〉ely.Moredetailsofthesurveyare&and the comprehensive studies of the cruise
have been reported by MIzuNo and NAKAo
(1982),and the chemistry of these nodules,
especially by Usul and MoGHlzuKI(1982).
1200 1400 18Q1600 qo 1600 1400 1200
060
oooρ 、
.9一・
’
400
NORTH PAαFIC
罫HAWA”〃 WAKE 亀o 20
ら餓ARSHALL
ロ o ρ
Qo SA猷OA
WAKE- o τAH建TI
τAHITi TRI
ANSECT
2げ俺
Fり1SOUTH PACIFK:
Fig・l Index map ofthe survey area。
一111一
βz61」6あn gプ孟h606010g乞6αJ S撹7∂¢y gプ」ψαn,%1。33,ハb.3
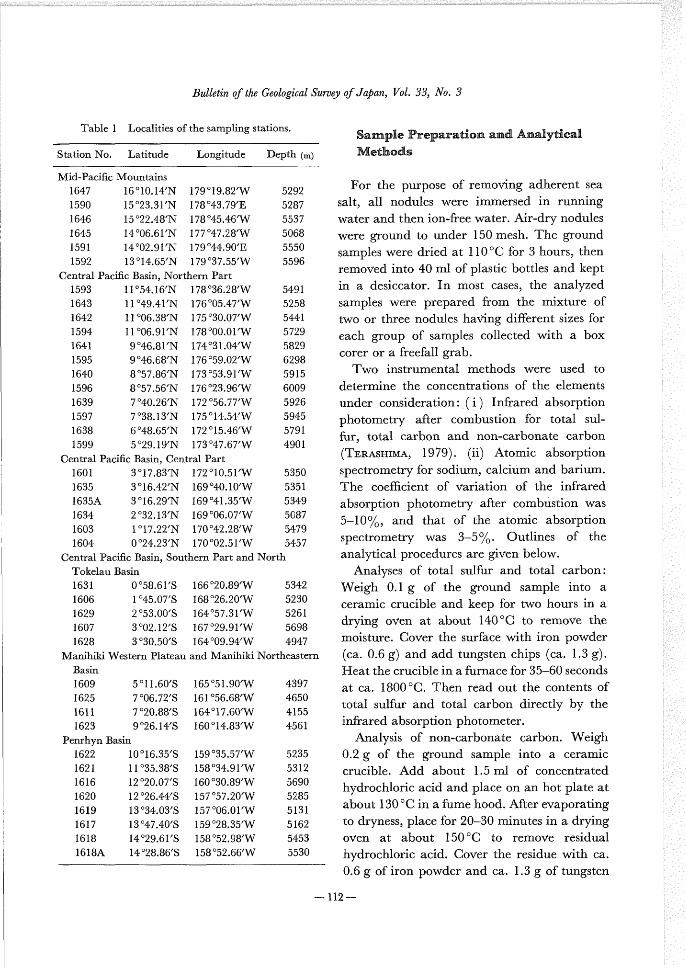
Table l Localities ofthe sampling stations.
Station No. Latitude Longitude Depth(m)
S認聡聰蝿e聖欝e騨曜魏童o聡a聡認A聡題且y愈茸舩且
Me曲《蝿s
Mid-P&ci丘c Mountains
1647 16。10.14’N 179。19.82’W
1590 15。23.31’N 178043.79’E
1646 15022.48’N 178。45.46/W
1645 14。06.61’N 177。47.28’W
l591 14。02.91’N 179044.90/E
1592 13。14.65’N’179。37.55’W
Central Pacific Basin,Northern Part
1593 11。54.16’N 178。36.28’W
1643 11Q49.41’N 176。05.47/W
1642 11。06。38’N 175。30.07’W
1594 11。06.91/N 178000.01!W
1641 9。46.81’N 174。31.04’W
1595 9046.68’N 176。59.02’W
1640 8。57.86/N l73。53.91’W
1596 8。57.56’N 176。23.96’W
l639 7。40.26’N 172056.77’W
1597 7038.13’N 175。14.54/W
1638 6。48.65’N l72。15.46’W
1599 5。29.19’N 173047.67’W
Central Pacific Basin,Central Part
1601 3。17.83’N 172010.51’W
1635 3016.42’N 169。40.10’W
1635A 3。16.29’N 169。41.35’W
1634 2。32.13/N 169。06.07’W
l603 1017.22’N 170042.28’W
1604 0。24.23’N 170。02.51/W
5292
5287
5537
5068
5550
5596
5491
5258
5441
5729
5829
6298
5915
6009
5926
5945
5791
4901
5350
5351
5349
5087
5479
5457
Centr&1Pacific Basin,Southern Part and North
Tokelau Basin
1631
1606
1629
1607
1628
0。58.61’S
l o45.07’S
2053.00,S
3002.12,S
3。30.50/S
166。20.89’W
I68。26.20’W
164057.3rW
167029.91’W
164。09.94’W
5342
5230
5261
5698
4947
ManihikiWestem Plateau and ManihikiNortheastem Basin
1609 5。11.60/S
1625 7。06.72,S
l611 7。20,88/S
1623 go26.14/S
Penrhyn Basin
1622 10。16.35’S
1621 11。35.38’S
1616 12。20.07’S
1620 12。26.44’S
1619 13。34.03,S
l617 13。47.40,S
1618 14029.61/S
1618A 14。28.86’S
165。51.90’W
161056.68/W
164017.60’W
160014.83’W
159。35.57’W
158034.91’W
160。30.89’W
157。57.20’W
157006.01’W
159。28.35’W
158。52.98’W
158。52.66’W
4397
4650
4155
4561
5235
5312
5690
5285
5131
5162
5453
5530
For the purpose of removing adherent sea
salt,all nodules were immersed in running
water and then ion-f}ee water.Air-dry nodules
were ground to under150mesh.The ground
s我mples were dried at110。C fbr3hours,then
removed into40ml ofplastic bottles and kept
in a desiccator.In most cases,the an乱1yzed
samples were prepared f士om the mixture of
two or three nodules ha▽ing different sizes fbr
each group of samples collected with a box
corer or a丘ee魚II grab。
Two instrumental methods were used to
determine the concentrations of the elements
under consideration:.(i) In食ared absorption
photometry after combustion fbr total su1一
血r,total carbon and non-carbonate carbon
(TERAsHIMA,1979)。(ii)Atomic absorption
spectrometry fbr sodium,calcihm and b乱rium・
The coef丑cient of〉ariation of the inf}ared
absorption photometry after comb丘stion was
5-10%,and that of the atomic absorption
spectrometry was 3-5%・ Outlines of’ the
我n我lytical proced皿es a,re given below。
Analyses of total sulfhr and total carbon:
Weigh O。1g of the ground sample into a
ceramic crucible and keep fbr two hours in a
drying oven at about l40。C to remove the
moisture。Cover the surface with iron powder
(ca。0.6g)an(i add tungsten chips(ca.1。3g).
Heat the crucible in a fhrnace f≧)r35-60secon(1s
at ca.18000C.Then read out the contents of
total sulfUr and total carbon directly by the
in倉ared absorption photometer。
Analysis of non-carbonate carbon。Weigh
O.2g of the ground sample into a ceramic
crucible.Add about L5ml of concentrated
hydrochloric acid and place on&n hot plate at
about l30。C in afume hood.Afterevaporating
to dryness,place fbr20-30minutes in a drying
oven at about l500C to remo〉e residu批1
hydrochloric ac圭d。Cover the rcsidue with ca,.
0。6g ofiron powd.er and ca。L3g of tungsten
一112一
3%伽αη4σ励・n伽Mπ一η・4%185(乃7α5h吻,翫んα・αn4M・6h吻勧
chips, and proceed as described above fbr
total sulfhr an(i carbon.
Analysis of water soluble sodium:Weigh
O。2g of the ground sample into a50ml test
tube with a stopper.Afセer adding water to the
volume,shake the mixture fbr about l minute.
Allow to stand fbr more than two days,and
then determine sodium in the supematant
solution by an atomic absorption spectropho-
tometer using an air-acetylene flame。
Ana1ゾses of calcium and barium、Weigh
O.1g of the ground sample into a TeHon
beaker,and add4ml of concentrated hydro-
chloric acid and 2ml of 30% hydrogen
peroxide。Afとer standing fbr5minutes at
room temperature,add5ml of hydrofluoric
acid,and evaporate to drゾness at about1800C・
Add5ml ofdiluted hydrochloric acid(1十1),
and repeat the ev&poration.Add2.5ml of
diluted hydrochloric acid(1十1)and.5ml of
water,and heat gently to dissolve the salt.
Trans免r the solution into a25ml ofvolumetric
flask,and add2。5ml of pot&ssium chloride
solution(30mg/ml K)and l ml of strontium
chloride solution(40mg/ml Sr),then dilute
to the volume.Determine calcium and barium
in the solution by an atomic absorption
spectrophotometerusingan air-acetylene flame
fbr calcium and a nitrous oxide-acetylene
Hame fbr barium.
Res魍且電s窺鼠麗量且》量§e服s§量⑪臨
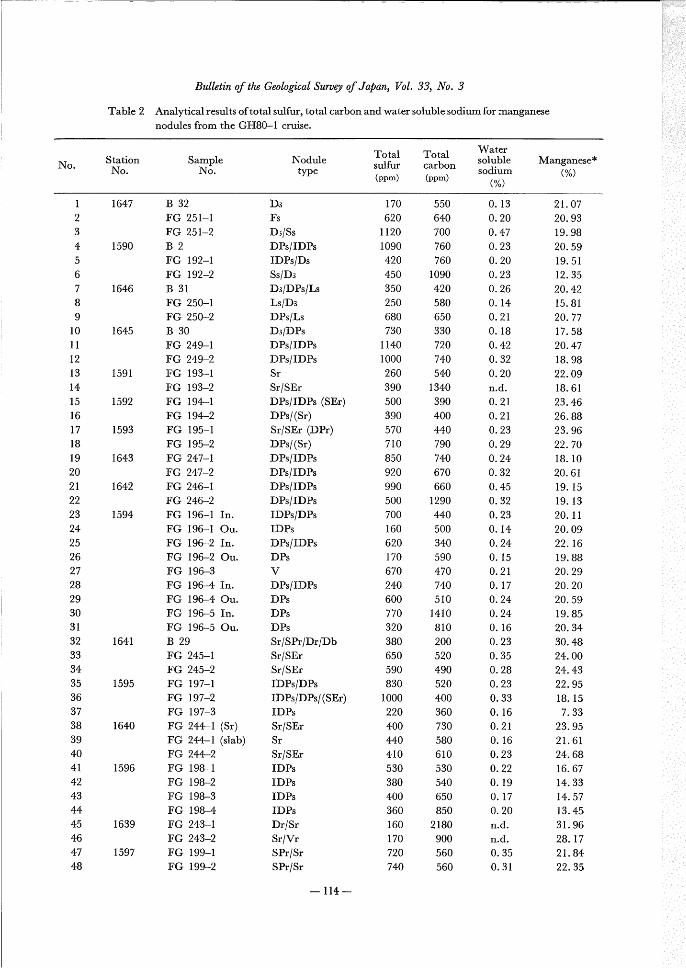
The contents of total sulfヒrシtotal carbon
and water soluble sodium in lll nodule
samples批re listed in Table2,in southeastward
ord.er of their geogr&phical localities。The
results fbr non-carbonate carbon, c批rbonate
carbon,calcium oxid.e and bar圭um in selected
37nodules are listed in Table3.The values
of carbonate carbon are obtained by subtract-
ing non-carbonate carbon fピom the total
carbon.
G鯉聡e躍認且窺s聖ee電
The content of total sulfUr varies fヒom120
to1590ppm,averages650ppm in the surveyarea。For total carbon,the content ranges fヒom
200to4180ppm,and averages730ppm.Theaverage contents of’total sul血r and total
carbon in the deep-sea sediments f}om the
samesurveyareasare3300ppmand5400ppm,respectively (TERAsHIMA,unpublished).Theresults indicate that both the elements are less
enriched in the manganese nodules than in
the sediments.
Sulfじr apPears to exist as the compounds of
sul魚te or sulfide in ma血e sediments.The
sulfide sulfUris easilyremoved f}om thesamples
by ignition at high temperature.Soりthe
selected雌eennodules(Nos。3,4,11,30,35,
48,52,57,64,73ラ81,85,92,93and94)were
analyzed afterignitingat5000C fbr60minutes。
However,there was,no clear dif驚rence in the
results between the samples ignited at500。C
and only drying at.1400C fbr2hours.This
suggests that the sulfhr in the nodules is not
sulfide sulfUr but is present in the fbrm of
sulfate.
Non-carbonate carbon content ranges丘om
200to1400ppm,300-700ppm in most cases。
Also carbonate carbon has a range 丘om
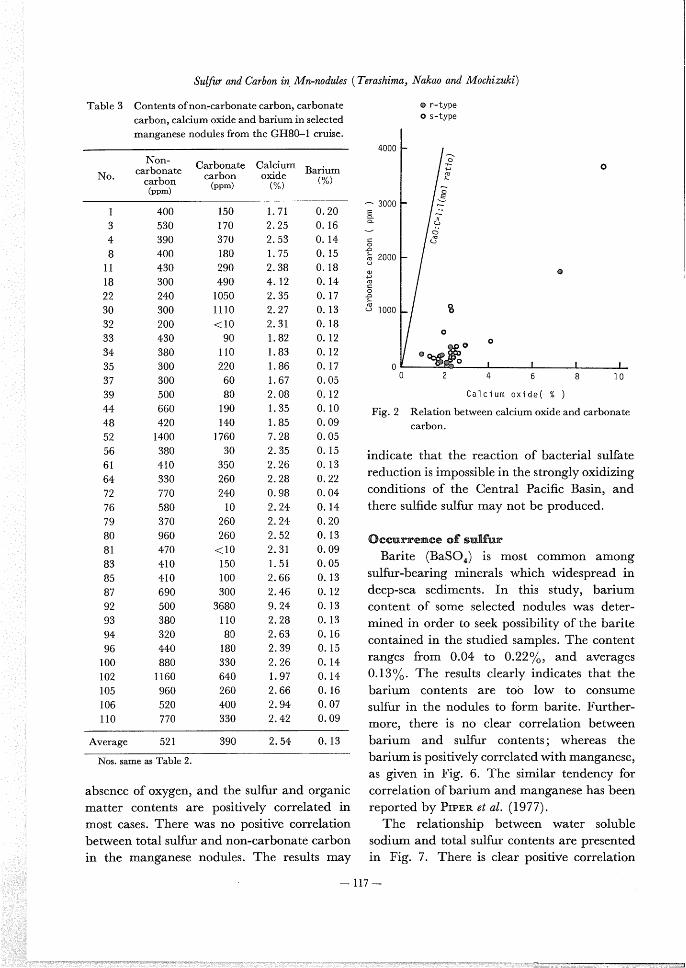
10ppm to3680ppm,being commonly100-1000ppm(Table3)。(〕alcium carbonate(Ca-
CO3)is the most commonmineral ofcarbonate
carbon in deep-sea sediments。Therefbre,there
may be some calcium carbonate as animpurity
in the nodules.H:owever,Fig。2shows the exi-
stence ofmuch excess of calcium oxide in the
nodules。The excess calcium oxide may be in
the fbrm ofphosphate.
R£亘窺電量o聡s恥量P髄e重wee聰蜜eg量⑰聡認且w題繭麗重量⑪臨§
鶴臨魂聰⑪dl賜且e電y昼》es
Regional variations of the average contents
of total sulfhr,total carbon,water soluble so-
dium andmanganesearelistedin Table4.Thecontents of total su1血r and total carbon on the
samples fピom southem part in the survey area,
i.e.the Manihiki Westem Plateau,Manihiki
Northeastern Basin and Penrhyn Basin,areslightly higher than those of northern part,i。e。,
一113一
No.
1
23456
7
89
10
11
12
13
14
15
16
17
18
19
20
21
22
23
24
25
26
27
28
29
30
31
32
33
34
35
36
37
38
39
40
41
42
43
4445
46
47
48
Table2
StationNo.
1647
1590
1646
1645
1591
1592
1593
1643
1642
1594
1641
1595
1640
1596
1639
1597
B%伽ηψh6σ6・1・9ぎ6αJS%吻げ」α卿,FbJ。33,瓦・.3
Analyticalresultsoftotalsulfじr,totalcarbonandwatersolublesodiumfbrmanganese
nodules ffom the GH80-1cruise.
Sample :No.
Noduletype
TotaIsulfhr
(ppm)
Totalcarbon(ppm)
Watersoluble
sodium (%)
Manganese* (%)
B32FG251-l
FG251-2
B2FG192-1FG192-2B31FG250-1FG250-2B30FG249-lFG249-2FGFGFGFGFGFG
193-1
193-2
194-1
194-2
195-1
195-2
FG247-1:FG247-2
FG246-1FG246-2FGFGFGFGFGFGFGFGFG
196-1 1n.
196-1 0u.
196-2 1n.
196-2 0u.
196-3
19641n.196-4 0u.
196-5 1n.
196-5 0u.
B29FG245-1FG245-2FG197-lFG197-2FG197-3FG24些一1(Sr)
FG244-1(slab)
FG244-2FG198-1FG198-2FG198-3FG198-4FG243-1FG243-2FG199-1FG199-2
DsFs
D3/Ss
DPs/IDPsIDPs/Ds
Ss/D3
D5/DPs/Ls
Ls/Ds
DPs/Ls
D3/DPs
DPs/1DPsDPs/1DPsSr
Sr/SEr
DPs/1DPs(SEr)
DPs/(Sr)
Sr/SEr(DPr)
DPs/(Sr)
DPs/1DPsDPs/IDPsDPs/IDPsDPs/IDPsIDPs/DPsIDPs
DPs/1DPsDPs
VDPs/IDPsDPsDPsDPsSr/SPr/Dr/Db
Sr/SEr
Sr/SEr
IDPs/DPsIDPs/DPs/(SEr)
1:DPs
Sr/SEr
Sr
Sr/SEr
IDPsIDPsIDPsIDPsDr/Sr
Sr/Vr
SPr/Sr
SPr/Sr
114一
170
620
1120
1090
420
450
350
250
680
730
1140
1000
260
390
500
390
570
710
850
920
990
500
700
160
620
170
670
240
600
770
320
380
650
590
830
1000
220
400
440
410
530
380
400
360
160 170720
740
550
640
700
760
760
1090
420
580
650
330
720
740
540
1340
390
400
440
790
740
670
660
1290
440
500
340
590
470
740
510
1410
810
200
520
490
520
400
360
730
580
610
530
540
650
850
2180
900
560
560
0.13
0.20
0.47
0.23
0.20
0.23
0.26
0.14
0.21
0.18
0.42
0.32
0.20n.d.
0.21
0.21
0.23
0.29
0.24
0.32
0.45
0.32
0.23
0.14
0.24
0.15
0.21
0.17
0.24
0.24
0.16
0.23
0.35
0.28
0.23
0.33
0.16
0.21
0.16
0.23
0.22
0.19
0.17
0.20n.d.
n.d.
0.35
0.31
21.07
20.93
19.98
20.59
19.51
12.35
20.42
15.81
20.77
17.58
20.47
18.98
22.09
18.61
23.46
26.88
23.96
22.70
18.10
20.61
19.15
19.13
20.11
20.09
22.16
19.88
20.29
20.20
20.59
19.85
20.34
30.48
24.00
24.43
22.95
18.15
7.33
23.95
21.61
24.68
16.67
14.33
14.57
13.45
31.96
28.17
21.84
22.35
(continued)
No.Station No.
49
50
51
52
53
54
55
56
57
58
59
60
61
62
63
6465
66
67
68
69
70
71
72
73
74
75
76
77
78
79
80
81
82
83
84
85
86
87
88
89
90
91
92
93
94
95
96
97
1638
1599
1601
1635
1635A
1634
1603
1604
1631
1606
1629
1607
1628
1609
1625
1611
1623
1622
1621
1616
1620
1619
S吻7αη4σ励・伽Mη一π・4%」65(π鰯h魏α,翫んα・αη4瀬・6h蜘勧
Sample No.
Nodule type
Tot31sulfhr
(ppm)
Totalcardon(ppm)
Watersolublesodium (%)
FG242-1FG242-2FG201-2FG201-3FG201-4
B6FG203-1FG203-2B26FG238-1
.FG238-2
FG239-1FG239-2D377FG237-1FG237-2FG205-lFG205-2FG206-2B24FG234-1
FG234-2
B9FG208-2B23FG232-1FG232-2P161FG209-lFG209-2FG231-2FG211-2B21FG228-1
B ll
FG213-1
B20Sur.
B20B皿. FG225-1
B19 FG22手一1
:FG224-2
B14 FG218-2
B18 FG223-1
FG223-2
FG222-1
FG222-2
Sr/Dr
Ir/Vr/SPr
Sr
Sr
Sr/SPr
Sr
Sr
Sr
Sr/Dr
Sr/Dr
Sr/Dr
IDPs/r/DPs/r
IDPr/DrIr/Vr/Sr
IDPs/r/DPs/r
亙DPs/r/DPs/r
Sr
SPr/Sr
Sr
Sr
SPs/r/Ss/r
SPs/r/Ss/r
DPsSr/SEr
Ir/1DPr/Sr/Ls十r
Sr/Ds/r/Ls十r
Sr/SEr
DPs/SPs
IDPsIDPs亙r
DPs/1DPsDPs/Ds
Ss/1s
VsVsSs/SPs
Ss
Ss/Ds
DsSs/Ds
DPs/Ls
Ss/Ls/(SPs)
Ss/DPs/Fs
DsSs/SEs
Ss/SEs
DPs/Lr十s
DPs/SPs/1Ss
430120
530
900
640
430
350
400
1310
430
370
770
320
330
830
1040
550
540
480
530
650
740
1070
200
1060
890
550
670
800
600
370
930
700420
350
2101590
730 5301500
880 950 9401220
9701310
990 980 930
730
840
730
3160
410
520
410
410
480
620
390
580
760
920
590 590790
520
1520
440 390 520 2801010
730 470 490 590 470 480 6301220
4702140
560 740 510 430 990 410 430 560 4904180
490 400 730 620 610
0.19
0.13
0.20
0.18
0.27
0.18
0.19
0.22
0.34n.d.
0.23
0.25
0.19n.d.
0.29
0。41n.d.
0.20n.d.
0.32
0.26
0.38
0.28
0.15
0.31
0.29
0.23
0.27
0.24
0.18
0.17
0.22
0.27n.d.
0.18
0.18
0.48
0.29
0.14
0.36
0.23
0.33
0.23
0.20
0.19
0.44
0.35
0.30
0.25
一115一
Manganese* (%)
26.90
28.36
14.47
8.7621.55
26.74
26.66
28.33
29.38
26.59
28.86
15.99
9.58
7.1422.51
23.32
26.84
25.95
19.65
24.72
23.78
22.46
20.12
4.85
18.04
21.23
27.00
19.64
14.57
14.90
26.39
19.43
10.29
7.62
5.76
6.85
18.98
14.67
18.08
18.57
18.63
18.91
19.29
13.66
20.25
19.18
19.33
18.74
20.05
糞
鐵
藝
嚢藝
嚢
議
諜嚢
萎
嚢
嚢
ii
B%伽πφh6σ60Jo9ゴ6αIS%吻げ諏卿,殉1。33,瓦・.3
(continued)
No.Station No.
Sample No.
Nodule type
WaterTotal Totalsu1飴 carb。n s・luble Manganese* sodium (%)(ppm) (ppm) (%)
98
99
100
101
102
103
104
105
106
107
108
109
110
111
1617
1618
1618A
B17B151n.
B150u.FG219-11n.
FG219-10u.FG219-21n.#1
FG219-21n.#2
FG219-20u.B161rr.
B16Sph.FG220-2FG221-1Sph.FG221-11rr。
FG221-2
SPs/1DPsSs
Ss
ss/DPs/1DPs
Ss
Ss
Ss
Ss
Ss
Ss
Ss/1Ss
ISs/DPs/Ss
ISs
ISs/DPs
890
1330
160
1540
120
770
1360
120
430
820
670
930
360
910
590
400
1210
960
1800
420
450
1220
920
580
540
620
1100
620
0.21
0.27
0.14
0.57
0.12
0.23
0.44
0.14
0.16
0.23
0.24
0.31
0.16
0.26
21.94
18.67
15.56
17.58
13.00
18.61
17.46
15.67
11.16
20.59
18.66
20.13
9.5718.08
Nos.1-16,Mid-PaciHcMountains;17-53,CentralPaciHcBasin,NorthemPartl54-67,CentralPaci五cBasin,CentralPartl
68-79,Central PaciHc Basin,Southem Part and North Tokelau Basinl80-86,Manihiki Westem Plateau and Manihiki
Northeastem Basin;87-111,Penrhyn Basin。
In。:Inner三〇u.:Outer3Sph.:Sphere三Irr。=Irregular3Sur.:Su晦ce3Bur.:Buried.
*Data taken丘om Usul and MocHlzuKI(1982)。
the Mid-pacific Mounta圭ns, Central Pacific
Basin and North Tokelau Basin.This may be
related to nodule type and/or bathymetric or
geographical environment of nodule occur-
rence。Table5shows the average contents ofsome elements on typical fbhr types ofnodules.
Total sulfhr,total carbon and water soluble
sodium are relatively enriched in s-type
nodules which are poorer in manganese than
r-type nodules.The Ss-type nodules翫re most
abundant in both total sulfhr and total carbon3
and these nodules 丘equently occur in the
southern part of the survey area。
⊂】⑪穿置㊧盈題電量⑭聡題聡皇⑪聡9§⑪醗㊧e且肥朧㊧臨重s
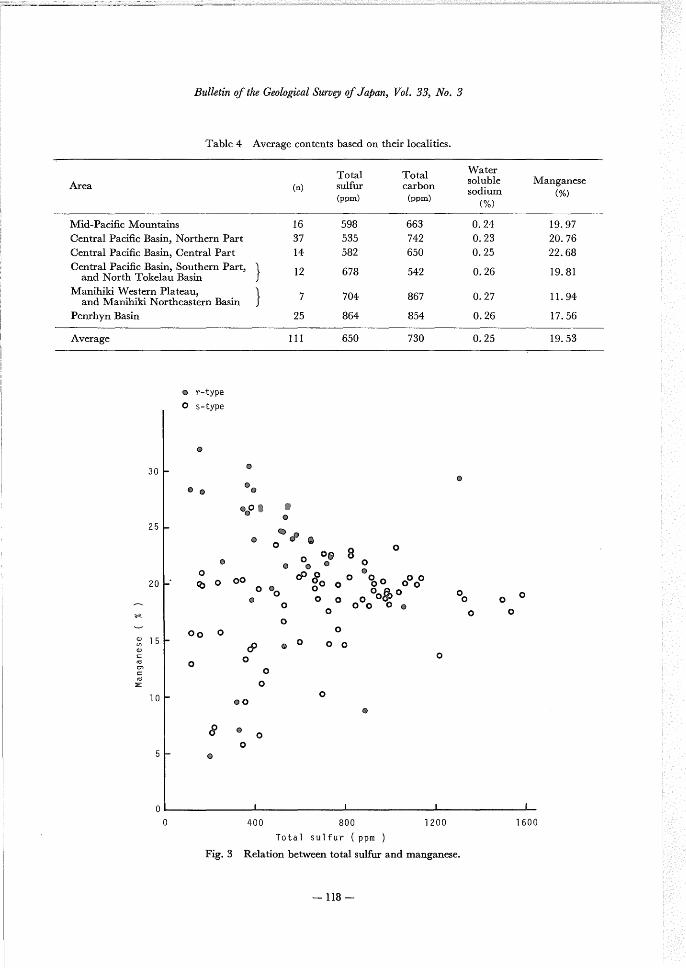
Manganese an(i total sulfヒr乱re correlated
inversely on the nodules with high manganese
(more than about18%)contents。Those with
low manganese (1ess than 18%)contents,
however,appear to have a rather positive
correlation,as shown in Fig.3.The result was
nearly the same as the relationship between
manganese and iron contents(MoGHlzuKI6渉α1.シ1981).This may be related to chemica1
characteristics ofmang&nese d皿ing the nodule
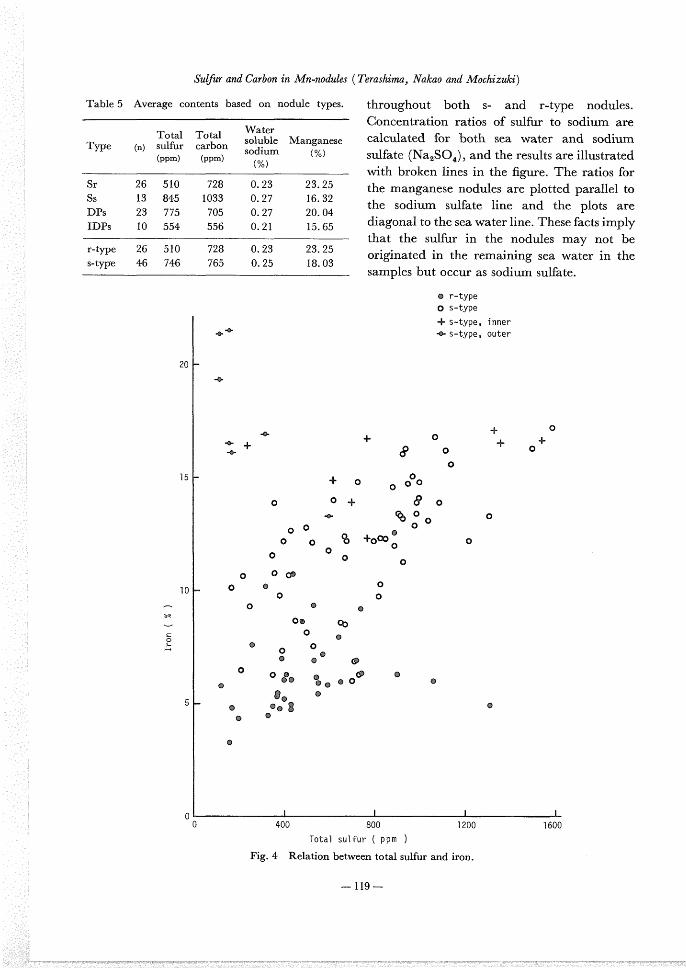
fbrmation.The relationship between iron and
totalsulfUrcontentsareshowninFig。4。There exists postitive correlation in most of
the s-type nodules, but this correlation is
ambiguous in the r-type ones.There are clear
dif驚rences in the total sulfhr contents between
inner zone and outer zone of some selected
nodules.In most cases,total sulfUr is more
abundant in the inner zone than the outer
zone,as shown in Fig,4.
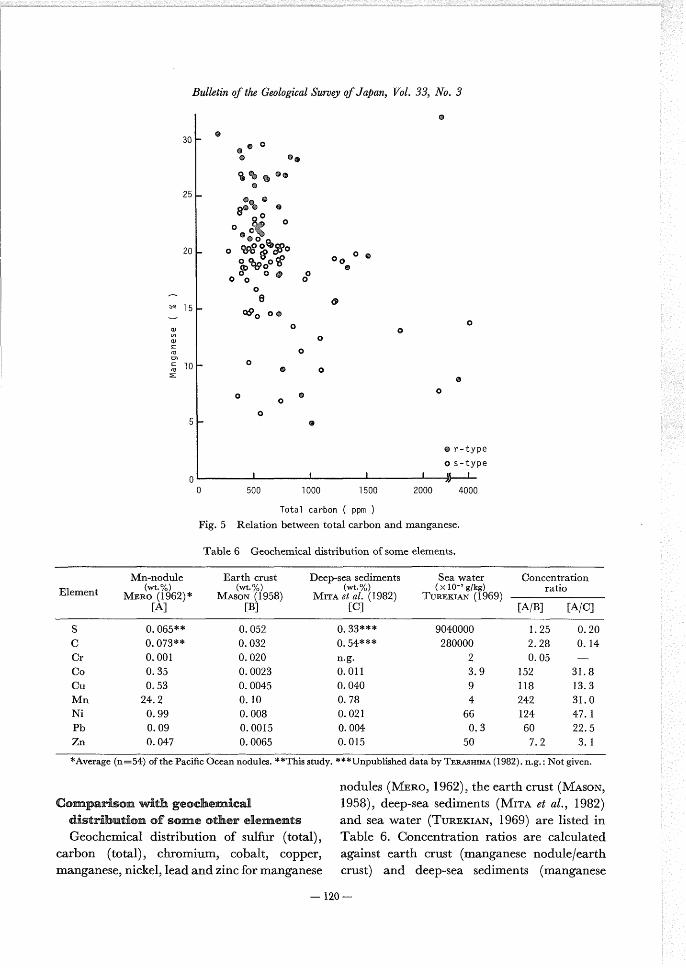
The content oftotal carbon varies in a wide
range fbr the nodules with low manganese
contents(1ess than about20%),whereas it
tends to be restricted to relati〉ely n乱rrow
range on those with high manganese(more
than20%)contents,as shown in Fig.5。There
are no clear correlations between total carbon
and tot&1sulfUr contents.
It is generally known that sulfide sulfhr in
the coastal ma血e sediments is produced by
compensαtion of sul魚te sulfヒr during the
process of bacterial sulfate reduction。The
bacterial sulfate reduction occurs only in the
116一
S%伽αη40励・η勿Mη一n・4%」65(乃7α5h伽,翫んα・鰯ルf・6h伽爾
Table3 Contents ofnon-carbonate carbon,carbonate
carbon,calciumoxide&nd barium in selected
manganese nodules黛om the GH80-1cruise、
No.
Non. Cεしrbonate Calciumcarbonate carbon oxide carbon (ppm) (%) (ppm)
Barium (%)
4000
1
3
4
8
11
18
22
30
32
33
34
35
37
39
44
48
52
56
61
6472
76
79
80
81
83
85
87
92
93
94
96
100
102
105
106
110
400
530
390
400
430
300
240
300
200
430
380
300
300
500
660
420
1400
380
410
330
770
580
370
960
470
410
410
690
500
380
320
440
880
1160
960
520
770
150
170
370
180
290
490
1050
1110
<10
90110
220
60
80190
140
1760
30350
260
240
10260
260
<10
150
100
300
3680
110
80180
330
640
260
400
330
1.71
2.25
2.53
1.75
2.38
4.12
2.35
2.27
2.31
1.82
1.83
1.86
1.67
2.08
1.35
1.85
7.28
2.35
2.26
2.28
0。98
2.24
2.24
2.52
2.31
1.51
2.66
2.46
9.24
2.28
2.63
2.39
2.26
1.97
2.66
2.94
2.42
0.20
0.16
0.14
0.15
0.18
0.14
0.17
0.13
0.18
0.12
0.12
0.17
0.05
0.12
0.10
0.09
0.05
0.15
0.13
0.22
0.04
0.14
0.20
0,13
0.09
0。05
0.13
0.12
0.13
0.13
0.16
0.15
0.14
0.14
0.16
0.07
0.09
一3000E⊆α
ニ
2詰20000Φ
ρ心⊆
o⊇」ゆ
01000
0
轡r-typeO s-type
へ o 幻 厄 乱
o ミ)
”
Qo㊨o
o
3
@噛。
Oo
趣
o
0.13
Fig。2
0 2 4 6 8 10
Calclum oxide( % )
R.elation between calcium oxide and carbonate
carbon.
indicate that the reaction of bacterial sulfate
reduction is impossible in the stronglyoxidizing
conditions of the Central Paci丘c Basin,and
there sulfide sulfhr may not be produced.
Average 521 390 2.54
Nos.same as Table2.
absence of’oxygen,and the sulfhr and organic
matter contents are positively correlated in
most cases。There was no positive correlation
between total sulfUr and non-carbonate carbon
in the manganese nodules。The results may
{》c¢騒蜜置⑱臨¢㊧o置s題亘臨欝
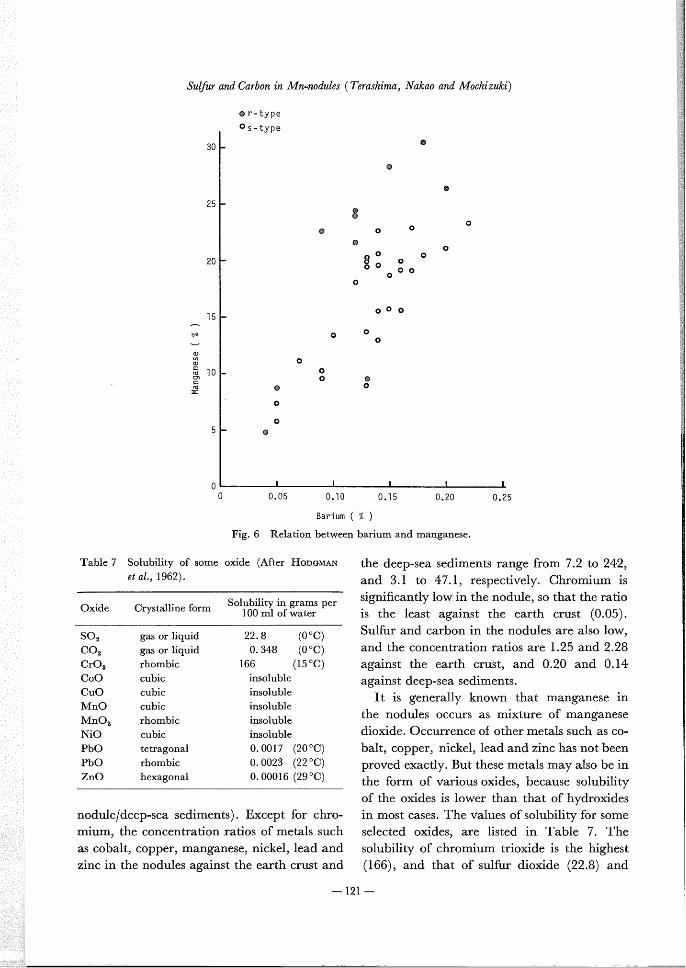
Barite(BaSO4)is most common amongsu1無一bearing minerals which wid.espread in
deep-sea sediments.In this study,barium
content of some selected nodules was deter-
mined in order to seek possibility ofthe barite
contained in the studied samples。The content
ranges fヒom O.04to O22%,and averages
O.13%.The results clearly indicates that the
barium contents are to610w to consumesulfUr in the nodules to fbrm b乱rite,Further-
more,there is no clear correlation between
b&rium and sulfUr contentsl whereas the
bariumis positivelycorrelatedwithmangαnese,
as gi▽en in Fig。6.The similar tendency fbr
correlation ofbarium and manganese has been
reported by PIPER6≠α1。(1977)。
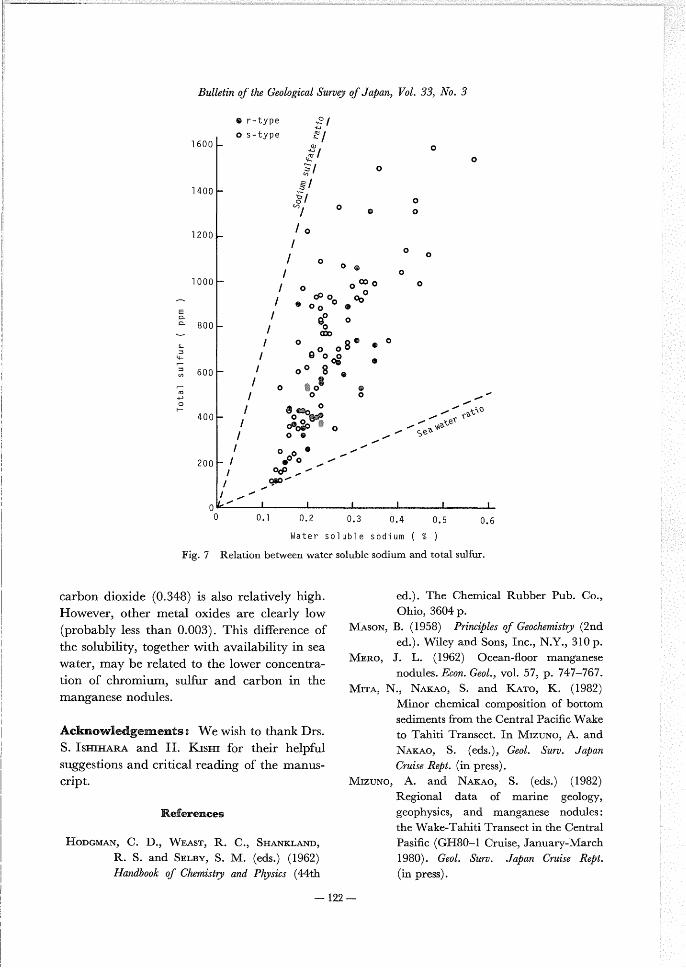
The relationship between water soluble
sodium and total sulfhr contents are presented
in Fig.7。There is clear positive correlation
117
β%JJ6痂φhθσθ・」・9づ6αJS鉱吻げ」吻π,γbJ.33,葡.3
Table4 Average contents based on their localities.
Area (n)
TotalsulfUr
(ppm)
Totalcarbon(ppm)
Watersoluble
sodium (%)
Manganese (%)
Mid-Paci丘c Mountains
CentraユPacific Basin,Northern Part
Central Paci£c Basin,Central Part
C蕾駕蕪撫濃霊emPa「t・}
M弐鼎、畿「臨搬,nB、,in}
Penrhyn Basin
16
37
14
12
725
598
535
582
678
704
864
663
742
650
542
867
854
0。24
0.23
0.25
0.26
0.27
0.26
19.97
20.76
22.68
19.81
11.94
17.56
Average 111 650 730 0.25 19.53
30
25
20
訳
Φ153需望
£
10
5
0
⑭卜type
Os-type
薗
萄⑱
魯
轡
愈@
噌舞
⑭
嚢愚
⑳ ♂魯o
◎翻
oq》◎o◎o㊥ o 趨 ◎
◎◎ ◎
◎
∂
o
麟◎
◎
◎
8鯉◎ ◎爾
◎
o齪8 ◎ ㊥ ◎
艦◎◎警・。♂3
◎◎
◎。◎◎。亀㊥
⑱◎
o
◎
◎◎
愈
o
@
Oo ◎
ooo
0 400 800 1200
Totalsulfur(PPm)Fig。3 Relation between total sulfhr and manganese.
1600
一118一
S幽7αη4σ励・厄πMπ一π・4%」65(乃郷h勉α,翫伽鰯瀬・6hεz鷹)
Table5 Average contents based on nodule types,
Type Total(n)sulfur
(ppm)
WaterTotalcarb。n s・lubleM翫nganese sodium (%〉(ppm)
(%)
Sr
Ss
DPsIDPs
26 510
13 845
23 775
10 554
728
1033
705
556
0.23
0.27
0.27
0.21
23.25
16.32
20.04
15.65
r-type 26 510s-type 46 746
728
7650.23
0.25
23.25
18.03
throughout both s- and r-type nodules.
Concentration ratios of sulfヒr to sodium are
calculated.fbr both sea water and sodium
sulfate(Na2SO4),and the results are illustrated
with broken lines in the figure、The ratios飾r
the manganese nodules are plotted parallel to
the sodium sulfate line αnd the plots are
diagonal to theseawaterline.These魚ctsimply
that the sulfhr in the nodules may not be
originated in the remaining sea water in the
samples but occur as sodium su1飯te.
駅
⊆
o餌
20
15
10
5
0
愈φ
㊥
⑱
奪十φ
o
⑭
醗
o
◎
⑭
◎
㊥
傘
禽
◎
◎
◎◎◎ o
◎(欝
◎
◎
⑱
◎⑱
◎
o晶 ㊥㊥
⑭⑭認醗
十 〇
〇 十
噸
◎
も
◎
十・
8
㊥r-type◎s-type十s-type, i nneγ’
轡s-type,outer
◎
oo
雫 o十 牛
o
o ◎o o 8◎
も◎o o ⑭ ◎十〇〇〇 ◎ ◎
㊥
露
偽 魑o 爾麟 ㊥
爾 (興㊥㊥爾◎鯉
◎
o
⑱
◎
轡
㊥
0 400 800 1200
Totalsulfur(ppm)
Fig.4 Relation between total sulfhr and iron.
1600
一119一
B%伽πげ孟h6σ60」・9∫6αJS%7妙φ」α伽,7bl。33,飾.3
30
25
20
訳15
Φ◎り
Φ⊆而
ゆ
⊆10邸
Σ
5
0
⑭
⑪o 愈 曹 ㊥◎
懸魅秘㊥㊥ @
8轟㊥⑤
・.錘
。
・。離
。
o o愈 oO O O
o
o
eqgoo㊥
o
o
⑱
o
o
0
㊥
@
0
0
0⑲Oo ㊦
δ
o
⑱
o
⑳
0
㊥r-type
os-type
0
Fig.5
500 1000 1500 2000 県 Totalcarbon(PPm)
Relation between tot&1carbon and manganese.
4000
Table6 Geochemic我1d.istribution ofsome elements.
Mn-nodule (wt,%)Element MERO(1962)* [A]
Earth crust (wt。%)
MASON(1958) [B]
Deep-sea sediments (wt.%)
MITA蜘1.(1982) [C]
Sea water (×10-79/kg)
TUREKIAN(1969)
Concentration
ratio
[AIB] [A/c]
SCCr
CoCuMnNi
PbZn
0.065**
0.073**
0.001
0.35
0.53
24.2
0.99
0.090.047
0.052
0.032
0.020
0.0023
0.0045
0.100.008
0.0015
0.0065
0.33***
0.54***
n・9・
0.011
0.040
0.780.021
0.004
0.015
9040000
280000
2
3.9
9
4
66
0.3
50
1.25
2.28
0.05
152
118
242
124
60
7.2
0。20
0。14
31.8
13.3
31.0
47.1
22.53.1
*Average(n=54)ofthe PaciHc Ocean nodules・紳This study・***Unpublished databyTERAsHIMA(1982)・n・g.=Not given・
c⑪灘昼》麗誠§⑪聡w置鵬ge⑪¢臨⑱職量c箆且
鵡量s電置置霞3聰重量⑪聡⑪ぜs⑪朧㊧⑪電畳鼠e留e且e灘㊧魍電§
Geochemical distribution of sulfヒr(total),
carbon (tota1),chromium,cob翫1t,copper,
manganese,nicke1,leadandzincfbrm乱nganese
nodules(MERo,1962),the earth crust(MAsoN,
1958),deep-sea sediments(MITA6厩1.,1982)
and,sea water(TuREKIAN,1969)抗re listed in
Table 6.Concentration ratios are calculated
against earth crust(manganese nodule/e&rth
crust)and deep-sea sediments(manganese
一120一
S吻7αη4σ励・瘤πMη一η・躍θ5(乃鰯h伽,瓦ぬ・姻瀬・6h∫z襯)
30
25
20
15
訳
Φの
雲810毒Σ
5
0
⑭r-type
Os-type
㊥
⑱
o
◎
0
⑱
oo
o
謬
㊥
o
⑱
00
㊥
O o8 000 0 0 0
o
9
o O o
o
㊧
o
o
薯
0
Fig。6
0.05 0.10 0.15 0.20
Barium ( % )
Relation between barium and manganese。
0。25
Table7 Solubility of some oxide(After HoDGMANθ渉α」.,1962).
Oxide Crystalline hmSolubility in grams per
lOO ml ofwater
SO2CO2CrO3CoOCuOMnOMnO2NioPbOPbOZnO
gas or liquid
gas or liquid
rhombiccubic
cubic
cubic
rhombiccubic
tetragonal
rhombichexagonal
22.8 (OOC)
0.348 (OOC)
166 (150C) insoluble
insoluble
insoluble
insoluble
insoluble
O.0017(200C)
0.0023(22。C)
0.00016(29。C)
nodule/deep.sea sediments)。ExcepHbr chro-
mium,the concentrationτatios of metals such
ascobalt,coPPer,manganese,nickel,1eadandzinc in the nodules against the earth crust and
the deep-sea sediments range丘om7。2to242,
and3。1to47.1,respectively.Chromium issignificantly low in the nodule,so that the ratio
is the least against the earth crust (0。05)。
Sulfhr and carbon in the nodules are also low,
and the concentration ratios are1.25and2.28
against the earth crust,and O.20 and O.14
against deep-sea sediments。
It is generally known that manganese in
the nodules occurs as mixture of manganese
dioxide.Occurrence of othermetals such as co-
balt,coPPer,nicke1,1ead and zinc has not been
proved exactly.But these metals may also be in
the fbrm of various oxides,because solubility
of the oxides is lower than that of hydroxides
in most cases.The values ofsolubility fbr some
selected oxides,are listed in T&ble7.The
solubi1三ty of chrolnium trioxide is the highest
(166),and that of sulfhr dioxide (22.8) and
一121一
「
Bz6Jl8∫∫nげ♂hθθ60Jo46αl Sz67∂砂gプ」4ψαπ,レわ1.33,ハ乙o.3
Ei
q血
』
コ
}
5の
而
ρo卜
1600
1400
1200
1000
800
600
400
200
0
㊦r-type
os-type
ノ
/
ノ
ノ
/
’
ノ
,
ノ
’ 111
1,
ノ
ノ
ノ
ノ
/
/
0
ノ
ノ
額. o ③
00● ヂoo(ρ
蓼ゆ!
81 ぞ/ の ロ 慮! o ミ! o り
§!
81 0ζつ o/ ㊥ o
/o
/
0 0 0 0⑳ ロo OOOO O
び》Oo qbO⑭Oo ⑭
蒐。 ゆOo
o8◎●0 00q8 .oo8② 趣 懸o ㊥ 0 0 11
111評詞G
11 ,! 11ノ!
’
0 0・1 0・2 0.3 0.4 0.5 0.6
Water soluble sodium ( % )
Fig.7 Re1&tion between water soluble sodium and total sulfhL
carbon dioxide (0。348)is also relatively high・
However,other metal ox三des are cle&rly low
(probably less than O。003).This dif驚rence of
the solubility,together with availability in sea
water,may・be related to the lower concentra-
tion of chromium,sulfヒr and carbon in the
manganesenodules.
Ack臨ow置e囎鯉e麟3Wewish to thankDrs.S・Is且II{ARA and H。KIsHI fbr their helpfhl
suggestions and critical reading of the manus-
cript.
Re艶re皿ces
HoDGMAN,C.D.,WEAsT,R.C.,SHANKL州D,
R..S。and S肌BY,S.M。(eds.)(1962)
肋励・・んげCh翻吻αη4P姻65(44th
ed.)。The Chemical Rubber Pub.Co。,
Ohio,3604P。MAsoN,B.(1958)P伽ψ165びσ606h6而吻ノ(2nd
ed.).Wiley and Sons,Inc.,N.Y.,310p。
MERo,J.L.(1962)Ocean一且oor manganese nodules。E60n.σθol。,vo1.57,P。747-767.
MITA,N.,]N’A踏o,S.and KATo,K(1982)
Minor chemical composition of bottom
sediments丘omtheCentralPaci丘cWake to Tahiti Transect.In MlzuNo,A.and NAKAO, S. (eds。), (穿60」。 S%7∂. 」ψαη
0剛乞56Rψ渉.(in press).
MlzuNo,A.and NAKAoラS.(eds.)(1982)
Regional data of marine geology,
geophysics,and.manganese nodules:
theWake-TahitiTransectintheCentral
Pasinc(GH80-1Cruise,January-March
1980).060♂.S瀦」卿η07%歪5θRゆ(in press).
一122一
S喚7αn4伽6・n乞面fη一η・4吻(乃郷h伽,陥んα・姻瀬・6hσz瑚
MocHlzuKI,T.,TERAsHIMA,S.,MlzuNo,A.
and NAKAo,S.(1981)Metal contents
ofmanganese nodules fヒom the GH79-1
area.In MlzuNo,A.(ed.),σ60乙S%7∂・
」ψαn O剛ゴ56Rψ6.,no。15,P・245-256・
PIpER,D.Z.and WILLIAMsoN,M。E.(1977)
Composition ofPacific Ocean f奄rroman.
ganesen・dules.漁吻6θθ・1・紗,v・L23,
p.285-303。
TERAsHIMA,S.(1979) The dete㎜ination of
total carbon, total sulfUr, cεしrbon乱te
and non-carbonate carbon in geologica1
materials by inf士ared absorption spec-
trometry.B%ll。σ601.S%7び.」砂侃,vo1.30,
p.609-627.
TuR.EKIAN,K.K(1969) The oceans,streams,
and atmosphere。In WEDEPo肌,H・K・ (ex.eピL),Hαn4ゐooん のヂ(穿606h6ηzゴ5耽ア,voL
1,Springer-Verlag,Berlin,p.297-323。
Usul,A。and MocHlzuKI,T.(1982)Regional
variation ofmanganese nodule chemistry
from Wake to Tahiti,GH80-1cruise.
In MlzuNo,A。and NAKAo,S.(eds.), 0θol.S%7∂.」αψαπ07漉56Rψ渉。(in press).
マンガン団塊中の硫黄と炭素
寺島 滋・中尾征三・望月常一
要 旨
中央太平洋海盆から得られたマンガン団塊111試料について全硫黄と全炭素を定量し,さらにこれら
元素の存在形態と地球化学的性質を知る目的で一部の試料について非炭酸塩炭素,ナトリウム(水溶性),
カルシウム,バリウムなどを定量した.用いた分析方法は全硫黄,全炭素,非炭酸塩炭素は燃焼一赤外
吸収法であり,他の元素は原子吸光法である.
全硫黄の含有量は120-1590ppmで,平均値は650ppmであった.マンガン量との関係では,マンガ
ン含有量が高い(約18%以上)試料では逆相関,低い試料では正の相関が認められた.加熱試験や水溶
性ナトリウムとの関係などからマンガン団塊中の硫黄はすべて硫酸塩として存在し,特に硫酸ナトリゥ
ムとして含有される可能性が大きい.
全炭素の含有量は200-4180ppmで,平均値は730ppmであった.そして炭酸塩炭素(平均390ppm・
n=37)に比べて非炭酸塩炭素(平均521ppm,n-37)がやや多く含有される.
硫黄,炭素,クロムは,マンガン,ニッケル,銅などに比べてマンガン団塊中に濃縮されない元素で
ある.これら元素の酸化物の水に対する溶解度を比較した結果,硫黄,炭素,クロムの溶解度が他の金
属元素に比べて著しく大きいことがわかった.マンガン団塊中の各種元素の存在量を規制する要因の一
つとして,各元素の海水中の存在量と酸化物の溶解度の差が重要と思われる.
(受付:1981年11月24日3受理;1982年1月18日)
一123一