Embed Size (px)
Citation preview
Bridgewater College
Economic Factors and Obesity For completion of Senior Seminar
Maddison Teasley 11-7-2017
1
Table of Contents
• Abstract……………………………………………………………2
• Introduction………………………………………………………. 3
• Literature review………………………………………………..... 5
• Research Proposal……..………………………………………......7
o Hypotheses……………………………………….………..7
• Descriptive Statistics………………………………………………9
• Empirical results………………………………………...…….…...9
o Regression Analysis Table………………………..……....10
• Conclusion……………………………………………….....……..12
2
Abstract
This document discusses obesity and it’s causes. We look at eight variables to see which
ones have the biggest impact. In our search we discover that the variables we chose don’t have
as much of an impact as we had initially anticipated. Obesity surprisingly isn’t as affected by
income and unemployment as I had hoped, but we did find some interesting results. Hopefully in
the future research will find some of the causes of obesity other than over eating and under
exercising.
3
Introduction
Obesity is a well-known problem within the United States (US). I believe that the
economy has a major effect on the overall well-being of the citizens. In 2014 over seventy
percent of the United States population were overweight or obese, but only thirty six percent
believed that that were obese or overweight. The obesity rate is fast growing with a twenty
percent increase in obesity alone, not including those who are overweight.
Obesity comes along with multiple other health problems such as heart disease, diabetes
and even cancer. I believe economic circumstances have a lot to do with the obesity rate of the
United States. The average salary for a worker in the United States is 44,148 dollars and with
the cost of living ever increasing there may be some correlation between why people are gaining
weight and their after-costs income. Sometimes the government will offer assistance in order to
help some citizens put food on the table, however, that may not be enough to feed a family a
healthy balanced meal. It’s almost like a vicious cycle of poor economic situations aiding in the
rise of obesity and the rise of obesity hurting the economy. My goal of this paper is to collect
and analyze data to try and determine what economic factors influence the obesity rate and
which have no correlation.
Some of the variables that I measured include, unemployment rate, cost of living, and
average yearly income per state could have a major impact on the obesity rate due to the fact that
less money means less opportunity to make healthy decisions at the grocery store. All these
variables have a major impact on the ability for citizens to be healthy, healthy options are
typically more expensive and if there is a low employment rate or low wage rate it’s far more
likely that the citizen or family will be overweight or obese. I compared each states obesity rate
4
to their rates of all the variables I researched. There are also some not so obvious variables we
can look at that may have an impact on the obesity rate.
Some variables that may influence obesity rate aren’t as obvious as the ones already
listed. These include the percentage of the population that has insurance, racial distinctions,
education level and the percentage of the population that receives food stamps. Insurance plays a
role because those who have insurance may be more likely to be more health conscious with
their decisions it also presents a moral hazard problem as people may lie about their current
health status in order to get insurance. Racial distinctions may play a role, but in order to find
any direct correlations. Of course, education level plays a role because that impacts the job
market for the individual. Finally, food stamps are a government program to help low income
families afford food, however this isn’t the same budget of higher income families, so once again
probably don’t make as many healthy choices.
Finding out the correlation between obesity and the economy may eventually help solve
the US obesity crisis. This may be able to help economists figure out a way to encourage healthy
habits among citizens. If they discover that money is the issue with healthy habits they may
want to encourage companies to encourage increased wages or increase the number of
employees. I believe that companies should be willing to increase their wages because the better
a worker feels typically the better they will perform at their job and an increased wage will
increase their ability to be healthy and thus feel better. I also believe that if we increase the
amount of people with insurance than the insurance companies may lose out on some money due
to moral hazard problems and the Peltzman effect. This paper determines whether or not
economic factors affect the obesity rates.
5
Literature Review
There are many articles on the topic of obesity, but there are fewer that combine the
factor of economic status. As I stated prior, some of the factors I anticipate using are average
salary per year per family, unemployment rate, percent with insurance, percent with a college
degree, childhood obesity rates, and the percent of people receiving SNAP benefits.
The first article, Socioeconomic Status and Health by Nancy E. Adler, Thomas Boyce,
Margaret A. Chesney, Sheldon Cohen, Susan Folkman, Robert L. Kahn, and S. Leonard Syme. I
saw dealt with socioeconomic status and health aimed to do a few things, first, it reviews
evidence that the correlation of socioeconomic status (which they measured by incorporating
economic status, measured by income; social status, measured by education; and work status,
which they measure by occupation) to health is not simply a threshold effect in which illness and
death increase solely severe deprivation, but is a graded correlation occurring at all levels within
the range of social position. Second, they look at the gradient, this gives a look into psychosocial
variables as well as looking into their own factors. They concluded that those of a lower
socioeconomic status have the highest rates of illness and death, this includes obesity. Overall,
they found that socioeconomic status is one of the key factors in determining the cause of illness
and death.
The next article, Obesity and Socioeconomic Status in Children and Adolescents:
United States by Cynthia L. Ogden; Molly M. Lamb; Margaret D. Carroll; Katherine M. Flegal,
discusses the economic effects on obesity in children. In this article we could make the
assumption that these finding could relate back to adults as well because if the economic effects
6
are affecting the children why wouldn’t they be affecting the parents of these children as well.
This article states that the more impoverished a family is the more likely it is that the children
will become obese. I relate this to my study in the sense that socioeconomic status affects entire
families and not just the children. Kids are easier to be influenced by the environment around
them, this includes the unhealthy lifestyle they may be faced with due to low income or poorly
educated parents. In the article I discussed prior to this one they discussed how outside factors
influence the obesity rate, and if children grow up in conditions in which they are surrounded by
obese prone situations they may be more prone to obesity in the later years.
Economic Causes and Consequences of Obesity by Eric A. Finkelstein, Christopher J.
Ruhm, and Katherine M. Kosa, brings in yet another factor that contributes, or may contribute to
the increasing obesity rate in the United States. Technology has been evolving more and more
over the years and has been making jobs easier and easier. They take some of the manual labor
out of the job which causes some of the energy the worker eats during the day to be stored for the
next time. Healthy foods aren’t as easy to produce in mass quantities and quickly as it is for
unhealthy foods to be produced. But I think that the United States population has overall
become lazier due to the fact that television and environment has changed so much over the
years with the invention of smart phones it’s easy to not leave your house. The less motivation
you have to get up and move, the less energy you expel and the more your body stores. Which
leads to obesity and an increase in food consumption.
The articles discussed all have similar results in the sense that they state that
socioeconomic status is the main cause of illness among workers. While the last two articles I
discuss deal solely with the actual effect of the economy on obesity. One with children’s obesity
as the focus states that children in poorer families tend to be more obese than those in higher
7
classed families. The technology article is discussing how work is becoming easier and the
production of unhealthy foods is also becoming easier so less energy is being used but more is
being consumed as well. Overall the articles have their different theories and they all tend to
lean toward the economy in some way having an impact on the obesity rates.
My Research Proposal
I directly studied the correlation of economic effects on the obesity rate. As I stated prior
I reviewed factors such as income per capita, unemployment rate, region of the US, and the
percentage of people that have insurance. Percentage of people with insurance is one variable
that isn’t so obvious, it leads me to believe that the Peltzman effect comes into play as well as the
classic asymmetric information problem.
The equation I intend to use is:
Obesity=α+ β income per capita+β unemployment rate+β South or not south+β Percent with insurance +βchildhood obesity rate
+β% of population white +β Percent with SNAP benefits +βPercent of people with a bachelors degree
My hypotheses that go along with this equation are that the income per capita will have a
negative correlation to the obesity rate, as in when the income increases the obesity rate will
decrease. Unemployment rate will have a positive correlation because if unemployment
increases so will the obesity rate due to the decrease in income. I included a dummy variable
because I believe that the southern region of the US tends to have an unhealthy diet consisting of
a lot of fried foods, take a look at my grandma’s house for proof on that one. With the percent of
the population with insurance I predict that there will be a positive correlation due to the
Peltzman effect, this states that if there are safety precautions in place those who have said safety
precautions will be more reckless. Childhood obesity I predict will have a positive correlation,
8
the health habits they learn as kids I think carry over into adulthood. I included the race factor
just for my own curiosity to see if there is any correlation. Finally, I added the percentage of the
population on SNAP benefits, I found an article which stated that twenty-eight percent of the
money from this program goes to junk food and drinks so I think there will be a positive
correlation between those on SNAP and the obesity rate. Finally, I added a education variable
because I think the more education you have the more likely it is you’ll be more aware of your
health choices, so with this variable I think there will be a negative correlation. These variables
will help me to prove my overall hypothesis that economic factors have a major impact on
obesity rates. My data research consists of some scholarly articles which I have described to
help me decide what I want to study and where to get some of the information they themselves
used. My data will be from the year of 2014 so that I may use the census bureau to gain data the
year the census was taken. From the census bureau, I intend to find the data for the per capita
income as well as the percentage with insurance and unemployment rate. I also intend to
research some variables I don’t intend to add to my model such as what percentage increase of
wages was there as well as what was the percentage increase in cost of living during the year of
2014. For this data, I will be looking at the Minutes of the Federal Open Market Committee
from September 16–17, 2014. These sources are reliable and worth using because they are all
government websites and contain information from the entire country which they sort and turn
into statistical data that they can use to determine the state of the nation. I find that using
government sources tend to be more reliable than nongovernment websites.
As for the population on SNAP benefits, I found an article which stated that twenty-eight
percent of the money from this program goes to junk food and drinks so I think there will be a
positive correlation between those on SNAP and the obesity rate. These variables will help me
9
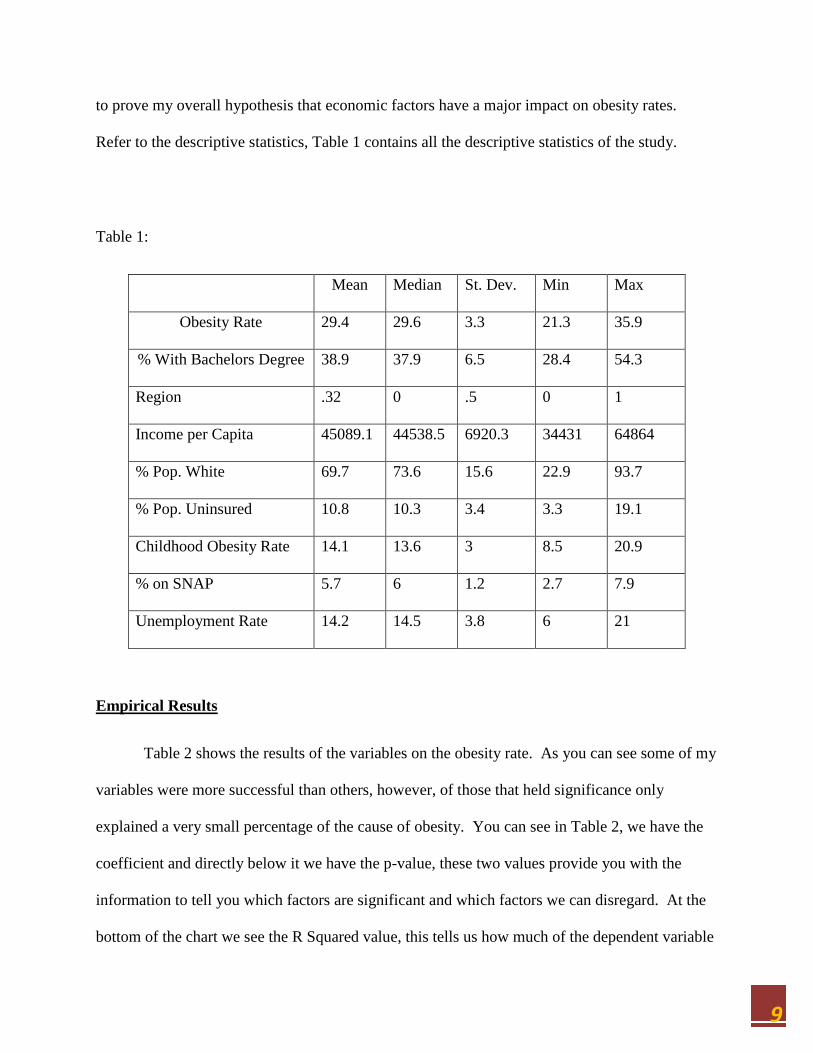
to prove my overall hypothesis that economic factors have a major impact on obesity rates.
Refer to the descriptive statistics, Table 1 contains all the descriptive statistics of the study.
Table 1:
Mean Median St. Dev. Min Max
Obesity Rate 29.4 29.6 3.3 21.3 35.9
% With Bachelors Degree 38.9 37.9 6.5 28.4 54.3
Region .32 0 .5 0 1
Income per Capita 45089.1 44538.5 6920.3 34431 64864
% Pop. White 69.7 73.6 15.6 22.9 93.7
% Pop. Uninsured 10.8 10.3 3.4 3.3 19.1
Childhood Obesity Rate 14.1 13.6 3 8.5 20.9
% on SNAP 5.7 6 1.2 2.7 7.9
Unemployment Rate 14.2 14.5 3.8 6 21
Empirical Results
Table 2 shows the results of the variables on the obesity rate. As you can see some of my
variables were more successful than others, however, of those that held significance only
explained a very small percentage of the cause of obesity. You can see in Table 2, we have the
coefficient and directly below it we have the p-value, these two values provide you with the
information to tell you which factors are significant and which factors we can disregard. At the
bottom of the chart we see the R Squared value, this tells us how much of the dependent variable
10
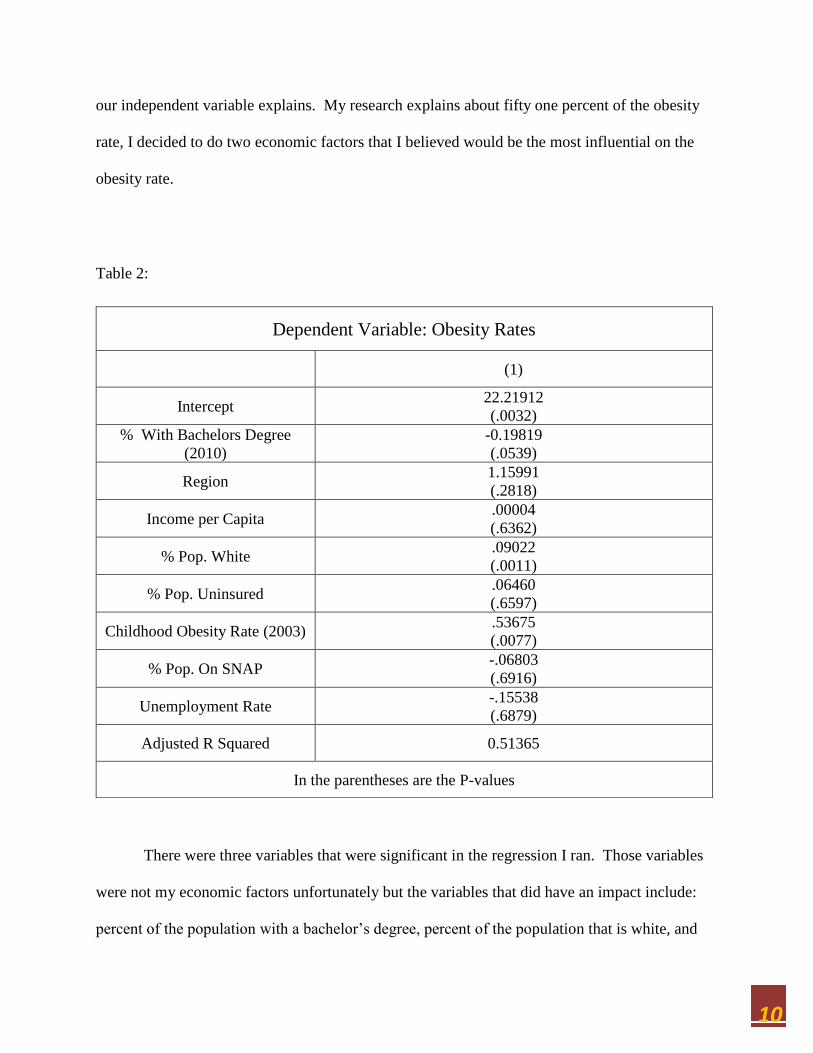
our independent variable explains. My research explains about fifty one percent of the obesity
rate, I decided to do two economic factors that I believed would be the most influential on the
obesity rate.
Table 2:
There were three variables that were significant in the regression I ran. Those variables
were not my economic factors unfortunately but the variables that did have an impact include:
percent of the population with a bachelor’s degree, percent of the population that is white, and
Dependent Variable: Obesity Rates
(1)
Intercept 22.21912
(.0032)
% With Bachelors Degree
(2010)
-0.19819
(.0539)
Region 1.15991
(.2818)
Income per Capita .00004
(.6362)
% Pop. White .09022
(.0011)
% Pop. Uninsured .06460
(.6597)
Childhood Obesity Rate (2003) .53675
(.0077)
% Pop. On SNAP -.06803
(.6916)
Unemployment Rate -.15538
(.6879)
Adjusted R Squared 0.51365
In the parentheses are the P-values
11
the childhood obesity rate. As we see in Table 2, they don’t have an exceptionally large impact
on the overall percentage of the obesity rate. For every one percentage point increase of the
population with a bachelor’s degree the obesity rate decreases by -.198 percentage points. This
proves my theory that the more education you have the more health conscious you tend to be.
Next, with every one percentage point increase in the amount of the population that is white will
increase the obesity rate by .09 percentage points. I didn’t have much of a hypothesis for this
variable but I can’t say the results surprised me. The last significant variable was the childhood
obesity rate which I hypothesized would have a positive correlation, for every one percentage
point increase in the childhood obesity rate the obesity rate percentage will increase .536
percentage points.
Now to get into my nonsignificant variables, these may have had a big impact of the
obesity rate but none of them were significant at the ten percent level. I thought the region of the
US would have an impact because the south is more known for their fried foods and unhealthy
lifestyle. Region would have had a larger impact had it been significant. The next variable,
income per capita is one that I had assumed would have a larger impact on the obesity rate hence
why I chose it. However, that wasn’t the case, this variable wasn’t significant either but even if
it had been it wouldn’t have made a big impact. The percentage of the population that is
uninsured I assumed that those who were insured would be more likely to be obese due to the
Peltzman Effect, however even if it had been significant it wouldn’t have made a major dent on
the obesity rate. SNAP benefits are benefits for those in low income households that helps them
afford more food, this wasn’t significant or a large factor, but I had assumed it would be because
an article stated that 28 percent of purchases with SNAP was junk food and drink. Finally, we
have unemployment rate, this went along with the income per capita variable, again, not
12
significant, unemployment rate has been low in recent years so maybe in times when there is a
higher rate there is a spike in obesity.
Conclusion
Overall, my results didn’t prove what I was hoping they would prove. Although some of
my variables were significant, the ones I was hoping would be significant ending up having the
most miniscule results. Although my factors were not significant we did prove some common
assumptions wrong. Like the assumption that those on SNAP benefits tend to be more likely to
be obese, which we saw in Table 2 was not the case, this was also true for lower income families
and the unemployment rate.
Future research involving economics and obesity should look at other economic factors
such as GDP per capita, industry and cost of living. These may put income and unemployment
into a better perspective and may change the significance levels of these variables. As stated
before the obesity rate is an increasing problem and with further research maybe we could find
the cause and eventually a solution to the problem.
13
Citations
Alder, Nancy, et al. “Socioeconomic Status and Health.” Psycnet, psycnet.apa.org/fulltext/1994-
29613-001.pdf.
Adult Obesity in the United States. (2017, August 31). Retrieved November 10, 2017, from
https://stateofobesity.org/adult-obesity/
Childhood Overweight and Obesity Trends.” National Conference of State Legislatures, NCSL,
26 Feb. 2014, www.ncsl.org/research/health/childhood-obesity-trends-state-rates.aspx.
Data Access and Dissemination Systems (DADS). (2010, October 05). Your Geography
Selections. Retrieved November 10, 2017, from
https://factfinder.census.gov/faces/tableservices/jsf/pages/productview.xhtml?pid=ACS_16_1YR
_CP05&prodType=table
Finklestein, Eric A, et al. “ECONOMIC CAUSES AND CONSEQUENCES OF OBESITY.”
Annual Reviews, University of North Carolina, 1 Nov. 2004,
www.annualreviews.org/doi/pdf/10.1146/annurev.publhealth.26.021304.144628.
Marmot, M G, et al. Annual Review, Department of Community Medicine, 1987,
www.annualreviews.org/doi/pdf/10.1146/annurev.pu.08.050187.000551.
New State-by-State College Attainment Numbers Show Progress Toward 2020 Goal. (2012, July
12). Retrieved October 20, 2017, from https://www.ed.gov/news/press-releases/new-state-state-
college-attainment-numbers-show-progress-toward-2020-goal
14
Ogden, Cynthia, et al. “Obesity and Socioeconomic Status in Children and Adolescents: United
States, 2005–2008.” ERIC, Obesity and Socioeconomic Status in Children and Adolescents:
United States, 2005–2008.
“Percentage of U.S. state population receiving SNAP benefits (Food Stamps) 2011 | Statistic.”
Statista, Statista, 2011, www.statista.com/statistics/223066/percentage-of-us-state-population-
receiving-snap-benefits/.
Smith, J., & Medalia, C. (2015, September). Health Insurance Coverage in the United States:
2014. Retrieved October 20, 2017, from
https://www.census.gov/content/dam/Census/library/publications/2015/demo/p60-253.pdf

![STAMPS(CR) UMfadils.yolasite.com/resources/Manual-S/UM-STAMPS(CR)_v1.0... · Web viewStamp Assessment and Payment Sistem [PANDUAN PENGGUNA stamps(CR) V1.0] [rayuan] DISEDIAKAN OLEH:](https://img.pdfslide.tips/doc/110x75/5e25bddb5004dd37e861fb5e/stampscr-crv10-web-view-stamp-assessment-and-payment-sistem-panduan-pengguna.jpg)