Embed Size (px)
Citation preview
November 1996
CEC DG XII: EU 3rd Framework Programme
Economic Impact Analysis of Ecotax Proposals
Comparative Analysis of Modelling Results
Final Report
INFRAS
Rieterstrasse 18, CH - 8002 Zürich
Tel. ++41 1 - 202 93 14, Fax ++41 1 - 202 33 65
in cooperation with
ECOPLAN
Monbijoustr. 26, CH - 3011 Bern
Tel. ++41 31 - 385 81 81, Fax ++41 31 - 385 81 80
with contributions of:
INFRAS, Zürich: S. Mauch R. Iten S. Banfi S. Hess
ECOPLAN, Berne: R. van Nieuwkoop A. Müller
CEC DG XII: EU 3rd Framework Programme
Economic Impact Analysis of Ecotax Proposals
Comparative Analysis of Modelling Results
Final Report
Overview of Contents i
INFRAS/ECOPLAN
Overview of Contents
Foreword and Aknowledgement.......................................................................... F-1
Summary............................................................................................................. S-1
Zusammenfassung.............................................................................................. Z-1
Part I: Methodology
1. Introduction and aim of the study..................................................................3
2. Methodology .................................................................................................7
3. Typology of models.....................................................................................13
Part II: Parametric Analysis
4. Review of theoretical and empirical studies ................................................23
5. Case study: Swiss GEM analysis................................................................57
Part III: Conclusions
6. Output-sensitive assumptions...................................................................109
7. Meta analysis ............................................................................................121
8. Towards an optimal policy design.............................................................153
9. Conclusions for future Swiss model policy................................................157
Annex 1 ............................................................................................................... A-1
Annex 2 ............................................................................................................. A-19
Abbreviations and Glossary .............................................................................. A-21
Literature ............................................................................................................. L-1

Table of Contents iii
INFRAS/ECOPLAN
Table of Contents
Foreword and Acknowledgement........................................................................ F-1
Summary
The problem and the aim of the study .................................................................. S-1
Methodology ......................................................................................................... S-1
Results of the „anatomic“ model analysis ............................................................. S-2
Main results of the case study for Switzerland...................................................... S-4
Conclusions regarding model characteristics........................................................ S-5
Conclusions from the meta analysis ..................................................................... S-6
Policy conclusions ................................................................................................ S-7
Conclusions for the Swiss Confederation's future modelling policy ....................... S-7
Zusammenfassung
Fragestellung und Ziel der Studie ......................................................................... Z-1
Methode ............................................................................................................... Z-2
Resultate der vergleichenden Modellanalysen...................................................... Z-2
Die wichtigsten Resultate der Fallstudie für die Schweiz ...................................... Z-5
Schlussfolgerungen betreffend die Modelleigenschaften ...................................... Z-8
Die wichtigsten Erkenntnisse der Meta-Analyse ................................................... Z-8
Schlussfolgerungen für die Politik ......................................................................... Z-9
Schlussfolgerungen für die zukünftige Modellpolitik des Bundes ........................ Z-10
Part I: Methodology
1. Introduction and aim of the study ........................................................................3
1.1. Aim of the study.................................................................................................3
1.2. Questions of interest..........................................................................................3
2. Methodology........................................................................................................7
2.1. Parametric analysis ...........................................................................................7
2.2. Case study: Swiss CGE model ..........................................................................9
2.3. Meta analysis...................................................................................................11
iv Table of Contents
INFRAS/ECOPLAN
3. Typology of models .......................................................................................... 13
3.1. Overview ......................................................................................................... 13
3.2. Preliminary assessment .................................................................................. 15 3.2.1. Partial equilibrium models ................................................................... 15 3.2.2. Input-Output Models............................................................................ 16 3.2.3. Macroeconomic models ...................................................................... 17 3.2.4. Computable general equilibrium models ............................................. 18 3.2.5. Summary............................................................................................. 19
Part II: Parametric Analysis
4. Review of theoretical and empirical studies...................................................... 23
4.1. Theoretical studies .......................................................................................... 23
4.2. Surveys ........................................................................................................... 29
4.3. Empirical model simulations ............................................................................ 33
4.4. Conclusions..................................................................................................... 47
5. Case study: Swiss GEM analysis ..................................................................... 57
5.1. Introduction ..................................................................................................... 57
5.2. Model description ............................................................................................ 58
5.3. The policy scenarios........................................................................................ 67
5.4. The conceptual framework and hypotheses for the case study Switzerland ................................................................................................... 72
5.5. Reference scenario and comparison with other Swiss studies ........................ 75 5.5.1. Results of the reference scenario........................................................ 75 5.5.2. Comparison with other Swiss studies .................................................. 79
5.6. Sensitivity analysis to changes in policy .......................................................... 82
5.7. Sensitivity analysis of changes of model assumptions .................................... 87 5.7.1. Production function sensitivity analysis ............................................... 87 5.7.2. Sensitivity analysis: international trade and labour supply ................... 91
5.8. Summary of the counterfactual scenarios and the sensitivity analysis............. 95
5.9. The energy tax ................................................................................................ 97 5.9.1. Introduction ......................................................................................... 97 5.9.2. Results ................................................................................................ 99
5.10. Appraisal and interpretation......................................................................... 105
Part III: Conclusions
6. Output-sensitive assumptions ........................................................................ 109
6.1. ETR policy design ......................................................................................... 109
6.2. Framework conditions ................................................................................... 111
Table of Contents v
INFRAS/ECOPLAN
6.3. Model endogenous assumptions (model architecture)..................................115
6.4. Conclusions ...................................................................................................116
7. Meta analysis ..................................................................................................121
7.1. Analysis of gaps in the models considered ....................................................121
7.2. Technical progress, innovations and the role of environmental regulation .....122
7.3. Transitional phenomena: The relevance of time rates of change...................125
7.4. International competitiveness: Impact of offsetting strategies ........................127
7.5. Crosschecking the excess burden effect .......................................................138
7.6. The energy efficiency gap..............................................................................142
7.7. Synthesis .......................................................................................................146
8. Towards an optimal policy design ...................................................................153
9. Conclusions for future Swiss model policy .....................................................157
9.1. Past and present model policies ....................................................................157
9.2. Future needs .................................................................................................158
9.3. Conclusions for modelling policy....................................................................159
Annex
Annex 1: Implementation of Unemployment in the CGE Model .......................... A-1
Theory of unemployment in a nutshell .................................................................. A-1
Implementation of unemployment......................................................................... A-4
Description and evaluation of the implementation possibilities.............................. A-6
Conclusions ........................................................................................................ A-16
Annex 2: Popular Initiative on Energy and Environment (published 28.9.1993)................................................................................................. A-21
Abbreviations and Glossary of Main Expressions ............................................. A-23
Literature ............................................................................................................. L-1

Foreword and Acknowledgement F-1
INFRAS/ECOPLAN
Foreword and Acknowledgement
This report is the Swiss contribution to a project within the third EU framework programme called „Greenhouse Gas Abatement Through Fiscal Policy in the European Union“. The project study team consists of different institutes from five countries, who jointly carried out six studies related to central issues of the analysis of effects (economic and environmental) of fiscal policies designed to reduce greenhouse gas emissions in four member states of the European Union and in Switzerland:
United Kingdom DAE Department of Applied Economics, University of Cambridge, Cambridge Dr. T. Barker, project coordinator
Germany WICEE Wuppertal Institute for Climate, Environment and Energy, Wuppertal Dr. H.J. Luhmann
The Netherlands SEO Stichting voor Economish Onderzoek, Universiteit van Amsterdam, Dr. J.V. van Velthuijsen
France C3ED Centre d’Economie et d’Ethique pour L’Environnement et le Développement, Versailles Prof. S. Faucheux
Switzerland INFRAS Consulting Group for Environmental Economics and Policy, Zurich Dr. S.P. Mauch ECOPLAN Consulting Group for Environmental Economics , Berne R. van Nieuwkoop
The research project comprises six studies and an overall synthesis report, which summarizes the studies and draws general conclusions. Summaries of the studies and the synthesis are published in DAE et al. 1996.
The Swiss study has been elaborated in a fruitful cooperation between INFRAS and ECOPLAN and benefitted from various inputs of the other project partners. It has been financed by the following institutions of the Swiss government: Federal Office for Education and Science, Federal Office of Energy and Federal Finance Administration.
Supplementary funds have been contributed by private firms interested in the topic of greenhouse gas abatement policy. All funds are gratefully acknowledged.

F-2 Foreword and Acknowledgement
INFRAS/ECOPLAN
Three offices of the Swiss government were directly involved in the study process: Federal Office of Energy, Federal Office of Environment, Forests and Landscape and Federal Finance Administration.
Summary S-1
INFRAS/ECOPLAN
Summary
The problem and the aim of the study
In recent years the double-dividend-hypothesis of an Ecological Tax Reform (ETR) turned out to be one of the key issues in the scientific and political discussions of strategies towards sustainable development. In particular, the hypothesis that an ETR leads to an improvement in both environmental quality and economic activity has at-tracted much attention.
Today a variety of sophisticated and complex simulation models are available for the analysis of ETR or fiscal policy measures for greenhouse gas abatement - in Switzerland as well as in Europe or in other OECD countries. The inherent disadvantage of these mathematically stringent models are the restrictive assumptions which they are bound to make with regard to the real world complexity. The limitation in the description of real world phenomena - particularly transitional phenomena - is a high price for the neatness of the simulations. The multitude of these restrictions - differing from model to model - have been the main reason for unexplained contradictory results - real or seeming - between different models.
This situation weakens the explanatory power of the simulation models and sometimes leads to a paralysis of policy and governments - despite the advent of still more, new and more complex models. Therefore, this project aims to contribute to the clarification of these contradictions in order to improve the basis for an effective policy targeted towards sustainable development.
In today’s situation the need is less for yet more and new models striving at adding more sophistication into a particular architecture of a family of models. Rather ther is a need to help policy makers and the majority of professionals (but not „modelling engineers“) to understand the real relevance of the models outputs, to grasp the convergencies and divergencies between model outputs and the real world (which is constantly changing, evolving).
Methodology
The project uses a three-pronged approach. The first tool is a comparative analysis of the „anatomy“ or architecture of recent important studies applying theoretical or numerical simulation models for the evaluation of the economic impacts of ETR packages. This comparative analysis aims at tracing the implications of external input assumptions and of internal structural-architectural model assumptions through the algorithms all the way to outputs. The second is a complementary case study with a computable general equilibrium model for Switzerland with a systematic sensitivity
S-2 Summary
INFRAS/ECOPLAN
analysis. Finally, a meta analysis aims to fill the gaps that the other approaches have left open.
Results of the „anatomic“ model analysis
Convergent results
The most important convergent results among models have been found to be the following:
• The effects of an ETR depend on its key design parameters, both on the levy side of the tax reform and on the side of revenue recycling.
• In general a tax shift from the relative abundant factor labour to the scarce factor environment/energy leads to positive effects on employment (substitution effect) and negative effects on GDP (monetary income effect). There exists a trade-off between employment and GDP effects. Theoretical studies show that negative employment effects have to be expected if negative income effects of the tax dominate over the substitution effect due to the change in the relative factor input prices. However, simulation studies - based on regular assumptions regarding substitution elasticities - show a dominance of the substitution effect. In these cases we can expect positive employment effects.
• Positive employment effects can be expected if the revenues are used for cutting taxes on labour in general and social security contributions of employers (and em-ployees) in particular. The use of revenues for lump sum payments to households and for cutting VAT leads to less important or no positive employment effects.
• For most European countries numerically stronger employment effects can be ex-pected if the cut in social security contributions is designed as a targeted cut towards the low qualified labour force. (This, however, implies also a conservative effect on the structural change of technology and economy.)
• Positive effects on GDP are to be expected if the revenues are used for a cut in capi-tal taxes, as this design favours investment.
• Negative effects on GDP will be limited if the tax is phased in stepwise. An increase in the speed of introduction of the tax leads to negative effects on GDP.
• Both GDP and employment effects depend on the size of the tax reform: The results of the simulations show positive effects on GDP and on employment when the energy tax is introduced stepwise and the (energy) price increase does not exceed 4-5% per year. Higher tax rates lead to negative effects on employment and GDP.
Summary S-3
INFRAS/ECOPLAN
• In general the simulation results show more distinct effects in the long run than in the short run.
Divergent results
• The results of the studies diverge with regard to the relevance of the effects on employment and GDP. There are studies showing negligible effects and others showing quite relevant effects. To a certain degree the differences are due to the model approach chosen: Macroeconomic models lead usually, ceteris paribus, to more optimistic results compared to computable general equilibrium models. The explanation for this tendency seems to be the comparative advantage of macro-economic models in implementing disequilibria, which allows for a more adequate estimation of the employment effects.
• The relative effects of a harmonised scenario, compared to a first mover scenario, are not yet clear. Some studies show relative advantages of a first mover scenario, other studies show clearly negative effects for a country acting as a first mover. The main reason for this divergence are differences between models in the assumptions with respect to international trade and corresponding feed-back effects in the models.
Open questions
• In general the dynamic effects of technical progress are not considered in the models applied so far. This is the first major deficiency.
• The majority of the models considers only voluntary unemployment and therefore only situations where the labour supply determines the real wage. The consideration of involuntary unemployment probably strengthens positive employment effects.
• The effects of compensation for offsetting negative competitiveness effects are not considered in the models.
• The substitution elasticities introduced in the models are usually derived from an empirical basis that analyses changes in one direction. For example, the substitution elasticities between capital and labour are derived from a data basis reflecting a time period with substitution only in one direction, i.e. substitution of labour by capital. For the time being the symmetry of these elasticities is not very well established, even it is quite decisive for the estimation of employment effects due to a change in the rela-tive prices.
• Models do not explicitly address the issue of the optimal level of an energy- CO2-tax and the optimal speed of introduction that minimizes adjustment costs and
S-4 Summary
INFRAS/ECOPLAN
maximises environmental benefits generated from a reduction in energy consump-tion.
Main results of the case study for Switzerland
The analysis carried out with the Swiss CGE model pursues two objectives. Firstly, it provides a systematic check of the results of the anatomic model analysis and secondly, it addresses some of the open questions mentioned above. The model not only depicts voluntary but also involuntary unemployment due to wage rigidity. Furthermore, effects of compensation measures are a part of the scenarios analysed and an extensive sensitivity analysis was carried out.
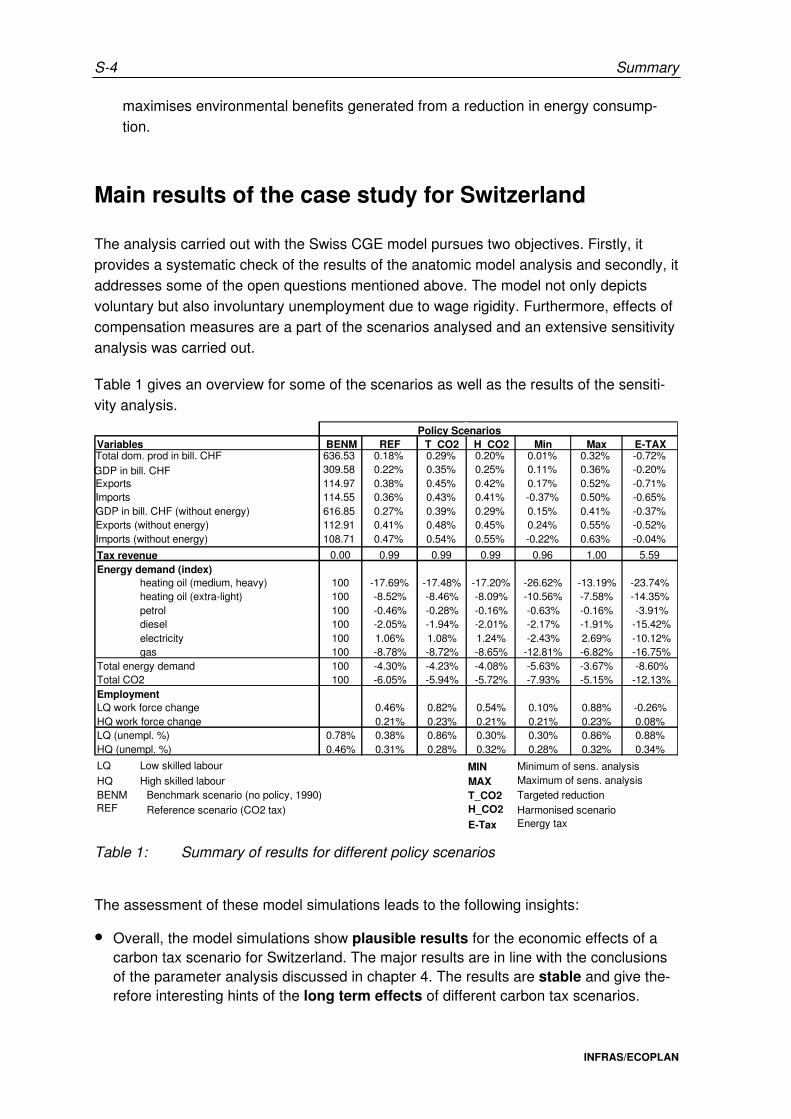
Table 1 gives an overview for some of the scenarios as well as the results of the sensiti-vity analysis.
Benchmark scenario (no policy, 1990)
Policy ScenariosVariables BENM REF T_CO2 H_CO2 Min Max E-TAXTotal dom. prod in bill. CHFCHF
636.53 0.18% 0.29% 0.20% 0.01% 0.32% -0.72%
GDP in bill. CHF 309.58 0.22% 0.35% 0.25% 0.11% 0.36% -0.20%Exports 114.97 0.38% 0.45% 0.42% 0.17% 0.52% -0.71%Imports 114.55 0.36% 0.43% 0.41% -0.37% 0.50% -0.65%GDP in bill. CHF (without energy) 616.85 0.27% 0.39% 0.29% 0.15% 0.41% -0.37%Exports (without energy) 112.91 0.41% 0.48% 0.45% 0.24% 0.55% -0.52%Imports (without energy) 108.71 0.47% 0.54% 0.55% -0.22% 0.63% -0.04%
Tax revenue 0.00 0.99 0.99 0.99 0.96 1.00 5.59Energy demand (index)
heating oil (medium, heavy) 100 -17.69% -17.48% -17.20% -26.62% -13.19% -23.74%heating oil (extra-light) 100 -8.52% -8.46% -8.09% -10.56% -7.58% -14.35%petrol 100 -0.46% -0.28% -0.16% -0.63% -0.16% -3.91%diesel 100 -2.05% -1.94% -2.01% -2.17% -1.91% -15.42%electricity 100 1.06% 1.08% 1.24% -2.43% 2.69% -10.12%gas 100 -8.78% -8.72% -8.65% -12.81% -6.82% -16.75%
Total energy demand 100 -4.30% -4.23% -4.08% -5.63% -3.67% -8.60%Total CO2 100 -6.05% -5.94% -5.72% -7.93% -5.15% -12.13%EmploymentLQ work force change 0.46% 0.82% 0.54% 0.10% 0.88% -0.26%HQ work force change 0.21% 0.23% 0.21% 0.21% 0.23% 0.08%LQ (unempl. %) 0.78% 0.38% 0.86% 0.30% 0.30% 0.86% 0.88%HQ (unempl. %) 0.46% 0.31% 0.28% 0.32% 0.28% 0.32% 0.34%
LQ Low skilled labour MIN Minimum of sens. analysisHQ High skilled labour MAX Maximum of sens. analysisBENM T_CO2 Targeted reductionREF Reference scenario (CO2 tax) H_CO2 Harmonised scenario
E-Tax Energy tax
Table 1: Summary of results for different policy scenarios
The assessment of these model simulations leads to the following insights:
• Overall, the model simulations show plausible results for the economic effects of a carbon tax scenario for Switzerland. The major results are in line with the conclusions of the parameter analysis discussed in chapter 4. The results are stable and give the-refore interesting hints of the long term effects of different carbon tax scenarios.
Summary S-5
INFRAS/ECOPLAN
• The successful implementation of unemployment in the CGE model by a wage rigidity assumption allows more realistic simulations with regard to labour market effects. This is an interesting development of CGE models and makes them more relevant for policy issues.
• The simulations in general show positive economic effects of the introduction of a carbon tax (CO2 tax) in Switzerland, assuming a policy input with the specified fea-tures: revenue recycling, rebate schemes for energy intensive industries. The different effects on GDP and total domestic production indicate that the carbon tax leads to ef-ficiency gains in overall production that allow for a higher GDP by increased factor in-puts (capital and labour) and reduced intermediate inputs.1
• The carbon tax leads to significant reductions in energy consumption.
• The conclusions regarding the CO2 tax scenario are valid for a first mover scenario (with offsetting measures), which is remarkable from a policy point of view.
• Economic impacts are not significantly changed in a harmonised scenario charac-terised by a simultaneous introduction of a similar carbon tax in all other countries trading with Switzerland.
• A more sophisticated revenue recycling with a targeted cut in social security contri-butions enhances the effects on employment significantly.
• The effects of changes in the model endogenous assumptions are rather small. Even model runs based on pessimistic assumptions show positive economic effects.
• Among the model endogenous assumptions the substitution elasticity between energy and capital/labour and the elasticity of labour supply seem to be the most influencial.
• The simulations show that exempting energy intensive sectors does not have a signi-ficant impact on the macro-economic variables (GDP, total exports and imports, un-employment, etc.). At the levels of sectors or even individual firms there are, however, important differences from the scenarios without exemption rules.
Conclusions regarding model characteristics
The review of empirical studies combined with a systematic sensitivity analysis with the CGEM for Switzerland leads to interesting insights regarding the relative importance of model endogenous assumptions compared to the relevance of the internal structure (anatomy) of the model chosen: Generally it seems that the anatomy of the models is more significant for the results than external model assumptions. The simulation results generated by the computable general equilibrium model of ECOPLAN turned out to be quite insensitive to changes in model endogenous assumptions as, for example, the nesting structure of the production functions or substitution elasticities between factor inputs.
1 This is not in contradiction with the fact that a few energy intensive and export/import exposed firms
might see increased competition in the short and medium term. In the political debate, however, these aspects receive much more attention than overall economics impacts.
S-6 Summary
INFRAS/ECOPLAN
Conclusions from the meta analysis
The meta analysis served to
• reveal major limits and deficiencies of the formal mathematical models;
• develop complementing arguments to evaluate what effects a relaxation of the major restrictive assumptions has on the results obtained in simulation.
A number of features of the models applied at present lead to a distorted picture of a complex, dynamic reality. This, in turn, probably creates overly pessimistic forecasts of effects of ETR models. For example:
• The absence of innovation effects triggered by an ETR leads to an overestimation of transition costs and to an underestimation of the positive economic effects.
• Long term effects are underestimated, since they are not easily captured by conventional empirical models. Such effects comprise the cascade of reactions on price changes, reaching from short term changes in consumption at a given capital stock to long term changes in housing and production patterns.
• Technical as well as economic analyses show that a significant improvement of "eco-efficiency" can be achieved at no or even negative net cost. This potential is neglected by standard models for methodological reasons. Again, this leads to an overestimation of transition costs.
• Simplified quantitative estimations for Switzerland show that a shift of some of the tax burden from labour to energy/environment leads to a significant increase in efficiency of the tax system. The questioning of the double dividend hypothesis by several purely theoretical studies can thus be refuted.
Summary S-7
INFRAS/ECOPLAN
Policy conclusions
The following major policy conclusions can be drawn from the analysis:
• According to the state-of-the-art of the available theoretical and empirical studies the double dividend hypothesis in the weak2 sense, i.e. positive environmental and posi-tive employment effects, can be expected to hold true for the EU member countries and for Switzerland - at least in the long run. This has to do with the existence of structural involuntary unemployment.
• With regard to the levy side, a combined energy and carbon tax is the most effective solution. The tax has to be phased in stepwise in order to minimize structural ad-justment costs of firms and households.
• The most favourable impacts on economic performance are achieved if the revenues are fully recycled to households and industries. Employment effects are maximised by using the revenues for lowering the social security contributions of (low skilled) employers and employees.
• Negative impacts on international competitiveness can be controlled effectively by introducing offsetting methods, such as border tax adjustments, sectoral recycling of the revenues or a rebate scheme for buffering the negative short term effects on energy intensive industries. Rebate schemes are in the center of interest with regard to policy implementation because their political acceptance is quite high and work on the practical problems related to the implementation is more advanced.
Conclusions for the Swiss Confederation's future modelling policy
The in-depth assessment of the state-of-the-art in model analyses leads to the following recommendations to decision makers at the level of the Swiss Confederation:
• Since the choice of the model approach has a large effect on the outcome, the modelling strategy should aim at a large diversification. Apart from computable general equilibrium models, econometric macro models should be applied alongside simpler transparent partial analyses. This will shed more light on the broad spectrum of possible results.
Special attention should be given to a more pronounced incorporation of dynamic effects. This is true for the analysis of effects resulting in the course of structural change as well
2 The hypothesis in its strong sense calls for both positive environmental and GDP effects.

S-8 Summary
INFRAS/ECOPLAN
as in the more concrete analysis of long term effects of ETR models. Alternative approaches, such as system dynamics, may be particularly useful in this endeavour.
Zusammenfassung Z-1
INFRAS/ECOPLAN
Zusammenfassung
Fragestellung und Ziel der Studie
Die Hypothese der „doppelten Dividende“ (Double dividend) besagt, dass eine ökologi-sche Steuerreform gleichzeitig zu Verbesserungen der Umweltqualität und des ökono-mischen Ergebnisses führe. Die Relevanz dieser Hypothese wurde in den letzten Jahren zu einer Schlüsselfrage in der wissenschaftlichen und politischen Diskussion von Strate-gien in Richtung nachhaltiger Entwicklung. Insbesondere die Hypothese, dass durch eine geeignete Ausgestaltung der ökologischen Steuerreform sowohl eine bessere Umwelt-qualität erreicht als auch ein Beitrag zur Lösung der in praktisch allen Ländern aktuellen strukturellen Beschäftigungsprobleme geleistet werden kann, wurde stark beachtet.
Heute existiert eine Vielzahl hoch entwickelter und komplexer Simulationsmodelle zur Analyse der ökonomischen Auswirkungen von ökologischen Steuerreformen und anderer fiskalischer Massnahmen zur Bekämpfung des anthropogenen Treibhauseffektes - sowohl in der Schweiz als auch in Europa und anderen OECD-Ländern. Der Nachteil dieser mathematisch stringenten Modelle besteht in den restriktiven Annahmen, die gemacht werden müssen, um die reale Welt für die Zwecke der Modellanalyse zu ver-einfachen. Diese Vereinfachungen - insbesondere die in der Regel weitgehend vernach-lässigten dynamischen Aspekte (sogenannte Transitionsphänomene) - stellen einen hohen Preis dar, um die ökonomischen Wirkungen mit mathematischen Modellen simu-lieren zu können. Die von Modell zu Modell variierenden Restriktionen sind ein Haupt-grund für die beobachteten - jedoch nicht erklärten - scheinbar oder tatsächlich wider-sprüchlichen Resultate der Modellanwendungen.
Diese Situation schwächt die Erklärungskraft der Simulationsmodelle und führt da und dort zu einer Lähmung der Politik, obwohl laufend neue und noch komplexere Modelle entwickelt und angewendet werden. Vor diesem Hintergrund versucht das vorliegende Projekt, zur Klärung der beobachteten Widersprüche beizutragen, um damit die Grundla-gen für eine effektive Politik in Richtung nachhaltiger Entwicklung zu verbessern.
In der heutigen Situation steht dabei weniger die Notwendigkeit neuer Modelle im Vor-dergrund, welche noch mehr Komplexität in eine bestimmte Modellarchitektur zu inte-grieren versuchen. Vielmehr soll Politikern und der Mehrheit der in diesem Bereich tätigen Personen, welche meistens nicht Modellbauer sind, geholfen werden, die tatsächliche Bedeutung der Modellergebnisse zu verstehen - und zwar im Zusammenhang mit einer dynamischen, realen Welt, welche sich laufend verändert und entwickelt. Die Restrukturierungsdynamik von Technik und Wirtschaft ist gerade heutzutage ein sehr prägendes Entwicklungsmerkmal.

Z-2 Zusammenfassung
INFRAS/ECOPLAN
Methode
Drei methodische Ansätze werden angewendet:
• Erstens wird eine vergleichende Modell-Analyse durchgeführt: Die Anatomie bzw. Architektur der in jüngerer Zeit zur Analyse ökonomischer Auswirkungen von Ökotax-Vorschlägen angewendeten wichtigen theoretischen und quantitativen Simula-tionsmodelle wird einem systematischen Vergleich unterzogen. Die Implikationen der externen Input-Annahmen und der internen Modellstruktur-Annahmen für die Modell-ergebnisse werden herausgearbeitet.
• Zweitens wird in einer komplementären Fallstudie für die Schweiz ein berechenbares Gleichgewichtsmodell angewendet und mit einer systematischen Sensitivitätsanalyse die Bedeutung verschiedener externer und interner Modellannahmen mit einer systematischen Sensitivitätsanalyse vertieft ausgeleuchtet.
• Die Meta-Analyse stellt das dritte methodische Element dar. In der Meta-Analyse wird versucht, die in der vergleichenden Analyse und in der Fallstudie identifizierten Lücken der herkömmlichen Modellanalysen mit den Erkenntnissen komplementärer Analysen, welche nicht auf komplexen gesamtwirtschaftlichen Top-down-Modellen basieren, zu ergänzen.
Resultate der vergleichenden Modellanalysen
In dieser Studie wurden rund dreissig in- und ausländische Ökotax-Modelle untersucht.
Die von den Modellen „vorausgesagten“ ökologischen und wirtschaftlichen Auswirkungen hängen von den Annahmen bezüglich dreier verschiedener Parametergruppen ab:
1. Exogene Annahmen über die wirtschaftliche Umfeldentwicklung;
2. Annahmen über die Ausgestaltung der Ökosteuer, sowohl auf der Erhebungs- wie auf der Mittelverwendungsseite;
3. Annahmen in der Modell-Architektur über die realen wirtschaftlichen Zusammen-hänge, zum Beispiel über das Verhalten der Sozialpartner bei Lohnverhandlungen, das Investitionsverhalten von Unternehmen oder die Bedeutung von Standortverlage-rungen ins Ausland.
Die wichtigsten konvergenten Resultate der verschiedenen Modelluntersuchungen können wie folgt zusammengefasst werden:
• Die ökonomischen und umweltseitigen Auswirkungen einer ökologischen Steuer-reform hängen von einigen Schlüsselparametern der Ausgestaltung ab - sowohl auf

Zusammenfassung Z-3
INFRAS/ECOPLAN
der Abgabenseite als auch auf der Mittelverwendungsseite. Insbesondere haben eine schrittweise Einführung, gekoppelt mit einer aufkommensneutralen Ausgestaltung der Abgabe, einen klar positiven Einfluss auf wirtschaftliche Stabilität und Beschäftigung.
• Im allgemeinen existiert ein Trade-Off zwischen Beschäftigungs- und Einkommens-wirkungen: Gemäss der Mehrzahl der untersuchten Studien führt eine Verlagerung der Steuer- und Abgabelasten vom relativ reichlich vorhandenen und bereits stark besteuerten Produktionsfaktor Arbeit zum vergleichsweise knappen aber wenig besteuerten Faktor Umwelt und Energie zu leicht positiven Beschäftigungseffekten (Substitutionseffekt) und leicht negativen Effekten auf das Bruttoinlandprodukt (Ein-kommenseffekt). Theoretische Studien zeigen, dass negative Beschäftigungswir-kungen dann zu erwarten sind, wenn der negative Einkommenseffekt der Einführung einer Steuer grösser ist als der Substitutionseffekt aufgrund der veränderten relativen Preise der Produktionsfaktoren. Die Simulationsstudien, welche auf empirisch geschätzten Substitutionselastizitäten basieren, weisen bei den heutigen steuerlichen Belastungen von Arbeit und Energie/Umwelt auf eine Dominanz des Substitutionseffektes hin. Das heisst, in der Realität können durchaus positive Be-schäftigungseffekte aufgrund der schrittweisen Einführung einer ökologischen Steuerreform erwartet werden.
• Positive Beschäftigungseffekte können erwartet werden, falls die Steuererträge zur Senkung der Steuern und Abgaben auf Arbeit, speziell der lohnabhängigen Beiträge der ArbeitgeberInnen und ArbeitnehmerInnen an die Sozialversicherungen verwendet werden. Die Rückverteilung der Erträge in Form von pauschalen Pro-Kopf-Beiträgen oder deren Verwendung für eine Senkung der Mehrwertsteuersätze führt dagegen zu geringeren oder gar keinen positiven Beschäftigungswirkungen.
• Für die meisten europäischen Länder können quantitativ stärkere Beschäftigungs-wirkungen erwartet werden, wenn die Senkung der Lohnnebenkosten gezielt bei we-niger qualifizierten Arbeitskräften erfolgt. Eine solche Strategie impliziert allerdings aus längerfristiger Sicht auch eine strukturerhaltende Wirkung für die Wirtschaft insgesamt, und den technischen Fortschritt in der Produktion.
• Ein Senkung von Kapital- und Gewinnsteuern führt zu positiven Wirkungen auf das Bruttoinlandprodukt, da damit Investitionen gefördert werden. US-amerikanische Studien zeigen für diese Mittelverwendung die besten Ergebnisse bezüglich Wirt-schaftswachstum. Für Europa scheinen dagegen aufgrund der vergleichsweise hohen Steuer- und Abgabebelastung des Faktors Arbeit eine Senkung der Grenz-steuersätze bei der Einkommenssteuer oder eine Senkung der lohnabhängigen Sozialversicherungsbeiträge bessere Ergebnisse - insbesondere bessere Beschäf-tigungswirkungen - zu bringen.
• Negative Wirkungen auf das Bruttoinlandprodukt nehmen zu, wenn die Steuer in zu grossen Schritten eingeführt wird, bzw. eingeführt werden muss.
Z-4 Zusammenfassung
INFRAS/ECOPLAN
• Sowohl die Effekte auf das Bruttoinlandsprodukt als auch die Beschäftigungswirkun-gen hängen vom Ausmass der ökologischen Steuerreform ab. Für die untersuchten Grössenordnungen der Steuer gelten folgende Schlussfolgerungen: Bis zu einer ge-wissen Höhe des des Steuersatzes sind die Beschäftigungseffekte und die Wirkun-gen auf das BSP positiv. Grob zusammengefasst, können positive Auswirkungen einer schrittweise eingeführten Abgabe bei durchschnittlichen (Energie-)Preiserhö-hungen von bis zu 4 bis 5 % pro Jahr erwartet werden. Höhere Steuersätze wirken sich, gemäss den vorliegenden Ergebnisse, dagegen negativ auf das BSP und die Beschäftigung aus. Die Frage der optimalen Einführungsdynamik und der optimalen Geschwindigkeit des angestrebten Strukturwandels ist dabei noch wenig analysiert.
• Die Simulationsergebnisse für die langfristigen Wirkungen der Steuer sind akzen-tuierter denn für die kurz-/mittelfristigen Wirkungen. Kurz- und mittelfristig werden von den meisten Simulationen recht ähnliche Auswirkungen vorhergesagt: Für eine Öko-steuer in der Grössenordnung des 1992er-Vorschlages der EU-Kommission bzw. des Vorschlages der schweizerischen Bundesrates für eine CO2-Abgabe werden kurz-und mittelfristig unbedeutende bis leicht positive wirtschaftliche Auswirkungen und leicht positive ökologische Auswirkungen vorhergesagt. Die längerfristigen Vorhersa-gen variieren naturgemäss stärker.
Neben den oben dargestellten konvergierenden, hat die Studie auch verschiedene, zwi-schen verschiedenen Modellen divergierende Resultate hervorgebracht. Darunter fallen insbesondere folgende Aspekte:
• Die Ergebnisse divergieren bezüglich des Ausmasses der Beschäftigungswirkungen und der Wirkungen auf das Bruttosozialprodukt. In gewissen Studien sind die be-rechneten Beschäftigungswirkungen vernachlässigbar, in anderen Studien werden dagegen bedeutende Beschäftigungswirkungen vorhergesagt. Unterschiede in den Modellen erklären einen Teil der divergierenden Ergebnisse. Im allgemeinen sind die Ergebnisse der makroökonomischen Modelle - ceteris paribus - optimistischer als die Ergebnisse der berechenbaren Gleichgewichtsmodelle. Diese Tendenz kann u.a. damit erklärt werden, dass makroökonomische Modelle imstande sind, Un-gleichgewichte zu simulieren. Diese Eigenschaft erlaubt beispielsweise eine reali-tätsnähere Abbildung der Situation auf dem Arbeitsmarkt und damit eine plausiblere Abschätzung der Beschäftigungseffekte.
• Die Auswirkungen eines harmonisierten Vorgehens im Vergleich zu einem Voraus-gang eines Landes oder einer Ländergruppe (unilaterales Vorgehen) werden von den Studien ebenfalls recht unterschiedlich beurteilt: In einigen Modellen führt der Vor-ausgang eines Landes zu positiven ökonomischen Wirkungen. In anderen Studien dagegen ergeben die Simulationen bedeutende negative Wirkungen eines Voraus-ganges. Diese Unterschiede können zum grössten Teil mit unterschiedlichen Annah-men bezüglich des internationalen Handels (z.B. Preiselastizitäten der Import- und Exportnachfrage) und Standortverhaltens von Unternehmen in der Modellstruktur erklärt werden.
Zusammenfassung Z-5
INFRAS/ECOPLAN
Neben den konvergierenden und den divergierenden Modellergebnissen zeigt die ver-gleichende Modellanalyse auch Bereiche auf, in denen noch offene Fragen bestehen.
• In den Modellen werden die dynamischen Auswirkungen des technischen Fortschritts meistens nicht oder bestenfalls als exogene Annahme berücksichtigt. Dies ist der wohl wichtigste Mangel der heutigen Modelle.
• Die Mehrheit der Modelle - insbesondere der berechenbaren Gleichgewichtsmodelle - berücksichtigt nur freiwillige Arbeitslosigkeit - eine Annahme, die gerade seit anfangs der 90er Jahre besonders realitätsfremd geworden ist. Einzelne Studien - so auch die Fallstudie für die Schweiz mit dem ECOPLAN-Modell - zeigen, dass die Berücksich-tigung unfreiwilliger Arbeitslosigkeit die positiven Beschäftigungseffekte verstärkt.
• Die Auswirkung von Kompensationsmassnahmen zur Abfederung bzw. Beseitigung von negativen Wirkungen auf die internationale Wettbewerbsfähigkeit wird in den Mo-dellen in der Regel nicht berücksichtigt. Negative Auswirkungen auf einzelne beson-ders energieintensive Sektoren werden dadurch überschätzt. Für die Abschätzung der gesamtwirtschaftlichen Auswirkungen spielt diese Vernachlässigung jedoch eine untergeordnete Rolle.
• Die in den Modellen benützten Substitutionselastizitäten basieren auf empirischen Untersuchungen und analysieren meistens Änderungen in nur einer Richtung. Die Substitutionselastizität von Arbeit durch Kapital, beispielsweise, basiert auf einer Zeitreihe, in der die Substitution in nur eine Richtung stattgefunden hat, d.h. eine Substitution von Arbeit durch Kapital im säkularen Prozess der Steigerung der Ar-beitsproduktivität. Wenn aber die umgekehrte Substitutionselastizität grösser bzw. kleiner wäre, so ergäben sich mehr bzw. weniger positive Beschäftigungseffekte.
• Die Modelle vernachlässigen es, die Frage nach dem optimalen Steuersatz und der optimalen Einführungsgeschwindigkeit für die Minimierung der Anpassungskosten und die Maximierung der positiven Umwelteffekte - also die Frage nach der aus ökonomisch-ökologischer Sicht optimalen Geschwindigkeit des Strukturwandels - zu behandeln.
Die wichtigsten Resultate der Fallstudie für die Schweiz
Die Analyse mit dem berechenbaren Gleichgewichtsmodell für die Schweiz verfolgte zwei Ziele. Erstens bietet sie die Möglichkeit, die Resultate aus der Modellstrukturanalyse systematisch zu überprüfen, und zweitens können einige der oben erwähnten offenen Fragen untersucht werden. Das Modell bildet nicht nur die freiwillige Arbeitslosigkeit, sondern auch unfreiwillige Arbeitslosigkeit infolge einer Lohnrigidität ab. Berücksichtigt werden zudem die Ausnahmeregelungen für energieintensive Sektoren. Die Resultate wurden einer umfassenden Sensitivitätsanalyse unterzogen.
Z-6 Zusammenfassung
INFRAS/ECOPLAN
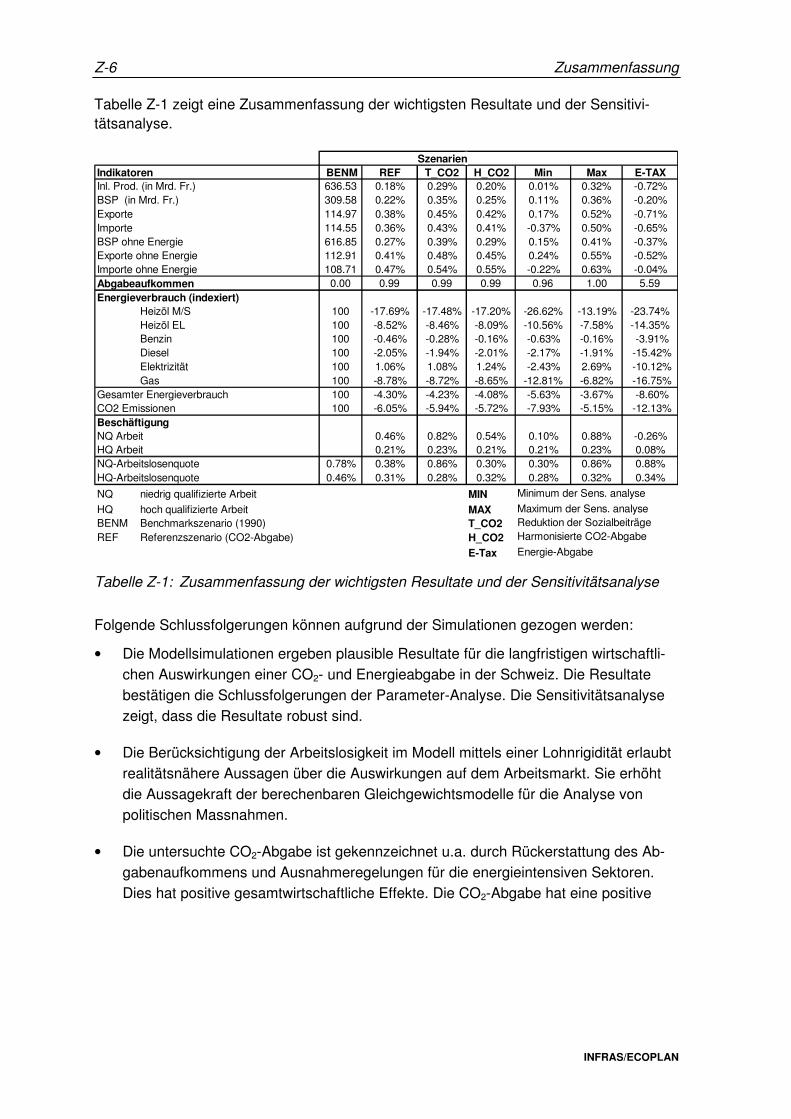
Tabelle Z-1 zeigt eine Zusammenfassung der wichtigsten Resultate und der Sensitivi-tätsanalyse.
SzenarienIndikatoren BENM REF T_CO2 H_CO2 Min Max E-TAXInl. Prod. (in Mrd. Fr.) 636.53 0.18% 0.29% 0.20% 0.01% 0.32% -0.72%BSP (in Mrd. Fr.) 309.58 0.22% 0.35% 0.25% 0.11% 0.36% -0.20%Exporte 114.97 0.38% 0.45% 0.42% 0.17% 0.52% -0.71%Importe 114.55 0.36% 0.43% 0.41% -0.37% 0.50% -0.65%BSP ohne Energie 616.85 0.27% 0.39% 0.29% 0.15% 0.41% -0.37%Exporte ohne Energie 112.91 0.41% 0.48% 0.45% 0.24% 0.55% -0.52%Importe ohne Energie 108.71 0.47% 0.54% 0.55% -0.22% 0.63% -0.04%Abgabeaufkommen 0.00 0.99 0.99 0.99 0.96 1.00 5.59Energieverbrauch (indexiert)
Heizöl M/S 100 -17.69% -17.48% -17.20% -26.62% -13.19% -23.74%Heizöl EL 100 -8.52% -8.46% -8.09% -10.56% -7.58% -14.35%Benzin 100 -0.46% -0.28% -0.16% -0.63% -0.16% -3.91%Diesel 100 -2.05% -1.94% -2.01% -2.17% -1.91% -15.42%Elektrizität 100 1.06% 1.08% 1.24% -2.43% 2.69% -10.12%Gas 100 -8.78% -8.72% -8.65% -12.81% -6.82% -16.75%
Gesamter Energieverbrauch 100 -4.30% -4.23% -4.08% -5.63% -3.67% -8.60%CO2 Emissionen 100 -6.05% -5.94% -5.72% -7.93% -5.15% -12.13%BeschäftigungNQ Arbeit 0.46% 0.82% 0.54% 0.10% 0.88% -0.26%HQ Arbeit 0.21% 0.23% 0.21% 0.21% 0.23% 0.08%NQ-Arbeitslosenquote 0.78% 0.38% 0.86% 0.30% 0.30% 0.86% 0.88%HQ-Arbeitslosenquote 0.46% 0.31% 0.28% 0.32% 0.28% 0.32% 0.34%
NQ niedrig qualifizierte Arbeit MIN Minimum der Sens. analyse
HQ hoch qualifizierte Arbeit MAX Maximum der Sens. analyseBENM Benchmarkszenario (1990) T_CO2 Reduktion der SozialbeiträgeREF Referenzszenario (CO2-Abgabe) H_CO2 Harmonisierte CO2-Abgabe
E-Tax Energie-Abgabe
Tabelle Z-1: Zusammenfassung der wichtigsten Resultate und der Sensitivitätsanalyse
Folgende Schlussfolgerungen können aufgrund der Simulationen gezogen werden:
• Die Modellsimulationen ergeben plausible Resultate für die langfristigen wirtschaftli-chen Auswirkungen einer CO2- und Energieabgabe in der Schweiz. Die Resultate bestätigen die Schlussfolgerungen der Parameter-Analyse. Die Sensitivitätsanalyse zeigt, dass die Resultate robust sind.
• Die Berücksichtigung der Arbeitslosigkeit im Modell mittels einer Lohnrigidität erlaubt realitätsnähere Aussagen über die Auswirkungen auf dem Arbeitsmarkt. Sie erhöht die Aussagekraft der berechenbaren Gleichgewichtsmodelle für die Analyse von politischen Massnahmen.
• Die untersuchte CO2-Abgabe ist gekennzeichnet u.a. durch Rückerstattung des Ab-gabenaufkommens und Ausnahmeregelungen für die energieintensiven Sektoren. Dies hat positive gesamtwirtschaftliche Effekte. Die CO2-Abgabe hat eine positive
Zusammenfassung Z-7
INFRAS/ECOPLAN
Wirkung auf das BSP3 und führt in der Produktion zu einer Substitution der Vor-leistungen durch primäre Faktoren (Arbeit und Kapital).
• Die Effekte der höheren Energieabgabe (E-tax), welche einer Umsetzung der Ener-gie- und Umweltinitiative entspricht und Energiepreiserhöhungen von insgesamt knapp 70 % bei den fossilen Energieträgern und knapp 35% bei Elektrizität impliziert, auf Wirtschaftswachstum und Beschäftigung sind leicht negativ, übersteigen jedoch in keinem Szenario minus 1%.
• Die Abgaben führen zu einer spürbaren bis beachtlichen Reduktion des Energiever-brauchs. Eine CO2-Abgabe in der Grössenordnung des Bundesratsvorschlages von 1994 (mit Abgabenhöhen von z.B. knapp 25 bzw. 30 % der Endnachfragepreise für Erdgas bzw. Heizöl extra leicht und rund 7% für unverbleites Benzin) führt zu Reduk-tionen des Gesamtenergieverbrauchs um ca. 4 bis 5% und der CO2-Emissionen um 6-8%, die deutlich höhere Energieabgabe reduziert den Energieverbrauch um ca. 9% und die CO2-Emissionen um über 12%.
• Die leicht positiven gesamtwirtschaftlichen Auswirkungen gelten für die Einführung einer CO2-Abgabe (inkl. Ausnahmeregelung) im Alleingang, was in politischer Hin-sicht von Bedeutung ist.
• Die Resultate ändern sich nicht stark, wenn man ein Szenario unterstellt, in dem eine ähnliche Abgabe von den schweizerischen Handelspartnern eingeführt wird (siehe Szenario H_CO2 in Tabelle Z-1).
• Eine gezielte Reduktion der Sozialbeiträge der Arbeitgeber verstärkt die positiven Re-sultate auf dem Arbeitsmarkt (siehe Szenario T_CO2 in Tabelle Z-1).
• Die Resultate sind robust gegen Änderungen der modellendogenen Annahmen. So-gar unter sehr pessimistischen Annahmen für die modellendogenen Parameter erge-ben sich positive gesamtwirtschaftliche Auswirkungen.
• Die Sensitivitätsanalyse hat gezeigt, dass die Annahmen über die Höhe der Substitu-tionselastizitäten zwischen Energie und Kapital/Arbeit sowie die Arbeitsangebotelasti-zität die Resultate am meisten beeinflussen.
• Die Simulationen haben gezeigt, dass die Ausnahmeregelung keinen bedeutenden Einfluss auf die gesamtwirtschaftlichen Resultate (gesamte inländische Produktion, Im- und Exporte, Arbeitslosigkeit) hat. Auf der sektoralen Ebene gibt es jedoch klare Unterschiede.
3 Energieintensive und export/import-sensible Unternehmungen können jedoch kurz- bis mittelfristig
Produktionsrückgänge verzeichnen. In der politischen Diskussion bekommt dieser Aspekt oft die grössere Aufmerksamkeit als die positiven gesamtwirtschaftlichen Auswirkungen.
Z-8 Zusammenfassung
INFRAS/ECOPLAN
Schlussfolgerungen betreffend die Modelleigen-schaften
Aus der Analyse der empirischen Arbeiten und der systematischen Sensitivitätsanalyse mit dem berechenbaren Gleichgewichtsmodell für die Schweiz konnten interessante Er-kenntnisse bezüglich der relativen Bedeutung der exogenen Modellannahmen im Ver-gleich zur internen Struktur des gewählten Modells gewonnen werden. Wichtigstes Er-gebnis ist folgendes: Die grundsätzliche Modellstruktur beeinflusst die Ergebnisse stärker als die exogenen Modellannahmen. Beispielsweise erweisen sich die mit dem berechen-baren Gleichgewichtsmodell von ECOPLAN erzielten Simulationsergebnisse für die Schweiz als relativ robust bezüglich Änderungen der Modellannahmen, wie etwa Ände-rungen der genisteten Struktur der Produktionsfunktion oder der Substitutionselastizitäten der Produktionsfaktoren. Demgegenüber variieren die Resultate insgesamt relativ stark in Abhängigkeit des gewählten Modellansatzes - aber auch der unterstellten Policy- und Umfeldszenarien.
Die wichtigsten Erkenntnisse der Meta-Analyse
Die Meta-Analyse wurde mit zwei Zielen durchgeführt:
1. Analyse und Aufzeigen der Hauptlücken und -grenzen der formalen mathematischen Modelle,
2. Entwicklung ergänzender Argumente, um die mögliche Wirkung der Aufhebung der wichtigsten restriktiven Annahmen auf die simulierten Ergebnisse einzuschätzen.
Eine Reihe von Aspekten der heute angewendeten Modelle führen zu einer realitätsfer-nen Abbildung einer komplexen dynamischen Realität und damit zu vermutlich zu pessi-mistischen Vorhersagen über die Auswirkungen von Ökotax-Modellen. Als ausgewählte Beispiele können genannt werden:
1. Die Vernachlässigung dynamischer Effekte auf Innovationen und technischen Fort-schritt, welche durch eine Energiesteuer gefördert werden, führt zu einer Über-schätzung der Anpassungskosten und zu einer Unterschätzung der positiven wirt-schaftlichen Wirkungen.
2. Langfristwirkungen werden unterschätzt, da sie mit den konventionellen empirischen Methoden nur schwierig zu erfassen sind. Diese berücksichtigen die Kaskade von Reaktionen auf Preisänderungen, reichend von kurzfristigen Änderungen des Kon-sumverhaltens bei gegebenem Kapitalstock bis zu langfristigen Änderungen von räumlichen Siedlungs- und Produktionsstrukturen, nicht bzw. nur unvollständig.
Zusammenfassung Z-9
INFRAS/ECOPLAN
3. Technisch-/ökonomische Analysen zeigen, dass ein bedeutendes Potential an Öko-effizienzverbesserungen zu geringen oder gar negativen Nettokosten realisiert wer-den kann. Dieses Potential wird durch die gesamtwirtschaftlichen Modelle aus me-thodischen Gründen nicht berücksichtigt, was ebenfalls zu einer Überschätzung der Anpassungskosten führt.
4. Einfache und grobe quantitative Schätzungen zeigen zudem für die Schweiz, dass durch die Verlagerung der Steuer- und Abgabebelastung vom Faktor Arbeit zum Faktor Energie/Umwelt bedeutende Effizienzgewinne im Steuer- und Abgabesystem möglich sind. Die Infragestellung der Double-Dividend-Hypothese durch verschiede-ne theoretische Arbeiten wird damit empirisch widerlegt.
Schlussfolgerungen für die Politik
Aus der vergleichenden Analyse können folgende Schlussfolgerungen betreffend der Ausgestaltung der Steuer, der Einführungsmodalitäten und Mittelverwendung gezogen werden:
• Die Analyse der aktuellsten empirischen und theoretischen Studien ergibt, dass die Hypothese der doppelten Dividende in ihrer schwächeren Form4 - d.h. positive Umwelteffekte und positive Beschäftigungswirkungen - für die EU-Länder und für die Schweiz zutrifft, vor allem bei struktureller Arbeitslosigkeit und wenn die langfristigen Wirkungen der Einführung einer Energiesteuer bzw. einer ökologischen Steuerreform beachtet werden.
• Bei der Ausgestaltung der Abgabenseite muss berücksichtigt werden, dass eine kombinierte Energie-/CO2- Steuer wohl am effizientesten wirkt, da auf diese Weise ineffiziente Substitutionen zwischen fossilen und aus Umweltsicht ebenfalls pro-blematischen elektrischen Energien vermieden werden können. Die Steuer sollte unbedingt stufenweise eingeführt werden, um die Anpassungskosten von Unter-nehmen und Haushalten zu minimieren.
• Auf der Seite der Mittelverwendung ist zu beachten, dass die ökonomischen Aus-wirkungen der Steuer verbessert werden können, wenn die Einnahmen vollständig an Unternehmen und Haushalte zurückerstattet werden. Die grössten Beschäftigungs-wirkungen werden dann erzielt, wenn die Einnahmen zur Senkung der Sozialbeiträge von Arbeitnehmern und Arbeitnehmerinnen eingesetzt werden.
• Die (kurzfristigen) negativen Auswirkungen auf die internationale Wettbewerbsfähig-keit insbesondere bei energieintensiven Branchen können minimiert werden, indem
4 Die Hypothese der doppelten Dividende in ihrer stärkeren Form verlangt positive Umwelteffekte und
positive Auswirkungen auf das BSP.

Z-10 Zusammenfassung
INFRAS/ECOPLAN
Kompensationsmassnahmen eingeführt werden. Beispiele solcher Kompensations-massnahmen sind: Steuerkompensationen an der Grenze für energieintensive Güter, sektorale Rückerstattung der Steuereinnahmen oder Festlegung einer maximalen Belastung durch die Energiesteuer (Rabattsysteme). Rabattsysteme stehen aufgrund ihrer hohen politischen Akzeptanz und der vergleichweise weit fortgeschrittenen Umsetzungsarbeiten im Vordergrund.
Schlussfolgerungen für die zukünftige Modellpolitik des Bundes
Die umfangreichen vergleichenden Analysen des „state of the art“ im Bereich der Modell-analysen von Energie- und Umweltabgaben führen schliesslich zu Schlussfolgerungen für die Prioritäten der zukünftigen Modellpolitik auf Bundesebene. Diese können mit fol-genden zwei Grundsätzen zusammengefasst werden:
1. Angesichts der Bedeutung des Analyseansatzes für die Ergebnisse sollte die Modell-strategie einen hohen Grad an Diversifikation anstreben. Neben berechenbaren Gleichgewichtsmodellen sollten auch ökonometrische Makromodelle, jedoch auch einfachere transparente partialanalytische Ansätze verfolgt werden, damit das Spektrum der zu erwartenden Wirkungen voll ausgeleuchtet werden kann.
2. Besondere Beachtung sollte der verstärkten Berücksichtigung dynamischer Effekte geschenkt werden, sowohl für die Analyse der im Strukturwandel ablaufenden An-passungsprozesse als auch der realitätsnäheren Analyse der Langfristwirkungen von Ökotax-Modellen. Hierzu können auch alternative Analyseansätze wie zum Beispiel “System Dynamics“ einen konstruktiven Beitrag leisten.

INFRAS/ECOPLAN
Part I: Methodology

1. Introduction and Aim 3
INFRAS/ECOPLAN
1. Introduction and aim of the study
1.1. Aim of the study
In recent years the double-dividend-hypothesis became one of the key questions in the scientific and political discussions of strategies towards sustainable development. The hypothesis that an ecological tax reform (ETR) leads to an improvement in both environmental quality and economic performance has attracted much attention.
Today, there are a variety of sophisticated and complex simulation models available for the analysis of the impacts of fiscal policy measures (ETR, in particular) for greenhouse gas abatement - in Switzerland as well as in Europe or other OECD countries. These mathematically and algorithmically stringent models have the inherent disadvantage that they need to make very restrictive assumptions to simulate reality. This is the main rea-son for which the results on short and long term impacts of environmental-energy taxes and revenue neutral tax shifts sometimes seem to be contradictory. It is a matter of fact that up to now there have been no satisfactory explanations for such contradictions on the basis of systematic comparative analysis of the "anatomy of models".
This situation weakens the credibility of simulation models and leads to a paralysis of policy and governments - despite still new and more complex models.
On this background the present project aims to contribute to clarifying of the alleged con-tradictions in order to improve the basis for energy and environment policies targeted towards sustainable development.
1.2. Questions of interest
With regard to this background, the aim of this study is to shed more light on the following questions:
1. Which are the convergent and divergent results of the available studies on economic impacts of ETR proposals?
2. Which of these divergencies can be explained by different types of assumptions: exogenous input parameters, model exogenous policy design (= input) parameters and assumptions/restrictions inside the model architecture?
3. Which are the ouput-sensitive assumptions or parameters? Which parameters have the dominant influences on the ouptuts? The relevant outputs are given in the following list:

4 1. Introduction and Aim
INFRAS/ECOPLAN
a) National/regional GDP
b) First mover advantages
c) Levels and structures of employment and involuntary unemployment
d) Inflation
e) Economic structure
f) Energy efficiency of technologies applied
g) Energy mixes and levels used
h) Exports/Imports -> international competitiveness
i) Salary levels and earnings (profits, capital earnings)
4. Which are the comparative advantages of the different models? For which questions can a suitable analysis be expected with a specific model - which aspects are ne-glected by the model architecture?
5. Which alternative approaches could complement the model analysis in order to give a more comprehensive picture of the socio-economic impacts of ETR proposals?
6. How can the variety of the model results be synthesized to a stronger basis for policy formulation?
7. How must ETR proposals or the fiscal policy targeted to greenhouse gas abatement (GGA, resp.) be designed, so that the national economic benefits to be maximised, short term versus long term?5
a) GDP6 growth
b) Employment (quantity, quality)
c) Innovation for structural change toward sustainable development
d) Long term economic advantages in competitiveness
8. What complementary policy measures can increase these benefits and minimize risks?
a) Energy tax compensation/buffering models (border tax adjustments, tax credit schemes, exemption of energy for production processes)
b) Recycling and/or earmarking of revenues for financing of environmental R+D, impulse programmes
c) Training/retraining programmes
5 A hypothesis is that it is crucial to distinguish between short term and long term economic impacts. In
the short run structural adaptions to new factor prices are very limited.
6 This study did not address the question of other, more meaningful indicators of material welfare than the traditional GDP.
1. Introduction and Aim 5
INFRAS/ECOPLAN
Particular interest in these issues has existed in Switzerland for some time in the context of longterm national energy policy. In this context an elaborate series of prospective energy studies has been conducted over the past five years; various computable general equilibrium models (CGEM) have been developed and applied on various occasions (see chapter 9).
Since more recently, efforts are being made to simulate the impacts of two popular initia-tives aiming at steadily and significantly reducing energy consumption from conventional sources and at increasing the production of new renewable energy sources by means of a financial support programme.
Therefore, the questions addressed in this project are of acute interest to Swiss energy policy analysts.
Actor specific concerns
Experience with the dynamics of the Swiss (and European) debate shows that different actor groups articulate issues, fears and hopes of their particular concerns and interests. This profile of articulated concerns has changed over time, as certain issues were resol-ved - at least in the mainstream debate and new issues were tabled. Even though pro and contra arguments are varied, analysis reveals that at the bottom line virtually all relevant concerns articulated today have to do with the fear that first mover countries might suffer a relative loss in international competitiveness, leading to more unemployment and lower growth in GDP and incomes. On the other hand, proponents argue that the „do nothing and wait“ is the worst choice, because this inevitably would aggravate ecological and economic problems if needed structural changes are inhibited. They claim that first movers would be able to earn economic advantages in the medium and long term. To-day’s actor-orientied profile of concerns can be summarised as follows:
1. Business: The main issues are: Economic risks and chances under first mover condi-tions. Positions Partners are heterogenous. Energy intensive firms claim losses in competitiveness, even if rates of changes are low and if special compensation measu-res are foreseen. Energy extensive firms generally are not actively participating in the debate, except for a minority of progressive firms and business leaders. Major busi-ness associations generally take a conservative position. They are in favour of volun-tary agreements with no financial incentives by government. Fiscal neutrality is consi-dered a „conditio sine qua non“ almost unanimously in the business community. A mi-nority suspects that politics could water down neutrality condition in the long run eventhough it is included in the ETR concept. The double dividend hypothesis is viewed heterogenously within the business community.
2. Environmental peer groups are focussing on environmental gains. They claim that potentially negative economic effects in the first mover scenario can be alleviated with compensation measures; and they stress the potential of first mover economic advantages in the longer run. This hypothesis of the first mover advantages relates

6 1. Introduction and Aim
INFRAS/ECOPLAN
to the issue of technological innovation and to restructuring of the economy for im-proving simultanously economic and ecological efficiency. This is the claim of the win-win strategy, or double dividend. There remain heterogenous views in these actor groups with respect to the question of earmaking parts of the tax revenues during a number of years for environmental impulse programmes.
3. Consumer organizations are concerned with impacts on inflation and the cost of living, and with negative distributional impacts on low income groups such as old age people, large families with low incomes etc.
4. Rural regions and certain cantons are concerned mainly with negative distributional effects on rural regions due to higher fuel prices in transportation and impacts on energy intensive firms claiming loss in competitiveness. Tourism as a special case of the export industry plays a role here.
5. Labour unions naturally are concerned with the issues of (un-) employment and GDP effects, and with distributional aspects. There does not seem to be a homoge-nous position on whether short term negative impacts or longer term first mover ad-vantages are more important and certain.
6. Certain fiscal specialists still articulated the problem of combining fiscal, economic and environmental policy with one set of instrumentations. They retain the claim that an incentive tax cannot be used to finance part of the state budget, because an in-centive tax has the objective of eliminating/reducing the taxed object, and thus en-dangering the stability of revenues. The same issue is of interest for the correspond-ing branches of government: The ministries of finance, economics and of environ-ment.
2. Methodology 7
INFRAS/ECOPLAN
2. Methodology
Two methodological approaches are applied:
- parametric-analysis
- meta analysis
The parametric-analysis first consists of a survey of recent important studies applying theoretical and simulation models for the evaluation of the economic impacts of ETR pro-posals on the one hand. Secondly a case study with a computable general equilibrium model for Switzerland with a systematic sensitivity analysis is carried out.
The meta analysis exploits supplementary approaches applied in the context of the analy-sis of ETR impacts in order to achieve a more solid interpretation of the conventional model results, and to bring more insight with regard to aspects neglected in conventional models so far. The most important aspects relate to the relevance of dynamic aspects such as innovation induced by the introduction of an ETR.
2.1. Parametric analysis
The survey of important studies on the economic short and long term impacts of ETR tries to elaborate the output-sensitive parameters by differentiating three categories:
1. Model exogenous assumptions: These are exogenous assumptions on the character of the economy(ies) investi-gated, the reference development of main economic variables, a.s.o. We identify the following parameters to be relevant:
a) Existing level of (voluntary/involuntary) unemployment and its structure (skilled vs. unskilled, traditional vs. modern skills, a.s.o.), behaviour of trade unions, existence of wage rigidities
b) Existing structure of the economy (I-O-coefficients)
c) Level and structure of international trade relations
d) Reference development assumed (GDP, population, energy consumption, a.s.o.)
e) Long term energy price scenarios in other countries
f) Extension7 of first mover scenario -> other countries (foreign trade) which join the first mover -> Second mover delay time
7 This could also be part of the policy design variable set.

8 2. Methodology
INFRAS/ECOPLAN
2. Model endogenous response assumptions:8 Usually the models applied appears as black box to the user of the model outputs. Sometimes this appears not only to politicians but also to professionals outside the inner circle of the model design team of specialists.This is problematic because there are a number of model endogenous assumptions which are output-sensitive, too. An aim of this study is to shed light on the interior of this black box and to elaborate the most important model endogenous assumptions and their specific relevance for the model outputs. This part of the analysis should allow to answer one of the key questions which is: Where are the limitations of the model analysis? Which questions are the models really able to answer usefully? Important model endogenous assump-tions are:
a) Number and type of unemployment layers considered
b) Treatment of dynamic aspects/transitional phenomena
c) Elasticities: - substitution elasticities capital-labour-energy (complementarity, substitutability) - elasticity of labour-supply - elasticities of energy demand, other goods, a.s.o.
d) Integration of voluntary/involuntary unemployment and wage rigidities in the model
e) Degree of intersectoral and international mobility of capital
3. Policy design assumptions: In this group the assumptions characterising the ETR policy are considered. These assumptions are of special interest because they are to be optimised. We focus on the following assumptions:
a) Levels and rate of increase of energy tax; structure of energy tax for different energy modes
b) Degree and structure of revenue recycling
c) Degree of recycling vs. earmarked spending
d) Structure of innovative programmes with earmarked funds
e) Strategies/measures to offset negative effects on competitiveness in first mover scenarios
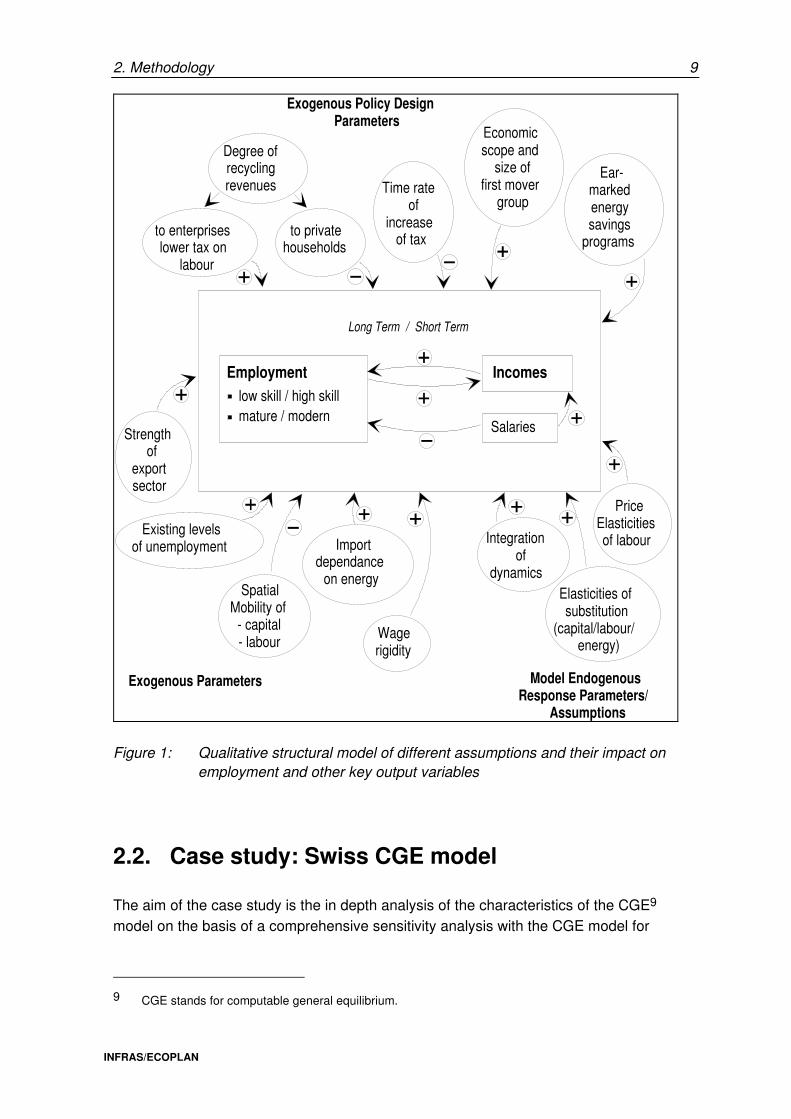
Figure 1 shows the impact of the relevant assumptions and structural model features on the key output variables.
8 Anatomy or architecture of the model
2. Methodology 9
INFRAS/ECOPLAN
Long Term / Short Term
Salaries
Employment
low skill / high skillmature / modern
Incomes
Degree ofrecyclingrevenues
to enterpriseslower tax on
labour
to privatehouseholds
Time rateof
increaseof tax
Economicscope and
size of first mover
group
Ear-markedenergysavings
programs
Strengthof
exportsector
Existing levelsof unemployment Import
dependance on energy
Exogenous Policy DesignParameters
Exogenous Parameters Model EndogenousResponse Parameters/
Assumptions
Integrationof
dynamicsSpatial
Mobility of- capital- labour
Wagerigidity
Elasticities ofsubstitution
(capital/labour/energy)
PriceElasticitiesof labour
Figure 1: Qualitative structural model of different assumptions and their impact on employment and other key output variables
2.2. Case study: Swiss CGE model
The aim of the case study is the in depth analysis of the characteristics of the CGE9 model on the basis of a comprehensive sensitivity analysis with the CGE model for
9 CGE stands for computable general equilibrium.
10 2. Methodology
INFRAS/ECOPLAN
Switzerland. The sensitivity analysis is done for two scenarios. These are the introduction of:
1. a CO2 tax
2. an energy tax
Both scenarios will be described in detail in section 5.3.
Through systematic variation of the three kinds of parameters - model endogenous, mo-del exogenous and policy design parameters - it will be possible to distinguish between more and less output sensitive parameters and to complement the picture of the survey analysis. The results of the simulations are shown in sections 5.5 to 5.7.
The model used for the case study is a CGE model for Switzerland for the year 1990. This model is a revised and extended version of a model that was developed for the Swiss Department of Energy.10 New data is implemented and, as the focus of this project is, among other things, on the impact of an ecological tax reform on employment. The labour market is extended by introducing unemployment and a differentiation between high and low skilled workers.
The main reasons for choosing a CGE model are:11
• Today CGE models are commonly approbed and most readily accessible adequate tools to assess the impacts of policy measures. A CGE model can function as a unifying framework to compare different policy proposals. They are powerful in the simulation of intersectoral economic interactions.
• The underlying theory of general equilibrium provides a methodologically consistent framework to analyse the allocational and distributional effects of policy measures on the base of plausible (microeconomic) behavioural assumptions and transparent mechanisms. The mutual links between all markets are captured through the interde-pendence of relative prices which drive the direct and indirect effects (inc. feedbacks) of policy measures.
• Model exercises are reproducible and the sensitivity of conclusions to crucial parameters can be assessed.
Section 5.2 outlines the basic model structure and the important underlying data.12
10 ECOPLAN (1995), Wirtschaftliche Auswirkungen und Verteilungseffekte verschiedener CO2-/Energie-
abgabe-Szenarien.
11 cf. also Gelauff G.M.M. und Graafland J.J. ( 1991 ), Analyzing taxation and labour market with an AGE model for the Netherlands.
12 A more detailed description can be found in: ECOPLAN (1995), Wirtschaftliche Auswirkungen und Verteilungseffekte verschiedener CO2-/Energieabgabe-Szenarien or in: Felder S. and van Nieuwkoop R. (1995), Revenue Recycling of a CO2 Tax: Results from a General Equilibrium Model for Switzerland.
2. Methodology 11
INFRAS/ECOPLAN
2.3. Meta analysis
The meta analysis approach is based on the following idea:
Economic simulation models are formulated in a mathematically and algorithmicly strict form. With respect to feasibility, such models are bound to focus on the most important aspects and to abstract from (seemingly?) less important ones. Therefore they are only able to give a rough and aggregate picture of a differentiated and complex reality. For example, the models are able to deal with 30 to 40 industrial sectors in a coherent fra-mework, but, e.g. the integration of the effects of sector-specific offsetting strategies in order to offset potential negative effects on international trade is very difficult, or even impossible. On the other hand, there are qualitative or partially quantified models which are able to focus on a specific point of the analysis: E.g. most probably it is more ade-quate to analyse the effects of the above mentioned offsetting strategies by simple mo-dels which are taking into account the cost structure of the different industries and the financial effects of the offsetting strategies. An other example would be the assessment of technology diffusion by simple means of return on investment calculation and reasonable assumption of the economic framework. The advantages of this kind of models is that they can be tailored exactly according to a specific issue. The main disadvantage of these partially quantified models is their lack of quantification and the often necessary "ceteris paribus" assumption, which implies that the analysed aspect can be isolated from the "rest of the world". Usually therefore, we are confronted with a lack of coherent connection between the different sectors and agents of the economy when we apply this kind of analytical approach.
The meta analysis therefore distinguishes between three types of models:
- Mathematically strictly fomulated (computer) simulation models
- Partially quantified models
- Analysis based on qualitative, causal relationship argumentations.
The meta analysis tries to combine the three approaches in an optimal setting, and to produce as much synergetic effects as possible.
Three methodological steps are therefore foreseen :
1. The first step consists of identifying the gaps and short comings (blind spots) in the mathematical simulation models available, and in assessing the severeness of their implications at the level of results. This includes
- Assessment of the structure of input variables the models can digest (including values of such input assumptions)

12 2. Methodology
INFRAS/ECOPLAN
- Assessment of model internal architectural assumptions/restrictions, such as substitution elasticities and architecture of production functions.
2. The second step consists of identifying or developing suitable approaches to
- Either assess the signs and magnitudes of corrections in the model outputs which one has to expect from the inclusion of omitted or inade-quately modelled parameters or phenomena, e.g. the dynamic effects of technological (and other) innovation as a response to regulation
- Or develop logical/qualitative causal argumentation to marshal evidence for the modifications needed in the model outputs
- Or apply formalized partial models which simulate the neglected or un-realistically simulated effects.
3. The third step consists of a synthesis of the whole fabric of a main model and amendments/additions by mean of causal argumentation and/or supplementary par-tial models.
Last - and not least - this meta-analytical process can become an efficient and con-sciously applied tool for the further development and improvement of formal mathe-matical/numerical models, to become a more powerful tool-kit with several different tools (not only a hammer, but also wrenches, screwdrivers etc.), applicable not only for the simulation of the specific type of regulation such as energy taxes, but to a mix of eco-nomic incentives (taxes and programmespecific technology adoption subsidies), com-mand and control and awareness rising information programmes.
3. Typology of Models 13
INFRAS/ECOPLAN
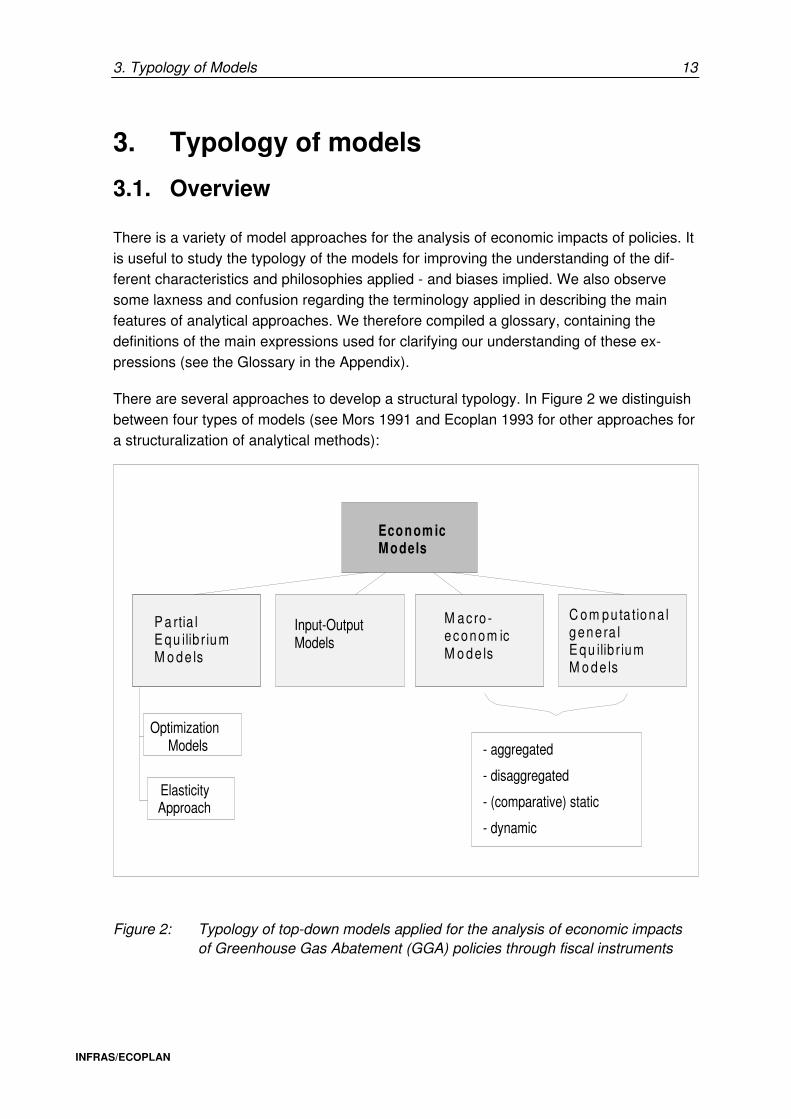
3. Typology of models
3.1. Overview
There is a variety of model approaches for the analysis of economic impacts of policies. It is useful to study the typology of the models for improving the understanding of the dif-ferent characteristics and philosophies applied - and biases implied. We also observe some laxness and confusion regarding the terminology applied in describing the main features of analytical approaches. We therefore compiled a glossary, containing the definitions of the main expressions used for clarifying our understanding of these ex-pressions (see the Glossary in the Appendix).
There are several approaches to develop a structural typology. In Figure 2 we distinguish between four types of models (see Mors 1991 and Ecoplan 1993 for other approaches for a structuralization of analytical methods):
Econom icM odels
M acro -econom icM o de ls
C om pu ta tiona lgene ra lE qu ilib r iumM o de ls
ElasticityApproach
OptimizationModels
P a rtia lE qu ilib r iumM o de ls
Input-OutputModels
- aggregated
- disaggregated
- (comparative) static
- dynamic
Figure 2: Typology of top-down models applied for the analysis of economic impacts of Greenhouse Gas Abatement (GGA) policies through fiscal instruments
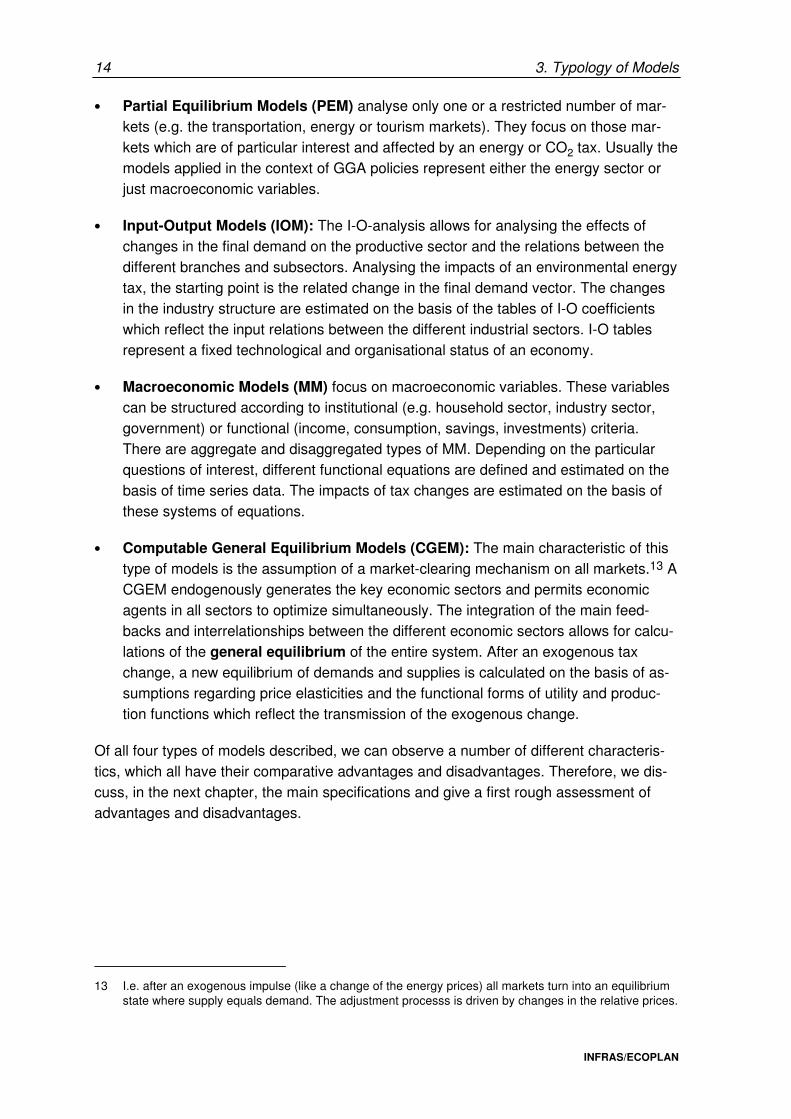
14 3. Typology of Models
INFRAS/ECOPLAN
• Partial Equilibrium Models (PEM) analyse only one or a restricted number of mar-kets (e.g. the transportation, energy or tourism markets). They focus on those mar-kets which are of particular interest and affected by an energy or CO2 tax. Usually the models applied in the context of GGA policies represent either the energy sector or just macroeconomic variables.
• Input-Output Models (IOM): The I-O-analysis allows for analysing the effects of changes in the final demand on the productive sector and the relations between the different branches and subsectors. Analysing the impacts of an environmental energy tax, the starting point is the related change in the final demand vector. The changes in the industry structure are estimated on the basis of the tables of I-O coefficients which reflect the input relations between the different industrial sectors. I-O tables represent a fixed technological and organisational status of an economy.
• Macroeconomic Models (MM) focus on macroeconomic variables. These variables can be structured according to institutional (e.g. household sector, industry sector, government) or functional (income, consumption, savings, investments) criteria. There are aggregate and disaggregated types of MM. Depending on the particular questions of interest, different functional equations are defined and estimated on the basis of time series data. The impacts of tax changes are estimated on the basis of these systems of equations.
• Computable General Equilibrium Models (CGEM): The main characteristic of this type of models is the assumption of a market-clearing mechanism on all markets.13 A CGEM endogenously generates the key economic sectors and permits economic agents in all sectors to optimize simultaneously. The integration of the main feed-backs and interrelationships between the different economic sectors allows for calcu-lations of the general equilibrium of the entire system. After an exogenous tax change, a new equilibrium of demands and supplies is calculated on the basis of as-sumptions regarding price elasticities and the functional forms of utility and produc-tion functions which reflect the transmission of the exogenous change.
Of all four types of models described, we can observe a number of different characteris-tics, which all have their comparative advantages and disadvantages. Therefore, we dis-cuss, in the next chapter, the main specifications and give a first rough assessment of advantages and disadvantages.
13 I.e. after an exogenous impulse (like a change of the energy prices) all markets turn into an equilibrium
state where supply equals demand. The adjustment processs is driven by changes in the relative prices.
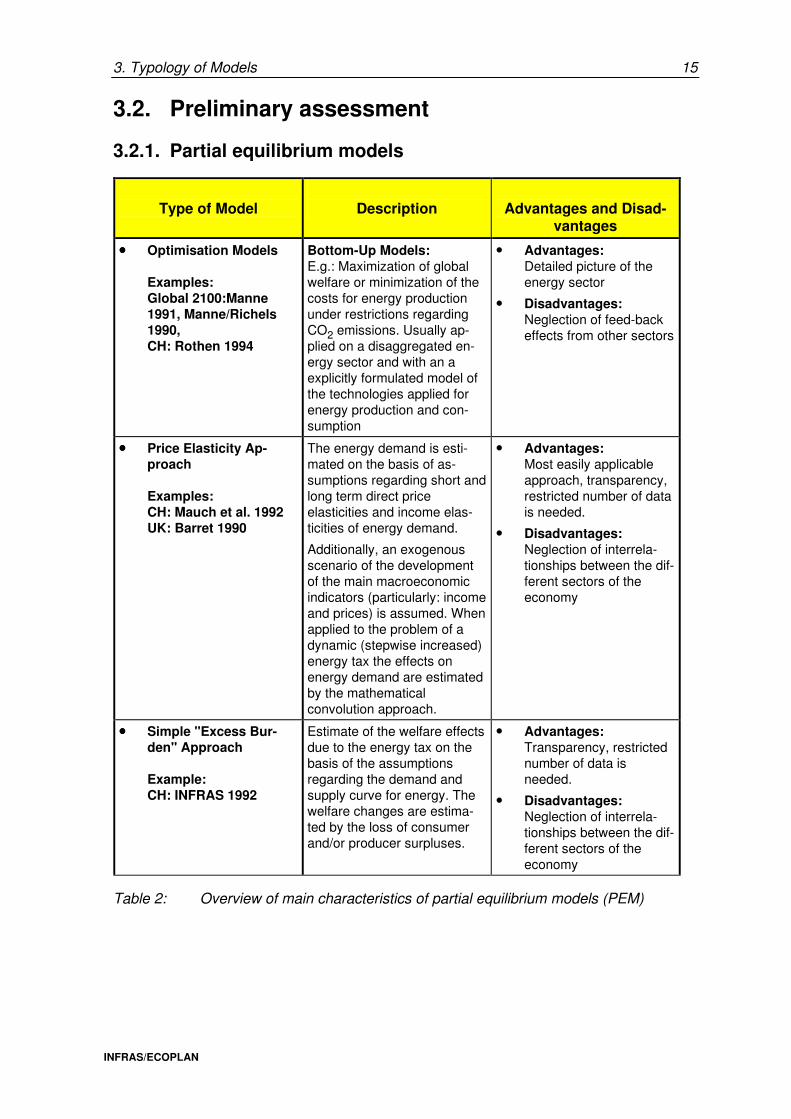
3. Typology of Models 15
INFRAS/ECOPLAN
3.2. Preliminary assessment
3.2.1. Partial equilibrium models
Type of Model
Description
Advantages and Disad-
vantages
•••• Optimisation Models Examples: Global 2100:Manne 1991, Manne/Richels 1990, CH: Rothen 1994
Bottom-Up Models: E.g.: Maximization of global welfare or minimization of the costs for energy production under restrictions regarding CO2 emissions. Usually ap-plied on a disaggregated en-ergy sector and with an a explicitly formulated model of the technologies applied for energy production and con-sumption
• Advantages: Detailed picture of the energy sector
• Disadvantages: Neglection of feed-back effects from other sectors
•••• Price Elasticity Ap-proach Examples: CH: Mauch et al. 1992 UK: Barret 1990
The energy demand is esti-mated on the basis of as-sumptions regarding short and long term direct price elasticities and income elas-ticities of energy demand.
Additionally, an exogenous scenario of the development of the main macroeconomic indicators (particularly: income and prices) is assumed. When applied to the problem of a dynamic (stepwise increased) energy tax the effects on energy demand are estimated by the mathematical convolution approach.
• Advantages: Most easily applicable approach, transparency, restricted number of data is needed.
• Disadvantages: Neglection of interrela-tionships between the dif-ferent sectors of the economy
•••• Simple "Excess Bur-den" Approach Example: CH: INFRAS 1992
Estimate of the welfare effects due to the energy tax on the basis of the assumptions regarding the demand and supply curve for energy. The welfare changes are estima-ted by the loss of consumer and/or producer surpluses.
• Advantages: Transparency, restricted number of data is needed.
• Disadvantages: Neglection of interrela-tionships between the dif-ferent sectors of the economy
Table 2: Overview of main characteristics of partial equilibrium models (PEM)

16 3. Typology of Models
INFRAS/ECOPLAN
3.2.2. Input-Output Models
Type of Model
Description
Advantages and Disad-
vantages
•••• Input-Output Analysis: Examples: D: DIW 1994 CH: PROGNOS 1993 A: WIFO 1995
The development of final de-mand is an exogenous assumption (as in the case of the Elasticity Approach). Sectoral Effects of changes in the final demand are estima-ted on the basis of I-O-tables which show the interrelation-ship of the different economic sectors with regard to the in-puts used (e.g.: I-O- coeffi-cients for 30 to 40 industries).
This structure is assumed to be constant for the time hori-zon of the analysis (constant Input-coefficients and con-stant elasticities of substitu-tion).
The IOM show how a given change of the final demand affects the demand for input factors as capital, labour and energy.
• Advantages: I-O-tables are available in most countries, therefore, marginal costs of an analysis with IOM are relatively low, too.
• Disadvantages: The assumption of con-stant Input-coefficients is rather unrealistic. Fur-thermore the exogenous- ly given final demand and the neglection of feed-back effects between demand and supply-side are also strong simplifi-cations.
IOM therefore are ade-quate for analysis with a restricted time horizon (short to mid term)
Table 3: Overview of main characteristics of Input-Output Models (IOM)
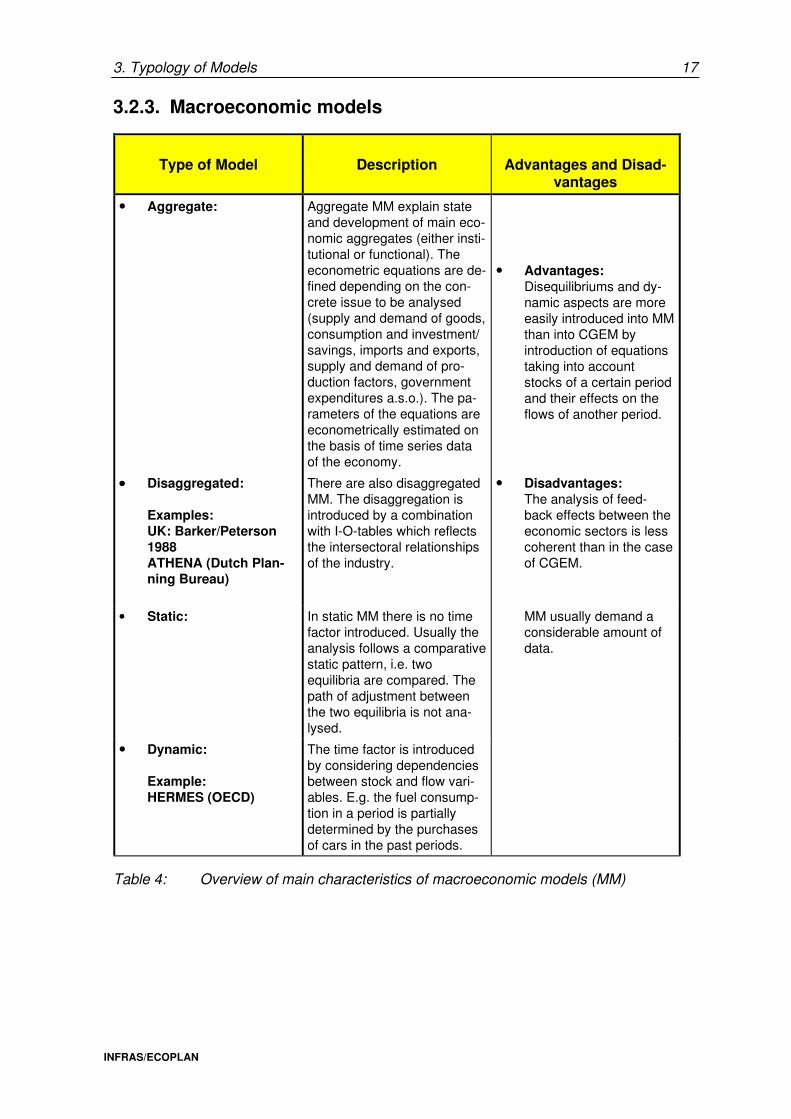
3. Typology of Models 17
INFRAS/ECOPLAN
3.2.3. Macroeconomic models
Type of Model
Description
Advantages and Disad-
vantages
• Aggregate:
Aggregate MM explain state and development of main eco-nomic aggregates (either insti-tutional or functional). The econometric equations are de-fined depending on the con-crete issue to be analysed (supply and demand of goods, consumption and investment/ savings, imports and exports, supply and demand of pro-duction factors, government expenditures a.s.o.). The pa-rameters of the equations are econometrically estimated on the basis of time series data of the economy.
• Advantages: Disequilibriums and dy-namic aspects are more easily introduced into MM than into CGEM by introduction of equations taking into account stocks of a certain period and their effects on the flows of another period.
•••• Disaggregated: Examples: UK: Barker/Peterson 1988 ATHENA (Dutch Plan-ning Bureau)
There are also disaggregated MM. The disaggregation is introduced by a combination with I-O-tables which reflects the intersectoral relationships of the industry.
• Disadvantages: The analysis of feed-back effects between the economic sectors is less coherent than in the case of CGEM.
• Static: In static MM there is no time factor introduced. Usually the analysis follows a comparative static pattern, i.e. two equilibria are compared. The path of adjustment between the two equilibria is not ana-lysed.
MM usually demand a considerable amount of data.
• Dynamic: Example: HERMES (OECD)
The time factor is introduced by considering dependencies between stock and flow vari-ables. E.g. the fuel consump-tion in a period is partially determined by the purchases of cars in the past periods.
Table 4: Overview of main characteristics of macroeconomic models (MM)
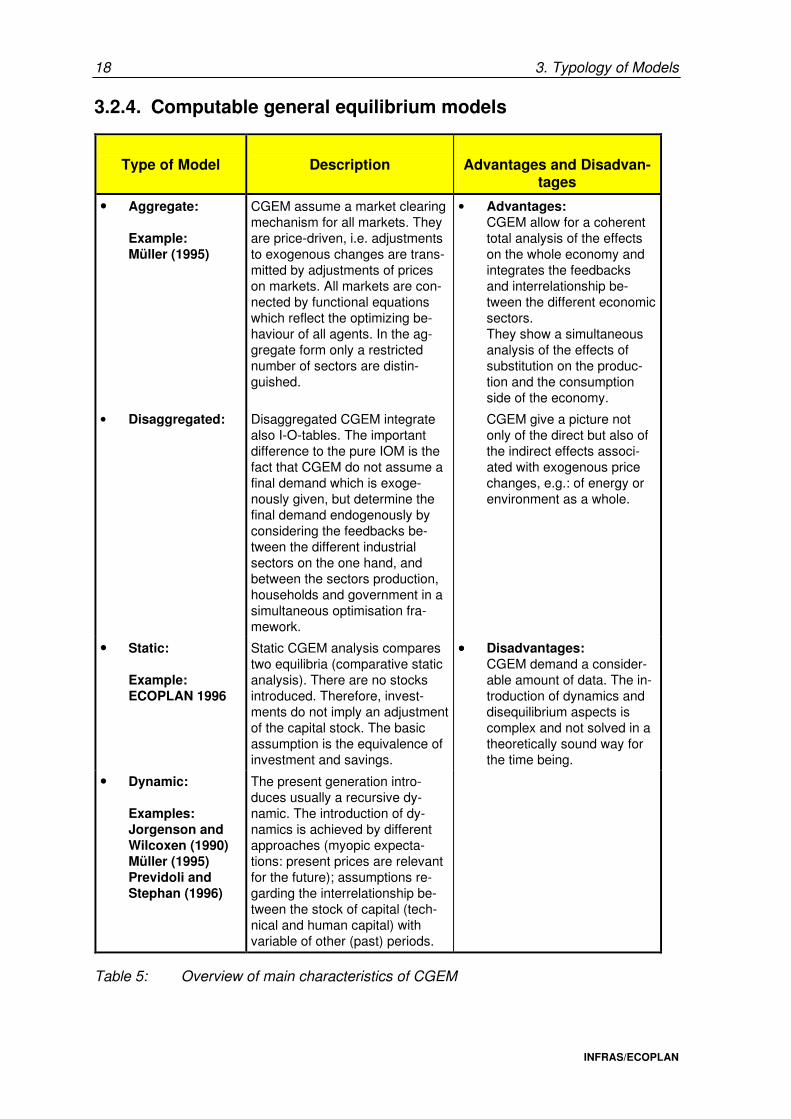
18 3. Typology of Models
INFRAS/ECOPLAN
3.2.4. Computable general equilibrium models
Type of Model
Description
Advantages and Disadvan-
tages
• Aggregate: Example: Müller (1995)
CGEM assume a market clearing mechanism for all markets. They are price-driven, i.e. adjustments to exogenous changes are trans-mitted by adjustments of prices on markets. All markets are con-nected by functional equations which reflect the optimizing be-haviour of all agents. In the ag-gregate form only a restricted number of sectors are distin-guished.
• Advantages: CGEM allow for a coherent total analysis of the effects on the whole economy and integrates the feedbacks and interrelationship be-tween the different economic sectors. They show a simultaneous analysis of the effects of substitution on the produc-tion and the consumption side of the economy.
• Disaggregated: Disaggregated CGEM integrate also I-O-tables. The important difference to the pure IOM is the fact that CGEM do not assume a final demand which is exoge- nously given, but determine the final demand endogenously by considering the feedbacks be-tween the different industrial sectors on the one hand, and between the sectors production, households and government in a simultaneous optimisation fra-mework.
CGEM give a picture not only of the direct but also of the indirect effects associ-ated with exogenous price changes, e.g.: of energy or environment as a whole.
• Static: Example: ECOPLAN 1996
Static CGEM analysis compares two equilibria (comparative static analysis). There are no stocks introduced. Therefore, invest-ments do not imply an adjustment of the capital stock. The basic assumption is the equivalence of investment and savings.
•••• Disadvantages: CGEM demand a consider-able amount of data. The in-troduction of dynamics and disequilibrium aspects is complex and not solved in a theoretically sound way for the time being.
• Dynamic: Examples: Jorgenson and Wilcoxen (1990) Müller (1995) Previdoli and Stephan (1996)
The present generation intro-duces usually a recursive dy-namic. The introduction of dy-namics is achieved by different approaches (myopic expecta-tions: present prices are relevant for the future); assumptions re-garding the interrelationship be-tween the stock of capital (tech-nical and human capital) with variable of other (past) periods.
Table 5: Overview of main characteristics of CGEM
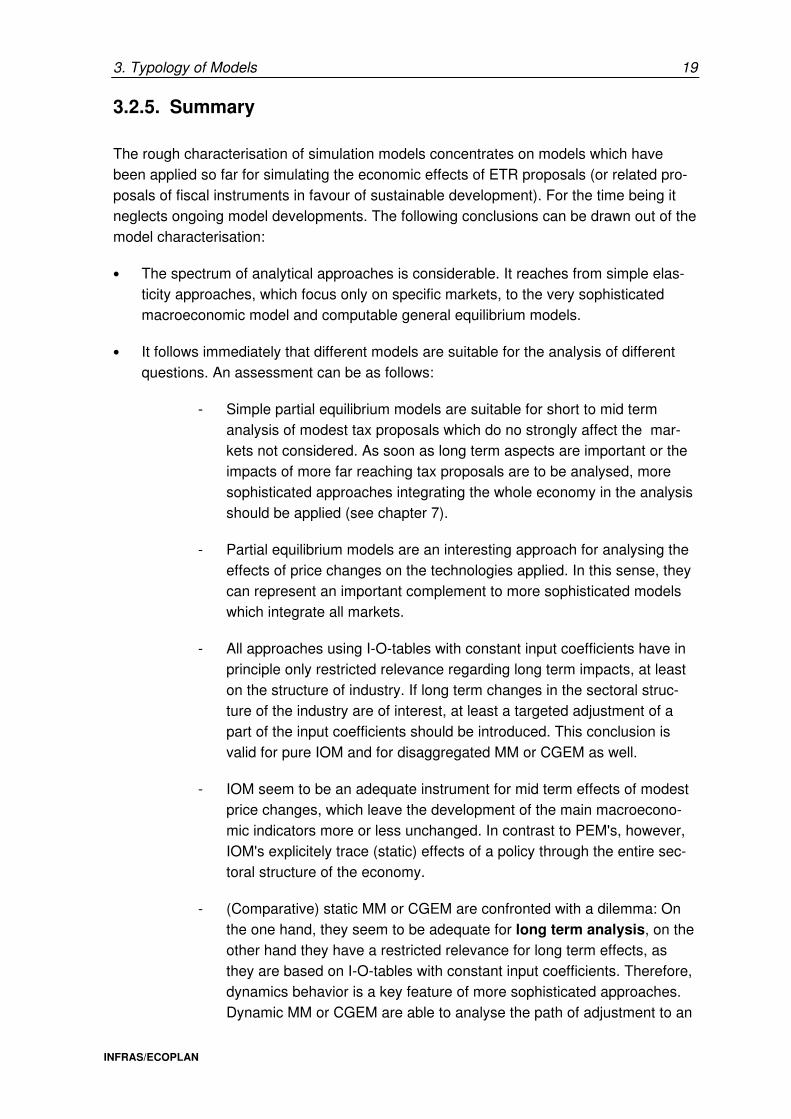
3. Typology of Models 19
INFRAS/ECOPLAN
3.2.5. Summary
The rough characterisation of simulation models concentrates on models which have been applied so far for simulating the economic effects of ETR proposals (or related pro-posals of fiscal instruments in favour of sustainable development). For the time being it neglects ongoing model developments. The following conclusions can be drawn out of the model characterisation:
• The spectrum of analytical approaches is considerable. It reaches from simple elas-ticity approaches, which focus only on specific markets, to the very sophisticated macroeconomic model and computable general equilibrium models.
• It follows immediately that different models are suitable for the analysis of different questions. An assessment can be as follows:
- Simple partial equilibrium models are suitable for short to mid term analysis of modest tax proposals which do no strongly affect the mar-kets not considered. As soon as long term aspects are important or the impacts of more far reaching tax proposals are to be analysed, more sophisticated approaches integrating the whole economy in the analysis should be applied (see chapter 7).
- Partial equilibrium models are an interesting approach for analysing the effects of price changes on the technologies applied. In this sense, they can represent an important complement to more sophisticated models which integrate all markets.
- All approaches using I-O-tables with constant input coefficients have in principle only restricted relevance regarding long term impacts, at least on the structure of industry. If long term changes in the sectoral struc-ture of the industry are of interest, at least a targeted adjustment of a part of the input coefficients should be introduced. This conclusion is valid for pure IOM and for disaggregated MM or CGEM as well.
- IOM seem to be an adequate instrument for mid term effects of modest price changes, which leave the development of the main macroecono-mic indicators more or less unchanged. In contrast to PEM's, however, IOM's explicitely trace (static) effects of a policy through the entire sec-toral structure of the economy.
- (Comparative) static MM or CGEM are confronted with a dilemma: On the one hand, they seem to be adequate for long term analysis, on the other hand they have a restricted relevance for long term effects, as they are based on I-O-tables with constant input coefficients. Therefore, dynamics behavior is a key feature of more sophisticated approaches. Dynamic MM or CGEM are able to analyse the path of adjustment to an

20 3. Typology of Models
INFRAS/ECOPLAN
exogenous price impulse, which can overcome the above mentioned dilemma. For the time being, this seems to be easier for MM than for CGEM, mainly due to reasons of computational ease or complexity.
• All in all, the typological analysis of the models applied shows that the state of the art with regard to model engineering is rather advanced. However, we observe a syste-matic inbalance or bias in the direction of this advancement: Development is highly advanced and sophisticated regarding the modelling of intersectoral interdependen-cies of disaggregated markets - in their state of equilibrium. On the other hand, there is a conspicious gap in the modelling of dynamic and transitional phenomena of structural change - technologically and economically. As innovation and technical progress - accelerated by the globalisation of markets and by changing relative prices - play a major role in the concept of ETR this situation is unsatisfactory from the policy oriented point of view. The approaches towards focussing more carefully on these phenomena are, therefore, in the center of interest of both: the survey analysis and the case study with the CGEM.

INFRAS/ECOPLAN
Part II: Parametric Analysis

4. Review of Theoretical and Empirical Studies 23
INFRAS/ECOPLAN
4. Review of theoretical and empirical studies
The comparative analysis of important theoretical and empirical studies aims at tracing out how assumptions and typologies of models coin the theoretical and empirical results. We distinguish three kinds of assumptions:
− Model exogenous assumptions: features of the labour market (involuntary unem-ployment, wage rigidities), international trade, etc.
− Exogenous policy design assumptions: features of the levy side (such as tax level or speed of introduction), the recycling of the revenues (reduction of social security contributions, of income tax, etc.)
− Model endogenous response assumptions (model "architecture"): considerations of dynamic aspects, nesting of the factors of production (substitution between energy, labour and capital).
The analysis will focus on those models that are most frequently used for empirical analysis of the economic impact of environmental taxes. Therefore the empirical analysis concentrates on general equilibrium, macroeconomic and input-output-models. Partial equilibrium models are in fact not suitable for an analysis which focuses on the impact upon several economic indicators; but they are very useful if only one sector has to be modelled (for example a case study for one sector).
4.1. Theoretical studies
A number of important theoretical and empirical studies were presented at the interna-tional workshop on "Environmental Taxation, Revenue Recycling and Unemployment" in December 1994 at Milano14 (see the corresponding list of papers and speakers). The contributions of Bovenberg (1994), Bovenberg/van der Ploeg (1994), Carraro/ Sou-beyran (1994) and Goulder (1994) turned out to be the most relevant theoretical analy-ses in the context of the question at stake.
Bovenberg/van der Ploeg focus on the effects of structural unemployment (due to a rigid and „too high“ wage) and of international mobility of capital on the double dividend. Both authors identify tax shifting (shift of the tax burden away from the production factor work towards those outside the labour market) and tax level effects (increase in the overall tax burden) as the main elements which determine the employment effect of an environ-mental tax reform. The tax burden of a tax on energy must be compared to the expected abatement costs (in order to achieve a higher environmental quality), the beneficial ef- 14 Organised by the "Fondazione ENI Enrico Mattei", Milano.

24 4. Review of Theoretical and Empirical Studies
INFRAS/ECOPLAN
fects on productivity due to a higher environmental quality and the efficiency gains of making the tax system more efficient (in comparison with the initial system). Furthermore, the assumption with regard to the international mobility of capital determines the magni-tude of a shift of the burden of taxation from labour to capital.
The study of Bovenberg puts the emphasis on the tax level and on tax shifting effects as well. The tax shifting effect leads to a redistribution of income between labour and non-labour incomes. This effect is important if unemployed people are expected to earn a substantial income in the informal sector. The income from the informal sector is not af-fected by a reduction in labour taxes and, in addition, it must bear an increase in energy prices (therefore real income earned in the informal sector decreases). With the intro-duction of an environmental tax reform, the position outside the labour market will beco-me less attractive. Unemployed people have an incentive to return to the formal labour market. As a consequence, unemployment will be reduced. The authors point out that a double dividend can be achieved without lowering after-tax incomes only if initial tax rates on labour and the wage elasticity of labour demand are high. In any case, the overall effect on employment depends on the balance between tax shifting and tax level effect. Employment will be reduced if the tax level effect is greater than the tax shifting effect. This is the case if: - incomes from the informal sector are small - the initial energy tax is large - price elasticity of energy demand is large.
Under these assumptions, the cost of a clean environment are high and are shifted to the employed persons. This leads to higher wage costs and consequently to decreasing em-ployment. If the tax shifting effect is higher than the tax level effect, the costs of a cleaner environment are borne by those outside the labour market, increasing the incentive for unemployed people to get a job in the formal sector. A crucial assumption is that unem-ployment is due to search frictions in the labour market. This leads to a rent on realised jobs. The wage is therefore higher than the productivity of labour. A reduction in labour taxes reduces the gap between the wage level and the labour productivity.
The study of Carraro and Soubeyran focuses on the effects of a tax reform on the sub-stitution of demand effects (consumption shift from dirty to clean products). The authors assume fixed prices and also fixed wages (markets are cleared through quantity adjust-ments). The impact on employment depends primarly on the assumptions in the initial situation: if we face an optimal tax system15, the introduction of an energy tax will create an excess burden (loss in consumers’ and producers’ surpluses). As a consequence, unemployment will rise. Hence, in an optimal taxation framework, the (static) model implies a trade-off between environmental protection and employment. On the other hand, if the initial tax system is suboptimal16, the introduction of optimal taxation leads to 15 In an optimal tax system framework, a given tax revenue is achieved by minimising the excess burden
(the loss in consumers’ and producers’ surpluses).
16 The overall tax burden is higher than optimal. That means, the same tax revenue could be achieved with lower social costs (lower excess burden). On the other side, the energy tax is lower than optimal
4. Review of Theoretical and Empirical Studies 25
INFRAS/ECOPLAN
an increase in employment. Carraro/Soubeyran conclude that the welfare improving features of the tax reform depend more on the initial distortions in the tax system than on the recycling of the tax revenue.
The analysis of Goulder of the effects of an environmental tax reform distinguishes three forms of double dividend: The weak, the intermediate and the strong form. The weak double dividend states that revenue recycling through cuts in distortionary taxes leads to a welfare increase in comparison to a situation with recycling through lump sum pay-ments. The validity of this sort of double dividend is supported by theoretical analysis and by numerical simulations. On the other hand, the strong form of double dividend states that the introduction of an environmental tax involves no gross costs. Costs are defined as the monetary equivalent of the changes in individual welfare due to the environmental tax and do not include the welfare effects related to changes in environmental quality. The intermediate form is less stringent, as it only states that „it is possible to find a distortionary tax such that the re-venue-neutral substitution of the environment tax for this tax involves a zero or negative gross cost“. For the analysis of the strong form of double dividend, Goulder defines two sorts of ef-fects: The revenue recycling effect and the tax interaction effect. The revenue recycling effect offsets (at least partly) the distortionary effects of the pre-existing tax. The tax inter-action effect considers the tax base erosion, which limits the extent to which labour taxes can be reduced. This second effect leads to an increase of the overall costs of the envi-ronmental tax. If the strong double dividend holds, the environmental tax produces posi-tive welfare effects, even without considering the positive effects on environmental quality. In this case the estimation of environmental benefits of a tax reform would be superfluous.
The main results of the studies are presented in Table 6:
which means that the energy tax is smaller than the external costs associated with the energy consumption.
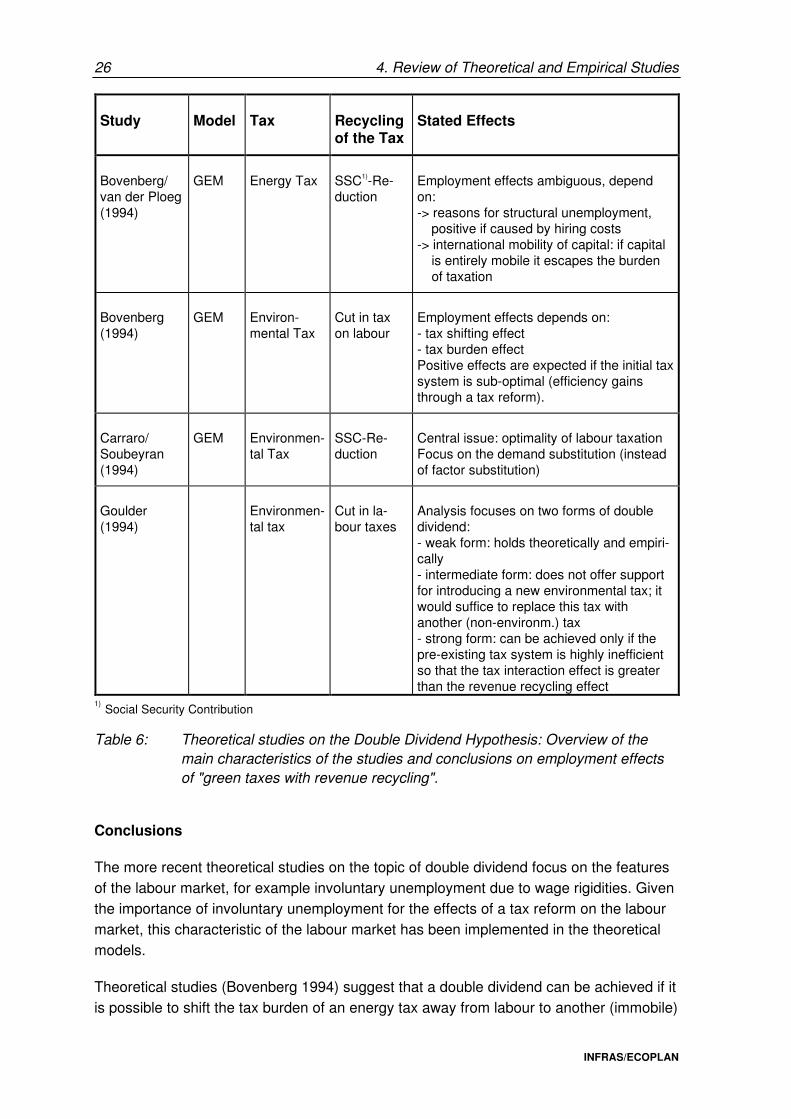
26 4. Review of Theoretical and Empirical Studies
INFRAS/ECOPLAN
Study Model Tax Recycling of the Tax
Stated Effects
Bovenberg/ van der Ploeg (1994)
GEM Energy Tax SSC1)-Re-duction
Employment effects ambiguous, depend on: -> reasons for structural unemployment,
positive if caused by hiring costs -> international mobility of capital: if capital
is entirely mobile it escapes the burden of taxation
Bovenberg (1994)
GEM Environ-mental Tax
Cut in tax on labour
Employment effects depends on: - tax shifting effect - tax burden effect Positive effects are expected if the initial tax system is sub-optimal (efficiency gains through a tax reform).
Carraro/ Soubeyran (1994)
GEM Environmen-tal Tax
SSC-Re-duction
Central issue: optimality of labour taxation Focus on the demand substitution (instead of factor substitution)
Goulder (1994)
Environmen-tal tax
Cut in la-bour taxes
Analysis focuses on two forms of double dividend: - weak form: holds theoretically and empiri-cally - intermediate form: does not offer support for introducing a new environmental tax; it would suffice to replace this tax with another (non-environm.) tax - strong form: can be achieved only if the pre-existing tax system is highly inefficient so that the tax interaction effect is greater than the revenue recycling effect
1) Social Security Contribution
Table 6: Theoretical studies on the Double Dividend Hypothesis: Overview of the main characteristics of the studies and conclusions on employment effects of "green taxes with revenue recycling".
Conclusions
The more recent theoretical studies on the topic of double dividend focus on the features of the labour market, for example involuntary unemployment due to wage rigidities. Given the importance of involuntary unemployment for the effects of a tax reform on the labour market, this characteristic of the labour market has been implemented in the theoretical models.
Theoretical studies (Bovenberg 1994) suggest that a double dividend can be achieved if it is possible to shift the tax burden of an energy tax away from labour to another (immobile)
4. Review of Theoretical and Empirical Studies 27
INFRAS/ECOPLAN
production factor (capital). According to this theory, the benefits of more employment only in this case coincide with an improvement in the quality of the environment.
A central issue of the theoretical studies is the optimality of the tax system. If a tax reform is introduced in a taxation framework which is already optimal, a reform induces the usual trade-off between environmental protection and employment rather than a double divi-dend effect. On the other hand, if we face a second-best situation (sub-optimal tax system), a fiscal reform may achieve the twin goals of improving environmental quality and increasing employment. Several authors conclude that the relevance of the double dividend hypothesis is quite doubtful.
The conclusions are derived from analyses neglecting technological progress and related structural adaption processes in response to the tax shift. Together with the simplification necessary for a theoretical analysis (for example only two goods of consumption), this sort of models is appropriate for the analysis of specific problems related to the envi-ronmental tax, but cannot give evidence of the overall positive or negative effects of an energy tax.
Table 7 compiles the main hypotheses and arguments of those studies and gives some critical comments:

28 4. Review of Theoretical and Empirical Studies
INFRAS/ECOPLAN
Crucial model assumptions and hypotheses of the theoretical models
Comment
Energy tax leads to a negative income effect and a reduction in real wages due to an increase in the excess burden.
The tax base shifts from a large to a narrow one.
Reduction in real wages cannot be com-pensated through a reduction in SSC. Real wages will rise in order to adjust for the pri-ce level increase. The wage-price spiral cannot be avoided.
The negative income effect of the tax must be considered to-gether with the positive substitution effect of the tax-induced change in relative prices. The increase of the price of energy-intensive goods is compensated by a decrease of the price of labour-intensive goods. The initial utility level can be reached depending on how the utility function is defined. The level of the excess burden depends on the elasticities of demand and the tax level. If a price elastic demand for energy is assumed, the excess burden will be higher than with an unelastic price de-
mand.17 The requirement that the energy tax must be revenue-neutral leads to a higher tax level on energy (narrow tax base) in comparison with the tax level on labour (large tax base). This could (but need not) lead to an increase in the excess burden (price elasticitites of demand are still important). It is necessary to compare the excess burden due to the energy tax with the decrease in excess burden on the labour market. Furthermore, the „zero cost potential“ is never considered in the models. Through a change in the production function (which considers now the available energy saving measures) the same production level can be reached without an increase in output prices. The cost savings can be attained because of an impro-vement in the information concerning energy saving strategies and technologies. If this potential gets realized, the energy tax has no consequences on the price level and therefore also no pressure on wages to rise. In this case the wage-price-spiral can be avoided.
As a consequence of the decrease in la-bour costs, labour demand increases. This leads to a reduction in labour productivity.
Through the realization of the zero cost potentials it would be possible to reach the initial output level without an increase in price level.
Elasticities of substitution between energy-capital and labour: Energy is substituted first of all for capital.
There is a lack in empirical evidence regarding the level of the substitution elasticities. The results of the empirical studies are
ambiguous18.
Theoretical models must operate with sim-plifications. For example:
- only two or three goods are analysed
- the models are static
- they do not consider „no regret policies“
- there are no market barriers
- full mobility of capital, immobility of labour
Theoretical models cannot be used for an extensive analysis of the effect of the energy tax because of the necessary simplifi-cation and the high level of abstraction.
Table 7: Crucial model assumptions and hypotheses of the theoretical models and critical comments
17 See also section 7.5 for a quantitative illustration.
18 See for example DIW (1994), p. 164

4. Review of Theoretical and Empirical Studies 29
INFRAS/ECOPLAN
4.2. Surveys
There are four surveys available dealing with similar questions: First a study of the EU DG II elaborated by J. Koopman (1994), secondly a survey written by Majocchi (1994) and presented at a OECD workshop, thirdly a survey study carried out by CE Delft (1994). The fourth survey (also an OECD study, written by Beaumais, Schubert and Zagame (1995)) presents some evaluations of environmental policies. The evaluation concentrates upon two types of instruments, the macroeconomic and the computable general equilibrium models.

30 4. Review of Theoretical and Empirical Studies
INFRAS/ECOPLAN
Study Effects Claimed
EC Survey (Koopman/ 1994)
Generally positive impacts Employment effects depend on: -> precise formulation of policy and reaction of social partners -> level and structure of unemployment -> design of the revenue recycling Positive effects on employment are expected with a policy of targeted reduc-tion of social security contributions for low skilled workers. For a positive em-ployment effect it is important that the wage-price spiral can be avoided (this depends on the reaction of the social partners). The employment effects are more important if there is involuntary unemployment.
Effects on international competitiveness depend on: -> degree of international coordination -> size of fiscal reform -> introduction of special measures of protection -> recycling of the tax revenue The effects on competitiveness are likely to be positive if an internationally co-ordinated tax is introduced with partial exemptions for strongly energy intensi-ve industries.
Empirical findings -> the recycling of 1% of GDP generates employment effects of 0.5 to 1%
(stronger effects if revenue recycling is targeted at low skilled workers)
CE/De Wit (1994)
Theoretical findings: -> Short run: shift to more employment (factors are less mobile, capital and
energy are highly complementary, initial environmental levies are relatively low)
-> Ambiguous effects in the long term because of factor mobility -> Depend on the initial level of unemployment (negative effects if there is full
employment, a wage reaction is more probable) -> Employment effects are more positive in case of an internationally coordi-
nated implementation Empirical findings (4 empirical studies/surveys): -> positive employment effects in the short term -> long term effects are less clear; they depend on the specification of the
model (model endogenous response assumptions), possible positive effects depend on how the model simulates the price increase and the following impact on inflation and on unemployment (through the mechanism of the Phillips curve).
Majocchi (1994)
Majocchi analysed the effects of 16 European studies The effects of an energy tax depends on: -> assumptions of the wage increase following the implementation of the policy
(positive employment effects if there is only a moderate wage increase)¸ model exogenous assumptions on wage-price dynamics (inflation has a negative employment effect)
-> assumptions of strong complementarity between energy and capital (negative employment effect)
-> assumptions of compensatory mechanism for energy intensive branches (compensation has a positive impact on competitiveness)
-> the positive employment effect is even greater with a targeted cut in SSC The recycling of 1% of GDP generates employment effects of 0.1 to 0.7% Effects on competitiveness (without compensatory mechanism): negative for energy intensive sectors

4. Review of Theoretical and Empirical Studies 31
INFRAS/ECOPLAN
Study Effects Claimed
OECD Survey (Beaumais/ Schubert/ Zagame/ 1995)
The generally positive impact of the energy tax depends on: - short term: employment effect depends on the magnitude of income and
substitution effects - medium/long term: empl. effect depends on price-wage spiral (due to wage
indexation) - very long run: unemployment depends on trends in foreign prices and the
elasticity of wages in relation to unemployment (existence of wage rigidities) Employment effects depends on: -> trends in the competitiveness of the country -> the link of wages to consumer price index (positive employment effects if
wages are not linked to consumer price index; inflation hurts jobs) -> model endogenous response -> substitutability between factors of production (especially if there is com-
plementarity between energy and capital) -> the greater the redistribution targeted at low wages, the greater the benefits
Table 8: Surveys on the Double Dividend Issue: Overview of the effects of "green taxes with revenue recycling" on the main economic indicators.
As a synthesis of the review of the theoretical studies and the surveys we conclude that under the following pre-conditions, ETR lead to positive employment effects:
1. The tax has to be phased in gradually and predictably. In this case adjustment costs will be lower and economic performance better.
2. Revenues have to be recycled fully to households and firms so that no net increase in the tax burden results. Strongest employment effects are achieved if the revenue is used for cutting the SSC of low qualified labour force.
3. The size of the employment effect depends crucially on the following labour market characteristics:
-> Does a significant ex ante excess burden on labour exist or not? The higher the existing excess burden on labour is, the larger the employment effects are that can be expected by a tax shift from labour to energy and environment. An in-dicator for the actual excess burden on labour is the so called "tax wedge". The tax wedge is the difference between the total cost of employing someone and the amount of consumption this person can finance out of that income19, i. e. the dif-ference between net and gross labour costs. In most European countries this difference is in the order of 30 - 60%.20 Gross labour costs include the income taxes, social security contributions and taxes on consumption. Net labour costs do not.
-> Does structural unemployment exist? Positive long term employment effects can be expected if there is structural un-employment.
19 See OECD 1994
20 See OECD 1996, p. 47

32 4. Review of Theoretical and Empirical Studies
INFRAS/ECOPLAN
-> Reasons for unemployment: Wage rigidities, hiring costs (information barriers): Positive employment effects are higher in a situation with involuntary unemployment due to wage rigidities. In this case, the tax shift will narrow the gap between the marginal productivity of the labour force and the corresponding marginal costs. The same is valid for a situation with high hiring costs.
-> Probability of a wage-price spiral process? If the ETR leads to a wage-price spiral, employment effects are most probably small or inexistent, which is why the ETR should be designed as inflation-neutral as possible. The reaction of trade unions to a price increase influences the oc-currence of a wage-price spiral. In situation with high unemployment rates, trade unions are less powerful, so that it is more difficult for them to claim wage in-creases.
4. If the initial taxation of the environmental inputs is already high, an ETR is less likely to create more employment.
5. Employment effects are greater if the assumed substitution elasticity between labour and environmental inputs is high and the elasticity of substitution between environ-mental inputs and capital is low. There is still only weak empirical evidence on this issue.
6. Unless a first mover country includes special offsetting policy measures - such as border tax adjustment - the long term employment effects depend on the degree of international harmonisation. This problem is closely linked with long term factor mobility. The positive long term employment effects are more relevant the higher the degree of international harmonisation is, because in this way an outflow of capital can be avoided.
7. Some factors, which are usually not considered in the analysis, reinforce the positive employment effects of the ETR. These factors are: positive impact of the tax on technological development, first mover advantages and increases in economic pro-ductivity due to the cleaner environment (CE/De Witt 1994).
The effects of ETR on international competitiveness are influenced by the following aspects:
1. International harmonisation and offsetting strategies: a coordinated introduction of the CO2-energy tax at the European level helps to minimize the negative effects for individual industries (small distortion in international competition). When harmonisa-tion is lacking, negative impacts of an ETR can be reduced though offsetting measu-res.
2. Intensity of the fiscal reform: negative effects on competitiveness are lower if the time rate of raising the energy tax is low. Examples are: tax rebates for energy intensive sectors exposed to international competition; border tax adjustments.

4. Review of Theoretical and Empirical Studies 33
INFRAS/ECOPLAN
3. Revenue recycling: cost-increasing effects and, correspondingly, negative effects on competitiveness are reduced if the revenue is fully used to lower other taxes in the economy (fiscal neutrality precondition).
4. The problem of impairing international competitiveness by ETR is relevant only for energy intensive industrial sectors. In Switzerland some 2% of the labour force work in such sectors. In other European countries this fraction is higher.
All in all, the effects of ETR on international competitiveness are judged to be relatively small, except for some energy intensive branches.
4.3. Empirical model simulations
Table 9 gives an overview of the main characteristics of the studies analysing the eco-nomic impacts of ETR proposals or "green taxes" and their individual main conclusions regarding the effects on the main economic indicators21:
21 For a comprehensive survey of the existing empirical literature on the double dividend issue see
Majocchi, 1994
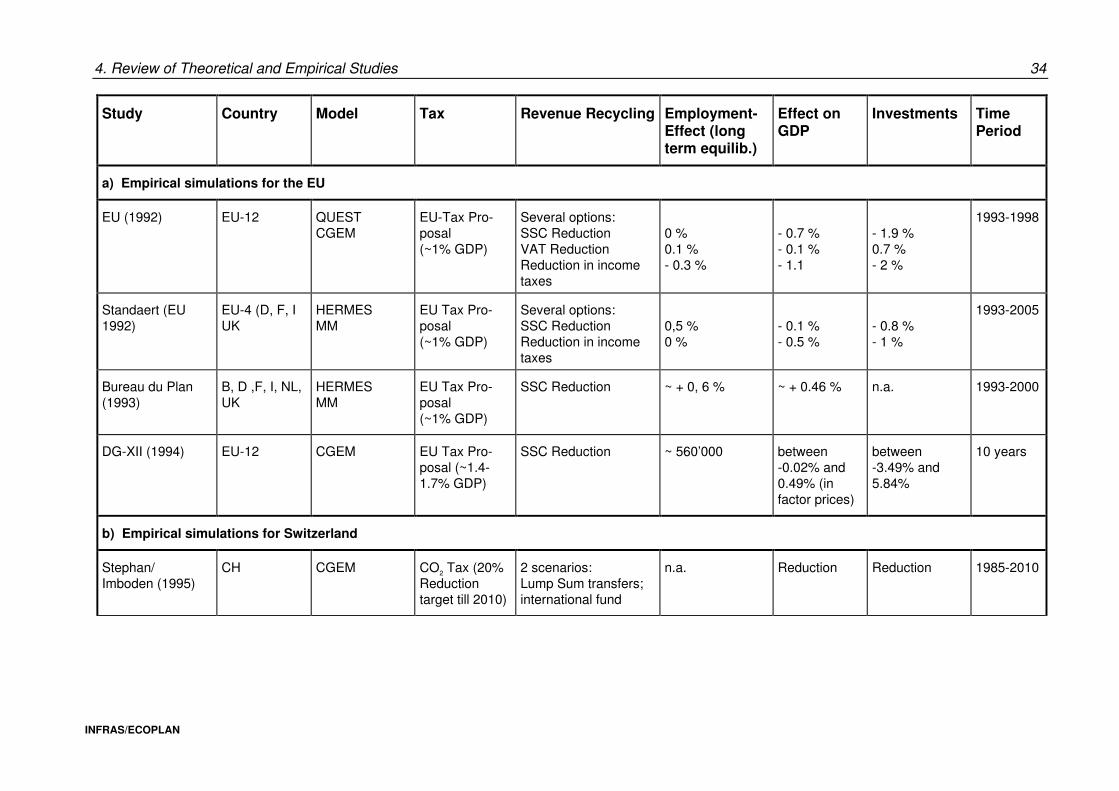
4. Review of Theoretical and Empirical Studies 34
INFRAS/ECOPLAN
Study Country Model Tax Revenue Recycling Employment-Effect (long term equilib.)
Effect on GDP
Investments Time Period
a) Empirical simulations for the EU
EU (1992) EU-12 QUEST CGEM
EU-Tax Pro-posal (~1% GDP)
Several options: SSC Reduction VAT Reduction Reduction in income taxes
0 % 0.1 % - 0.3 %
- 0.7 % - 0.1 % - 1.1
- 1.9 % 0.7 % - 2 %
1993-1998
Standaert (EU 1992)
EU-4 (D, F, I UK
HERMES MM
EU Tax Pro-posal (~1% GDP)
Several options: SSC Reduction Reduction in income taxes
0,5 % 0 %
- 0.1 % - 0.5 %
- 0.8 % - 1 %
1993-2005
Bureau du Plan (1993)
B, D ,F, I, NL, UK
HERMES MM
EU Tax Pro-posal (~1% GDP)
SSC Reduction ~ + 0, 6 % ~ + 0.46 % n.a. 1993-2000
DG-XII (1994) EU-12 CGEM EU Tax Pro-posal (~1.4-1.7% GDP)
SSC Reduction ~ 560’000 between -0.02% and 0.49% (in factor prices)
between -3.49% and 5.84%
10 years
b) Empirical simulations for Switzerland
Stephan/ Imboden (1995)
CH CGEM CO2 Tax (20% Reduction target till 2010)
2 scenarios: Lump Sum transfers; international fund
n.a. Reduction Reduction 1985-2010
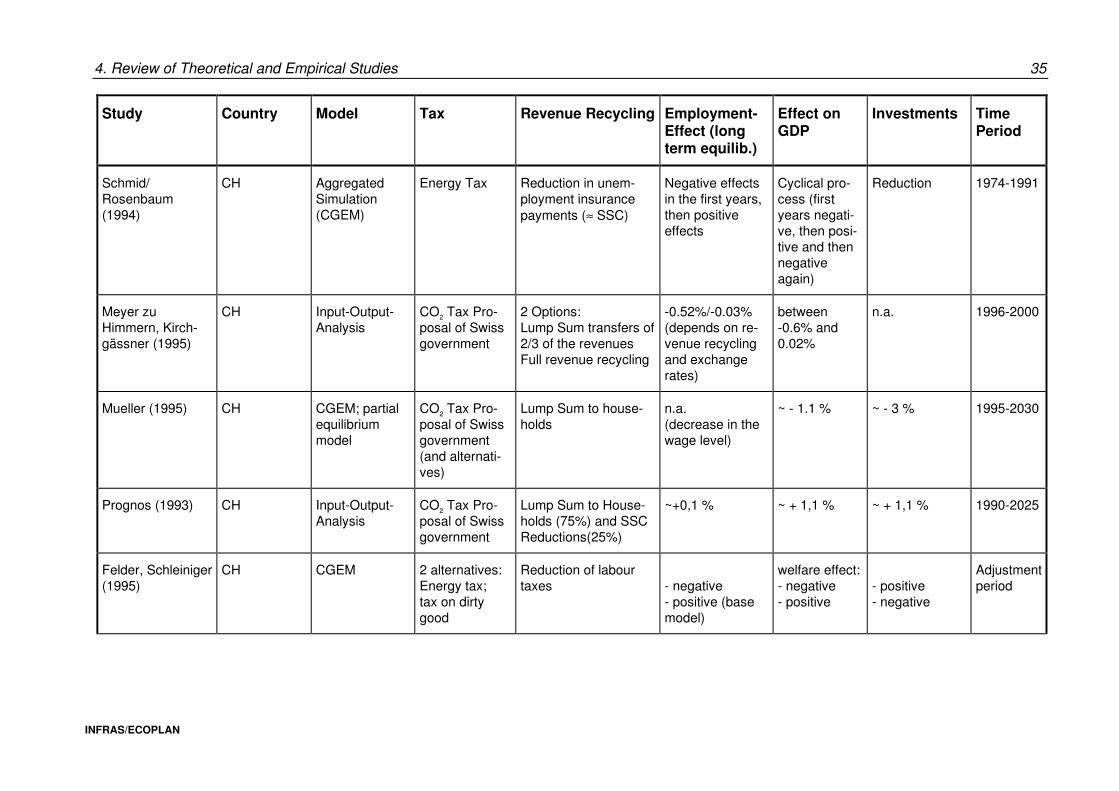
4. Review of Theoretical and Empirical Studies 35
INFRAS/ECOPLAN
Study Country Model Tax Revenue Recycling Employment-Effect (long term equilib.)
Effect on GDP
Investments Time Period
Schmid/ Rosenbaum (1994)
CH Aggregated Simulation (CGEM)
Energy Tax Reduction in unem-ployment insurance payments (≈ SSC)
Negative effects in the first years, then positive effects
Cyclical pro-cess (first years negati-ve, then posi-tive and then negative again)
Reduction 1974-1991
Meyer zu Himmern, Kirch-gässner (1995)
CH Input-Output-Analysis
CO2 Tax Pro-posal of Swiss government
2 Options: Lump Sum transfers of 2/3 of the revenues Full revenue recycling
-0.52%/-0.03% (depends on re-venue recycling and exchange rates)
between -0.6% and 0.02%
n.a. 1996-2000
Mueller (1995) CH CGEM; partial equilibrium model
CO2 Tax Pro-posal of Swiss government (and alternati-ves)
Lump Sum to house-holds
n.a. (decrease in the wage level)
~ - 1.1 % ~ - 3 % 1995-2030
Prognos (1993) CH Input-Output-Analysis
CO2 Tax Pro-posal of Swiss government
Lump Sum to House-holds (75%) and SSC Reductions(25%)
~+0,1 % ~ + 1,1 % ~ + 1,1 % 1990-2025
Felder, Schleiniger (1995)
CH CGEM 2 alternatives: Energy tax; tax on dirty good
Reduction of labour taxes
- negative - positive (base model)
welfare effect: - negative - positive
- positive - negative
Adjustment period
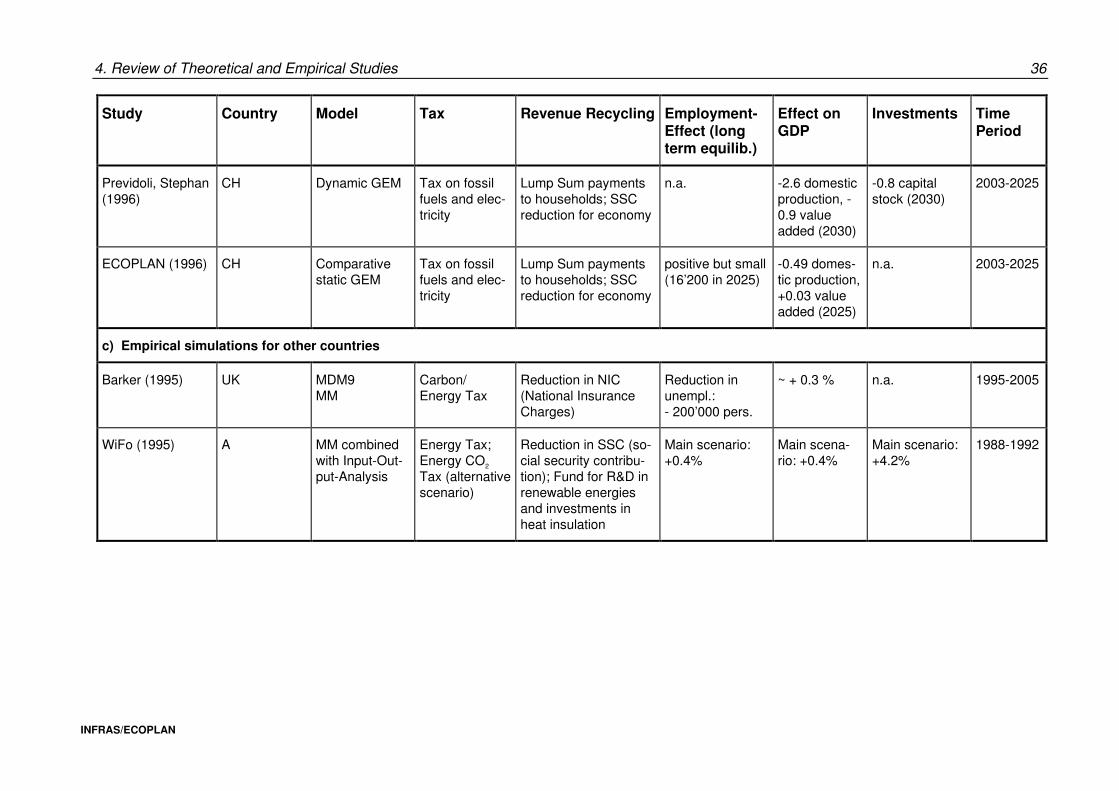
4. Review of Theoretical and Empirical Studies 36
INFRAS/ECOPLAN
Study Country Model Tax Revenue Recycling Employment-Effect (long term equilib.)
Effect on GDP
Investments Time Period
Previdoli, Stephan (1996)
CH Dynamic GEM Tax on fossil fuels and elec-tricity
Lump Sum payments to households; SSC reduction for economy
n.a. -2.6 domestic production, -0.9 value added (2030)
-0.8 capital stock (2030)
2003-2025
ECOPLAN (1996) CH Comparative static GEM
Tax on fossil fuels and elec-tricity
Lump Sum payments to households; SSC reduction for economy
positive but small (16’200 in 2025)
-0.49 domes-tic production, +0.03 value added (2025)
n.a. 2003-2025
c) Empirical simulations for other countries
Barker (1995) UK MDM9 MM
Carbon/ Energy Tax
Reduction in NIC (National Insurance Charges)
Reduction in unempl.: - 200’000 pers.
~ + 0.3 % n.a. 1995-2005
WiFo (1995) A MM combined with Input-Out-put-Analysis
Energy Tax; Energy CO2 Tax (alternative scenario)
Reduction in SSC (so-cial security contribu-tion); Fund for R&D in renewable energies and investments in heat insulation
Main scenario: +0.4%
Main scena-rio: +0.4%
Main scenario: +4.2%
1988-1992
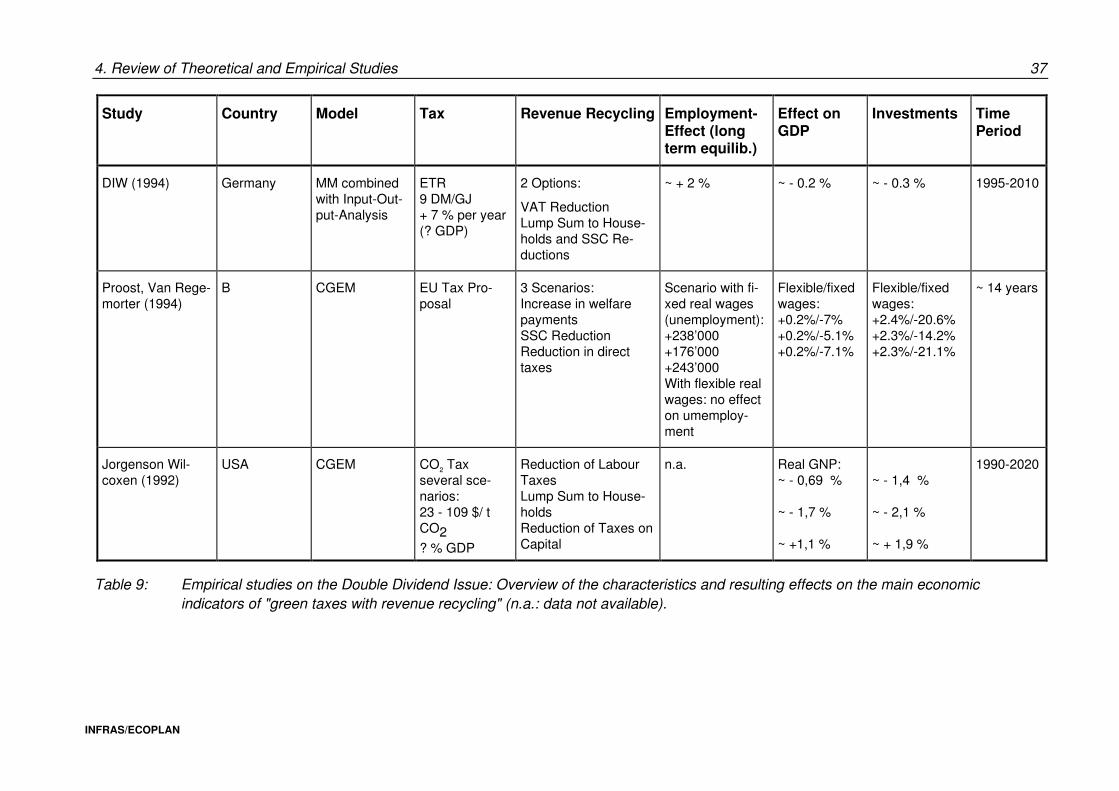
4. Review of Theoretical and Empirical Studies 37
INFRAS/ECOPLAN
Study Country Model Tax Revenue Recycling Employment-Effect (long term equilib.)
Effect on GDP
Investments Time Period
DIW (1994) Germany MM combined with Input-Out-put-Analysis
ETR 9 DM/GJ + 7 % per year (? GDP)
2 Options:
VAT Reduction Lump Sum to House-holds and SSC Re-ductions
~ + 2 % ~ - 0.2 % ~ - 0.3 % 1995-2010
Proost, Van Rege-morter (1994)
B CGEM EU Tax Pro-posal
3 Scenarios: Increase in welfare payments SSC Reduction Reduction in direct taxes
Scenario with fi-xed real wages (unemployment): +238’000 +176’000 +243’000 With flexible real wages: no effect on umemploy-ment
Flexible/fixed wages: +0.2%/-7% +0.2%/-5.1% +0.2%/-7.1%
Flexible/fixed wages: +2.4%/-20.6% +2.3%/-14.2% +2.3%/-21.1%
~ 14 years
Jorgenson Wil-coxen (1992)
USA CGEM
CO2 Tax several sce-narios: 23 - 109 $/ t CO2 ? % GDP
Reduction of Labour Taxes Lump Sum to House-holds Reduction of Taxes on Capital
n.a. Real GNP: ~ - 0,69 % ~ - 1,7 % ~ +1,1 %
~ - 1,4 % ~ - 2,1 % ~ + 1,9 %
1990-2020
Table 9: Empirical studies on the Double Dividend Issue: Overview of the characteristics and resulting effects on the main economic indicators of "green taxes with revenue recycling" (n.a.: data not available).
38 4. Review of Theoretical and Empirical Studies
INFRAS/ECOPLAN
a) At the EU level there are several empirical model simulations:
− The official simulations of the EC are carried out with the QUEST model. The QUEST model is a macroeconomic model which distinguishes only one production sector. As it connects simulations of the EC member countries with those of the most relevant non-EC countries, it is able to integrate the feedback effects for the economies of the EC stemming from the international trade relations with the rest of the world. QUEST assumes that Japan and the USA do not introduce the tax. Furthermore, the QUEST model stresses the relevance of the wage-price-spiral, as it assumes no price illusion of the households (contrary to the HERMES model, which also shows some more optimistic results). QUEST tends to accentuate the negative impacts of price rises which leads to a loss in competitiveness. The macroeconomic effects of this simulation are, all in all, limited (but they improve over time). The substitution of energy through labour goes on for a considerable amount of time (approximately 10 years, dependent upon the turnover rate of capital). The positive effects of the VAT scenario depend, to some extent, on the wage indexation used in QUEST, which only leads to a moderate wage increase.
− HERMES: Generally, the simulations carried out for the four largest EU countries with HERMES (macroeconomic, multi-sectoral model) have very similar patterns to those of QUEST, although the macroeconomic effects are somewhat more positive with HER-MES (inflation is not so high and the slowdown of the GDP is not as strong as in the QUEST simulations). HERMES assumes production functions which allow only an ex ante substitution between factors (putty-clay production function). As a consequence, the time dimension is very important because the substitution between production fac-tors depends solely on the new investment. The production function of HERMES as-sociates a combination of capital and energy with a combination of labour and non-energy intermediate inputs. An increase in the relative price of energy makes the capi-tal/energy combination more expensive, leading to a decrease in capital demand (and in investment). The main differences between HERMES and QUEST are − the degree of disaggregation (HERMES works with a more disaggregate structure
of industries22 than QUEST), − the structure of the wage equation (HERMES assumes price illusion of the house-
holds), and − the integration of international trade relations (HERMES assumes a large closed
economy and neglects international feedback, i.e. first mover effects). The simulations show, for the scenario with a SSC reduction, positive employment ef-fects; this positive effect increases in the long run. Considerable effects on the GDP are to be noted shortly after the introduction of the tax: two years after the introduction of the tax the GDP shows a decrease of -0.34% from the baseline scenario). After se-ven years, the difference to the baseline is reduced to -0.12%. Only the investment
22 Nine different branches and 15 consumption categories are dinstinguished.
4. Review of Theoretical and Empirical Studies 39
INFRAS/ECOPLAN
does not show a similar trend. In the first period (after two years) they show a decrea-se of -0.8%. Investment improves, in comparison to the baseline scenario, after 7 years (to -0.67%) but decrease once more to -0.8% after 12 years. This trend is pri-marily due to the fixed capital formation of the firms.
− A general equilibrium model analysis of the effects of the introduction of the combined carbon/energy tax according to the earlier proposal of the EU has been carried out with the so called GEM-E3-model for 12 EU countries by four European research institutes (Capros et al. 1994). The main feature of this model is that it considers full equilibrium on all markets, including the labour markets. Unemployment is included in the model through a high real wage rate elasticity of labour supply, which is, as pointed out by the authors, a sensitive assumption. The balance of payment of the EU countries can vary, depending on the relative prices of export goods, while the exchange rate remains fixed. The results demonstrate that a double dividend can be achieved, although the employment effects are relatively small. Energy consumption drops significantly, the major negative effects are borne by the energy intensive industry and, to a lesser degree, by the equipment goods industry. The simulation results show major differences between countries, which are due mainly to differences in the structure of the economy. The following factors affect the results: degree of flexibility of the labour market (elasticity of labour supply), degree of exposure to foreign trade, flexibility of the energy supply system (substitution elasticities between different energies), pre-existing level of energy-related excise taxes.
b) Empirical studies for Switzerland:
− PROGNOS (1993) carried out a study for Switzerland on the economic impacts of the official proposal for a CO2 tax in Switzerland. The study is based on a combination of an elasticity approach (partial analysis) and an Input-Output-Analysis where two equlilibrium situations are compared (comparative static analysis). Four scenarios with different assumptions on the levels of CO2 taxes, revenue recycling and energy taxes were analysed. Different simulations were carried out for the internationally harmo-nised scenario and for the first mover scenario. The overall results of the simulations are positive (increase in GDP), especially with an international harmonisation. The only negative effect expected is an increase in the price level (i.e. a decrease in purchasing power). The general employment effects are relatively small, but there are significant differences between industries. For the employment effects too, the first mover scenario shows smaller positive effects than the international harmonisation scenario (calculated on the basis of the change in the value added in different branches). Overall, there is an increase in the value added of both the harmonised and the first mover scenarios. As expected, the decrease in energy imports affects the balance of payments positively. Thereby the decrease in the export is slightly more pronounced in the first mover scenario than in the harmonised scenario. The overall effect on the balance of payment is more positive in the harmonised scenario in which the increase in domestic demand, due to the reduction in energy imports, is directed to a larger ex-tend toward domestic products.
40 4. Review of Theoretical and Empirical Studies
INFRAS/ECOPLAN
− Stephan/Imboden (1995) analysed the impact of three GGA policy scenarios on the Swiss economy (base case scenario, first mover scenario, international harmonisation) with a dynamic computable GEM. Revenue recycling varies, according to the scena-rios: The harmonisation scenario implies that the revenues flow into an international fund and cannot be recycled to households (i.e. through lump sum payments). Contrary to that, the first mover scenario is characterised by a revenue recycling via lump sum transfers to domestic private households only. In the short run, the impact of a CO2 tax on GDP and on consumption is larger in the harmonisation than in the first mover scenario. This, however, changes in the long run, when the costs of a first mover strategy - measured as a loss in GDP or a reduction in consumption - prevail over the costs of the harmonisation strategy. The model is based on the assumption of complementarity of capital and energy in the short/medium run. Only in the long run, with a new capital stock, it is possible to substitute energy by capital (increase in energy efficiency through energy saving investments). In the first mover scenario, the reduction in the demand of fossil fuels is more drastic than in the harmonisation sce-nario. The explanation for the large reduction in the consumption of fossil fuels in the first mover scenario is that the targeted reduction of emissions is higher in this sce-nario than in the harmonisation scenario. In their analysis of the simulations results, the authors point out that the overall negative effects would be weaker in a model which would allow energy efficiency to advance technological progress already in the short term.
− The simulations of Meyer zu Himmern/Kirchgässner (1995) simulate under worst case assumptions the effects of a CO2 tax in Switzerland. In the input-output-analy-sis carried out, they assumed that no structural change would take place and no spe-cial regulations for energy intensive branches would be introduced (fixed coefficients of the input-output tables). The change in relative prices affects directly only the demand-side of the economy. The scenarios analysed show the effects on employment and competitiveness of different assumptions for the exchange rates (fixed or variable exchange rates) and for the revenue recycling (full or partial revenue recycling). The results are sensitive with respect to the design of the revenue recycling. However, even in the Kirchgässner analysis, the CO2 tax analysed leads to positive effects on GDP and negligible effects on employment (-0.03%) if the revenues of the tax are fully recycled and if the exchange rate is allowed to react to the rise in prices.
− Müller/Carlevaro (1995) applied two different methods for the simulations of the ef-fects of an energy CO2/tax in Switzerland: the partial equilibrium analysis and the CGEM analysis (which includes some dynamic elements). One of the designs for a CO2 tax analysed corresponds to the official 1994-proposal of the Swiss government. The alternative tax designs are considered to minimize the negative impact of the tax on competitiveness. The energy demand depends on the investment (energy and capital are complementary factors). Therefore, a reduction in energy consumption can only be achieved with the renewal of the capital stock (investments in more energy
4. Review of Theoretical and Empirical Studies 41
INFRAS/ECOPLAN
efficient technologies). The official proposal for a CO2 tax23 leads to a considerable de-crease in energy consumption in the long run (-13%). Also GDP and investment show a strong decrease. Due to the capital mobility and the increase in the energy price in Switzerland new investment is made abroad. As the model assumes full employment, it is not able to analyse the effects of the CO2 tax on unemployment. Important (and probably very sensitive) assumptions are: no recycling of the tax revenue to the firms, special measure for offsetting negative effects on competitiveness not taken into account, high speed of introduction of the CO2 tax, full mobility of capital.
− Schmid/Rosenbaum (1995) analyse the effect of a reduction in SSC (payment for the unemployment insurance) which is paid by an energy tax on employment. The simu-lations were carried out by a partial equilibrium model and show the effects which an energy tax would have had on the Swiss economy over the last twenty years. As for GDP the simulations show an up-and-down development: a reduction in the first years after the introduction of the energy tax, thereafter an increase, which is followed by a new reduction. The changes in unemployment rates are related to the development of overall economic growth (a reduction in economic growth is followed by a reduction in unemployment rates). The effect on the price level is not clearly predictable. The nega-tive price effect due to the energy price increase is dampened by the reduction in economic growth.
− A further simulation for Switzerland was carried out with the MARKAL model (Kypreos, 1994), which uses an alternative modelling approach. Due to its differences to the traditional simulation models24 this study is not integrated in Table 9. The use of a process-oriented optimisation model such as MARKAL (market allocation), combi-ned with an engineering simulation (bottom-up approach) allows for detailed simula-tions of the emission reduction. With this approach it is, however, not possible to measure the net impact on GDP. Kypreos compared the effects of different scena-rios25 on the CO2 emission level and on the average and total cumulative cost of CO2 control. The scenarios differ with regard to the assumptions on the future supply of nuclear energy (nuclear phase-out programme, nuclear status quo or moratorium, unconstrained nuclear supply: reference case). The most important assumptions con-cern the introduction of alternative technologies and (energy) resources and the im-provement in the efficiency of end-use devices. Also it is assumed that the price of oil will double in the next 20 years in Switzerland. The author points out that this assump-tion is in line with the results of projection studies which estimate that the world price of oil and gas will sharply increase after the year 2000. A reduction of 33% of the CO2 emissions by the year 2025 (application of the Toronto recommendation) would imply,
23 36 CHF per ton of CO2
24 It focuses on the emission reduction and does not analyse the impact of revenue recycling. Also, with this approach it is not possible to identify the changes in GDP.
25 Three scenarios were analysed: The „Reference Case“ with an unconstrained nuclear supply, the nuclear „Status-Quo“ and the „Moratorium Case“.
42 4. Review of Theoretical and Empirical Studies
INFRAS/ECOPLAN
in the reference case, discounted cumulative costs of 59 bn CHF, in the status quo case 70 bn CHF26. The author emphasizes that these costs are not to be seen as a loss in GDP. For an estimation of the GDP change it would be necessary to use of a CGEM or similar economic simulation model. In a second study, Kypreos combined the MARKAL model with a macroeconomic growth model. One key model variable is the implemented time rate of technological progress that improves energy efficiency. With this approach it is possible (like in the first study) to get the marginal cost due to CO2 control (these costs correspond to the carbon tax necessary to reduce the CO2 emission by 20-50%). The simulated effect on GDP is negative, and it varies depen-ding on the scenario between 1.7% (reduction of CO2 emissions by 30% by the year 2030) and 4% (reduction of 50%). The difference between the negative results of the study of Kypreos, though including some sort of technological progress, and the small positive results of the Prognos study (Prognos 1993), without considering technological progress, can be explained through the much more stringent assumptions of the study of Kypreos. The CO2 tax in the model of Kypreos aims to reduce CO2 emission by 30% respectively 50% by the year 2030. The magnitude of the CO2 tax is therefore much more larger than in the Prognos scenario, where the CO2 emission goal is not as stringent. In the Prognos study it is foreseen to reach a consolidation of the CO2 emissions by the year 2000, thereafter a reduction of the emissions (the reduction target is not specified).
− Felder/Schleiniger (1995): Based on the study of Goulder, the authors analyse the conditions under which income sources other than labour bear the burden of the en-vironmental tax. The focus is put on the following income sources: transfer income, capital, foreign labour. Felder/Schleiniger assume that a shift of the tax burden from labour to factor rents on fossil fuels is very unlikely to be achieved. This possibility is therefore not considered in the study. The numerical simulations show that depending on the assumptions about factor mobility, a double dividend can be attained. If capital is considered to be a fixed production factor (as it may be in the short run), it is possi-ble to shift a part of the tax burden on it. This reduces the distortion in the labour mar-ket (labour does not bear the whole tax burden) and, as a consequence, increases after tax wage and therefore employment. As usual in CGEM, there is no involuntary unemployment, so that an increase in real wages automatically leads to an increase in employment. The nesting structure of the production function and the assumptions on substitution elasticities between energy, capital and labour have an important impact on employ-ment effects (high substitution elasticities between energy and capital, lower elasticities between the bundle energy/capital and labour).
26 The average cost per kg CO2 reduction is lower in the status quo case (0.27 CHF/kg) than in the
reference case (0.35 CHF/kg). On the contrary, the discounted marginal cost per kg of CO2 reduction is lower in the reference case than in the status quo scenario. The results show that for an energy-efficient country such as Switzerland it is very expensive to apply an uniform reduction of CO2 emissions. The possibilities of inter-fossil fuel substitution are not enough to meet the Toronto recommendation; therefore it needs special efforts in energy conservation and in finding renewable energy sources if CO2 reduction should be domestically.
4. Review of Theoretical and Empirical Studies 43
INFRAS/ECOPLAN
The simulation results show that positive employment effects can be achieved, if the dirty good - and not energy - is taxed. The dirty goods are, in comparison to the other goods, capital and energy intensive goods. The taxation of the dirty good leads to a shift of the tax burden to transfer incomes, so that real after-tax wages are allowed to rise. This does not happen with a taxation of energy input, because firms substitute the expensive production factor energy with other production factors, which leads to an erosion of the tax base. Consequently, the cut in labour taxes is not as high as in the case of a tax on the dirty good (with important consequences on the labour market). A shift of the tax burden to foreign labour supply can be achieved only with a taxation of the dirty good (only in this case a double dividend can be achieved). The central assumptions on which this result depends are rather unrealistic for Switzerland: Capital is not tradeable and the export good is labour intensive. As a consequence the domestic currency becomes stronger, real wages of foreign labour forces improve and therefore the supply of foreign labour forces increases. In this case, the tax burden is shared between foreign and domestic labour forces, which leads to a discharge of domestic labour.
− Previdoli/Stephan (University of Berne, 1996) analyse the economic effects of the energy-environment popular initiative with a dynamic general equilibrium model. This popular initiative demands a stabilisation of the consumption of fossil fuels and of electric energy within eight years after the initiative has been accepted in the referen-dum. Thereafter, energy consumption must be reduced during the following 25 years by 1% per year. The energy tax is introduced stepwise and increases by 3.5% per year for fossil fuels and by 2% per year for electric energy. The tax revenues are redistri-buted to households (lump sum payments) and to the economy (according to the SSC). The dynamic model allows for sequential (inter-temporal) decision making of the hou-seholds. At the beginning of each period, the household must decide how much of its income should be consumed and how much should be saved. The model considers two energy saving possibilities: the substitution of fossil fuels and electricity with renewable energy resources and the increase in the energy efficiency and the inno-vations of less energy intensive techniques. Both possibilities allow a reduction of energy consumption without implying a reduction in economic production. The business as usual scenario allows for a growth of the (potential) labour supply of 1.3% per year. In comparison to this basic scenario, the model results for the energy-environment initiative (EEI) in the year 2030 show only very small differences (below 1%) for the development of the capital stock (-0.8%) and the value added (-0.9%). A difference of 2%-3% results for the domestic production (-2.6%) and the exports (-2.1%). The effects of the tax on industry and services are altogether also relatively small (due to the reduction of the tax for energy intensive branches), with the exception of the energy sector, where a considerable reduction of the energy consumption can be achieved.
− ECOPLAN simulated parallel to this study the economic effect of the „energy environ-ment initiative“ (see Annex 2) within the framework of the „energy perpective studies“
44 4. Review of Theoretical and Empirical Studies
INFRAS/ECOPLAN
of the Swiss federal office of energy (ECOPLAN 1996). The model used is an up dated comparative static GEM, which allows for wage rigidities on the labour market. In com-parison with the basic model, the actual model has been improved through the inte-gration of a tax function that shows the effects of energy taxation on five different households types (low and high qualified employed and unemployed people, pensio-ners). Other adaptations of the model concern the utilised substitution elasticities - which are generally lower than those utilised previously. These changes are based on the results obtained with bottom-up models carried out for the Swiss “energy perspec-tives“. The ECOPLAN study analyses explicitly the effects of energy policy on the labour market. The redistribution of the tax revenues through a reduction of SSC has a (small) positive impact on the labour market (about 16’200 new jobs). The effects on energy consumption and CO2 emissions are more considerable (13% and 15.5% for the energy tax which will be levied in the year 2025). The results of this ECOPLAN study are, all in all, more optimistic than those of Previ-doli/Stephan: the drop in domestic production, value added and exports in comparison to the basic scenario are less considerable. Previdoli and Stephan identify the reasons for the more optimistic results of the ECOPLAN study in the differences of the model structure (static versus dynamic model) and in the different modelling of exports and domestic production. The dynamic model of Previdoli/Stephan considers also short and mid term adjustment costs of industries due to the stepwise increasing energy prices. The comparative static ECOPLAN study on the other hand, shows results for the long term equilibrium, when adjustment has taken place completely. But the results of Previdoli/Stephan should not be interpreted as an argument against the relative advantage of a stepwise price increase compared to a one time price increase. A stepwise price increase is much more favourable and leads to less adjustment costs if it is announced well in advance credibly. The sensitivity analysis carried out shows that the economic effects are more positive if a minimum consumption is defined (in comparison to the case where there is no re-striction about the minimum consumption of households). An increase in the flexibility of the production function leads to negative economic effects because the reaction of the economy to price increases is stronger. The sensitivities concerning the interna-tional competitiveness (Armington elasticities of substitution and transformation) show only moderate macroeconomic effects, although the effects for some branches are considerable.
c) Empirical studies for different European countries and for the USA:
− Proost/Van Regemorter (1994) utilize a dynamic (two periods) applied general equi-librium model for Belgium. The first period shows the medium run adaptations (5-7 years), the second period shows the full adjustments in the long run (12-14 years). Some sensitivity analysis was carried out with regard to the policy design. First of all, the authors distinguished three scenarios for revenue recycling: an increase in welfare payments, a decrease in social security contributions, a decrease in direct taxes. The model assumes that all EU countries introduce the energy-carbon tax. Also, they
4. Review of Theoretical and Empirical Studies 45
INFRAS/ECOPLAN
discuss two conditions of the labour market: flexible wages (full employment) in all periods and fixed real wages in the medium term (classical unemployment). The worst impacts result in the case where fixed real wages are combined with the strategies of reducing transfer payments and of reducing direct tax payments. The GDP falls significantly and unemployment increases. The scenario of a reduction of SSC shows the best results, but also in this case overall welfare still decreases be-cause the reduction of SSC is insufficient to improve employment (the possibilities to reduce the wage cost are limited because the tax base is eroded). The reasons for these negative results can be found in the assumptions on factor mobility. At last, the only fixed factor must bear the energy tax, and this is the factor labour. As long as there are no price rigidities on the labour market, the choice of the design of the tax reform on the recycling side is not important (wage adjustments offset the negative/ positive effects on the labour market).
− For Germany DIW carried out in 1994, a comprehensive study on the economic im-pacts of a concrete ETR proposal27. The analysis is based on simulations of a macro-economic model, combined with an Input-Output-Analysis. The study analyses two modalities for the revenue recycling: a reduction in social security contribution and a lump sum payment to households. As expected, the sectoral analysis shows that energy intensive industries are (in the short term) challenged by the negative effects of the energy price increase. After a period of ten years, there are only few industries whose products show a price increa-se of more than 5% of the initial price level. The expected increase of the price level results ten years after the introduction of the tax on 1.5 % (in comparison to the refe-rence scenario). Due to the reduction of SSC, the effects of the tax reform on competitiveness are posi-tive. The export-intensive industries are often also labour-intensive and profit from an advantage from the tax reform. Several sensitivites have been carried out, especially on the assumptions regarding the exchange rate and the wage policy. Independently from the assumptions, the results show that the effects of a tax reform on economic growth are low, the impact on employment is on the other hand quite relevant. The authors of the study emphasize that the I-O-Model assumes a fixed relationship bet-ween input factors. This implies that the expected adjustments are not considered, which leads to results which are too pessimistic. A CGEM carried out for Germany (Welsch, Hoster (1994)) analyse the impact of a EU-wide carbon/energy tax and of a domestic energy tax (based exclusively on the energy content). The effects of both taxes on the balance of current account are positive, due to the decrease in energy imports. The authors were also able to confirm that the as-sumptions regarding the revenue recycling are crucial for the results. The tax recycling through consolidation of government budget seems to have particularly positive effects on GDP. The overall (negative) effects on employment are also very small (less than 0.05% difference from the reference case).
27 The ETR proposal of DIW foresees a tax on the energy content of fossil fuels and electricity. The
baseline tax is 9 DM for a GJ, the annual increase amount to 7%.
46 4. Review of Theoretical and Empirical Studies
INFRAS/ECOPLAN
− For Austria, a macroeconomic model combined with a IOM was computed by the Aus-trian Economic Research Institute (WiFo 1995). The tax is introduced stepwise and different revenue recycling are considered. In the main scenario, in the first years the revenue recycling to households reaches 50% of the tax revenue. The other 50% are allocated in infrastructure investment (commuter transport, heat insulation) and for research and development of renewable energy sources. After five years, these pro-portions change and households will receive 70% of the revenues. A first mover sce-nario is assumed. The main scenario models offsetting measures for the industry, this only in the first years after the introduction of the tax (degressive tax rate for energy in-tensive industries). The macroeconomic effects are positive: In comparison to the reference case, the GDP increases by 0.4% after 5 years. The employment reacts with a time lag to the development of the GDP. After a period of 5 years, a small increase of 11’000 persons results (i.e. of 0.4%). The unemployment rate decreases by 0.2%. The changes in production and employment are quite different between economic sectors. The largest losses in employment occur in the energy intensive sectors, like the fossil fuels industry, paper industry, chemical industry. A large increase in em-ployment is achieved by the construction industry, due partly to the revenue recycling for investments in insulation. The sensitivities carried out for different assumptions on the labour market, show that the assumptions regarding the labour demand (first of all assumptions for the elasticities of substitution) have a considerable impact on employment effects.
− Jorgenson/Wilcoxen (1992) carried out the most comprehensive US study in this do-main. They apply a highly disaggregated CGEM for the analysis of the size of the ne-cessary CO2 tax in the US for several CO2 emission stabilisation and reduction sce-narios. It is the only study which integrates biased technological change and capital formation endogenously, whereby the technical change need not be energy saving in every industry. Another special feature of the model consists in the productivity growth, which is an endogenous function of relative prices. The authors analysed three models of revenue recycling: lump sum payment, reduc-tion of taxes on labour, reduction of taxes on capital. Significant differences between the scenarios result for the following variables: • The price of capital: it decreases with the reduction of labour taxes, and increases
for the other scenarios. • Capital stock: it increases in the scenario with a reduction in capital taxes (that
means more investment) and decreases in the other scenarios, • The growth of real GNP: it is positive in the scenario with the reduction of capital ta-
xes, negative for the scenario with a reduction of labour taxes and lump sum pay-ments.
The authors identify the reasons for the high predicted GNP losses in some feature of their model, especially in the stronger links between current carbon taxes, capital ac-cumulation and productivity growth. The increase in energy prices (first of all the price of coal and electricity) reduces productivity growth and slows the rate of capital forma-tion (less investments), both effects reduce the growth of GDP.
4. Review of Theoretical and Empirical Studies 47
INFRAS/ECOPLAN
− The study of Barker (1995) analyses the effects of a change in the UK fiscal system in order to achieve a reduction in greenhouse gas emissions and an increase in em-ployment. The analysis was carried out with a macroeconomic model (E328 model, Cambridge Multisectoral Dynamic Model). This model shows some interesting fea-tures, which differ from the other models: it does not assume an economy with full employment all the time nor constant returns to scale or perfect competition. Simulations were carried out for three scenarios, wich differ by the design of energy taxation (increasing the road fuel excise duty by 5% and 17.66%, introduction of a carbon/energy tax). The revenues are recycled via reductions of employers’ SSC. The effects on international competitiveness measured through the balance of pay-ments ratio to GDP are relatively small (falls from 3.9% in the base case to 3.7% in the scenario with a carbon/energy tax), as the losses from energy-intensive trade are offset by the gain from labour-intensive trade. The model assumes a fixed exchange rate, which does not buffer the negative effects on competitiveness. Also, no exemp-tions are given to energy intensive industries. Both assumptions give an upper esti-mate to the loss of competitiveness. The employment effects are positive and depend on the amount of the energy tax or on the level of revenues which can be recycled, respectively.
4.4. Conclusions
The review of empirical studies leads to the following conclusions:
Effects on employment
1. On average, an energy tax of about 0.5-1 % of GDP29 leads to a positive employ-ment effect in the order of magnitude of about 0 to 1 % of current employment if the revenues are fully recycled as a reduction of the social security contributions (SSC) of employers.
2. The employment effect increases with the level of the assumed green tax. For the time being it is open up to what level this result can be extrapolated. However, ac-cording to dynamic analysis, time rates of change of green taxes are much more relevant than levels.
3. Macroeconomic models usually predict larger effects than CGEM as they model unemployment more adequately.
28 E3: Energy-Environment-Economy
29 The tax revenue depends of course on the tax design. For Switzerland, the range of the tax revenue varies between 0.4% and 0.9% of GDP (see PROGNOS 1993).
48 4. Review of Theoretical and Empirical Studies
INFRAS/ECOPLAN
Effects on GDP
1. The wide range of ETR effects on GDP, depending on design of revenue-recycling is of special interest. The recycling by means of a reduction of capital taxes shows the strongest impact on GDP because this option favours capital formation.
2. The study of Mueller/Carlevaro confirms that a stepwise introduction of the tax alle-viates its negative impacts. The combination of the assumptions of this model (regar-ding the elasticities, the incomplete revenue recycling, employment, lack of offsetting measures, international capital mobility, etc.) leads to a pessimistic impacts scenario of a CO2 tax.
3. Stephan/Imboden modelled a stepwise introduction of the CO2 tax as well. According to this model the impact on GDP depends mostly on the degree of international harmonisation (first mover vs. harmonisation scenario). The model predicts small but generally negative effects on GDP, more so in the first mover scenario without offsetting measures.
Effects on competitiveness
• In first mover scenarios, the effects on competitiveness of an energy tax strongly de-pend on offsetting measures included in the ETR policy.
• In a scenario with a harmonized ETR policy the overall effect on international trade is contradictory. The assumed negative effects on GDP are due to a general reduction in imports and exports.
Relevance of the design of the levy-side
1. The adjustment costs are lower if the tax is phased in gradually and predictably. Ba-sed on previous experience, anticipatory behaviour can be expected in such a si-tuation. If it is credibly known that energy prices will increase, the capital stock will be replaced even before the tax is introduced with a more energy efficient capital stock.
Relevance of revenue recycling
1. Full revenue recycling has a positive impact on GDP, employment and competitive-ness (compared to incomplete recycling). With regard to energy consumption, invest-ment and inflation, there are no significant differences between different designs of revenue recycling.
2. Recent studies at the EU level show a strong evidence for a higher employment ef-fect if the SSC reduction is targeted to low skilled workers30.
3. If revenues are recycled with a proportional reduction of direct taxes (instead of SSC) effects on employment and GDP are less favourable.
4. Revenue recycling through a reduction of taxes on capital affects investment and GNP positively.
30 However, in the longer run this has a tendency to slow down structural change and technological
progress.

4. Review of Theoretical and Empirical Studies 49
INFRAS/ECOPLAN
Although the overall tendency of the studies analysed indicates at least slightly positive effects on the main economic indicators due to the introduction of an ETR, there are several studies coming up with rather negative results.
Table 10 gives some explanations for the differing results by comparing the key assump-tions of the „optimistic“ and „pessimistic“ models:

50 4. Review of Theoretical and Empirical Studies
INFRAS/ECOPLAN
Key assumptions of models with generally posi-tive results
Key assumptions of models with generally nega-tive results
Macroeconomic and Input-Output-Models
Example:
Switzerland: Prognos (1993)
Other countries: WiFo (1995, Austria), DIW (1994, Germany)
Example:
Switzerland: Meyer zu Himmern/Kirchgässner (1995)
Policy design assumptions:
The basic assumptions regarding the policy design are identical in the analysis of Prognos and Meyer zu Himmern/Kirchgässner (CO2 tax proposal of the Swiss government)
Both model a full revenue recycling to households and industry. Offsetting measures for energy intensive branches are not considered in these studies.
Model endogenous assumptions:
DIW: It is possible to transfer a part of the tax burden to foreign countries. This assumption tries to com-pensate for the lack in offsetting measures at the border. It is assumed that the nominal exchange rate compensates for a loss in competitiveness due to an increase in domestic prices. Also, the real interest ra-te is held constant. The level of the tax increases stepwise. The assumptions concerning the increase in labour productivity also affect the results: scenarios with a low/high increase in labour productivity shows more/less positive effects on employment.
Meyer von Himmern/Kirchgässner modelled a "worst case scenario". In some of the scenarios they assumed fixed exchange rates (negative impact on export) and no full revenue recycling (negative impact on labour market and therefore on cost structure of industry). Both assumptions lead to a decrease in the competitive position of Switzerland. Further, the authors assumed a fixed production structure (constant coefficients in the input-output-table).The structural adjustment costs are, therefore, overestimated, the flexibility of the economy is underestimated.
Framework conditions:
Labour market: involuntary unemployment and reaction of trade unions are not considered explicitly
General equilibrium models
Examples:
Switzerland: ECOPLAN (see chapter 4) Other countries: Proost/Regemorter (1994, Belgium)
Switzerland: Müller (1995), Stephan/Imboden (1995), Felder/Schleiniger (1995) Other countries: Welsch/Hoster (1994, Germany)
Policy design assumptions:
ECOPLAN: Full revenue recycling to households and economy; Offsetting measures for energy intensive industries
Proost/Regemorter: revenue recycling through an in-crease in welfare payments; no offsetting measures for energy intensive industries; no stepwise intro-duction of the energy tax.
Full revenue recycling, no stepwise introduction of the tax, no offsetting measures (Müller)
Stephan/Imboden: In the international harmonisation scenario, a part of the tax revenue is shifted to fo-reign countries, the economic effects af an energy tax are, therefore, pessimistic.
Welsch/Hoster: stepwise introduction of the tax, re-venue recycling through lump sum payments to households, through increase in government expen-diture, through consolidation of government budget. The revenue recycling through a decrease in SSC has not been modelled. The employment effects are therefore small (negative).
continued
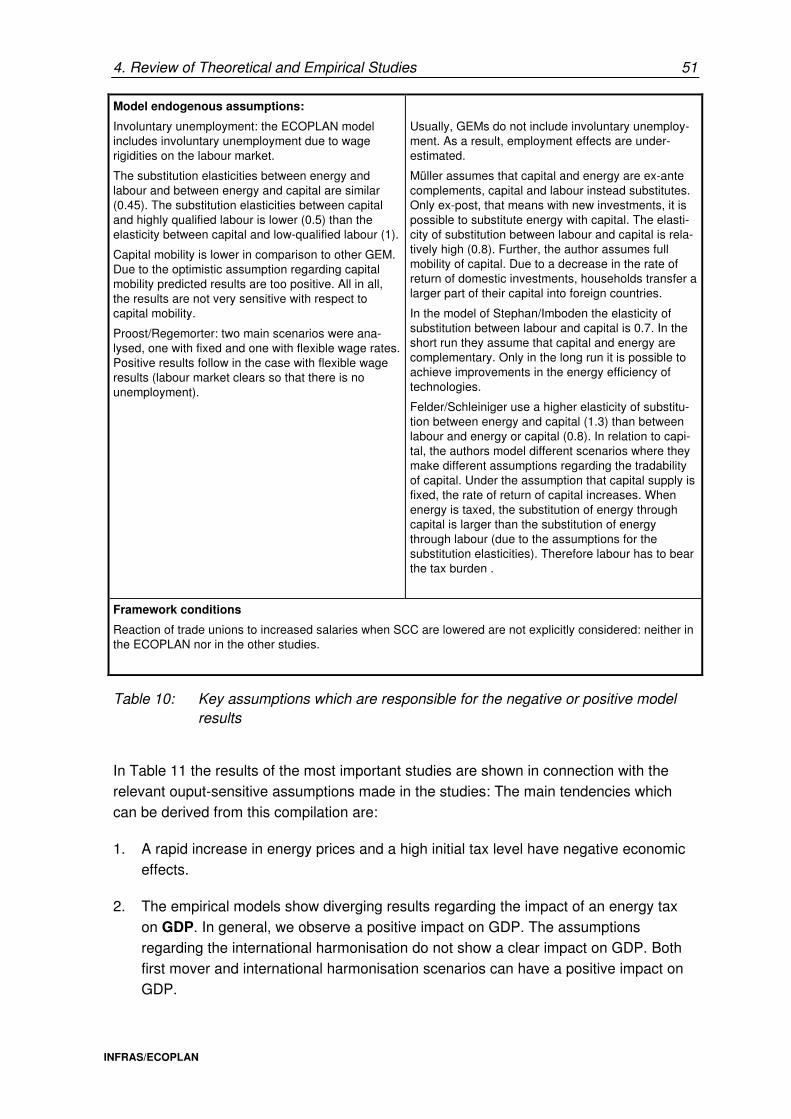
4. Review of Theoretical and Empirical Studies 51
INFRAS/ECOPLAN
Model endogenous assumptions:
Involuntary unemployment: the ECOPLAN model includes involuntary unemployment due to wage rigidities on the labour market.
The substitution elasticities between energy and labour and between energy and capital are similar (0.45). The substitution elasticities between capital and highly qualified labour is lower (0.5) than the elasticity between capital and low-qualified labour (1).
Capital mobility is lower in comparison to other GEM. Due to the optimistic assumption regarding capital mobility predicted results are too positive. All in all, the results are not very sensitive with respect to capital mobility.
Proost/Regemorter: two main scenarios were ana-lysed, one with fixed and one with flexible wage rates. Positive results follow in the case with flexible wage results (labour market clears so that there is no unemployment).
Usually, GEMs do not include involuntary unemploy-ment. As a result, employment effects are under-estimated.
Müller assumes that capital and energy are ex-ante complements, capital and labour instead substitutes. Only ex-post, that means with new investments, it is possible to substitute energy with capital. The elasti-city of substitution between labour and capital is rela-tively high (0.8). Further, the author assumes full mobility of capital. Due to a decrease in the rate of return of domestic investments, households transfer a larger part of their capital into foreign countries.
In the model of Stephan/Imboden the elasticity of substitution between labour and capital is 0.7. In the short run they assume that capital and energy are complementary. Only in the long run it is possible to achieve improvements in the energy efficiency of technologies.
Felder/Schleiniger use a higher elasticity of substitu-tion between energy and capital (1.3) than between labour and energy or capital (0.8). In relation to capi-tal, the authors model different scenarios where they make different assumptions regarding the tradability of capital. Under the assumption that capital supply is fixed, the rate of return of capital increases. When energy is taxed, the substitution of energy through capital is larger than the substitution of energy through labour (due to the assumptions for the substitution elasticities). Therefore labour has to bear the tax burden .
Framework conditions
Reaction of trade unions to increased salaries when SCC are lowered are not explicitly considered: neither in the ECOPLAN nor in the other studies.
Table 10: Key assumptions which are responsible for the negative or positive model results
In Table 11 the results of the most important studies are shown in connection with the relevant ouput-sensitive assumptions made in the studies: The main tendencies which can be derived from this compilation are:
1. A rapid increase in energy prices and a high initial tax level have negative economic effects.
2. The empirical models show diverging results regarding the impact of an energy tax on GDP. In general, we observe a positive impact on GDP. The assumptions regarding the international harmonisation do not show a clear impact on GDP. Both first mover and international harmonisation scenarios can have a positive impact on GDP.

52 4. Review of Theoretical and Empirical Studies
INFRAS/ECOPLAN
3. The revenue recycling through a reduction of SSC has positive, in the worst case no employment effects. The assumptions regarding the substitution elasticities or the labour market conditions (full employment, wage rigidities) influence mainly the re-sults. A targeted cut in SSC for low skilled labour forces has a strong positive em-ployment effect.
4. The results regarding international competitiveness are divergent. The first mover scenario tends to have negative or, in the best case, no impact on international competitiveness. In a framework of international harmonisation, the impact is less clear. The assumptions regarding the exchange rate (flexible or fixed) or the mobility of capital are crucial for the impact of an energy tax on international competitiveness.
5. It is obvious that energy consumption decreases with the introduction of an energy tax. All models show convergent results.
6. Investment is negatively affected by the energy tax.
7. The impact on inflation is in virtually all models negative (increase in price level). This effect depends mainly upon the reaction of wages. If wages increase (due, for example, to the reaction of trade unions), the effects on the price level are larger than in the case where gross labour costs decrease.
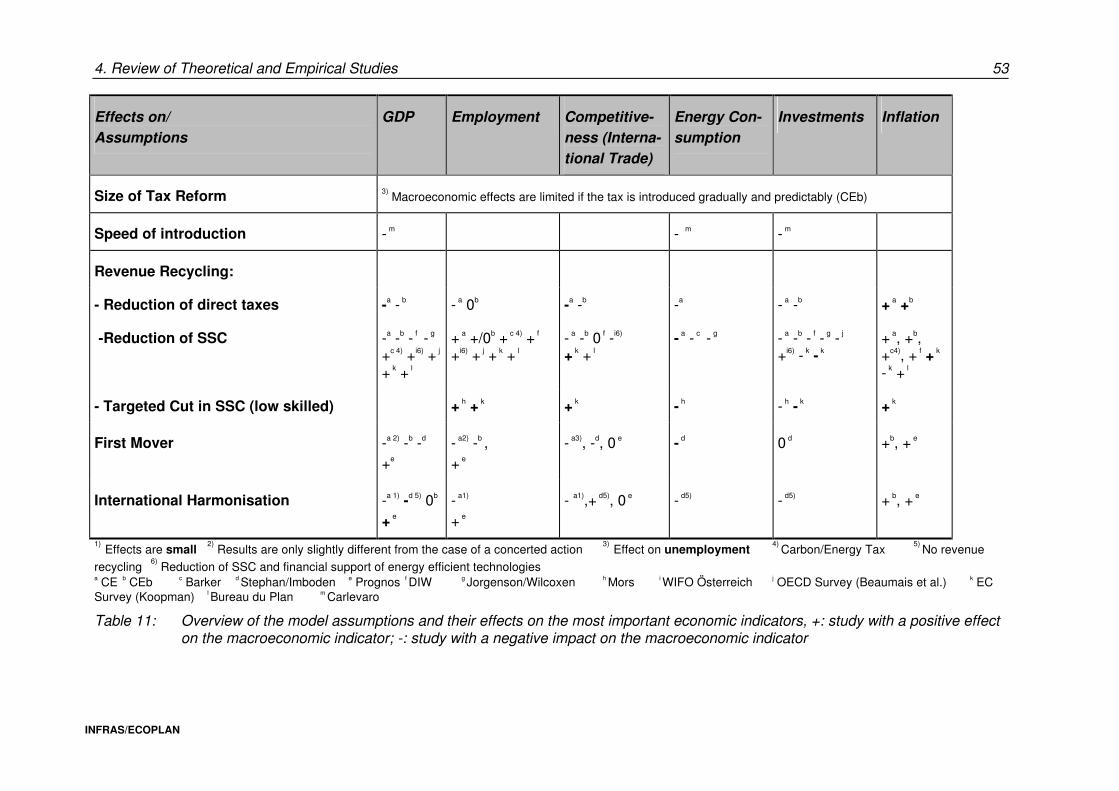
4. Review of Theoretical and Empirical Studies 53
INFRAS/ECOPLAN
Effects on/
Assumptions
GDP Employment Competitive-
ness (Interna-
tional Trade)
Energy Con-
sumption
Investments Inflation
Size of Tax Reform 3) Macroeconomic effects are limited if the tax is introduced gradually and predictably (CEb)
Speed of introduction - m - m - m
Revenue Recycling:
- Reduction of direct taxes -a - b - a 0b -a -b -a - a -b + a +b
-Reduction of SSC -a -b - f - g +c 4) +i6) + j + k + l
+ a +/0b + c 4) + f +i6) + j + k + l
- a -b 0 f -i6) + k + l
- a - c - g - a -b - f - g - j
+i6) - k - k + a, +b, +c4), + f + k - k + l
- Targeted Cut in SSC (low skilled) + h + k + k - h - h - k + k
First Mover -a 2) -b -d +e
- a2) -b , + e
- a3), -d, 0 e - d 0 d +b, + e
International Harmonisation -a 1) -d 5) 0b + e
- a1) + e
- a1),+ d5), 0 e - d5) - d5) + b, + e
1) Effects are small 2) Results are only slightly different from the case of a concerted action
3) Effect on unemployment 4)
Carbon/Energy Tax 5)
No revenue
recycling 6) Reduction of SSC and financial support of energy efficient technologies
a CE b CEb c Barker d Stephan/Imboden e Prognos f DIW g Jorgenson/Wilcoxen h Mors i WIFO Österreich j OECD Survey (Beaumais et al.) k EC Survey (Koopman) l Bureau du Plan m Carlevaro
Table 11: Overview of the model assumptions and their effects on the most important economic indicators, +: study with a positive effect on the macroeconomic indicator; -: study with a negative impact on the macroeconomic indicator

54 4. Review of Theoretical and Empirical Studies
INFRAS/ECOPLAN
Finally, the analysis of the theoretical and empirical studies allows a first sounder assess-ment of the output-sensitive assumptions. Table 12 summarizes the most relevant assumptions of the models applied and gives some comments on the expected effects on model outputs:

4. Review of Theoretical and Empirical Studies 55
INFRAS/ECOPLAN
Crucial assumptions Effects
Technological progress: Top-down models usually do not consider technologi-cal progress.
Costs of structural change are overestimated. Long run results are too pessimistic.
Economic growth: Dynamic growth effects are not considered (growth due to new products, due to a change in relative prices)
New growth theory: Investments in R&D depend on the change in relative prices. The growth effects are too small if the dynamic growth component is ne-glected.
Mobility of capital: Usually, models assume full mobility of capital.
In the short run capital is not as mobile as in the model assumed. Therefore, these models overesti-mate the negative effects of capital export.
In the long run, the positive dynamic effects due to technological development and innovation must be considered. They can slow down capital export. Innovation can improve the international competitive-ness of a country.
Labour market: CGEM do not consider unemployment, or they assume only voluntary unemployment.
Involuntary unemployment:
- Due to wage rigidities: In such a situation, employ-ment effects depend on labour demand. For small changes in the wage level the elasticity of labour supply is not relevant (as long as wages do not reach the equilibrium level).
- Due to structural unemployment
- Unemployment due to business cycle
Costs of structural change are overestimated in com-parison to a situation with involuntary unemployment.
If involuntary unemployment is integrated in the mo-dels, a reduction of SSC - and consequently a re-duction of gross wages - leads to positive employ-ment effects. The effects of a reduction of SSC on wages depend on the behaviour and influence of trade union in the wage bargaining.
Causes of structural unemployment can be partly removed through educational programmes and changes in the economic framework conditions.
A reduction of SSC is not effective in reducing un-employment due to a downward economic trend -> during an upward economic trend the reduction in SSC will be offset through wage claims.
Substitution between capital-energy-labour:
CGEM sometimes assume that substitution elastici-ties between capital and energy are larger than the substitution elasticities between the compound energy-capital and labour (p.e. Felder/Schleiniger, 1995).
International studies show that labour and materials are substitutes with a small cross-price elasticity between them. On the other hand, capital and energy are complements and jointly substitutable for labour. (Hammermesch, 1993)
Time rate of introduction of the tax:
Usually, the models tacitely assume that the tax is introduced at once (with some exceptions, as for example Carlevaro with a stepwise introduction of the tax).
The costs of structural adjustment are overestimated. Efficiency increasing investments during the normal turnover of capital are underestimated.
Offsetting measures for energy intensive industries:
Neglected in most of the models, with exception of the ECOPLAN study.
Costs of structural adjustment of energy intensive industries are overestimated.
Table 12: Crucial assumptions for the results of the theoretical and empirical studies. Generally, the assumptions lead to too pessimistic model results.

56 4. Review of Theoretical and Empirical Studies
INFRAS/ECOPLAN
In chapter 5 we will try to achieve further insights with regard to the most relevant model assumptions by carrying out a case study for Switzerland with the CGEM of ECOPLAN. The systematic sensitivity analysis made by letting assumedly relevant parameters vary will improve the understanding of output-sensitive assumptions.
5. Case Study Switzerland 57
INFRAS/ECOPLAN
5. Case study: Swiss GEM analysis
5.1. Introduction
This chapter summarizes the numerical results of the analysis of the Swiss case study. Section 5.2 shows the detailed description of the CGEM; in section 5.3 the assumed policy scenarios are presented and in section 5.4 the conceptual framework of the case study Switzerland is derived and the hypotheses for the sensitivity analysis are formu-lated. For the reference scenario (CO2 tax), the impact on the main economic indicators on the use of energy resources as well as on the CO2 emissions will be discussed in section 5.5. The objective of this chapter is to have a closer look at the robustness of the results of the model31. In section 5.5. the results of the scenario with the CO2 tax will be discussed and compared with four other existing studies on the impact of a Swiss CO2 tax. In section 5.6 we will look at the results of a thorough comparison and sensitivity analysis of the most important parameters:
• Alternative scenarios comparison: Do the results change a lot when policy para-meters are varied (e.g. another redistribution of the revenue, another tax level, other tax subjects)? In particular are looked at two alternative CO2 tax scenarios (section 5.6):
– The first scenario differs from the reference scenario by the use of the tax revenue. Instead of lowering the social security tax of both low and high skilled workers, only the tax of the low skilled workers is reduced (CO2 tax)
– The second scenario assumes policy harmonisation, i.e. that the European Union is also introducing a CO2 tax (CO2 tax)
• Model sensitivity analysis: We look at changes in the results when important para-meters of the model are altered or the structure of the production function is modified (section 5.7).
The impact of the energy tax and the sensitivity analysis for this scenario will be dealt with in section 5.9.
31 A more thorough interpretation of the impact of a combined energy CO2 tax and the Energy-Environment tax on the economy with special emphasis on distributional effects can be found in ECOPLAN (1995), „Wirtschaftliche Auswirkungen und Verteilungswirkungen verschiedener CO2 -/ Energieabgabeszenarien“ and in ECOPLAN (1996) „Wirtschaftliche Auswirkungen der Energie-Umwelt-Initiative. Komparativ statische Gleichgewichtsanalyse“.

58 5. Case Study Switzerland
INFRAS/ECOPLAN
5.2. Model description
Basic model
Our analysis of the economic and environmental effects of fiscal policies designed to reduce greenhouse gas emissions in Switzerland is based on a static large scale general equilibrium model of the Swiss economy for the year 1990. Figure 3 gives an outline of the structure of the model. The arrows indicate the financial flows between the different subjects. The width of the arrows corresponds to the absolute level of the financial flows. The following subsections give an overview of the model structure.
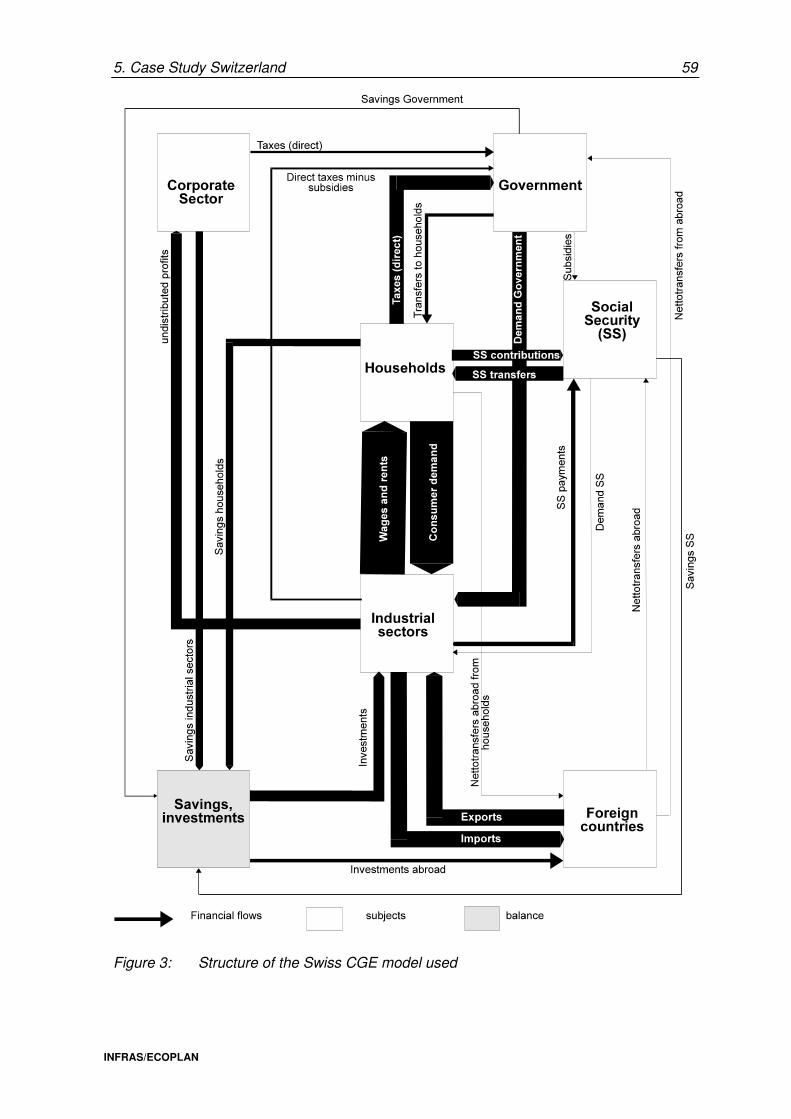
5. Case Study Switzerland 59
INFRAS/ECOPLAN
Figure 3: Structure of the Swiss CGE model used
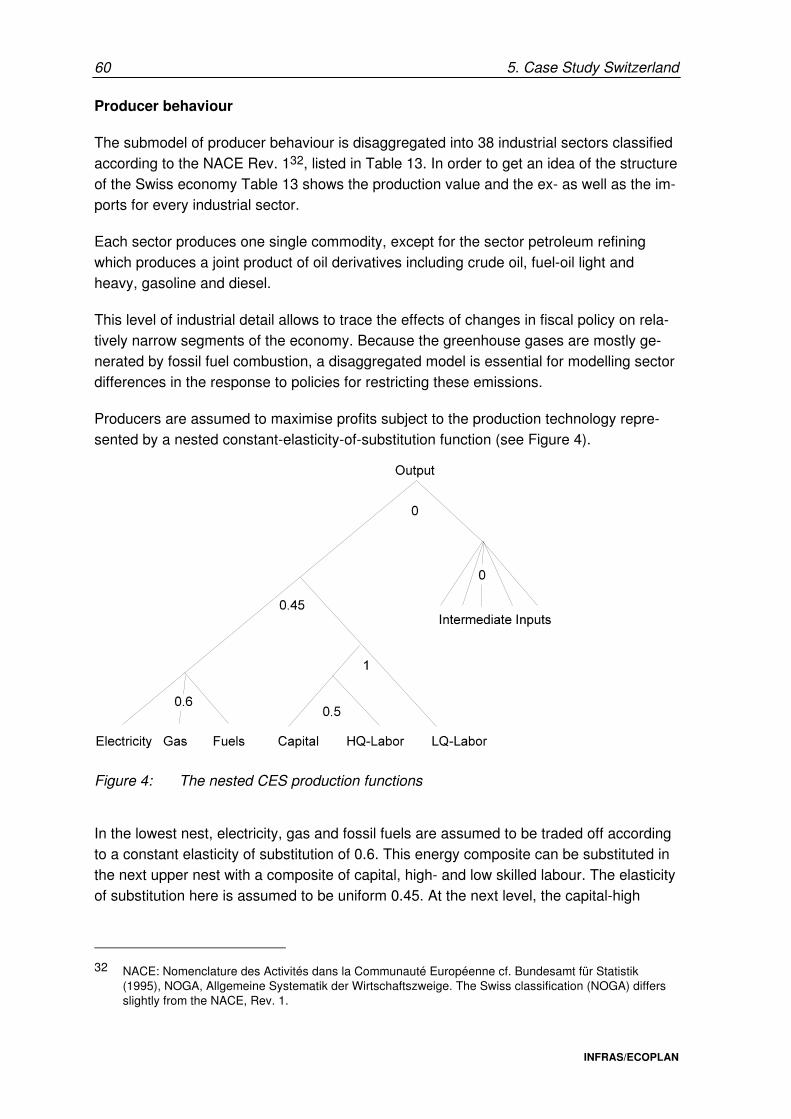
60 5. Case Study Switzerland
INFRAS/ECOPLAN
Producer behaviour
The submodel of producer behaviour is disaggregated into 38 industrial sectors classified according to the NACE Rev. 132, listed in Table 13. In order to get an idea of the structure of the Swiss economy Table 13 shows the production value and the ex- as well as the im-ports for every industrial sector.
Each sector produces one single commodity, except for the sector petroleum refining which produces a joint product of oil derivatives including crude oil, fuel-oil light and heavy, gasoline and diesel.
This level of industrial detail allows to trace the effects of changes in fiscal policy on rela-tively narrow segments of the economy. Because the greenhouse gases are mostly ge-nerated by fossil fuel combustion, a disaggregated model is essential for modelling sector differences in the response to policies for restricting these emissions.
Producers are assumed to maximise profits subject to the production technology repre-sented by a nested constant-elasticity-of-substitution function (see Figure 4).
Figure 4: The nested CES production functions
In the lowest nest, electricity, gas and fossil fuels are assumed to be traded off according to a constant elasticity of substitution of 0.6. This energy composite can be substituted in the next upper nest with a composite of capital, high- and low skilled labour. The elasticity of substitution here is assumed to be uniform 0.45. At the next level, the capital-high
32 NACE: Nomenclature des Activités dans la Communauté Européenne cf. Bundesamt für Statistik
(1995), NOGA, Allgemeine Systematik der Wirtschaftszweige. The Swiss classification (NOGA) differs slightly from the NACE, Rev. 1.

5. Case Study Switzerland 61
INFRAS/ECOPLAN
skilled composite can be traded off with low skilled labour, the elasticity of substitution having a value of 1.
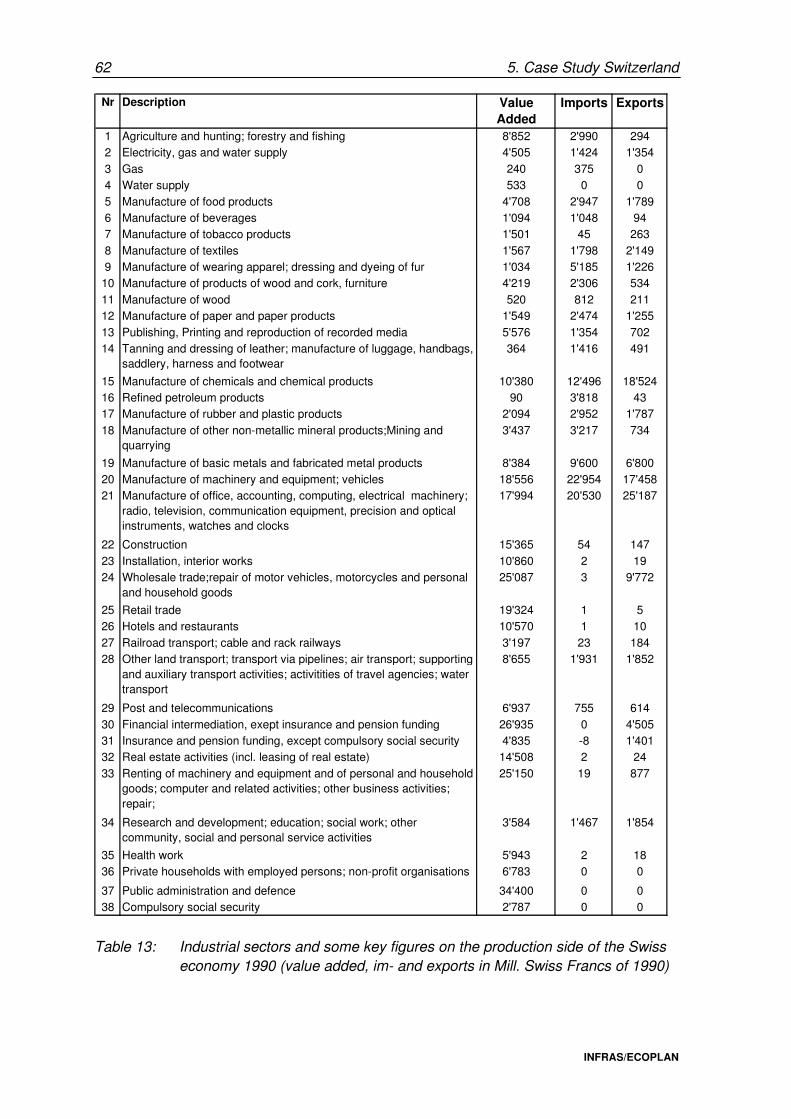
62 5. Case Study Switzerland
INFRAS/ECOPLAN
Nr Description Value Added
Imports Exports
1 Agriculture and hunting; forestry and fishing 8'852 2'990 2942 Electricity, gas and water supply 4'505 1'424 1'354
3 Gas 240 375 04 Water supply 533 0 0
5 Manufacture of food products 4'708 2'947 1'7896 Manufacture of beverages 1'094 1'048 947 Manufacture of tobacco products 1'501 45 263
8 Manufacture of textiles 1'567 1'798 2'1499 Manufacture of wearing apparel; dressing and dyeing of fur 1'034 5'185 1'22610 Manufacture of products of wood and cork, furniture 4'219 2'306 534
11 Manufacture of wood 520 812 21112 Manufacture of paper and paper products 1'549 2'474 1'255
13 Publishing, Printing and reproduction of recorded media 5'576 1'354 70214 Tanning and dressing of leather; manufacture of luggage, handbags,
saddlery, harness and footwear364 1'416 491
15 Manufacture of chemicals and chemical products 10'380 12'496 18'52416 Refined petroleum products 90 3'818 4317 Manufacture of rubber and plastic products 2'094 2'952 1'787
18 Manufacture of other non-metallic mineral products;Mining and quarrying
3'437 3'217 734
19 Manufacture of basic metals and fabricated metal products 8'384 9'600 6'80020 Manufacture of machinery and equipment; vehicles 18'556 22'954 17'45821 Manufacture of office, accounting, computing, electrical machinery;
radio, television, communication equipment, precision and optical instruments, watches and clocks
17'994 20'530 25'187
22 Construction 15'365 54 147
23 Installation, interior works 10'860 2 1924 Wholesale trade;repair of motor vehicles, motorcycles and personal
and household goods 25'087 3 9'772
25 Retail trade 19'324 1 526 Hotels and restaurants 10'570 1 10
27 Railroad transport; cable and rack railways 3'197 23 18428 Other land transport; transport via pipelines; air transport; supporting
and auxiliary transport activities; activitities of travel agencies; water transport
8'655 1'931 1'852
29 Post and telecommunications 6'937 755 614
30 Financial intermediation, exept insurance and pension funding 26'935 0 4'50531 Insurance and pension funding, except compulsory social security 4'835 -8 1'40132 Real estate activities (incl. leasing of real estate) 14'508 2 24
33 Renting of machinery and equipment and of personal and household goods; computer and related activities; other business activities; repair;
25'150 19 877
34 Research and development; education; social work; other community, social and personal service activities
3'584 1'467 1'854
35 Health work 5'943 2 1836 Private households with employed persons; non-profit organisations 6'783 0 0
37 Public administration and defence 34'400 0 038 Compulsory social security 2'787 0 0
Table 13: Industrial sectors and some key figures on the production side of the Swiss economy 1990 (value added, im- and exports in Mill. Swiss Francs of 1990)
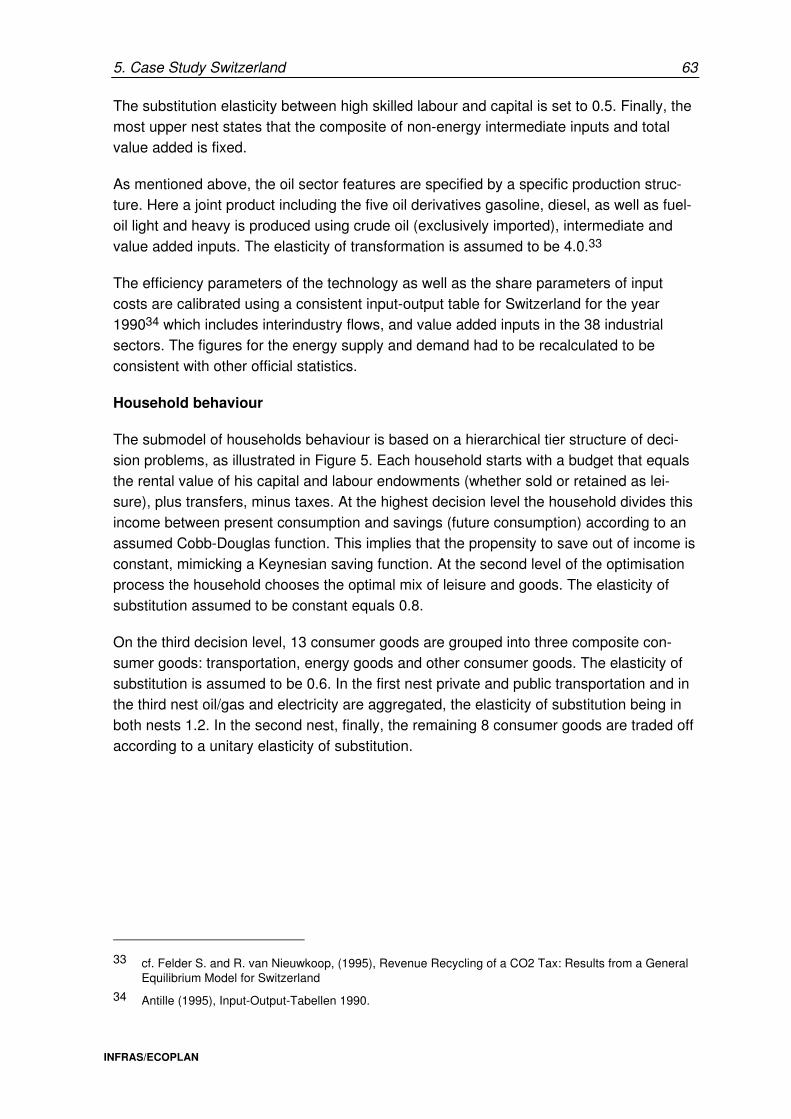
5. Case Study Switzerland 63
INFRAS/ECOPLAN
The substitution elasticity between high skilled labour and capital is set to 0.5. Finally, the most upper nest states that the composite of non-energy intermediate inputs and total value added is fixed.
As mentioned above, the oil sector features are specified by a specific production struc-ture. Here a joint product including the five oil derivatives gasoline, diesel, as well as fuel-oil light and heavy is produced using crude oil (exclusively imported), intermediate and value added inputs. The elasticity of transformation is assumed to be 4.0.33
The efficiency parameters of the technology as well as the share parameters of input costs are calibrated using a consistent input-output table for Switzerland for the year 199034 which includes interindustry flows, and value added inputs in the 38 industrial sectors. The figures for the energy supply and demand had to be recalculated to be consistent with other official statistics.
Household behaviour
The submodel of households behaviour is based on a hierarchical tier structure of deci-sion problems, as illustrated in Figure 5. Each household starts with a budget that equals the rental value of his capital and labour endowments (whether sold or retained as lei-sure), plus transfers, minus taxes. At the highest decision level the household divides this income between present consumption and savings (future consumption) according to an assumed Cobb-Douglas function. This implies that the propensity to save out of income is constant, mimicking a Keynesian saving function. At the second level of the optimisation process the household chooses the optimal mix of leisure and goods. The elasticity of substitution assumed to be constant equals 0.8.
On the third decision level, 13 consumer goods are grouped into three composite con-sumer goods: transportation, energy goods and other consumer goods. The elasticity of substitution is assumed to be 0.6. In the first nest private and public transportation and in the third nest oil/gas and electricity are aggregated, the elasticity of substitution being in both nests 1.2. In the second nest, finally, the remaining 8 consumer goods are traded off according to a unitary elasticity of substitution.
33 cf. Felder S. and R. van Nieuwkoop, (1995), Revenue Recycling of a CO2 Tax: Results from a General
Equilibrium Model for Switzerland
34 Antille (1995), Input-Output-Tabellen 1990.
64 5. Case Study Switzerland
INFRAS/ECOPLAN
Figure 5: The nested CES utility functions
For each of the 13 consumer goods a (necessary) minimal demand was estimated (we used a Stone-Geary formulation of consumer demand). With that generalisation, non-unitary income elasticities are allowed for. The 13 consumer goods are generated by 13 fixed-coefficient technologies transforming the 42 output commodities into 13 commodi-ties demanded by the three types of households.
The three household groups are differentiated according to their labour qualification and status („blue collars“, white collars“ and retired people). Since current consumption as opposed to current income is closely related to lifetime-income, expenditure data were used to determine the income stratification.
The model includes a fourth household category which is exclusively endowed with un-distributed profits. This household spends his income entirely on the purchase of invest-ment goods and paying capital taxes.
While excise taxes and tariffs are proportional, the income tax is progressive. The mar-ginal tax rate for each of the household classes was specified as a linear function of (money) income. The functional parameters (intercept and slope) were calculated using the 1990 income and tax payments of the households. The model includes an endoge-nous labour supply.
Investments
We assume that consumers buy investment goods with their savings. The saving-in-vestment good is a composite of the 38 industries output. These 38 commodities enter the composite according to a Cobb-Douglas function.
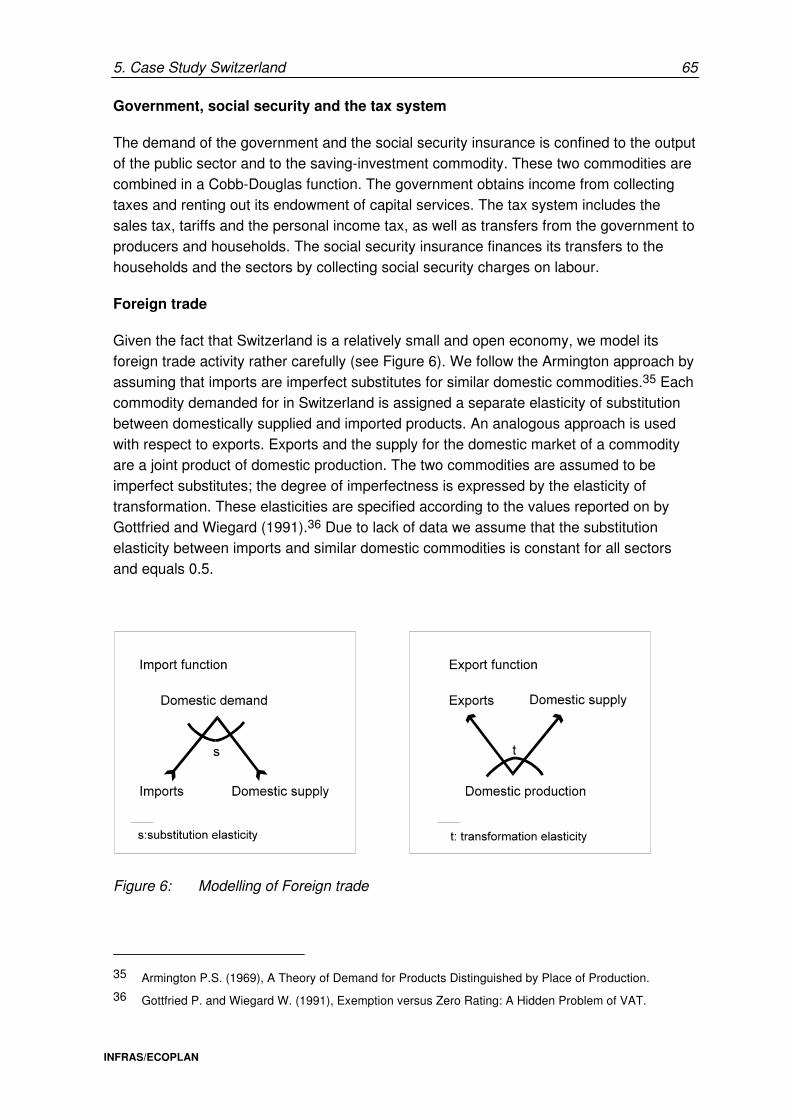
5. Case Study Switzerland 65
INFRAS/ECOPLAN
Government, social security and the tax system
The demand of the government and the social security insurance is confined to the output of the public sector and to the saving-investment commodity. These two commodities are combined in a Cobb-Douglas function. The government obtains income from collecting taxes and renting out its endowment of capital services. The tax system includes the sales tax, tariffs and the personal income tax, as well as transfers from the government to producers and households. The social security insurance finances its transfers to the households and the sectors by collecting social security charges on labour.
Foreign trade
Given the fact that Switzerland is a relatively small and open economy, we model its foreign trade activity rather carefully (see Figure 6). We follow the Armington approach by assuming that imports are imperfect substitutes for similar domestic commodities.35 Each commodity demanded for in Switzerland is assigned a separate elasticity of substitution between domestically supplied and imported products. An analogous approach is used with respect to exports. Exports and the supply for the domestic market of a commodity are a joint product of domestic production. The two commodities are assumed to be imperfect substitutes; the degree of imperfectness is expressed by the elasticity of transformation. These elasticities are specified according to the values reported on by Gottfried and Wiegard (1991).36 Due to lack of data we assume that the substitution elasticity between imports and similar domestic commodities is constant for all sectors and equals 0.5.
Figure 6: Modelling of Foreign trade
35 Armington P.S. (1969), A Theory of Demand for Products Distinguished by Place of Production.
36 Gottfried P. and Wiegard W. (1991), Exemption versus Zero Rating: A Hidden Problem of VAT.
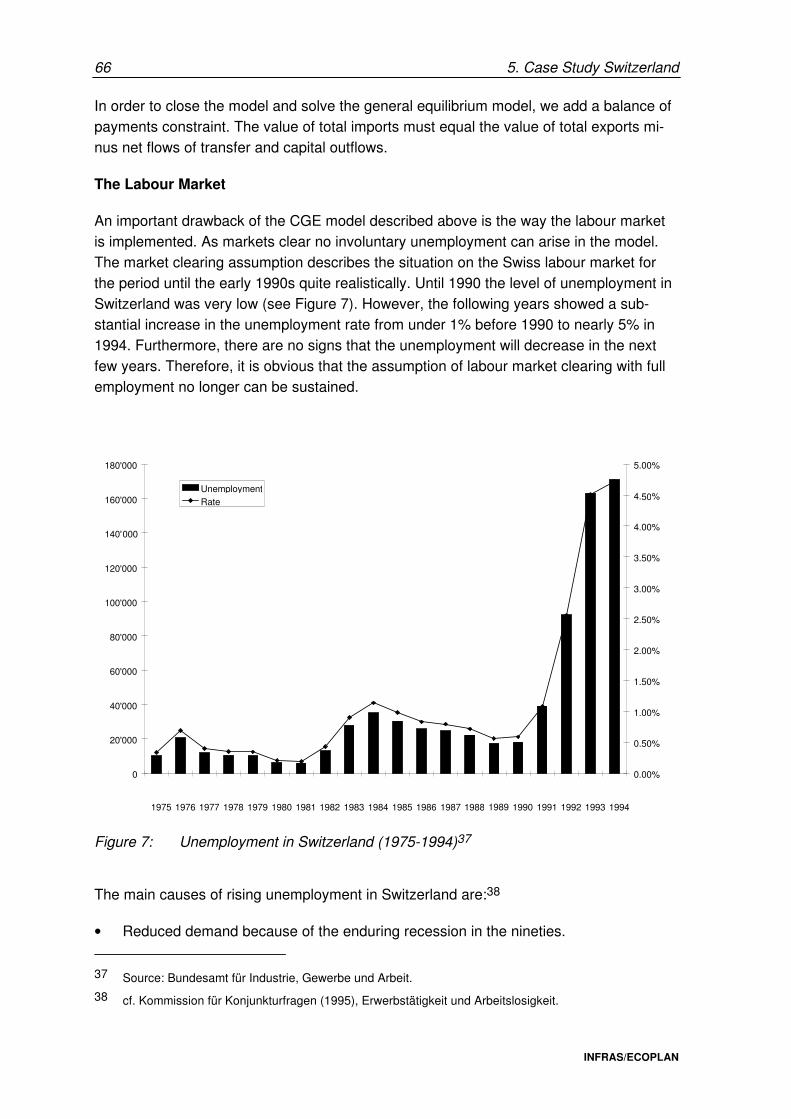
66 5. Case Study Switzerland
INFRAS/ECOPLAN
In order to close the model and solve the general equilibrium model, we add a balance of payments constraint. The value of total imports must equal the value of total exports mi-nus net flows of transfer and capital outflows.
The Labour Market
An important drawback of the CGE model described above is the way the labour market is implemented. As markets clear no involuntary unemployment can arise in the model. The market clearing assumption describes the situation on the Swiss labour market for the period until the early 1990s quite realistically. Until 1990 the level of unemployment in Switzerland was very low (see Figure 7). However, the following years showed a sub-stantial increase in the unemployment rate from under 1% before 1990 to nearly 5% in 1994. Furthermore, there are no signs that the unemployment will decrease in the next few years. Therefore, it is obvious that the assumption of labour market clearing with full employment no longer can be sustained.
0
20'000
40'000
60'000
80'000
100'000
120'000
140'000
160'000
180'000
1975 1976 1977 1978 1979 1980 1981 1982 1983 1984 1985 1986 1987 1988 1989 1990 1991 1992 1993 1994
0.00%
0.50%
1.00%
1.50%
2.00%
2.50%
3.00%
3.50%
4.00%
4.50%
5.00%
UnemploymentRate
Figure 7: Unemployment in Switzerland (1975-1994)37
The main causes of rising unemployment in Switzerland are:38
• Reduced demand because of the enduring recession in the nineties.
37 Source: Bundesamt für Industrie, Gewerbe und Arbeit.
38 cf. Kommission für Konjunkturfragen (1995), Erwerbstätigkeit und Arbeitslosigkeit.
5. Case Study Switzerland 67
INFRAS/ECOPLAN
• Foreigner policy: A big inflow of foreign workers during the economic growth period in the seventies and the beginning eighties. These foreigners got unlimited residence permits after a certain period of time and the allowance for their family to reside in Switzerland.
• Increased workforce share of women
• More people registered themselves as unemployed
• Hysteresis and negative welfare benefits effects
• Other causes.
We introduce an exogeneous markup on the wage in order to account for the unem-ployment.39 This means that unemployment in the model is not a result from the beha-viour of households and firms. This is not uncommon in CGE modelling and mostly done by introducing an exogenous wage floor. In Switzerland this is never be done until now. The level of the markup is calibrated to the 1990 level of unemployment. In order to ac-count for adjustments the mark-up is weighted by a price index. It also adjusts to changes in the social charges on labour.
The model has been implemented using MPS/GE as a GAMS subsystem.40
5.3. The policy scenarios41
Two taxes will be analysed: The first is a slightly changed version of the CO2 tax pro-posed by the Swiss Government. The second is an energy tax which resembles to a certain degree the tax proposed in the so called Energy-Environment-Initiative brought forward by a group of political organisations which will be subject to a referendum.
The CO2 tax
In the spring of 1994, the Swiss Government presented a draft law for the introduction of a CO2 tax. This proposal for a carbon tax is postponed until the year 2000.
39 In the Annex A this choice is justified by an extensive survey and analysis of possible implementations
of unemployment.
40 GAMS (General Algebraic Modeling System) is described in Brooke A. et al. (1992), GAMS A User Guide. MPS/GE stands for Mathematical Programming system for General Equilibrium Analysis developed by Rutherford. The interface between these modeling environments is described in Rutherford T.F. (1995),. The GAMS/MPSGE and GAMS/MILES User Notes.
41 Cf. ECOPLAN (1994), CO2 tax: The Swiss way of achieving consensus
68 5. Case Study Switzerland
INFRAS/ECOPLAN
The proposed CO2 tax has the following main features:
• The tax is levied on all fossil energies: petrol, diesel oil, heating oil, natural gas and coal. The fossil fuels are taxed on the basis of their carbon content. The tax will gra-dually increase to a maximum of 36 CHF (27 US$) per tonne of carbon dioxide. Table 14 and Figure 8 both show the CO2 tax rates for the different fuels and for electricity, the market prices, and the proposal of the European Union (EU). The Swiss rates are in line with the rates of the EU proposal, with the exception of electricity.
• The tax will be introduced gradually, i.e. in three stages. The starting rate will be 12 CHF (9 US$) per tonne of CO2. In the next stage the tax will be 24 CHF (18 US$) and in the third stage 36 CHF (27 US$) per tonne of CO2.
• The tax will be levied both on imported fossil fuels and domestic production.
• The following exemptions will be made:
– kerosene for international flights, due to international agreements,
– non-energy use of fossil fuels e.g. in the chemical industry
– wood and other biomass
– export of fossil fuels
• Reimbursement for energy intensive sectors
• Electricity and district heating are exempt as long as they are not produced from fossil fuels. In this context, it is worth bearing in mind that hydropower provides almost 60% of Swiss electricity, the remaining 40% being nuclear-generated.
Market price CH proposal EU proposal
CHF US$ CHF US$ CHF US$
Heating oil, extra-light (tonne) 398 302 110 83 105 80
Heating oil, medium/heavy (tonne) 236 179 114 86 117 89
Natural gas (10000 kWh) 300 227 71 54 78 59
Coal (tonne) 85 64 92.8 70 89 67
Leaded super petrol (100 l) 129 97 8.3 6 8 6
Unleaded petrol (100 l) 121 91 8.3 6 8 6
Diesel (100 l) 121 92 9.3 7 9.2 7
Hydro electricity (kWh) 140 106 0 0 4.5 3
Other electricity (kWh) 140 106 0 0 12.5 9
Table 14: The CO2 tax (36 CHF per tonne): rate per unit applicable, market price (1992-1993) and EU proposal (after six years)
In the third stage, the CO2 tax will produce revenues of about 1,400 million CHF (1060 million US$). About 100 million CHF (75 million US$) will be reimbursed to the energy
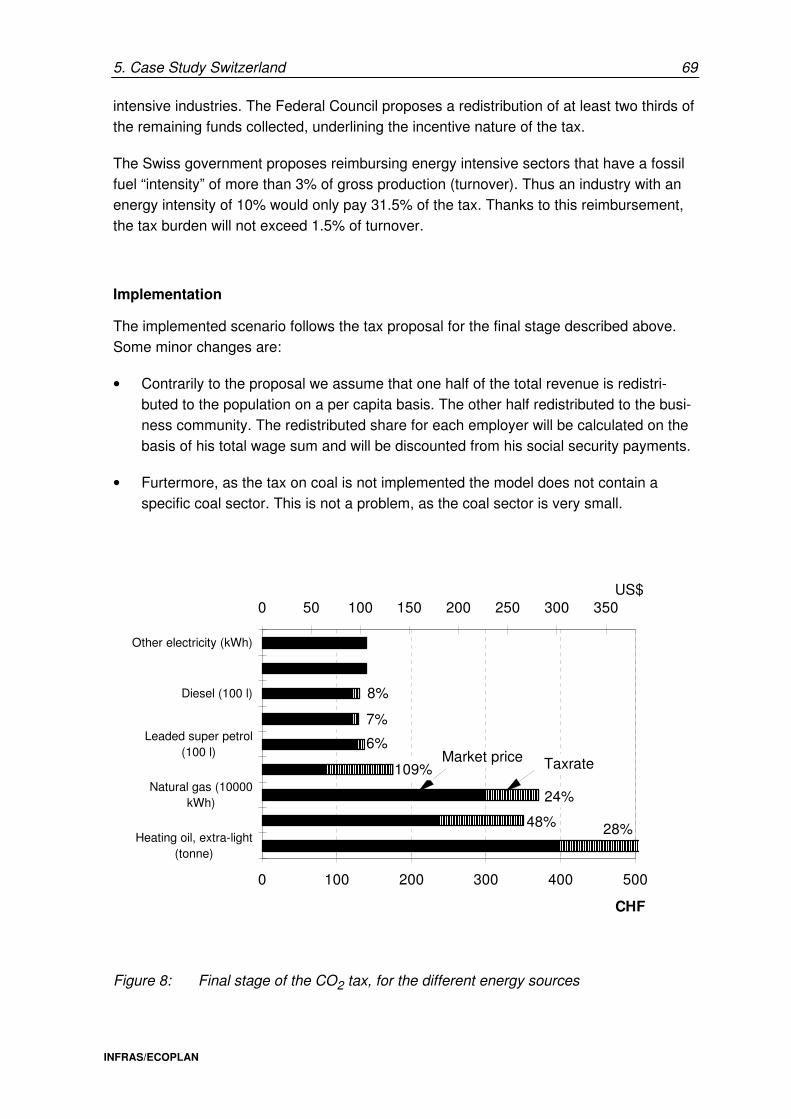
5. Case Study Switzerland 69
INFRAS/ECOPLAN
intensive industries. The Federal Council proposes a redistribution of at least two thirds of the remaining funds collected, underlining the incentive nature of the tax.
The Swiss government proposes reimbursing energy intensive sectors that have a fossil fuel “intensity” of more than 3% of gross production (turnover). Thus an industry with an energy intensity of 10% would only pay 31.5% of the tax. Thanks to this reimbursement, the tax burden will not exceed 1.5% of turnover.
Implementation
The implemented scenario follows the tax proposal for the final stage described above. Some minor changes are:
• Contrarily to the proposal we assume that one half of the total revenue is redistri-buted to the population on a per capita basis. The other half redistributed to the busi-ness community. The redistributed share for each employer will be calculated on the basis of his total wage sum and will be discounted from his social security payments.
• Furtermore, as the tax on coal is not implemented the model does not contain a specific coal sector. This is not a problem, as the coal sector is very small.
0 100 200 300 400 500
Heating oil, extra-light(tonne)
Natural gas (10000kWh)
Leaded super petrol(100 l)
Diesel (100 l)
Other electricity (kWh)
CHF
0 50 100 150 200 250 300 350US$
TaxrateMarket price
8%
7%
6%
109%
24%
48% 28%
Figure 8: Final stage of the CO2 tax, for the different energy sources
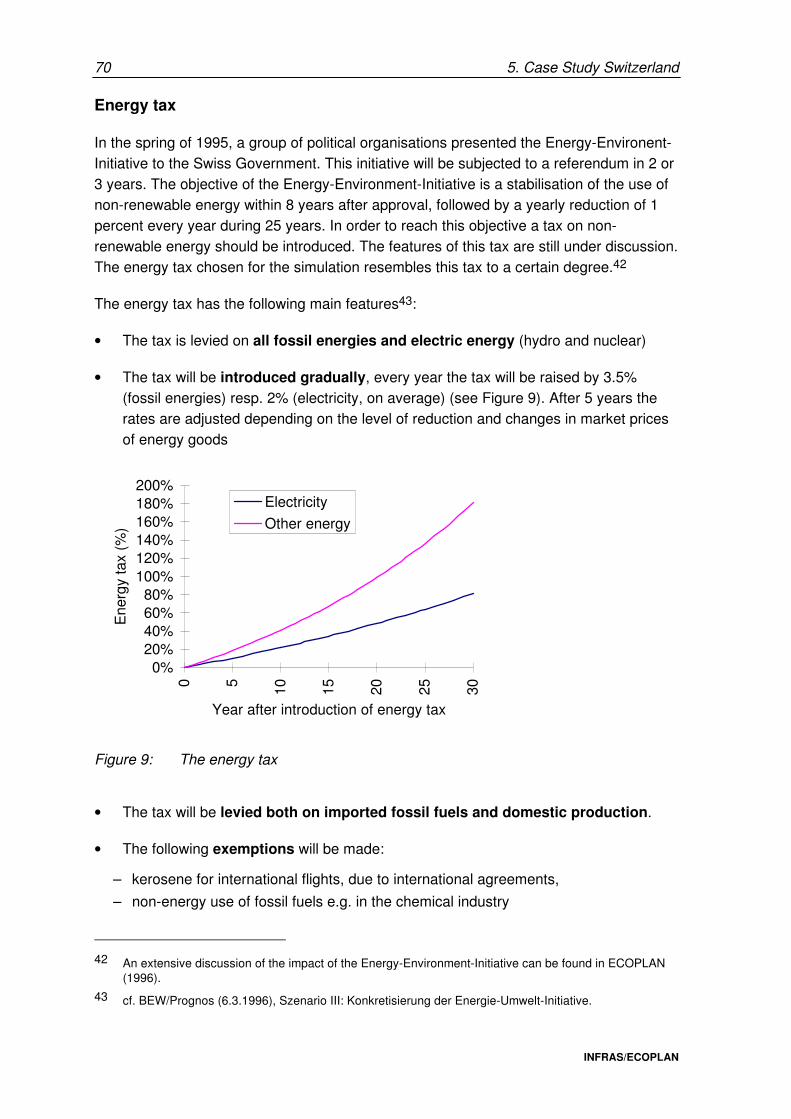
70 5. Case Study Switzerland
INFRAS/ECOPLAN
Energy tax
In the spring of 1995, a group of political organisations presented the Energy-Environent-Initiative to the Swiss Government. This initiative will be subjected to a referendum in 2 or 3 years. The objective of the Energy-Environment-Initiative is a stabilisation of the use of non-renewable energy within 8 years after approval, followed by a yearly reduction of 1 percent every year during 25 years. In order to reach this objective a tax on non-renewable energy should be introduced. The features of this tax are still under discussion. The energy tax chosen for the simulation resembles this tax to a certain degree.42
The energy tax has the following main features43:
• The tax is levied on all fossil energies and electric energy (hydro and nuclear)
• The tax will be introduced gradually, every year the tax will be raised by 3.5% (fossil energies) resp. 2% (electricity, on average) (see Figure 9). After 5 years the rates are adjusted depending on the level of reduction and changes in market prices of energy goods
0%20%40%60%80%
100%120%140%160%180%200%
0 5 10 15 20 25 30
Year after introduction of energy tax
Ene
rgy
tax
(%)
Electricity
Other energy
Figure 9: The energy tax
• The tax will be levied both on imported fossil fuels and domestic production.
• The following exemptions will be made:
– kerosene for international flights, due to international agreements,
– non-energy use of fossil fuels e.g. in the chemical industry
42 An extensive discussion of the impact of the Energy-Environment-Initiative can be found in ECOPLAN
(1996).
43 cf. BEW/Prognos (6.3.1996), Szenario III: Konkretisierung der Energie-Umwelt-Initiative.
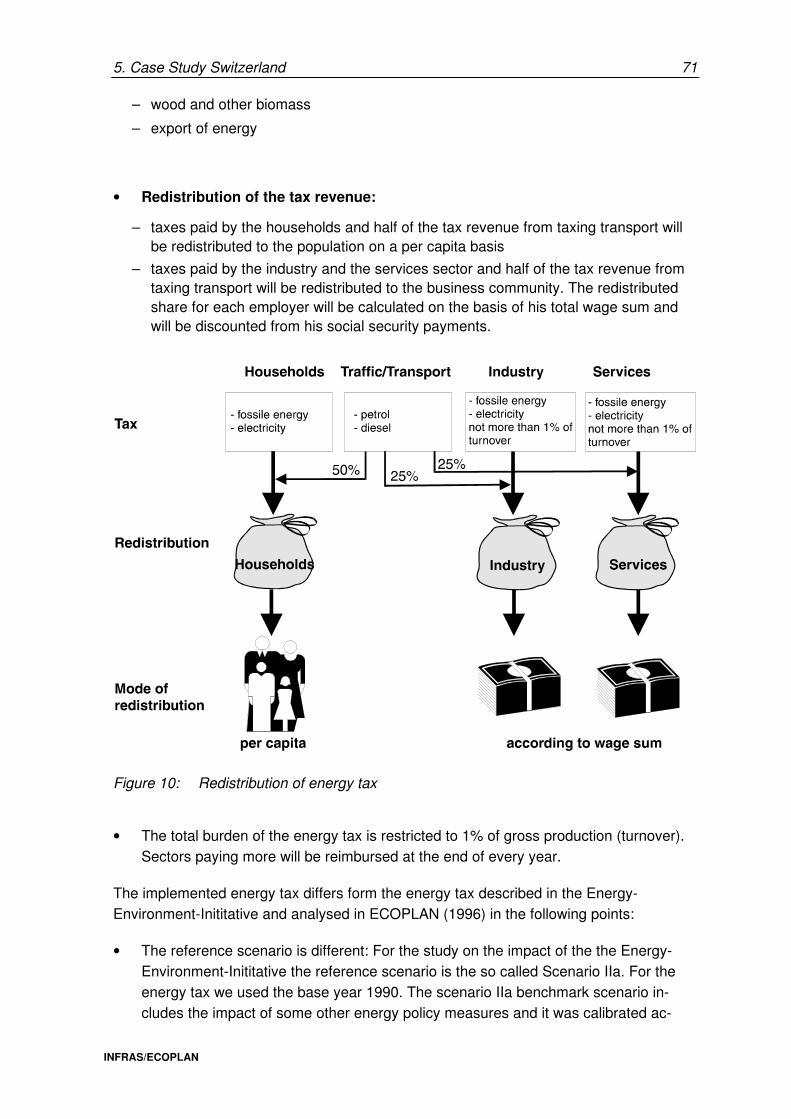
5. Case Study Switzerland 71
INFRAS/ECOPLAN
– wood and other biomass
– export of energy
• Redistribution of the tax revenue:
– taxes paid by the households and half of the tax revenue from taxing transport will be redistributed to the population on a per capita basis
– taxes paid by the industry and the services sector and half of the tax revenue from taxing transport will be redistributed to the business community. The redistributed share for each employer will be calculated on the basis of his total wage sum and will be discounted from his social security payments.
Figure 10: Redistribution of energy tax
• The total burden of the energy tax is restricted to 1% of gross production (turnover). Sectors paying more will be reimbursed at the end of every year.
The implemented energy tax differs form the energy tax described in the Energy-Environment-Inititative and analysed in ECOPLAN (1996) in the following points:
• The reference scenario is different: For the study on the impact of the the Energy-Environment-Inititative the reference scenario is the so called Scenario IIa. For the energy tax we used the base year 1990. The scenario IIa benchmark scenario in-cludes the impact of some other energy policy measures and it was calibrated ac-
72 5. Case Study Switzerland
INFRAS/ECOPLAN
cording to some bottom-up studies on the energy demand (the subsitution elasticities in the model are therefore much lower as in the 1990 benchmark scenario). This im-plies that the results will be more negative and the response of the energy demand will be greater due to the more flexible structure of the model.
• The level of the tax is different: In this study an uniformous tax for almost all the energy goods is introduced. This means, that the expected price path of the energy goods is not accounted for. This is done in ECOPLAN (1996), resulting in a non-uniformous tax.
• The excemption rule is implemented in a slightly different way. More sectors are excempted (especially the service sectors are also included).
5.4. The conceptual framework and hypotheses for the case study Switzerland
Based on the above analyses the conceptual framework for the case study Switzerland with the ECOPLAN CGEM can be derived.
The conceptual framework
The reference scenario is a moderate carbon tax of the same order of magnitude as the well known proposal of the EU for an energy/carbon tax but without charging electricy (see the preceding section):
– „CO2 tax": The design is quite similar to scenario IIb according to the "Swiss Ener-gy Perspective Studies"44, i.e. a set of regulatory measures in the different sectors (transportation, buildings, industry) and a revenue neutral carbon tax (of about 30 US$ per tonne of CO2). The carbon tax scenario is the basic scenario for the model runs.
The conceptual framework of the sensitivity analysis consists of a systematic variation of three kind of assumptions based on the results of the above presented analysis.
• Policy design assumptions: The policy scenarios are oriented along Swiss energy and GGA policies. A reference scenario and two sensitivities are implemented:
– „Targeted reduction“: Same scenario as the „Carbon tax scenario“ but instead of a general reduction of the social security contribution (SSC), we assume that the revenue of the carbon tax is used to cut the SSC of the low skilled labour.45
44 Prognos 1995
45 The practical implementation of a targeted cut in SSC is difficult.
5. Case Study Switzerland 73
INFRAS/ECOPLAN
– „Energy tax“ (see preceding section): The design of this tax is similar to the tax proposal according to the Energy-Environment-Initiative46 (energy tax with higher tax level), i.e. a dynamic (stepwise introduced) energy tax which allows to achieve the reduction target for the energy consumption of -1% per year. The revenues are used for a cut in the social security contributions (revenues stemming from the business sector) and for lump sum payments to households (revenues stemming from private households). For the energy tax proposal a separate sensitivity without tax reimbursement for the energy intensive industries will be carried out.
• Model endogenous assumptions: The following assumptions regarding the model endogenous variables are of interest for the sensitivity analysis:
– Structure of the production function (different nesting for labour)
– Level of elasticities of substitution between the input factors labour (differentiated in low and high skilled labour), capital and energy (complementary or substitutional relations between the production factors)
– International trade: Change in the level of the elasticities of transformation (or substitution) in the Armington production functions
– Labour market: Elasticities of labour supply
• Model exogenous assumptions (framework conditions):
„Harmonised scenario“: The EU introduces the carbon tax at the same time as Switzerland.
The assumptions with regard to technical progress are not varied because it would imply major modification of the model.
Hypotheses
The formulation of hypotheses with regard to the effects of the variation of certain para-meters is difficult because there are a number of countervailing effects to be considered. Furthermore an argumentation based on partial equilibrium analysis may be misleading because of such feed back effects. Nevertheless based on the literature and studies re-viewed the following hypotheses can be formulated. But we have to keep in mind that the theoretical and empirical basis of some of them may be weak:
46 The „Energy-Environment-Initiative“ („Energie-Umwelt-Initiative“) is an actual proposal of the Swiss
environment NGO’s for an ecological tax reform in Switzerland which will be subject to a referendum within the next two years. See also Annex 2 for the initiative text.
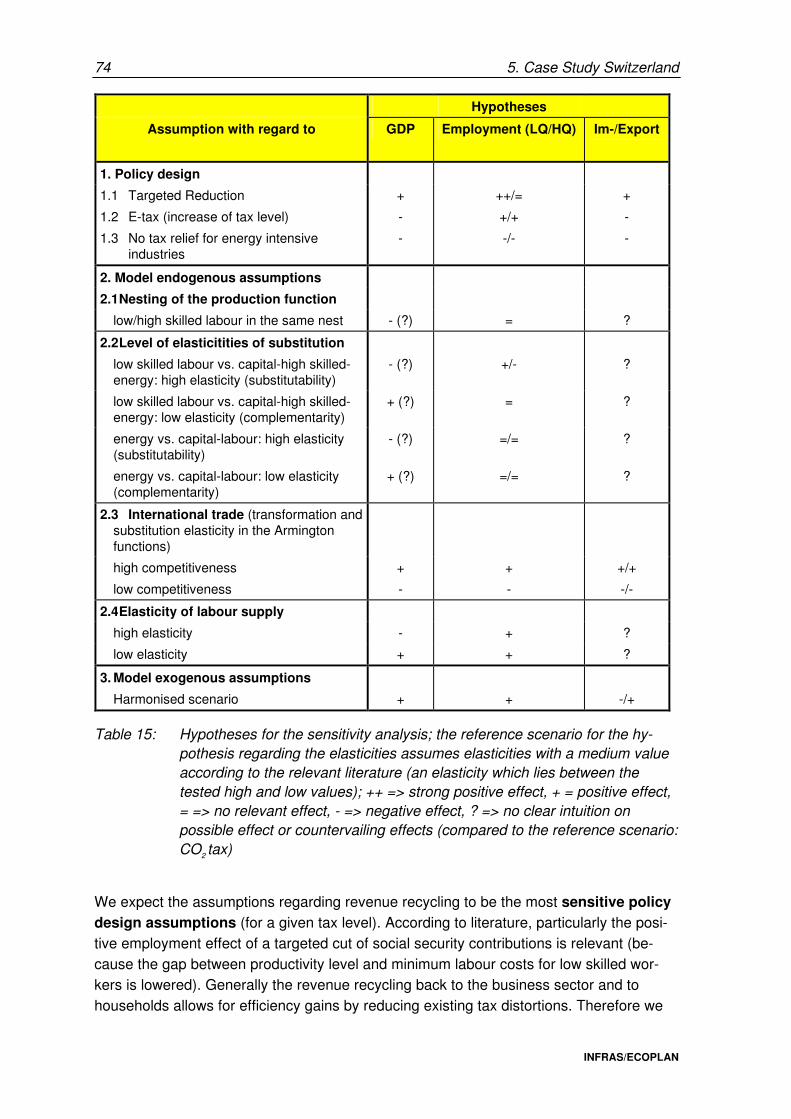
74 5. Case Study Switzerland
INFRAS/ECOPLAN
Hypotheses
Assumption with regard to GDP Employment (LQ/HQ) Im-/Export
1. Policy design
1.1 Targeted Reduction
1.2 E-tax (increase of tax level)
1.3 No tax relief for energy intensive industries
+
-
-
++/=
+/+
-/-
+
-
-
2. Model endogenous assumptions
2.1 Nesting of the production function
low/high skilled labour in the same nest - (?) = ?
2.2 Level of elasticitities of substitution
low skilled labour vs. capital-high skilled-energy: high elasticity (substitutability)
- (?) +/- ?
low skilled labour vs. capital-high skilled-energy: low elasticity (complementarity)
+ (?) = ?
energy vs. capital-labour: high elasticity (substitutability)
- (?) =/= ?
energy vs. capital-labour: low elasticity (complementarity)
+ (?) =/= ?
2.3 International trade (transformation and substitution elasticity in the Armington functions)
high competitiveness + + +/+
low competitiveness - - -/-
2.4 Elasticity of labour supply
high elasticity - + ?
low elasticity + + ?
3. Model exogenous assumptions
Harmonised scenario
+
+
-/+
Table 15: Hypotheses for the sensitivity analysis; the reference scenario for the hy-pothesis regarding the elasticities assumes elasticities with a medium value according to the relevant literature (an elasticity which lies between the tested high and low values); ++ => strong positive effect, + = positive effect, = => no relevant effect, - => negative effect, ? => no clear intuition on possible effect or countervailing effects (compared to the reference scenario: CO2 tax)
We expect the assumptions regarding revenue recycling to be the most sensitive policy design assumptions (for a given tax level). According to literature, particularly the posi-tive employment effect of a targeted cut of social security contributions is relevant (be-cause the gap between productivity level and minimum labour costs for low skilled wor-kers is lowered). Generally the revenue recycling back to the business sector and to households allows for efficiency gains by reducing existing tax distortions. Therefore we
5. Case Study Switzerland 75
INFRAS/ECOPLAN
expect an - at least slightly - positive effect on the main economic performance indicators by such a tax scheme.
According to the studies reviewed the level of substitution elasticities between the input factors are expected to be an output sensitive assumptions among the model endoge-nous assumptions. Higher elasticities reflect a more flexible economy and are therefore expected to be in line with better responses of the economy on green taxes. But there are also countervailing effects to consider (improvement of efficiency by the energy tax itself) which may be stronger in the case of complementarity. It is an open question which effect prevails.
The other key parameter among the model endogenous assumptions is presumed to be the level of the elasticity of labour supply (measures the degree of flexibility of labour supply), particularly with the chosen revenue recycling scheme which lowers the cost of labour and to a certain extent the level of wages paid. A high elasticity of labour supply means low resource constraints in the labour market and will favour positive economic effects, first of all in employment.
The effects of the different approaches for nesting the production function are not clear yet. Slightly stronger positive effects are expected for a structure whith high and low skill labour in the same nest compared to a structure with high skilled workers with capital in the same nest because the first structure reflects a slightly more flexible production struc-ture.
The assumptions regarding the elasticities in the Armington functions reflect to a certain extent the competitiveness of the economy. Favourable assumptions should imply posi-tive economic effects (GDP, employment, etc.).
5.5. Reference scenario and comparison with other Swiss studies
5.5.1. Results of the reference scenario
The basic policy scenario as described in section 5.3. can be summarised as follows:
• A CO2 tax is levied on all fossil energies and will result in a price increase that varies between 6 (gasoline) and 48 % (heating oil, medium/heavy)
• The tax will be levied both on imported fuels and domestic production
• Rebates for energy intensive sectors
• Electricity is exempted (even if fossil fuel based)
• Full recycling: All the tax revenue is redistributed to the households on a per capita basis and to the business community, helping to reduce employers’ social security payments
76 5. Case Study Switzerland
INFRAS/ECOPLAN
Before looking at the model results we will describe what a logically common sense result would be.
The targeted effect of the introduction of a CO2 tax is the reduction of the energy use in Switzerland. Households and firms shift away from the taxed energy goods which leads to substitution of production factors (e.g. labour for energy) and inter-sectoral shifts (expan-sion in labour-intensive sectors, reduction in energy intensive sectors). Labour intensity will rise. If the tax revenue is not redistributed to the economy, a drop in GDP and a decrease in employment is likely to occur.
If structural unemployment due to a downward rigidity of wages plays a role, shifting the tax burden from labour to resources will help to bridge the gap between the marginal productivity of labour and the minimum prescribed. This is expected to lead to less un-employment.
The labour supply in the model is price elastic, so the overall employment effect will de-pend on the strength of the supply effect, the wage rigidity, the substitution effect within and between the sectors, and to the extent to which the economic activity de- or in-creases. It is also possible to shift the tax burden away to abroad. This can bring about a terms of trade advantage and also a loss in market share. The overall effect is not obvious.
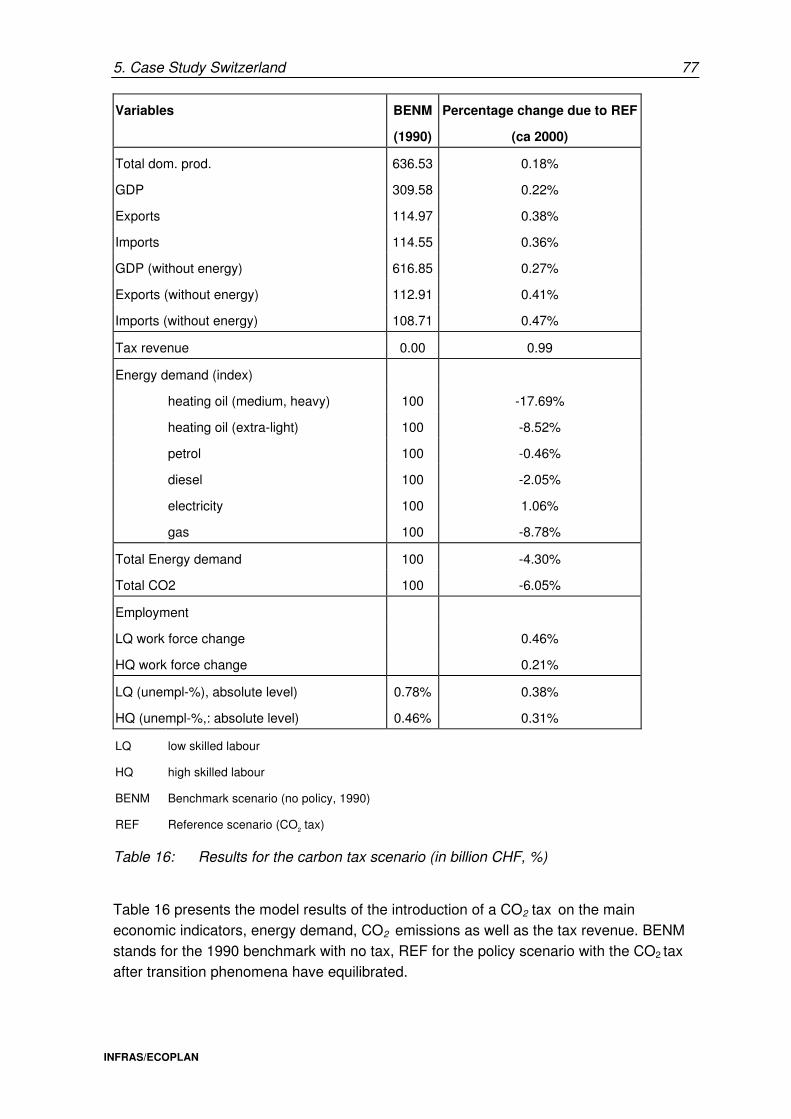
5. Case Study Switzerland 77
INFRAS/ECOPLAN
Variables BENM
(1990)
Percentage change due to REF
(ca 2000)
Total dom. prod. 636.53 0.18%
GDP 309.58 0.22%
Exports 114.97 0.38%
Imports 114.55 0.36%
GDP (without energy) 616.85 0.27%
Exports (without energy) 112.91 0.41%
Imports (without energy) 108.71 0.47%
Tax revenue 0.00 0.99
Energy demand (index)
heating oil (medium, heavy) 100 -17.69%
heating oil (extra-light) 100 -8.52%
petrol 100 -0.46%
diesel 100 -2.05%
electricity 100 1.06%
gas 100 -8.78%
Total Energy demand 100 -4.30%
Total CO2 100 -6.05%
Employment
LQ work force change 0.46%
HQ work force change 0.21%
LQ (unempl-%), absolute level) 0.78% 0.38%
HQ (unempl-%,: absolute level) 0.46% 0.31%
LQ low skilled labour
HQ high skilled labour
BENM Benchmark scenario (no policy, 1990)
REF Reference scenario (CO2 tax)
Table 16: Results for the carbon tax scenario (in billion CHF, %)
Table 16 presents the model results of the introduction of a CO2 tax on the main economic indicators, energy demand, CO2 emissions as well as the tax revenue. BENM stands for the 1990 benchmark with no tax, REF for the policy scenario with the CO2 tax after transition phenomena have equilibrated.
78 5. Case Study Switzerland
INFRAS/ECOPLAN
Throughout this chapter total domestic production, exports and imports as well as the energy demand in the counterfactual scenarios are expressed as a percentage change in the level compared to the benchmark scenario. The tax revenue is expressed in billion Swiss francs (price level 1990).
Remarks
• As Table 16 clearly demonstrates, the introduction of a CO2 tax has a small positive impact on the main economic indicators. The energy demand is, however, strongly regressing, as per objective.
• GDP as well as total domestic production increases. The total domestic production increases even more when the reduction in the energy sectors is not accounted for. The growth in total domestic production without energy is, however, smaller than the growth in GDP. The difference can be explained by the following effects of the imple-mented scenario:
− The CO2 tax raises the prices of the intermediate energy goods and thereby the price of the produced goods. This can lead to a decrease of the demand for intermediate goods used in the domestic production
− The cut in social security contributions and the raise in energy prices make the use of labour and capital more attractive. As labour supply is partly elastic and there is unem-ployment more labour is used leading to a growth in GDP.
• Total imports and exports show a small increase. The CO2 tax leads to an increase of imported non-energy goods47 and a reduction of the energy imports. The exports rise partly because due to the increase in the domestic production.
• Tax revenue: The revenue from the CO2 tax amounts to 1 Billion Swiss francs. This is less than the estimates of the Swiss government (1.4 Billion Swiss francs).48 The difference is a result of the neglected coal tax and of the incorporated feedbacks in the model leading to a reduction of the total energy demand and therefore to a smaller tax revenue.
• The demand for energy decreases, except electricity which is not taxed. The reduc-tion in CO2 emissions is higher because of the substitution away from energy goods with high CO2-emissions coefficients.
• Employment: The double dividend hypothesis holds as there is a (small) positive im-pact of the CO2 tax on employment: the overall supply with high and low skilled labour rises. This positive employment effect is mainly the result of a more favourable
47 In fact these import products contain non taxed „grey“ energy from production abroad, an effect
neglected in the energy balance.
48 EDI (1994), CO2-Abgabe auf fossilen Energieträgern, p.25.
5. Case Study Switzerland 79
INFRAS/ECOPLAN
relative price structure for labour resulting in a growth in the labour force itself (more people are willing to work due to an increase in the demand for labour because of the reduced labour costs) and a reduction in the unemployment rate. The differences between the two labour groups cannot easily be explained as the impact depends on the relative share of low and high skilled labour use in a sector and the effect on the structure of the economy. Some low (high) skilled labour intensive sectors gain, other loose.
Impact on the sectoral level
The CO2 tax has a negligible effect on most of the sectors. Changes in both directions (growth, decline) do not exceed the 1% level. Only the manufacture of paper and paper products as well as the manufacture of non-metallic products show a decline in the do-mestic production and exports that exceeds the 1%. This decline is countered by a rise of the imports in both sectors.
Main conclusion
The introduction of a CO2 tax has a small positive effect on the Swiss economy as a whole. GDP and unemployment are positively affected. The impact on the structure of the Swiss industry, the exports and imports is negligible for almost all sectors. In small segments of energy intensive industries negative impacts on competitiveness occur; how-ever, these are more than compensated by gains in other sectors.
5.5.2. Comparison with other Swiss studies
The results of the reference scenario are compared to four other Swiss studies listed in Table 17.
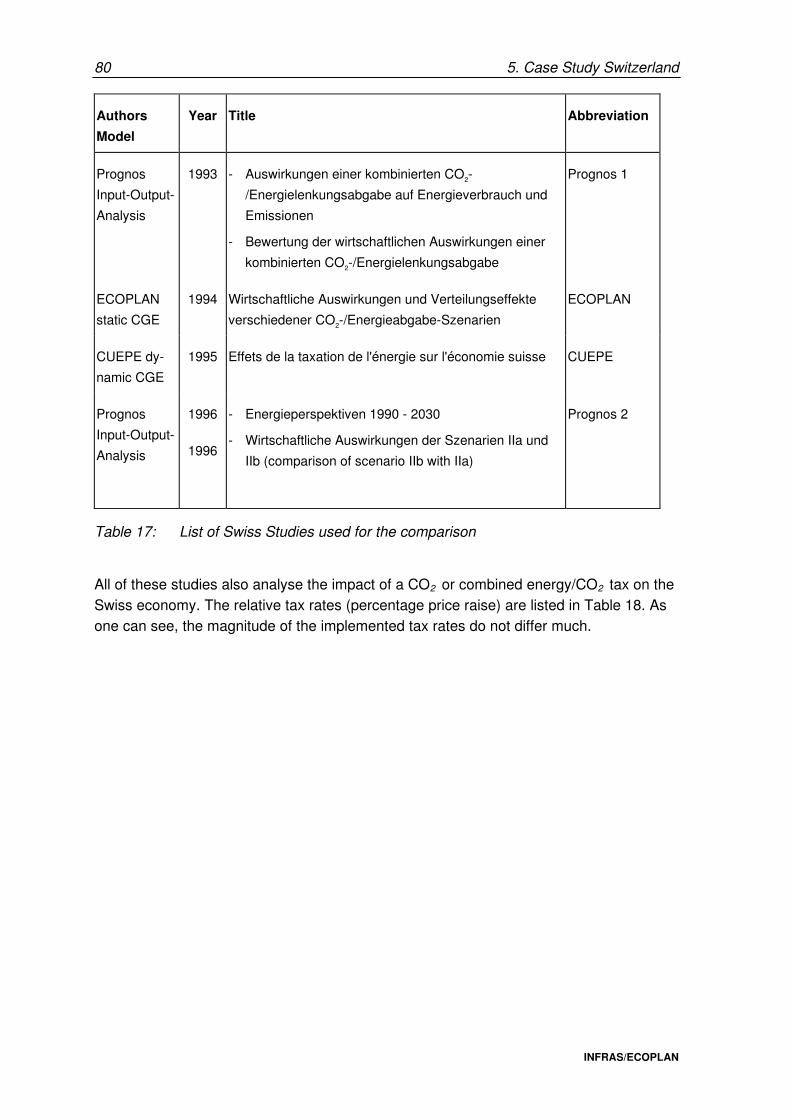
80 5. Case Study Switzerland
INFRAS/ECOPLAN
Authors
Model
Year Title Abbreviation
Prognos
Input-Output-
Analysis
1993 - Auswirkungen einer kombinierten CO2-
/Energielenkungsabgabe auf Energieverbrauch und
Emissionen
- Bewertung der wirtschaftlichen Auswirkungen einer
kombinierten CO2-/Energielenkungsabgabe
Prognos 1
ECOPLAN
static CGE
1994 Wirtschaftliche Auswirkungen und Verteilungseffekte
verschiedener CO2-/Energieabgabe-Szenarien
ECOPLAN
CUEPE dy-
namic CGE
1995 Effets de la taxation de l'énergie sur l'économie suisse CUEPE
Prognos
Input-Output-
Analysis
1996
1996
- Energieperspektiven 1990 - 2030
- Wirtschaftliche Auswirkungen der Szenarien IIa und
IIb (comparison of scenario IIb with IIa)
Prognos 2
Table 17: List of Swiss Studies used for the comparison
All of these studies also analyse the impact of a CO2 or combined energy/CO2 tax on the Swiss economy. The relative tax rates (percentage price raise) are listed in Table 18. As one can see, the magnitude of the implemented tax rates do not differ much.
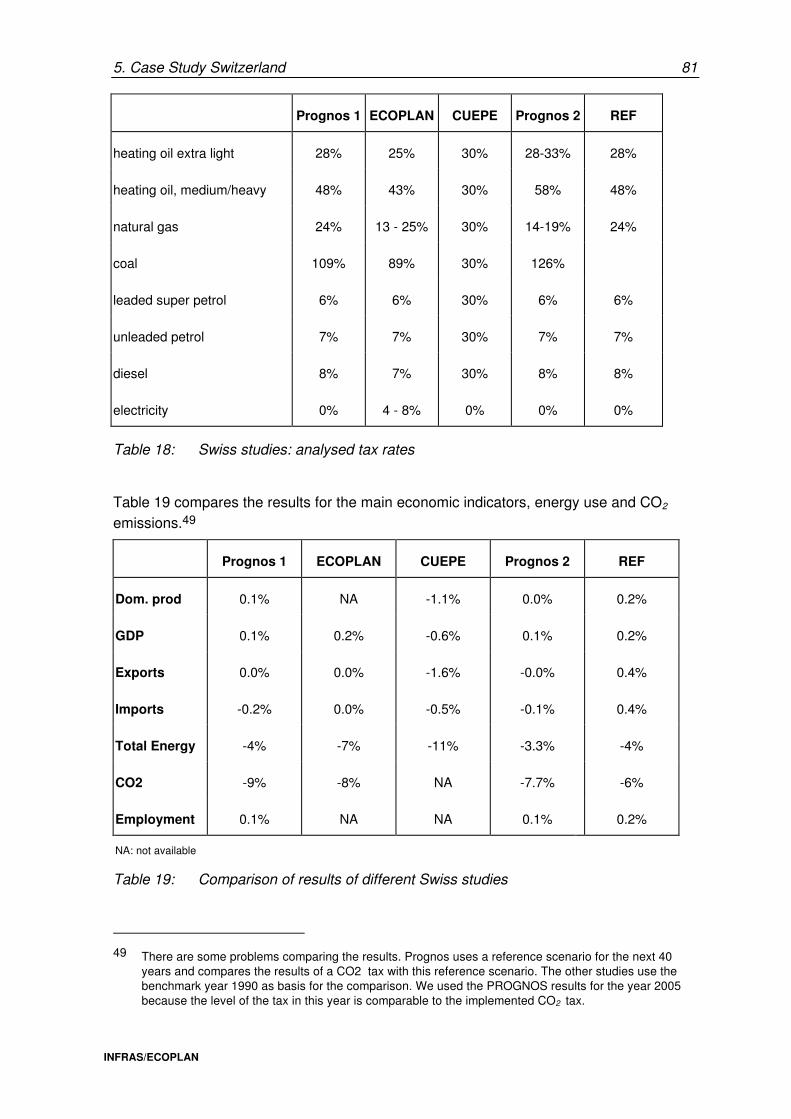
5. Case Study Switzerland 81
INFRAS/ECOPLAN
Prognos 1 ECOPLAN CUEPE Prognos 2 REF
heating oil extra light 28% 25% 30% 28-33% 28%
heating oil, medium/heavy 48% 43% 30% 58% 48%
natural gas 24% 13 - 25% 30% 14-19% 24%
coal 109% 89% 30% 126%
leaded super petrol 6% 6% 30% 6% 6%
unleaded petrol 7% 7% 30% 7% 7%
diesel 8% 7% 30% 8% 8%
electricity 0% 4 - 8% 0% 0% 0%
Table 18: Swiss studies: analysed tax rates
Table 19 compares the results for the main economic indicators, energy use and CO2 emissions.49
Prognos 1 ECOPLAN CUEPE Prognos 2 REF
Dom. prod 0.1% NA -1.1% 0.0% 0.2%
GDP 0.1% 0.2% -0.6% 0.1% 0.2%
Exports 0.0% 0.0% -1.6% -0.0% 0.4%
Imports -0.2% 0.0% -0.5% -0.1% 0.4%
Total Energy -4% -7% -11% -3.3% -4%
CO2 -9% -8% NA -7.7% -6%
Employment 0.1% NA NA 0.1% 0.2%
NA: not available
Table 19: Comparison of results of different Swiss studies
49 There are some problems comparing the results. Prognos uses a reference scenario for the next 40
years and compares the results of a CO2 tax with this reference scenario. The other studies use the benchmark year 1990 as basis for the comparison. We used the PROGNOS results for the year 2005 because the level of the tax in this year is comparable to the implemented CO2 tax.
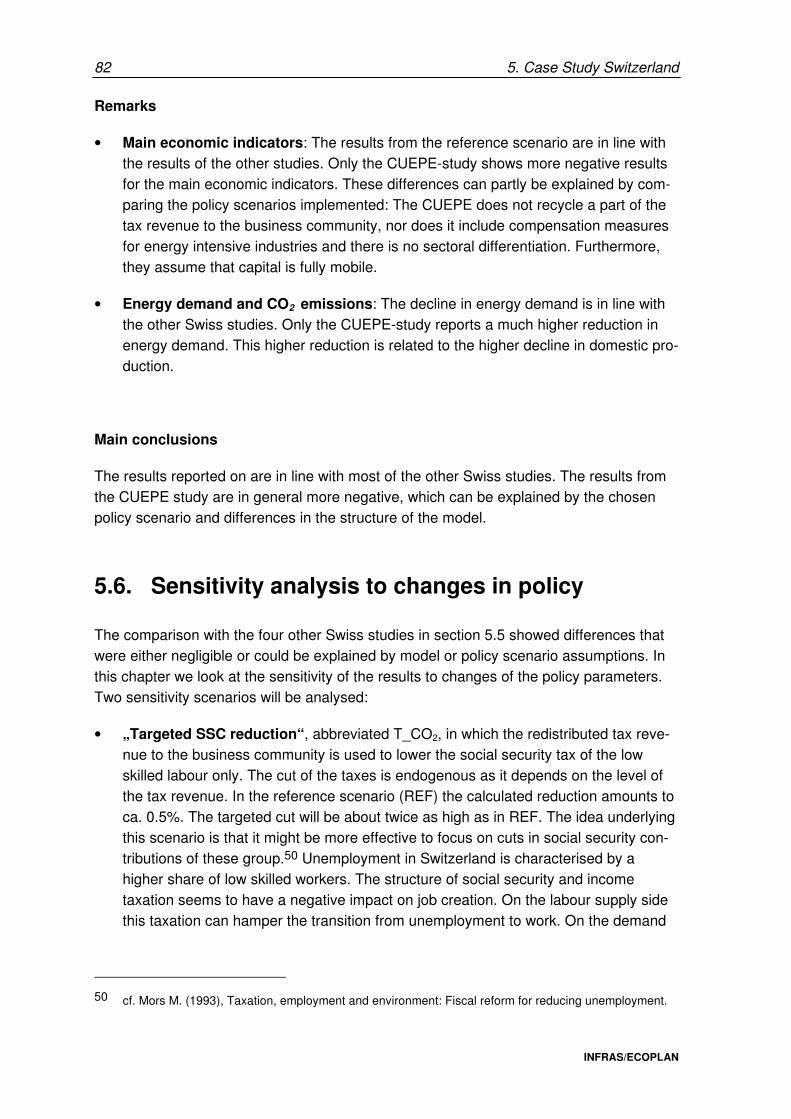
82 5. Case Study Switzerland
INFRAS/ECOPLAN
Remarks
• Main economic indicators: The results from the reference scenario are in line with the results of the other studies. Only the CUEPE-study shows more negative results for the main economic indicators. These differences can partly be explained by com-paring the policy scenarios implemented: The CUEPE does not recycle a part of the tax revenue to the business community, nor does it include compensation measures for energy intensive industries and there is no sectoral differentiation. Furthermore, they assume that capital is fully mobile.
• Energy demand and CO2 emissions: The decline in energy demand is in line with the other Swiss studies. Only the CUEPE-study reports a much higher reduction in energy demand. This higher reduction is related to the higher decline in domestic pro-duction.
Main conclusions
The results reported on are in line with most of the other Swiss studies. The results from the CUEPE study are in general more negative, which can be explained by the chosen policy scenario and differences in the structure of the model.
5.6. Sensitivity analysis to changes in policy
The comparison with the four other Swiss studies in section 5.5 showed differences that were either negligible or could be explained by model or policy scenario assumptions. In this chapter we look at the sensitivity of the results to changes of the policy parameters. Two sensitivity scenarios will be analysed:
• „Targeted SSC reduction“, abbreviated T_CO2, in which the redistributed tax reve-nue to the business community is used to lower the social security tax of the low skilled labour only. The cut of the taxes is endogenous as it depends on the level of the tax revenue. In the reference scenario (REF) the calculated reduction amounts to ca. 0.5%. The targeted cut will be about twice as high as in REF. The idea underlying this scenario is that it might be more effective to focus on cuts in social security con-tributions of these group.50 Unemployment in Switzerland is characterised by a higher share of low skilled workers. The structure of social security and income taxation seems to have a negative impact on job creation. On the labour supply side this taxation can hamper the transition from unemployment to work. On the demand
50 cf. Mors M. (1993), Taxation, employment and environment: Fiscal reform for reducing unemployment.
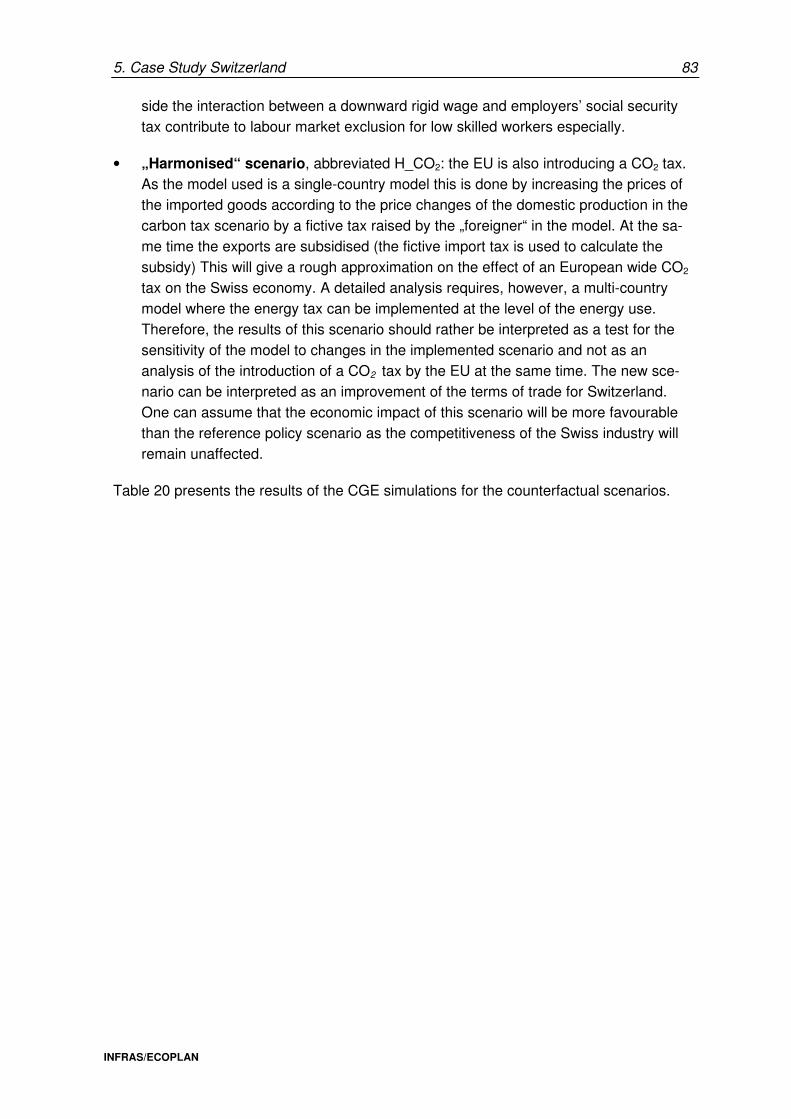
5. Case Study Switzerland 83
INFRAS/ECOPLAN
side the interaction between a downward rigid wage and employers’ social security tax contribute to labour market exclusion for low skilled workers especially.
• „Harmonised“ scenario, abbreviated H_CO2: the EU is also introducing a CO2 tax. As the model used is a single-country model this is done by increasing the prices of the imported goods according to the price changes of the domestic production in the carbon tax scenario by a fictive tax raised by the „foreigner“ in the model. At the sa-me time the exports are subsidised (the fictive import tax is used to calculate the subsidy) This will give a rough approximation on the effect of an European wide CO2 tax on the Swiss economy. A detailed analysis requires, however, a multi-country model where the energy tax can be implemented at the level of the energy use. Therefore, the results of this scenario should rather be interpreted as a test for the sensitivity of the model to changes in the implemented scenario and not as an analysis of the introduction of a CO2 tax by the EU at the same time. The new sce-nario can be interpreted as an improvement of the terms of trade for Switzerland. One can assume that the economic impact of this scenario will be more favourable than the reference policy scenario as the competitiveness of the Swiss industry will remain unaffected.
Table 20 presents the results of the CGE simulations for the counterfactual scenarios.
84 5. Case Study Switzerland
INFRAS/ECOPLAN
Variables BENM REF T_CO2 H_CO2
Total dom. prod. 636.53 0.18% 0.29% 0.20%
GDP 309.58 0.22% 0.35% 0.25%
Exports 114.97 0.38% 0.45% 0.42%
Imports 114.55 0.36% 0.43% 0.41%
GDP (without energy) 616.85 0.27% 0.39% 0.29%
Exports (without energy) 112.91 0.41% 0.48% 0.45%
Imports (without energy) 108.71 0.47% 0.54% 0.55%
Tax revenue 0.00 0.99 0.99 0.99
Energy demand (index)
heating oil (medium, heavy) 100 -17.69% -17.48% -17.20%
heating oil (extra-light) 100 -8.52% -8.46% -8.09%
petrol 100 -0.46% -0.28% -0.16%
diesel 100 -2.05% -1.94% -2.01%
electricity 100 1.06% 1.08% 1.24%
gas 100 -8.78% -8.72% -8.65%
Total Energy demand 100 -4.30% -4.23% -4.08%
Total CO2 100 -6.05% -5.94% -5.72%
Employment
LQ work force change 0.46% 0.82% 0.54%
HQ work force change 0.21% 0.23% 0.21%
LQ (unempl-%, absolute level) 0.78% 0.38% 0.86% 0.30%
HQ (unempl-%, absolute level) 0.46% 0.31% 0.28% 0.32%
LQ low skilled labour T_CO2 Targeted reduction
HQ high skilled labour H_CO2 Harmonised scenario
BENM Benchmark scenario (no policy, 1990)
REF Reference scenario (CO2 tax)
Table 20: Results for the counterfactual policy scenarios (in billion CHF, %)
Remarks
• Domestic production and GDP: the more positive impact on domestic production and GDP in the scenario with the reduction of the social contributions targeted to low skill workers can be explained by the increased supply of low skilled labour due to the fall in the relative employer’s price of this factor. The „harmonised“ scenario seems to have only a slightly more positive impact on GDP as the reference scenario.
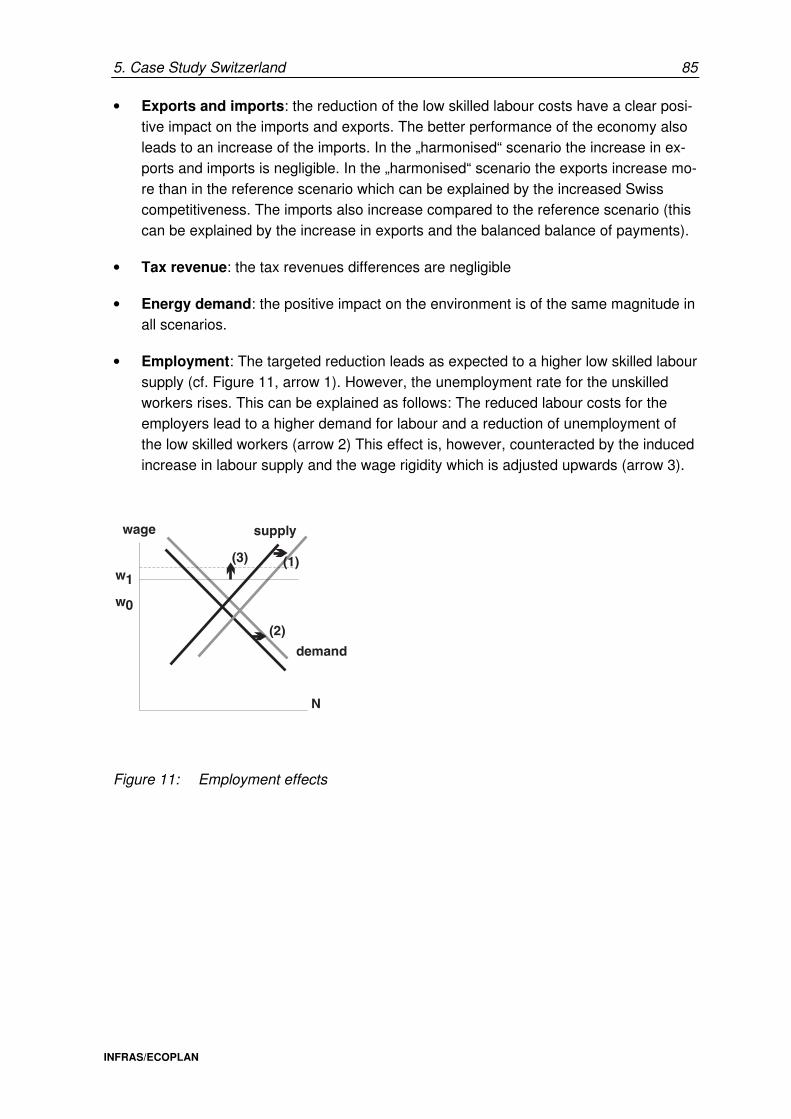
5. Case Study Switzerland 85
INFRAS/ECOPLAN
• Exports and imports: the reduction of the low skilled labour costs have a clear posi-tive impact on the imports and exports. The better performance of the economy also leads to an increase of the imports. In the „harmonised“ scenario the increase in ex-ports and imports is negligible. In the „harmonised“ scenario the exports increase mo-re than in the reference scenario which can be explained by the increased Swiss competitiveness. The imports also increase compared to the reference scenario (this can be explained by the increase in exports and the balanced balance of payments).
• Tax revenue: the tax revenues differences are negligible
• Energy demand: the positive impact on the environment is of the same magnitude in all scenarios.
• Employment: The targeted reduction leads as expected to a higher low skilled labour supply (cf. Figure 11, arrow 1). However, the unemployment rate for the unskilled workers rises. This can be explained as follows: The reduced labour costs for the employers lead to a higher demand for labour and a reduction of unemployment of the low skilled workers (arrow 2) This effect is, however, counteracted by the induced increase in labour supply and the wage rigidity which is adjusted upwards (arrow 3).
Figure 11: Employment effects
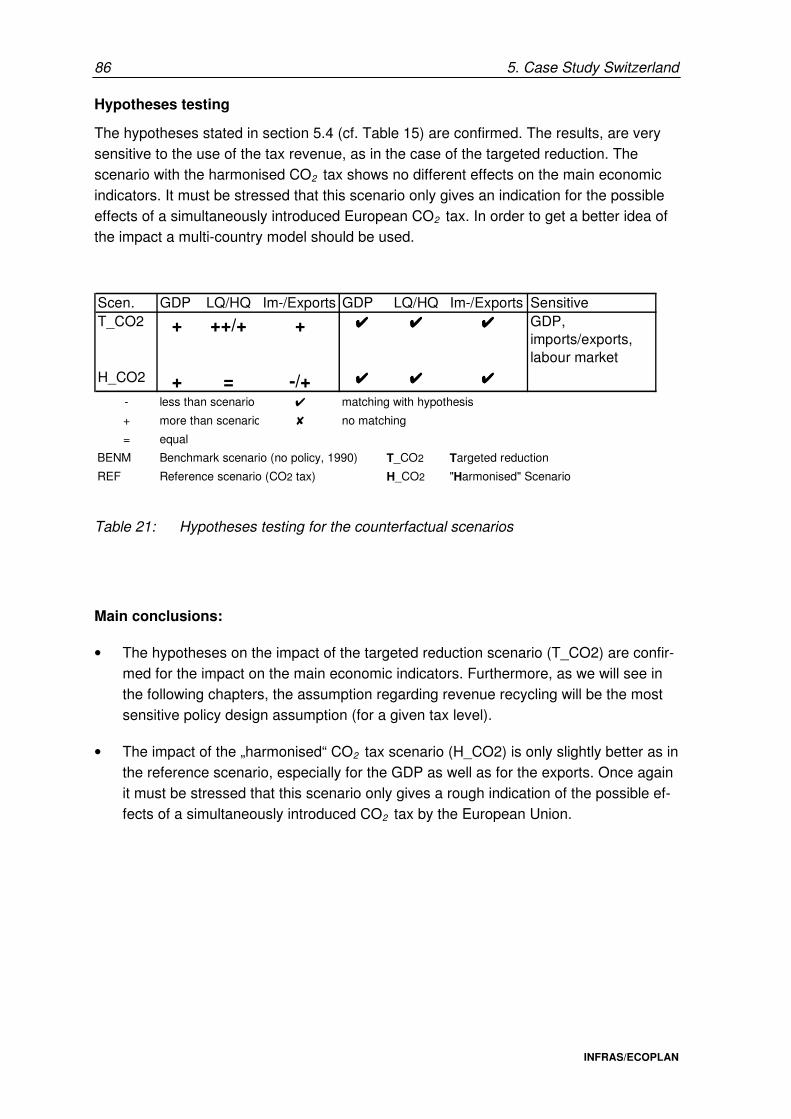
86 5. Case Study Switzerland
INFRAS/ECOPLAN
Hypotheses testing
The hypotheses stated in section 5.4 (cf. Table 15) are confirmed. The results, are very sensitive to the use of the tax revenue, as in the case of the targeted reduction. The scenario with the harmonised CO2 tax shows no different effects on the main economic indicators. It must be stressed that this scenario only gives an indication for the possible effects of a simultaneously introduced European CO2 tax. In order to get a better idea of the impact a multi-country model should be used.
Scen. GDP LQ/HQ Im-/Exports GDP LQ/HQ Im-/Exports SensitiveT_CO2 + ++/+ + 4444 4444 4444 GDP,
imports/exports, labour market
H_CO2 + = -/+ 4444 4444 4444
- less than scenario 4 matching with hypothesis
+ more than scenario 8 no matching
= equal
BENM Benchmark scenario (no policy, 1990) T_CO2 Targeted reduction
REF Reference scenario (CO2 tax) H_CO2 "Harmonised" Scenario
Table 21: Hypotheses testing for the counterfactual scenarios
Main conclusions:
• The hypotheses on the impact of the targeted reduction scenario (T_CO2) are confir-med for the impact on the main economic indicators. Furthermore, as we will see in the following chapters, the assumption regarding revenue recycling will be the most sensitive policy design assumption (for a given tax level).
• The impact of the „harmonised“ CO2 tax scenario (H_CO2) is only slightly better as in the reference scenario, especially for the GDP as well as for the exports. Once again it must be stressed that this scenario only gives a rough indication of the possible ef-fects of a simultaneously introduced CO2 tax by the European Union.
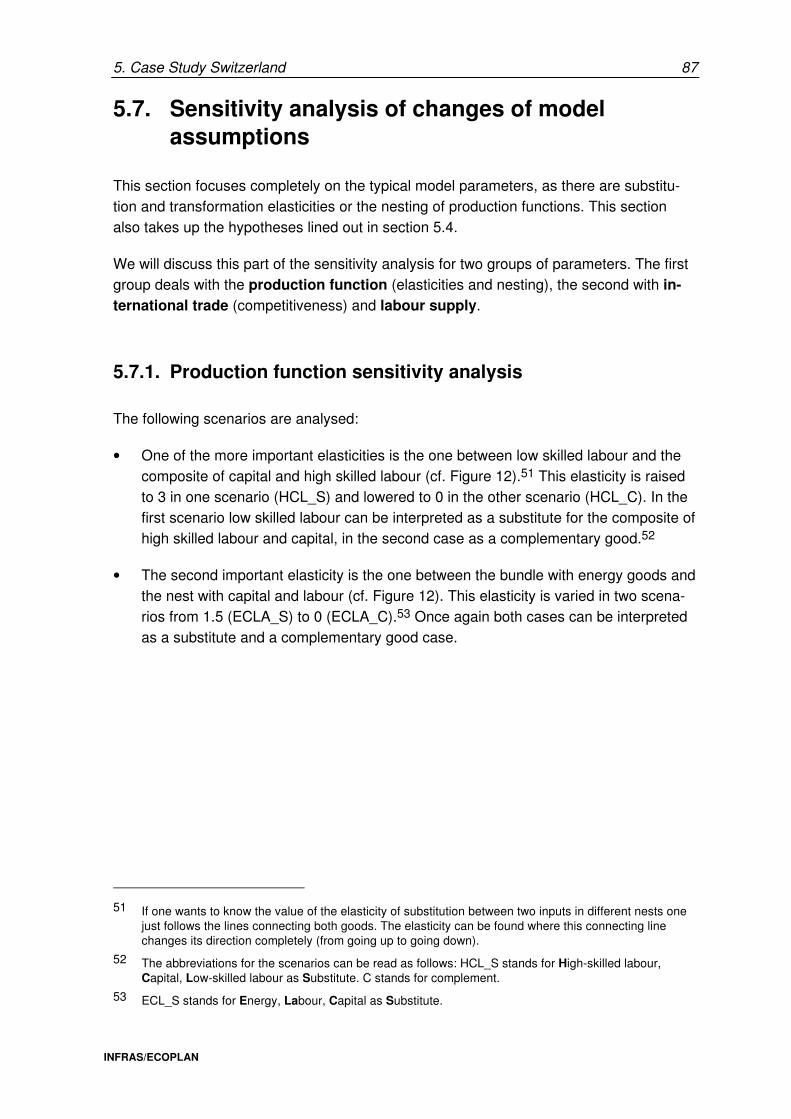
5. Case Study Switzerland 87
INFRAS/ECOPLAN
5.7. Sensitivity analysis of changes of model assumptions
This section focuses completely on the typical model parameters, as there are substitu-tion and transformation elasticities or the nesting of production functions. This section also takes up the hypotheses lined out in section 5.4.
We will discuss this part of the sensitivity analysis for two groups of parameters. The first group deals with the production function (elasticities and nesting), the second with in-ternational trade (competitiveness) and labour supply.
5.7.1. Production function sensitivity analysis
The following scenarios are analysed:
• One of the more important elasticities is the one between low skilled labour and the composite of capital and high skilled labour (cf. Figure 12).51 This elasticity is raised to 3 in one scenario (HCL_S) and lowered to 0 in the other scenario (HCL_C). In the first scenario low skilled labour can be interpreted as a substitute for the composite of high skilled labour and capital, in the second case as a complementary good.52
• The second important elasticity is the one between the bundle with energy goods and the nest with capital and labour (cf. Figure 12). This elasticity is varied in two scena-rios from 1.5 (ECLA_S) to 0 (ECLA_C).53 Once again both cases can be interpreted as a substitute and a complementary good case.
51 If one wants to know the value of the elasticity of substitution between two inputs in different nests one
just follows the lines connecting both goods. The elasticity can be found where this connecting line changes its direction completely (from going up to going down).
52 The abbreviations for the scenarios can be read as follows: HCL_S stands for High-skilled labour, Capital, Low-skilled labour as Substitute. C stands for complement.
53 ECL_S stands for Energy, Labour, Capital as Substitute.
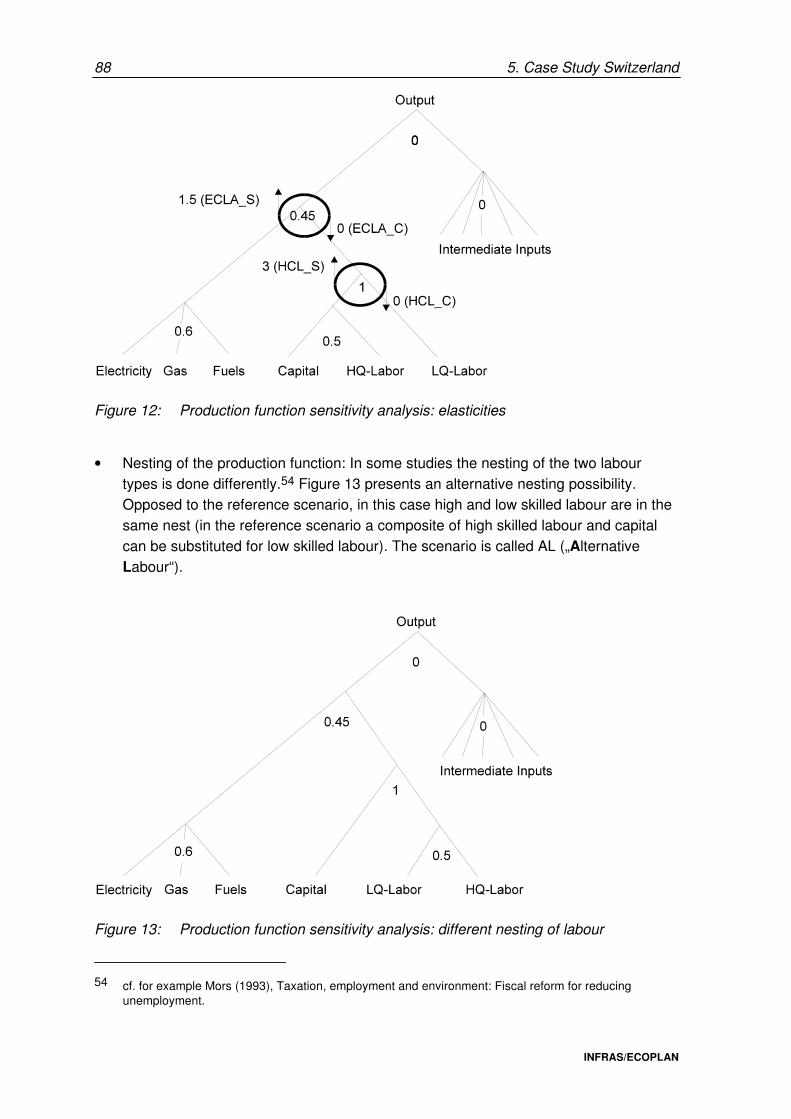
88 5. Case Study Switzerland
INFRAS/ECOPLAN
Figure 12: Production function sensitivity analysis: elasticities
• Nesting of the production function: In some studies the nesting of the two labour types is done differently.54 Figure 13 presents an alternative nesting possibility. Opposed to the reference scenario, in this case high and low skilled labour are in the same nest (in the reference scenario a composite of high skilled labour and capital can be substituted for low skilled labour). The scenario is called AL („Alternative Labour“).
Figure 13: Production function sensitivity analysis: different nesting of labour
54 cf. for example Mors (1993), Taxation, employment and environment: Fiscal reform for reducing
unemployment.
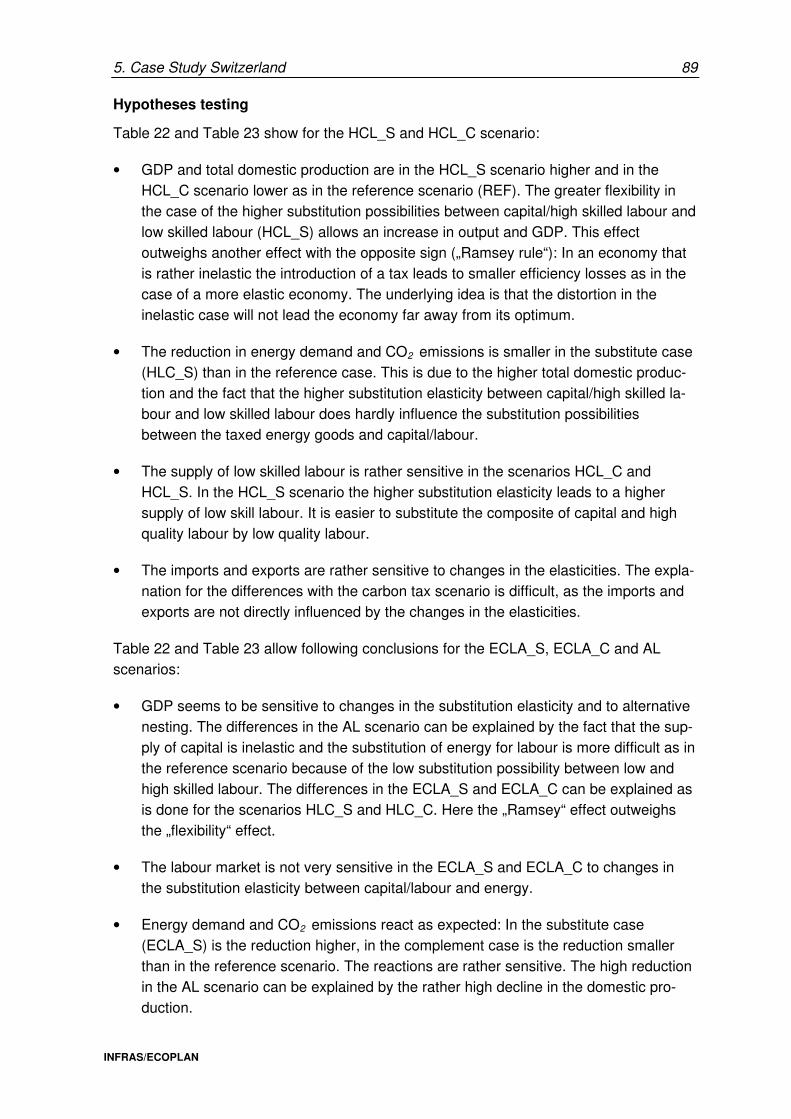
5. Case Study Switzerland 89
INFRAS/ECOPLAN
Hypotheses testing
Table 22 and Table 23 show for the HCL_S and HCL_C scenario:
• GDP and total domestic production are in the HCL_S scenario higher and in the HCL_C scenario lower as in the reference scenario (REF). The greater flexibility in the case of the higher substitution possibilities between capital/high skilled labour and low skilled labour (HCL_S) allows an increase in output and GDP. This effect outweighs another effect with the opposite sign („Ramsey rule“): In an economy that is rather inelastic the introduction of a tax leads to smaller efficiency losses as in the case of a more elastic economy. The underlying idea is that the distortion in the inelastic case will not lead the economy far away from its optimum.
• The reduction in energy demand and CO2 emissions is smaller in the substitute case (HLC_S) than in the reference case. This is due to the higher total domestic produc-tion and the fact that the higher substitution elasticity between capital/high skilled la-bour and low skilled labour does hardly influence the substitution possibilities between the taxed energy goods and capital/labour.
• The supply of low skilled labour is rather sensitive in the scenarios HCL_C and HCL_S. In the HCL_S scenario the higher substitution elasticity leads to a higher supply of low skill labour. It is easier to substitute the composite of capital and high quality labour by low quality labour.
• The imports and exports are rather sensitive to changes in the elasticities. The expla-nation for the differences with the carbon tax scenario is difficult, as the imports and exports are not directly influenced by the changes in the elasticities.
Table 22 and Table 23 allow following conclusions for the ECLA_S, ECLA_C and AL scenarios:
• GDP seems to be sensitive to changes in the substitution elasticity and to alternative nesting. The differences in the AL scenario can be explained by the fact that the sup-ply of capital is inelastic and the substitution of energy for labour is more difficult as in the reference scenario because of the low substitution possibility between low and high skilled labour. The differences in the ECLA_S and ECLA_C can be explained as is done for the scenarios HLC_S and HLC_C. Here the „Ramsey“ effect outweighs the „flexibility“ effect.
• The labour market is not very sensitive in the ECLA_S and ECLA_C to changes in the substitution elasticity between capital/labour and energy.
• Energy demand and CO2 emissions react as expected: In the substitute case (ECLA_S) is the reduction higher, in the complement case is the reduction smaller than in the reference scenario. The reactions are rather sensitive. The high reduction in the AL scenario can be explained by the rather high decline in the domestic pro-duction.
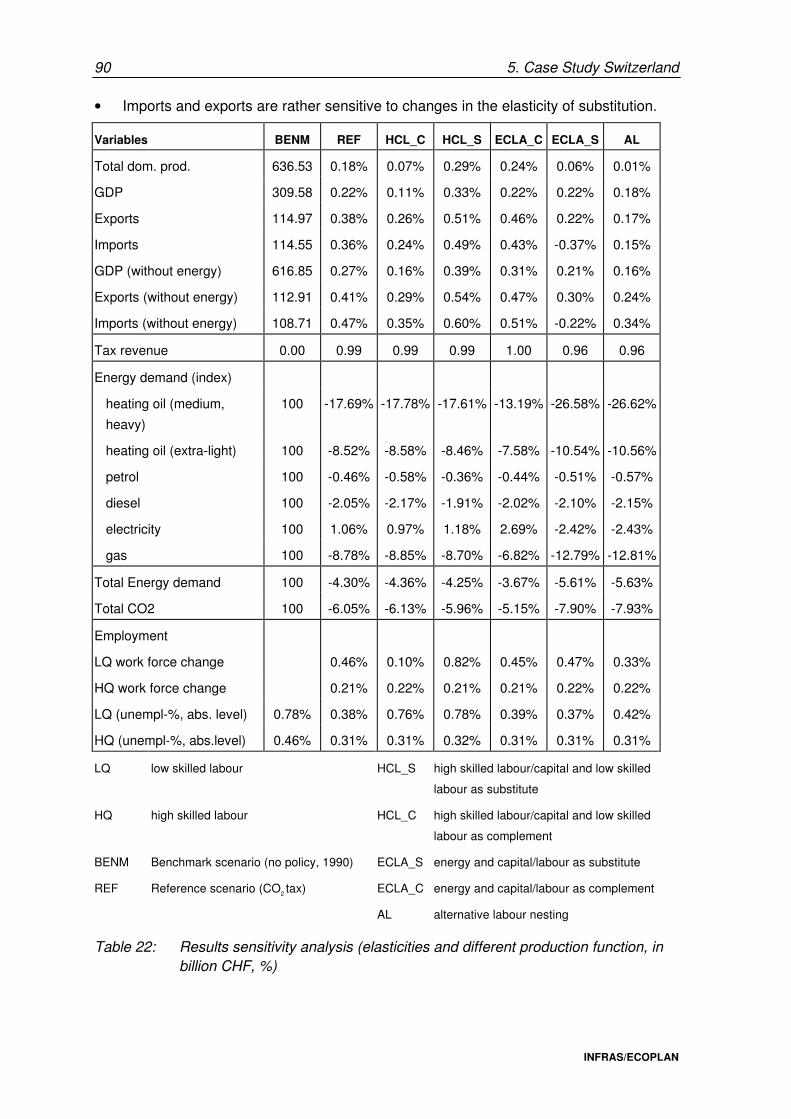
90 5. Case Study Switzerland
INFRAS/ECOPLAN
• Imports and exports are rather sensitive to changes in the elasticity of substitution.
Variables BENM REF HCL_C HCL_S ECLA_C ECLA_S AL
Total dom. prod. 636.53 0.18% 0.07% 0.29% 0.24% 0.06% 0.01%
GDP 309.58 0.22% 0.11% 0.33% 0.22% 0.22% 0.18%
Exports 114.97 0.38% 0.26% 0.51% 0.46% 0.22% 0.17%
Imports 114.55 0.36% 0.24% 0.49% 0.43% -0.37% 0.15%
GDP (without energy) 616.85 0.27% 0.16% 0.39% 0.31% 0.21% 0.16%
Exports (without energy) 112.91 0.41% 0.29% 0.54% 0.47% 0.30% 0.24%
Imports (without energy) 108.71 0.47% 0.35% 0.60% 0.51% -0.22% 0.34%
Tax revenue 0.00 0.99 0.99 0.99 1.00 0.96 0.96
Energy demand (index)
heating oil (medium,
heavy)
100 -17.69% -17.78% -17.61% -13.19% -26.58% -26.62%
heating oil (extra-light) 100 -8.52% -8.58% -8.46% -7.58% -10.54% -10.56%
petrol 100 -0.46% -0.58% -0.36% -0.44% -0.51% -0.57%
diesel 100 -2.05% -2.17% -1.91% -2.02% -2.10% -2.15%
electricity 100 1.06% 0.97% 1.18% 2.69% -2.42% -2.43%
gas 100 -8.78% -8.85% -8.70% -6.82% -12.79% -12.81%
Total Energy demand 100 -4.30% -4.36% -4.25% -3.67% -5.61% -5.63%
Total CO2 100 -6.05% -6.13% -5.96% -5.15% -7.90% -7.93%
Employment
LQ work force change 0.46% 0.10% 0.82% 0.45% 0.47% 0.33%
HQ work force change 0.21% 0.22% 0.21% 0.21% 0.22% 0.22%
LQ (unempl-%, abs. level) 0.78% 0.38% 0.76% 0.78% 0.39% 0.37% 0.42%
HQ (unempl-%, abs.level) 0.46% 0.31% 0.31% 0.32% 0.31% 0.31% 0.31%
LQ low skilled labour HCL_S high skilled labour/capital and low skilled
labour as substitute
HQ high skilled labour HCL_C high skilled labour/capital and low skilled
labour as complement
BENM Benchmark scenario (no policy, 1990) ECLA_S energy and capital/labour as substitute
REF Reference scenario (CO2 tax) ECLA_C energy and capital/labour as complement
AL alternative labour nesting
Table 22: Results sensitivity analysis (elasticities and different production function, in billion CHF, %)
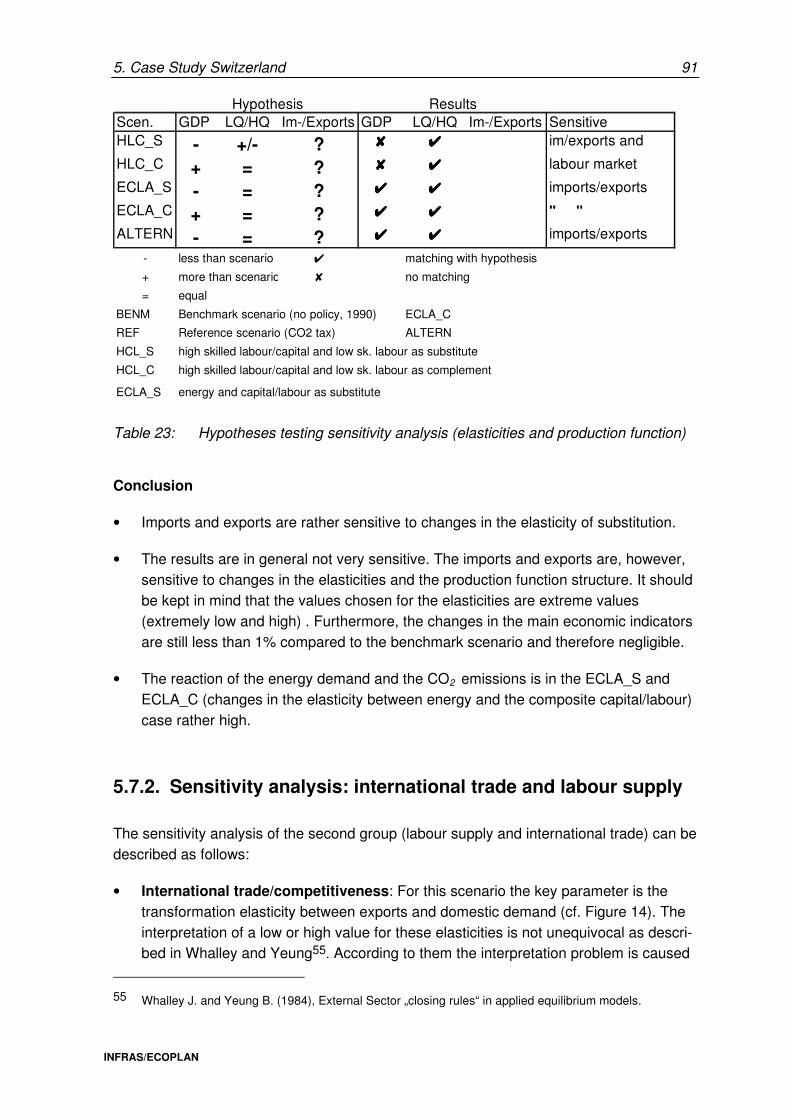
5. Case Study Switzerland 91
INFRAS/ECOPLAN
Hypothesis ResultsScen. GDP LQ/HQ Im-/Exports GDP LQ/HQ Im-/Exports SensitiveHLC_S - +/- ? 8888 4444 im/exports and
HLC_C + = ? 8888 4444 labour market
ECLA_S - = ? 4444 4444 imports/exports
ECLA_C + = ? 4444 4444 " "
ALTERN - = ? 4444 4444 imports/exports
- less than scenario 4 matching with hypothesis
+ more than scenario 8 no matching
= equal
BENM Benchmark scenario (no policy, 1990) ECLA_C
REF Reference scenario (CO2 tax) ALTERN
HCL_S high skilled labour/capital and low sk. labour as substitute
HCL_C high skilled labour/capital and low sk. labour as complement
ECLA_S energy and capital/labour as substitute
Table 23: Hypotheses testing sensitivity analysis (elasticities and production function)
Conclusion
• Imports and exports are rather sensitive to changes in the elasticity of substitution.
• The results are in general not very sensitive. The imports and exports are, however, sensitive to changes in the elasticities and the production function structure. It should be kept in mind that the values chosen for the elasticities are extreme values (extremely low and high) . Furthermore, the changes in the main economic indicators are still less than 1% compared to the benchmark scenario and therefore negligible.
• The reaction of the energy demand and the CO2 emissions is in the ECLA_S and ECLA_C (changes in the elasticity between energy and the composite capital/labour) case rather high.
5.7.2. Sensitivity analysis: international trade and labour supply
The sensitivity analysis of the second group (labour supply and international trade) can be described as follows:
• International trade/competitiveness: For this scenario the key parameter is the transformation elasticity between exports and domestic demand (cf. Figure 14). The interpretation of a low or high value for these elasticities is not unequivocal as descri-bed in Whalley and Yeung55
. According to them the interpretation problem is caused
55 Whalley J. and Yeung B. (1984), External Sector „closing rules“ in applied equilibrium models.
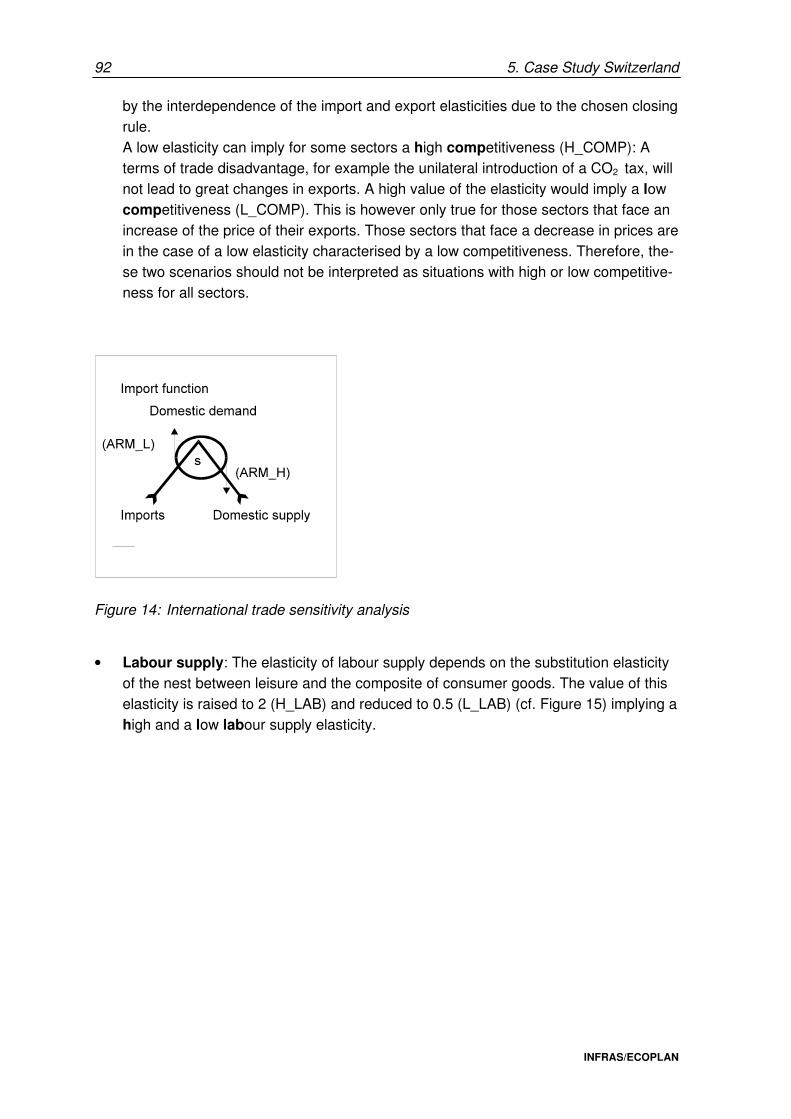
92 5. Case Study Switzerland
INFRAS/ECOPLAN
by the interdependence of the import and export elasticities due to the chosen closing rule. A low elasticity can imply for some sectors a high competitiveness (H_COMP): A terms of trade disadvantage, for example the unilateral introduction of a CO2 tax, will not lead to great changes in exports. A high value of the elasticity would imply a low competitiveness (L_COMP). This is however only true for those sectors that face an increase of the price of their exports. Those sectors that face a decrease in prices are in the case of a low elasticity characterised by a low competitiveness. Therefore, the-se two scenarios should not be interpreted as situations with high or low competitive-ness for all sectors.
Figure 14: International trade sensitivity analysis
• Labour supply: The elasticity of labour supply depends on the substitution elasticity of the nest between leisure and the composite of consumer goods. The value of this elasticity is raised to 2 (H_LAB) and reduced to 0.5 (L_LAB) (cf. Figure 15) implying a high and a low labour supply elasticity.
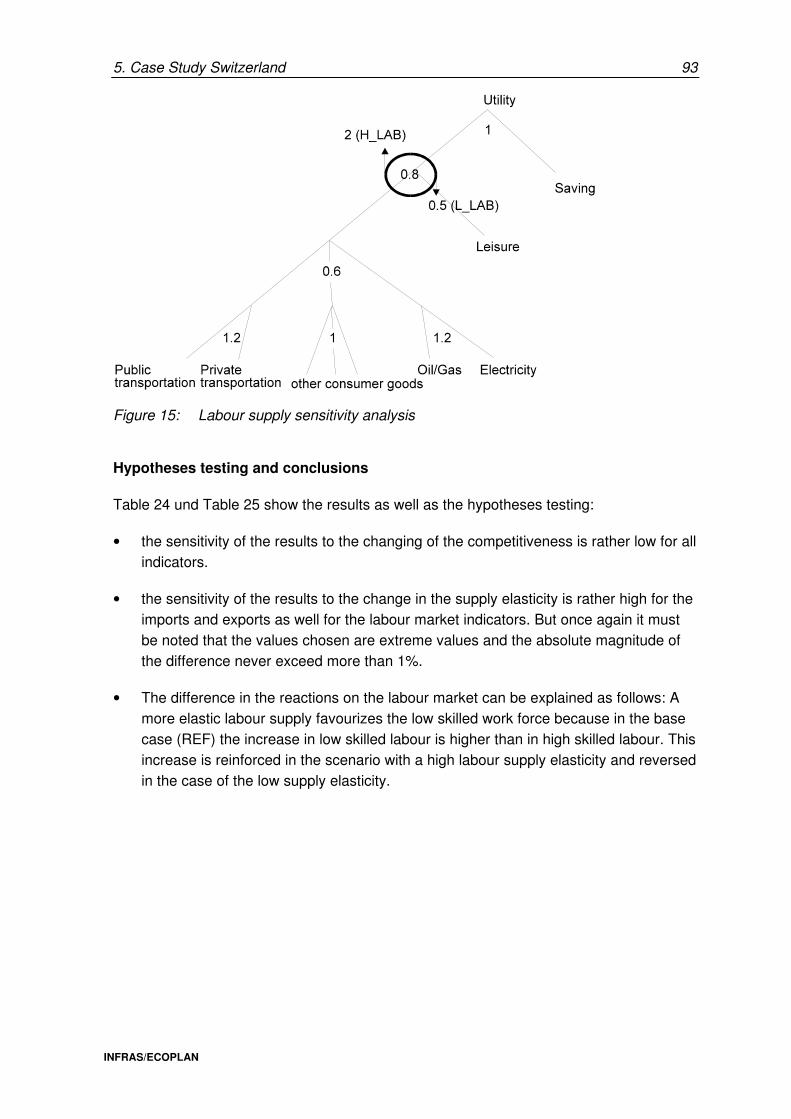
5. Case Study Switzerland 93
INFRAS/ECOPLAN
Figure 15: Labour supply sensitivity analysis
Hypotheses testing and conclusions
Table 24 und Table 25 show the results as well as the hypotheses testing:
• the sensitivity of the results to the changing of the competitiveness is rather low for all indicators.
• the sensitivity of the results to the change in the supply elasticity is rather high for the imports and exports as well for the labour market indicators. But once again it must be noted that the values chosen are extreme values and the absolute magnitude of the difference never exceed more than 1%.
• The difference in the reactions on the labour market can be explained as follows: A more elastic labour supply favourizes the low skilled work force because in the base case (REF) the increase in low skilled labour is higher than in high skilled labour. This increase is reinforced in the scenario with a high labour supply elasticity and reversed in the case of the low supply elasticity.
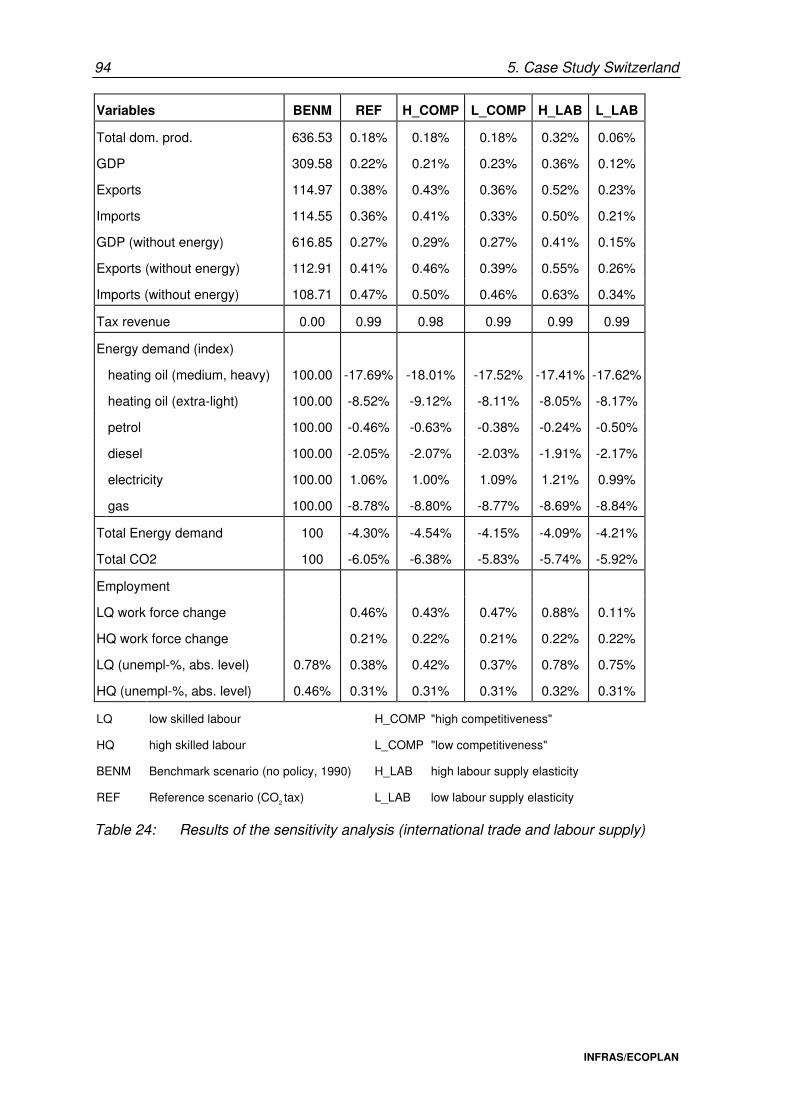
94 5. Case Study Switzerland
INFRAS/ECOPLAN
Variables BENM REF H_COMP L_COMP H_LAB L_LAB
Total dom. prod. 636.53 0.18% 0.18% 0.18% 0.32% 0.06%
GDP 309.58 0.22% 0.21% 0.23% 0.36% 0.12%
Exports 114.97 0.38% 0.43% 0.36% 0.52% 0.23%
Imports 114.55 0.36% 0.41% 0.33% 0.50% 0.21%
GDP (without energy) 616.85 0.27% 0.29% 0.27% 0.41% 0.15%
Exports (without energy) 112.91 0.41% 0.46% 0.39% 0.55% 0.26%
Imports (without energy) 108.71 0.47% 0.50% 0.46% 0.63% 0.34%
Tax revenue 0.00 0.99 0.98 0.99 0.99 0.99
Energy demand (index)
heating oil (medium, heavy) 100.00 -17.69% -18.01% -17.52% -17.41% -17.62%
heating oil (extra-light) 100.00 -8.52% -9.12% -8.11% -8.05% -8.17%
petrol 100.00 -0.46% -0.63% -0.38% -0.24% -0.50%
diesel 100.00 -2.05% -2.07% -2.03% -1.91% -2.17%
electricity 100.00 1.06% 1.00% 1.09% 1.21% 0.99%
gas 100.00 -8.78% -8.80% -8.77% -8.69% -8.84%
Total Energy demand 100 -4.30% -4.54% -4.15% -4.09% -4.21%
Total CO2 100 -6.05% -6.38% -5.83% -5.74% -5.92%
Employment
LQ work force change 0.46% 0.43% 0.47% 0.88% 0.11%
HQ work force change 0.21% 0.22% 0.21% 0.22% 0.22%
LQ (unempl-%, abs. level) 0.78% 0.38% 0.42% 0.37% 0.78% 0.75%
HQ (unempl-%, abs. level) 0.46% 0.31% 0.31% 0.31% 0.32% 0.31%
LQ low skilled labour H_COMP "high competitiveness"
HQ high skilled labour L_COMP "low competitiveness"
BENM Benchmark scenario (no policy, 1990) H_LAB high labour supply elasticity
REF Reference scenario (CO2 tax) L_LAB low labour supply elasticity
Table 24: Results of the sensitivity analysis (international trade and labour supply)
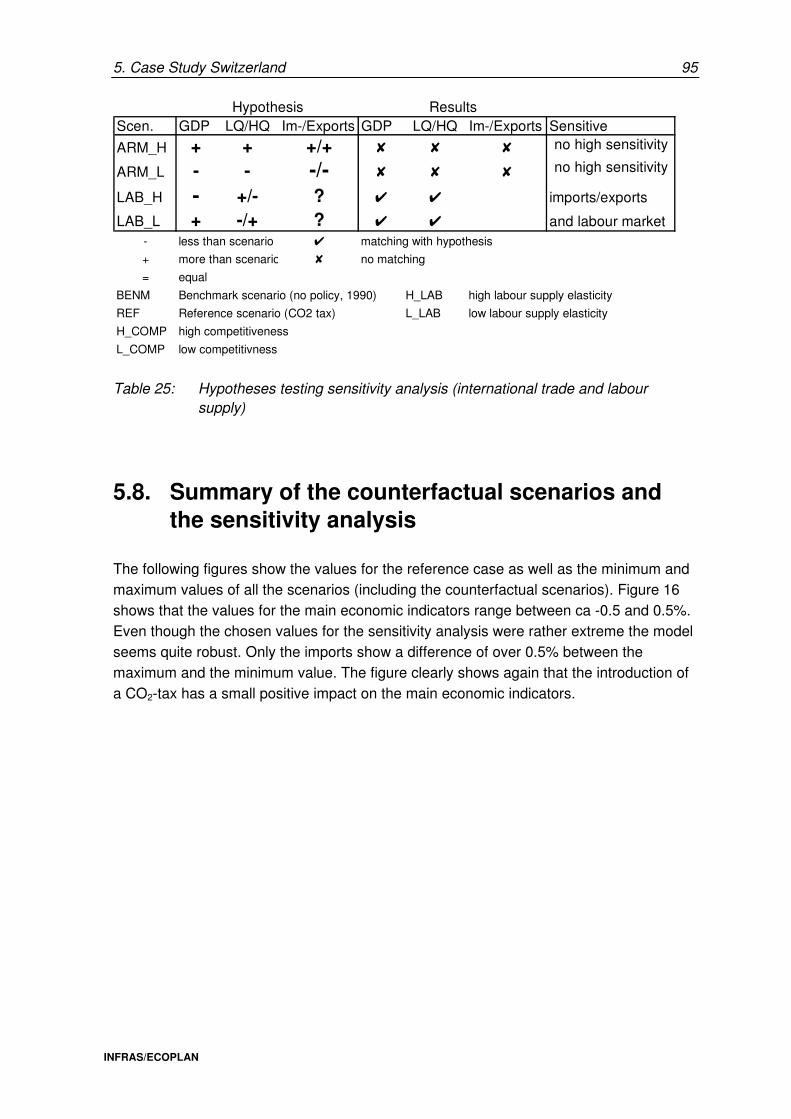
5. Case Study Switzerland 95
INFRAS/ECOPLAN
Hypothesis ResultsScen. GDP LQ/HQ Im-/Exports GDP LQ/HQ Im-/Exports Sensitive
ARM_H + + +/+ 8 8 8 no high sensitivity
ARM_L - - -/- 8 8 8 no high sensitivity
LAB_H - +/- ? 4 4 imports/exports
LAB_L + -/+ ? 4 4 and labour market- less than scenario 4 matching with hypothesis
+ more than scenario 8 no matching
= equal
BENM Benchmark scenario (no policy, 1990) H_LAB high labour supply elasticity
REF Reference scenario (CO2 tax) L_LAB low labour supply elasticity
H_COMP high competitiveness
L_COMP low competitivness
Table 25: Hypotheses testing sensitivity analysis (international trade and labour supply)
5.8. Summary of the counterfactual scenarios and the sensitivity analysis
The following figures show the values for the reference case as well as the minimum and maximum values of all the scenarios (including the counterfactual scenarios). Figure 16 shows that the values for the main economic indicators range between ca -0.5 and 0.5%. Even though the chosen values for the sensitivity analysis were rather extreme the model seems quite robust. Only the imports show a difference of over 0.5% between the maximum and the minimum value. The figure clearly shows again that the introduction of a CO2-tax has a small positive impact on the main economic indicators.
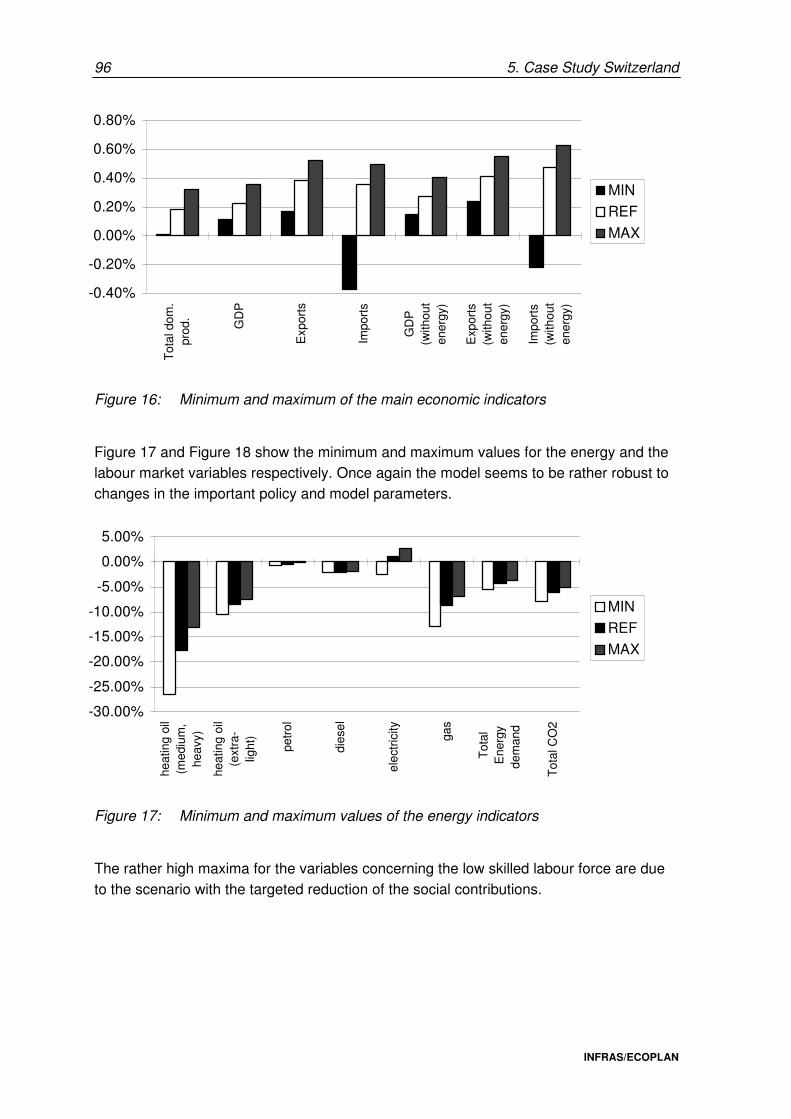
96 5. Case Study Switzerland
INFRAS/ECOPLAN
-0.40%
-0.20%
0.00%
0.20%
0.40%
0.60%
0.80%
Tot
al d
om.
prod
.
GD
P
Exp
orts
Impo
rts
GD
P(w
ithou
ten
ergy
)
Exp
orts
(with
out
ener
gy)
Impo
rts
(with
out
ener
gy)
MIN
REF
MAX
Figure 16: Minimum and maximum of the main economic indicators
Figure 17 and Figure 18 show the minimum and maximum values for the energy and the labour market variables respectively. Once again the model seems to be rather robust to changes in the important policy and model parameters.
-30.00%
-25.00%
-20.00%
-15.00%
-10.00%
-5.00%
0.00%
5.00%
heat
ing
oil
(med
ium
,he
avy)
heat
ing
oil
(ext
ra-
light
)
petr
ol
dies
el
elec
tric
ity
gas
Tot
alE
nerg
yde
man
d
Tot
al C
O2
MIN
REF
MAX
Figure 17: Minimum and maximum values of the energy indicators
The rather high maxima for the variables concerning the low skilled labour force are due to the scenario with the targeted reduction of the social contributions.
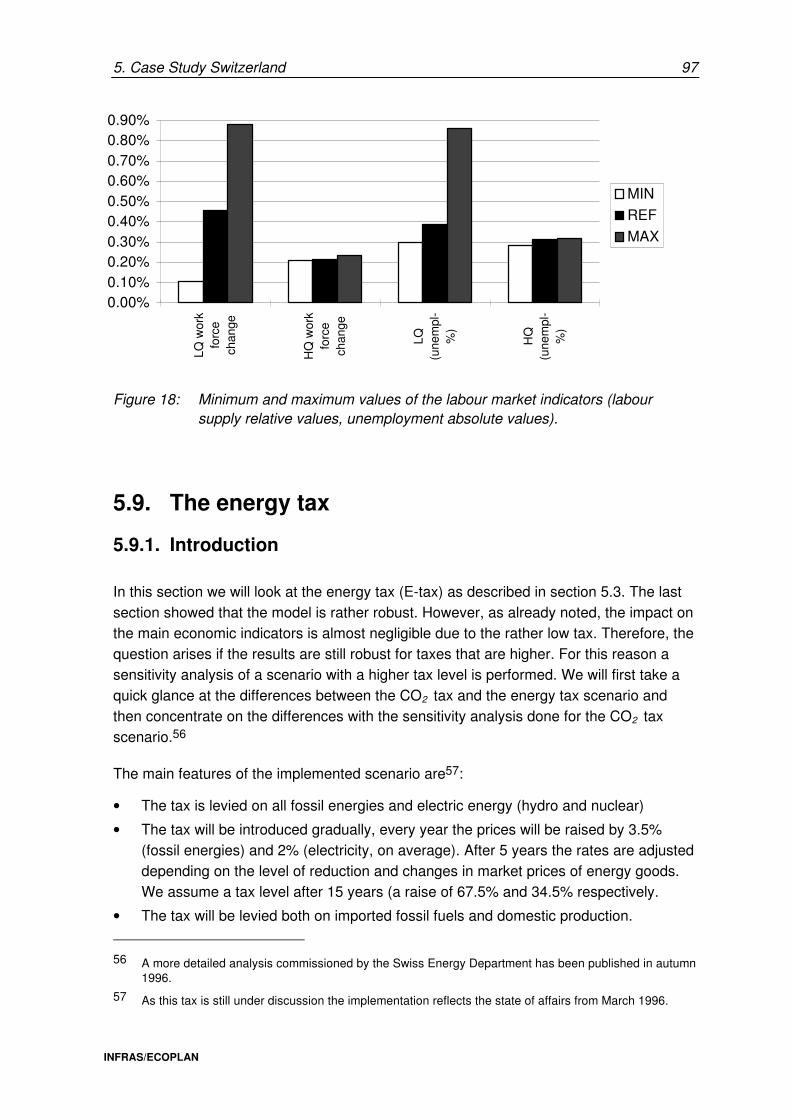
5. Case Study Switzerland 97
INFRAS/ECOPLAN
0.00%0.10%0.20%0.30%0.40%0.50%0.60%0.70%0.80%0.90%
LQ w
ork
forc
ech
ange
HQ
wor
kfo
rce
chan
ge
LQ(u
nem
pl-
%)
HQ
(une
mpl
-%
)
MIN
REF
MAX
Figure 18: Minimum and maximum values of the labour market indicators (labour supply relative values, unemployment absolute values).
5.9. The energy tax
5.9.1. Introduction
In this section we will look at the energy tax (E-tax) as described in section 5.3. The last section showed that the model is rather robust. However, as already noted, the impact on the main economic indicators is almost negligible due to the rather low tax. Therefore, the question arises if the results are still robust for taxes that are higher. For this reason a sensitivity analysis of a scenario with a higher tax level is performed. We will first take a quick glance at the differences between the CO2 tax and the energy tax scenario and then concentrate on the differences with the sensitivity analysis done for the CO2 tax scenario.56
The main features of the implemented scenario are57:
• The tax is levied on all fossil energies and electric energy (hydro and nuclear)
• The tax will be introduced gradually, every year the prices will be raised by 3.5% (fossil energies) and 2% (electricity, on average). After 5 years the rates are adjusted depending on the level of reduction and changes in market prices of energy goods. We assume a tax level after 15 years (a raise of 67.5% and 34.5% respectively.
• The tax will be levied both on imported fossil fuels and domestic production.
56 A more detailed analysis commissioned by the Swiss Energy Department has been published in autumn
1996.
57 As this tax is still under discussion the implementation reflects the state of affairs from March 1996.
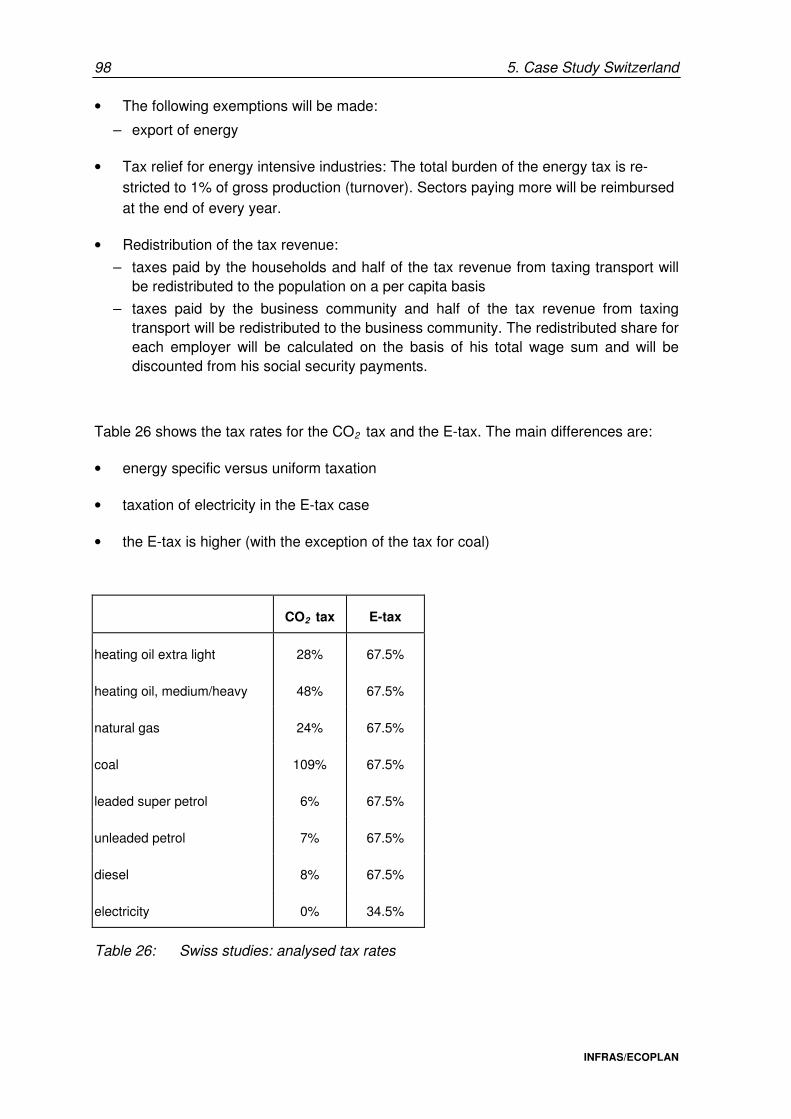
98 5. Case Study Switzerland
INFRAS/ECOPLAN
• The following exemptions will be made:
– export of energy
• Tax relief for energy intensive industries: The total burden of the energy tax is re-stricted to 1% of gross production (turnover). Sectors paying more will be reimbursed at the end of every year.
• Redistribution of the tax revenue:
– taxes paid by the households and half of the tax revenue from taxing transport will be redistributed to the population on a per capita basis
– taxes paid by the business community and half of the tax revenue from taxing transport will be redistributed to the business community. The redistributed share for each employer will be calculated on the basis of his total wage sum and will be discounted from his social security payments.
Table 26 shows the tax rates for the CO2 tax and the E-tax. The main differences are:
• energy specific versus uniform taxation
• taxation of electricity in the E-tax case
• the E-tax is higher (with the exception of the tax for coal)
CO2 tax E-tax
heating oil extra light 28% 67.5%
heating oil, medium/heavy 48% 67.5%
natural gas 24% 67.5%
coal 109% 67.5%
leaded super petrol 6% 67.5%
unleaded petrol 7% 67.5%
diesel 8% 67.5%
electricity 0% 34.5%
Table 26: Swiss studies: analysed tax rates
5. Case Study Switzerland 99
INFRAS/ECOPLAN
5.9.2. Results
Table 27 shows the results for the main economic indicators, the energy demand as well as the CO2 emissions for the CO2 tax (REF), the E-tax (ETREF) and a scenario without exemption (ET/WE).58
Some general remarks:
• The overall impact is negative for all the economic indicators but still does not exceed 1%
• The differences in the reduction of the different energy goods demand can be explai-ned by the differences in the tax rates
• The ET/WE scenario does not better on the aggregate level as the ETREF scenario. This is in line with our intuition: Exemptions do matter on the sectoral level, although the effect is negligible on the aggregate level.
• Only the effects on the labour market are different from the REF-Scenario: The LQ-workforce shows a greater decline as the HQ-workforce. The reverse effect can be partly explained by the differences in both scenarios in the redistribution of the tax revenue. In the REF-Scenario 50% of the revenue is distributed to the sectors, in the ETREF-Scenario the tax raised at the industry level is distributed to the industry, and the tax revenue of the service sectors is distributed to the service sectors. Combined with the different percentages in demand for high and low qualified labour in industry and service sector another pattern of impact on the labour markets results.
58 These results will be discussed in detail in the study mentioned in Footnote 56
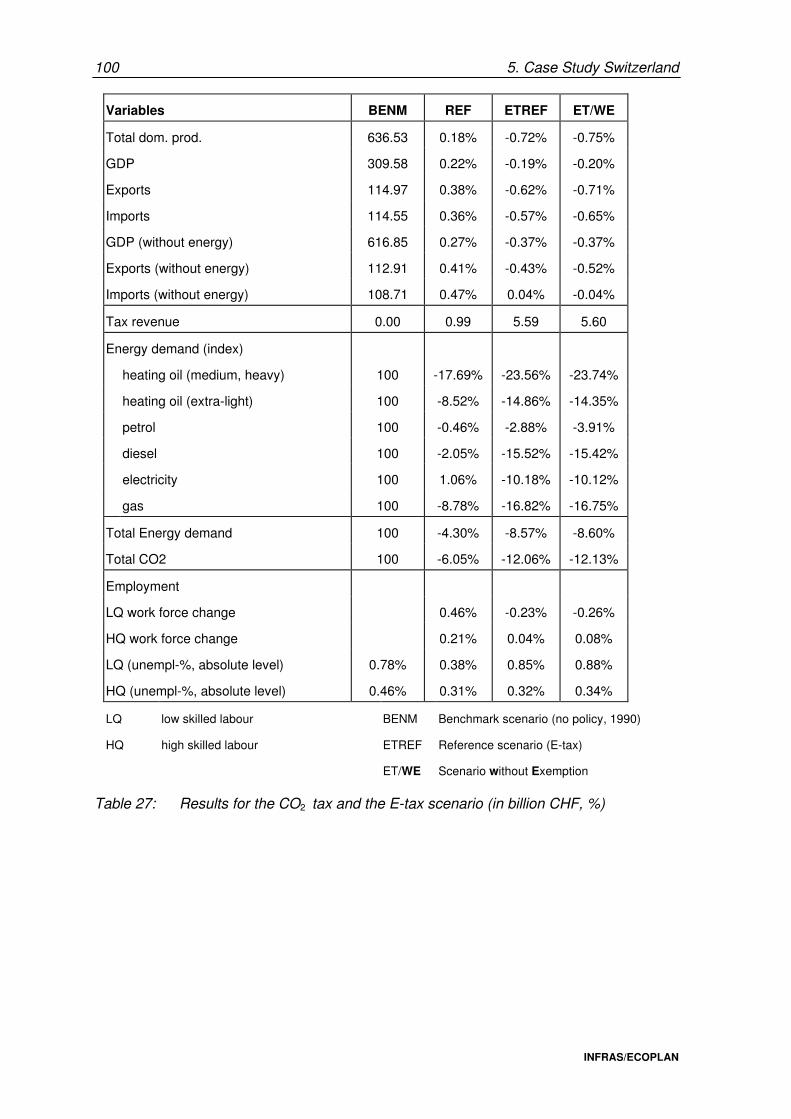
100 5. Case Study Switzerland
INFRAS/ECOPLAN
Variables BENM REF ETREF ET/WE
Total dom. prod. 636.53 0.18% -0.72% -0.75%
GDP 309.58 0.22% -0.19% -0.20%
Exports 114.97 0.38% -0.62% -0.71%
Imports 114.55 0.36% -0.57% -0.65%
GDP (without energy) 616.85 0.27% -0.37% -0.37%
Exports (without energy) 112.91 0.41% -0.43% -0.52%
Imports (without energy) 108.71 0.47% 0.04% -0.04%
Tax revenue 0.00 0.99 5.59 5.60
Energy demand (index)
heating oil (medium, heavy) 100 -17.69% -23.56% -23.74%
heating oil (extra-light) 100 -8.52% -14.86% -14.35%
petrol 100 -0.46% -2.88% -3.91%
diesel 100 -2.05% -15.52% -15.42%
electricity 100 1.06% -10.18% -10.12%
gas 100 -8.78% -16.82% -16.75%
Total Energy demand 100 -4.30% -8.57% -8.60%
Total CO2 100 -6.05% -12.06% -12.13%
Employment
LQ work force change 0.46% -0.23% -0.26%
HQ work force change 0.21% 0.04% 0.08%
LQ (unempl-%, absolute level) 0.78% 0.38% 0.85% 0.88%
HQ (unempl-%, absolute level) 0.46% 0.31% 0.32% 0.34%
LQ low skilled labour BENM Benchmark scenario (no policy, 1990)
HQ high skilled labour ETREF Reference scenario (E-tax)
ET/WE Scenario without Exemption
Table 27: Results for the CO2 tax and the E-tax scenario (in billion CHF, %)
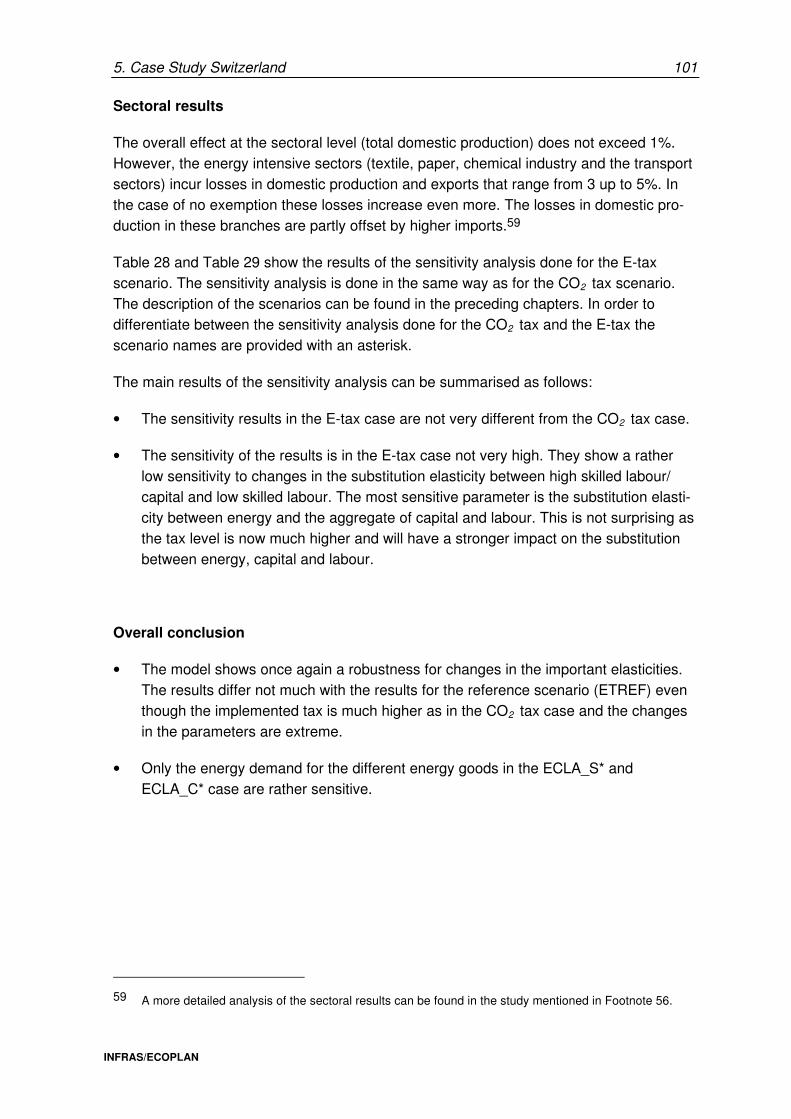
5. Case Study Switzerland 101
INFRAS/ECOPLAN
Sectoral results
The overall effect at the sectoral level (total domestic production) does not exceed 1%. However, the energy intensive sectors (textile, paper, chemical industry and the transport sectors) incur losses in domestic production and exports that range from 3 up to 5%. In the case of no exemption these losses increase even more. The losses in domestic pro-duction in these branches are partly offset by higher imports.59
Table 28 and Table 29 show the results of the sensitivity analysis done for the E-tax scenario. The sensitivity analysis is done in the same way as for the CO2 tax scenario. The description of the scenarios can be found in the preceding chapters. In order to differentiate between the sensitivity analysis done for the CO2 tax and the E-tax the scenario names are provided with an asterisk.
The main results of the sensitivity analysis can be summarised as follows:
• The sensitivity results in the E-tax case are not very different from the CO2 tax case.
• The sensitivity of the results is in the E-tax case not very high. They show a rather low sensitivity to changes in the substitution elasticity between high skilled labour/ capital and low skilled labour. The most sensitive parameter is the substitution elasti-city between energy and the aggregate of capital and labour. This is not surprising as the tax level is now much higher and will have a stronger impact on the substitution between energy, capital and labour.
Overall conclusion
• The model shows once again a robustness for changes in the important elasticities. The results differ not much with the results for the reference scenario (ETREF) even though the implemented tax is much higher as in the CO2 tax case and the changes in the parameters are extreme.
• Only the energy demand for the different energy goods in the ECLA_S* and ECLA_C* case are rather sensitive.
59 A more detailed analysis of the sectoral results can be found in the study mentioned in Footnote 56.
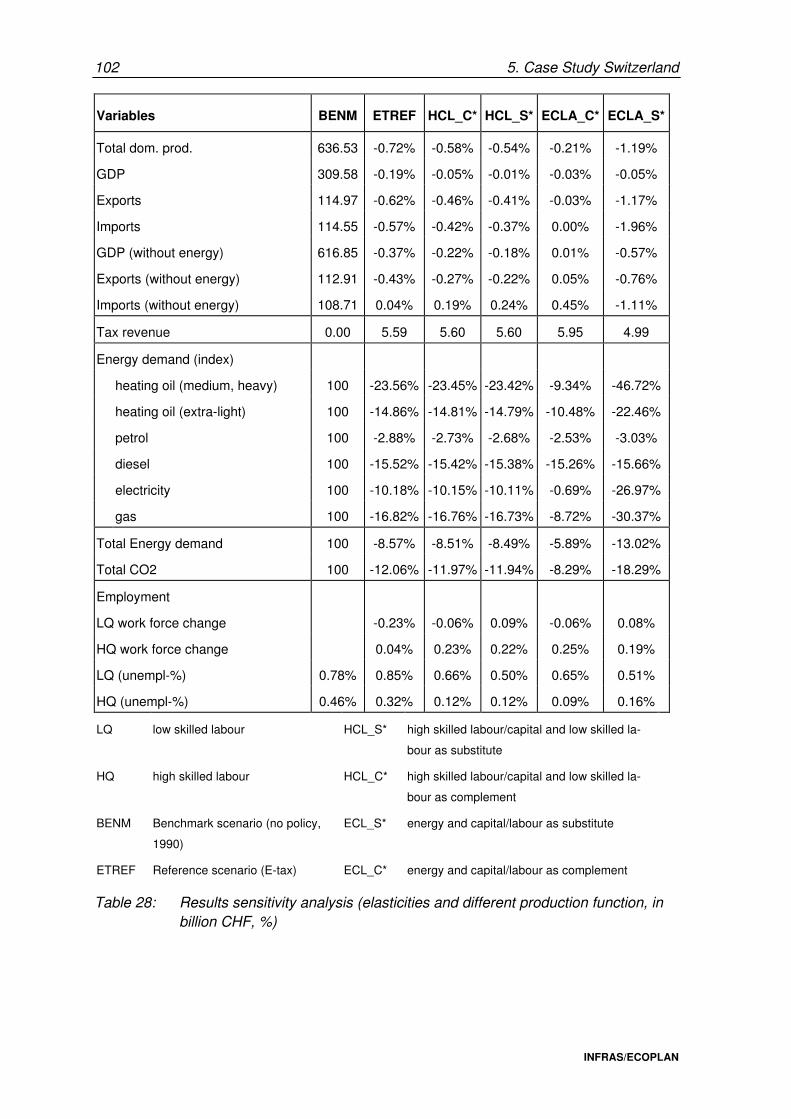
102 5. Case Study Switzerland
INFRAS/ECOPLAN
Variables BENM ETREF HCL_C* HCL_S* ECLA_C* ECLA_S*
Total dom. prod. 636.53 -0.72% -0.58% -0.54% -0.21% -1.19%
GDP 309.58 -0.19% -0.05% -0.01% -0.03% -0.05%
Exports 114.97 -0.62% -0.46% -0.41% -0.03% -1.17%
Imports 114.55 -0.57% -0.42% -0.37% 0.00% -1.96%
GDP (without energy) 616.85 -0.37% -0.22% -0.18% 0.01% -0.57%
Exports (without energy) 112.91 -0.43% -0.27% -0.22% 0.05% -0.76%
Imports (without energy) 108.71 0.04% 0.19% 0.24% 0.45% -1.11%
Tax revenue 0.00 5.59 5.60 5.60 5.95 4.99
Energy demand (index)
heating oil (medium, heavy) 100 -23.56% -23.45% -23.42% -9.34% -46.72%
heating oil (extra-light) 100 -14.86% -14.81% -14.79% -10.48% -22.46%
petrol 100 -2.88% -2.73% -2.68% -2.53% -3.03%
diesel 100 -15.52% -15.42% -15.38% -15.26% -15.66%
electricity 100 -10.18% -10.15% -10.11% -0.69% -26.97%
gas 100 -16.82% -16.76% -16.73% -8.72% -30.37%
Total Energy demand 100 -8.57% -8.51% -8.49% -5.89% -13.02%
Total CO2 100 -12.06% -11.97% -11.94% -8.29% -18.29%
Employment
LQ work force change -0.23% -0.06% 0.09% -0.06% 0.08%
HQ work force change 0.04% 0.23% 0.22% 0.25% 0.19%
LQ (unempl-%) 0.78% 0.85% 0.66% 0.50% 0.65% 0.51%
HQ (unempl-%) 0.46% 0.32% 0.12% 0.12% 0.09% 0.16%
LQ low skilled labour HCL_S* high skilled labour/capital and low skilled la-
bour as substitute
HQ high skilled labour HCL_C* high skilled labour/capital and low skilled la-
bour as complement
BENM Benchmark scenario (no policy,
1990)
ECL_S* energy and capital/labour as substitute
ETREF Reference scenario (E-tax) ECL_C* energy and capital/labour as complement
Table 28: Results sensitivity analysis (elasticities and different production function, in billion CHF, %)
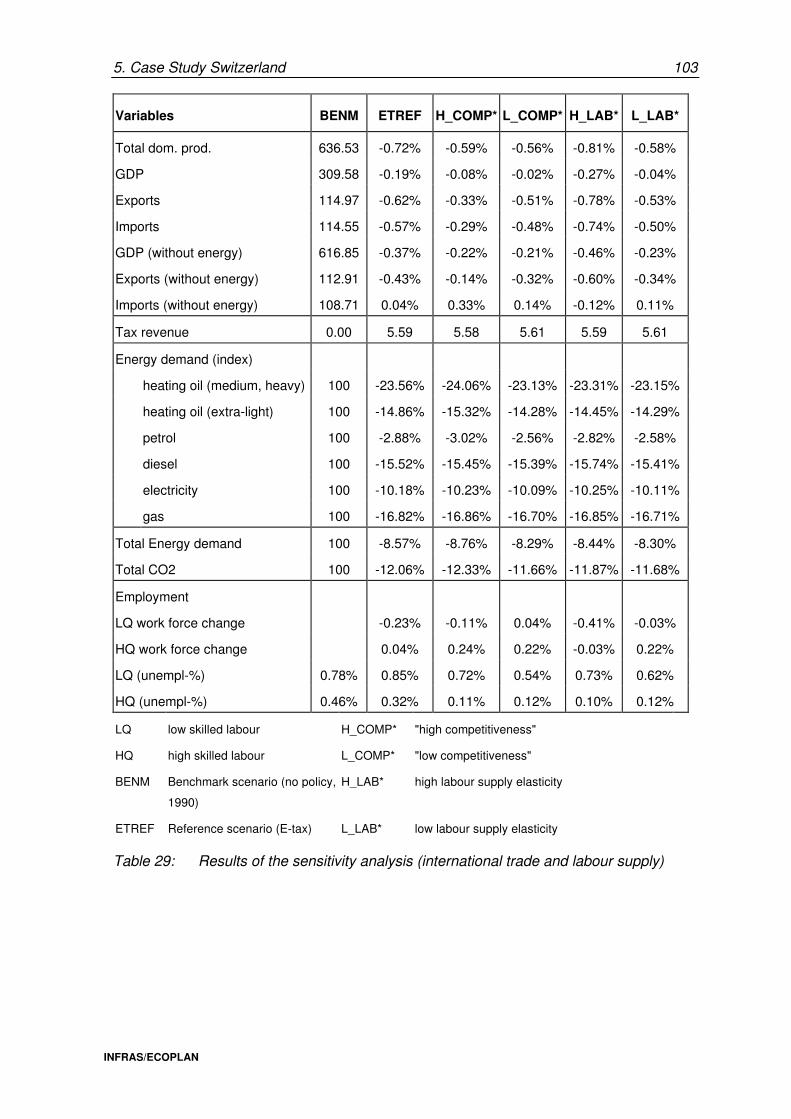
5. Case Study Switzerland 103
INFRAS/ECOPLAN
Variables BENM ETREF H_COMP* L_COMP* H_LAB* L_LAB*
Total dom. prod. 636.53 -0.72% -0.59% -0.56% -0.81% -0.58%
GDP 309.58 -0.19% -0.08% -0.02% -0.27% -0.04%
Exports 114.97 -0.62% -0.33% -0.51% -0.78% -0.53%
Imports 114.55 -0.57% -0.29% -0.48% -0.74% -0.50%
GDP (without energy) 616.85 -0.37% -0.22% -0.21% -0.46% -0.23%
Exports (without energy) 112.91 -0.43% -0.14% -0.32% -0.60% -0.34%
Imports (without energy) 108.71 0.04% 0.33% 0.14% -0.12% 0.11%
Tax revenue 0.00 5.59 5.58 5.61 5.59 5.61
Energy demand (index)
heating oil (medium, heavy) 100 -23.56% -24.06% -23.13% -23.31% -23.15%
heating oil (extra-light) 100 -14.86% -15.32% -14.28% -14.45% -14.29%
petrol 100 -2.88% -3.02% -2.56% -2.82% -2.58%
diesel 100 -15.52% -15.45% -15.39% -15.74% -15.41%
electricity 100 -10.18% -10.23% -10.09% -10.25% -10.11%
gas 100 -16.82% -16.86% -16.70% -16.85% -16.71%
Total Energy demand 100 -8.57% -8.76% -8.29% -8.44% -8.30%
Total CO2 100 -12.06% -12.33% -11.66% -11.87% -11.68%
Employment
LQ work force change -0.23% -0.11% 0.04% -0.41% -0.03%
HQ work force change 0.04% 0.24% 0.22% -0.03% 0.22%
LQ (unempl-%) 0.78% 0.85% 0.72% 0.54% 0.73% 0.62%
HQ (unempl-%) 0.46% 0.32% 0.11% 0.12% 0.10% 0.12%
LQ low skilled labour H_COMP* "high competitiveness"
HQ high skilled labour L_COMP* "low competitiveness"
BENM Benchmark scenario (no policy,
1990)
H_LAB* high labour supply elasticity
ETREF Reference scenario (E-tax) L_LAB* low labour supply elasticity
Table 29: Results of the sensitivity analysis (international trade and labour supply)
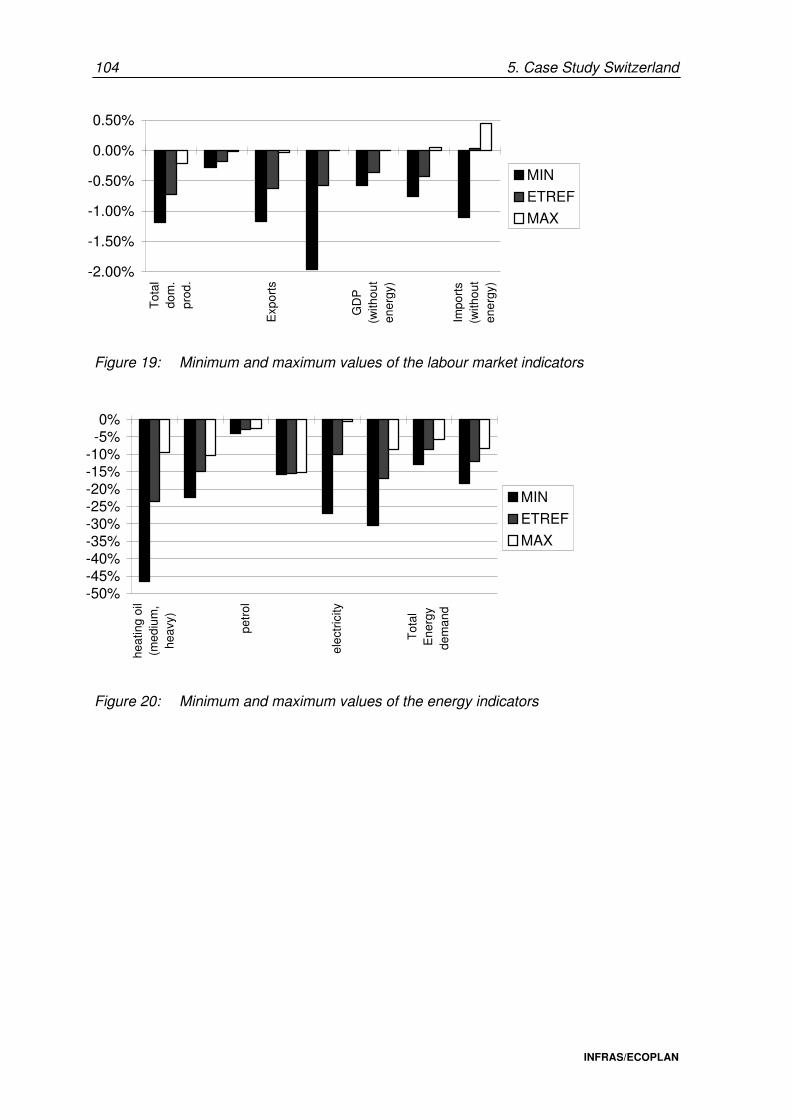
104 5. Case Study Switzerland
INFRAS/ECOPLAN
-2.00%
-1.50%
-1.00%
-0.50%
0.00%
0.50%
Tot
aldo
m.
prod
.
Exp
orts
GD
P(w
ithou
ten
ergy
)
Impo
rts
(with
out
ener
gy)
MIN
ETREF
MAX
Figure 19: Minimum and maximum values of the labour market indicators
-50%-45%-40%-35%-30%-25%-20%-15%-10%-5%0%
heat
ing
oil
(med
ium
,he
avy)
petr
ol
elec
tric
ity
Tot
alE
nerg
yde
man
d
MIN
ETREF
MAX
Figure 20: Minimum and maximum values of the energy indicators
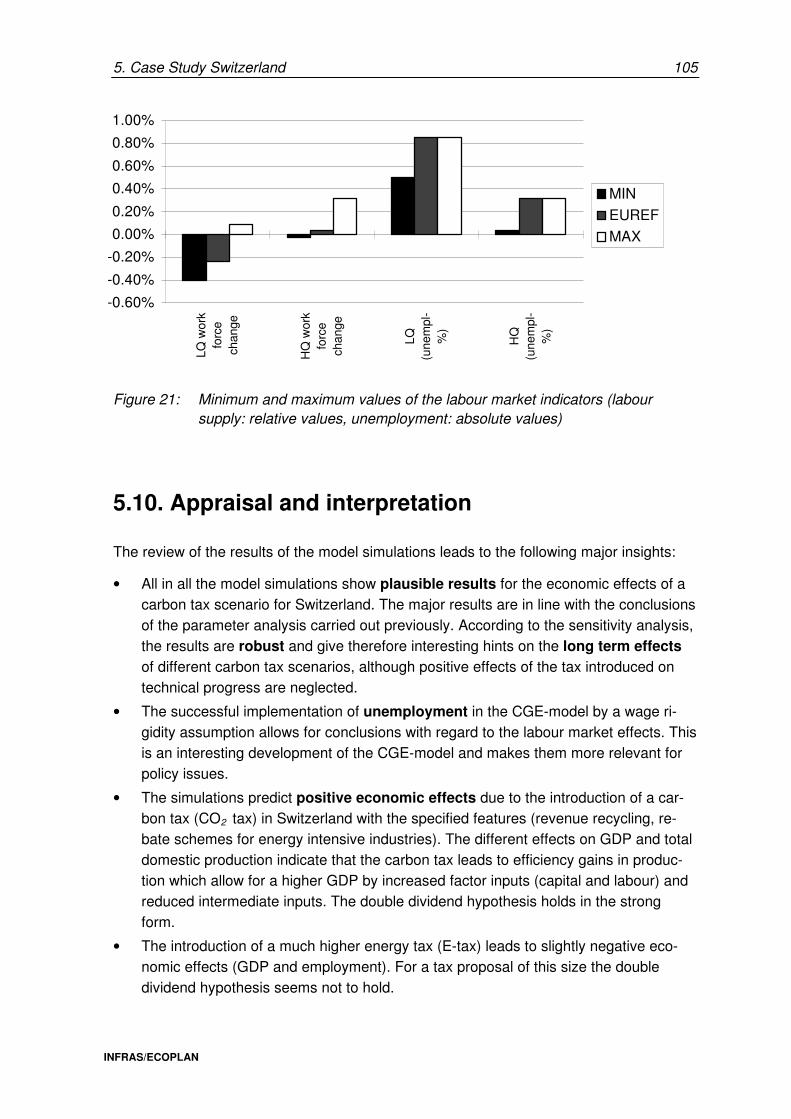
5. Case Study Switzerland 105
INFRAS/ECOPLAN
-0.60%
-0.40%
-0.20%
0.00%
0.20%
0.40%
0.60%
0.80%
1.00%
LQ w
ork
forc
ech
ange
HQ
wor
kfo
rce
chan
ge
LQ(u
nem
pl-
%)
HQ
(une
mpl
-%
)
MIN
EUREF
MAX
Figure 21: Minimum and maximum values of the labour market indicators (labour supply: relative values, unemployment: absolute values)
5.10. Appraisal and interpretation
The review of the results of the model simulations leads to the following major insights:
• All in all the model simulations show plausible results for the economic effects of a carbon tax scenario for Switzerland. The major results are in line with the conclusions of the parameter analysis carried out previously. According to the sensitivity analysis, the results are robust and give therefore interesting hints on the long term effects of different carbon tax scenarios, although positive effects of the tax introduced on technical progress are neglected.
• The successful implementation of unemployment in the CGE-model by a wage ri-gidity assumption allows for conclusions with regard to the labour market effects. This is an interesting development of the CGE-model and makes them more relevant for policy issues.
• The simulations predict positive economic effects due to the introduction of a car-bon tax (CO2 tax) in Switzerland with the specified features (revenue recycling, re-bate schemes for energy intensive industries). The different effects on GDP and total domestic production indicate that the carbon tax leads to efficiency gains in produc-tion which allow for a higher GDP by increased factor inputs (capital and labour) and reduced intermediate inputs. The double dividend hypothesis holds in the strong form.
• The introduction of a much higher energy tax (E-tax) leads to slightly negative eco-nomic effects (GDP and employment). For a tax proposal of this size the double dividend hypothesis seems not to hold.
106 5. Case Study Switzerland
INFRAS/ECOPLAN
• The exemption of energy intensive sectors plays a role: No exemption results in a slightly more negative overall effect in the case of the E-tax.
• The carbon and energy tax leads to significant reductions in energy consump-tion, which are in line with estimates of other studies.
• The conclusions regarding the CO2 tax scenario are valid for a first mover scenario, which is interesting from a policy oriented point of view.
• The overall economic effects are not significantly changed in a harmonised scena-rio characterised by a simultaneous introduction of a similar carbon tax in all other countries trading with Switzerland. However, from the point of view of the affected energy intensive branches, one must find the best possible way for rebates.
• If revenue recycling is designed more sophisticated with a targeted cut in social security contributions, the effects on employment are significantly improved.
• The effects of relevant changes in the model endogenous assumptions are rather small. Even model runs based on big changes in relevant model parameter in both directions show positive economic effects. The range of the effects on GDP in the CO2 tax case, for example, stretches from + 0.11 % (worst case) to + 0.36 % (best case) compared with the benchmark scenario.
• Among the model endogenous assumptions the substitution elasticity between energy and capital/labour and the elasticity of labour supply seem to be the most relevant.
• It has to be kept in mind that all results are generated under the assumption that the implemented tax shift will not induce a significant technological progress.

INFRAS/ECOPLAN
Part III: Conclusions

6. Output Sensitive Assumptions 109
INFRAS/ECOPLAN
6. Output-sensitive assumptions
6.1. ETR policy design
a) Levy side
• The long term price signals generated by the energy tax have to be announced well in advance credibly (ideally with a lead period of 5 - 10 years), clearly and in a re-liable way. Optimal impacts on GDP and on investment can be achieved by a step-wise introduction of the energy tax. This way, the economy has more time available to respond to the increase in energy prices and to adjust its production and invest-ment decisions to the future market situation.
• The CO2 tax curbs energy consumption and, through the recycling of revenues, reduces unemployment. The reduction in energy consumption depends mainly on the tax level: Jorgenson/Wilcoxen estimate for the United States that a carbon tax of 65 $/t will achieve a reduction of CO2 emissions of more than 30% by the year 2020 (in comparison to the emission of the year 1990). In order to achieve a stabilization of CO2 emissions at their 1990 level, the EU calculated that it would be necessary to in-troduce a tax of 10$/barrel of oil equivalent. In Switzerland, carbon emissions decrea-se by 12% with the introduction of a CO2 tax of about 45 $/t (36 CHF/t, see Felder/van Nieuwkoop 1996). For Germany, the DIW study estimates that the effect of an energy tax of 16 DM/GJ causes a reduction of CO2 emissions of about 20% with respect to the emission level of the year 1990. These proposals for energy CO2 taxes are not directly comparable as they measure the tax on a different base (ener-gy or CO2 content). Nevertheless, it is possible to recognise that the magnitude of the tax influences directly the energy consumption and therefore the emission level. The positive employment effects tend to be partly compensated by negative impacts on the productivity of labour. For the time being, no firm conclusions are possible in terms of up to what tax level and rate of implementation overall economic effects are still positive. There are studies pointing out that an annual increase of about 5% still leads to positive economic effects (e.g. DIW 1994, see also Majocchi 1994). On the other hand, the case study for Switzerland shows slightly negative impacts on impor-tant economic indicators, if a tax - implying price changes of about 50 to 100 % - is introduced in a relatively short time.
b) Revenue recycling
Different models for revenue recycling are analysed in different studies (see Table 9): lump sum payments to households and firms, reduction of social security contributions (SSC), targeted reduction of SSC, of the value added tax, of income taxes or of taxes on capital, or a proportional reduction of all existing taxes. The studies show the following impacts of different options of revenue recycling:
110 6. Output Sensitive Assumptions
INFRAS/ECOPLAN
• Compared to lowering SSC, lump sum payments to households show less favourable economic effects, in terms of employment and GDP. Lump sum payments - com-pared to reductions in SCC - lead to increased disposable incomes. Consequently, they tend to expand consumption, but also increase inflation. On the other hand, the lump sum payments have positive social effects: They compensate the regressive distributional effects of the energy tax.60
• A reduction of SSC has positive employment effects due to the induced substitution of energy by labour, a consequence of additional changes of relative prices. The level of the employment effects depends on the level of the income effect in comparison to the substitution effect. These effects work as follows:61
- Income effect: The overall price rise leads to a reduction in the purcha-sing power of economic agents. The demand for all goods is reduced. The income effect is linked to the degree of indexation of wages to the price level, to the speed of transmission of cost changes into prices and to the level of aggregate demand.
- Substitution effect: Facing the price changes induced by the energy tax, firms are encouraged to promote substitution of productions factors in order to balance the price rise.
• Targeted cut of SSC: the employment effect is particularly strong for low skilled wor-kers, as a downward wage-rigidity can in some cases lead to a considerable gap bet-ween productivity and labour costs. The price sensitivity for low skilled work is rela-tively high. The employment effects of a reduction of the labour costs for this worker segment are therefore particularly high - at least in the short run.62
• Reductions of the value added tax (VAT) do not help to reduce unemployment but can help to reduce the increase in price level due to the increasing energy prices. Compared to other designs of revenue recycling, the effect on the consumer price index is lower and private consumption achieves a higher level.
• A reduction in income taxes increases the disposable income of the households di-rectly but does not reduce labour costs. The employment effects are therefore neg-ligible (HERMES) or negative (QUEST). When this kind of revenue recycling is adopted, the expected increase of the price level is higher than with a reduction of labour costs. Furthermore, distributional effects are to the disadvantage of low in-come groups.
60 An in depth analysis of how negative distributional effects can be balanced out by using a balanced mix
of recycling models was presented by Mauch, Iten et al. (1993).
61 See Majocchi 1994
62 However, from a longterm point of view this policy tends to conserve technological structures and to slow down technological progress.
6. Output Sensitive Assumptions 111
INFRAS/ECOPLAN
• A reduction of capital tax leads to stronger incentives for capital formation, due to an increase in after-tax return on investment. GDP is expected to increase. The increase in capital formation and GDP can then generate positive employment effects in-directly. This effect depends on the magnitude of the income effect (due to the in-crease in GDP), relative to the substitution effect (the costs of capital have decreased in comparison to the costs of labour).
6.2. Framework conditions
a) International competitiveness
Generally, it is hypothesized that the introduction of CO2 energy tax - as a first mover - leads to negative effects on competitiveness, as prices of energy intensive products increase in comparison to the prices of foreign countries (changes in relative prices). Theoretical analyses of the effects on international competitiveness63 focus on the positive effects of a tax reform on innovation. The introduction of new technologies can partly offset the negative effects of energy price increase. As a consequence of the price increase, a country has an incentive to intensify the R&D efforts for new, less energy intensive technologies. This leads, in the long run, to a comparative advantage in the competitiveness of other countries - provided long term trends are toward higher energy prices.
The results of different empirical studies on environmental regulations show that there is no evidence for negative effects on international competitiveness64. The decision about plant location does not seem to be significantly affected by the degree of environmental regulation. Only for large multi-plant companies in pollution-intensive industries some evidence exists that their location choice is sensitive to differences in pollution regulation. For the time being, there are no studies available which analyse the location decision for new plants with regard to the introduction of an ETR. Some interesting studies, which concentrate on the US, show that the level of state taxes and public services and the degree of unionization are important factors for the plant location choice. These results indicate that the decision where to locate a new plant depends first of all on the variations in costs and opportunities between countries or states. An ETR which reduces labour and increases energy costs could, therefore, negatively influence the location choice of energy intensive industries. On the other hand, a positive incentive is created for labour-intensive industries and modern energy extensive sectors - such as the telecom industry and other parts of the service sector.
For a more detailed analysis of the effects on competitiveness of a CO2/energy tax it is necessary to consider the following two scenarios:
63 See for example Weder 1995
64 See Jaffe et al. 1995
112 6. Output Sensitive Assumptions
INFRAS/ECOPLAN
1. First mover
A first mover country without measures for offsetting the price increase of its export goods will - in the short run - incur a loss in international competitiveness for its energy intensive sectors. In the long run, the price increase accelerates technological change and the introduction of energy saving innovations which lead to a competitive advantage in these new markets. There are as yet no analyses available which consider the effects of offsetting measures at the border. Only the ECOPLAN model for Switzerland considers measures for offsetting negative effects on competitiveness. The offsetting measures are surprisingly effective. Unless these measures are integrated in the ETR policy - and considered by the simulation models predicted effects on competitiveness of a first mover scenario are negatively biased.
The assumptions with regard to the reaction of the exchange rate have implications for the competitiveness of the country. With flexible exchange rates, the purchasing power parity between the countries is re-adjusted in medium run (after a price shock). It must also be considered that changes in the exchange rates (appreciation or depreciation of the currency) can have a major importance for the competitiveness of a nation.65 The price increases induced by an ETR are often small compared to changes in the exchange rate.
The relevance and the degree of international competition in the energy intensive indus-tries of the first mover nation is decisive for the effects on international competition.
2. International harmonisation
Empirical results of the international harmonisation scenario on international competiti-veness are ambiguous. Few studies (e.g. EU 1992) show a negative impact on interna-tional trade, which is generated by the reduction in GDP in countries which introduce an ETR. Due to the reduction of incomes, imports as well as international trade as a whole tend to decrease. The negative effects of the CO2/energy tax on international trade de-pend on the assumptions with respect to the level of the income effect (decrease in GDP due to a reduction in the purchasing power of economic agents) and on the substitution elasticities between domestic and foreign production (if it is easy or not to switch from imported to domestic goods).
b) Energy market
As a major - and desired - effect of taxation, there will be a significant drop in energy consumption. The decrease in energy demand depends primarily on the level of the tax for the different kind of energies (fossil fuels, electricity). The effects on the demand for the different energies depend on the design of the tax (tax depending on the carbon con-tent and/or energy content). On the other hand, the demand for energy efficiency tech-
65 See Kirchgässner 1996
6. Output Sensitive Assumptions 113
INFRAS/ECOPLAN
nologies raises correspondingly.66 An important net result for a country like Switzerland is the substitution of imported energy by domestic production of energy conservation technologies.
A significant and sudden decrease in the worldwide energy demand would imply a reduction in world energy prices, which would countereffect the aims of the taxation. However, a considerable reaction of the world energy market on the drop in energy demand seems not to be very likely if only one country or even if the EU would phase-in an energy tax.67. A major decrease in world energy prices is only to be expected if practi-cally all non-OPEC countries were to introduce an energy tax.
It is interesting to note that the estimate for the potential of energy saving investment differs, depending on the approach used. Economic models in general do not estimate the future potential efficiency gains of innovation, or they assume high adjustment costs. On the other hand, engineering studies which use a bottom-up approach show much more optimistic results with considerable no-regrets potentials. These findings suggest that adjustment costs are often overestimated in top-down economic simulation models. The energy efficiency gap68 (gap between top-down macroeconomic models and bottom-up, engineering models) will be an important topic to discuss in the meta analysis.
c) Labour market
In the theoretical models the analysis of the employment effects of a tax shift focuses on the counteractive effects of income and substitution effects of energy taxation. The in-come effect generates a negative impact on labour demand because the net wage decreases. The income effect is linked to the degree of indexation of wages to the price level, to the magnitude of the substitution effect, to the speed of transmission of the cost changes into prices and to the level of aggregate demand.69 This negative effect is compensated by the positive effect generated from the reduction in labour costs (through reduction in SSC) and the corresponding substitution of imported energy and capital by labour. Therefore, the resulting net employment effect depends on which of these two effects dominates. From a theoretical point of view, the hypothesis is obvious, that in the short run, the income effect will prevail since the adjustment possibilities are limited.70 The potential for substitution between production factors is larger in the long run as it depends, at least partly, on the installation of new equipment. Most of the simulation
66 Particularly in sectors such as building renovation, new building materials, energy efficiency and
monitoring equipment etc.
67 See CE 1992
68 See OECD 1995
69 See Majocchi 1994
70 Here is where limited impulse programmes for energy efficiency technologies could present this short run negative effect.
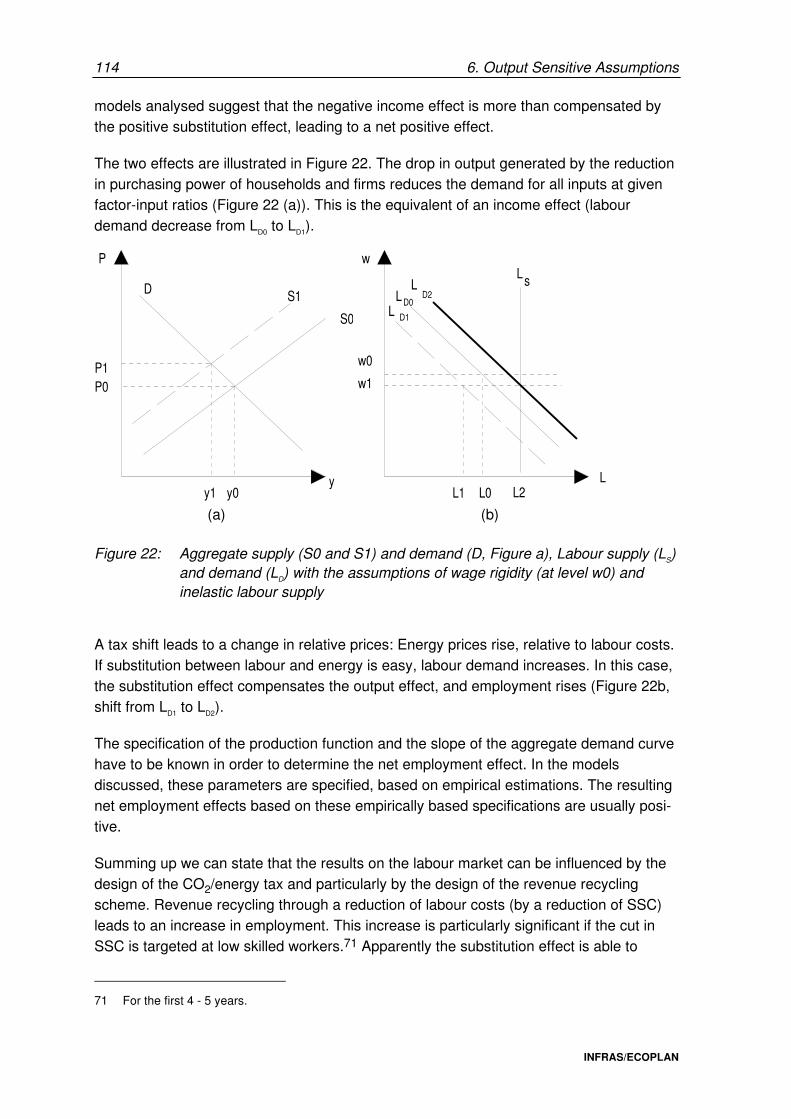
114 6. Output Sensitive Assumptions
INFRAS/ECOPLAN
models analysed suggest that the negative income effect is more than compensated by the positive substitution effect, leading to a net positive effect.
The two effects are illustrated in Figure 22. The drop in output generated by the reduction in purchasing power of households and firms reduces the demand for all inputs at given factor-input ratios (Figure 22 (a)). This is the equivalent of an income effect (labour demand decrease from LD0 to LD1).
P
y
P0P1
y0y1
S0
S1D
w
w0
w1
L0L1L
Ls
L2
LD2
D0
D1LL
(a) (b)
Figure 22: Aggregate supply (S0 and S1) and demand (D, Figure a), Labour supply (LS) and demand (LD) with the assumptions of wage rigidity (at level w0) and inelastic labour supply
A tax shift leads to a change in relative prices: Energy prices rise, relative to labour costs. If substitution between labour and energy is easy, labour demand increases. In this case, the substitution effect compensates the output effect, and employment rises (Figure 22b, shift from LD1 to LD2).
The specification of the production function and the slope of the aggregate demand curve have to be known in order to determine the net employment effect. In the models discussed, these parameters are specified, based on empirical estimations. The resulting net employment effects based on these empirically based specifications are usually posi-tive.
Summing up we can state that the results on the labour market can be influenced by the design of the CO2/energy tax and particularly by the design of the revenue recycling scheme. Revenue recycling through a reduction of labour costs (by a reduction of SSC) leads to an increase in employment. This increase is particularly significant if the cut in SSC is targeted at low skilled workers.71 Apparently the substitution effect is able to
71 For the first 4 - 5 years.
6. Output Sensitive Assumptions 115
INFRAS/ECOPLAN
compensate the income effect if a tax shift implying higher energy and lower labour costs is applied. The models analysed show that a CO2/energy tax with a revenue recycling through reduction of SSC leads to employment effects which vary between zero (EU study modelled with QUEST) and 2% (DIW, modelled with a macroeconomic model combined with an input-output analysis).
6.3. Model endogenous assumptions (model architecture)
a) Dynamic aspects
Empirical simulation models usually do not consider dynamic aspects realistically. Par-ticularly, technical progress due to changes in relative prices is neglected. The change in relative prices creates an incentive towards investing more in R&D of new energy saving technologies. It is also important to note that the increase of energy prices improves the competitiveness of technologies, which are not able to compete with the traditional technologies at the original low price level of energy. With increasing energy prices it be-comes attractive to invest in these new technologies. Models which take the shift in tech-nology development into account show more positive employment and GDP effects compared to static models.72 Technical progress is an important determinant for the date of introduction and price of backstop technologies. The adjustment costs of the economy are directly affected by the availability and the costs of such technologies.73 Models abstracting from induced technical progress are correspondingly overestimating adjust-ment costs to the tax shift (see also chapter 7).
b) Substitutability/complementarity of input factors
The model assumptions on the substitutability/complementarity of input factors have im-portant implications on the final demand of labour, energy and capital. The assumptions of complementarity of input factors implies that the price increase of energy leads to a negative impact on demand capital and labour as well. On the other hand, if the substi-tution between energy and labour dominates complementarity (the substitution elasticity is high), labour demand is positively affected by an energy price increase.
The production functions applied in models like HERMES assume a combination of ca-pital/energy and a combination of labour/non-energy intermediate inputs.74 With this structure of the production function, an increase in the relative price of energy makes the
72 See de Wit 1994. The survey presents the study of EnTech (developed at Vrije Universiteit) which
explaines technology development endogenously. The expenses in R&D are explicitly taken into account in the model.
73 See OECD 1994
74 See CE 1992b
116 6. Output Sensitive Assumptions
INFRAS/ECOPLAN
capital/energy combination more expensive (due to the complementarity between energy and capital). This effect can result in decreased demand for capital (and investments). Most probably, due to this assumption, the negative economic effects of a tax shift are overstressed, because it is implying that the industries have only very limited possibilities for investing in new energy saving technologies.
The substitutabillity between low and high skilled workers is implemented in some simulations (this distinction is interesting for the discussion regarding a targeted reduction of SSC).
c) Price elasticities of labour supply
The general equilibrium models usually assume full employment75, an assumption which is far from reality. As a consequence, the positive employment effect due to a reduction of SSC are smaller or non-existent than in a case with involuntary unemployment. This is due to the fact that in models with full employment primarily labour supply (more precisely the elasticity of labour supply) is determining overall employment. On the other hand, in models with involuntary unemployment due to wage rigidities (as often introduced in macroeconomic models), labour demand determines employment. In general equilibrium models different assumptions with regard to the elasticities of labour supply are introduced. Some studies assume a positive elasticity of labour supply, whereas other apply estimates close to zero (at least for men). The employment effects are higher in models assuming higher elasticities of labour supply.
In the case of Switzerland, the integration of involuntary unemployment through the assumption of the existence of wage rigidities seems to be the most realistic approach (see the case study with the ECOPLAN CGEM). In this case the assumption with regard to the elasticity of labour supply is not relevant for the resulting employment effects (at least for moderate changes).
6.4. Conclusions
The review of the selected theoretical and empirical studies plus the evaluation of the Swiss case study (chapter 5) show a number of convergent results. Some questions still remain open, as the models do not analyse all aspects systematically. The list below summarizes the most relevant convergent and divergent results and formulates remaining questions. The conclusions are relevant for EU and GGA policy in general and Swiss policy in particular.
75 Sometimes combined with voluntary unemployment
6. Output Sensitive Assumptions 117
INFRAS/ECOPLAN
1. Convergent results
Assumptions regarding revenue recycling:
• A reduction of the social security contribution (SSC) increases employment and decreases unemployment.
• A targeted reduction of SSC for the low skilled workforce reinforces these impacts in the low skilled workers segment.
• Revenue recycling by lump sum payments to households is the solution with the weakest employment effects in comparison with other solutions analysed. However, it has positive distributional effects.
• A reduction of capital taxes has positive effects specifically on the investment rate. The introduction of a CO2/energy tax without a reduction of taxes on capital leads to a cut in the rate of investment.
• Redistribution by a reduction in income taxes leads to negative economic results (GDP, employment and investment decrease more than in the scenarios with alter-native revenue recycling designs).
• The redistribution of the tax revenues in the form of a reduction of the value added taxes affects private consumption and investment, GDP and employment positively.
Assumptions regarding the levy side:
• Negative effects on GDP will be limited if the tax is phased in gradually. Excessive speeds of introduction of the tax leads to negative effects on GDP, due to desin-vestment which can be provoked.
Assumptions regarding the elasticities introduced in the models:
• A low substitution elasticity between energy and capital linked to substitution possibilities of capital with labour, leads to positive employment effects.
• The positive employment effect is even enhanced if labour is a better substitute for energy than capital. However it is still an open question which substitution elasticities reflect reality correctly. In the models analysed differing assumption regarding this aspect are made.
• In a full employment situation the elasticities of labour supply are nearly zero for men but are greater than zero for women: a positive elasticity for labour supply leads to a reduction of employment when (real) income decreases.
118 6. Output Sensitive Assumptions
INFRAS/ECOPLAN
• The income (IE) and the substitution (SE) effects on employment determine the final employment effect of a CO2/energy tax: - if IE > SE → negative overall employment effect - if SE > IE → positive overall employment effect It is usually assumed76 that the substitution effect compensates the income effect and therefore the estimated employment effects are in general positive.
Further unconditional77 convergent results:
• Energy tax (pure energy tax or combined energy/carbon tax) reduces energy con-sumption.
• The introduction of a tax on energy has a direct impact on prices (CPI increases). This effect is at least partially compensated if the revenues are fully recycled. A full compensation can be achieved by adjusting the price index, e.g. by the integration of lump sum paid back to households into the price index.
Further conditional, convergent results:
• In the case of first mover situation without offsetting measures: The higher the inter-national capital mobility, the more negative the effects on the main economic indica-tors (investment, employment, etc.).
• The employment effects depend on the bargaining power of the trade unions: if the trade unions are politically strong, the employment effect will be reduced (as the cost reduction for the empoyees will be partially compensated by salary increases).
• The response of the exchange rate influences the international competitiveness of the country. Flexible exchange rates compensate possible price increase due to the tax shift (according to the purchasing power parity) and allow for minimal effects on international competitiveness.
• The shift of taxes from a broad (labour) to a narrow (energy) tax base causes an increase in tax distortions (tax burden).78 If the environmental tax is finally borne by labour, taxing the narrow energy base will lead to larger distortions than taxing the larger labour base directly. On the other hand, there are also studies which show that a narrow tax might be preferable to a large one.79
76 See Kirchgässner 1996
77 „Unconditional“ means that the results do not depend on the model endogenous assumptions.
78 See Kirchgässner 1996
79 Kirchgässner 1996 makes the example of Brennan and Buchanan (The Power of Tax, Analytical Foundations of a Fiscal Constitution, 1980). The positive effects of a narrow tax base are seen in the possibility of the citizens to force government to pursue a policy according to their preferences.
6. Output Sensitive Assumptions 119
INFRAS/ECOPLAN
2. Divergent results
There are two major aspects with divergent results:
• Firstly, studies show controversial results with regard to the effects of revenue re-cycling on GDP. A number of studies come up with slightly negative results for GDP (and partly for international trade) even if the revenues are recycled by a cut of the SSC. Generally, the results improve over time as the substitution process in the di-rection of labour takes place only in the medium run (through replacement of capital stock).
• The effects of international harmonisation on international competitiveness are also ambiguous. The divergencies are mainly due to divergent assumptions regarding the magnitude of the reduction in domestic GDP due to the introduction of an ETR abroad (because of a reduction in foreign demand). A second explanation for the ambiguous results are the differing assumptions regarding the potential shift of the tax burden to foreign trade partners by an increase in export prices.
There are quite a number of conclusions which are well consolidated in the analysed theoretical and empirical studies. Nevertheless, there remain a number of open questions which have to be answered in the future:
3. Open questions
• In general the dynamic effects of technical progress are not considered realistically in the models applied so far. This is the major deficiency.
• The majority of the models considers only voluntary unemployment and therefore only situations where labour supply - and not labour demand - determines real wage80. The consideration of involuntary employment due, for example, to wage rigidities is likely to strenghten positive employment effects.
• The effects of compensation for offsetting negative competitiveness effects are mostly not considered in the top-down models (relates to the dynamic analysis).
• The empirical basis regarding the substitution elasticities between capital, labour and energy is still weak. E.g. it is still not well known whether labour is a better substitute for energy than capital. Furthermore, the substitution elasticities introduced in the mo-dels are usually derived from an empirical basis reflecting changes of factor inputs due to changes in relative prices only in one direction. For example, the substitution elasticities between capital and labour are derived from a data base reflecting a time period with substitution of labour by capital. For the time being, the symmetry of
80 Under the realistic assumption of an inelastic labour supply.

120 6. Output Sensitive Assumptions
INFRAS/ECOPLAN
these elasticities is not established, even if it is quite decisive for estimating the employment effects due to a change in the relative prices.
• Models do not explicitly address the issue of the optimal speed of introduction of a CO2/energy tax that minimizes adjustment costs and maximises environmental benefits generated by a reduction in energy consumption.
• What types of models must be used to reliably simulate impacts of a stepwise longer term and fundamental tax shift process, extending over two to three decades and shifting major parts (e.g. half) of the existing taxes from labour, capital and VAT to energy and other environmental resources?
The hypothesis is that the major challenge for modelling these effects is to deal with regulatory driven innovations, technological progress and the market penetration of new technologies.
The following meta analysis addresses some of the questions.

7. Meta Analysis 121
INFRAS/ECOPLAN
7. Meta analysis
7.1. Analysis of gaps in the models considered
So far the analysis was based on the most relevant conventional „top-down“ models applied for the analysis of economic impacts of Ecotax proposals.
In the meta analysis the focus is on the question of whether alternative or complementary approaches could enhance the analysis in order to yield a more comprehensive picture of the economic impacts of ETR proposals.
The most significant weaknesses or gaps of the conventional models considered can be summarized as follows:
The models are sophisticated and therefore complex and sometimes intransparent. Equally important, a number of restrictions and assumptions have to be introduced in order to make the models still computable. For example the rigidity of the structure of the economy and technical progress which is at best introduced by exogenous assumptions. Therefore the models are more appropriate for the analysis of short and medium term impacts. But even for the short and perhaps medium term analysis there are a number of drawbacks:
• Most models cannot or do not consider policy instruments for offsetting negative im-pacts on international competitiveness.
• The assumptions on capital mobility play an important role for the economic impacts of Ecotax. Often the models assume full mobility of capital. In reality there are factors which constrain the capital mobility.
• There are potentials for energy saving measures which could be realized at near zero cost. The potentials are supposed to exist due to certain institutional barriers, lack of information, rigidities and other transaction costs, which could be lowered or removed. Within the top-down models analysed such potentials are not considered. Top-down models inherently assume that the present energy economy is in an opti-mal state. If such potentials really exist, it would imply that the conventional top-down models overestimate the costs for improving energy efficiency and show therefore too high adjustment costs due to the introduction of an energy tax.
With regard to the long term analysis the following questions - which still are not handled in conventional models - influence outputs:
• What type of dynamic structural changes are triggered off by a long term oriented Ecotax reform, which is implemented stepwise over one to two decades?

122 7. Meta Analysis
INFRAS/ECOPLAN
• How do innovations and technical progress change the results of the static type of analyses? Specifically in terms of competitiveness on international markets, employment, import/export, and incomes?
• What type of innovations and technical progress do these incentives trigger off and are involved in the structural change processes?
7.2. Technical progress, innovations and the role of environmental regulation
Factors determining environmental innovations
Although there is much literature on technological innovation in general, relatively little attention has been paid to the problem, specifically from the point of view of environ-mental innovations. Figure 23 shows a mental model of how various factors determine environmental innovations (Hemmelskamp 1995). Energy and/or environmental prices (charges and taxes) are but one category among these, but an important one.
Figure 23: Factors determining environmental innovations (source Hemmelskamp 1995)
7. Meta Analysis 123
INFRAS/ECOPLAN
Hemmelskamp concludes - on the basis of a systematic and relatively broad based analysis - that „... direct regulation (command and control) ... provide little incentives for dynamic effects and that emission taxes and permits are better instruments to promote innovations“.
Slack in imperfect markets
The debate on the mechanisms and impacts of technological progress in general, and regulation - or ETR driven in particular, is carried out in two different but related contexts. First there is the general debate on the extent to which unregulated markets systemati-cally operate less efficiently than they could because even financially viable environmen-tal innovations are not pitched up by the majority of firms. This leads to the second and more specific question: Whether active, relatively stringent and progressive environmental regulation is capable of improving the ecological and economic performance merely by raising awareness and consciousness in public and in business environments.
Porter and van der Linde (1995) report a whole series of empirical data and case studies, illustrating examples81 of innovations driven by environmental regulation. It must be stressed that neither theoretical argumentation nor these illustrations mathematically pro-ve the unconditional existence of the double dividend. By the same argument, however, the criticisms of Porter's illustrations and arguments (e.g. Palmer, 1995) are insufficient to generally disprove Porter's hypothesis. Clearly, more precise conceptual models should be developed - as a precondition for a better quantitative understanding of the innovation offsets of static costs of good environmental regulation.
The debate between Porter/van der Linde (1990, 1995) on the one hand, and Palmer, Wallace and Portney (1995) and others on the other illustrate the state related to this debate. Analysing the arguments and the empirical evidence of both views the conclusion can only be that neither side denies that markets are neither static nor perfect in terms of picking up all and the last 10 US$ bills on the street; i.e. that there remains some degree of efficiency slack. It’s neither claimed (by Porter’s line of argument) that all firms can realize a double benefit, nor do Palmer et al. deny the existence of Porter’s case studies where double benefits are realized. The question is how much slack exists and how much of this slack can be removed with environmental regulation (because this sharpens the sight of R+D divisions and managers to detect 10$ bills lying on the street).
At this moment there seems no answer available to this question. However it can be safely said that there are always winners and losers. It can also be defined that:
- if ETR revenues are fully recycled and
81 Among them a relatively extensive study by Dorfmann et al. (1992), reporting on 181 source reduction
activities in 29 chemical plants in the USA. Of those activities with more detailed data available, 95 % of them showed an increase in product yield; 2/3 of the cases with needed investments showed pay back periods of six months or less; the average monetary savings per dollar invested were $ 3.50.

124 7. Meta Analysis
INFRAS/ECOPLAN
- if ETR is introduced smoothly
the results - both in terms of economic performance and ecological effectiveness - will be improved.
Innovation and technological progress
Over and above the aspects of efficiency slacks in real markets as discussed above there is the aspect of regulatory driven innovation, even if markets were perfect.
Static models describe a world in which technology, production processes, products and consumer needs are all fixed. Firms produce the same type of products with unchanged technologies. In this sense they do not react to increased energy prices and lower labour costs. In input-output models, this assumption is based on fixed technological coefficients in the input-output matrix. For example, the construction sector or the agricultural sector will still use the same amount of inputs from the energy sector per unit of construction or agricultural output, even if energy prices increase.82
Undoubtedly these static assumptions are unreal. They lead to an overestimation of the cost of an ETR and a corresponding underestimation of the benefits. Of course, innova-tion and technological progress have been and are driven by a variety of factors. While in the past a main factor determining the thrust of innovations on the cost side has been the tacit assumption and expectation that productivity increases primarily mean (or are quasi identical) to labour productivity. As a result, innovation processes essentially were guided by the objective to substitute labour (even more costly) by other inputs: energy, capital and information and know-how.83
Perspective for quantitative estimates
The meta analysis of these aspects had to be restricted to qualitative models. Quanti-tative and empirically based models could possibly be developed using the following approach of combining longitudinal and lateral empirical analysis:
Short and medium term technological responses to the (all too rapid, but not lasting), changes in world energy price perspectives84 in the 1970’s and 1980’s. Long term leadership of environmental innovations could be estimated by means of long term longitudinal analysis of energy efficiency of technology applied in different regions of the world with different energy price levels (international cross-sector). Approaches of this kind have been developed and applied in Ford Foundation 1974 (retrospective longi- 82 The model reacts only in the sense that the structure of final demand will change.
83 It is recognised that energy and information are derived production factors. Nevertheless it is convenient to look at them as substitutes for labour, capital.
84 It must be stressed that investment behaviour is determined not by actual short term prices, but by perceptions about long term trends of energy prices.
7. Meta Analysis 125
INFRAS/ECOPLAN
tudinal simulation), and Jesinghaus 1993 (contribution of crosssectural and longitudinal analysis of the fuel efficiency in the transportation sector)85.
Static and dynamic worlds: innovation and technological progress
As it turns out, in most of the existing models the single most important limitations relate to the neglect or inadequate consideration of dynamic phenomena, in particular of pro-cesses of innovation and technological progress as they are driven by good environ-mental regulation. It can be shown that this restriction leads to results which are too ne-gative in terms of those economic output parameters which - today - are considered as being of primordial importance: The impacts of ETR on international competitiveness, imports and exports, transfers of capital investment, unemployment, GDP and incomes.
7.3. Transitional phenomena: The relevance of time rates of change
A model can be called dynamic only if it explicitly deals with stock variables and flow variables separately and describes how the time rates of change of stock variables are dependent on flow variables. Concretely: A stock of vehicles and infrastructure of a transportation system or a stock of existing buildings or appliances is slowly turned over by means of yearly flows of vehicles, appliances, buildings etc. which are coming into use on the one hand, and old ones which are decommissioned on the other end. In turn, energy intensities of these flows are changing slowly - and with time delays - as a func-tion of many driving variables, notably of prices of energy, labour and capital.
Different lifetimes of stocks (vehicles, appliances, furnitures, buildings, bridges, roads, tunnels, powerplants, but even lifestyles of younger and older people) define a cascade of dynamic responses with response times varying from a few months (driving styles) to a few years (appliances, cars) or decades (infrastructures, settlement structures, lifestyles etc.). This type of qualitative meta analysis can be developed into partially quantitative dimensions. For example, it can be shown that elasticity coefficients in effect are transi-tional functions of time and that longterm elasticities may have to be looked at over many decades, not only 5 to 10 years (see Figure 24). Combined with selective bottom-up analysis the shape of such dynamic elasticity functions can be estimated.
This type of dynamic and bottom-up "labour" is needed - complementing large economic models - if phenomena of technological response to changing prices are to be taken into consideration in order to remove the static assumption limitations of models.
85 Today the calibration of the Ford Foundation approach could be extended over a much longer period
than it was possible in 1974.
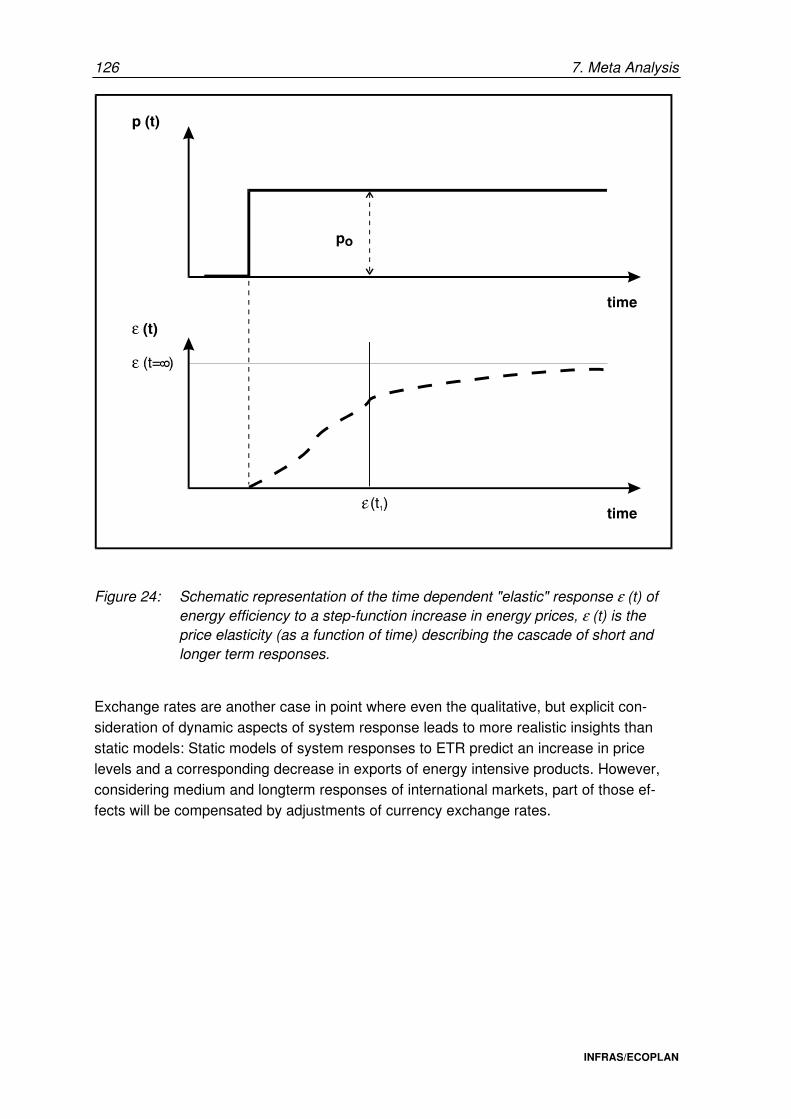
126 7. Meta Analysis
INFRAS/ECOPLAN
Figure 24: Schematic representation of the time dependent "elastic" response ε (t) of energy efficiency to a step-function increase in energy prices, ε (t) is the price elasticity (as a function of time) describing the cascade of short and longer term responses.
Exchange rates are another case in point where even the qualitative, but explicit con-sideration of dynamic aspects of system response leads to more realistic insights than static models: Static models of system responses to ETR predict an increase in price levels and a corresponding decrease in exports of energy intensive products. However, considering medium and longterm responses of international markets, part of those ef-fects will be compensated by adjustments of currency exchange rates.

7. Meta Analysis 127
INFRAS/ECOPLAN
7.4. International competitiveness: Impact of offsetting strategies
The problem
Competitiveness concerns are one of the key barriers preventing the introduction of an ETR. In Switzerland, the EU and in other OECD countries, perceptions that the tax might damage the international competitiveness of the national economy and therefore would lead to significant job losses are one of the key factors hindering the implementation of environmental taxes (CO2, energy). Particularly, representatives of energy intensive industries - in Switzerland e.g. paper, glass, cement, textiles, iron and steel, chemical products a.s.o. - fiercely resist the implementation of a tax reform. On the other hand, industries who would benefit from environmental tax shifts did not actively promote such a policy. It is a well known insight of modern political economics that those who fear disadvantages due to a proposed policy change, fight more intensively for their interests than those who would benefit. In the case of the implementation of an ETR, this pheno-menon becomes particularly relevant, because the benefits of the ETR are - while ge-nerally small - distributed more widely than the losses. An ETR proposal therefore can only be successful if winners and losers of the ETR can be identified ex-ante, and if supporting measures for compensating losers are integrated in the reform package.
This means that the analysis of the competitiveness impacts of the indroduction of an ETR is particularly relevant. The simulation models analysed give only restricted insights with regard to this issue. Particularly they neglect two important aspects:
- Most of the models do not consider the effects of compensation mea-sures in order to offset negative effects for energy intensive industries.
- The models are static and do not consider long term dynamic impacts of an ETR such as the induction of innovations and related possible first mover advantages.
Even though they neglect technological progress, most of the models show no relevant negative impacts on international competitiveness of the total of the national industry due to the implementation of a moderate, reasonably designed tax reform (see chapter 6). But usually, negative impacts to certain energy industries occur and are at least partly compensated by positive impacts of the rest of the industries (see the comment on industry/sector specific results generated by the case study Switzerland in chapter 5). Earlier analysis on the sector specific effects of the implementation are carried out in INFRAS 1994.
Supplementary analyses - relaxing critical assumptions - applying different methodologies can provide more insight in this issues.

128 7. Meta Analysis
INFRAS/ECOPLAN
Policies to offset negative impacts on competitiveness
Existing policies: In recent years several European countries have introduced energy and/or carbon taxes. The most important examples are the Scandinavian countries; Denmark, Finland, Norway and Sweden86. Most of them include exemptions or substantial rate reductions for energy intensive industries. Also the earlier proposals in Switzerland for a carbon tax (see BUWAL 1992) or for an energy tax (see EFV 1988) included a rebate scheme for energy intensive industries (see INFRAS 1994). The EU proposal included partial or full exemptions for all industries which pass thresholds of energy intensity. The question arises if these well established offsetting strategies can be evaluated as an efficient way for offsetting the feared negative impacts on competitiveness.
Criteria for the evaluation of offsetting policies: Criteria for the evaluation of offsetting strategies have been formulated by INFRAS 1994 or by Hoerner 1996. The most relevant criteria can be summarized as follows:
- Maximal effectiveness: The measures should be effective, i.e. they should be able to provide a sufficient protection of the domestic in-dustries against untaxed foreign competitors.
- Minimal loss in incentive effects: The measures should not reduce the incentive effects of the environmental tax introduced.
- Administrative efficiency: The measures should be administratively feasible at minimal cost.
From the point of view of an economic efficient environmental policy the major concern is clearly on the incentive effects. Offsetting measures should not water down the initial incentive effect of the tax introduced.
Assessing existing strategies: Most strategies actually implemented or under serious discussion exempt energy in-tensive industries from the tax. With regard to the three main criteria formulated above, primarily one major drawback of these policies can be identified:
The strategies eliminate the tax incentive precisely for those segments of the economy with the most intensive energy use. If there is a full exemption of energy intensive industries, there remains no incentive effect at all. But also in the case of rebate schemes as proposed within the Swiss proposal for a carbon tax, there remains no incentive for energy intensive industries with an energy intensity above the (politically defined) thres-hold. For these enterprises, the tax effect corresponds to a lump sum payment, not de-pending of the level of energy consumption. Correspondingly, there remains no incentive for the introduction of energy saving measures or for innovations to develop more efficient processes and to substitute away from energy intensive products.
86 The UK with its fuel price escalator is a special case.
7. Meta Analysis 129
INFRAS/ECOPLAN
For Switzerland, it is sometimes argued that this is not a major problem, because of two reasons:
- Energy intensive industries are less important in Switzerland compared to other OECD countries. Industries with an energy intensity above 3%87 are producing only about 2 % of total GDP. Nevertheless the ener-gy consumption of these industries amounts to about 10 % of total energy consumption (see INFRAS 1994).
- Energy intensive industries have realized the possible energy saving measures because energy costs are already a relevant cost factor be-fore the introduction of an energy tax. An additional energy price increa-se would therefore not lead to a further improvement of energy efficien-cy but to an evasion of the affected companies. The elimination of the incentive effect by the offsetting measure is therefore considered as irrelevant.
While the first argument is correct and can be taken as a plea for a pragmatic approach to policy design, the second argument is logically incorrect. Even if energy intensive industries have implemented all (economically viable) energy conservation measures, they have done these so far under past and present energy prices. The conclusion that higher energy prices would not lead to further progress is simply wrong. It also - implicitly and tacitly - says that changing framework conditions such as ETR do not induce any technical innovations.
There are alternate approaches to the exemption and rebate philosophy. These alter-natives are simultaneously effective with regard to the protection against biased inter-national competition; efficient with regard to the incentives towards improving energy effi-ciency; and implementable at administrative costs of a reasonable order of magnitude compared with the efficiency effects achieved.
Alternative approaches: Several alternative approaches have been developed by INFRAS in earlier studies in this domain (see INFRAS 1994a and b) and Hoerner 1996. Two of these are of particular interest in this context:
Border tax adjustments (BTA): The basic idea of border tax adjustment consists in off-setting all additional price differentials due to the introduction of an energy (or other form of environmental tax) by charging imported goods with the energy tax and discharging exported goods from the energy tax at the border according to the energy content of the traded goods.88 The energy content of the goods is called embodied energy or someti-mes „grey energy“.
87 Energy intensity defined as the share of total energy costs in the total turnover of a company
88 An analogous procedure is implemented in the context of a carbon tax: In this case the border tax adjustment is based on the carbon content of the traded goods.
130 7. Meta Analysis
INFRAS/ECOPLAN
With BTA rebate the tax on energy used to produce exported goods is rebated and a comparable charge on the embodied energy imports is imposed. It is important to see that border tax adjustments are not necessary (and not feasible) to be applied to goods with low energy intensity. For most of the traded goods, an energy tax with a maximum level in the order of magnitude as politically discussed so far (like the proposal of the EU for a combined energy/carbon tax or the proposal of the Swiss government for a carbon tax, see section 5) will not lead to relevant market distortions. Goods of a high level of manufacturing using those raw materials incur no relevant price effect due to an energy or carbon tax. E.g. no relevant competitiveness effects occur for watches or machines because the energy tax is such a small part of the total value of the finished goods that the resulting price increases have a negligible price impact on the final sale price.
According to INFRAS 1994, only about 100 categories of goods (out of the about 3500 categories officially registered by Swiss customs) will lead to a price differential of more than 2 % of current market prices. Hoerner 1996 comes up with an even lower number of goods, which are affected in a way which can be considered as relevant for competitive-ness aspects: „ ... only a handful of carbon-intensive raw materials industries will see price increases under the reference Swiss tax that are large enough to pose a meaningful threat to competitiveness. BTAs on bulk transfer of ten to twenty basic materials - unfa-bricated metals, bulk glass and paper, fertilizer and a few chemicals - should suffice to offset nearly all discernible impacts“ (see Hoerner 1996, p.22/23).
If the number of BTA relevant goods is restricted, implementation of BTA is administra-tively feasible, particularly on the export side. A possible approach for the implementation of BTA is the „energy-added tax“ method (see Hoerner/Muller 1996). This method is administratively similar to an invoice method value-added tax used throughout Europe. The tax paid on the energy embodied in the goods is recorded on the invoice. As with the VAT, the domestic exporter presents the invoice for taxes previously paid on exported goods to the tax authority for a refund. For imports, Hoerner/ Muller 1996 suggest the so called „predominant method“, a GATT compatible approach for adjusting energy intensive import goods. This method is already implemented in the United States, e.g. with the „Superfund Tax“ on traded chemicals which are not themselves directly taxable, but are produced with taxed chemical feedstock. Another example is the „Ozone-Depleting Chemicals (ODC) Tax“ on goods manufactured with, but not physically containing, such chemicals. The method is designed as follows: Where the foreign manufacturer provides detailed information on the energy used in manufacture, the tax is based on actual use of taxed energy in the manufacture of imported goods. In cases where no such information is provided, the tax is calculated based on an estimate of the amount of taxable energy that would have been used to produce the goods in Switzerland using the predominant method of production. U.S. experience has proven this method approach administrable and comaptible with international trade rules (see Hoerner/Muller 1996). A similar approach was developed in INFRAS 1994, where a tentative list with estimates
7. Meta Analysis 131
INFRAS/ECOPLAN
of the energy content89 of about 100 traded goods is given as the basis for the calculation of the BTA.
With regard to the above mentioned evaluation ciriteria, BTA can be assessed as follows: BTAs are capable of fully offsetting negative competitveness impacts for goods included in the system. Only negligible minimal impacts remain for goods that are below the energy intensity threshold implemented for applying BTAs. The incentive for a structural change towards more energy efficiency is fully preserved with regard to the production of goods for domestic consumption. On the other hand, the rebates of the tax for exports eliminate the incentive for export-oriented industries.90 In the case of Switzerland, where the relevance of the energy intensive export-oriented industries is low, this gap in the incentive is not a serious problem. BTA therefore seem to be preferable to reduced tax rates91.
„Protection bubble“ („Schutzglocke“): The „protection bubble“ approach (see INFRAS 1994) tries to buffer negative competitiveness impacts, while maintaining the crucial cha-racter of the incentive tax as much as possible. The basic ideas can be summarized as follows: The protection bubble is a sectoral recycling of the tax revenues. The revenues of each energy intensive sector would be paid back to each sector. The criteria for the repayments from the sector to the companies will be the wage sums and therefore inde-pendent from energy consumption. In this way, relative prices should be changed in order to set the incentives towards improvement of energy efficiency, at the same time, the loss of financial assets of industries should be kept as small as possible in order to maintain industries ability to invest in energy saving technologies. The revenues stemming from industries (sectors) will be collected by separate, industry-specific pots and redistributed to the companies according to an indicator which is defined independently from energy consumption (e.g. wage sum). The model can be implemented for energy intensive industries only or for the total of the industries. In order to offset negative impacts on competitiveness, only energy intensive industries have to be included in the sectoral recycling system. Sometimes it is argued that between industries and services a separate recycling system should also be implemented in order to avoid redistribution effects from the relatively energy intensive manufacturing industry to the relatively low energy intensive services.
In INFRAS 1994 it is suggested to recycle the revenues by a cut of employer’s social security contributions (SSC). This approach allows on average for an offset of negative competitiveness impacts. For the average producer (with regard to energy intensity) of every industry the net effect of the tax (tax burden and redistribution) will not lead to additional costs. In terms of international competitiveness, the average producer will be in the same position with the energy tax as prior to the introduction of the tax. For each
89 Based on comparatively energy efficient production technology predominatly used in Switzerland.
90 If importing industries do not also impose a similar tax with BTAs.
91 However, BTA systems were not included in the evaluation process which the Swiss Government carried out in the context of the CO2 tax proposal of 1994.
132 7. Meta Analysis
INFRAS/ECOPLAN
industry there are winners and losers of the tax: Companies with an energy intensity above the average will experience a net tax burden, energy efficient producers with an energy intensity in production below the average of the industry will achieve a net benefit by the introduction of the tax. The crucial point of this approach is the definition of the different industries which will be managed together and by the same pot. A politically accepted delimitation of the different industries has to be found, such that the products of the industries are homogenous and no intra-industrial transfers are provoked which are claimed as unfair by the losers of the system. In INFRAS 1994 a system with 5 to 10 selected sectors has been assessed as being able to bring an efficient and effective solution.
From an economic point of view, this approach is very attractive, because the basic idea of an ETR - the shift of the tax burden from labour to environment - is once again realized: In order to offset the negative impacts on competitiveness, simply a more disaggregated - industry specific - system of revenue recycling is designed. Correspondingly, such a system will not lead to relevant additional administrative pro-blems. The approach is effective with regard to the ability of offsetting negative compe-titiveness impacts, at the same time it is efficient as it does not dampen the initial mar-ginal incentive of the energy tax.
Impacts of common and alternative approaches:
The impact of such offsetting policies has been analysed by INFRAS, in two separate case studies for the energy intensive industries cement as well as pulp and paper (see INFRAS 1995 b und c). Starting point is the following simple estimate of the tax burden of a 40 % energy tax in Switzerland:
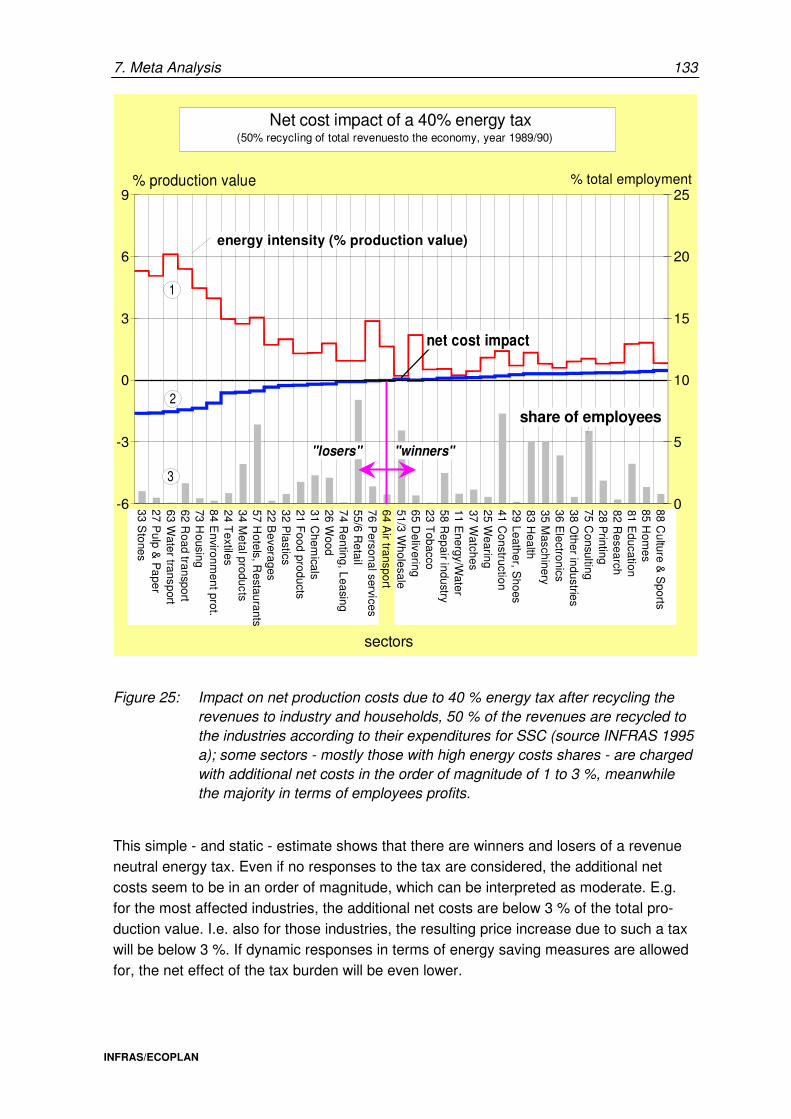
7. Meta Analysis 133
INFRAS/ECOPLAN
33 Stones
27 Pulp &
Pa
per63 W
ater transport62 R
oad transport73 H
ousing84 E
nvironment prot.
24 Textiles
34 Metal products
57 Hotels, R
estaurants22 B
everages32 P
lastics21 F
ood products31 C
hemicals
26 Wood
74 Renting, L
easing55/6 R
etail76 P
ersonal services64 A
ir transport51/3 W
holesale65 D
elivering23 T
obacco58 R
epair industry11 E
nergy/Water
37 Watches
25 Wearing
41 Construction
29 Leather, Shoes
83 Health
35 Maschinery
36 Electronics
38 Other industries
75 Consulting
28 Printing
82 Research
81 Education
85 Hom
es88 C
ulture & S
ports
-6
-3
0
3
6
9
0
5
10
15
20
25
2
3
1
Net cost impact of a 40% energy tax(50% recycling of total revenuesto the economy, year 1989/90)
% production value % total employment
energy intensity (% production value)
net cost impact
"winners""losers"
share of employees
sectors
Figure 25: Impact on net production costs due to 40 % energy tax after recycling the revenues to industry and households, 50 % of the revenues are recycled to the industries according to their expenditures for SSC (source INFRAS 1995 a); some sectors - mostly those with high energy costs shares - are charged with additional net costs in the order of magnitude of 1 to 3 %, meanwhile the majority in terms of employees profits.
This simple - and static - estimate shows that there are winners and losers of a revenue neutral energy tax. Even if no responses to the tax are considered, the additional net costs seem to be in an order of magnitude, which can be interpreted as moderate. E.g. for the most affected industries, the additional net costs are below 3 % of the total pro-duction value. I.e. also for those industries, the resulting price increase due to such a tax will be below 3 %. If dynamic responses in terms of energy saving measures are allowed for, the net effect of the tax burden will be even lower.
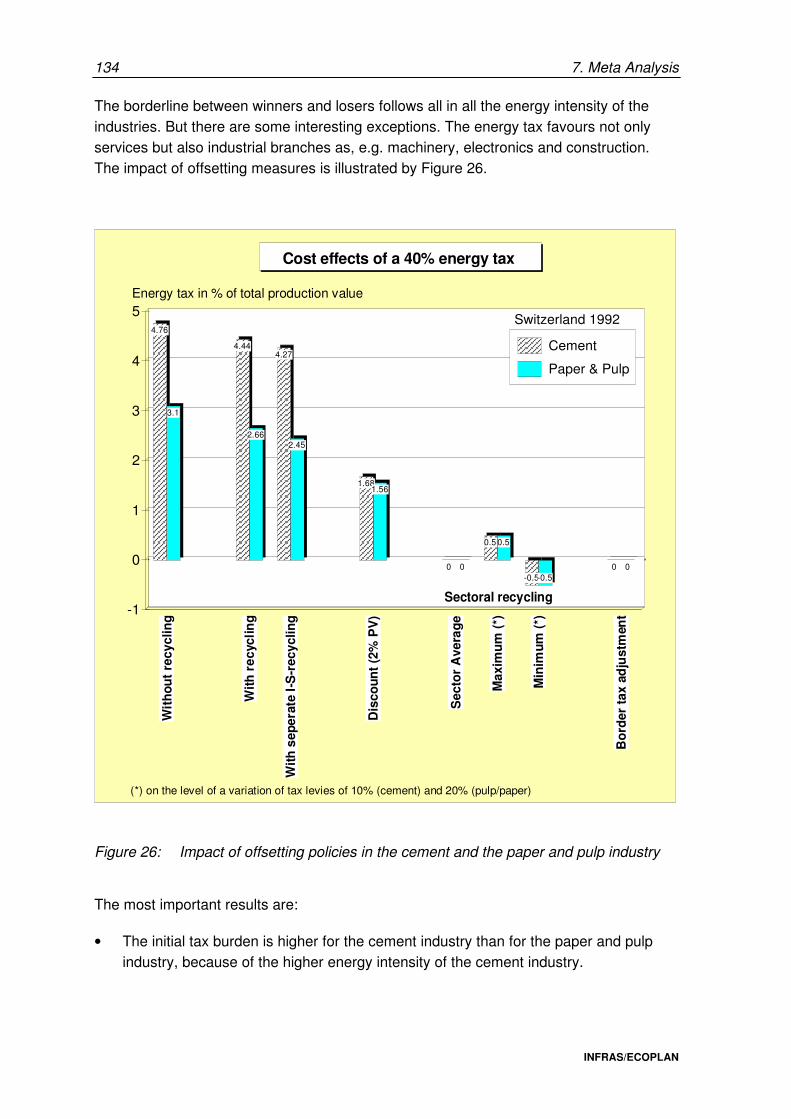
134 7. Meta Analysis
INFRAS/ECOPLAN
The borderline between winners and losers follows all in all the energy intensity of the industries. But there are some interesting exceptions. The energy tax favours not only services but also industrial branches as, e.g. machinery, electronics and construction. The impact of offsetting measures is illustrated by Figure 26.
Energy tax in % of total production value
(*) on the level of a variation of tax levies of 10% (cement) and 20% (pulp/paper)
Cost effects of a 40% energy tax
4.76
3.1
4.44
2.66
4.27
2.45
1.681.56
0 0
0.5 0.5
-0.5-0.50 0
Wit
ho
ut
recy
clin
g
Wit
h r
ecy
clin
g
Wit
h s
eper
ate
I-S
-rec
yclin
g
Dis
cou
nt
(2%
PV
)
Sec
tor
Ave
rag
e
Max
imu
m (
*)
Min
imu
m (
*)
Bo
rder
tax
ad
just
men
t-1
0
1
2
3
4
5
Cement
Paper & Pulp
Switzerland 1992
Sectoral recycling
Figure 26: Impact of offsetting policies in the cement and the paper and pulp industry
The most important results are:
• The initial tax burden is higher for the cement industry than for the paper and pulp industry, because of the higher energy intensity of the cement industry.
7. Meta Analysis 135
INFRAS/ECOPLAN
• The net effect of the general revenue recycling is relatively low because of the low labour intensity of the two industries compared to other industries.
• If the revenue recycling is carried out separately for the industry (manufacturing) and the service sector, a slight additional reduction of the tax burden is achieved. No cross subsidies from the manufacturing sector to the service sector occur in this case.
• Effective buffering effects can be achieved with two offsetting measures: The intro-duction of BTAs or of a sectoral recycling system („protection bubbles“) are able to eliminate the negative impacts on international competitiveness and the relative tax burden remains at the same level for the cement and for the paper and pulp industry.
• The rebate scheme included in the government proposal admits for a maximal net cost increase of approximately 2 % of the total production value (PV), which is less effective than the two incentive oriented offsetting strategies. For a more effective offsetting impact, the rebate payments have to be extended by lowering the threshold for the access to rebate payments and decreasing the level of the maximal allowable tax burden.
Conclusions: The analysis of the competitiveness effects of energy taxes and the potentials of offsetting measures leads to the following conclusions:
• There are solutions which allow for buffering possible negative impacts on interna-tional competitiveness due to the introduction of an energy or carbon tax in a first or early mover scenario.
• The measures discussed can be distinguished by their impact on effectiveness, effi-ciency and administrability.
• The introduction of BTAs or of a sectoral recycling system („protection bubble“) mini-mizes the reduction of the incentive effects of the initial tax and seem to be admini-stratively feasible. BTAs are preferable in terms of effectiveness but reduce the in-centives for efficiency improvements for the export-oriented industries. The „protec-tion bubble“ on the other hand, leads to a minimal reduction of the incentives, the tax incentive is maintained for the total of the domestic production but it allows only for an offset of the negative impacts on international competitiveness on the average for an industry.
• However, the focus of current policy is on rebate schemes which include exemptions or tax reductions for energy intensive industries which pass thresholds of energy in-tensity. These systems are better established in terms of political acceptance, but they are not appropriate from an efficiency oriented point of view. Sometimes it is argued that these approaches are administratively more feasible than the above discussed models. Ongoing work in the framework of the energy perspective studies

136 7. Meta Analysis
INFRAS/ECOPLAN
of the federal office of energy indicate that a rebate scheme restricting the maximal net burden due to the tax up to 1% will be an effective buffering model.
• As for the time being it seems clear that a largely harmonised scenario of the intro-duction of an ETR in all OECD countries will not turn into reality, the strengthening of the implementability of incentive-oriented offsetting measures seems to be of increa-sing interest.
c) Competitive gains
In the context of the competitiveness issue further aspects are of interest, which are not fully taken aboard by the conventional top-down models analysed in the previous chapters 4 to 6. Again, most of the critique of the conclusions regarding the impacts of the introduction of an ETR on international competitiveness relates to the static view of the conventional models. Particularly, they are neglecting the relevance of innovations fostered by stricter environmental regulation in general and by environmental taxes in particular (see also the previous sections 7.3. and 7.4.).
Early mover advantages: Probably the most famous contribution to this discussion is the one by Harvard Business School professor Michael Porter (see Porter 1990 and Porter/van der Linde 1995). The fundamental argumentation of the „Porter hypothesis“ is as follows: When a country leads other countries in terms of environmental policy, domestic firms can gain important advantages as early movers. The static conventional models do not consider such dynamic aspects. Their static view of environmental policy implies that technologies, products, processes and customer needs are all given. Obviously, in such a static world additional environmental regulation - be it market-based or not - inevitably raises costs and will lead to negative impacts on competitiveness of the domestic industries in terms of reduced market shares of domestic companies. An important precondition for the relevance of the early-mover-advantage-hypothesis is that national environmental policy is anticipating international trends in international en-vironmental policy. The adopted national expertise in the domain of energy and resource-efficient technologies and green products will only lead to national benefits if other countries will adopt comparable regulations and therefore will also demand the new tech-nologies and products. The hypothesis has been criticized by several authors. Major ar-guments stated and the counterarguments formulated by Porter/van der Linde 1995 are:
- Innovation offsets are theoretically possible but are small in practice: Porter stresses here the important aspect of resource productivity. Companies can realize important innovation offsets by improving re-source productivity throughout the value chain instead of dealing with the environmental problems at the end of the production process.
- High costs of compliance: The counterargument of Porter is in line with our argumentation which stresses the fact that econometric studies are
7. Meta Analysis 137
INFRAS/ECOPLAN
overestimating net compliance costs by assuming away innovation be-nefits.
- Crowding out of other potentially more productive investments and/or innovations: On the one hand there are a number of examples which show high rate of returns on environmental investments, on the other hand the level of environmental investments improving resource productivity and/or energy saving investments is still low.
No negative impacts of adopted policy: For the time being there is quite a large consensus among the scientific community that environmental policies adopted so far in the OECD countries, have had negligible effects on industrial competitiveness (Stevens 1993 or Jaffe et al 1995). This observation is ex-plained by different reasons:
• Environmental regulations have not been the source of significant cost differentials among the major competitors so far and therefore have had minimal effects on over-all trade.
• Marginal costs of abatement are probably lower than estimated in the conventional models (see also the section on the energy efficiency gap).
• Negative sectoral effects are often offset by positive overall macroeconomic effects. The problem is that negative impacts on the sectoral level are a shorter term pheno-menon and the benefits are dispersed and generally a longer term phenomenon.
• Environmental regulation is improving resource productivity and leads to a reduction of environmental expenditures and therefore not to additional cost differentials in in-ternational competition.
• With regard to the important role of foreign investment in the context of environmental policy, Stevens summarizes the following interesting aspects presented at the OECD workshop on „Environmental policies and industrial competitiveness“, (OECD 1993): The standard hypothesis of relocations due to environmental regulation have to be reexamined, because there is no empirical evidence for such a behaviour so far. At least current cost differentials are not sufficient to encourage relocating behaviour, other variables like access to markets, political stability, provison of an appropriate infrastructure and transport costs are more important.
Conclusions: Available empirical studies indicate that on the macro level a decreasing international competitiveness of domestic industries due to environmental regulation has not been a real problem for OECD countries so far. Some problems may occur on the sectoral level. These problems can be tackled by an adequate policy design.There are several argu-ments supporting the hypothesis that this conclusion is also valid with regard to additional environmental policies such as the implementation of an ETR in a first or early mover
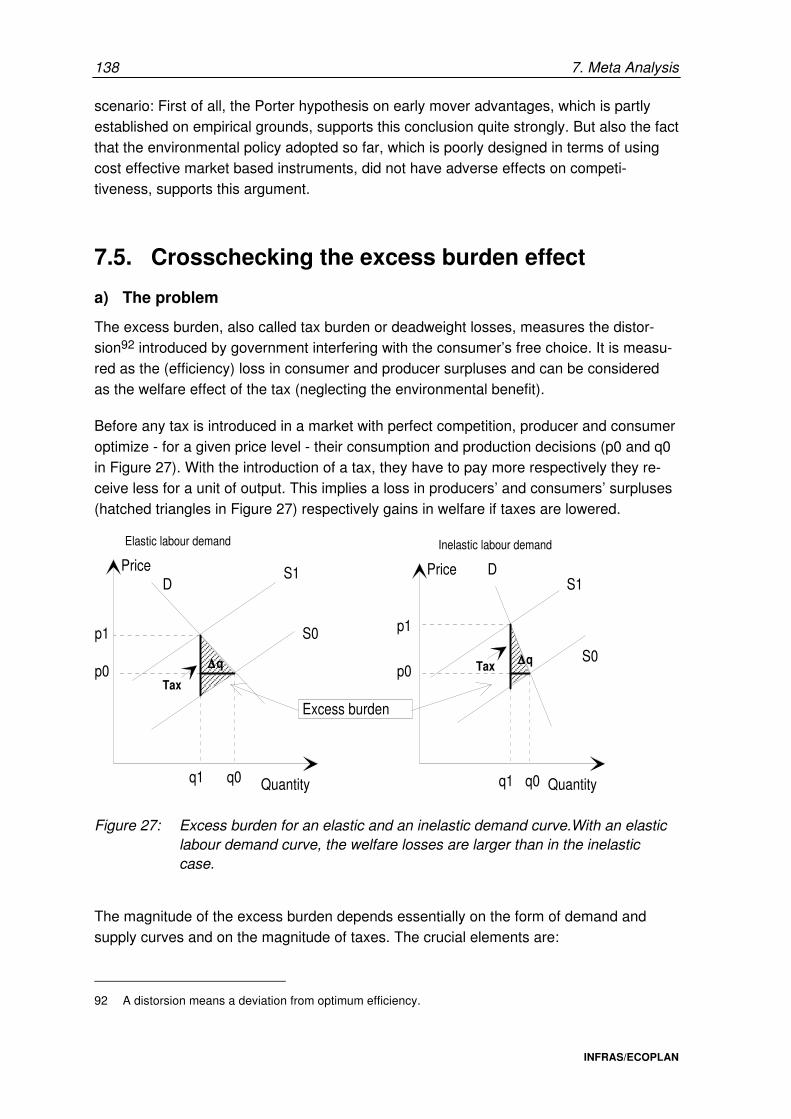
138 7. Meta Analysis
INFRAS/ECOPLAN
scenario: First of all, the Porter hypothesis on early mover advantages, which is partly established on empirical grounds, supports this conclusion quite strongly. But also the fact that the environmental policy adopted so far, which is poorly designed in terms of using cost effective market based instruments, did not have adverse effects on competi-tiveness, supports this argument.
7.5. Crosschecking the excess burden effect
a) The problem
The excess burden, also called tax burden or deadweight losses, measures the distor-sion92 introduced by government interfering with the consumer’s free choice. It is measu-red as the (efficiency) loss in consumer and producer surpluses and can be considered as the welfare effect of the tax (neglecting the environmental benefit).
Before any tax is introduced in a market with perfect competition, producer and consumer optimize - for a given price level - their consumption and production decisions (p0 and q0 in Figure 27). With the introduction of a tax, they have to pay more respectively they re-ceive less for a unit of output. This implies a loss in producers’ and consumers’ surpluses (hatched triangles in Figure 27) respectively gains in welfare if taxes are lowered.
Quantity
Tax
q0q1
p0
p1
Excess burden
q1 q0
p0
p1
Quantity
Price Price
S0
S1D
DS1
S0Tax∆∆∆∆ q ∆∆∆∆ q
Elastic labour demand Inelastic labour demand
Figure 27: Excess burden for an elastic and an inelastic demand curve.With an elastic labour demand curve, the welfare losses are larger than in the inelastic case.
The magnitude of the excess burden depends essentially on the form of demand and supply curves and on the magnitude of taxes. The crucial elements are:
92 A distorsion means a deviation from optimum efficiency.
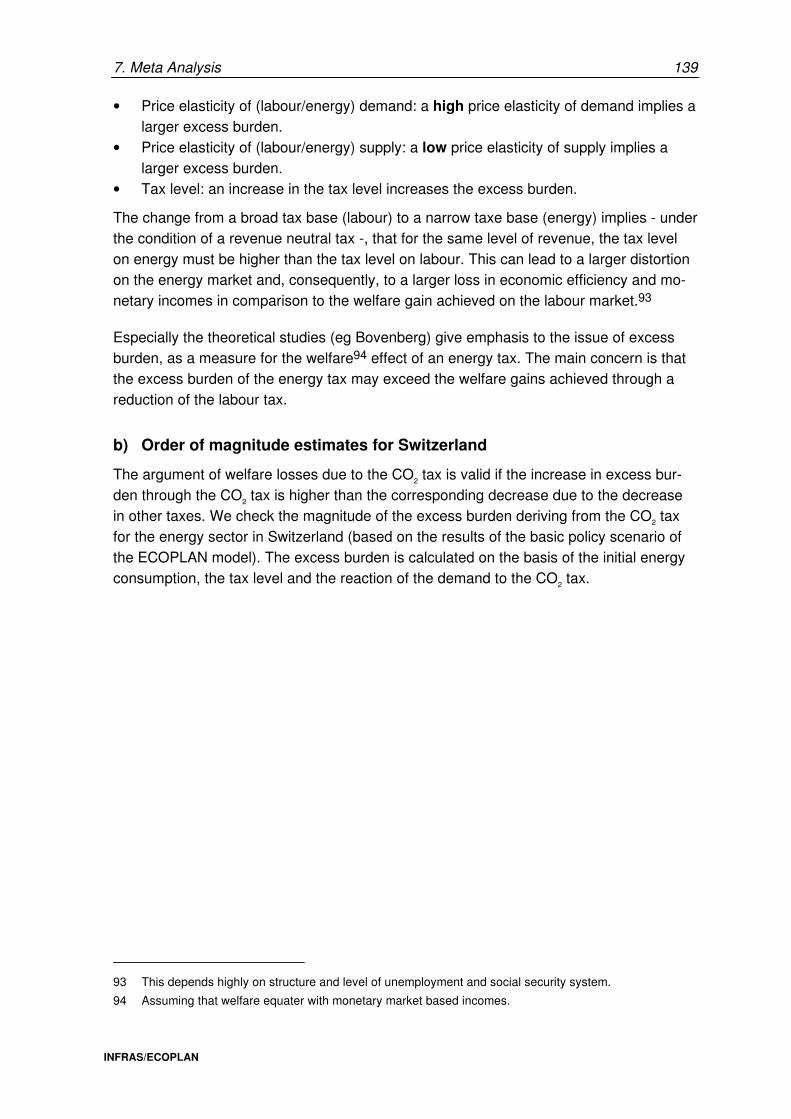
7. Meta Analysis 139
INFRAS/ECOPLAN
• Price elasticity of (labour/energy) demand: a high price elasticity of demand implies a larger excess burden.
• Price elasticity of (labour/energy) supply: a low price elasticity of supply implies a larger excess burden.
• Tax level: an increase in the tax level increases the excess burden.
The change from a broad tax base (labour) to a narrow taxe base (energy) implies - under the condition of a revenue neutral tax -, that for the same level of revenue, the tax level on energy must be higher than the tax level on labour. This can lead to a larger distortion on the energy market and, consequently, to a larger loss in economic efficiency and mo-netary incomes in comparison to the welfare gain achieved on the labour market.93
Especially the theoretical studies (eg Bovenberg) give emphasis to the issue of excess burden, as a measure for the welfare94 effect of an energy tax. The main concern is that the excess burden of the energy tax may exceed the welfare gains achieved through a reduction of the labour tax.
b) Order of magnitude estimates for Switzerland
The argument of welfare losses due to the CO2 tax is valid if the increase in excess bur-den through the CO2 tax is higher than the corresponding decrease due to the decrease in other taxes. We check the magnitude of the excess burden deriving from the CO2 tax for the energy sector in Switzerland (based on the results of the basic policy scenario of the ECOPLAN model). The excess burden is calculated on the basis of the initial energy consumption, the tax level and the reaction of the demand to the CO2 tax.
93 This depends highly on structure and level of unemployment and social security system.
94 Assuming that welfare equater with monetary market based incomes.
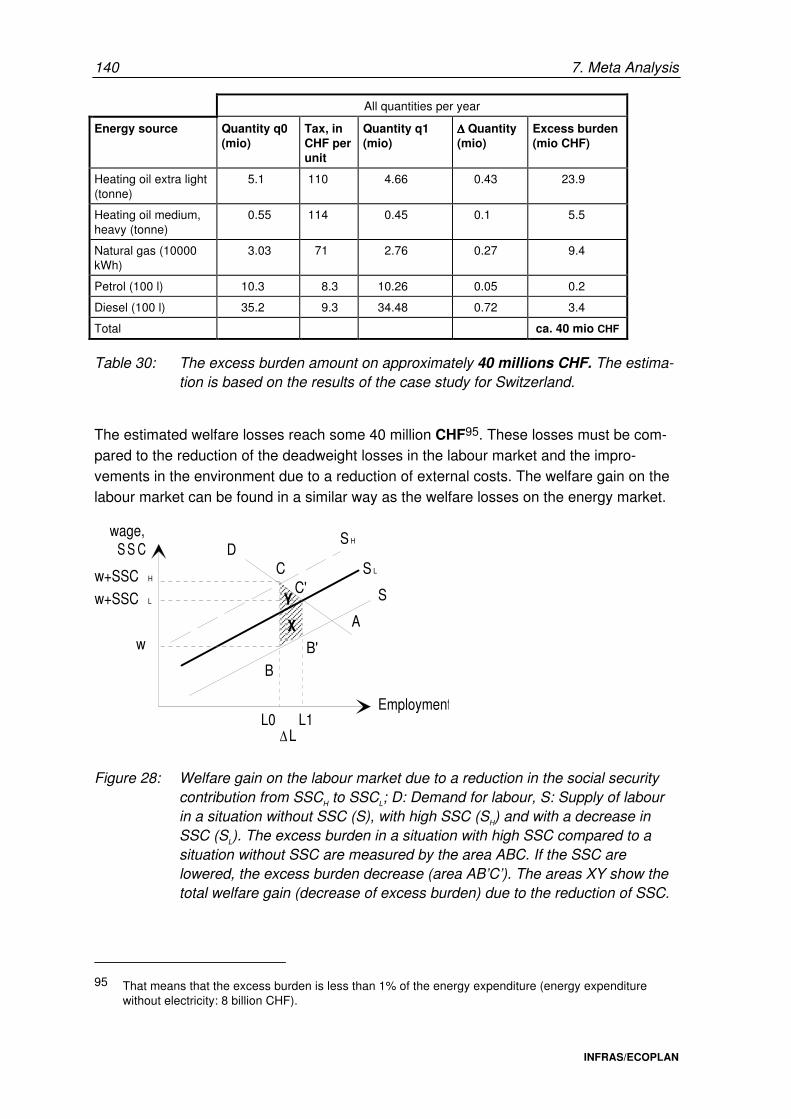
140 7. Meta Analysis
INFRAS/ECOPLAN
All quantities per year
Energy source Quantity q0 (mio)
Tax, in CHF per unit
Quantity q1 (mio)
∆∆∆∆ Quantity (mio)
Excess burden (mio CHF)
Heating oil extra light (tonne)
5.1 110 4.66 0.43 23.9
Heating oil medium, heavy (tonne)
0.55 114 0.45 0.1 5.5
Natural gas (10000 kWh)
3.03 71 2.76 0.27 9.4
Petrol (100 l) 10.3 8.3 10.26 0.05 0.2
Diesel (100 l) 35.2 9.3 34.48 0.72 3.4
Total ca. 40 mio CHF
Table 30: The excess burden amount on approximately 40 millions CHF. The estima-tion is based on the results of the case study for Switzerland.
The estimated welfare losses reach some 40 million CHF95. These losses must be com-pared to the reduction of the deadweight losses in the labour market and the impro-vements in the environment due to a reduction of external costs. The welfare gain on the labour market can be found in a similar way as the welfare losses on the energy market.
DS H
S
Employment
wage,
∆ L
w+SSC H
w
L0 L1
S S C
w+SSC L
S L
A
B
C
X
Y
B'
C'
Figure 28: Welfare gain on the labour market due to a reduction in the social security contribution from SSCH to SSCL; D: Demand for labour, S: Supply of labour in a situation without SSC (S), with high SSC (SH) and with a decrease in SSC (SL). The excess burden in a situation with high SSC compared to a situation without SSC are measured by the area ABC. If the SSC are lowered, the excess burden decrease (area AB’C’). The areas XY show the total welfare gain (decrease of excess burden) due to the reduction of SSC.
95 That means that the excess burden is less than 1% of the energy expenditure (energy expenditure
without electricity: 8 billion CHF).
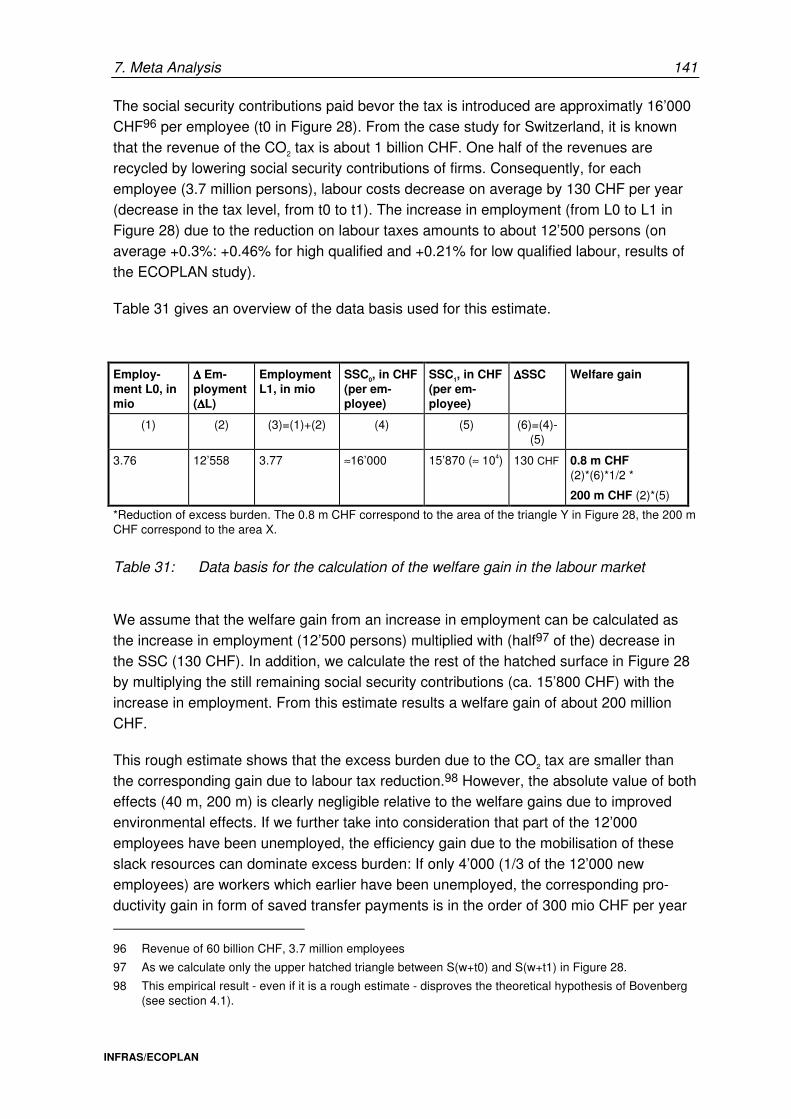
7. Meta Analysis 141
INFRAS/ECOPLAN
The social security contributions paid bevor the tax is introduced are approximatly 16’000 CHF96 per employee (t0 in Figure 28). From the case study for Switzerland, it is known that the revenue of the CO2 tax is about 1 billion CHF. One half of the revenues are recycled by lowering social security contributions of firms. Consequently, for each employee (3.7 million persons), labour costs decrease on average by 130 CHF per year (decrease in the tax level, from t0 to t1). The increase in employment (from L0 to L1 in Figure 28) due to the reduction on labour taxes amounts to about 12’500 persons (on average +0.3%: +0.46% for high qualified and +0.21% for low qualified labour, results of the ECOPLAN study).
Table 31 gives an overview of the data basis used for this estimate.
Employ-ment L0, in mio
∆∆∆∆ Em-ployment (∆∆∆∆L)
Employment L1, in mio
SSC0, in CHF (per em-ployee)
SSC1, in CHF (per em-ployee)
∆∆∆∆SSC Welfare gain
(1) (2) (3)=(1)+(2) (4) (5) (6)=(4)-(5)
3.76 12’558 3.77 ≈16’000 15’870 (≈ 104) 130 CHF 0.8 m CHF (2)*(6)*1/2 *
200 m CHF (2)*(5)
*Reduction of excess burden. The 0.8 m CHF correspond to the area of the triangle Y in Figure 28, the 200 m CHF correspond to the area X.
Table 31: Data basis for the calculation of the welfare gain in the labour market
We assume that the welfare gain from an increase in employment can be calculated as the increase in employment (12’500 persons) multiplied with (half97 of the) decrease in the SSC (130 CHF). In addition, we calculate the rest of the hatched surface in Figure 28 by multiplying the still remaining social security contributions (ca. 15’800 CHF) with the increase in employment. From this estimate results a welfare gain of about 200 million CHF.
This rough estimate shows that the excess burden due to the CO2 tax are smaller than the corresponding gain due to labour tax reduction.98 However, the absolute value of both effects (40 m, 200 m) is clearly negligible relative to the welfare gains due to improved environmental effects. If we further take into consideration that part of the 12’000 employees have been unemployed, the efficiency gain due to the mobilisation of these slack resources can dominate excess burden: If only 4’000 (1/3 of the 12’000 new employees) are workers which earlier have been unemployed, the corresponding pro-ductivity gain in form of saved transfer payments is in the order of 300 mio CHF per year
96 Revenue of 60 billion CHF, 3.7 million employees
97 As we calculate only the upper hatched triangle between S(w+t0) and S(w+t1) in Figure 28.
98 This empirical result - even if it is a rough estimate - disproves the theoretical hypothesis of Bovenberg (see section 4.1).
142 7. Meta Analysis
INFRAS/ECOPLAN
(4’000 unemployed * ≈40’000 CHF/a) or at least in the magnitude of the excess burden effects.
In summary, our rough quantitative estimates of the tax shift effects af a 1 billion/a CHF CO2 tax shift are these order of magnitudes:
• Dead weight loss due to CO2 tax: ca. - 40 mio CHF/a
• Welfare gain gain due to lower taxes on labour: ca. + 200 mio CHF/a
• Productivity gain due to reduction in involuntary unemployment and increase in employment ca. + 160 mio CHF
7.6. The energy efficiency gap
a) The hypothesis
At the OECD conference on „the economics of climate change“, 1993 in Paris, the hy-pothesis that there are relevant potentials for zero or negative cost improvements in energy efficiency was presented quite prominently.
Johansson/Swisher and Cline presented papers which focus on the issue of the relevance of such potentials (see Johansson/Swisher 1994 and Cline 1994).
Johansson/Swisher gave an overview on the state-of-the-art of bottom-up models. The major insights are the following: While top-down models are based on a macroeconomic framework and therefore are characterised by a high level of aggregation, the bottom-up approach is based on a detailed analysis of the technological situation. The advantage of this approach is that it is connected directly to technical reality. It is therefore often called the „engineering approach“ (see e.g. Cline 1994). Contrasting to top-down models which implicitly assume that the energy economy is already in an optimal state, bottom-up mo-dels focus on possible restrictions which hinder the realization of the state of the art tech-nologies. Bottom-up models therefore are able to identify the technical and economic potential for energy efficiency gains through the integrated management of energy supply and demand. The integrated analysis of end use and supply technologies is based on a comparison of the marginal costs of different technologies to supply or to save energy. A number of studies have been published that identify relevant potentials to reduce energy demand through application of energy efficient technologies (see Johansson/Swisher 1994). While there is a wide variation in bottom-up study results, several country specific analyses indicate that industrialised countries could achieve 10 to 30 per cent reductions in energy demand at no or low net cost to society. The strategies analysed consist of a combination of energy efficiency measures with the least expensive measures for utilizing renewable resources. The emission reduction measures analysed include substitution of carbon emission intensive fuels, cogeneration of combined heat and power, more efficient district heating systems, energy efficiency measures in industrial processes, efficiency measures in buildings and additional production of renewable energies (wind, solar, biomass) etc. Most studies show significant reduction potentials for the short term at
7. Meta Analysis 143
INFRAS/ECOPLAN
negative marginal costs, leading to reductions of 30 percent of CO2 emissions or more at zero or low average cost. Later on, at higher emission reduction levels, the estimated marginal cost curves increase gradually. But it is important to note that in the long run there are more opportunities for cost effective energy efficiency improvements because of the regular turnover of the capital stock and due to the technical progress which brings up new and presumably cheaper measures than the already known measures.
The central questions with regard to the claimed low or zero cost energy improvements issue are as follows:
- Why are these relevant cost and energy saving potentials not realized for the time being?
- Is there something like a „free lunch“ but economic inefficiencies or mar-ket imperfections hinder its realisation?
- Are there possibilities to reduce the barriers and imperfections by public policy intervention?
In the last years, a number of authors analysed the causes which are responsible that the mentioned „no regret measures“ are not implemented:
Two kind of explanations were given by Jaffe/Stavins 1994, whereas the first explanation is connected with market failures, the second is seen in non-market failures, i.e. specific reasons for the (seemingly) suboptimal behaviour of the decision makers:
• Suboptimal diffusion due to market failure: The suboptimal availability of information on energy saving technologies is seen as the major market failure which leads to the observed energy paradox, because:
- Information is a public good, market economies do not support the supply of public goods.
- An enterprise implementing a new technology is not interested in the diffusion of the technology because it is often not possible to realize the corresponding profits.
- Often the users (and profiteurs) of energy saving investments and the investors are not identical which leads to biased incentives: Energy saving technologies seem to be too expensive to the investor because the savings of energy costs are neglected or valuated too low when deciding on the investment.
Too low energy prices are further market failures which are not directly connected to the so called energy paradox:
- on the one hand, because they are calculated on the basis of average instead of marginal costs,
- on the other hand, because external costs of energy consumption are not integrated in the energy prices.
144 7. Meta Analysis
INFRAS/ECOPLAN
• Suboptimal diffusion due to other reasons than market failure: Jaffe/Stavins list the following reasons for seemingly suboptimal behaviour which are not related to market failures:
- High implicit discount rates due to uncertainties about future energy pri-ces, reachable energy savings and the irreversibility of investments.
- Energy saving technologies lead under certain circumstances to losses in comfort.
- The introduction of new technologies generates learning costs.
- The cost effectiveness of energy saving technologies depends on the concrete investment. In reality the theoretically calculated cost effec-tiveness is under certain circumstances not valid.
- Economic actors tend to a certain inertia.
Similar causes are found by Johansson/Swisher 1994 and Sanstad et al.(1993) which can be summarized as follows:
- Lack of information due to information barriers (information as a partly public good)
- Capital market imperfections, lack of access to capital and financing re-sources
- Disparity of risk expectations between energy users and suppliers
- Split responsibilities and incentives for energy bills and efficiency mea-sures (principal-agent problem)
- Price distortions due to subsidies or regulated markets, electricity tariff structures
- Externalities from adoption of energy efficient technologies or from energy use which are not integrated in the market prices
- Too low energy prices not reflecting external costs (environmental and security costs)
b) Policy conclusions
Several conclusions can be drawn out of this analysis:
• In case of market imperfections an appropriate policy response can be formulated and implemented. Other perceived barriers, however, may be the result of an under-estimate of the costs of implementation of energy efficient technologies.
• Top-down models, on the one hand, with the basic assumption that the starting point of the analysis is an optimum, are usually overestimating the costs of energy saving investments because they are neglecting energy saving measures which can be realized by negative net costs.
7. Meta Analysis 145
INFRAS/ECOPLAN
• Bottom-up models, on the other hand, are usually underestimating the adjustment costs, because they are calculating the cost effectiveness of energy saving techno-logies from an engineering point of view, i.e. without integrating transaction costs. From an economic point of view, transaction costs are real costs like e.g. direct in-vestment costs.
• There is a certain potential for eliminating these transaction costs and barriers at least partially. Important measures with this purpose are: Internalisation of external costs, removal of institutional barriers (e.g. in the electricity market), support of tech-nological research, demonstration projects, activities to promote early markets. The implementation of such measures will support the realisation of the cost-effective-ness-energy saving investments, identified by bottom-up models.
• The role of increasing energy prices in the context of bottom-up analysis and the above mentioned barriers are crucial. Increasing energy prices increase primarily the value of the saved energy costs achieved by an investment improving energy effi-ciency. Energy saving measures become more profitable. In the long run the energy market and the market for energy saving investments will change. Corresponding in-vestments become cheaper due to economies of scale. The kind of the price changes (speed, rate of change, long term reliability of the induced price signal) are important determinants for the impacts of the price changes, because it influences the subjective judgement and the behaviour of the decision makers. A well designed pri-ce change can improve the positive effects of a tax shift from labour to energy, as it supports the realisation of the energy saving potentials. Moreover, by carefully in-creasing energy prices, a dynamic process can be started leading to a stepwise re-duction of several barriers. E.g. information barriers are vanishing at the moment when a technology achieves a certain minimal market share.
• The claimed existence of zero or low cost improvements strengthens the argument of positive employment effects which can be expected by a tax shift (change in relative prices of labour and energy): If energy savings can be achieved by very low or either zero costs, the tax shift will in any case lead to positive employment effects because of the following reasons:
- The central issue with regard to the relevance of the double dividend hypothesis is on the possibility of shifting the tax burden away from (domestic) labour force (see Bovenberg/De Moji 1994 or Bovenberg/ Van der Ploeg 1995). Bovenberg et al. claim that the tax burden occurs because economic production is moved away from the previous (Pareto-) optimum by the change in relative prices.
- If there are relevant zero or low cost energy saving measures, the tax shift will certainly not lead to a relevant move away from the optimum of production. Overall production costs will not increase (also in a static view) and real wages will not be touched significantly. The claimed negative income effect which is countervailing the substitution effect of the changes in the relative prices will therefore be irrelevant.
146 7. Meta Analysis
INFRAS/ECOPLAN
Correspondingly, the employment effects will be stronger in this case compared with a situation with high adjustment costs.
c) Relevance for Switzerland
The Swiss economy is characterised by a high standard with regard to energy efficiency compared to other economies. A number of efforts have been undertaken already to im-prove energy efficiency of the Swiss economy. Several regulations in the industry and household sector are implemented which set worldwide leading standards. The govern-mental energy saving programme „Energie 2000“ which comprises a broad variety of measures reaching from subsidies for renewable energies to information and education activities, supports the reduction of the above mentioned barriers to the implementation of new energy saving technologies. These facts suggest that the relevance of cost-effective-energy saving investments in Switzerland is less relevant compared to countries with less strict standards. Nevertheless, also for Switzerland, a range of technological options seems to exist, which can be implemented at low cost and sometimes at a net economic benefit. Currently, in the framework of the studies of the „Swiss Energy Perspectives“ such potentials are analysed. Preliminary results show zero cost potentials in several sectors. Major potentials seem to be in the transport and electricity sector. In the transport sector for example, a decrease of the average specific energy consumption of the car fleet could be achieved at negative costs without any problems by a stepwise shift of the car demand in the direction of the best available technology. However, these energy efficiency improvements seem to be perceived as too strong losses of comfort. Estimates of the cost efficiency of different measures for savings of the electricity consumption in the service sector show profitable energy saving potentials up to 35 % of the current electricity consumption (Aebischer 1995). Further potentials are most probably in the domain of small and medium enterprises of the industry sector. Also in the household sector certain zero cost potentials are available. But as in the transport sector, the effi-ciency improvements are often perceived as a decrease of the comfort level (e.g.: de-crease of the average heating temperature). This implies that a considerable share of adjustment costs to an ETR would consist in reduced utility of households and not in monetary economic costs.
7.7. Synthesis
The analysis of the architecture and structures of different types of mathematical eco-nomic models reveals both their strengths and their weaknesses like two sides of the same coin. The major weakness is that - in order to retain general validity and the com-plete mathematical structure of the model - many restrictive assumptions must be built into these models' architecture.99 It turns out that one of the most limiting of these as-sumptions is the (near) neglection of dynamic and transitional phenomena. In particular,
99 Computational feasibility is another requirement which asks for such sacrifices.

7. Meta Analysis 147
INFRAS/ECOPLAN
processes of innovations and technological progress, as they are driven by environmental regulation such as economic incentives, charges or ETR systems, are not described adequately.
In this situation, the concept of meta analysis has been introduced with the following ob-jective: The meta analysis means a set of complementary reflections, analyses and men-tal - or partially formalized - models
(1) To identify the major limitations and shortcomings100 of the formal mathematical models
(2) To develop supplementary models and arguments to assess the probable impact of the relaxation of major restrictions in the models available.
The following sections describe additional insights which this type of complementary analysis can bring to the computer outputs of the mathematical model runs.
Static and dynamic worlds: innovation and technological progress
As it turns out, in most of the existing models the single most important limitation relate to the neglect or inadequate consideration of dynamic phenomena, in particular of proces-ses of innovation and technological progress as they are driven by good environ-mental regulation. It can be shown that this restriction leads to results which are too negative in terms of those economic output parameters which - today - are considered to be of primordial importance: The impacts of ETR on international competitiveness, imports and exports, transfers of capital investment, unemployment, GDP and incomes.
Static models describe a world in which technology, production processes, products and consumer needs are all fixed. Firms produce the same type of products with unchanged technologies. In this sense they do not react to increases energy prices and lower labour costs.
Undoubtedly these static assumptions are unreal. They lead to an overestimation of the cost of an ETR and a corresponding underestimation of the benefits. Of course, innova-tion and technological progress have been and are driven by a variety of factors. While in the past a main factor determining the thrust of innovations on the cost side has been the tacit assumption and expectation that productivity increases primarily mean increases in labour productivity. As a result, innovation processes essentially were guided by the objective to substitute labour by other inputs: energy, capital as well as information and know-how.101
100 In the sense of architectural assumptions derivating from real world behaviour.
101 It is recognised that energy and information are derived production factors. Nevertheless it is convenient to look at them as substitutes for labour, capital.
148 7. Meta Analysis
INFRAS/ECOPLAN
Porter and van der Linde (1995) report on a whole series of empirical data and case stu-dies, illustrating examples102 of innovations driven by environmental regulation. It must be stressed that neither theoretical argumentation nor these illustrations mathematically pro-ve the unconditional existence of the double dividend. By the same argument, however, the criticisms of Porter's illustrations and arguments (e.g. Palmer, 1995) are insufficient to generally disprove Porter's hypothesis. Clearly more precise conceptual models should be developed - as a precondition for a better quantitative understanding of the innovation offsets of static costs of good environmental regulation.
System analysis: the importance of rates of change vs. the "irrelevance" of levels
A model can be called dynamic only if it explicitely deals with stock variables and flow variables separately and describes how the time rates of change of stock variables are dependent on flow variables. Concretely: A stock of vehicles and infrastructures of a transportation system or a stock of existing buildings or appliances is slowly turned over by means of yearly flows of vehicles, appliances, buildings etc. which are coming into use on the one hand, and old ones are decommissioned on the other hand. In turn, energy intensities of these flows are changing slowly - and with time delays - as a function of many driving variables, notably of prices of energy, labour and capital.
Different lifetimes of stocks (vehicles, appliances, furnitures, buildings, bridges, roads, tunnels, powerplants, but even lifestyles of younger and older people) define a cascade of dynamic responses with response times varying from a few months (driving styles) to a few years (appliances, cars) or decades (infrastructures, settlement structures, lifestyles etc.). This type of qualitative meta analysis can be developed into partially quantitative dimensions. For example, it can be shown that elasticity coefficients in effect are transi-tional functions of time and that longterm elasticities may have to be looked at over many decades, not only 5 to 10 years. It can be shown that significant parts of technological responses can occur even after 15-20 years. These are usually missed in conventional „longterm“ price elasticities.
Anticipatory responses
If longterm ETR projects are announced early and credibly and then introduced and im-plemented, corresponding reorientations of investment profiles will occur even in antici-pation of future price changes. In the case of such ETR projects - credibly announced - rising investments in energy efficiency and energy conservation projects can be expected, shifting factor inputs from imported energies to capital and domestic labour.
102 Among them a relatively extensive study by Dorfmann et al. (1992), reporting on 181 source reduction
activities in 29 chemical plants in the USA. Of those activities with more detailed data available, 95 % of them showed an increase in product yield; 2/3 of the cases with needed investments showed pay back periods of six months or less; the average monetary savings per dollar invested were $ 3.50.
7. Meta Analysis 149
INFRAS/ECOPLAN
Such anticipatory effects have been predicted and empirically observed, for example prior to the introduction of the German water pollution (emission) charges during the 1980's (Gantrel, 1993, Hemmelskamp, 1995).
Dynamic response of currency exchange rates
The conclusion from static analysis with respect to the negative effects of ETR-related price increases on international trade must be revised on the grounds of yet another effect which can only be captured by a dynamic consideration: the currency exchange rate response. In the longer run, relative cost increases of exports tend to be partly attenuated and compensated by (small) adaptions in currency exchange rates. Again, the static analysis will be closer to reality in the short run for discrete price jumps. In the long run, however, negative effects tend to be offset to a large degree.
ETR vs. traditional command and control regulation
All too often, the "genesis" of economic incentives is misunderstood - again due to a lack of appreciation of dynamic and transitional phenomena and a dominance of static per-ceptions. Too often, it is forgotten that economic incentives (ETR signals) - while being economically clearly more efficient than command-and-control (standards) regulation - are of little effect in the short run. They develop their full range of effectiveness only in the long run. Depending on the relevant cascades of responses, 80% effectiveness could only be reached after decades. Standards, on the other hand, have the advantage of inducing some uniform changes in the short run and without the need of diverting sig-nificant financial flows, going from firms to the state and back to the economy. The fi-nancial resources remain within the firm.
This has implications:
- In the short run command and control instruments are quite often more effective and economic instruments must be considered as complementary, not as substitutes. However, in the long run technological and economic structures will adapt to the evolving price structures, making markets fairer and more efficient than before. In this sense the task of standards is to plow ahead for the immediate application of best available technology, while the complementary economic instruments provide the ne-cessary and sustainable guidance incentives of market based development processes in the long run.
- Standards and other technical specifications tend to induce innovations rather of an end-of-pipe nature, while long term and evolutionary ETR signals tend to induce more fundamental and integrated innovations at the input, the process and the product level. This is one source of the superior economic effectiveness of economic instruments.
150 7. Meta Analysis
INFRAS/ECOPLAN
International competitiveness, employment and GDP effects
The logic of static models implies the following perception of causal effects: An increase of export prices of energy intensive products and services leads to a loss in international competitiveness103, a decrease in exports, increase in imports, outflow of capital. All of this results in an increase in domestic unemployment and an increase in social security costs and taxes as well as a decrease in incomes and GDP, etc.
This tends to occur in the short run and when energy prices increase rather abruptly. However, problems of socioeconomic disruptions are not caused by high levels of energy prices but by high time rates of change in prices.104 This is reflected by the commonly accepted concept to introduce ETR stepwise, giving special consideration to the dynamic response processes described above.
Offsetting strategies
For first mover countries - i.e. in the absence of international harmonisation - additional policy tools can be used to further attenuate or eliminate negative side effects of energy taxes/ETR. A variety of offsetting strategies has been developed and proposed, ranging from border tax adjustments to tax rebates for (or even exemptions of) energy intensive industries or of process energy in general. The basic principle of all these policy recommendations is to attenuate excessive rates of change.
First mover effects
Static models which do not take into account offsetting strategies generally predict nega-tive economic ETR impacts, especially for first mover countries105. On the other hand, dynamic analysis suggests that countries which are trimming their economy early in the direction of new technologies, new products and new markets will earn comparative ad-vantages in the medium and long run over hesitating countries which protect and con-serve existing economic structures. Certain empirical case studies do support this dy-namic thesis of first mover advantages.
The meta analysis shows also that there is one crucial assumption which must hold for these first mover advantages to become real: The longer term mega trends must go in the general direction of the early mover’s investments, i.e. in the direction of higher energy prices and - in general - more complete integration of environmental and natural resource values into the market system. While - based on longterm sustainability con-
103 These effects do only occur if individual countries with relatively small and open (and energy intensive)
economies introduce ETR policies as first movers, without other countries following suit.
104 Empirically this has been demonstrated many times by the so called Japan-Europe-USA-(Russia-) effect. Japan and Europe have traditionally seen much higher energy prices than USA (or Russia); yet Japan and Europe have performed quite well economically.
105 With small, open and energy intensive economies.
7. Meta Analysis 151
INFRAS/ECOPLAN
siderations - this assumption appears plausible, if not inevitable, no one can reliably forecast when (market based) environmental policies will be introduced on a broad scale.
Excess burden due to tax distortions
According to static economic theory, energy taxes lead to efficiency losses because of losses in consumer and producer rents (so called excess burdens).
Arguments against ETR have been forwarded claiming that, even in a revenue neutral tax shift from labour to energy, net excess burdens would result because energy is a smaller tax base than labour (larger tax wedge on energy). While the theoretical argument is correct, order of magnitude estimates indicate that in quantitative terms the argument is irrelevant. Furthermore, it is incomplete, because existing excess burdens due to high existing taxes on labour may decrease more rapidly than excess burdens due to energy taxes increase. This holds at least for relatively modest ETR proposals - in Switzerland up to several billions CHF of overall revenues.
The full employment assumption
The second important limitation - next to the static world assumptions - of most computer based comprehensive economic models today is the inadequate simulation of the effects of involuntary unemployment, specific social security mechanisms and of wage bargaining processes.
Many models implicitly assume full employment, an obviously unrealistic situation today and probably in the future. At least for the nearer future there are no credible perspectives that the persistingly high level of structural unemployment will significantly change to the better. Under these circumstances there are underutilized human resources which can be reintregated into new production processes.
In the context of our quantitative estimates of excess burden changes we calculated that overall economic gains due to decreased structural unemployment106 could be one order of magnitude higher (namely some 300-400 mio CHF/a) than new excess burden effects on energy, at least for moderate levels of energy taxes.
Double dividend: no need of a panacea
All through the various controversial points of the "ETR and employment debate" the underlying and unreflected assumption has become more and more significant that an ETR could only be feasible if the so called double dividend hypothesis could be proven. Although the motivation at the beginning of the debate on the double dividend was slightly
106 And lowered social costs of unemployment.
152 7. Meta Analysis
INFRAS/ECOPLAN
different. An important starting point was the following argumentation: If a double dividend exists, it is not necessary to calculate or estimate environmental benefits, but if there is no double dividend this is necessary in order to prove the efficiency of an ETR. In the authors' opinion this is a biased approach107 and an unnecessary condition.
- First it can be - and has been - demonstrated that a double dividend is likely to occur under identifiable conditions108;
- Secondly the stringent double dividend as a condition for the feasibility of an ETR process is neither necessary nor sensible. Clearly, it would be convenient if there were no uncertainties or controversies over the issue. However, there is no common sense in blocking policy and likely progress by means of blindly accepting or requesting a hard fact proof of a condition which would be sufficient but is not necessary.
By the same token one might reverse the approach and say: Present policies could only be left unchanged if it can be shown that they are a double dividend strategy compaired with alternative proposals, such as ETR.
107 It appears symptomatic for such situations that the reverse approach is hardly discussed, namely that
ETR is considered feasible unless a double dividend of the status quo policies could be proven.
108 Favourable conditions for double dividends: Dynamic effects, innovations and technological progress are not neglected, structural unemployment exists; relatively high existing tax levels on labour; times of rapid structural change for reasons independent of ETR and longer term trends toward higher cost for environmental and energy consumption.
8. Policy Design 153
INFRAS/ECOPLAN
8. Towards an optimal policy design
An important starting point for the design of ETR is the environmental target that should be achieved by the policy: One assumption could be that the IPCC targets with regard to CO2 emissions are relevant for long term environmental policy and that they represent a reasonable framework for the formulation of the policy design.
This assumption then serves as a rough benchmark for determining the size of a long term oriented tax reform. However, we do not estimate exact figures for the necessary tax rates. We rather focus on the corner stones of the design of the tax reform:
The focus is on the following questions:
1. How must the ETR - structure and dynamics - be designed, so that national economic and environmental benefits are maximized (short term and long term). Which are the important elements on the levy-side and with regard to the recycling of the revenues which should allow to realize a win-win strategy?
2. What complementary policy measures can increase these benefits and minimize economic risks?
According to the state of the art of the available theoretical and empirical studies, the double dividend hypothesis in the weak sense, i.e. positive environmental and positive employment effects, at least in the long run, can be expected to hold true for the EU member countries and for Switzerland. This conclusion holds at least for ETR proposals up to tax levels as proposed by the EU commission within the 1991 proposal for a com-bined carbon/energy tax and for the 1993 proposal of the Swiss government opting for a carbon tax (see Eidg. Departement des Innern 1993). It is still an open question up to which higher level of annual price increases this conclusion still holds.
Levy side: phasing in stepwise
The tax has to be phased in stepwise in order to avoid or minimize structural adjustment costs of energy intensive industries and households. A combined energy and carbon tax is the most effective solution from the environmental point of view. A combined energy and carbon tax is prefered to a pure carbon tax mainly because of two reasons:
- a carbon tax leads to inefficient substitution from fossil fuels to electricity
- electricity production, like the consumption of fossil fuels, leads to serious environmental problems (e.g. unclear risks, damages to landscapes and biodiversity).

154 8. Policy Design
INFRAS/ECOPLAN
A crucial element for the design and the scope of ETR is the environmental target which is to be achieved by the policy: For the time being, the IPCC targets with regard to CO2 emissions including a restriction with regard to electricity production is assumed to be relevant for long term environmental policy, i.e. a 60 % CO2 emission reduction109 until 2030. Furthermore a stabilization of electricity consumption by the year 2000 is assumed, and a reduction afterwords. In this case a stepwise increase of the energy price in the order of magnitude of about 3 to 4 % per annum seems adequate. The above mentioned earlier proposals of the EU and the Swiss government can be interpreted as first steps in the direction of such a more comprehensive tax reform.
Recycling of revenues
The best economic performance is achieved if the revenues are fully recycled to house-holds and industries. Employment effects are maximized by reducing the cost of the production factor labour, e.g. by using the revenues for lowering social security contributions of employers and employees.
In order to simultaneously achieve beneficial employment effects and minimal negative distributional impacts, a recycling of revenues to households and industries according to their relative contributions to total revenues is the most effective solution. For Switzerland, this is roughly a 50% to 50% split.
Complementary measures
Negative impacts on international competitiveness can be controlled by offsetting me-thods, such as border tax adjustments, sectoral recycling of the revenues, or a rebate scheme for buffering the negative short term effects in highly energy intensive industries (such as glass, pulp paper, aluminium). Such offsetting policies are only necessary for first mover countries if international harmonisation is too weak.
Further complementary measures are:
• Support of the market diffusion of new energy efficient technologies by governmental provision of information and consulting services. Earmarking of a small share of the revenues (eg. up to 5 %) for initiating energy saving investments can improve the market chances of new technologies and support the elimination of barriers to the breakthrough of low cost energy saving measures. However, such programmes should be limited in time, e.g. to a maximum of 10 years.
• Regulation and standards represent a complementary instrument to the market ba-sed ETR; e.g. dynamic standards for the effciency of energy end use equipment and buildings.
109 Compared to 1990

8. Policy Design 155
INFRAS/ECOPLAN
• Taxes on other resources like fresh water, construction raw materials, solid wastes a.s.o. may be necessary because the use of certain resources is only partially responsive to an ETR. Eco-efficient management of such resources can only be achieved by specific taxes because current market prices do not reflect the costs arising for future generations due to exhausted resources.
• Further support of (private) joint implementation projects by granting rebates to Swiss companies which contribute to reductions in developing countries (e.g. in the form of tax reductions). This aspect is of growing interest as public funds for development co-operation have been decreased in recent years whereas private investments have increased.
• Earmarking of a (small) share of the revenues for international funds designed for financing greenhouse gas abatement measures in developing countries such as the Global Environmental Facility (GEF).
• Last but not least: The introduction of the ETR should be accompanied - or led - by a reduction and elimination of ecologically damaging subsidies and ineffective regula-tions, such as certain subsidies to agriculture or building of infrastructure (e.g. trans-port networks, sewage treatment plants, waste incineration plants) or economically inefficient policies in air pollution control and energy saving.

9. Conclusions for a Swiss Model Policy 157
INFRAS/ECOPLAN
9. Conclusions for future Swiss model policy
This report has analysed theoretical and numerical/mathematical models - available in Switzerland and abroad - to simulate the energetic and socio-economic effects of energy and environmental policy toward sustainable development. Chapter 7 described meta analytical approaches to look at the major limitations and assumptions of these models and how results predicted by them are changed if their key limitations are relaxed in order to take real world situations into account better.
This analysis inevitably involves questions relating to the optimal allocation of resources invested in such modelling efforts. In this chapter we summarise some of related our observations and assessments - without any claims of a systematic analysis of the issue.
9.1. Past and present model policies
Models are not objectives for themselves. They are tools to serve a purpose. The devel-opment of economic modelling related to energy and environmental issues must be seen in the context of policy development in these sectors.
The era of „modern“ Energy - and Environment-Policy110 began around the 1970’s, lar-gely induced by the oil crisis and the public debate of „the limits to growth“. Early sub-stantial policy development work in the Energy/Environment and transport sector took place in the framework of the Committees on Global Energy Policy (1973-1978) and for Global Transportation (finished 1978). Work supporting the development and implemen-tation of the federal law related to the protection of the environment and its subsequent ordinances began somewhat later, before the enactment of this law in 1983.
Scientific support of this policy work began to include the development and application of economic models in the context of a broad range of technical and socio-economic stu-dies. At the beginning policy impacts and effectiveness in terms of environmental and energy efficiency were the main concerns. Later, the need for more comprehensive eco-nomic models was accentuated by two developments:
• Market based instruments such as environmental taxes and charges, tradeable per-mits became more important in the policy discussion.
110 EE-Policy = Enegy and Environmental Policy
158 9. Conclusions for a Swiss Model Policy
INFRAS/ECOPLAN
• Economic repercussions of EE-policy in terms of international competitiveness, (un)-employment and GDP growth became key issues.
• In this context various federal agencies as well as federal and cantonal Universities began to - or continued to - support different modelling research groups in Switzer-land (notably at the Universities of St. Gallen, Berne and Geneva), to focus their modelling capabilities to simulate the impacts of the policy investments under dis-cussion.
So far, the large majority of project support has been for one or two particular families of models, namely static I-O- and GEM-models. Interest in other, complementary approa-ches has begun only recently. Genuine dynamic models have not been developed.
Recently, GEM-research teams have begun to consider dynamic aspects by „upgrading“ and expanding GEM-models. Another approach is the transformation and application of an Macro-model (which originally has been developed for the EU) to Switzerland, linking Switzerland into this multi-regional model (INFRAS-KOF).
9.2. Future needs
Future needs in modelling EE-policy impacts are essentially determined by three elements:
1. strengths and limitations of present models
2. the focus of objectives and instruments of future EE-policies
3. outstanding features of the mega-trends of future technological dyna-mics and socio-cultural-economic development (e.g. globalisation and increasing relevance of information technologies, potentials of „dematerialisation“).
The first aspect has been one focus of interest in this report. The main features of the second and third can be said to be
- The persistance of high structural unemployment combined with conti-nued rapid technological and structural change, globalisation of markets, intercontinental shifts in competitiveness in „traditional“ industrial production, etc. This clearly calls for models with higher capabilities of simulating system dynamic aspects of innovation and technological change processes.
- The analysis of more ambitious EE-objectives and policies, such as implied by IPCC, and pursued - in Switzerland - by the popular initiatives on energy and environment pending at present. This points in the same direction for enhanced dynamic modelling capabilities.

9. Conclusions for a Swiss Model Policy 159
INFRAS/ECOPLAN
9.3. Conclusions for modelling policy
Based on the results of this project, in particular the needs-summary in section 9.2 on the one hand, and on more general - earlier - experience with modelling for policy making in the transportation and the environmental sector on the other hand111, the following conclusions are drawn for the developmente of future modelling policy in Switzerland:
1. It is generally good practice to maintain - or develop - a diversity of modelling approaches and to avoid mono-cultures in methodologies, methodological ideologies and schools of thought. There is a wellknown psychological phenomenon relating to communities and subcultures in the modelling world: „If your only tool is a hammer, you tend to see nails everywhere“.
2. A robust scientific support to policy making presupposes a fabric of methods, allowing for a critical analysis of results produced by models as independent and complemen-tary as possible.
3. The fabric of models should not only include models with alternate architectural de-signs (I/O, GEM, MM, System Dynamics, etc.) but of similarly high complexity. It should as well contain a well balanced mix of models with a broader spectrum of complexity: From simple, crude and transparent models („rough and ready“), up to sophisticated and complex models.
4. The type of policy which will be of interest in the future will imply - and deal with - profound and far reaching structural change process: Technological economic and socio-cultural. This emphasises the need to correct the past tendency toward a monocultural model policy around static models. The need is to develop capabilities to simulate the
- dynamic aspects
- innovation technological and structural change
- policy induced innovation processes and technological market penetration processes
- non-linear, or non-infinitesimal phenoma
- long term aspects.
5. It must be clearly distinguished between the requirements that models with different time horizons must meet: short term economic models, designed to predict economic performance for the next 1, 2, 6 or 12 months must meet requirements very different from models designed to trace out the long term impacts of EE-policies over time periods where dynamic aspects, innovations and structural changes play a key role.
111 See Mauch 1974 and Bower, Mauch 1974

160 9. Conclusions for a Swiss Model Policy
INFRAS/ECOPLAN
6. There is a need to develop a family of genuine dynamic models, with special capa-bilities to simulate dynamic transitional phenomena. The role of Systems Dynamic approaches and models as well as their potential for further development should be assessed by a combined team of researchers from different „schools“.
7. An explicit policy for EE-modelling (intersectoral and sectoral) is necessary and should periodically be updated (e.g. every 4 years). This policy should include gui-delines relating to the allocation of funds to different developments, oriented towards needs and objectives. University level basic and applied research, as well as practical policy oriented sectoral research should be considered separately, and in coordi-nation.
8. Last but not least, the question „How accurate is accurate enough for the practical decisions at hand?“ must be asked more persistingly and: the principal „It is better to be approximately right than exactly wrong“ must be remembered more often.

INFRAS/ECOPLAN
Annex

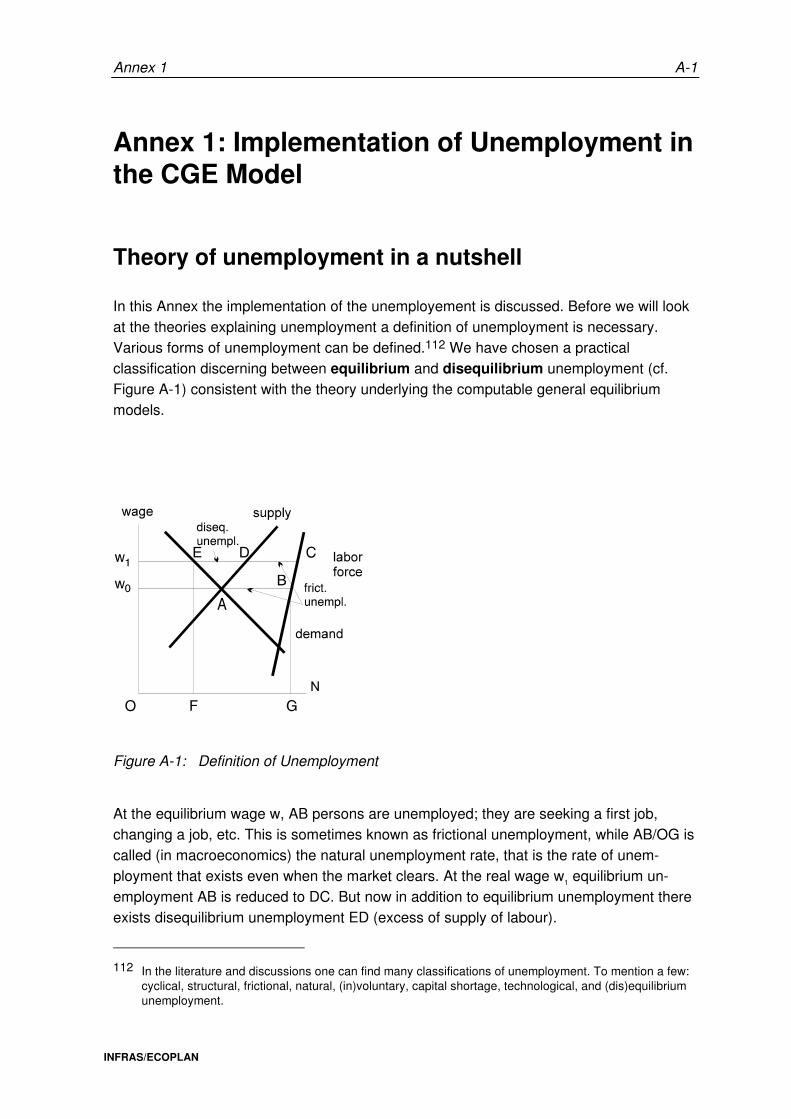
Annex 1 A-1
INFRAS/ECOPLAN
Annex 1: Implementation of Unemployment in the CGE Model
Theory of unemployment in a nutshell
In this Annex the implementation of the unemployement is discussed. Before we will look at the theories explaining unemployment a definition of unemployment is necessary. Various forms of unemployment can be defined.112 We have chosen a practical classification discerning between equilibrium and disequilibrium unemployment (cf. Figure A-1) consistent with the theory underlying the computable general equilibrium models.
Figure A-1: Definition of Unemployment
At the equilibrium wage w, AB persons are unemployed; they are seeking a first job, changing a job, etc. This is sometimes known as frictional unemployment, while AB/OG is called (in macroeconomics) the natural unemployment rate, that is the rate of unem-ployment that exists even when the market clears. At the real wage w1 equilibrium un-employment AB is reduced to DC. But now in addition to equilibrium unemployment there exists disequilibrium unemployment ED (excess of supply of labour).
112 In the literature and discussions one can find many classifications of unemployment. To mention a few:
cyclical, structural, frictional, natural, (in)voluntary, capital shortage, technological, and (dis)equilibrium unemployment.
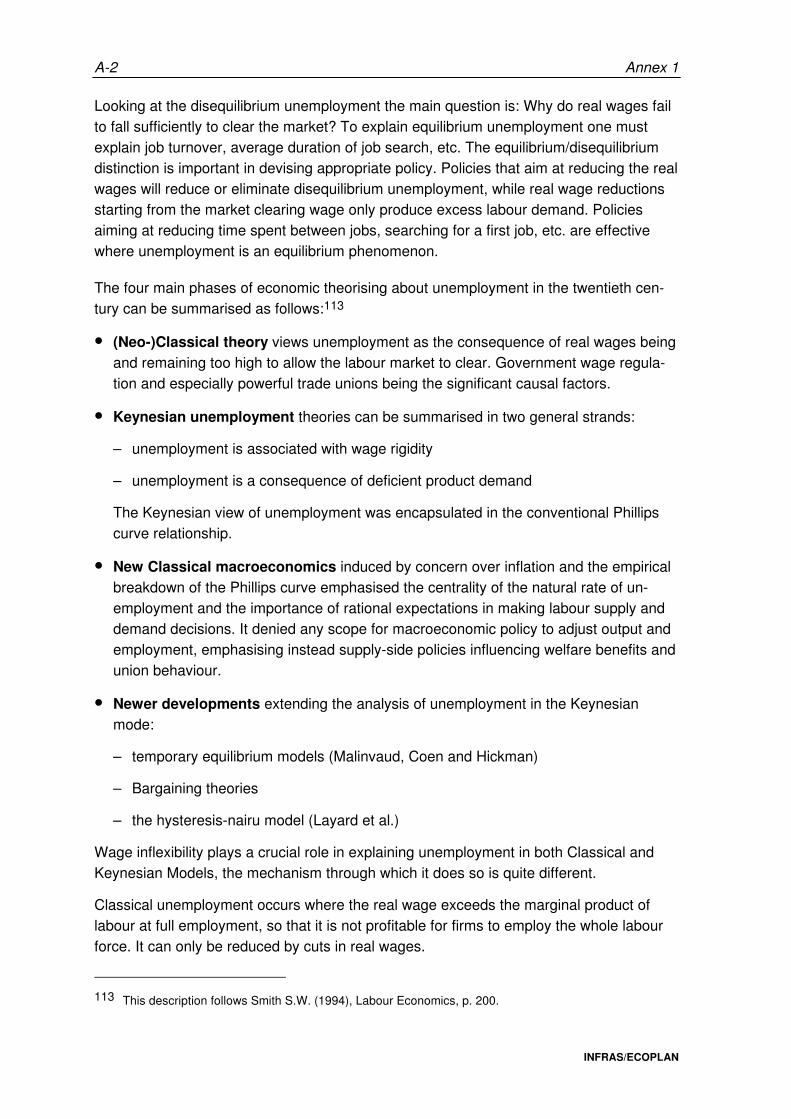
A-2 Annex 1
INFRAS/ECOPLAN
Looking at the disequilibrium unemployment the main question is: Why do real wages fail to fall sufficiently to clear the market? To explain equilibrium unemployment one must explain job turnover, average duration of job search, etc. The equilibrium/disequilibrium distinction is important in devising appropriate policy. Policies that aim at reducing the real wages will reduce or eliminate disequilibrium unemployment, while real wage reductions starting from the market clearing wage only produce excess labour demand. Policies aiming at reducing time spent between jobs, searching for a first job, etc. are effective where unemployment is an equilibrium phenomenon.
The four main phases of economic theorising about unemployment in the twentieth cen-tury can be summarised as follows:113
• (Neo-)Classical theory views unemployment as the consequence of real wages being and remaining too high to allow the labour market to clear. Government wage regula-tion and especially powerful trade unions being the significant causal factors.
• Keynesian unemployment theories can be summarised in two general strands:
– unemployment is associated with wage rigidity
– unemployment is a consequence of deficient product demand
The Keynesian view of unemployment was encapsulated in the conventional Phillips curve relationship.
• New Classical macroeconomics induced by concern over inflation and the empirical breakdown of the Phillips curve emphasised the centrality of the natural rate of un-employment and the importance of rational expectations in making labour supply and demand decisions. It denied any scope for macroeconomic policy to adjust output and employment, emphasising instead supply-side policies influencing welfare benefits and union behaviour.
• Newer developments extending the analysis of unemployment in the Keynesian mode:
– temporary equilibrium models (Malinvaud, Coen and Hickman)
– Bargaining theories
– the hysteresis-nairu model (Layard et al.)
Wage inflexibility plays a crucial role in explaining unemployment in both Classical and Keynesian Models, the mechanism through which it does so is quite different.
Classical unemployment occurs where the real wage exceeds the marginal product of labour at full employment, so that it is not profitable for firms to employ the whole labour force. It can only be reduced by cuts in real wages.
113 This description follows Smith S.W. (1994), Labour Economics, p. 200.
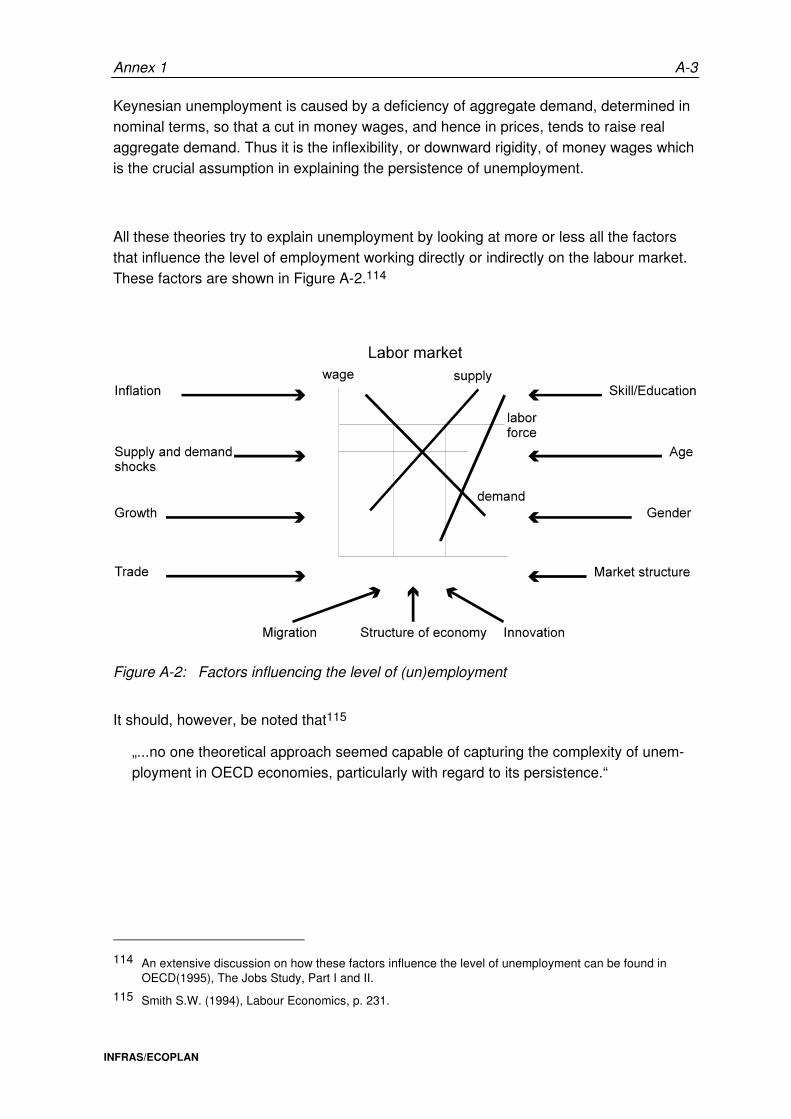
Annex 1 A-3
INFRAS/ECOPLAN
Keynesian unemployment is caused by a deficiency of aggregate demand, determined in nominal terms, so that a cut in money wages, and hence in prices, tends to raise real aggregate demand. Thus it is the inflexibility, or downward rigidity, of money wages which is the crucial assumption in explaining the persistence of unemployment.
All these theories try to explain unemployment by looking at more or less all the factors that influence the level of employment working directly or indirectly on the labour market. These factors are shown in Figure A-2.114
Figure A-2: Factors influencing the level of (un)employment
It should, however, be noted that115
„...no one theoretical approach seemed capable of capturing the complexity of unem-ployment in OECD economies, particularly with regard to its persistence.“
114 An extensive discussion on how these factors influence the level of unemployment can be found in
OECD(1995), The Jobs Study, Part I and II.
115 Smith S.W. (1994), Labour Economics, p. 231.
A-4 Annex 1
INFRAS/ECOPLAN
Implementation of unemployment
Implementation criteria and objective
As pointed out in the preceding chapter the existing literature on (un)employment pre-sents a wide range of theories explaining unemployment. They range from micro-eco-nomic theories concentrating on single aspects to macroeconomic theories that give an overall picture of the mechanisms underlying unemployment. It is obvious that not all of them can and should be implemented and a choice must be made. Criteria for the choice of the implementation of unemployment for our CGE model are:116
• Consistency: Are the features of the implementation consistent with the theory under-lying the model?
• Adequacy: How adequately represents the implementation the phenomena it is assumed to describe? To be more precise: How well suits the implementation the situation in Switzerland for the chosen year or period?
• Comprehensibility: The implementation should not be a black box.
• Implementability: Is it possible to implement unemployment in the desired way or are there limitations by the software, the base model used or the data?
Using these criteria the objective of the implementation should be:
• The model should depict the behaviour that can lead to unemployment on the aggre-gated Swiss labour market in an adequate and realistic way. This picture should be as complete as possible. Furthermore, the assumptions concerning the behaviour ought to be consistent with the underlying theory of CGE modelling as well as with the struc-ture of the model. Finally, the implementation should be relevant for the analysis.
In the next two chapters we will evaluate the implementation possibilities. In a first round the criterion „consistency“ is used to narrow down the choice. The remaining possibilities are then described and evaluated according to the criteria. In the last chapter the con-clusions concerning the objective of the implementation will be discussed and a possibility to implement unemployment in the CGE model will be presented.
116 cf. also Pesaran M.H. and Smith R.P. (1985), Evaluation of Macroeconometric Models.
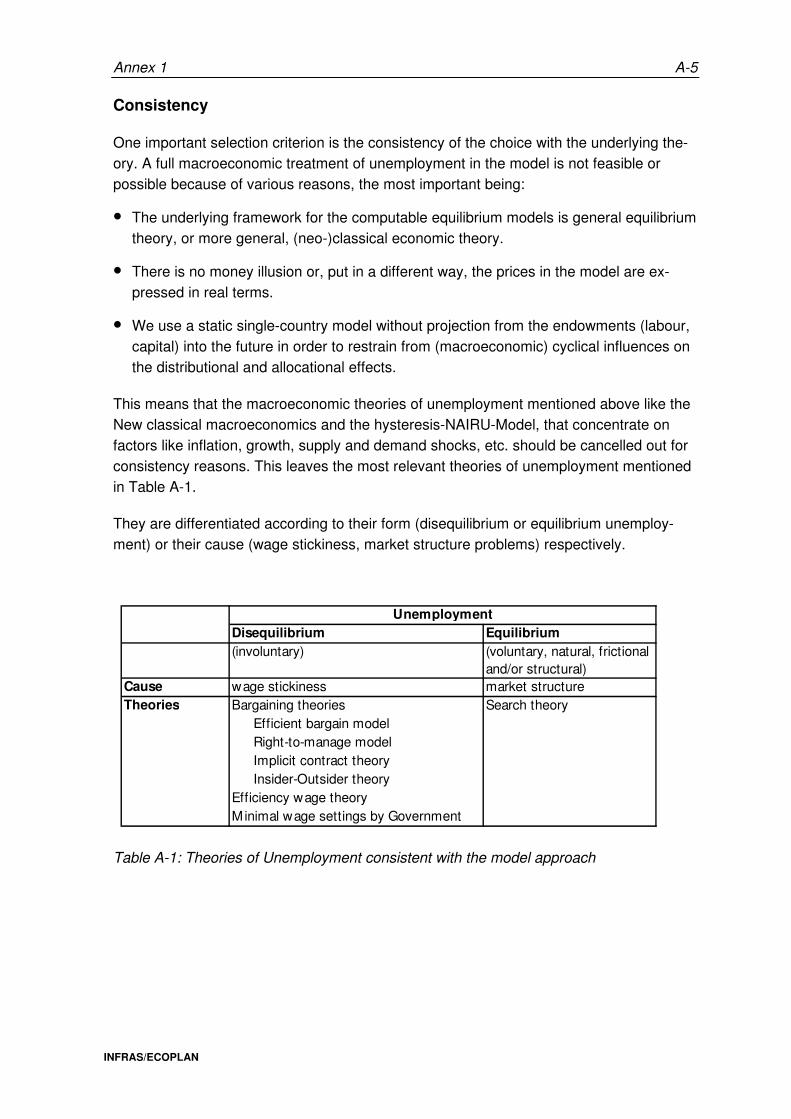
Annex 1 A-5
INFRAS/ECOPLAN
Consistency
One important selection criterion is the consistency of the choice with the underlying the-ory. A full macroeconomic treatment of unemployment in the model is not feasible or possible because of various reasons, the most important being:
• The underlying framework for the computable equilibrium models is general equilibrium theory, or more general, (neo-)classical economic theory.
• There is no money illusion or, put in a different way, the prices in the model are ex-pressed in real terms.
• We use a static single-country model without projection from the endowments (labour, capital) into the future in order to restrain from (macroeconomic) cyclical influences on the distributional and allocational effects.
This means that the macroeconomic theories of unemployment mentioned above like the New classical macroeconomics and the hysteresis-NAIRU-Model, that concentrate on factors like inflation, growth, supply and demand shocks, etc. should be cancelled out for consistency reasons. This leaves the most relevant theories of unemployment mentioned in Table A-1.
They are differentiated according to their form (disequilibrium or equilibrium unemploy-ment) or their cause (wage stickiness, market structure problems) respectively.
UnemploymentDisequilibrium Equilibrium(involuntary) (voluntary, natural, frictional
and/or structural)Cause wage stickiness market structureTheories Bargaining theories Search theory
Efficient bargain modelRight-to-manage modelImplicit contract theoryInsider-Outsider theory
Efficiency wage theoryMinimal wage settings by Government
Table A-1: Theories of Unemployment consistent with the model approach
A-6 Annex 1
INFRAS/ECOPLAN
Description and evaluation of the implementation possibilities
Bargaining theories
The bargaining theories try to explain the behaviour of trade unions. These theories can be used as possible explanations of (persistent) equilibrium unemployment caused by wage stickiness: If unions are able to influence the level of the wage, this should be re-flected in a wage differential between unionised and non-unionised workers. This wage differential is called the union mark-up. As there is no clear evidence of a productivity offset117, the wage-raising power will lead to less employment in the unionised sector or in sectors where the most of the employees are covered by collective agreements. Unless the remaining part of the labour market is fully flexible, the union mark-up will lead to un-employment in the un-unionised sectors of the economy. As empirical studies tend to support, not only the wage level of the unionised workers is affected, the union wage bargaining has also an impact on the level of all the wages. In Switzerland, for example, this mark-up is estimated at about 4% (cf. below).
The two main neo-classical models on the influence of unions on the labour market are:
• Efficient bargain model: In this model the unions negotiate about employment as well as wages.
• Right-to-manage model: The union has an influence on the wage level and the firm can set the employment level, which will maximise profits at any given wage rate.
Two further theories that can be used as possible explanations of the influence of trade unions on the labour market outcomes are:
• Implicit contract theory: Under the assumption that employees are more risk averse than their employers, employees will look for some form of insurance against wage fluctuations. The employers can offer a long-term wage contract which will keep the wages protected from product or labour market fluctuations. As the firms face adjust-ment costs they will wait in the case of a recession until the end of the contract to ne-gotiate a lower wage.
• Insider-Outsider theory:118 Insiders are employees whose position is protected by the existence of labour adjustment costs (e.g. hiring and training costs). Outsiders can be defined as unemployed persons and employees of other firms. Trade unions feature as representatives of insiders who can impose additional labour adjustment
117 Unionised enterprises could be more efficient as their are some positive effects on productivity (e.g.
lower staff turnover, more high-trust relationship, etc.)
118 A good description of the Insider-Outsider theory can be found in Lindbeck and Snower (1988).
Annex 1 A-7
INFRAS/ECOPLAN
costs. As the level of the insider wage is set a upper constraint by the marginal revenue per worker and marginal hiring and firing costs, its size depends on the magnitude of the incumbent workforce. If one assumes that wages for insiders are significantly insulated from external labour market conditions, the theory gives a possible explanation of wage rigidity. Once all insiders are employed the insiders or the union become indifferent about the consequences of the higher wage. In such a model modest increases of demand may be completely absorbed by a raise in wages rather than in a reduction of unemployment. Unemployment will persist.
Adequacy and empirical evidence
All the abovementioned bargaining theories only can explain some elements of unem-ployment. Especially the implicit contract theory and the insider-outsider theory do not provide a convincing explanation of wage rigidity and unemployment persistence. They do however give an insight in the bargaining processes. Furthermore, as Smith119 remarks:
„Attempts to test the two main models of union behaviour have not resolved the pro-blem of determining which is the most appropriate characterisation of trade union ac-tivity. (...) Neither theory seems to be able to account satisfactorily for the data on ne-gotiated wages and their associated employment levels.“
In many studies the impact of trade union power on unemployment has been estimated. Although the results vary quite markedly they all support the view that unions do have a negative effect on unemployment.120
Implementability
The implementation of bargaining theories in CGE models, although no new territory, is demanding in many respects. Not only the mathematical formulation but also the data requirements and the calibration seem to keep researchers away from implementing theories that try to incorporate endogenous explanations of wage differentials due to union power. However, the nineties show a growing bulk of literature on CGE models with unemployment caused by bargaining.
One of the most elaborated examples is Gelauff and Graafland.(121) Their recursive dy-namic CGE model MIMIC for the Netherlands contains not only a right-to-manage model but also a matching function, a search model and a minimal wage setting. The model has a wide variety of household groups (17 types, 170 income classes) and 6 sectors (a few of them are modelled as monopolies). They can rely on a vast set of data and estimated parameters.
119 Smith S.W. (1994), Labour Economics, p.131.
120 Smith S.W. (1994), Labour Economics, p.140.
121 Gelauff G.M.M. and Graafland J.J. (1994), Modelling Welfare State Reform.
A-8 Annex 1
INFRAS/ECOPLAN
Other studies with CGE models incorporating bargaining processes are those from (listed according to the year of publication):
• D.M. Newbery and J.E. Stiglitz (1985):(122) In a simple CGE model with constraints limiting the set of feasible contracts it is shown that unemployment will arise.
• M.C. Kemp et al (1987):123 CGE model with powerful trade unions. It is shown that increases in the payments to the unemployed or in the size of the workforce increase the level of employment and depress the net wage, and that technical improvements have the opposite effect.
• H.J. Jacobsen and Chr. Schultz (1990):124 The wage rate is determined by negotiation between an employers’ union and a trade union. Unions are supposed to be „long sighted“ and care about members’ utilities in stationary states. The Nash bargaining equilibria are characterised by unemployment for certain parameter values.
• J. Goto (1990):125 CGE trade model that incorporates labour unions and unemploy-ment. Examens USA-japan trade conflicts and trade-labour problems.
• P. Cahuc and A. Zylberberg (1991):126 CGE model with imperfect competition and union wage levels. The wage agreement at industry level is Pareto inefficient and en-tails the highest unemployment rate.
• B.S. Rasmussen (1992):127 CGE model with sector-specific trade unions. Wage formation is either non-co-operative or co-operative. The welfare and employment effects of bargaining co-operation to simple co-operation are ambiguous.
Main conclusions concerning the implementation
• One important feature of the more realistic models is their (recursive) dynamic nature. This is an obvious feature as the bargaining process between unions and firms are mostly repeated annually. The empirical underpinning of the rather short duration of wage adjustments, can be found in the OECD Jobs Study.128 This means, that if un-employment caused by bargaining processes are relevant for Switzerland, a (recursive) dynamic CGE model should be used.
122 Newbery D.M. and Stiglitz J.E.(1985), Wage rigidity, Implicit Contracts, Unemployment and Economic
Efficiency.
123 Kemp M.C., Leonard D. and Long N.V. (1987), Trade Unions, Seniority and Unemployment.
124 Jacobsen H.J and Schultz Chr. (1990), General Equilibrium Model with Wage Bargaining.
125 Goto J. (1990), Labor in international trade theory: A new perspective on Japanese-American issues.
126 Cahuc P. and Zylberberg A. (1991), Wage Setting Levels and Macroeconomic Performance.
127 Rasmussen, B.S. (1992), Union Cooperation and Nontraded Goods in General Equilibrium.
128 OECD (1994), OECD Jobs Study, part II, p.2.
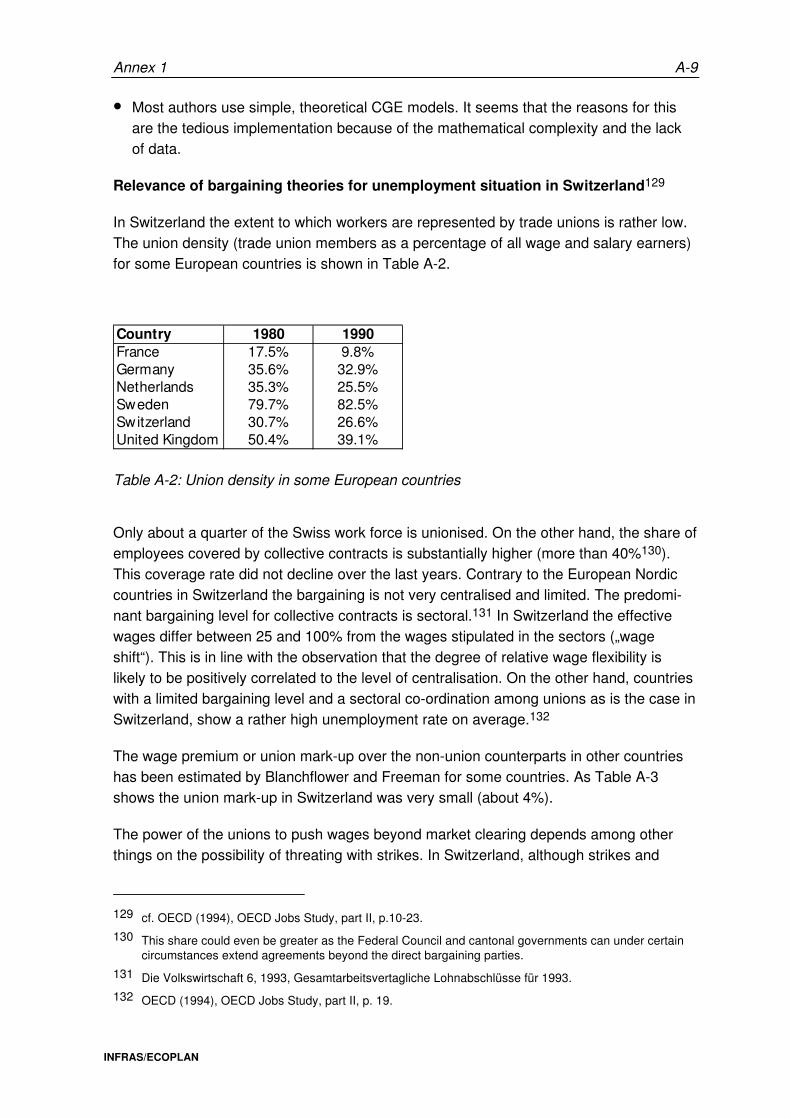
Annex 1 A-9
INFRAS/ECOPLAN
• Most authors use simple, theoretical CGE models. It seems that the reasons for this are the tedious implementation because of the mathematical complexity and the lack of data.
Relevance of bargaining theories for unemployment situation in Switzerland129
In Switzerland the extent to which workers are represented by trade unions is rather low. The union density (trade union members as a percentage of all wage and salary earners) for some European countries is shown in Table A-2.
Country 1980 1990France 17.5% 9.8%Germany 35.6% 32.9%Netherlands 35.3% 25.5%Sweden 79.7% 82.5%Switzerland 30.7% 26.6%United Kingdom 50.4% 39.1%
Table A-2: Union density in some European countries
Only about a quarter of the Swiss work force is unionised. On the other hand, the share of employees covered by collective contracts is substantially higher (more than 40%130). This coverage rate did not decline over the last years. Contrary to the European Nordic countries in Switzerland the bargaining is not very centralised and limited. The predomi-nant bargaining level for collective contracts is sectoral.131 In Switzerland the effective wages differ between 25 and 100% from the wages stipulated in the sectors („wage shift“). This is in line with the observation that the degree of relative wage flexibility is likely to be positively correlated to the level of centralisation. On the other hand, countries with a limited bargaining level and a sectoral co-ordination among unions as is the case in Switzerland, show a rather high unemployment rate on average.132
The wage premium or union mark-up over the non-union counterparts in other countries has been estimated by Blanchflower and Freeman for some countries. As Table A-3 shows the union mark-up in Switzerland was very small (about 4%).
The power of the unions to push wages beyond market clearing depends among other things on the possibility of threating with strikes. In Switzerland, although strikes and
129 cf. OECD (1994), OECD Jobs Study, part II, p.10-23.
130 This share could even be greater as the Federal Council and cantonal governments can under certain circumstances extend agreements beyond the direct bargaining parties.
131 Die Volkswirtschaft 6, 1993, Gesamtarbeitsvertagliche Lohnabschlüsse für 1993.
132 OECD (1994), OECD Jobs Study, part II, p. 19.
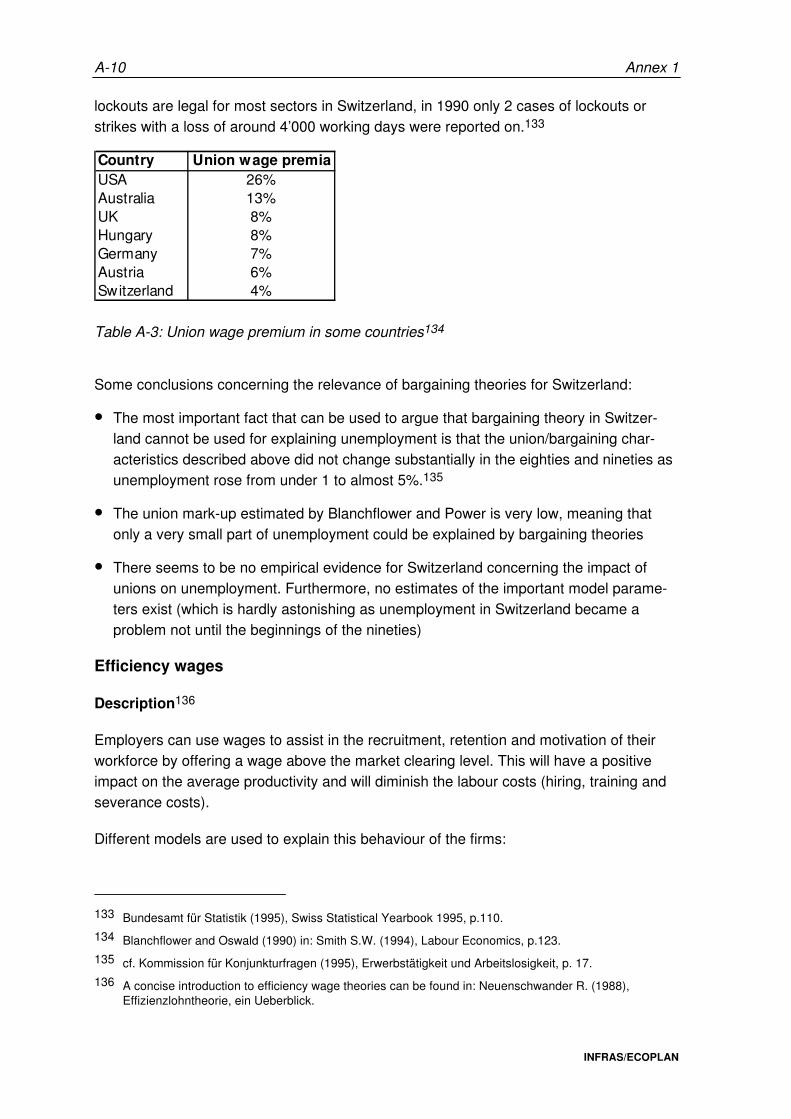
A-10 Annex 1
INFRAS/ECOPLAN
lockouts are legal for most sectors in Switzerland, in 1990 only 2 cases of lockouts or strikes with a loss of around 4’000 working days were reported on.133
Country Union wage premiaUSA 26%Australia 13%UK 8%Hungary 8%Germany 7%Austria 6%Switzerland 4%
Table A-3: Union wage premium in some countries134
Some conclusions concerning the relevance of bargaining theories for Switzerland:
• The most important fact that can be used to argue that bargaining theory in Switzer-land cannot be used for explaining unemployment is that the union/bargaining char-acteristics described above did not change substantially in the eighties and nineties as unemployment rose from under 1 to almost 5%.135
• The union mark-up estimated by Blanchflower and Power is very low, meaning that only a very small part of unemployment could be explained by bargaining theories
• There seems to be no empirical evidence for Switzerland concerning the impact of unions on unemployment. Furthermore, no estimates of the important model parame-ters exist (which is hardly astonishing as unemployment in Switzerland became a problem not until the beginnings of the nineties)
Efficiency wages
Description136
Employers can use wages to assist in the recruitment, retention and motivation of their workforce by offering a wage above the market clearing level. This will have a positive impact on the average productivity and will diminish the labour costs (hiring, training and severance costs).
Different models are used to explain this behaviour of the firms:
133 Bundesamt für Statistik (1995), Swiss Statistical Yearbook 1995, p.110.
134 Blanchflower and Oswald (1990) in: Smith S.W. (1994), Labour Economics, p.123.
135 cf. Kommission für Konjunkturfragen (1995), Erwerbstätigkeit und Arbeitslosigkeit, p. 17.
136 A concise introduction to efficiency wage theories can be found in: Neuenschwander R. (1988), Effizienzlohntheorie, ein Ueberblick.
Annex 1 A-11
INFRAS/ECOPLAN
• Productivity differential models:137 Employers do not have complete information on the productivity of their workers. A wage that is not high enough will cause the most productive workers to quit their job.
• Search models:138 The employer does not have full information on the search beha-viour of their work force. A wage above market clearing level reduces the expected gains from searching a new job and simultaneously increases the productivity.
• Shirking models:139 Another aspect to minimize labour cost is the concern of firms about shirking by their workers. The dismissal of a shirking worker is only than a threat if the dismissed worker must accept a lower wage at other firms which have vacancies or if there are no vacancies and unemployment is the consequence of being caught shirking. As all firms cannot increase relative wages, the unemployment result is more likely.
• Turnover models:140 The employer is not able to estimate the tendency of their em-ployees to quit their job. A wage above the market clearing level reduces this tendency and saves costs.
Adequacy
Efficiency wage theory as the bargaining theory does not give a complete explanation of why wages are sticky. Even taken together they tell less than the whole story.141 Most theoretical work is done on static models, thereby leaving out the dynamic components of unemployment.
Furthermore, policy changes can have different effects in the different versions of the theory.142 The validity of the theories is therefore an empirical question.
Estimations for the USA, France, Germany and Switzerland showed that the efficiency wage theory could not be validated.143
137 cf. for example: Malcomson J.M. (1981), Unemployment and the Efficiency Wage Hypothesis.
138 cf. Lindbeck A. and Snower D.J. (1987), Long-Term Unemployment and Macroeconomic Policy.
139 Shapiro C. and Stiglitz J.E. (1984), Equilibrium Unemployment as a Worker Discipline Device.
140 cf. for example: Calvo G. (1979), Quasi-Walrasian Theories of Unemployment.
141 cf. Fallon P. and Verry D. (1988), The Economics of the Labour Market, p. 225.
142 cf. Fallon P. and Verry D. (1988), The Economics of the Labour Market, p. 219.
143 van Nieuwkoop R. (1989), Effizienzlohntheorie, eine ökonometrische Untersuchung.
A-12 Annex 1
INFRAS/ECOPLAN
Implementability
Once again, only the Dutch CGE model has incorporated an efficiency wage.144
Another publication in which efficiency wage theories are incorporated into a theoretical CGE model is the paper by Agell and Lundborg145. They discuss the effects of tax policy and unemployment benefits on involuntary unemployment and resource allocation and re-examine classical results on tax-incidence. Among other things, they show that any tax policy that raises the wage-rental rate lowers unemployment.
Relevance of efficiency wage theory for unemployment situation in Switzerland
Estimations for Switzerland showed that the efficiency wage theory could not be vali-dated.146
Minimal wage setting
Description
Statutory minimum wages can be seen as a substitute for negotiated minimum wages. They are mostly applied in order to protect some low-productivity workers who might have to accept wages which fall below socially acceptable standards.
If the labour market is also regulated by minimum wage legislation, employers will select only those candidates whose productivity on the job offered is sufficient to meet the mini-mum wage. A rise in the legal minimum wage will decrease the acceptance rate of the employer and also increase the average vacancy duration at a given level of unemploy-ment.147
Social security legislation can lead to an implicit minimum wage. The social security payments, the unemployment benefits (duration and level of payments) as well as the continued payment in the case of illness define in fact a minimal wage.
A minimum wage rate will have adverse effects on job creation especially for low skilled workers.
In Europe statutory minimum wages are currently in operation in France, the Netherlands, Luxembourg, Spain and Portugal. All the European countries have social security
144 Gelauff G.M.M. and Graafland J.J. (1994), Modelling Welfare State Reform, p.11.
145 Agell J. and Lundberg P. (1992), Fair wages, involuntary unemployment and tax policies in the simple general equilibrium model.
146 van Nieuwkoop R. (1989), Effizienzlohntheorie, eine ökonometrische Untersuchung.
147 The description comes from Graafland J.J. (1991), Minimum wages, unemployment benefits and equilibrium unemployment: A simulation model for the Netherlands.
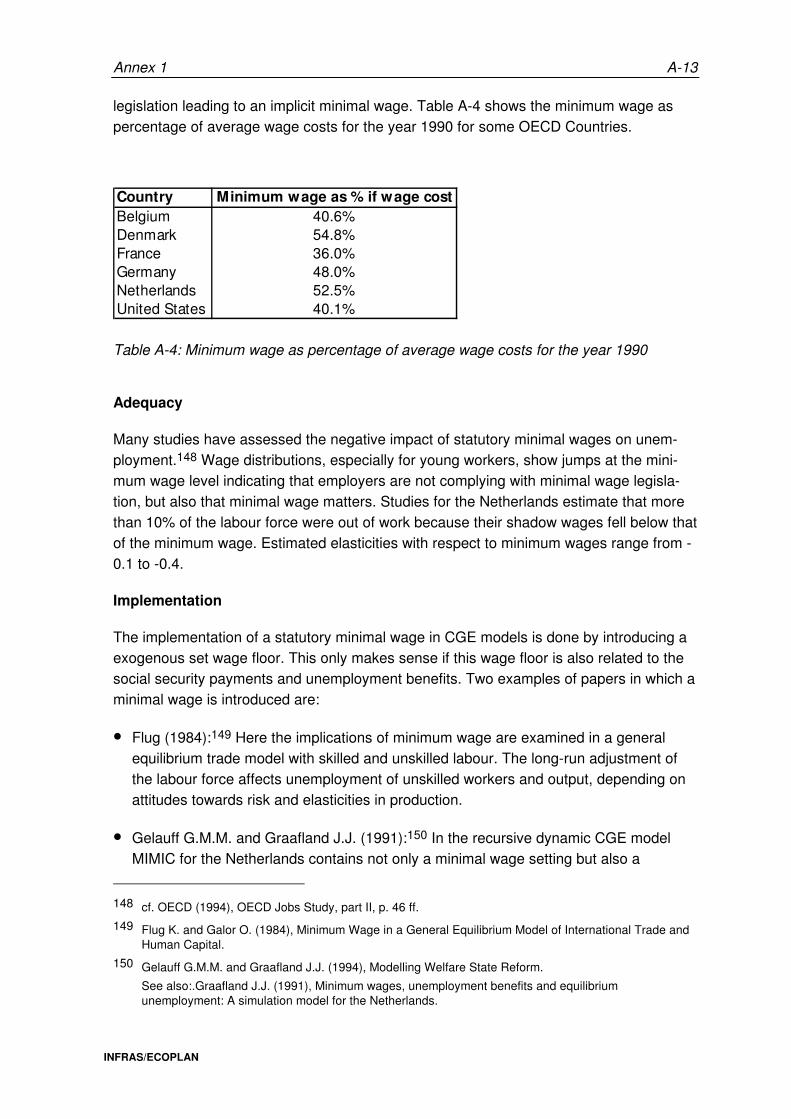
Annex 1 A-13
INFRAS/ECOPLAN
legislation leading to an implicit minimal wage. Table A-4 shows the minimum wage as percentage of average wage costs for the year 1990 for some OECD Countries.
Country Minimum wage as % if wage costBelgium 40.6%Denmark 54.8%France 36.0%Germany 48.0%Netherlands 52.5%United States 40.1%
Table A-4: Minimum wage as percentage of average wage costs for the year 1990
Adequacy
Many studies have assessed the negative impact of statutory minimal wages on unem-ployment.148 Wage distributions, especially for young workers, show jumps at the mini-mum wage level indicating that employers are not complying with minimal wage legisla-tion, but also that minimal wage matters. Studies for the Netherlands estimate that more than 10% of the labour force were out of work because their shadow wages fell below that of the minimum wage. Estimated elasticities with respect to minimum wages range from -0.1 to -0.4.
Implementation
The implementation of a statutory minimal wage in CGE models is done by introducing a exogenous set wage floor. This only makes sense if this wage floor is also related to the social security payments and unemployment benefits. Two examples of papers in which a minimal wage is introduced are:
• Flug (1984):149 Here the implications of minimum wage are examined in a general equilibrium trade model with skilled and unskilled labour. The long-run adjustment of the labour force affects unemployment of unskilled workers and output, depending on attitudes towards risk and elasticities in production.
• Gelauff G.M.M. and Graafland J.J. (1991):150 In the recursive dynamic CGE model MIMIC for the Netherlands contains not only a minimal wage setting but also a
148 cf. OECD (1994), OECD Jobs Study, part II, p. 46 ff.
149 Flug K. and Galor O. (1984), Minimum Wage in a General Equilibrium Model of International Trade and Human Capital.
150 Gelauff G.M.M. and Graafland J.J. (1994), Modelling Welfare State Reform.
See also:.Graafland J.J. (1991), Minimum wages, unemployment benefits and equilibrium unemployment: A simulation model for the Netherlands.
A-14 Annex 1
INFRAS/ECOPLAN
matching function, a search model and a right-to-manage model. They simulate mini-mum wage reductions (10-30% reduction and complete abolishment). The quantitative effects are rather small because the fall in the official minimum wage rate only partially diminishes the minimum wage scales in collective agreements determined by unions and employer’s organisations. They find an increase in employment.
Relevance of minimal wage setting for Switzerland
Switzerland does not have a statutory minimal wage, although collective agreements do set minimum wages for the parties directly involved151. Under certain circumstances the employers have the possibility to reduce the wage below the agreed wage floor. There is no statistical evidence for the existence of an implicit minimal wage. This does of course not mean that minimal wage setting does not play any role in explaining unemployment in Switzerland.
Job search152
Description
We now come to a theory explaining equilibrium (or frictional or structural unemployment). Job search theory is a neo-classical explanation of unemployment and originated in the 1970s. The main assumption is that both workers and employees face incomplete infor-mation about market opportunities. Workers do not have full information on wage offers and vacancies, whilst firms search for workers whose productivity can differ.
For workers it can be productive to spent time acquiring such information and deliberately refrain from work for a time. Simply accepting the first offer that comes along would not maximise expected life time earning. Similarly, when workers are not identically producti-ve, firms can increase expected profits by not taking the first applicant for a job.
An important aspect of search theory is the reservation wage, defined as the minimal acceptable wage. This reservation wage depends, among other things, on the wage dis-tribution, the welfare benefits and the chosen discount rate. The higher the welfare benefits, the higher will be the reservation wage, the longer the search duration and the higher the unemployment.
In the light of this theory unemployment can be explained as the mere inability to find a job at a suitable wage.
Adequacy
The search theory is criticised in some theoretical aspects: 151 If the Federal Council or the cantonal governments would extend the agreements beyond the direct
bargaining parties, one could speak of a minimum wage.
152 cf. Fallon P. and Verry D. (1988), The Economics of the Labour Market, p. 201 ff and Smith S.W. (1994), Labour Economics, Chapter 7.
Annex 1 A-15
INFRAS/ECOPLAN
• Job search theory is in respect of welfare benefits, reservation wages and unemploy-ment not completely definite. Especially in the case where all wage offers exceed the reservation wage. In this case, all the job search will be on-the-job and equilibrium un-employment cannot be explained by search theory. This criticism suggests that the existence of vacancies and not wage offer is crucial in search theory. Including the probability of finding a vacancy changes the relationship searching and unemployment: A lower probability of finding a vacancy will lower the reservation wage, which will shorten the search duration and reduce unemployment.
• Another theoretical critical point is the possibility that benefits may actually improve the effectiveness of job search by enabling the unemployed to finance the search activity which will lead to a faster rate of job offer arrival compared to non-claimants of welfare benefits.
• Search theory only sheds some light on the supply-side of the picture. A convincing model of the firm’s behaviour is lacking.
The empirical status of search theory casts considerable doubt on the magnitude of the relationship between welfare benefits and unemployment duration. It also questions the scope for reducing unemployment using the benefit policy instrument.
Implementability
Once again the most interesting implementation of the theory is done by Gelauff and Graafland153. In their recursive CGE model the reservation wage is related to a weighted average wage rate and the unemployment benefit. The weight of the average wage rate depends on the probability to find a job. The model contains five types of labour: low skilled with minimum income, other low skilled, technically skilled, economically skilled and service orientated skilled workers. The parameters of the search model are based on Dutch micro-econometric and macroeconometric research.
Other authors who explicitly implemented search theory are:
• Davidson et al.(1988):154 The authors develop a two-sector general equilibrium model in which unemployment arises endogenously because of trading frictions in the labour market of one sector.
• Galor O. and Lach S.(1989):155 The authors construct an overlapping generations model in which the steady-state equilibrium is characterised by the existence of search unemployment. It allows for the wage offers’ distribution to be determined endoge-nously.
153 Gelauff G.M.M. and Graafland J.J. (1994), Modelling Welfare State Reform.
154 Davidson et al. (1988), The Structure of Simple General Equilibrium Models with Frictional Unemploy-ment.
155 Galor O. and Lach S.(1989), Search Theory in an Overlapping Generations Setting.
A-16 Annex 1
INFRAS/ECOPLAN
• Hosios A.J. (1990):156 Hosios presents a simple general equilibrium model in which unemployed workers search for jobs and vacant firms search for employees. Some illustrative short-run and steady-state results are presented concerning the behaviour of open and closed economies that exhibit unemployment and vacancies.
Most of the developed models are highly aggregated, simple general equilibrium models (except for the CGE model for the Netherlands). The implementation is tedious, especially because of the implementation of the wage distribution and the poor availability of data for the parameter.
Relevance of search theory for Switzerland
In Switzerland there are no indications that would underpin the relevance of search theory for the explanation of increased unemployment in Switzerland.157
Conclusions
We started this chapter on the implementation of unemployment in CGE models with the formulation of the objective based on some relevant implementation criteria. This objec-tive was stated as follows:
The model should depict the behaviour that can lead to unemployment on the aggre-gated Swiss labour market in an adequate and realistic way. This picture should be as complete as possible. Furthermore, the assumptions concerning the behaviour ought to be consistent with the underlying theory of CGE modelling as well as with the struc-ture of the model. Finally, the implementation should be relevant for the analysis.
In a first step we argued that we have to confine ourselves to the neo-classical theories that try to explain unemployment because only these theories are consistent with the CGE framework. This meant that macroeconomic explanations of unemployment, that look at inflation, supply and demand shocks etc. had to be cancelled out. We looked at the neo-classical theories of unemployment and evaluated them according to the objec-tive.
The results of this evaluation can be summarised as follows:
• None of the theories gives a complete explanation of unemployment (this is, however, also true for all the macroeconomic theories)
• The implementation of only one of the theories in order to explain only a part of un-employment cannot be recommended, because:
156 Hosios A.J.(1990), Factor Market Search and the Structure of Simple General Equilibrium Models.
157 cf. Kommission für Konjunkturfragen (1995), Erwerbstätigkeit und Arbeitslosigkeit, p. 17.

Annex 1 A-17
INFRAS/ECOPLAN
– there is no empirical evidence for any of the theories for the Swiss situation, which of course does not mean, that the theories are wrong
– it is not clear which part of Swiss unemployment can be explained by only one of the theories.
• The implementation of a combination of theories, that would explain total unemploy-ment, as done by Gelauff and Graafland158 for the Netherlands is not feasible for Switzerland, because:
– there is no empirical evidence for any of the theories for the Swiss situation
– the data situation in Switzerland concerning unemployment theories is poor (para-meter for the mathematical description of the households’ and firms’ behaviour and calibration data are lacking)
– the costs and time demand would be very high. The implementation of unemploy-ment in the CGE model for the Netherlands has a long history. The CGE project was initiated at the Dutch Central Planning Bureau in the second quarter of 1987. More than 10 persons worked on the model during many years. The other models mentioned above are mostly very simple two-sector CGE models. Most of the models are static and only one theory of unemployment has been implemented.
These conclusions leave us at the starting point: The modelling of behaviour of house-holds and firms leading to unemployment seems to be impossible for the time being. However, one possibility still remains: Instead of trying to explain the unemployment re-sulting from the behaviour of households and firms one could impose the unemployment exogenously. This is not uncommon in CGE modelling and mostly done by introducing an exogenous wage floor. Some examples are:
• Erlich S. et al (1987):159 In this paper an application to Belgium of a two-period general equilibrium model is used to analyse market imperfections (e.g. downward rigidities on real wages). It is shown that in the short, real wage policies can only do very little to alleviate the burden of unemployment.
• Dewatripont M. and Robinson S.(1988):160 A CGE model of Turkey is used to explore the empirical effect on adjustment to various macroeconomic shocks of a variety of „structural“ rigidities, one of them being a wage rigidity leading to unemployment.
• Edward S. and Ostry J.D. (1990):161 The authors develop a general equilibrium model of an economy with short-run unemployment to analyse how anticipated protectionist
158 Gelauff G.M.M. and Graafland J.J. (1994), Modelling Welfare State Reform.
159 Erlich S., Ginsburgh V. and van der Heyden L.(1987), Where do real wage policies lead Belgium?
160 Dewatripont M. and Robinson S (1988), The impact of Price Rigidities: A Computable General Equilibrium Analysis.
161 Edward S. and Ostry J.D. (1990), Anticipated Protectionist Policies, Real Exchange Rates, and the Current Account: The Case of Rigid Wages.
A-18 Annex 1
INFRAS/ECOPLAN
policies affect real exchange rates, the current account, and aggregated unemploy-ment. If a future tariff generated a current real-exchange rate appreciation and if non-tradables are labour intensive, the anticipation of protectionist policies will generate an increase in current employment.
• Wang L.(1993):162 The author examines the incidence of the corporate income tax for a two-sector general equilibrium model with perfect capital mobility and sector-specific rigid-wage in the corporate sector. Unemployment and national income decline.
The introduction of an exogenous wage floor by definition does not give an explanation why this rigidity exists and how it reacts to changes of policy parameters. Another more promising way of introducing unemployment (partly) exogenously is the calculation of the mark-up on the competitive wage. The mathematical formulation of most theories trying to explain wage stickiness indirectly leads to a mark-up on the competitive wage.
The mark-up can account for one of the main causes of unemployment, namely for the unemployment caused by wage stickiness. Wage stickiness can be described as a si-tuation in which the wage level is too high and is not adjusted for a certain period. In Switzerland there is no evidence that the labour market structure has changed in the last few years163, ruling out the other main cause of unemployment (imperfect market struc-ture).
The objection that in reality the level of the mark-up is only temporary fixed and will be adjusted in the course of the years, can be ventured by indexing the mark-up with e.g. a consumer price index. As we are using a static model, which means a mid to long-term perspective, the mark-up should be calibrated in such way that it complies with the esti-mates for the semi-elasticity of real wages with respect to unemployment rates.164
The practical implementation can be done as follows:
• the rigidity is implemented as an endogenous mark-up on the wage caused by the given unemployment in the benchmark year
• the model is solved and the mark-up is calculated
• the level of the mark-up weighted by a price index is integrated the model.
The main assumptions and implications of the partly exogenous mark-up on the average competitive wage for the simulation results of different policies are obvious:
162 Wang L.F.S.(1993), Sector-Specific Unemployment and Corporate Income Tax Incidence: A Geometric
Exposition. See also: Wang L.F.S.(1990), Unemployment and the Backward Incidence of Pollution Control.
163 cf. Kommission für Konjunkturfragen (1995), Erwerbstätigkeit und Arbeitslosigkeit, p. 17.
164 This semi-elasticity ranges for some European countries from -1 to -3.5 (cf. OECD (1994), OECD Jobs Study, part II, table 4).

Annex 1 A-19
INFRAS/ECOPLAN
• Unemployment in Switzerland is mainly caused by wage stickiness
• The behaviour resulting in this wage stickiness is not part of the model
• Simulated policies only have an indirect impact on the wage mark-up through the chosen index which is in line with estimates on the long-run responsiveness of wages to unemployment.

Annex 2 A-21
INFRAS/ECOPLAN
Annex 2: Popular Initiative on Energy and Environment (published 28.9.1993)
(Federal popular Initiative for „the reward of energy conservation and against wasting of energy“)
The national constitution shall be amended as follows paragr. 24 octies, sect. 6 (new)
§ a) In order to protect the environment, landscapes and the climate, the Swiss Confederation takes measures to stabilize the consumption of non-renewable energies, and subsequently to reduce it stepwise down to an environmentally compatible level.
§ b) In order to reach these objectives the Confederation levies an incentive charge on all non-renewable energy sources and on hydro-electricity for plants with more than 1 MW installed capacity. The federal council decides on the level of charges, and reports to parliament annually on objectives reached.
§ c) The charges shall be nondistortionary with respect to foreign trade markets. To this end, legal implementations can foresee special, temporary regulation for energy intensive industries. Distortionary impacts on the consumer price index can be compensated. Aspects of regional economies are to be considered within the objectives of § a).
§ d) The revenues are to be completely recycled, socially compatibly, to households and business firms such that the overall quota of taxes and charge remains unchanged. The recycling scheme shall retain incentives for the efficient management of energy.
Transitional regulation Paragr. 21 (new)
If the law based on the constitutional amendment after 24 octies sect. 6 of the federal constitution has not come in force within three years after its acceptance by popular vote, the Federal Council shall immediately enact decrees for implementation. The use of non-renewable energy must be stabilized within eight years after acceptance of paragr. 24 octies sect. 6 of the federal constitution and subsequently diminish by one percent per year during 25 years.
A-22 Annex 2
INFRAS/ECOPLAN
Popular initiative „for a solar penny“ (published 28.9.1993)
The federal constitution is amended as follows: Paragr. 24 octies, sect. 5 (new)
§ a) For the promotion of the application of solar energy facilities within settlements and of the efficient and sustainable use of energy, the confederation levies a charge on the final demand of non-renewable energies; Inflation is to be compensated periodically. The charge is increased stepwise from originally 0.1 cents per kWh to 0.5 cents. At least half of the revenue is to be used for the utilization of solar energy.
§ b) The promotion programme of the confederation takes into account regional aspects. For energy intensive production transitional regulation can be foreseen. The protection of historical monuments and townscapes shall be taken into consideration. Revenues from non-hypothecated charges on energy may also be used for the promotion programme, instead of revenues from charges according to § a).
§ c) Details are regulated by the law.
Transitional regulations Paragr. 20 (new)
1 If the law is not in force three years after the acceptance of paragr. 24 octies sect. 5 of the constitution the Federal Council shall immediately enact corresponding decrees. Five years after the introduction of these decrees the full level of the charges shall be reached. Paragr. 24 octies sect. 5 shall expire twenty years after the full level of charges had been reached.
2 Existing solar installations shall qualify for fair financial support according to paragr. 24 octies sect. 5a provided they have not been operating for longer than one year at the time of acceptance of these constitutional amendments.

Abbreviations and Glossary A-23
INFRAS/ECOPLAN
Abbreviations and Glossary of Main Expressions
Abbreviations:
bn: Billion
CGEM: Computable General Equilibrium Model
CHF: Swiss Franc
CO2: Carbon Dioxide
DM: Deutschmark
ETR: Ecological Tax Reform
GDP: Gross Domestic Product
GNP: Gross National Product
GEF: Global Environmental Facilitate
GEM: General Equilibrium Model
GJ: Gigajoule
IE: Income Effect
IO/IOM: Input-Output Model
m: Million
MM: Macroeconomic Models
NIC: National Insurance Charge
R+D: Research and Development
SE: Substitution Effect
SSC: Social Security Contributions
t: Ton
VAT: Value added tax

A-24 Abbreviations and Glossary
INFRAS/ECOPLAN
Glossary of main expressions:
Aggregation: Synthesis -> Economic reality is drawn together to a few aggre-gates (households, companies, government).
Desaggregation: The opposite of aggregation; d. tries, as much as possible, to grasp reality in its facets, e.g. the whole of the productive sector is broken down into 40 or more single sectors; households into classes (e.g. according to income).
Variables: V. are entities which can take different values within a certain range. In the model, v. represent certain circumstances or influ-encing factors.
Exogenous v.: Predetermined v. -> are not explained by the model.
Endogenous v.: Are explained by the model -> the more v. can be made endoge-nous, the better the model is able to depict reality.
Stock v.: stock quantities-> are measured at a given time (e.g. capital, money supply, population).
Flow v.: flow quantities -> are measured in a time period (e.g. income, consumption, investment, population growth).
Parameter: Specify the direction and amount of the relationship between two variables, given a functional form. P. have no unit and are esti-mated in econometric models.
Static models: Describe situations, not processes. All variables are determined simultaneously -> time does not explicitly appear in the model.
Comparative statics: Comparison of two situations. These situations are described by a static model in which the exogenous variables take different va-lues.
Abbreviations and Glossary A-25
INFRAS/ECOPLAN
Dynamic models: Time is explicit in the model -> 6 main types:
- Yt = f(t) -> variable is directly time dependent
- Yt = f(Yt,Yt-1,Yt-2,...) -> variable depends on values of ear-lier periods
- Yt = f(Xt,Xt-1,Xt-2,...) -> variable depends on values of other variables in earlier periods
- Yt = f(Xt,Xt+1,Xt+2,...) -> variable depends on expected values of other variables
- Yt = f(∆Xt) -> variable depends on the change of other variables through time
- Yt = f(Σ Xr) -> variable depends on the accumulation of other variables over a certain time period (r=1 to t)
Recursive dynamic models: The endogenous variables can be calculated along a "causal chain" one after the other, with the help of the exogenous vari-ables and the variables calculated already. In CGEM: for example the assumption that current prices will remain unchanged in the fu-ture (=myopic expectations of households).
Interdependent models: Model equations can only be solved simultaneously -> "Causal chains" do not only run one way.
Deterministic models: Randomness is not considered in the variables -> fixed values of variables.
Stochastic models: V. as random variables with an expected value and variation properties are considered.
Total models: The model comprises all decisive agents, all goods, factors and money, i.e. all markets.
Partial models: Not all markets are included. Assumption: Cause-effect chains may be interrupted, or agents may be neglected. Example: iso-lated analysis of the energy market without considering feedbacks from/to other markets.
Micro models: Agents are individual households and companies.
Macro models: Only the state or trend of economic aggregates is explained (GDP, consumption, investment, imports/exports, employment, etc.). Modern macro models are rooted in microeconomics insofar as the trend in some macro aggregates is explained by individual decisions (e.g. behaviour of employers and employees on the la-bour market).
A-26 Abbreviations and Glossary
INFRAS/ECOPLAN
Equilibrium/disequilibrium models: Market equilibrium/market disequilibrium models (MEM, MDM): In MEM plans of supplying and demanding agents are compatible -> the market is cleared. In MDM plans are not compatible; plans have to be revised. Equilibrium vs. disequilibrium adjustment paths: The development of an endogenous variable over time can be favoured as a simple (economically explainable) linkage of the variable across different time periods (e.g. capital growth with a constant interest rate).
Bottom-up models: Engineering-based models which may include, when applied to energy or CO2 issues, a detailed description of the energy sector with a detailed model of the energy technologies. These models try to model the energy supply chain across time. Therefore, they are often formulated dynamically.
Literature L-1
INFRAS/ECOPLAN
Literature
AEBISCHER B. (1995), Kostenkurven für Energiesparungen im primären und tertiären Sektor (Entwurf), ETH, Forschungsgruppe Energieanalysen
AGELL J. AND LUNDBERG P. (1992), Fair wages, involuntary unemployment and tax policies in the simple general equilibrium model, Journal of Public Economics 47(3), April, p. 299-320
ANTILLE G. (1995), Input-Output-Tabellen 1990, Bundesamt für Statistik, Bern
ARMINGTON P.S. (1969), A Theory of Demand for Products Distinguished by Place of Production, International Monetary Staff Papers 16, pp. 159-178
BARKER T. (1995), Taxing Pollution instead of Employment: Greenhouse Gas Abatement through Fiscal Policy in the UK, Paper to Appear in Energy and Environment, 1995
BARKER T. AND PETERSON W. (1988), The Cambridge Multisectoral Dynamic Model of the British Economy, Cambridge University Press, Cambridge
BARRETT S. (1990), Economic Instruments for Managing Climate Change - A Survey and Analysis of Current Proposals, Study prepared for BP international, April
BOVENBERG A.L. AND VAN DER PLOEG F. (1994), Tax reform, Structural Unemployment and the Environment, Paper presented at the international workshop on "Environmental Taxation, Revenue Recycling and Unemployment" on December 1994 at Milano, organised by the "Fondazione ENI Enrico Mattei", Milano
BOVENBERG A.L. (1994), Environmental Policy, Distortionary Labour Taxation and Employment: Pollution Taxes and the Double Dividend, Paper presented at the international workshop on "Environmental Taxation, Revenue Recycling and Unemployment" on December 1994 at Milano, organised by the "Fondazione ENI Enrico Mattei", Milano
BOWER B.T. AND MAUCH S.P. (1974), Regional Residuals Environmental Quality Management Modelling: Criteria for an optimal Planning Process in the Real World, Journal of Environmental Management Vol 4, July 1976
BROOKE A., KENDRICK D., MEERAUS A. (1992), GAMS A User Guide, The Scientific Press, San Francisco
BUNDESAMT FÜR STATISTIK (1995), Swiss Statistical Yearbook 1995, Bern
BUNDESAMT FÜR STATISTIK (1995a), NOGA Allgemeine Systematik der Wirtschaftszweige, Teil 1: Detaillierte Gliederung, Bern
L-2 Literature
INFRAS/ECOPLAN
BUREAU DU PLAN (1993), Effects of a General Reduction in Employers' Social Security Contributions Financed by a CO2/Energy Tax, Brussels 1993
CAHUC P. AND ZYLBERBERG A. (1991), Wage Setting Levels and Macroeconomic Perfor-mance, Annales d’Economie et de Statistique 0(23), July-Sept., p. 1-12
CALVO G. (1979), Quasi-Walrasian Theories of Unemployment, American Economic Re-view, 69(2), pp. 102-107
CAPROS P. ET AL., Double dividend Analysis: First results of a General Equilibium Model (GEM-E3) linking the EU-12 countries, Paper presented at the international workshop on "Environmental Taxation, Revenue Recycling and Unemployment" on December 1994 at Milano, organised by the "Fondazione ENI Enrico Mattei", Milano
CARRARO C. AND SOUBEYRAN A. (1994), Environmental Taxation and Employment in a Multi-Sector General Equilibrium Model, Paper presented at the international workshop on "Environmental Taxation, Revenue Recycling and Unemployment" on December 1994 at Milano, organised by the "Fondazione ENI Enrico Mattei", Milano
CE/DE WITT G. (1994), The Effects in Employment of a Shift in Taxation from Labour to the Environment; Delft 1994
CLINE W. R. (1994), Costs and Benefits of Greenhouse Abatement: A Guide to Policy Analysis, in: OECD, The Economics of Climate change - Proceedings of an OECD/IEA Conference
DAVIDSON C., MARTIN L. AND MATUSZ S. (1988), The Structure of Simple General Equilib-rium Models with Frictional Unemployment, Journal of Political Economy 96(6), De-cember, pp. 1267-1293
DEPARTMENT OF APPLIED ECONOMICS, UNIVERSITY OF CAMBRIDGE (1996), Greenhouse Gas Abatement through Fiscal Policy, Results of the project in the European Commission Environmental Research programme - Research Area III Economic and Social Aspects of the Environment, Cambridge August 1996
DEWATRIPONT M. AND ROBINSON S (1988), The impact of Price Rigidities: A Computable General Equilibrium Analysis, University of California at Berkeley Department of Agri-culture and Resource Economics (CUDARE) Working Paper 375, February
DIW (DEUTSCHES INSTITUT FÜR WIRTSCHAFTSFORSCHUNG) (1994), Gutachten im Auftrag von Greenpeace, Wirtschaftliche Auswirkungen einer ökologischen Steuerreform, Berlin
DORFMANN M. A. ET AL. (1992), Environmental Dividends: Cutting more Chemical Wastes, New York: INFORM
Literature L-3
INFRAS/ECOPLAN
ECOPLAN (1996), Wirtschaftliche Auswirkungen der Energie-Umwelt-Initiative, Komparativ statische Gleichgewichtsanalyse, Studie im Auftrag des Bundesamtes für Energiewirtschaft zu Handen der Arbeitsgruppe „Energieperspektiven“
ECOPLAN (1995), Wirtschaftliche Auswirkungen und Verteilungseffekte verschiedener CO2-/Energieabgabe-Szenarien, Ergebnisse aus einem berechenbaren Gleichge-wichtsmodell für die Schweiz, EDMZ, Bern
ECOPLAN (1993), Möglichkeiten und Grenzen von allgemeinen Gleichgewichtsmodellen zur Untersuchung von energiepolitischen Massnahmen - Pilotstudie im Rahmen der sozioökonomischen Energieforschung des Bundes
EDWARD S. AND OSTRY J.D. (1990), Anticipated Protectionist Policies, Real Exchange Rates, and the Current Account: The Case of Rigid Wages, Journal of International Money and Finance 9(2), June, pp. 206-219
EIDG. DEPARTEMENT DES INNERN (EDI) (1994), CO2-Abgabe auf fossilen Energieträgern, Erläuternder Bericht, Bern
EIDG. VOLKSWIRTSCHAFTSDEPARTEMENT (1993), Gesamtarbeitsvertagliche Lohnab-schlüsse für 1993, Die Volkswirtschaft 6
ERLICH S., GINSBURGH V. AND VAN DER HEYDEN L. (1987), Where do real wage policies lead Belgium?, European Economic Review 31(7), October, pp. 1369-1383.
EUROPEAN COMMISSION (1992), The Climate Challenge, Economic Aspects of the Community's Strategy for Limiting CO2 Emissions, Brussels, Mai 1992
EUROPEAN COMMISSION (1992a), The Economics of limiting CO2 Emissions, Brussels, 1992a
EUROPEAN COMMISSION (1993), Taxation, Employment and Environment: Fiscal Reform for Reducing Unemployment, Brussels 1993 and the corresponding follow-up studies: CEC 1994a: Taxation, Employment and Environment, Analytical Study No. 3, European Economy No. 56, and ECE 1994b: Taxation and Employment: Tax Policies for Improving Employment in Europe, DG for Economic and Financial Affairs, DOC II/369/94, Brussels
FALLON P. AND VERRY D. (1988), The Economics of the Labour Market, New York
FELDER S. AND VAN NIEUWKOOP R. (1995), Revenue Recycling of a CO2 Tax: Results form a General Equilibrium Model for Switzerland, Annals of Operations Research (forthcoming, Special Issue)
FELDER S. AND SCHLEINIGER R. (1995), Domestic Environmental Policy and International Factor Mobility: A General Equilibrium Analysis, Swiss Journal of Economic and Statistics, 1995, Vol. 131 (3), pp. 547-558
L-4 Literature
INFRAS/ECOPLAN
JORD FOUNDATION (1994), A TIME TO CHOOSE: AMERICAS ENERGY FUTURE, Final Report by the Energy Policy Project of the Ford Foundation, ConferenceBallinger Publishing Company, Cambridge MA
FLUG K. AND GALOR O. (1984), Minimum Wage in a General Equilibrium Model of Interna-tional Trade and Human Capital, Brown Department of Economics Working Papers 84(21), October
GALOR O. AND LACH S.(1989), Search Theory in an Overlapping Generations Setting, Brown University Department of Economics Working Paper 89(20), April.
GELAUF G.M.M. AND GRAAFLAND J.J. (1991), Analyzing taxation and labour market with an AGE model for the Netherlands, Research Memorandum No. 86 Centraal Planbureau, Den Haag
GELAUFF G.M.M. AND GRAAFLAND J.J. (1994), Modelling Welfare State Reform, North-Holland, Amsterdam
GOTO J. (1990), Labour in international trade theory: A new perspective on Japanese-American issues, Johns Hopkins University Press, Baltimore and London
GOTTFRIED P. AND WIEGARD W. (1991), Exemption versus Zero Rating: A Hidden Problem of VAT, Journal of Public Economics 46, pp. 307-328
GOULDER L. H. (1994), Environmental Taxation and the „Double Dividend“: A Readers’s Guide, NBER (National Bureau of Economic Research) Working Paper Series, Cambridge MA
GRAAFLAND J.J. (1991), Minimum wages, unemployment benefits and equilibrium unem-ployment: A simulation model for the Netherlands, CPB Research Memorandum 87.
HEMMELSKAMP J. (1996), Environmental Policy Instruments and Their Effects on Innova-tion, Zentrum für Europäische Wirtschaftsforschung (ZEW), Mannheim
HOERNER J. A. AND MULLER F. (1996), Carbon Taxes for Climate Protection in a Competi-tive World, A Paper Prepared for the Swiss Federal Office for Foreign Economic Affairs by the Environmental Tax Program of the Center for Global Change, University of Maryland College Park
HOSIOS A.J.(1990), Factor Market Search and the Structure of Simple General Equilibrium Models, Journal of Political Economy 98(2), April, pp. 325-355
INFRAS (1992), CO2 Perspektiven im Verkehr, im Auftrag des Bundesamtes für Energiewirtschaft, Bern
Literature L-5
INFRAS/ECOPLAN
INFRAS (1995), Dynamische Energieabgabe und internationale Wettbewerbsfähigkeit - Energiewirtschaftliche Grundlagen, im Auftrag des Bundesamtes für Energiewirtschaft, Bern
INFRAS (1995), Energie-/CO2-Abgaben und internationale Wettbewerbsfähigkeit - Fallstudie Papierindustrie, Zürich
INFRAS (1995), Energieabgabe und internationale Wettbewerbsfähigkeit - Fallstudie Zementindustrie, Schlussbericht, Zürich
INFRAS (1995), Studien zum Thema „Ecotax and Employment“, erster Zwischenbericht im EU 3. Rahmenprogramm-Projekt „Green House Gas Abatement through Fiscal Policy“, Zürich 1995
JACOBSEN H.J AND SCHULTZ CHR. (1990) General Equilibrium Model with Wage Bargain-ing, Scandinavian Journal of Economics 92(3), pp. 379-398
JAFFE A. B. AND STAVINS R. N. (1994), The energy-efficiency gap.What does it mean? in: Energy Policy 22 (19), pp. 804-810
JAFFE A. B. AND STAVINS R. N. (1995), Dynamic Incentives of Environmental Regulations: The Effects of Alternative Policy Instruments on Technology Diffusion, in: Journal of Environmental Economics and Management 29, pp 43-63
JAFFE A. B., PETERSON S. R. AND PORTNEY P. R. (1995), Environmental Regulation and the Competitiveness of U:S: Manufacturing: What Does the Evidence Tell Us?, Journal of Economic Literature Vol. XXXIII, 1995, pp.132-163
JOCHEM E. AND HOHMEYER O. (1992), The Economic of Near-Term Reductions in Green-house Gases, in: Confronting Climate Change, Risks, Implications and Responses, Ed. I. M. Mintzer, Cambridge University Press
JESINGHAUS J. (1992), Preiselastizität bei Treibstoffen - ein neues Messkonzept, in: Mauch S., Iten R., von Weizsäcker E.U., Jesinghaus J.: Ökologische Steuerrefrom, Rüegger Verlag, Zürich
JOHANSSON T. B. AND SWISHER J. N. (1994), Perspectives on „Bottom-Up“ Analyses of the Costs of CO2 Emission Reductions, in: OECD, The Economics of Climate Change - Proceedings of an OECD/IEA Conference
JORGENSON D. W., WILCOXEN P. J. (1993), Reducing US Carbon Emissions: An Econo-metric General Equilibrium Assessment, in: Resource and Energy Economics, 1993, 7-25
KEMP M.C., LEONARD D. AND LONG N.V. (1987), Trade Unions, Seniority and Unemploy-ment, European Economic Review 31(5), July, pp. 1093-1112
L-6 Literature
INFRAS/ECOPLAN
KIRCHGÄSSNER G. (1996), Environmental Policy in Switzerland: Methods, Results, Pro-blems and Challenges, Paper presented at the workshop about „Actual Problems of Swiss Economic Policy“, Studienzentrum Gerzensee, March 21-23, 1996
KOMMISSION FÜR KONJUNKTURFRAGEN (1995), Erwerbstätigkeit und Arbeitslosigkeit, Beilage zur Volkswirtschaft 11/95
KOOPMAN J.: Eco-taxes and Employment in Europe: Under which Conditions can an Employment benefit from Green Fiscal Reform be expected? Brussels 1994 OECD: Implementation Strategies of Environmental Taxes; Paris 1995
KYPREOS S. (1992), CO2-Emission Control in Switzerland Using Mathematical Program-ming, Paul Scherrer Institute, Villigen, Switerland, published in INFOR vol. 30, no. 3, Aug. 1992
KYPREOS S. (1994), Allocation of Carbon Tax Revenue to National and International Mitigation Options, Paul Scherrer Institute, Villigen, Switzerland
KYPREOS S., Economic Implication of Environmental Policy for Switerland, Paper Pre-sented at the 16th Congress of the World Energy Council, Paul Scherrer Institute, Villigen, Switzerland
LINDBECK A. AND SNOWER D.J. (1987), Long-Term Unemployment and Macroeconomic Policy, American Economic Review 78(2), pp. 38-43
LINDBECK A. AND SNOWER D.J. (1988), The Insider-Outsider Theory of Employment and Unemployment, MIT Press, Cambridge , Mass.
MAJOCCHI A. (1994), Review of the empirical models and results related to eco-taxes and employment effects, Paper presented at the OECD Workshop on Implementation of Environmental Taxes, Paris, 14-15 February 1994, Dipartimento di Economia Pubblica e Territoriale, University of Pavia Italy, Febraury 1994
MALCOMSON J.M. (1981) Unemployment and the Efficiency Wage Hypothesis, Economic Journal 91, pp. 848-866
MANNE A. S. (1991), Global 2100: Three Scenarios for Reducing Carbon Emissions, Standford University
MANNE A. S. AND RICHELS R. G. (1990), CO2 Emissions Limits: an Economic Cost Analysis for the USA, in: The Energy Journal, Vol. 11 no 2
MAUCH S. (1974), Regional Environmental Quality Management Modelling: Outline of the User Standpoint, Paper presented at RFF/WHO Workshop, Rotterdam Oct 22-25
MAUCH S., ITEN R. ET AL. (1992), Ökologische Steuerreform - Europäische Ebene und Fallbeispiel Schweiz, Zürich
Literature L-7
INFRAS/ECOPLAN
MAUCH S., ITEN R. ET AL. (1995), Ökologische Steuerreform: Wettbewerbsfähigkeit, Be-schäftigung und Umwelt - Marktwirtschaftliche Bewältigung des ökologisch und ökonomisch bedingten Strukturwandels zu einer nachhaltigen Entwicklung, FMU (Forum Marktwirtschaft und Umwelt), Zürich
MEYER ZU HIMMERN A. AND KIRCHGÄSSNER G., Umweltschutz und internationale Wettbe-werbsfähigkeit, in: Jochimsen M., Kirchgässner G. (Ed.) (1995), Schweizerische Um-weltpolitik im internationalen Kontext, Basel
MORS M. (1991), The Economics of Policies to Stabilize or Reduce Greenhouse Gas Emissions: the Case of CO2, Economic Papers, Commission of the European Communities
MUELLER T. (1995), Effets de la taxation de l’ énergie sur l’économie Suisse, Rapport intermédiaire au EWG-OFEN sur le projet No2655 „Taxe CO2 et dynamique de l’économie Suisse“
NEUENSCHWANDER R. (1988) Effizienzlohntheorie, ein Ueberblick, Lizentiatsarbeit, Uni-versität Bern
NEWBERY D.M. AND STIGLITZ J.E.(1985) Wage rigidity, Implicit Contracts, Unemployment and Economic Efficiency, Pinceton Woodrow Wilson School Discussion Papers in Economics 91, April 25
OECD (1992), Les coûts économiques de la réduction des émissions de CO2, in: Revue économique de l' OECD, No 19, Paris
OECD (1992b), Energy taxation and price distortions in fossil fuel markets: some implica-tions for climate change policy, Hoeller P., Coppel J., Economic departement working papers, No 110, Paris
OECD (1994), OECD Jobs Study, Evidence and Explanations, Paris
OECD (1994a), The Economics of Climate Change, Proceedings of an OECD/IEA Confe-rence, Paris
OECD (1994b), Implementation Strategies of Environmental Taxes, Environment policy committee and committee on fiscal affairs, Joint session on taxation and environment 3rd session, November 1994
OECD (1995), Global Warming - Economic Dimensions and Policy Responses, Paris
OECD (1995b), Evaluation of environmental policies and their impact on employment using applied models, Beaumais O., Schubert K., P. Zagame, Environment Directorate
OECD (1996), Labour market policies in Switzerland, Paris
L-8 Literature
INFRAS/ECOPLAN
PALMER K., WALLACE E. O. AND PORTNEY P. R. (1995), Tightening Environmental Standards: The Benefit-Cost or the No-Cost Paradigm? in: Journal of Economic Perspectives, Vol. 9, Nr. 4, pp. 119-132
PESARAN M.H.AND SMITH R.P. (1985), Evaluation of Macro-econometric Models, Eco-nomic Modelling 2, pp. 125-134
PORTER M. E. AND VAN DER LINDE C. (1995), Toward a New Conception of the Environ-ment-Competitiveness Relationship, in: Journal of Economic Perspectives, Vol. 9, Nr. 4, pp. 97-118
PREVIDOLI P. AND STEPHAN G. (1996), Die Volkswirtschaftlichen Auswirkungen der Ener-gie-Umwelt-Initiative: Eine empirische, dynamische Gleichgewichtsanalyse, Gutachten im Auftrag des Bundesamtes für Energiewirtschaft, Universität Bern
PROGNOS (1996), Wirtschaftliche Auswirkungen der Szenarien IIa und IIb, im Auftrag des Bundesamtes für Umwelt, Wald und Landschaft, Bern und des Bundesamtes für Energiewirtschaft, Bern, Basel
PROGNOS (1996a), Energieperspektiven 1990 - 2030, Szenarien I, IIa und IIb, Basel
PROGNOS (1993), Bewertung der wirtschaftlichen Auswirkungen einer CO2 -Abgabe, Basel
PROGNOS (1993b), Auswirkungen einer gemischten Energielenungsabgabe nach EG-Vorschlag auf Energieverbrauch und CO2 - Emissionen, Basel
PROOST S. AND VAN REGEMORTER D. (1994), Testing the Double Dividend Hypothesis for a Carbon Tax in a Small Open Economy Paper presented at the international workshop on "Environmental Taxation, Revenue Recycling and Unemployment" on December 1994 at Milano, organised by the "Fondazione ENI Enrico Mattei", Milano
RASMUSSEN, B.S. (1992), Union Co-operation and Nontraded Goods in General Equilib-rium, Scandinavian Journal of Economics 94(4), pp. 561-579
ROTHEN S. M. (1993), Kohlendioxid und Energie - Eine Untersuchung für die Schweiz, Verlag Rüegger, Chur/Zürich
RUTHERFORD T.F. (1995), The GAMS/MPSGE and GAMS/MILES User Notes, GAMS De-velopment Corporation, Washington.
SANSTAD A. H. AND HOWARTH R. B. (1994), „Normal“ markets, market imperfections and energy efficiency, in: Energy Policy 22 (10), pp. 811-818
SCHMID H. AND ROSENBAUM E. (1995), Arbeitslosigkeit und Arbeitslosenversicherung aus ökonomischer Sicht, Bern
Literature L-9
INFRAS/ECOPLAN
SHAPIRO C. AND STIGLITZ J.E. (1984) Equilibrium Unemployment as a Worker Discipline Device, American Economic Review 74(3), pp. 433-444
SMITH S.W., 1994, Labour Economics, Routledge, London
STANDAERT S., 1992, The Macro-sectoral Effects of an EC-wide Energy Tax: Simulation Experiments for 1993-2005, in: CEC, The Economics of Limiting CO2 Emissions, European Economy, Special Edition No 1
STEPHAN G. AND IMBODEN D., 1995, Laissez-faire, Kooperation oder Alleingang: Klima-politik in der Schweiz, in: Schweizerische Zeitschrift für Volkswirtschaft und Statistik, Juni 1995
STERNER T., 1994, Environmental Tax Reform, Theory, Industrialized Country Experience, and Relevance in LDCs, February
VAN NIEUWKOOP R. (1989) Effizienzlohntheorie, eine ökonometrische Untersuchung, Lizentiatsarbeit, Universität Bern
VON WEIZSÄCKER E.U., LOVINS A. B. AND HUNTER LOVINS L., Faktor Vier - Doppelter Wohlstand - halbierter Naturverbrauch, Der neue Bericht an den Club of Rome, München: Droemer Knaur
WANG L. (1993) Sector-Specific Unemployment and Corporate Income Tax Incidence: A Geometric Exposition, American Economist 37(1), Spring 1993, pp. 64-67
WANG L.F.S.(1990) Unemployment and the Backward Incidence of Pollution Control, Journal of Environmental Economics and Management 18(3), may, pp. 292-298
WEDER R. (1995) Lenkungsabgaben und internationale Wettbewerbsfähigkeit: Handels- und standorttheoretische Überlegungen, Institut für Volkswirtschaft, Univesität Basel, Papier präsentiert im Rahmen der internationalen Konferenz: „Lenkungsabgaben und ökologische Steuerreform aus wirtschafts- und finanzpolitischer Sicht“, Bundesamt für Aussenwirtschaft
WELSCH H. AND HOSTER F., A (1994), General-Equilibrium Analysis of European Carbon/Energy Taxation: Model Structure and Preliminary Results, Institute of Energy Economics, University of Cologne, Köln
WHALLEY J. AND YEUNG B. (1994), External Sector „Closing Rules“ in Applied Equilibrium Models, Journal of International Economics 16, pp. 123-128
WIFO (Österreiches Institut für Wirtschaftsforschung) (1995), Makroökonomische und sektorale Auswirkungen einer umweltorientierten Energiebesteuerung in Österreich, Wien