Embed Size (px)
Citation preview
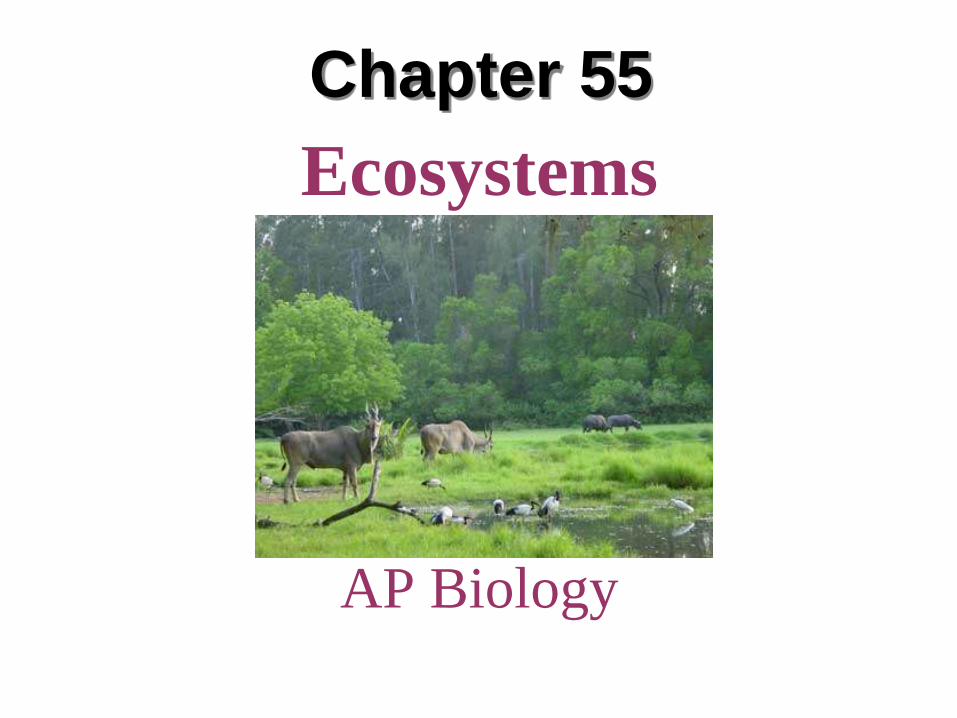
Chapter 55
Ecosystems
AP Biology
Overview: Observing Ecosystems • An ecosystem consists of all the organisms living in a community, as well as the
abiotic factors with which they interact
– Ecosystems range from a microcosm, such as an aquarium, to a large area
such as a lake or forest
• Regardless of an ecosystem’s size, its dynamics involve two main processes:
– 1) Energy flow: Energy enters most ecosystems as sunlight
• It is then converted to chemical energy by autotrophs, passed to
heterotrophs through organic molecules that make up food, and finally
dissipated as heat
– 2) Chemical cycling: Chemical elements, including carbon and nitrogen, are
cycled among abiotic and biotic components of an ecosystem
• Photosynthetic organisms incorporate these elements into their biomass
from the air, soil and water
– Some of this biomass is then consumed by animals
• The elements are returned to the environment by the metabolism of plants
and animals, as well as by bacteria and fungi
• In this chapter, we will discuss:
– Dynamics of energy flow and chemical cycling
• Physical laws governing energy flow and chemical
cycling in ecosystems
• Factors limiting primary production in aquatic versus
terrestrial ecosystems
– Impacts of human activities on energy flow and chemical
cycling
Concept 55.1: Physical laws govern energy flow
and chemical cycling in ecosystems
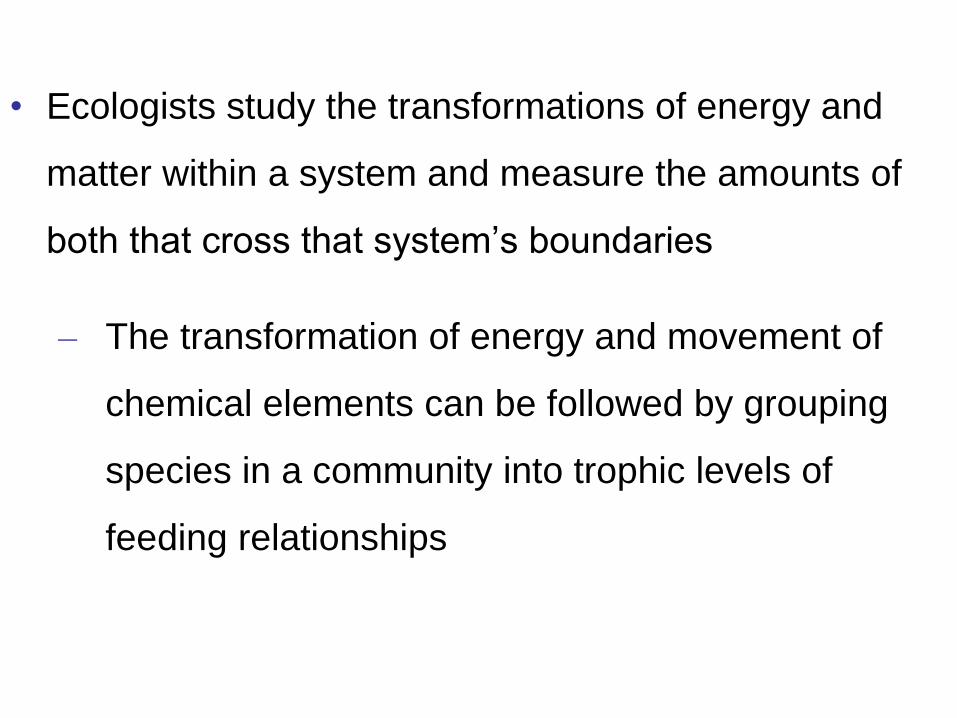
• Ecologists study the transformations of energy and
matter within a system and measure the amounts of
both that cross that system’s boundaries
– The transformation of energy and movement of
chemical elements can be followed by grouping
species in a community into trophic levels of
feeding relationships
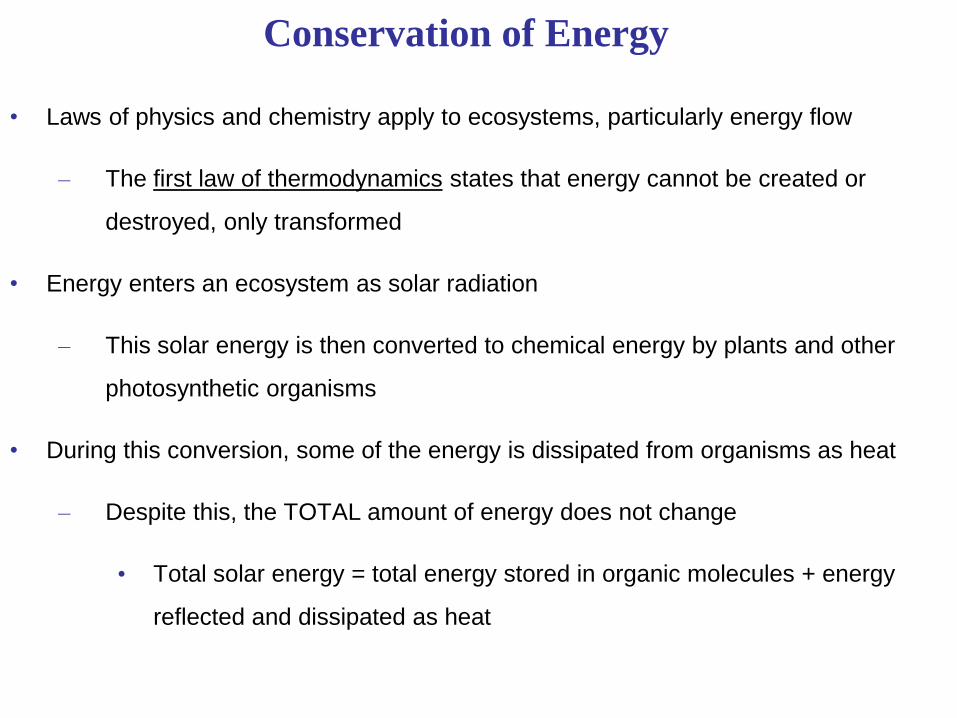
Conservation of Energy
• Laws of physics and chemistry apply to ecosystems, particularly energy flow
– The first law of thermodynamics states that energy cannot be created or
destroyed, only transformed
• Energy enters an ecosystem as solar radiation
– This solar energy is then converted to chemical energy by plants and other
photosynthetic organisms
• During this conversion, some of the energy is dissipated from organisms as heat
– Despite this, the TOTAL amount of energy does not change
• Total solar energy = total energy stored in organic molecules + energy
reflected and dissipated as heat
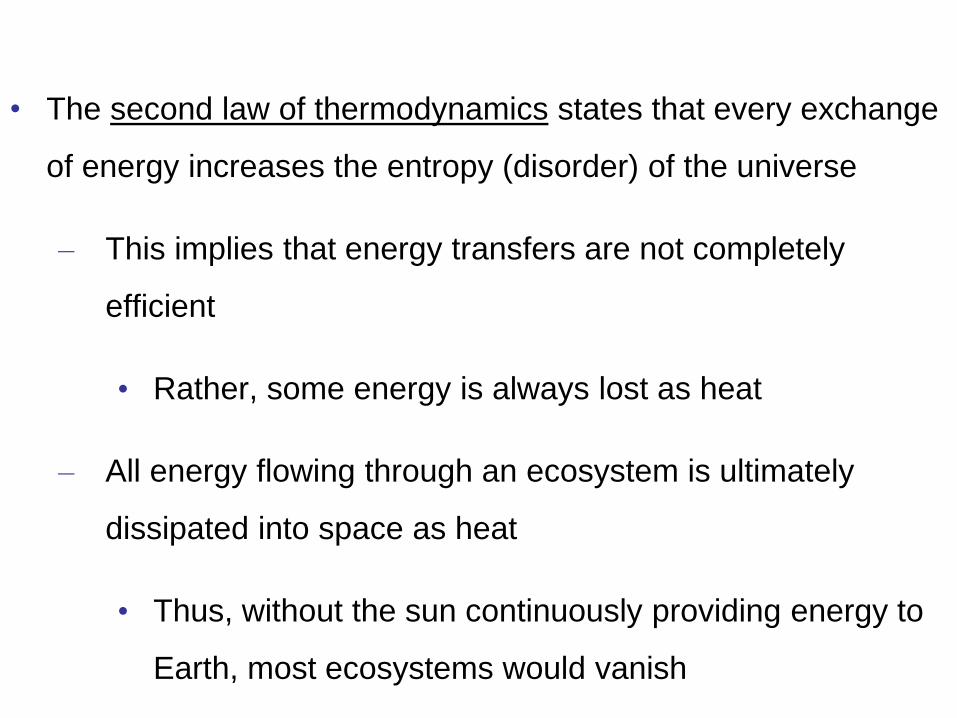
• The second law of thermodynamics states that every exchange
of energy increases the entropy (disorder) of the universe
– This implies that energy transfers are not completely
efficient
• Rather, some energy is always lost as heat
– All energy flowing through an ecosystem is ultimately
dissipated into space as heat
• Thus, without the sun continuously providing energy to
Earth, most ecosystems would vanish
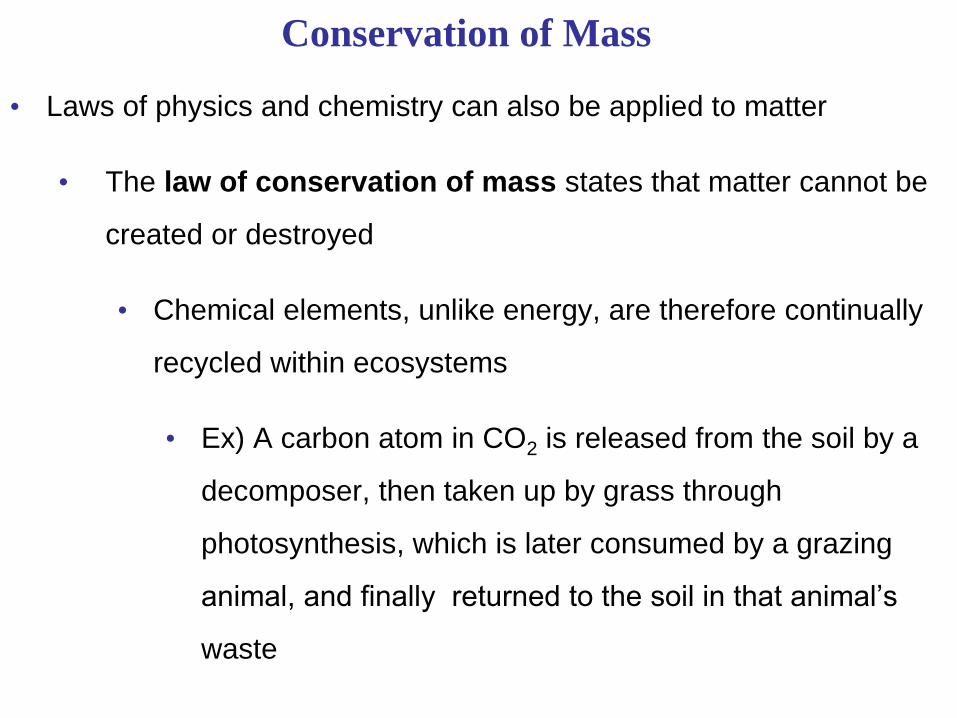
Conservation of Mass
• Laws of physics and chemistry can also be applied to matter
• The law of conservation of mass states that matter cannot be
created or destroyed
• Chemical elements, unlike energy, are therefore continually
recycled within ecosystems
• Ex) A carbon atom in CO2 is released from the soil by a
decomposer, then taken up by grass through
photosynthesis, which is later consumed by a grazing
animal, and finally returned to the soil in that animal’s
waste
• Although elements are not lost on a global scale, they move between
ecosystems as inputs and outputs
• Ex) In a forest ecosystem, most nutrients enter as dust or as
solutes dissolved in rain and are carried away in water or in
gases released by organisms
• Ecosystems are therefore open systems, absorbing energy and mass
and releasing heat and waste products
• The balance between inputs and outputs determines whether a
given ecosystem is a source or sink for a given element
• If a mineral nutrient’s outputs exceed its inputs, it will
eventually limit production in that ecosystem
Energy, Mass, and Trophic Levels • Recall: ecologists assign species to trophic levels on the basis of their main source
of nutrition and energy
– The trophic level that ultimately supports all others consists of autotrophs, also
known as primary producers
• Most autotrophs are photosynthetic organisms that use light energy to
make sugar and other organic compounds
– Plants, algae, and photosynthetic prokaryotes are the biosphere’s
main autotrophs
– Organisms in the trophic levels above primary producers are heterotrophs that
either directly or indirectly depend on the output of primary producers
• Primary consumers include herbivores, which eat plants and other
primary producers
• Secondary consumers are carnivores that eat herbivores
• Tertiary consumers are carnivores that eat other carnivores
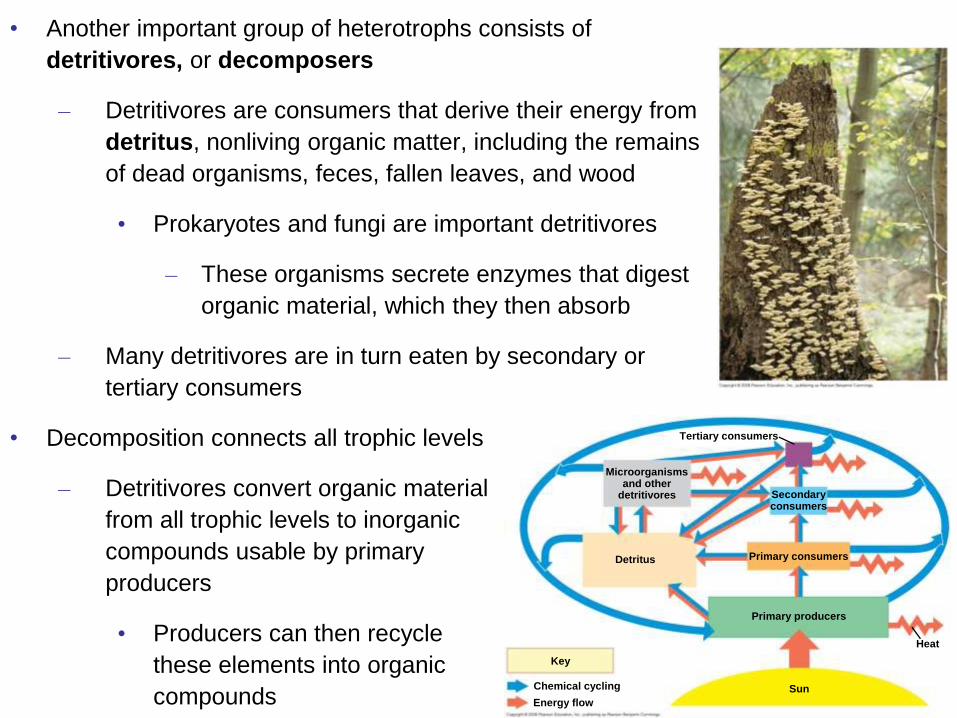
• Another important group of heterotrophs consists of
detritivores, or decomposers
– Detritivores are consumers that derive their energy from
detritus, nonliving organic matter, including the remains
of dead organisms, feces, fallen leaves, and wood
• Prokaryotes and fungi are important detritivores
– These organisms secrete enzymes that digest
organic material, which they then absorb
– Many detritivores are in turn eaten by secondary or
tertiary consumers
• Decomposition connects all trophic levels
– Detritivores convert organic material
from all trophic levels to inorganic
compounds usable by primary
producers
• Producers can then recycle
these elements into organic
compounds
Fig. 55-3
Fig. 55-4
Microorganismsand other
detritivores
Tertiary consumers
Secondaryconsumers
Primary consumers
Primary producers
Detritus
Heat
SunChemical cycling
Key
Energy flow
Concept Check 55.1
• 1) Why is the transfer of energy in an ecosystem referred to as
energy flow, not energy cycling?
• 2) How does the 2nd law of thermodynamics explain why an
ecosystem’s energy supply must be continually replenished?
• 3) You are studying nitrogen cycling on the Serengeti Plain in
Africa. During your experiment, a heard of migrating
wildebeests grazes through your study plot. What would you
need to know to measure their effects on nitrogen balance in
the plot?
Concept 55.2: Energy and other limiting factors
control primary production in ecosystems
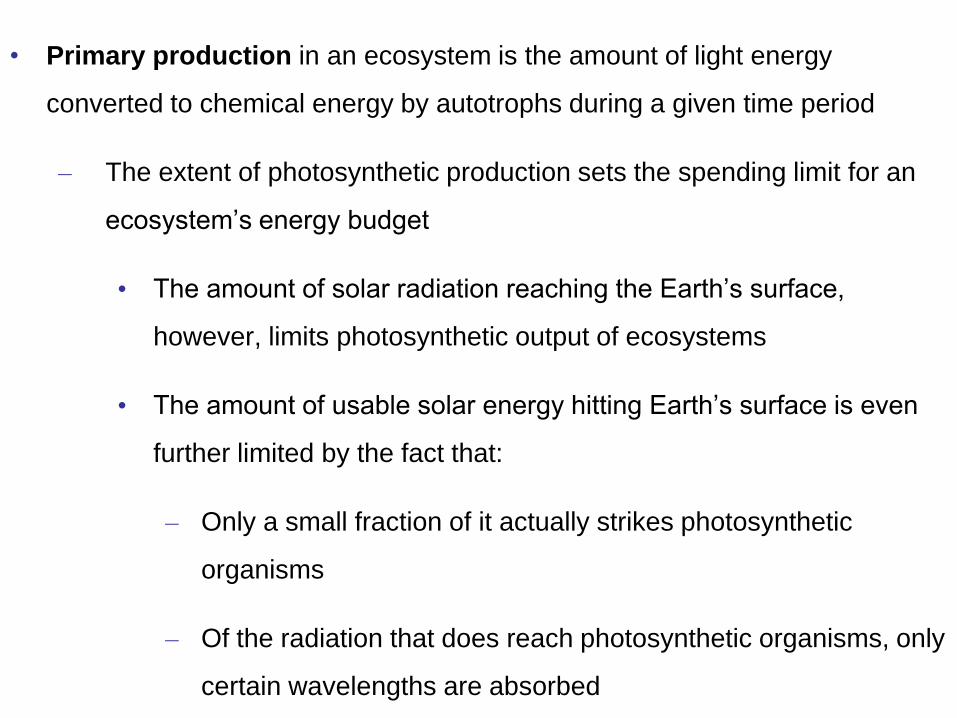
• Primary production in an ecosystem is the amount of light energy
converted to chemical energy by autotrophs during a given time period
– The extent of photosynthetic production sets the spending limit for an
ecosystem’s energy budget
• The amount of solar radiation reaching the Earth’s surface,
however, limits photosynthetic output of ecosystems
• The amount of usable solar energy hitting Earth’s surface is even
further limited by the fact that:
– Only a small fraction of it actually strikes photosynthetic
organisms
– Of the radiation that does reach photosynthetic organisms, only
certain wavelengths are absorbed
• As a result, only ~1% of the visible light that strikes photosynthetic
organisms is converted to chemical energy by photosynthesis
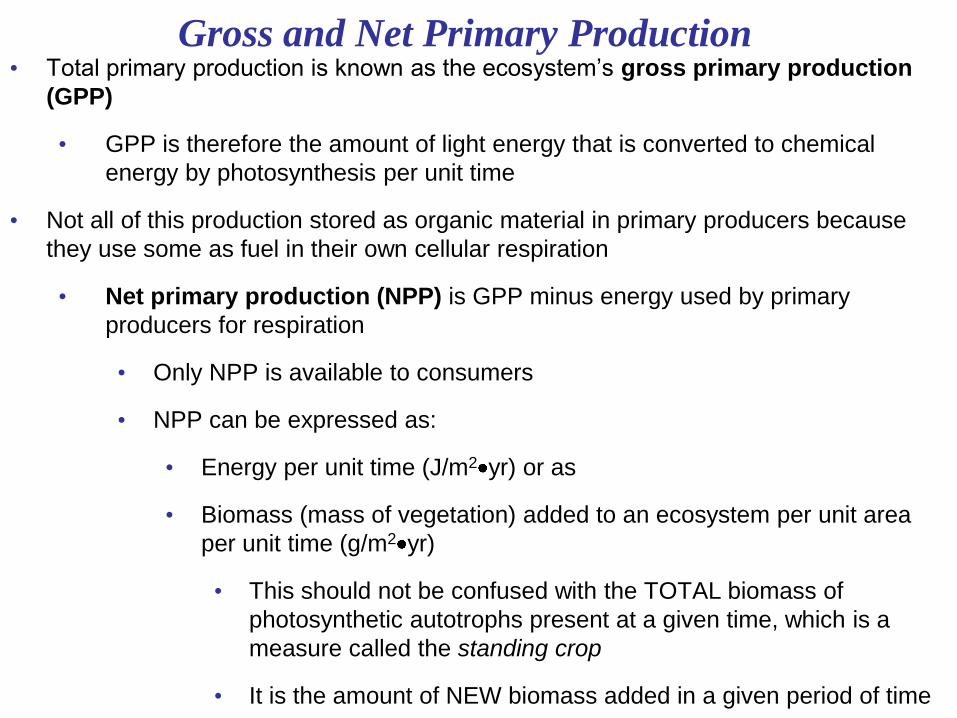
Gross and Net Primary Production • Total primary production is known as the ecosystem’s gross primary production
(GPP)
• GPP is therefore the amount of light energy that is converted to chemical
energy by photosynthesis per unit time
• Not all of this production stored as organic material in primary producers because
they use some as fuel in their own cellular respiration
• Net primary production (NPP) is GPP minus energy used by primary
producers for respiration
• Only NPP is available to consumers
• NPP can be expressed as:
• Energy per unit time (J/m2 yr) or as
• Biomass (mass of vegetation) added to an ecosystem per unit area
per unit time (g/m2 yr)
• This should not be confused with the TOTAL biomass of
photosynthetic autotrophs present at a given time, which is a
measure called the standing crop
• It is the amount of NEW biomass added in a given period of time
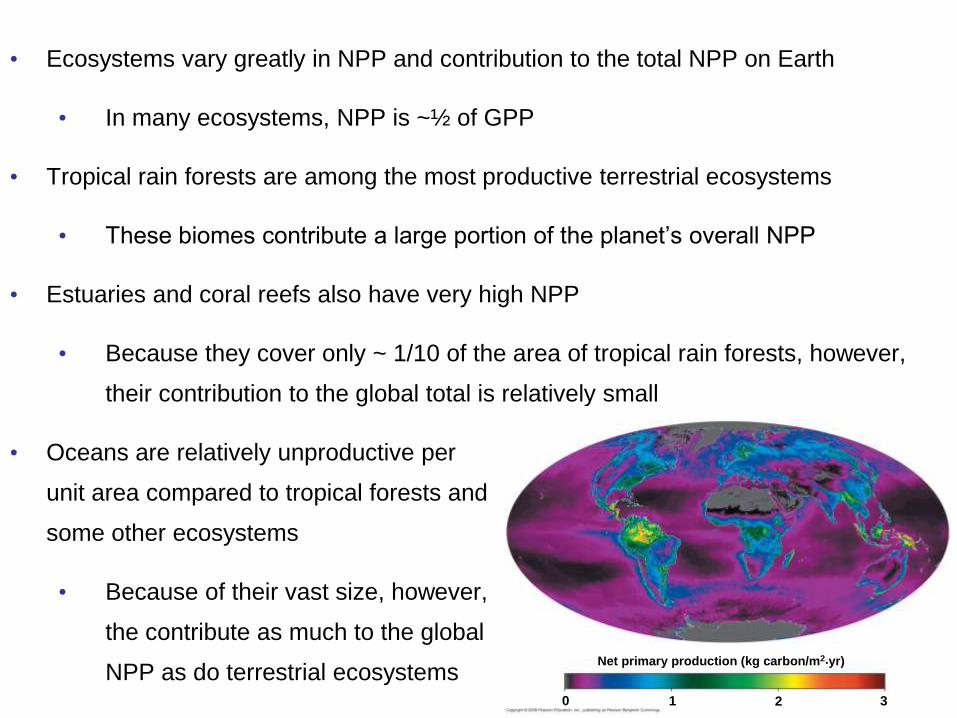
• Ecosystems vary greatly in NPP and contribution to the total NPP on Earth
• In many ecosystems, NPP is ~½ of GPP
• Tropical rain forests are among the most productive terrestrial ecosystems
• These biomes contribute a large portion of the planet’s overall NPP
• Estuaries and coral reefs also have very high NPP
• Because they cover only ~ 1/10 of the area of tropical rain forests, however,
their contribution to the global total is relatively small
• Oceans are relatively unproductive per
unit area compared to tropical forests and
some other ecosystems
• Because of their vast size, however,
the contribute as much to the global
NPP as do terrestrial ecosystems
Fig. 55-6
Net primary production (kg carbon/m2·yr)
0 1 2 3
·
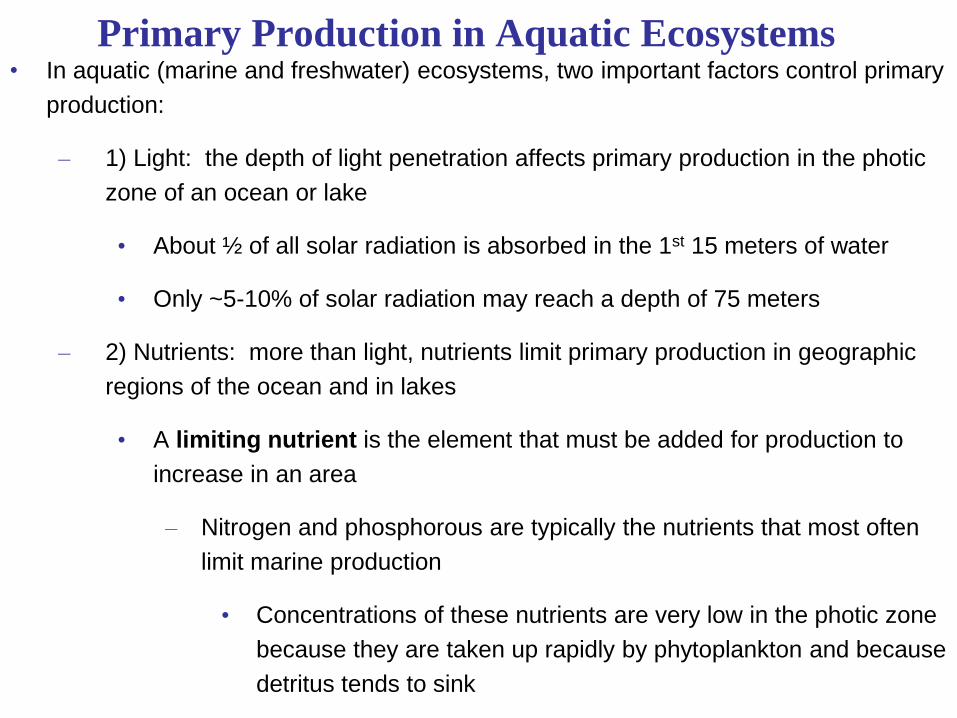
Primary Production in Aquatic Ecosystems • In aquatic (marine and freshwater) ecosystems, two important factors control primary
production:
– 1) Light: the depth of light penetration affects primary production in the photic
zone of an ocean or lake
• About ½ of all solar radiation is absorbed in the 1st 15 meters of water
• Only ~5-10% of solar radiation may reach a depth of 75 meters
– 2) Nutrients: more than light, nutrients limit primary production in geographic
regions of the ocean and in lakes
• A limiting nutrient is the element that must be added for production to
increase in an area
– Nitrogen and phosphorous are typically the nutrients that most often
limit marine production
• Concentrations of these nutrients are very low in the photic zone
because they are taken up rapidly by phytoplankton and because
detritus tends to sink
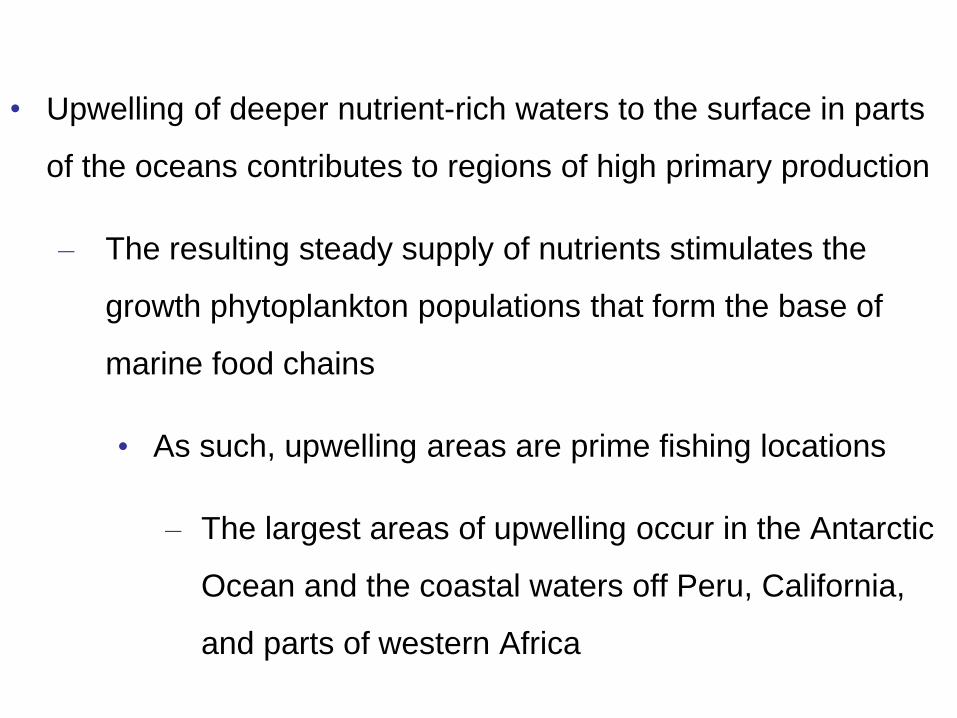
• Upwelling of deeper nutrient-rich waters to the surface in parts
of the oceans contributes to regions of high primary production
– The resulting steady supply of nutrients stimulates the
growth phytoplankton populations that form the base of
marine food chains
• As such, upwelling areas are prime fishing locations
– The largest areas of upwelling occur in the Antarctic
Ocean and the coastal waters off Peru, California,
and parts of western Africa
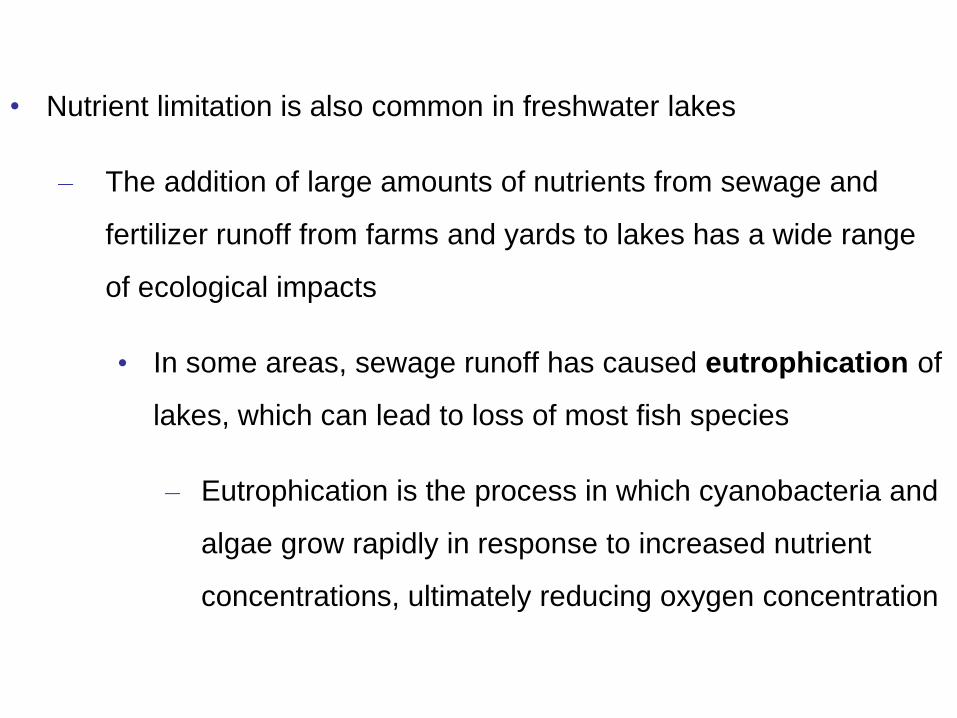
• Nutrient limitation is also common in freshwater lakes
– The addition of large amounts of nutrients from sewage and
fertilizer runoff from farms and yards to lakes has a wide range
of ecological impacts
• In some areas, sewage runoff has caused eutrophication of
lakes, which can lead to loss of most fish species
– Eutrophication is the process in which cyanobacteria and
algae grow rapidly in response to increased nutrient
concentrations, ultimately reducing oxygen concentration
Ne
t p
rim
ary
pro
du
cti
on
(g
/m2·y
r)
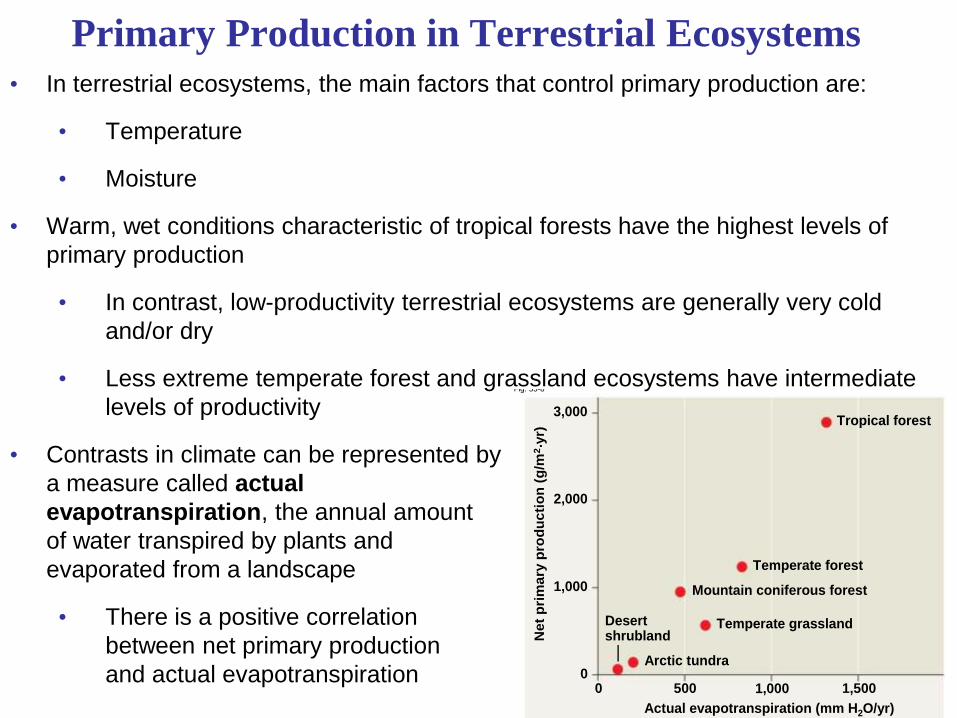
Fig. 55-8
Tropical forest
Actual evapotranspiration (mm H2O/yr)
Temperate forest
Mountain coniferous forest
Temperate grassland
Arctic tundra
Desertshrubland
1,5001,00050000
1,000
2,000
3,000
·
Primary Production in Terrestrial Ecosystems
• In terrestrial ecosystems, the main factors that control primary production are:
• Temperature
• Moisture
• Warm, wet conditions characteristic of tropical forests have the highest levels of
primary production
• In contrast, low-productivity terrestrial ecosystems are generally very cold
and/or dry
• Less extreme temperate forest and grassland ecosystems have intermediate
levels of productivity
• Contrasts in climate can be represented by
a measure called actual
evapotranspiration, the annual amount
of water transpired by plants and
evaporated from a landscape
• There is a positive correlation
between net primary production
and actual evapotranspiration
• Mineral nutrients can also limit primary production in terrestrial
ecosystems
– Nitrogen and phosphorus are the most common nutrients
that limit terrestrial production
• Adding more of the limiting nutrient will increase
production until some other nutrient becomes limiting
Concept Check 55.2
• 1) Why is only a small portion of the solar energy that strikes Earth’s
atmosphere stored by primary producers?
• 2) How can ecologists experimentally determine the factor that limits
primary production in an ecosystem?
• 3) As part of a science project, a student is trying to estimate total
primary production of plants in a prairie ecosystem for a year. Once
each quarter, the student cuts a plot of grass with a lawnmower and
then collects and weighs the cuttings to estimate plant production.
What components of plant primary production is the student missing
with this approach?
Concept 55.3: Energy transfer between trophic
levels is typically only 10% efficient
• Secondary production is the amount of chemical energy in
consumers’ food that is converted to their own new biomass
during a given period of time
• Much of primary production, however, is not useful to
consumers
• Ex) Herbivores eat only a fraction of plant material
produced, and in addition, they cannot digest all the
plant material they do eat
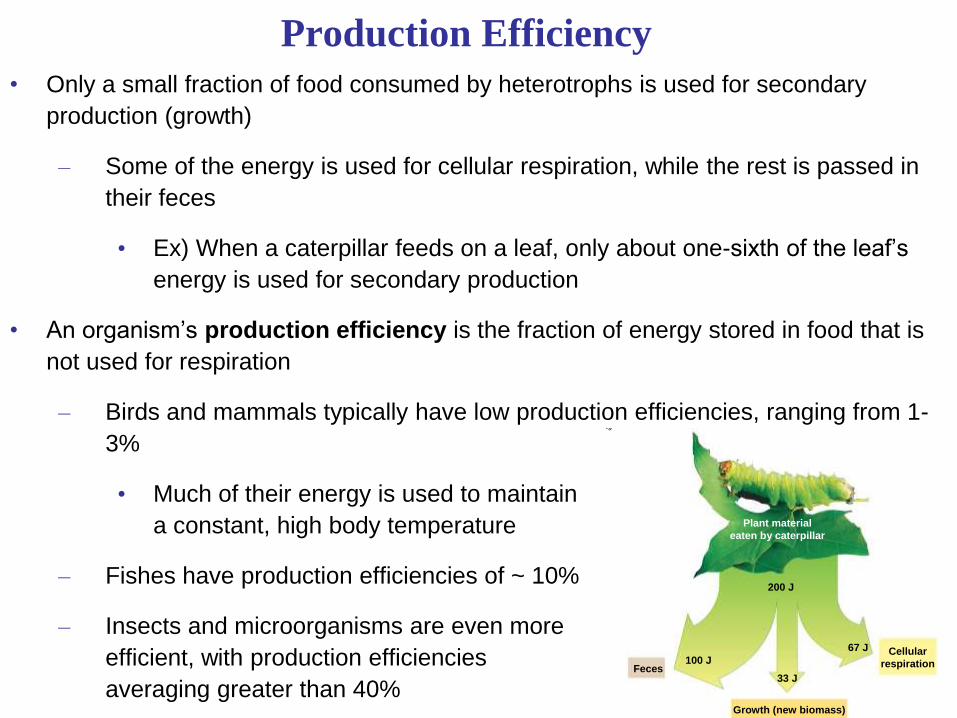
Production Efficiency
• Only a small fraction of food consumed by heterotrophs is used for secondary
production (growth)
– Some of the energy is used for cellular respiration, while the rest is passed in
their feces
• Ex) When a caterpillar feeds on a leaf, only about one-sixth of the leaf’s
energy is used for secondary production
• An organism’s production efficiency is the fraction of energy stored in food that is
not used for respiration
– Birds and mammals typically have low production efficiencies, ranging from 1-
3%
• Much of their energy is used to maintain
a constant, high body temperature
– Fishes have production efficiencies of ~ 10%
– Insects and microorganisms are even more
efficient, with production efficiencies
averaging greater than 40%
Fig. 55-9
Cellular
respiration100 J
Growth (new biomass)
Feces
200 J
33 J
67 J
Plant material
eaten by caterpillar
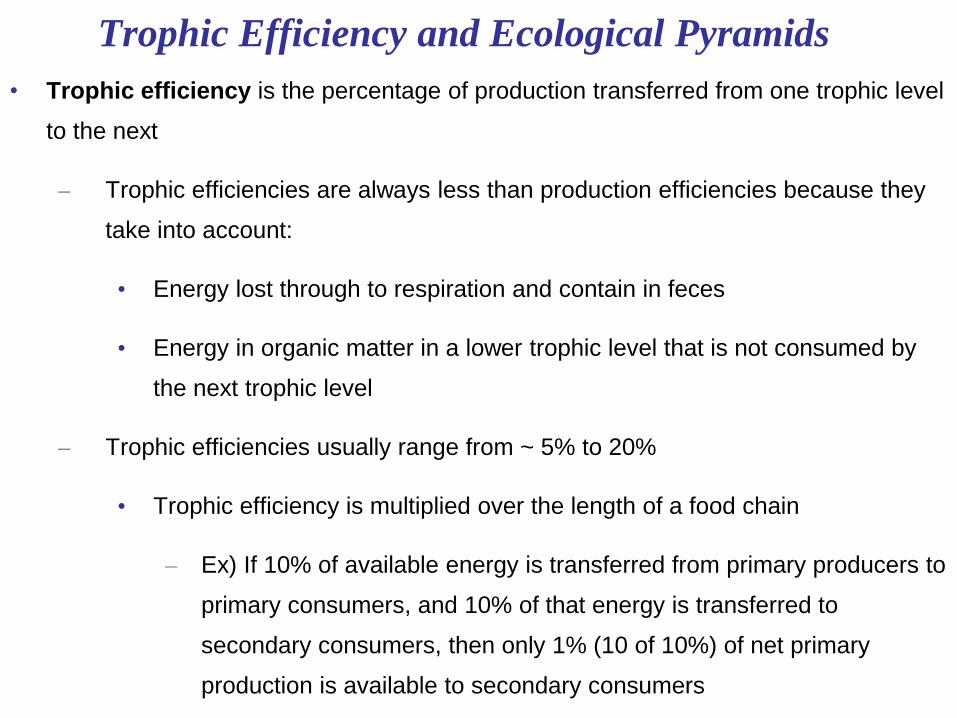
Trophic Efficiency and Ecological Pyramids
• Trophic efficiency is the percentage of production transferred from one trophic level
to the next
– Trophic efficiencies are always less than production efficiencies because they
take into account:
• Energy lost through to respiration and contain in feces
• Energy in organic matter in a lower trophic level that is not consumed by
the next trophic level
– Trophic efficiencies usually range from ~ 5% to 20%
• Trophic efficiency is multiplied over the length of a food chain
– Ex) If 10% of available energy is transferred from primary producers to
primary consumers, and 10% of that energy is transferred to
secondary consumers, then only 1% (10 of 10%) of net primary
production is available to secondary consumers
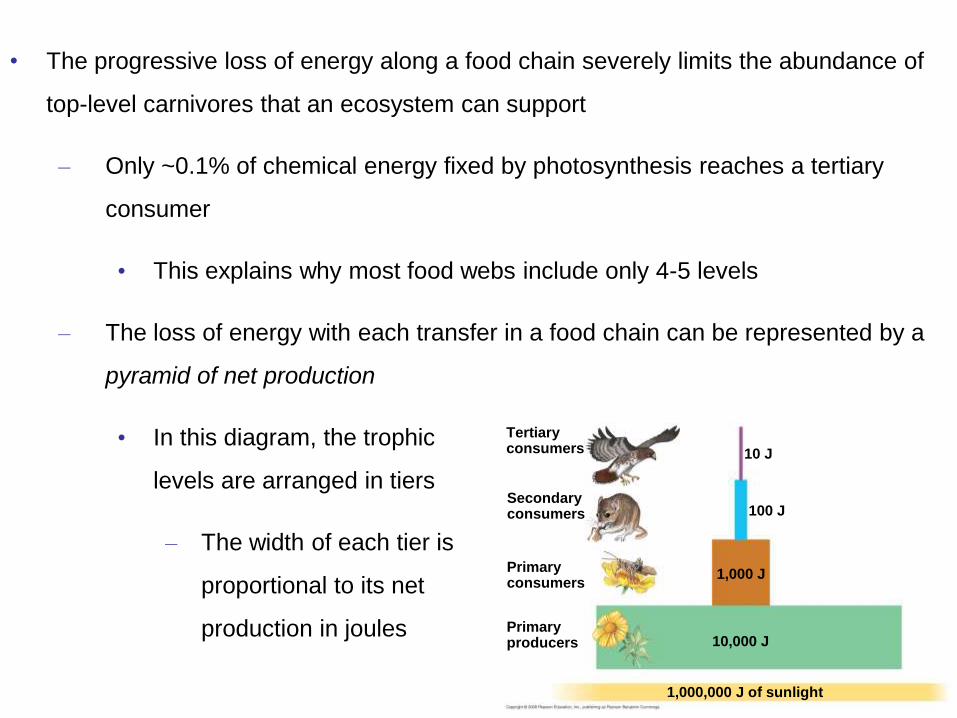
Fig. 55-10
Primaryproducers
100 J
1,000,000 J of sunlight
10 J
1,000 J
10,000 J
Primaryconsumers
Secondaryconsumers
Tertiaryconsumers
• The progressive loss of energy along a food chain severely limits the abundance of
top-level carnivores that an ecosystem can support
– Only ~0.1% of chemical energy fixed by photosynthesis reaches a tertiary
consumer
• This explains why most food webs include only 4-5 levels
– The loss of energy with each transfer in a food chain can be represented by a
pyramid of net production
• In this diagram, the trophic
levels are arranged in tiers
– The width of each tier is
proportional to its net
production in joules
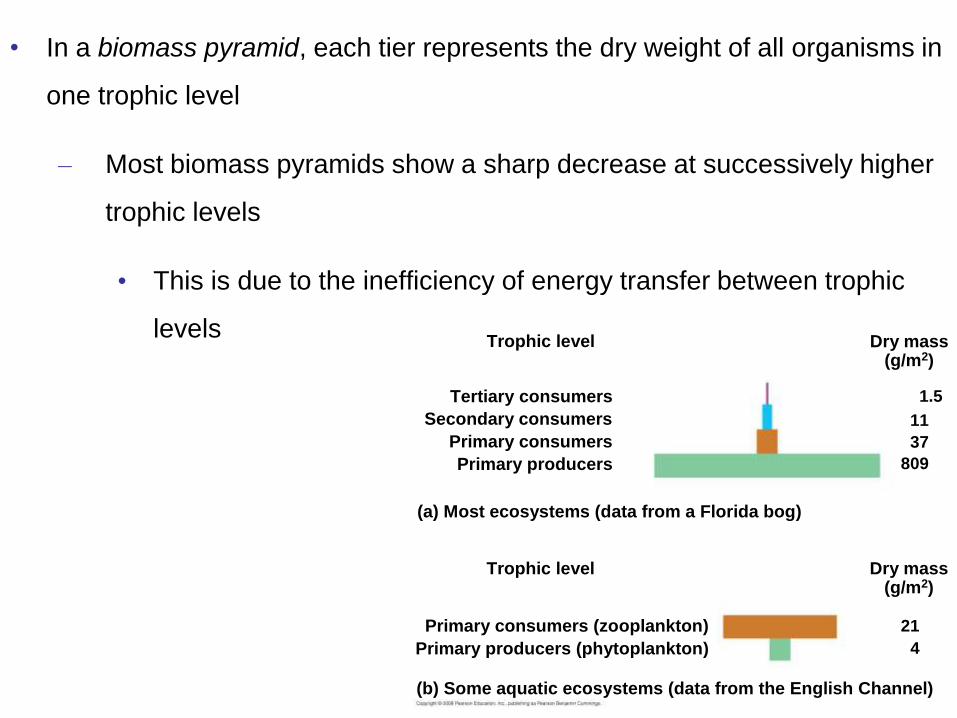
• In a biomass pyramid, each tier represents the dry weight of all organisms in
one trophic level
– Most biomass pyramids show a sharp decrease at successively higher
trophic levels
• This is due to the inefficiency of energy transfer between trophic
levels Fig. 55-11
(a) Most ecosystems (data from a Florida bog)
Primary producers (phytoplankton)
(b) Some aquatic ecosystems (data from the English Channel)
Trophic level
Tertiary consumers
Secondary consumers
Primary consumers
Primary producers
Trophic level
Primary consumers (zooplankton)
Dry mass(g/m2)
Dry mass(g/m2)
1.5
11
37
809
21
4
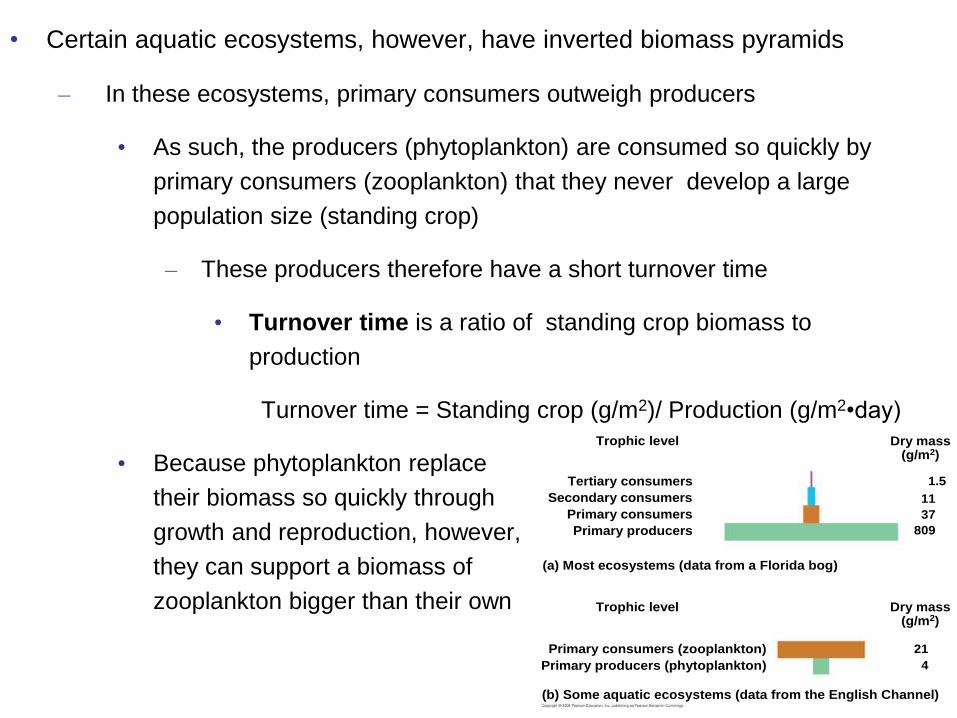
Fig. 55-11
(a) Most ecosystems (data from a Florida bog)
Primary producers (phytoplankton)
(b) Some aquatic ecosystems (data from the English Channel)
Trophic level
Tertiary consumers
Secondary consumers
Primary consumers
Primary producers
Trophic level
Primary consumers (zooplankton)
Dry mass(g/m2)
Dry mass(g/m2)
1.5
11
37
809
21
4
• Certain aquatic ecosystems, however, have inverted biomass pyramids
– In these ecosystems, primary consumers outweigh producers
• As such, the producers (phytoplankton) are consumed so quickly by
primary consumers (zooplankton) that they never develop a large
population size (standing crop)
– These producers therefore have a short turnover time
• Turnover time is a ratio of standing crop biomass to
production
Turnover time = Standing crop (g/m2)/ Production (g/m2•day)
• Because phytoplankton replace
their biomass so quickly through
growth and reproduction, however,
they can support a biomass of
zooplankton bigger than their own
• Dynamics of energy flow in ecosystems have important
implications for the human population
– Eating meat is a relatively inefficient way of tapping
photosynthetic production
• People obtain far more calories by eating grains directly
as a primary consumer than by eating the same amount
of grain fed to an animal
– Worldwide agriculture could therefore feed many more
people if humans ate only plant material
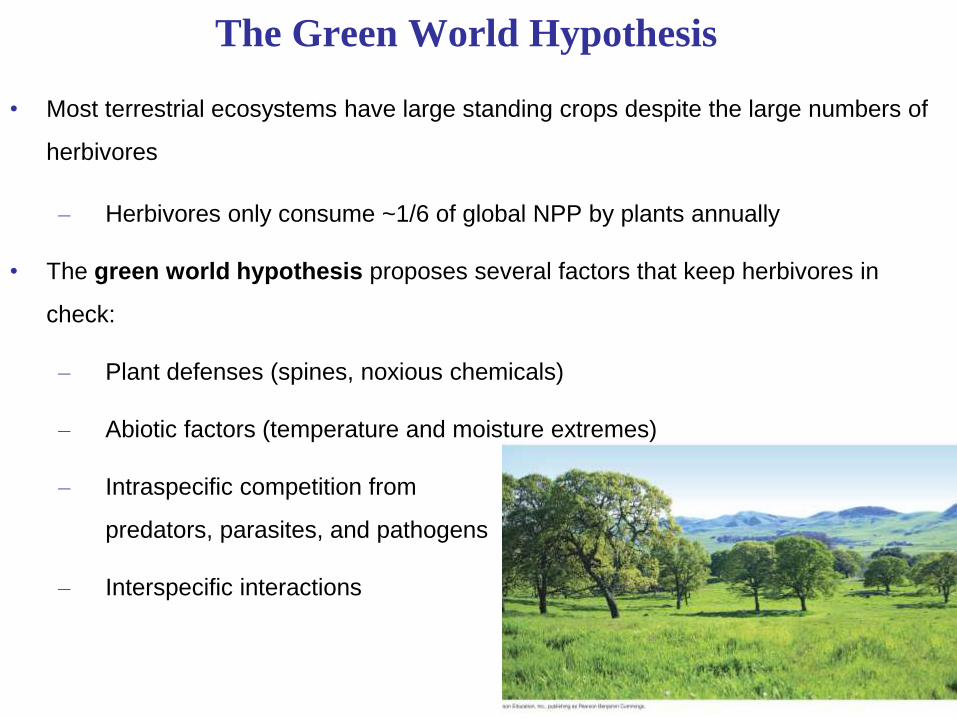
Fig. 55-12
The Green World Hypothesis
• Most terrestrial ecosystems have large standing crops despite the large numbers of
herbivores
– Herbivores only consume ~1/6 of global NPP by plants annually
• The green world hypothesis proposes several factors that keep herbivores in
check:
– Plant defenses (spines, noxious chemicals)
– Abiotic factors (temperature and moisture extremes)
– Intraspecific competition from
predators, parasites, and pathogens
– Interspecific interactions

Concept Check 55.3
• 1) If an insect that eats plant seeds containing 100 J of energy uses 30 J of
that energy for respiration and excretes 50 J in its feces, what is the insect’s
net secondary production? What is its production efficiency?
• 2) Tobacco leaves contain nicotine, a poisonous compound that is
energetically expensive for the plants to make. What advantage might the
plant gain by using some of its resources to produce nicotine?
• 3) As part of a new reality show on television, a group of overweight people
are trying to safely lose in one month as much weight as possible. In
addition to eating less, what could they do to decrease their production
efficiency for the food they eat?
Concept 55.4: Biological and Geochemical
Processes Cycle Nutrients Between Organic and Inorganic Parts of an
Ecosystem
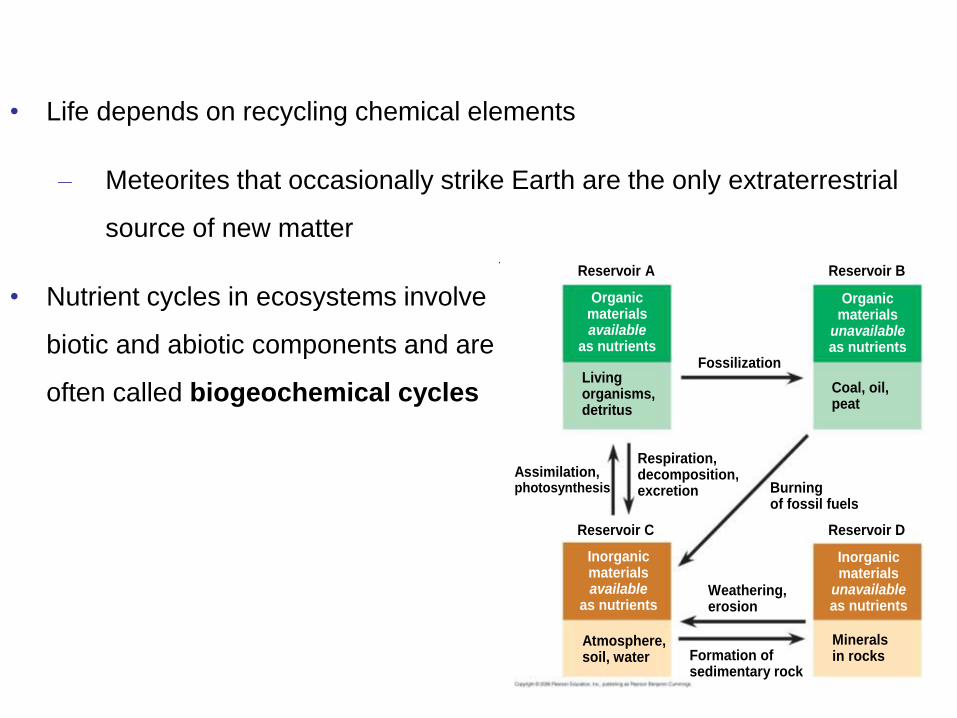
Fig. 55-13
Reservoir A Reservoir B
Organicmaterialsavailable
as nutrientsFossilization
Organicmaterials
unavailableas nutrients
Reservoir DReservoir C
Coal, oil,peat
Livingorganisms,detritus
Burningof fossil fuels
Respiration,decomposition,excretion
Assimilation,photosynthesis
Inorganicmaterialsavailable
as nutrients
Inorganicmaterials
unavailableas nutrients
Atmosphere,soil, water
Mineralsin rocks
Weathering,erosion
Formation ofsedimentary rock
• Life depends on recycling chemical elements
– Meteorites that occasionally strike Earth are the only extraterrestrial
source of new matter
• Nutrient cycles in ecosystems involve
biotic and abiotic components and are
often called biogeochemical cycles
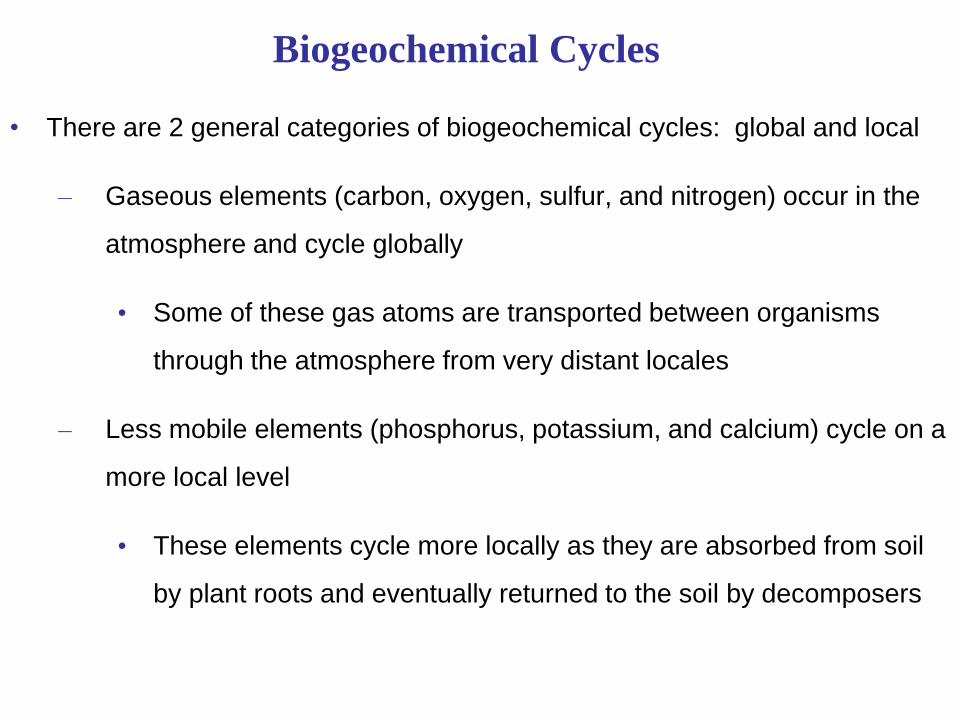
Biogeochemical Cycles
• There are 2 general categories of biogeochemical cycles: global and local
– Gaseous elements (carbon, oxygen, sulfur, and nitrogen) occur in the
atmosphere and cycle globally
• Some of these gas atoms are transported between organisms
through the atmosphere from very distant locales
– Less mobile elements (phosphorus, potassium, and calcium) cycle on a
more local level
• These elements cycle more locally as they are absorbed from soil
by plant roots and eventually returned to the soil by decomposers
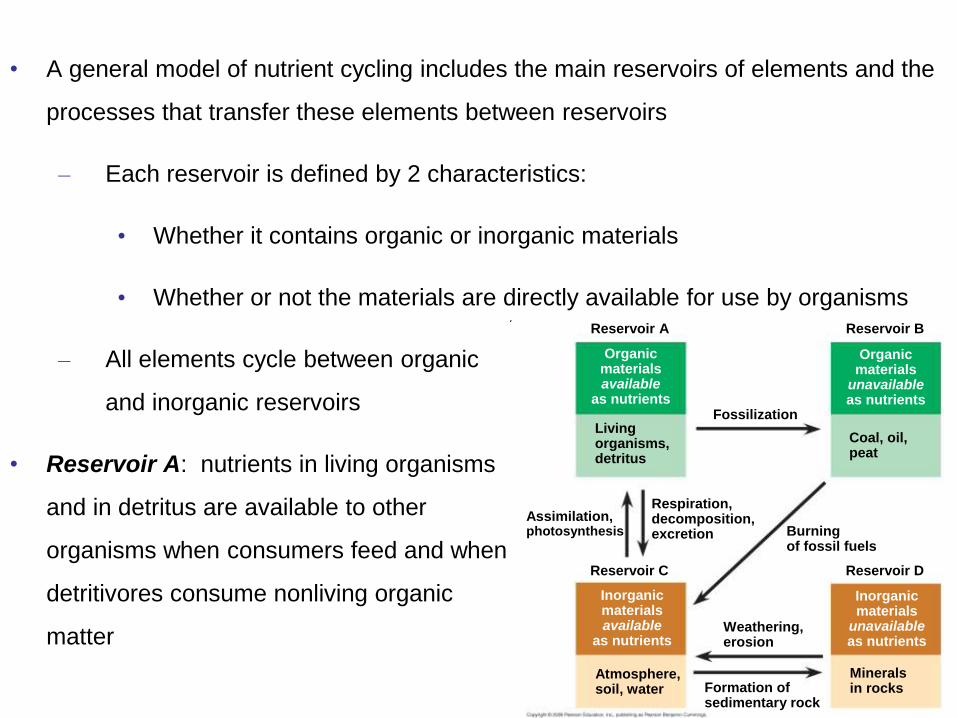
Fig. 55-13
Reservoir A Reservoir B
Organicmaterialsavailable
as nutrientsFossilization
Organicmaterials
unavailableas nutrients
Reservoir DReservoir C
Coal, oil,peat
Livingorganisms,detritus
Burningof fossil fuels
Respiration,decomposition,excretion
Assimilation,photosynthesis
Inorganicmaterialsavailable
as nutrients
Inorganicmaterials
unavailableas nutrients
Atmosphere,soil, water
Mineralsin rocks
Weathering,erosion
Formation ofsedimentary rock
• A general model of nutrient cycling includes the main reservoirs of elements and the
processes that transfer these elements between reservoirs
– Each reservoir is defined by 2 characteristics:
• Whether it contains organic or inorganic materials
• Whether or not the materials are directly available for use by organisms
– All elements cycle between organic
and inorganic reservoirs
• Reservoir A: nutrients in living organisms
and in detritus are available to other
organisms when consumers feed and when
detritivores consume nonliving organic
matter
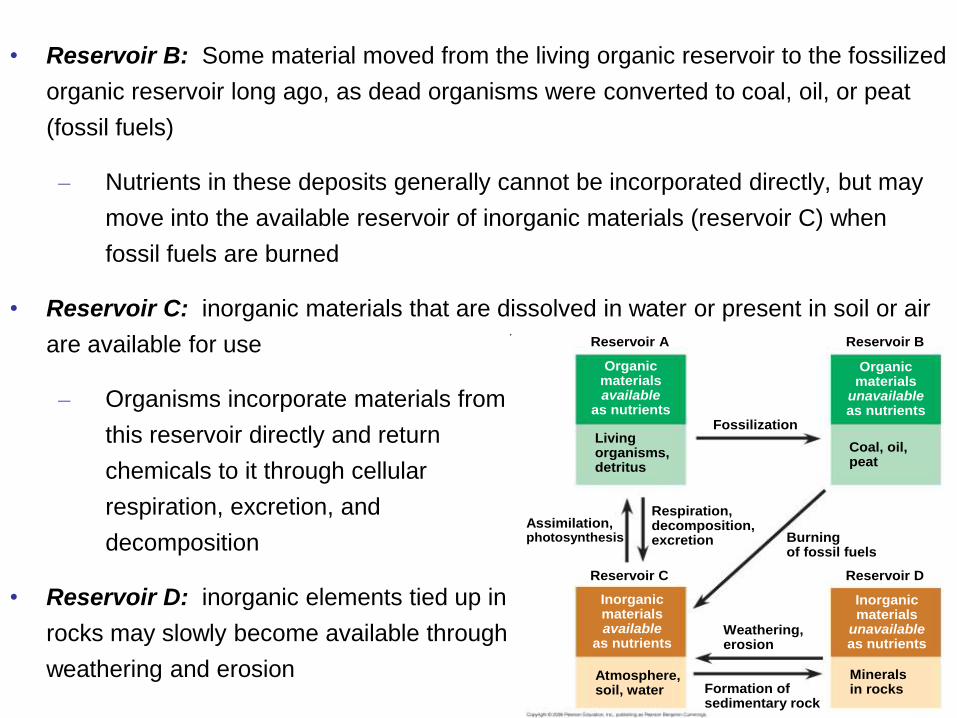
Fig. 55-13
Reservoir A Reservoir B
Organicmaterialsavailable
as nutrientsFossilization
Organicmaterials
unavailableas nutrients
Reservoir DReservoir C
Coal, oil,peat
Livingorganisms,detritus
Burningof fossil fuels
Respiration,decomposition,excretion
Assimilation,photosynthesis
Inorganicmaterialsavailable
as nutrients
Inorganicmaterials
unavailableas nutrients
Atmosphere,soil, water
Mineralsin rocks
Weathering,erosion
Formation ofsedimentary rock
• Reservoir B: Some material moved from the living organic reservoir to the fossilized
organic reservoir long ago, as dead organisms were converted to coal, oil, or peat
(fossil fuels)
– Nutrients in these deposits generally cannot be incorporated directly, but may
move into the available reservoir of inorganic materials (reservoir C) when
fossil fuels are burned
• Reservoir C: inorganic materials that are dissolved in water or present in soil or air
are available for use
– Organisms incorporate materials from
this reservoir directly and return
chemicals to it through cellular
respiration, excretion, and
decomposition
• Reservoir D: inorganic elements tied up in
rocks may slowly become available through
weathering and erosion
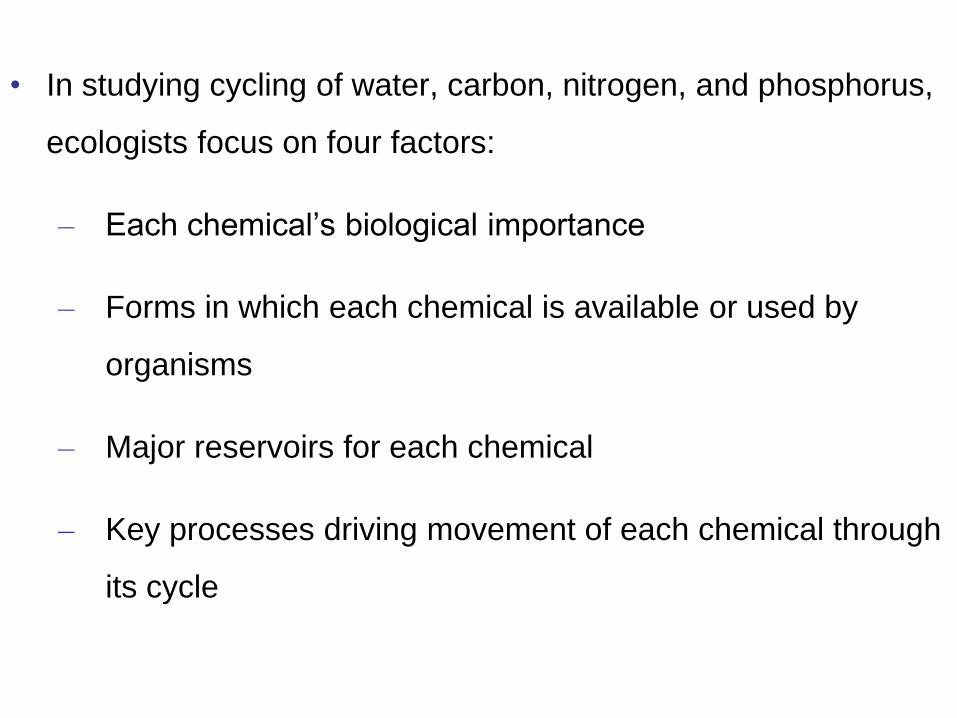
• In studying cycling of water, carbon, nitrogen, and phosphorus,
ecologists focus on four factors:
– Each chemical’s biological importance
– Forms in which each chemical is available or used by
organisms
– Major reservoirs for each chemical
– Key processes driving movement of each chemical through
its cycle
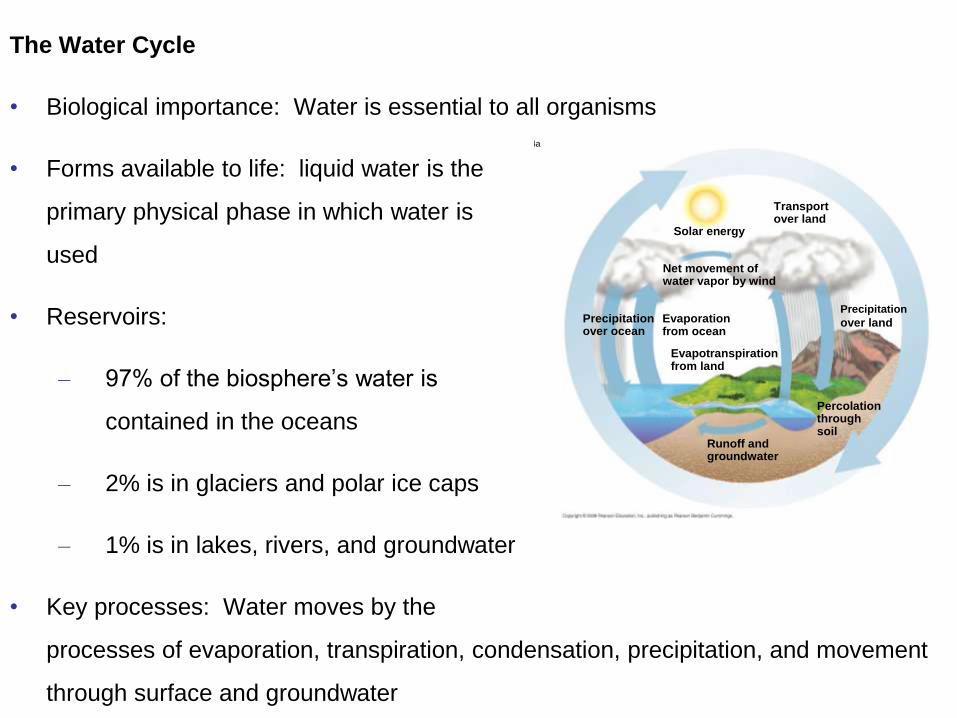
The Water Cycle
• Biological importance: Water is essential to all organisms
• Forms available to life: liquid water is the
primary physical phase in which water is
used
• Reservoirs:
– 97% of the biosphere’s water is
contained in the oceans
– 2% is in glaciers and polar ice caps
– 1% is in lakes, rivers, and groundwater
• Key processes: Water moves by the
processes of evaporation, transpiration, condensation, precipitation, and movement
through surface and groundwater
Fig. 55-14a
Precipitation
over land
Transportover land
Solar energy
Net movement ofwater vapor by wind
Evaporationfrom ocean
Percolationthroughsoil
Evapotranspirationfrom land
Runoff andgroundwater
Precipitationover ocean
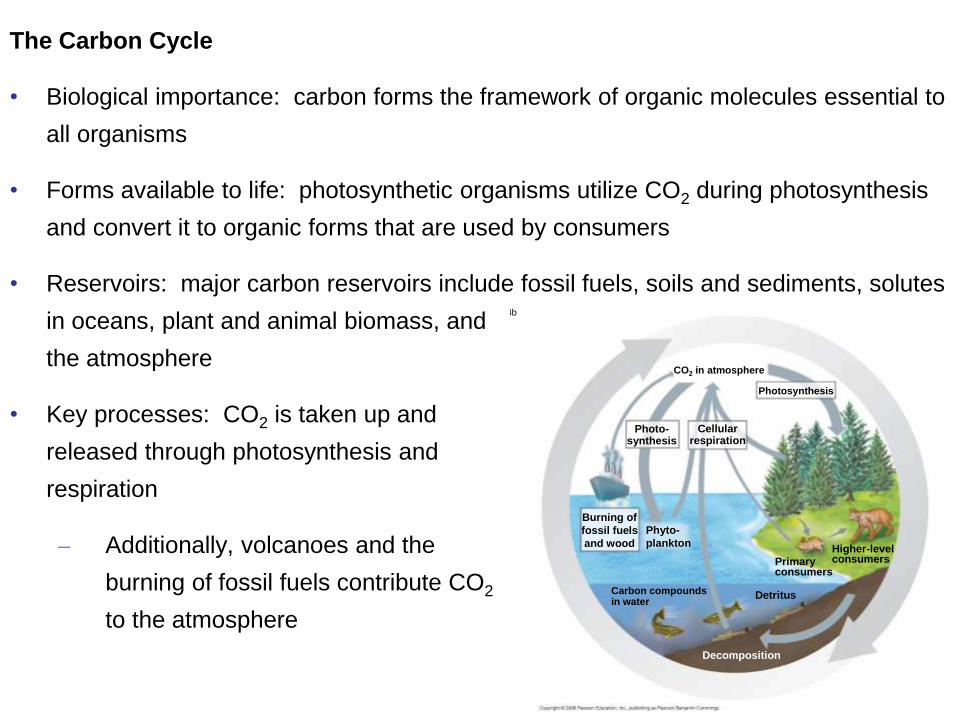
Fig. 55-14b
Higher-levelconsumersPrimary
consumers
Detritus
Burning of
fossil fuels
and wood
Phyto-
plankton
Cellularrespiration
Photo-synthesis
Photosynthesis
Carbon compoundsin water
Decomposition
CO2 in atmosphere
The Carbon Cycle
• Biological importance: carbon forms the framework of organic molecules essential to
all organisms
• Forms available to life: photosynthetic organisms utilize CO2 during photosynthesis
and convert it to organic forms that are used by consumers
• Reservoirs: major carbon reservoirs include fossil fuels, soils and sediments, solutes
in oceans, plant and animal biomass, and
the atmosphere
• Key processes: CO2 is taken up and
released through photosynthesis and
respiration
– Additionally, volcanoes and the
burning of fossil fuels contribute CO2
to the atmosphere
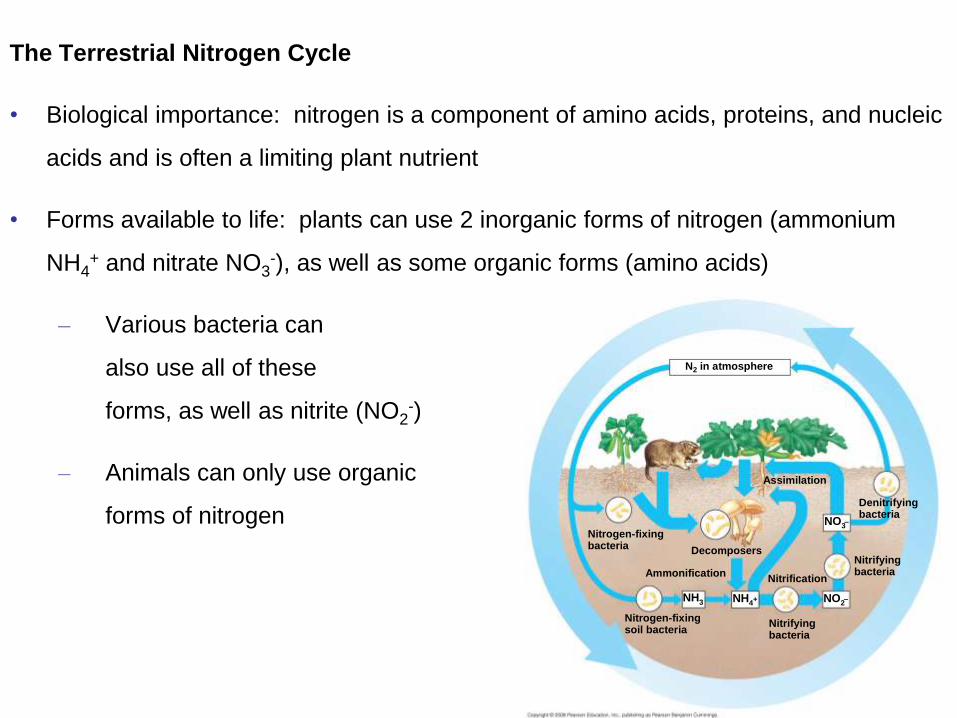
Fig. 55-14c
Decomposers
N2 in atmosphere
Nitrification
Nitrifyingbacteria
Nitrifyingbacteria
Denitrifyingbacteria
Assimilation
NH3 NH4 NO2
NO3
+ –
–
Ammonification
Nitrogen-fixingsoil bacteria
Nitrogen-fixingbacteria
The Terrestrial Nitrogen Cycle
• Biological importance: nitrogen is a component of amino acids, proteins, and nucleic
acids and is often a limiting plant nutrient
• Forms available to life: plants can use 2 inorganic forms of nitrogen (ammonium
NH4+ and nitrate NO3
-), as well as some organic forms (amino acids)
– Various bacteria can
also use all of these
forms, as well as nitrite (NO2-)
– Animals can only use organic
forms of nitrogen
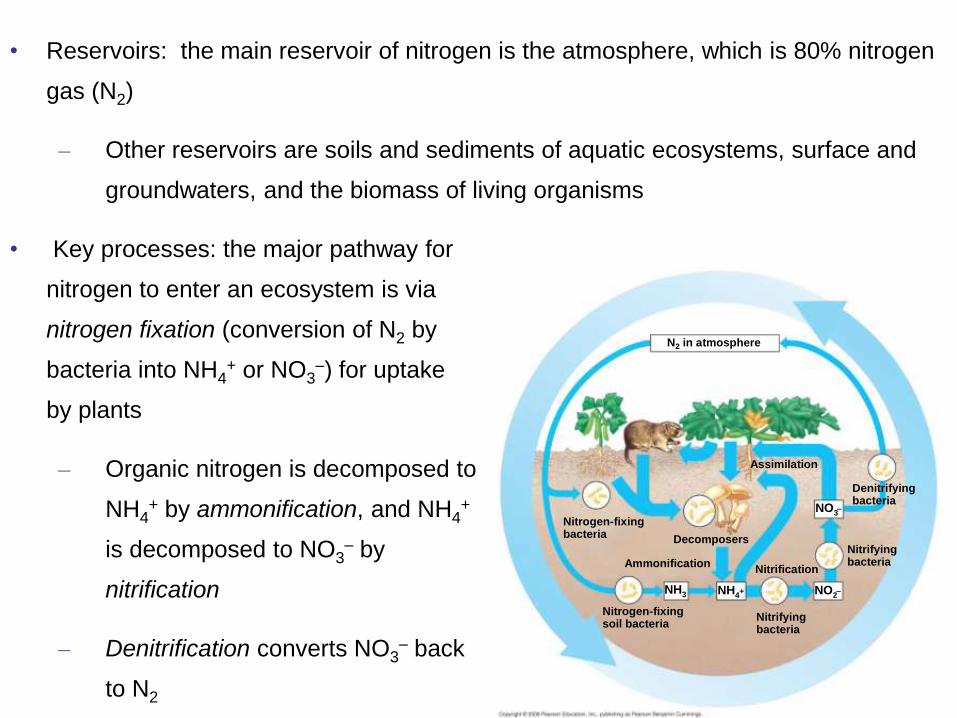
Fig. 55-14c
Decomposers
N2 in atmosphere
Nitrification
Nitrifyingbacteria
Nitrifyingbacteria
Denitrifyingbacteria
Assimilation
NH3 NH4 NO2
NO3
+ –
–
Ammonification
Nitrogen-fixingsoil bacteria
Nitrogen-fixingbacteria
• Reservoirs: the main reservoir of nitrogen is the atmosphere, which is 80% nitrogen
gas (N2)
– Other reservoirs are soils and sediments of aquatic ecosystems, surface and
groundwaters, and the biomass of living organisms
• Key processes: the major pathway for
nitrogen to enter an ecosystem is via
nitrogen fixation (conversion of N2 by
bacteria into NH4+ or NO3
–) for uptake
by plants
– Organic nitrogen is decomposed to
NH4+ by ammonification, and NH4
+
is decomposed to NO3– by
nitrification
– Denitrification converts NO3– back
to N2
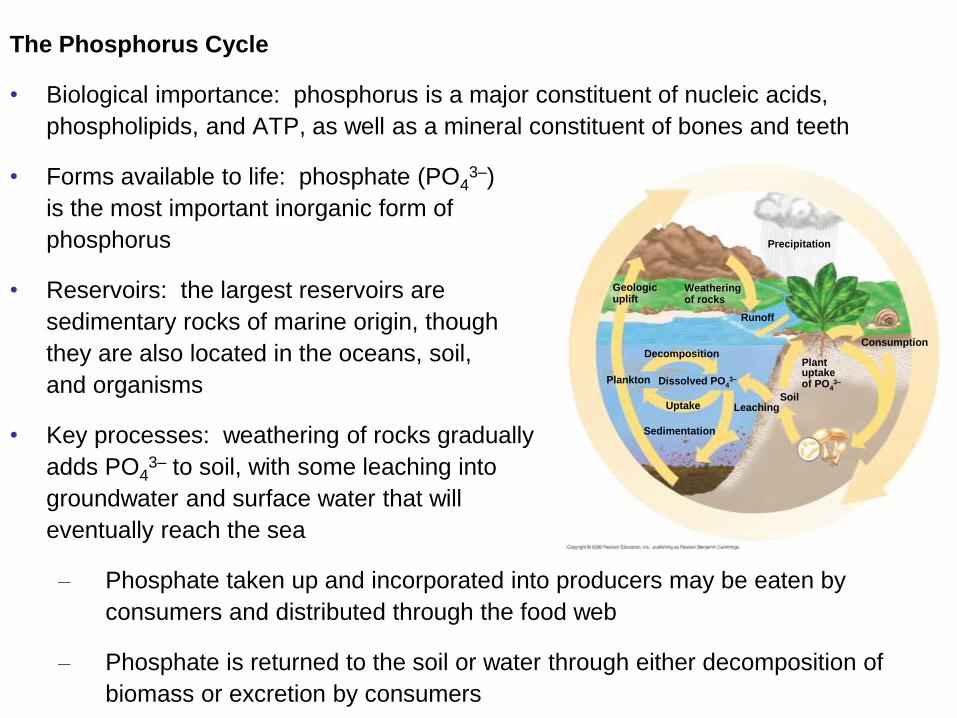
Fig. 55-14d
Leaching
Consumption
Precipitation
Plantuptakeof PO4
3–
Soil
Sedimentation
Uptake
Plankton
Decomposition
Dissolved PO43–
Runoff
Geologicuplift
Weatheringof rocks
The Phosphorus Cycle
• Biological importance: phosphorus is a major constituent of nucleic acids,
phospholipids, and ATP, as well as a mineral constituent of bones and teeth
• Forms available to life: phosphate (PO43–)
is the most important inorganic form of
phosphorus
• Reservoirs: the largest reservoirs are
sedimentary rocks of marine origin, though
they are also located in the oceans, soil,
and organisms
• Key processes: weathering of rocks gradually
adds PO43– to soil, with some leaching into
groundwater and surface water that will
eventually reach the sea
– Phosphate taken up and incorporated into producers may be eaten by
consumers and distributed through the food web
– Phosphate is returned to the soil or water through either decomposition of
biomass or excretion by consumers
Decomposition and Nutrient Cycling Rates
• Decomposers (detritivores) play an essential role in recycling carbon, nitrogen, and
phosphorus
– Rates at which nutrients cycle in different ecosystems vary greatly, mostly as a
result of differing rates of decomposition
– The rate of decomposition is controlled by temperature, moisture, and nutrient
availability
• Decomposers usually grow faster and decompose material more quickly in
warmer ecosystems
• Decomposition is slower when conditions are either too dry for
decomposers to thrive or too wet to supply them with enough oxygen
– Rapid decomposition results in relatively low levels of nutrients in the soil
because relatively little organic material accumulates as leaf litter on the
ecosystem floor
• Ex) About 75% of nutrients in tropical rain forests is present in woody tree
trunks, while only ~10% is contained in the soil
Concept 55.4
• 1) For each of the 4 biogeochemical cycles detailed in Figure
55.14 (pp. 1232-1233), draw a simple diagram that shows one
possible path for an atom or molecule of that chemical from
abiotic to biotic reservoirs and back.
• 2) Why does deforestation of a watershed increase the
concentration of nitrates in streams draining the watershed?
• 3) Why is nutrient availability in a tropical rain forest particularly
vulnerable to logging?
Concept 55.5: Human activities now dominate most
chemical cycles on Earth
• As the human population has grown, our activities have disrupted the trophic
structure, energy flow, and chemical cycling of many ecosystems
– Human activity removes nutrients from one part of the biosphere and adds
them to another
• Ex) A person consumes broccoli that was grown in the soils of California
– Human activity has also caused addition of novel, sometimes toxic, materials to
ecosystems
• We will look at some specific examples of how humans are impacting the
biosphere’s chemical dynamics
– The impact of agriculture on nitrogen cycling
– Contamination of aquatic ecosystems
– Acid precipitation
– Addition of toxins into the environment, resulting in biological magnification
– Global warming caused by rising atmospheric CO2 levels
– Depletion of the ozone layer
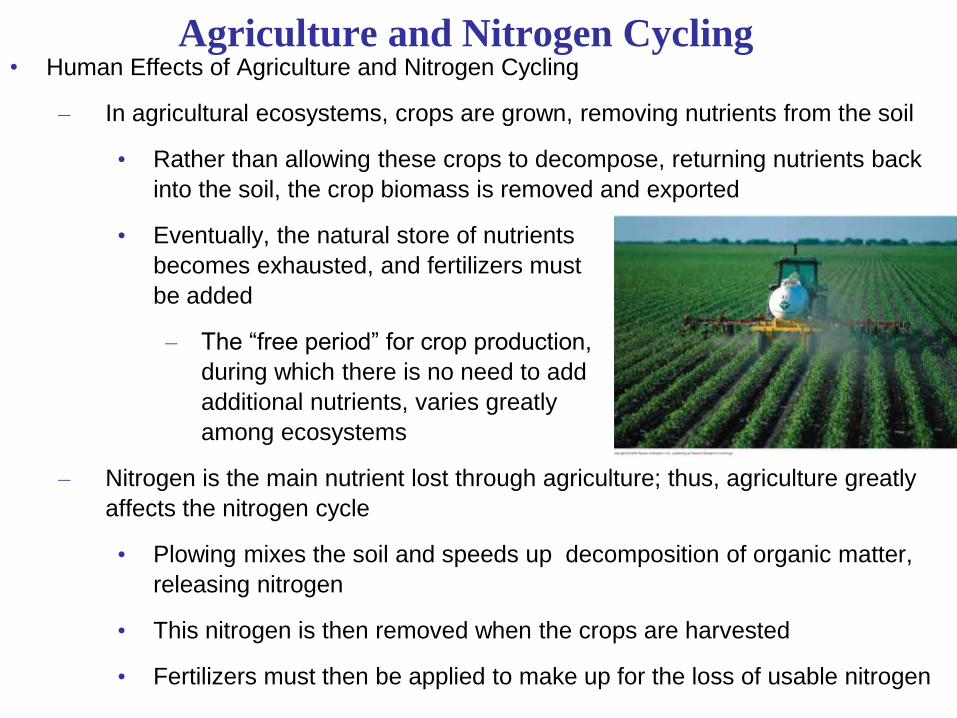
Agriculture and Nitrogen Cycling • Human Effects of Agriculture and Nitrogen Cycling
– In agricultural ecosystems, crops are grown, removing nutrients from the soil
• Rather than allowing these crops to decompose, returning nutrients back
into the soil, the crop biomass is removed and exported
• Eventually, the natural store of nutrients
becomes exhausted, and fertilizers must
be added
– The “free period” for crop production,
during which there is no need to add
additional nutrients, varies greatly
among ecosystems
– Nitrogen is the main nutrient lost through agriculture; thus, agriculture greatly
affects the nitrogen cycle
• Plowing mixes the soil and speeds up decomposition of organic matter,
releasing nitrogen
• This nitrogen is then removed when the crops are harvested
• Fertilizers must then be applied to make up for the loss of usable nitrogen
Fig. 55-17
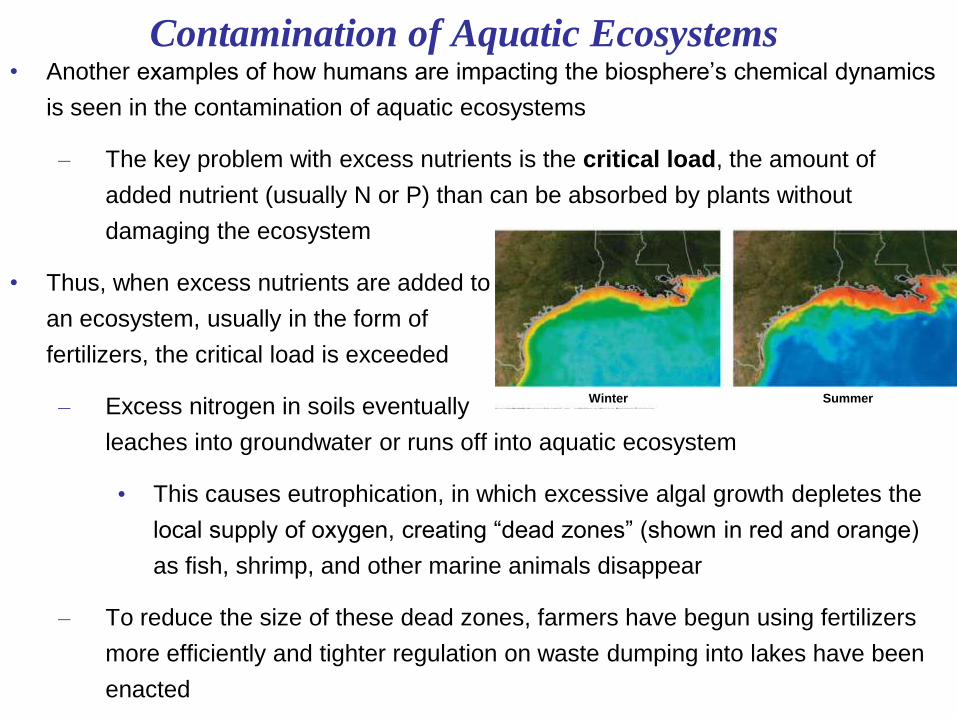
Contamination of Aquatic Ecosystems • Another examples of how humans are impacting the biosphere’s chemical dynamics
is seen in the contamination of aquatic ecosystems
– The key problem with excess nutrients is the critical load, the amount of
added nutrient (usually N or P) than can be absorbed by plants without
damaging the ecosystem
• Thus, when excess nutrients are added to
an ecosystem, usually in the form of
fertilizers, the critical load is exceeded
– Excess nitrogen in soils eventually
leaches into groundwater or runs off into aquatic ecosystem
• This causes eutrophication, in which excessive algal growth depletes the
local supply of oxygen, creating “dead zones” (shown in red and orange)
as fish, shrimp, and other marine animals disappear
– To reduce the size of these dead zones, farmers have begun using fertilizers
more efficiently and tighter regulation on waste dumping into lakes have been
enacted
Fig. 55-18
Winter Summer
Acid Precipitation
• Another ecological consequence of human activity is acid precipitation
– Burning of wood and fossil fuels (coal and oil) releases oxides of sulfur
and nitrogen that react with water in the atmosphere
• This results in the formation of sulfuric and nitric acids, which
eventually fall to Earth’s surface as acid precipitation
– Acid precipitation is any form of precipitation (rain, snow, sleet,
or fog) that has a pH less than 5.2
• Acid precipitation lowers the pH of steams and lakes, affecting soil
chemistry and nutrient availability
– Nutrient deficiencies affect the health of plants and limit their
growth, mainly by leaching nutrients from their leaves
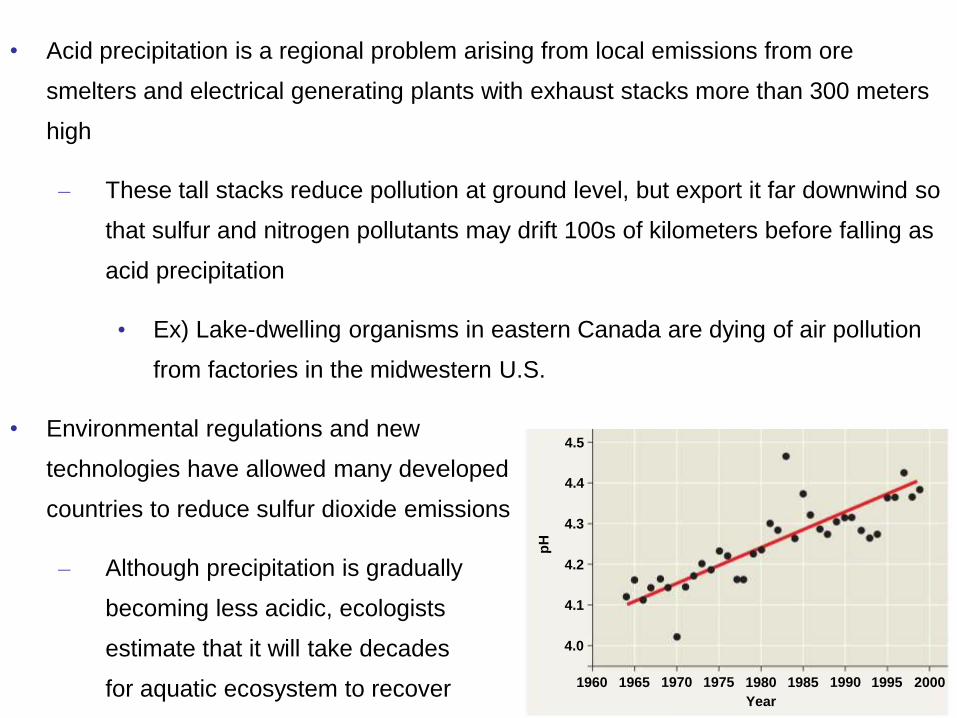
Fig. 55-19
Year
200019951990198519801975197019651960
4.0
4.1
4.2
4.3
4.4
4.5
pH
• Acid precipitation is a regional problem arising from local emissions from ore
smelters and electrical generating plants with exhaust stacks more than 300 meters
high
– These tall stacks reduce pollution at ground level, but export it far downwind so
that sulfur and nitrogen pollutants may drift 100s of kilometers before falling as
acid precipitation
• Ex) Lake-dwelling organisms in eastern Canada are dying of air pollution
from factories in the midwestern U.S.
• Environmental regulations and new
technologies have allowed many developed
countries to reduce sulfur dioxide emissions
– Although precipitation is gradually
becoming less acidic, ecologists
estimate that it will take decades
for aquatic ecosystem to recover
Toxins in the Environment
• Humans have also significantly impacted ecosystems as their activities release many
toxic chemical into the environment
– Organisms take up these poisons from the environment, along with nutrients
and water
• Some of the toxins are metabolized and excreted, but others accumulate in
specific tissues, especially fat
– One reason why these toxins are so harmful is that they become more
concentrated in successive trophic levels of a food web
• This process, called biological magnification, occurs because the
biomass at any given trophic level is produced from a much larger biomass
ingested from the level below
– Thus, top-level carnivores tend to be the organisms most severely
affected by toxic compounds in the environment
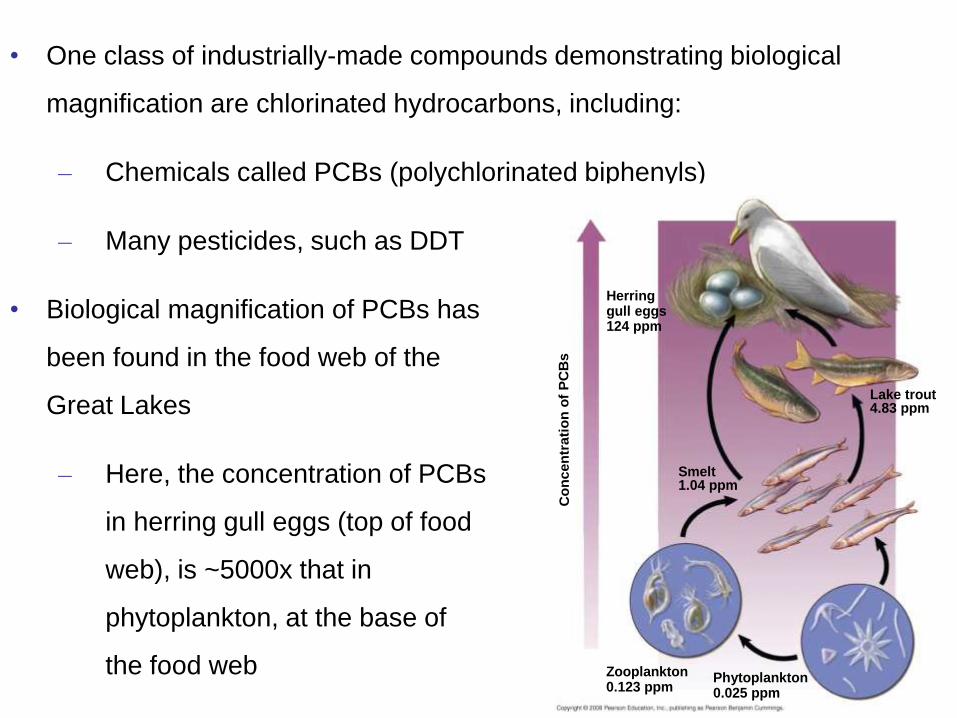
• One class of industrially-made compounds demonstrating biological
magnification are chlorinated hydrocarbons, including:
– Chemicals called PCBs (polychlorinated biphenyls)
– Many pesticides, such as DDT
• Biological magnification of PCBs has
been found in the food web of the
Great Lakes
– Here, the concentration of PCBs
in herring gull eggs (top of food
web), is ~5000x that in
phytoplankton, at the base of
the food web
Fig. 55-20
Lake trout4.83 ppm
Co
nc
en
tra
tio
n o
f P
CB
s
Herringgull eggs124 ppm
Smelt1.04 ppm
Phytoplankton0.025 ppm
Zooplankton0.123 ppm
• Accumulation of DDT caused a decline in the populations of top level avian
carnivores, including pelicans, ospreys, and eagles
– Large amounts of DDT in the tissues of these birds interfered with the
deposition of calcium in their eggshells
• As a result, these eggs could not withstand the weight of the adult
birds during incubation and frequently broke
• In the 1960s Rachel Carson brought attention to the biomagnification of DDT
in birds in her book Silent Spring
– DDT was banned in the U.S. in 1971, resulting in a dramatic recovery
of affected bird populations
Greenhouse Gases and Global Warming
• Another pressing problem caused by human activities is the rising
level of atmospheric carbon dioxide
– Due to the burning of fossil fuels and other human activities, the
concentration of atmospheric CO2 has been steadily increasing
• Scientists estimate that
atmospheric CO2
concentrations have
increased by ~40%
since the mid-19th
century
Fig. 55-21
CO2
CO
2co
ncen
trati
on
(p
pm
) Temperature
1960300
Av
era
ge g
lob
al
tem
pera
ture
(ºC
)
1965 1970 1975 1980
Year
1985 1990 1995 2000 2005
13.6
13.7
13.8
13.9
14.0
14.1
14.2
14.3
14.4
14.5
14.6
14.7
14.8
14.9
310
320
330
340
350
360
370
380
390
Effects of Elevated CO2 Levels on Plant Productivity
• One predictable consequence of increasing atmospheric CO2
concentrations is increased productivity by plants
– Because C3 plants are more limited by CO2 availability than
C4 plants, increasing global CO2 concentrations may cause
the spread of C3 species into terrestrial habitats that
currently favor C4 plants
• Corn, the most important grain crop in the U.S. is a C4
plant that may therefore eventually be replaced by C3
crops, such as wheat and soybeans
The Greenhouse Effect and Climate
• Rising concentrations of CO2 are also changing Earth’s heat budget
– CO2 is a greenhouse gas that intercepts, absorbs, and reflects infrared
radiation back toward Earth, a phenomenon called the greenhouse
effect
• Without this process, which helps retain some solar heat, the
average air temperature at Earth’s surface would be –2.4
F
– Increased levels of atmospheric CO2, however, are magnifying the
greenhouse effect
• Global models predict that by the end of the 21st century,
atmosphere CO2 concentrations will more than double, increasing
average global temperature by ~5
F
• Northern coniferous forests and tundra show the strongest effects of global
warming
– Darker, more absorptive surfaces are uncovered as snow and ice melt,
resulting in less reflection of radiation back to the atmosphere
• This, in turn, causes further warming
– Climate models suggest that there may be no summer ice present in
the Arctic by the end of the century
• This will decrease the habitats for polar bears, seals, and seabirds
– Higher temperatures also increase the likelihood of fires
• Fires in western North America and Russia have burned twice the
usual area in recent decades
• A warming trend would also affect the geographic distribution of precipitation
– Major agricultural areas of the central U.S. will likely become much
drier
– Many organisms, especially plants (who cannot disperse rapidly over
long distances) may not be able to survive the high rates of climate
change
• Many habitats will also become much more fragmented, further
limiting the ability of organisms to migrate
• Global warming can be slowed by:
– Using energy more efficiently
– Replacing fossil fuels with renewable solar, wind, and nuclear power
Ozo
ne la
yer
thic
kn
ess (
Do
bso
ns
)
Fig. 55-23
Year
’052000’95’90’85’80’75’70’65’6019550
100
250
200
300
350
Depletion of Atmospheric Ozone
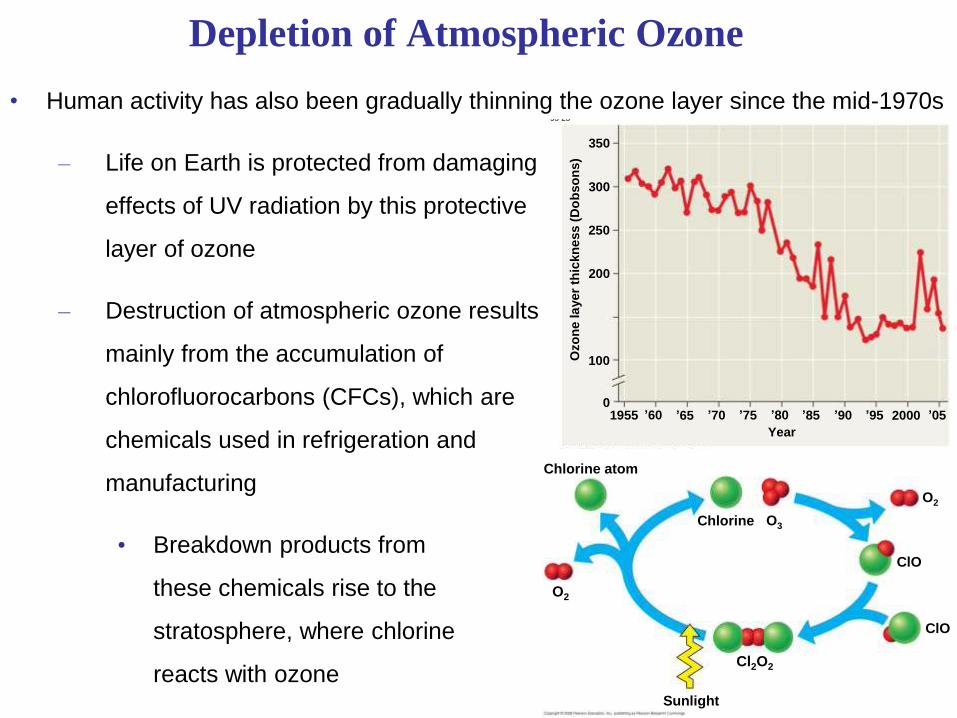
• Human activity has also been gradually thinning the ozone layer since the mid-1970s
– Life on Earth is protected from damaging
effects of UV radiation by this protective
layer of ozone
– Destruction of atmospheric ozone results
mainly from the accumulation of
chlorofluorocarbons (CFCs), which are
chemicals used in refrigeration and
manufacturing
• Breakdown products from
these chemicals rise to the
stratosphere, where chlorine
reacts with ozone
Fig. 55-24
O2
Sunlight
Cl2O2
Chlorine
Chlorine atom
O3
O2
ClO
ClO
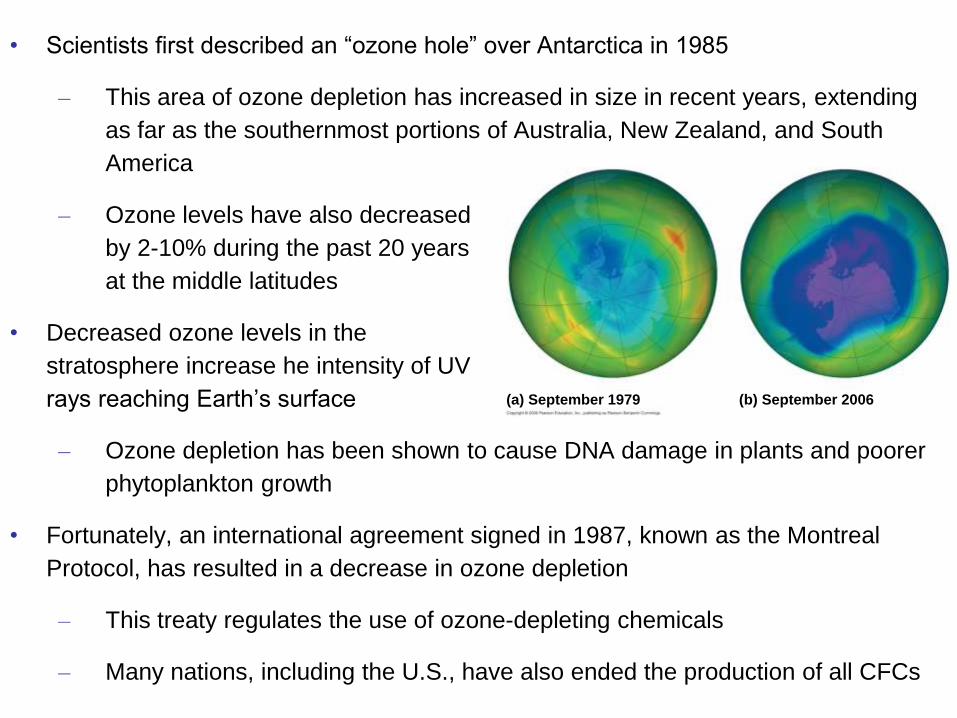
• Scientists first described an “ozone hole” over Antarctica in 1985
– This area of ozone depletion has increased in size in recent years, extending
as far as the southernmost portions of Australia, New Zealand, and South
America
– Ozone levels have also decreased
by 2-10% during the past 20 years
at the middle latitudes
• Decreased ozone levels in the
stratosphere increase he intensity of UV
rays reaching Earth’s surface
– Ozone depletion has been shown to cause DNA damage in plants and poorer
phytoplankton growth
• Fortunately, an international agreement signed in 1987, known as the Montreal
Protocol, has resulted in a decrease in ozone depletion
– This treaty regulates the use of ozone-depleting chemicals
– Many nations, including the U.S., have also ended the production of all CFCs
Fig. 55-25
(a) September 1979 (b) September 2006
Concept 55.5
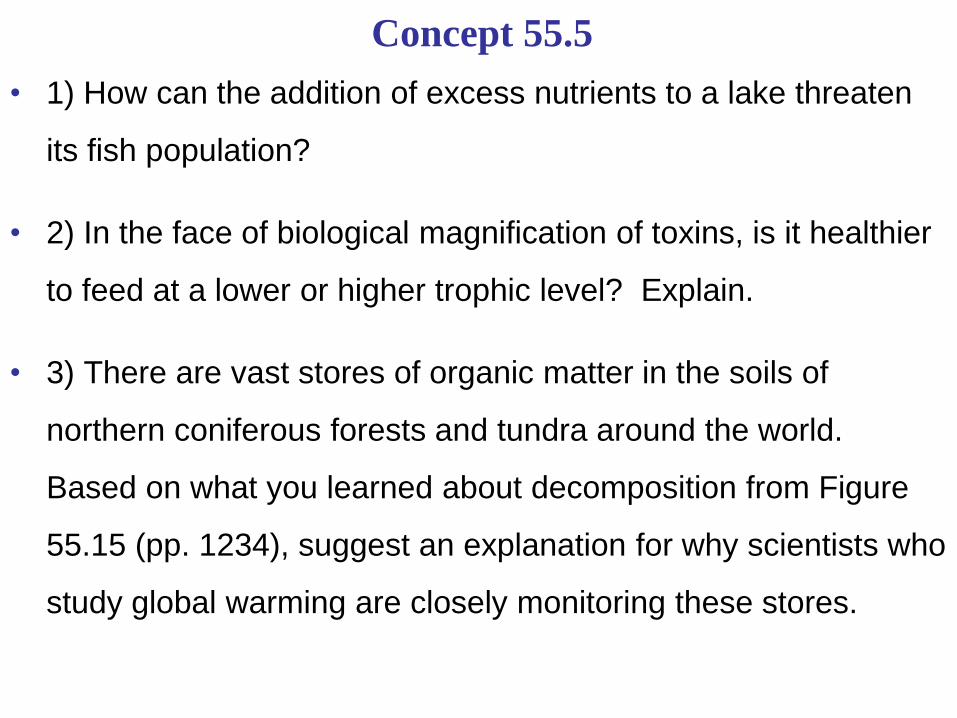
• 1) How can the addition of excess nutrients to a lake threaten
its fish population?
• 2) In the face of biological magnification of toxins, is it healthier
to feed at a lower or higher trophic level? Explain.
• 3) There are vast stores of organic matter in the soils of
northern coniferous forests and tundra around the world.
Based on what you learned about decomposition from Figure
55.15 (pp. 1234), suggest an explanation for why scientists who
study global warming are closely monitoring these stores.
You should now be able to:
1. Explain how the first and second laws of
thermodynamics apply to ecosystems
2. Define and compare gross primary
production, net primary production, and
standing crop
3. Explain why energy flows but nutrients cycle
within an ecosystem
4. Explain what factors may limit primary
production in aquatic ecosystems
5. Distinguish between the following pairs of
terms: primary and secondary production,
production efficiency and trophic efficiency
6. Explain why worldwide agriculture could feed
more people if all humans consumed only
plant material
7. Describe the four nutrient reservoirs and the
processes that transfer the elements between
reservoirs
8. Explain why toxic compounds usually have
the greatest effect on top-level carnivores
9. Describe the causes and consequences of
ozone depletion