Embed Size (px)
Citation preview
FE E'D)S IN'M IT ED �VANT! I Tel: 040 - 23310260, 23310261 Fax : 040 - 23311604
email : [email protected] web: www.avanlifeeds.com
www.avantiindia.com
Corporate Office : G-2, Concorde Apa11me11ts,
6-3-658, Somajiguda, yderabac/ - 500 082, angana State, India.
111 the business of q11ali(1• Pmw11 feed 11111! Prm1111 Exports
Ref: AFL/BSE & NSE/2018-19/04 02"d June, 2018
The Deputy General Manager BSE, Limited Corporate Relation Department 1st Floor, New Trading Ring Rotunda Building Phiroze Jeejeeboy Towers, Dalal Street, MUMBAI - 400 001 Fax: 022-2272 2041 I 22723121 SSE Code: 512573
National Stock Exchange India Limited Exchange Plaza Sandra (East) Mumbai - 400 051. Fax: 022-26598237/38
NSE Code: AVANTIFEED
Dear Sir,
Sub: AVANTI FEEDS LIMITED- Schedule of Audio Conference Call for Investors on 041h June, 2018 - Copy of Presentation on the Audited Financial Results for the
Quarter and Year ended 31.03.2018 - Reg.
Ref: 1) Regulation 30 read with part A of Schedule 3 of Securities and Exchange Board of India (Listing Obligations and Disclosure Requirements) Regulations 2015. 2) Our letter No. AFL/BSE & NSE/2018-19, dated 01 st June, 2018
* * *
Further to our letter cited, we enclose herewith a copy of presentation on the Audited Financial Results for the Quarter and Year ended 31.03.2018, in connection with Audio Conference Call for Investors to be held on 041h June 2018 at 4.00 PM.
This is for your information and record.
Thanking you
Yours faithfully for AVANT! FEEDS LIMITED
C RAMACHANDRA RAO, JOINT MANAGING DIRECTOR COMPANY SECRETARY & CFO
Encl: as above Regd. Office:
H.No. 37, Plot No. 37, Baymount, Rushikonda,
Visak/Japatnam - 530045 dhra Pradesh, India.
N : L16001AP1993PLC095778
AVANTI FEEDS LIMITED Q4 & FY18 Result Update
MAY 2018
Disclaimer
This presentation has been prepared by Avanti Feeds Limited based on information and data which the Company
considers reliable, but the Company makes no representation or warranty, express or implied, whatsoever, and no
reliance shall be placed on, the truth, accuracy, completeness, fairness and reasonableness of the contents of this
Presentation.
Certain matters discussed in this presentation may contain statements regarding the Company’s market opportunity
and business prospects that are individually and collectively forward looking statements. Such forward looking
statements are not guarantees for future performance and or subject to known and unknown risks, uncertainties, and
assumptions that are difficult to predict.
These risks and uncertainties include but are not limited to, performance of the Indian economy and of the economies
of various international markets, the performance of the industry in India and worldwide, competition, the company’s
ability to successfully implement its strategy, company’s future levels of growth and expansion, technological
implementation, changes and advancements, changes in revenue, income or cash flows, withdrawal of governmental
fiscal incentives, the company’s market preferences and its exposure to market risks, as well as other risks.
2
Index
RESULT HIGHLIGHTS 4
OPERATIONAL HIGHLIGHTS 8
THE PATH FORWARD 11
FINANCIAL STATEMENTS 14
ANNEXURE 18
3

RESULT HIGHLIGHTS
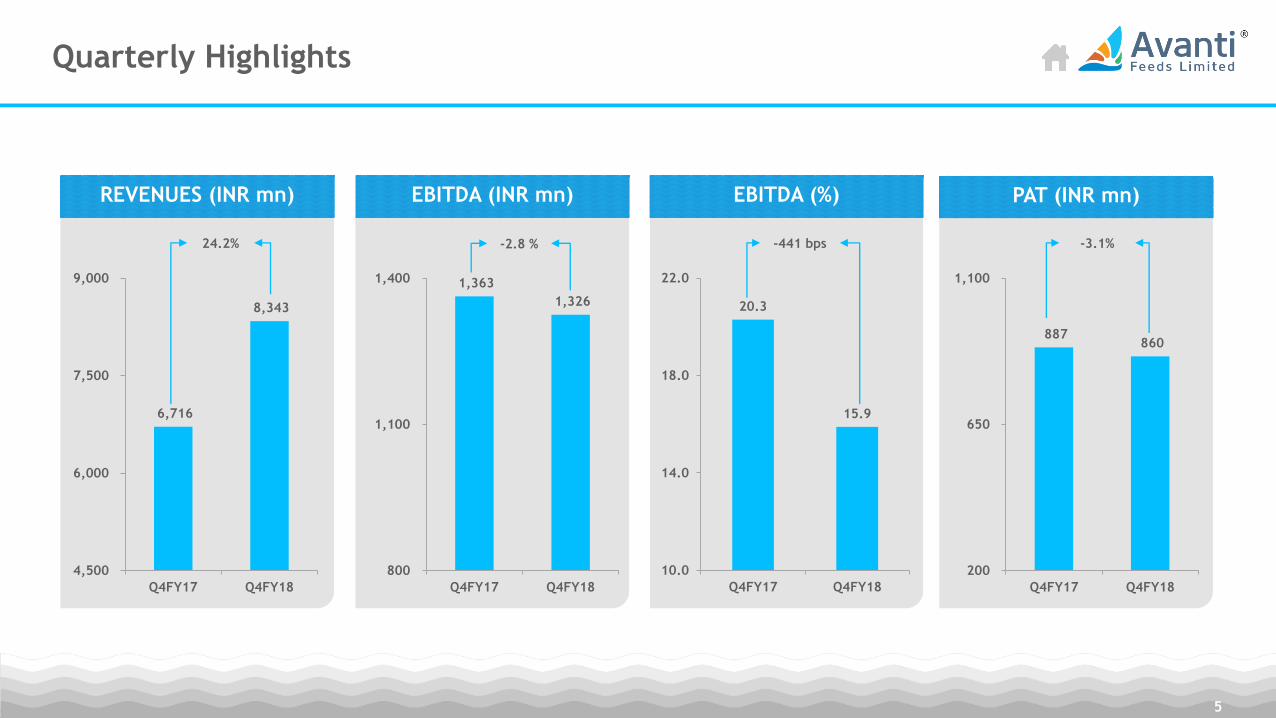
Quarterly Highlights
5
6,716
8,343
4,500
6,000
7,500
9,000
Q4FY17 Q4FY18
24.2%
REVENUES (INR mn)
20.3
15.9
10.0
14.0
18.0
22.0
Q4FY17 Q4FY18
-441 bps
EBITDA (%)
1,363
1,326
800
1,100
1,400
Q4FY17 Q4FY18
-2.8 %
EBITDA (INR mn)
887 860
200
650
1,100
Q4FY17 Q4FY18
-3.1%
PAT (INR mn)
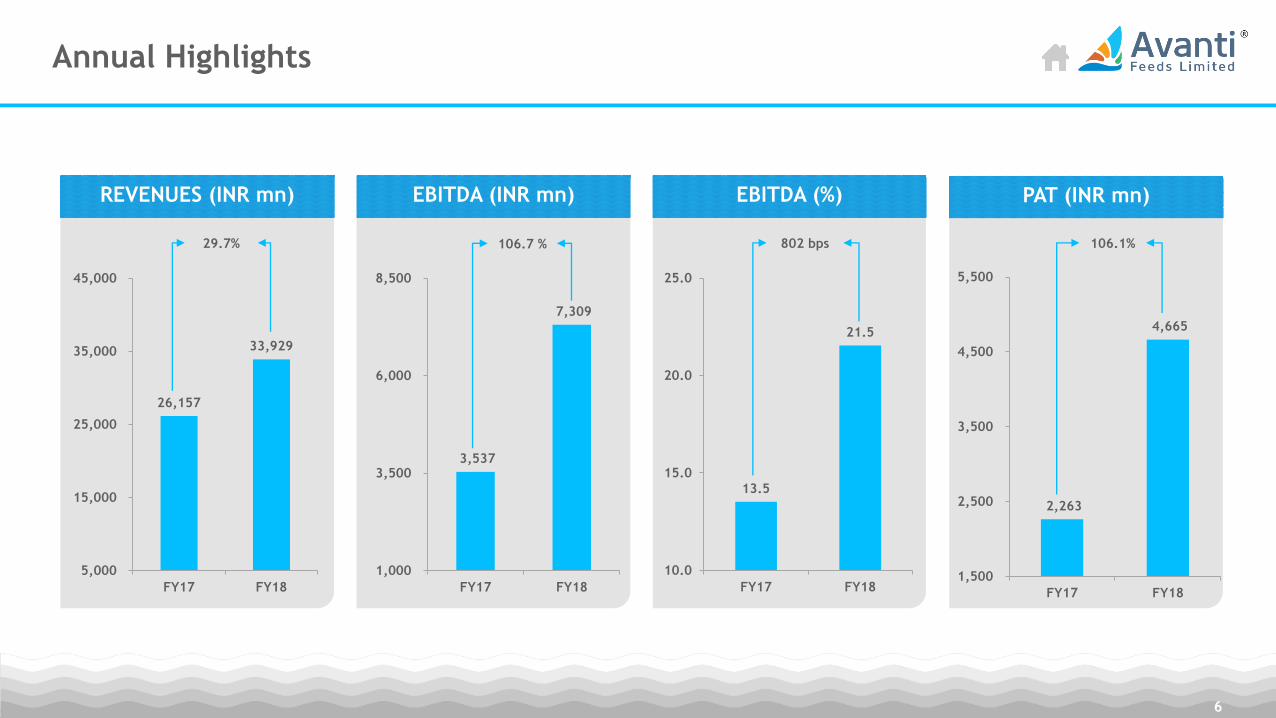
Annual Highlights
6
26,157
33,929
5,000
15,000
25,000
35,000
45,000
FY17 FY18
29.7%
REVENUES (INR mn)
13.5
21.5
10.0
15.0
20.0
25.0
FY17 FY18
802 bps
EBITDA (%)
3,537
7,309
1,000
3,500
6,000
8,500
FY17 FY18
106.7 %
EBITDA (INR mn)
2,263
4,665
1,500
2,500
3,500
4,500
5,500
FY17 FY18
106.1%
PAT (INR mn)
Key commentary on the quarter results
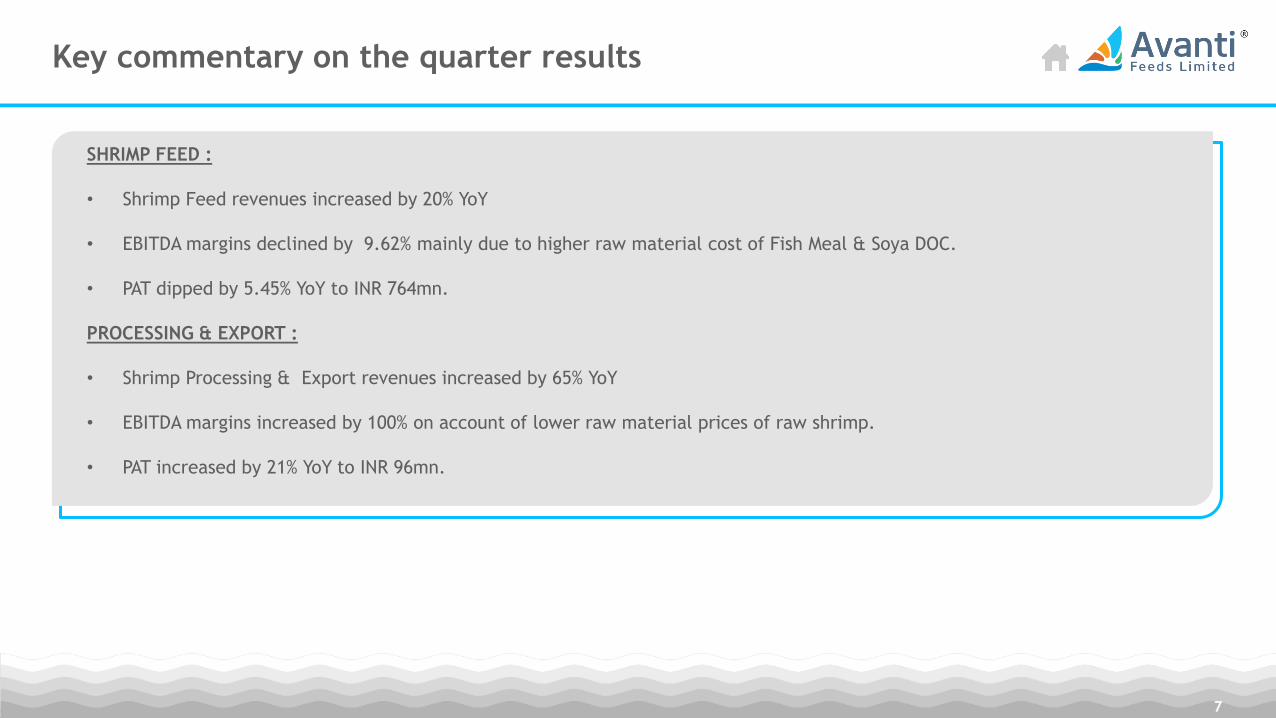
SHRIMP FEED :
• Shrimp Feed revenues increased by 20% YoY
• EBITDA margins declined by 9.62% mainly due to higher raw material cost of Fish Meal & Soya DOC.
• PAT dipped by 5.45% YoY to INR 764mn.
PROCESSING & EXPORT :
• Shrimp Processing & Export revenues increased by 65% YoY
• EBITDA margins increased by 100% on account of lower raw material prices of raw shrimp.
• PAT increased by 21% YoY to INR 96mn.
7

OPERATIONAL HIGHLIGHTS
Operational Highlights - Quarterly
9
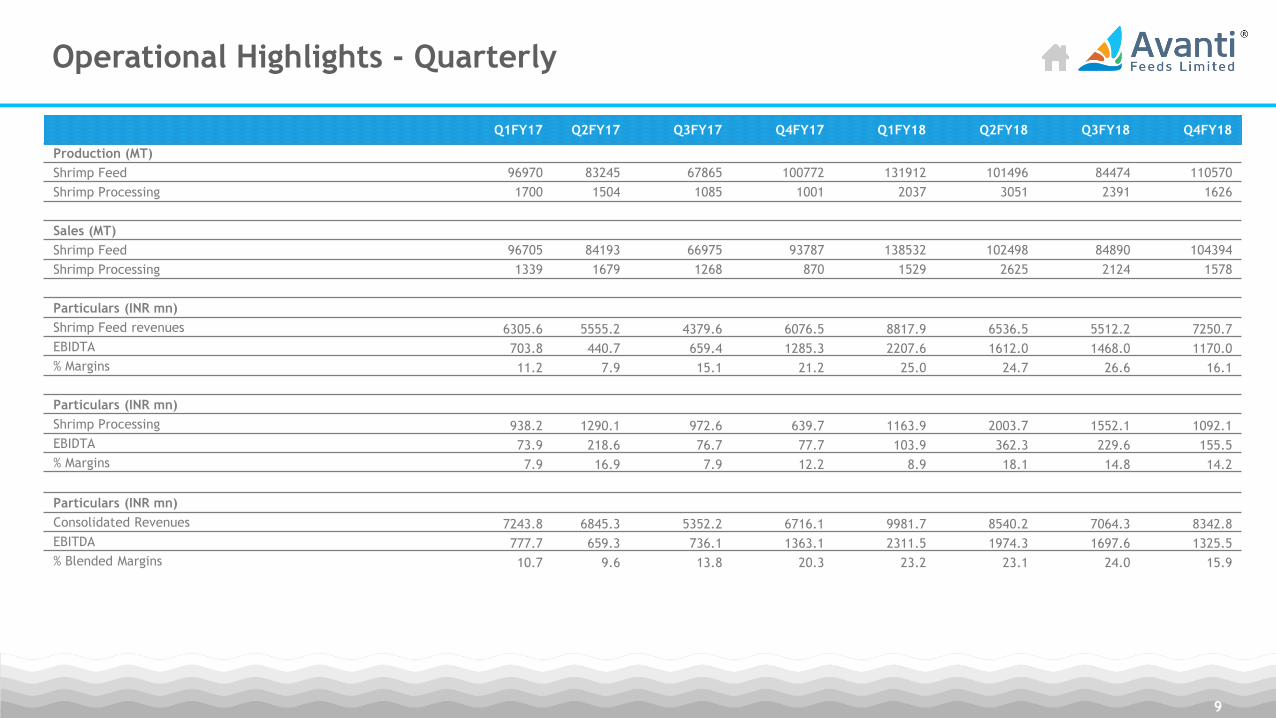
Q1FY17 Q2FY17 Q3FY17 Q4FY17 Q1FY18 Q2FY18 Q3FY18 Q4FY18
Production (MT)
Shrimp Feed 96970 83245 67865 100772 131912 101496 84474 110570
Shrimp Processing 1700 1504 1085 1001 2037 3051 2391 1626
Sales (MT)
Shrimp Feed 96705 84193 66975 93787 138532 102498 84890 104394
Shrimp Processing 1339 1679 1268 870 1529 2625 2124 1578
Particulars (INR mn)
Shrimp Feed revenues 6305.6 5555.2 4379.6 6076.5 8817.9 6536.5 5512.2 7250.7
EBIDTA 703.8 440.7 659.4 1285.3 2207.6 1612.0 1468.0 1170.0
% Margins 11.2 7.9 15.1 21.2 25.0 24.7 26.6 16.1
Particulars (INR mn)
Shrimp Processing 938.2 1290.1 972.6 639.7 1163.9 2003.7 1552.1 1092.1
EBIDTA 73.9 218.6 76.7 77.7 103.9 362.3 229.6 155.5
% Margins 7.9 16.9 7.9 12.2 8.9 18.1 14.8 14.2
Particulars (INR mn)
Consolidated Revenues 7243.8 6845.3 5352.2 6716.1 9981.7 8540.2 7064.3 8342.8
EBITDA 777.7 659.3 736.1 1363.1 2311.5 1974.3 1697.6 1325.5
% Blended Margins 10.7 9.6 13.8 20.3 23.2 23.1 24.0 15.9
Operational Highlights - Annually
10
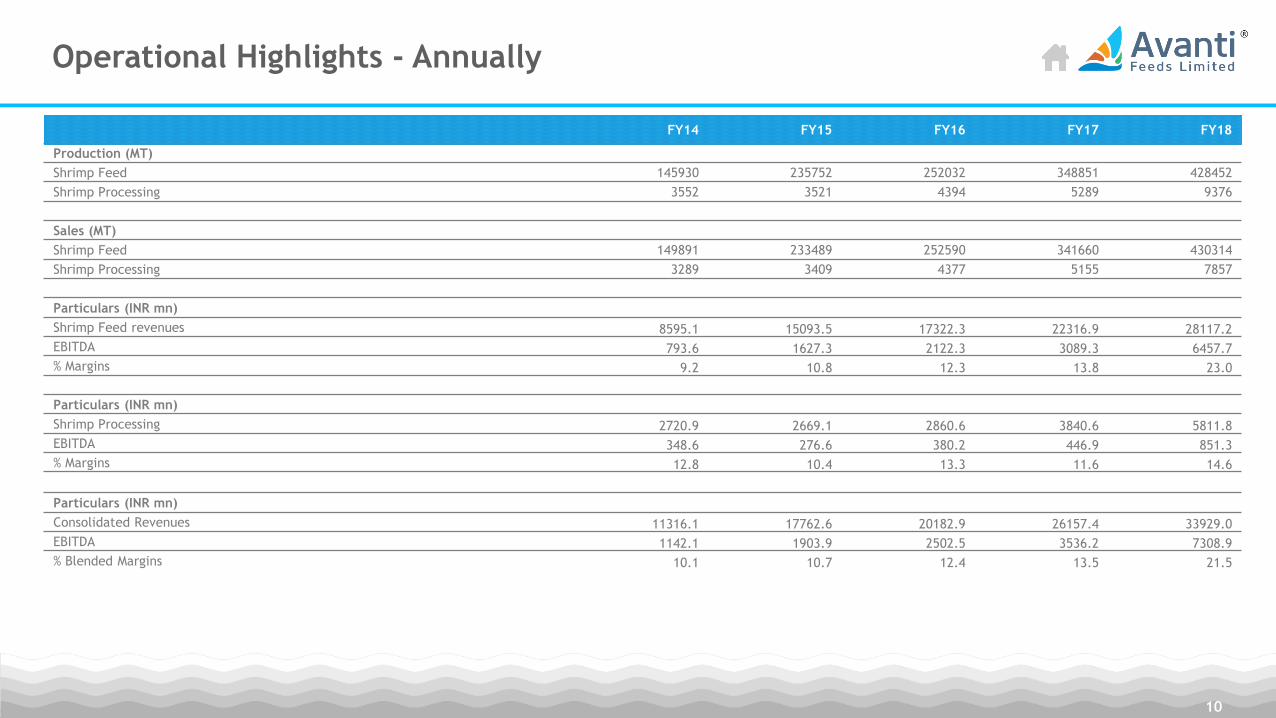
FY14 FY15 FY16 FY17 FY18
Production (MT)
Shrimp Feed 145930 235752 252032 348851 428452
Shrimp Processing 3552 3521 4394 5289 9376
Sales (MT)
Shrimp Feed 149891 233489 252590 341660 430314
Shrimp Processing 3289 3409 4377 5155 7857
Particulars (INR mn)
Shrimp Feed revenues 8595.1 15093.5 17322.3 22316.9 28117.2
EBITDA 793.6 1627.3 2122.3 3089.3 6457.7
% Margins 9.2 10.8 12.3 13.8 23.0
Particulars (INR mn)
Shrimp Processing 2720.9 2669.1 2860.6 3840.6 5811.8
EBITDA 348.6 276.6 380.2 446.9 851.3
% Margins 12.8 10.4 13.3 11.6 14.6
Particulars (INR mn)
Consolidated Revenues 11316.1 17762.6 20182.9 26157.4 33929.0
EBITDA 1142.1 1903.9 2502.5 3536.2 7308.9
% Blended Margins 10.1 10.7 12.4 13.5 21.5

THE PATH FORWARD
Industry Highlights
12
Shrimp Culture Scenario in India
• Shrimp culture in India grew consistently YoY since introduction of Vannamei culture. According to a survey, India has about
11,90,000 Ha area potential for development of shrimp culture mainly in Maritime States. Out of which, only about 1,53,000 Ha
is under shrimp farming presently and there is significant scope for increase in area of shrimp culture.
• The shrimp exports grew by 20% during the period from Apr’17 – Jan’18 and clocked 4.56 lakhs MT as compared to 3.78 lakhs MT
in the corresponding period of previous year. (MPEDA Press release).
• In the current year (2018) till now, the shrimp export prices have been declining significantly and the farm gate prices of raw
shrimps have also dipped, dampening the expectations of a growth rate of above 15% in production, in the current year.
However, since the prices are expected to go up in near future, the growth may be expected at around 5 - 10%, in the current
year.
Shrimp Production and Exports Market Potential
• Keeping the increasing growth trend, India exported about 5.40 lakh MT's of shrimp in 2017-18.
• However, in 2018-19, due to prevailing un-favourable conditions, it is anticipated that the exports may go up by about 5 - 10%.
• In the long run, the Indian shrimp export is set to nearly double to $7 billion (INR 45,000 crore) by 2022, driven by global
demand, high quality and improved product mix. (Source: Crisil Report)
Growth Strategy Ahead
13
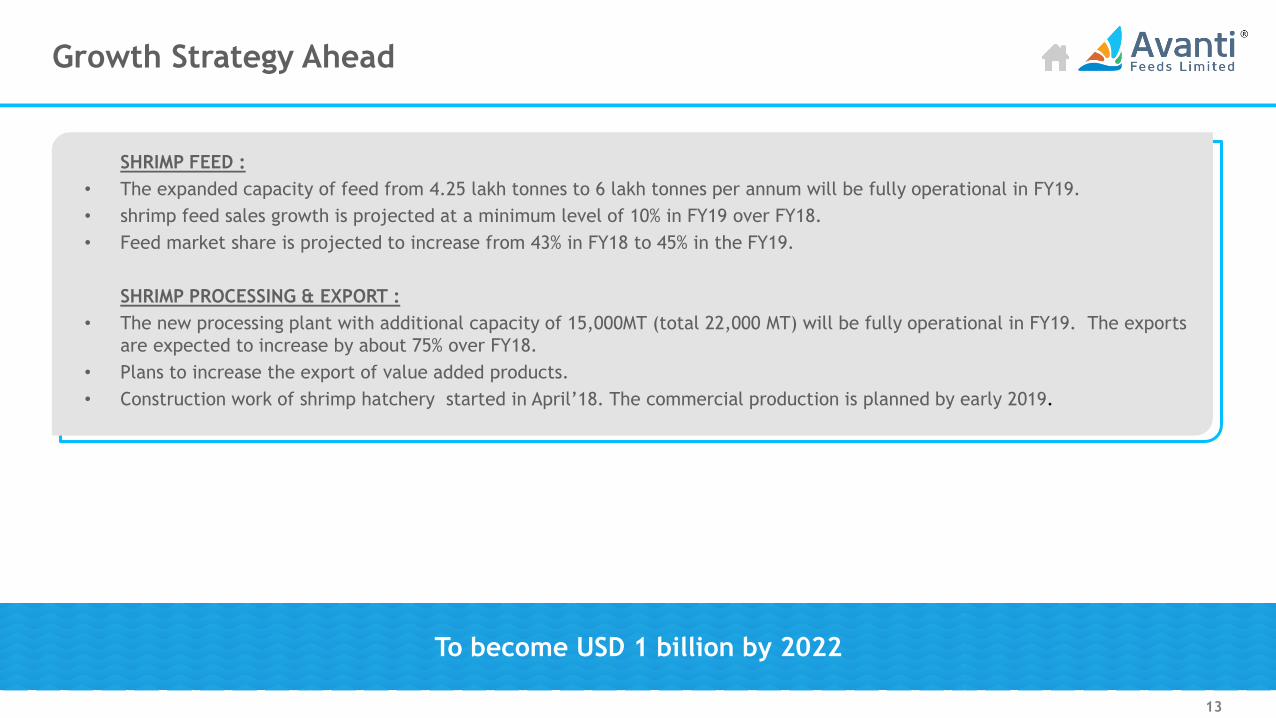
SHRIMP FEED :
• The expanded capacity of feed from 4.25 lakh tonnes to 6 lakh tonnes per annum will be fully operational in FY19.
• shrimp feed sales growth is projected at a minimum level of 10% in FY19 over FY18.
• Feed market share is projected to increase from 43% in FY18 to 45% in the FY19.
SHRIMP PROCESSING & EXPORT :
• The new processing plant with additional capacity of 15,000MT (total 22,000 MT) will be fully operational in FY19. The exports
are expected to increase by about 75% over FY18.
• Plans to increase the export of value added products.
• Construction work of shrimp hatchery started in April’18. The commercial production is planned by early 2019.
To become USD 1 billion by 2022

FINANCIAL STATEMENTS
Profit & Loss Statement - Quarterly
15
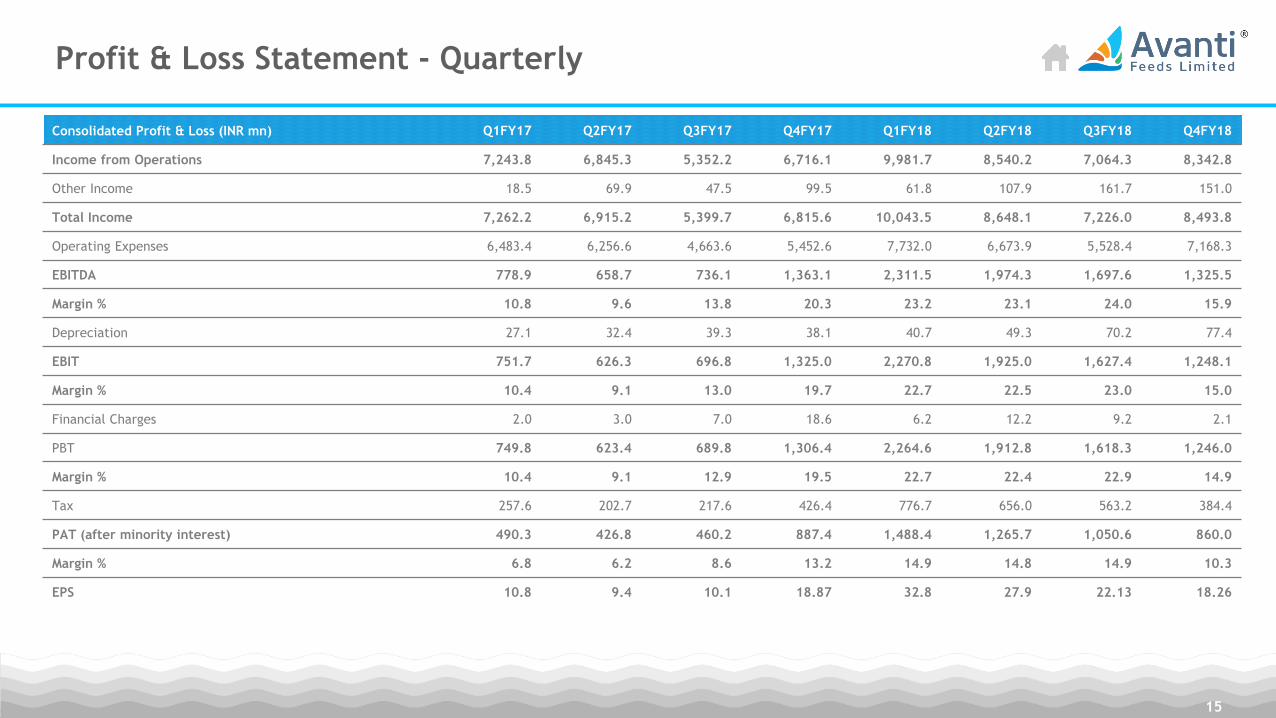
Consolidated Profit & Loss (INR mn) Q1FY17 Q2FY17 Q3FY17 Q4FY17 Q1FY18 Q2FY18 Q3FY18 Q4FY18
Income from Operations 7,243.8 6,845.3 5,352.2 6,716.1 9,981.7 8,540.2 7,064.3 8,342.8
Other Income 18.5 69.9 47.5 99.5 61.8 107.9 161.7 151.0
Total Income 7,262.2 6,915.2 5,399.7 6,815.6 10,043.5 8,648.1 7,226.0 8,493.8
Operating Expenses 6,483.4 6,256.6 4,663.6 5,452.6 7,732.0 6,673.9 5,528.4 7,168.3
EBITDA 778.9 658.7 736.1 1,363.1 2,311.5 1,974.3 1,697.6 1,325.5
Margin % 10.8 9.6 13.8 20.3 23.2 23.1 24.0 15.9
Depreciation 27.1 32.4 39.3 38.1 40.7 49.3 70.2 77.4
EBIT 751.7 626.3 696.8 1,325.0 2,270.8 1,925.0 1,627.4 1,248.1
Margin % 10.4 9.1 13.0 19.7 22.7 22.5 23.0 15.0
Financial Charges 2.0 3.0 7.0 18.6 6.2 12.2 9.2 2.1
PBT 749.8 623.4 689.8 1,306.4 2,264.6 1,912.8 1,618.3 1,246.0
Margin % 10.4 9.1 12.9 19.5 22.7 22.4 22.9 14.9
Tax 257.6 202.7 217.6 426.4 776.7 656.0 563.2 384.4
PAT (after minority interest) 490.3 426.8 460.2 887.4 1,488.4 1,265.7 1,050.6 860.0
Margin % 6.8 6.2 8.6 13.2 14.9 14.8 14.9 10.3
EPS 10.8 9.4 10.1 18.87 32.8 27.9 22.13 18.26
Profit & Loss Statement - Annually
16
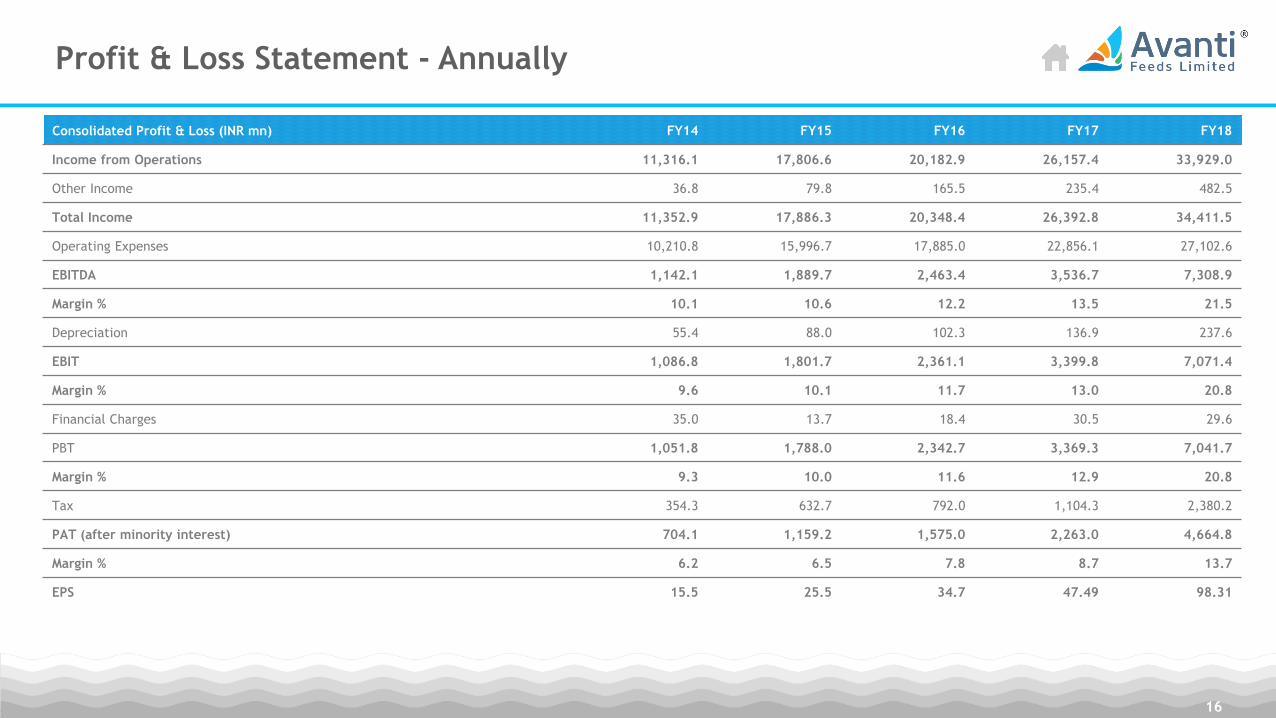
Consolidated Profit & Loss (INR mn) FY14 FY15 FY16 FY17 FY18
Income from Operations 11,316.1 17,806.6 20,182.9 26,157.4 33,929.0
Other Income 36.8 79.8 165.5 235.4 482.5
Total Income 11,352.9 17,886.3 20,348.4 26,392.8 34,411.5
Operating Expenses 10,210.8 15,996.7 17,885.0 22,856.1 27,102.6
EBITDA 1,142.1 1,889.7 2,463.4 3,536.7 7,308.9
Margin % 10.1 10.6 12.2 13.5 21.5
Depreciation 55.4 88.0 102.3 136.9 237.6
EBIT 1,086.8 1,801.7 2,361.1 3,399.8 7,071.4
Margin % 9.6 10.1 11.7 13.0 20.8
Financial Charges 35.0 13.7 18.4 30.5 29.6
PBT 1,051.8 1,788.0 2,342.7 3,369.3 7,041.7
Margin % 9.3 10.0 11.6 12.9 20.8
Tax 354.3 632.7 792.0 1,104.3 2,380.2
PAT (after minority interest) 704.1 1,159.2 1,575.0 2,263.0 4,664.8
Margin % 6.2 6.5 7.8 8.7 13.7
EPS 15.5 25.5 34.7 47.49 98.31
Balance Sheet & Key Ratios
17
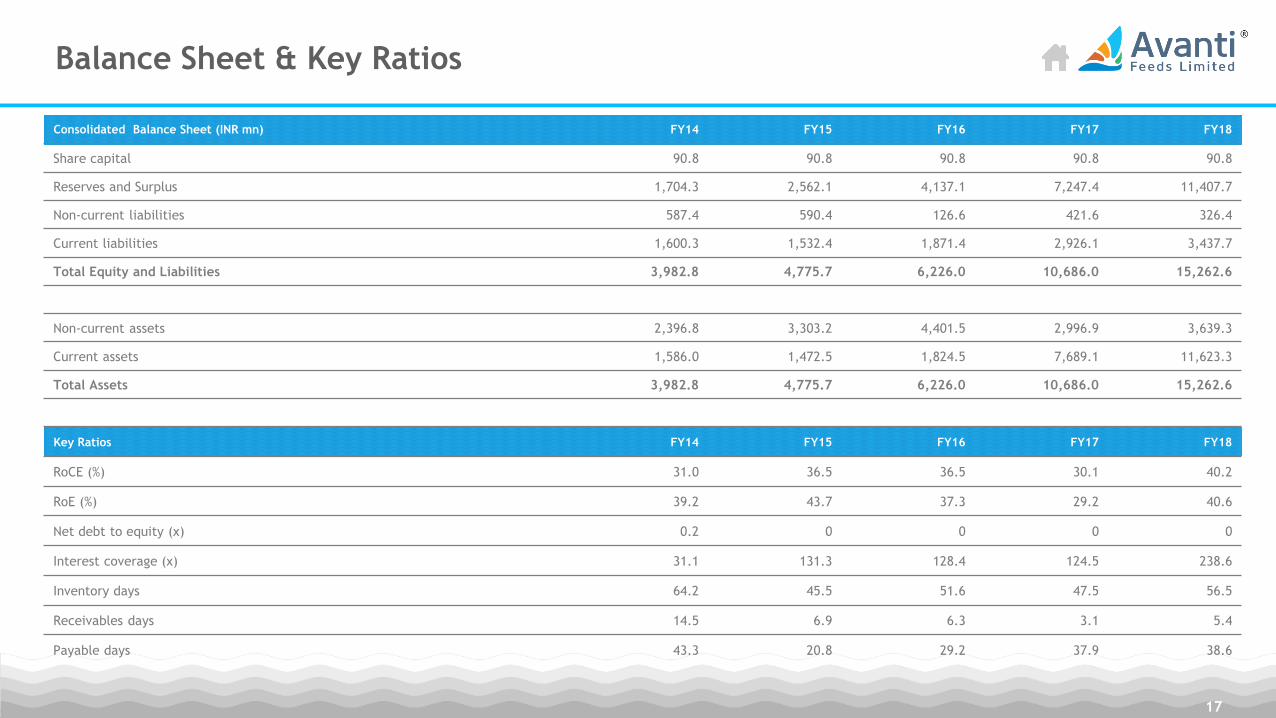
Consolidated Balance Sheet (INR mn) FY14 FY15 FY16 FY17 FY18
Share capital 90.8 90.8 90.8 90.8 90.8
Reserves and Surplus 1,704.3 2,562.1 4,137.1 7,247.4 11,407.7
Non-current liabilities 587.4 590.4 126.6 421.6 326.4
Current liabilities 1,600.3 1,532.4 1,871.4 2,926.1 3,437.7
Total Equity and Liabilities 3,982.8 4,775.7 6,226.0 10,686.0 15,262.6
Non-current assets 2,396.8 3,303.2 4,401.5 2,996.9 3,639.3
Current assets 1,586.0 1,472.5 1,824.5 7,689.1 11,623.3
Total Assets 3,982.8 4,775.7 6,226.0 10,686.0 15,262.6
Key Ratios FY14 FY15 FY16 FY17 FY18
RoCE (%) 31.0 36.5 36.5 30.1 40.2
RoE (%) 39.2 43.7 37.3 29.2 40.6
Net debt to equity (x) 0.2 0 0 0 0
Interest coverage (x) 31.1 131.3 128.4 124.5 238.6
Inventory days 64.2 45.5 51.6 47.5 56.5
Receivables days 14.5 6.9 6.3 3.1 5.4
Payable days 43.3 20.8 29.2 37.9 38.6

ANNEXURE
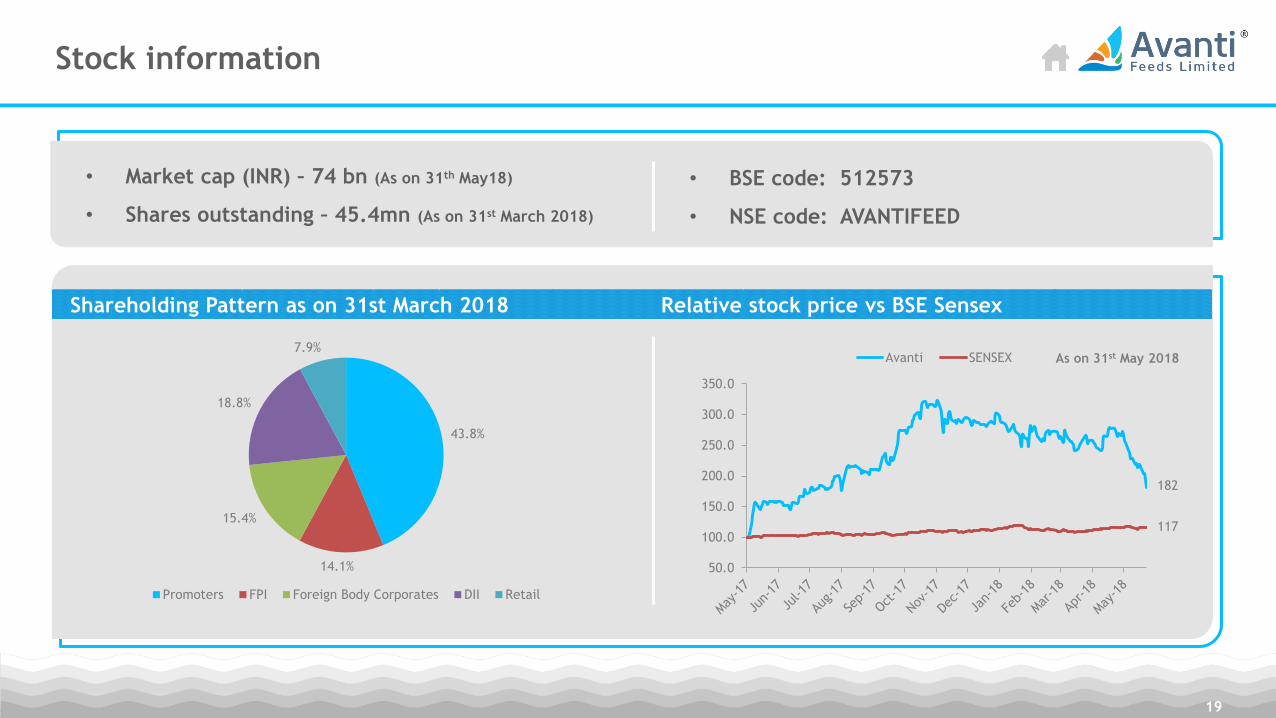
Stock information
• Market cap (INR) – 74 bn (As on 31th May18)
• Shares outstanding – 45.4mn (As on 31st March 2018)
• BSE code: 512573
• NSE code: AVANTIFEED
19
Shareholding Pattern as on 31st March 2018 Relative stock price vs BSE Sensex
As on 31st May 2018
182
117
50.0
100.0
150.0
200.0
250.0
300.0
350.0
Avanti SENSEX
43.8%
14.1%
15.4%
18.8%
7.9%
Promoters FPI Foreign Body Corporates DII Retail
Contacts
20
Name: Mr. M. Venkateswara Rao (GM- Corporate Affairs)
Email id: [email protected]
Phone number: +91-40-23310260
Investor Relations contact
G-2, Concorde Apartments, 6-3-658,
Somajiguda, Hyderabad-500082 Telangana,
India.
Corporate Office