Embed Size (px)
Citation preview
ILO Department of Statistics
Edgardo GreisingEdgardo GreisingEdgardo GreisingEdgardo Greising
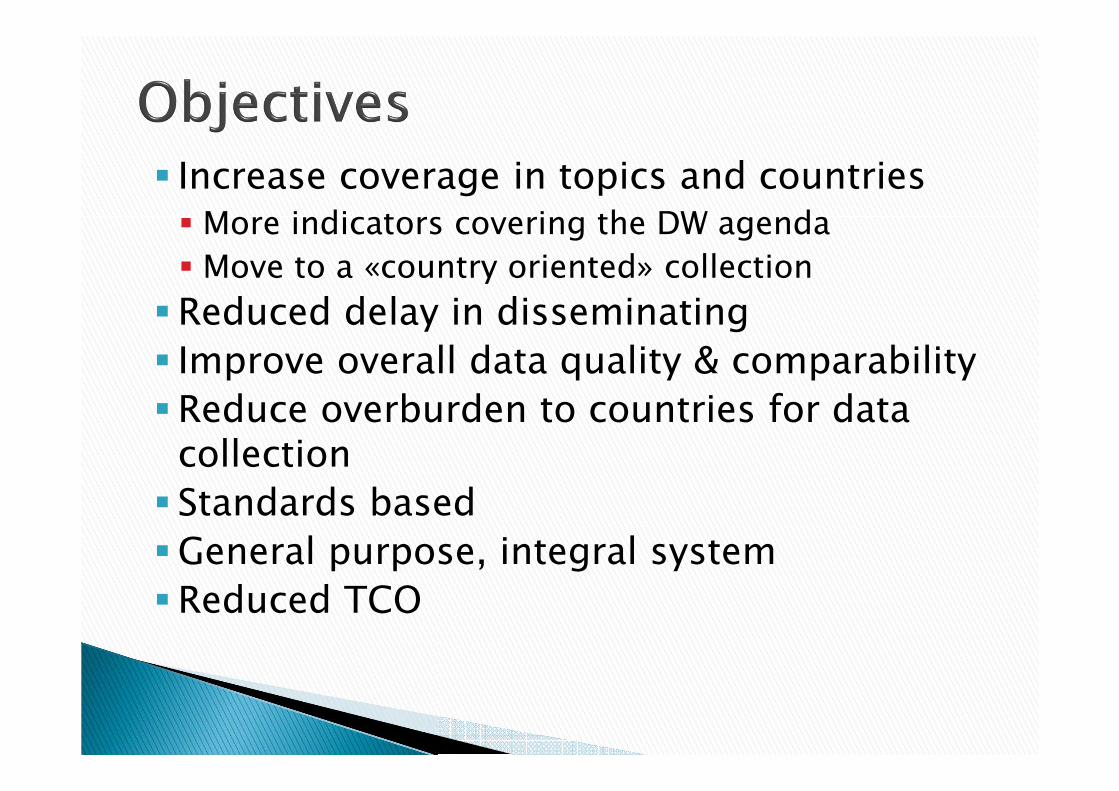
� Increase coverage in topics and countries� More indicators covering the DW agenda
� Move to a «country oriented» collection
�Reduced delay in disseminating
� Improve overall data quality & comparability
�Reduce overburden to countries for data collection
� Standards based
�General purpose, integral system
�Reduced TCO
� A new system: not only IT
� Effective dissemination
� ILOSTAT and DWI
� Conclusions
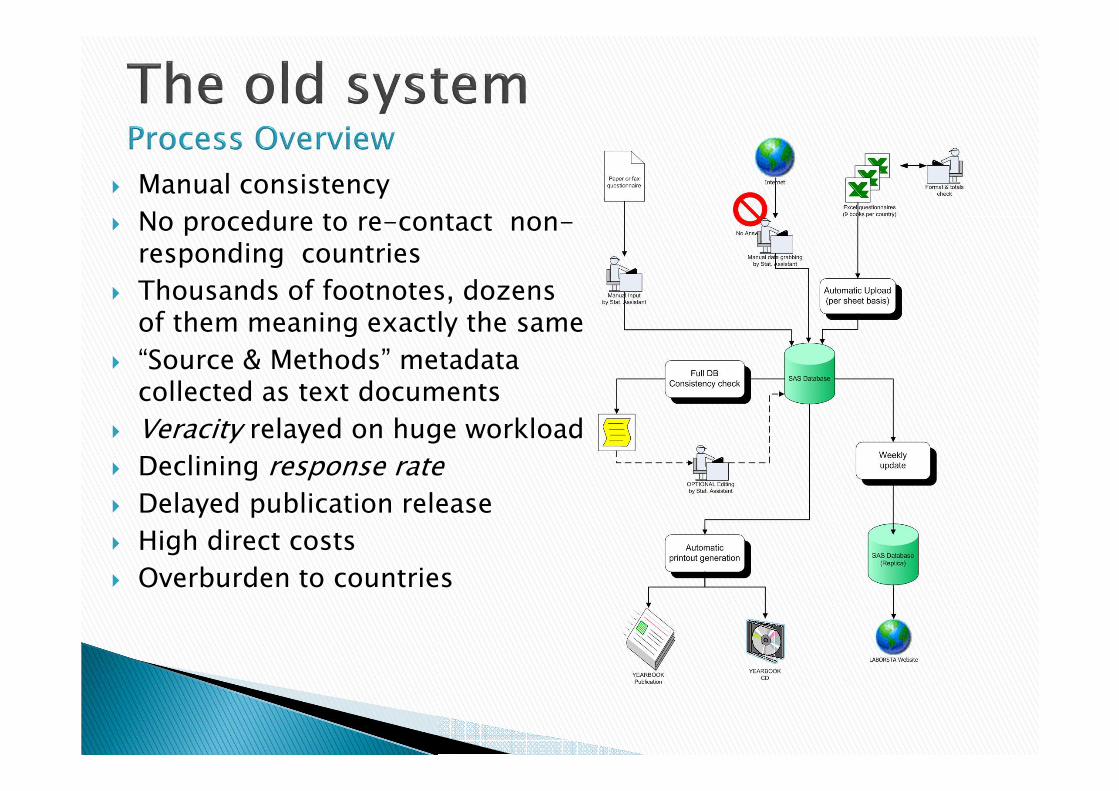
� Manual consistency
� No procedure to re-contact non-responding countries
� Thousands of footnotes, dozens of them meaning exactly the same
� “Source & Methods” metadata collected as text documents
� Veracity relayed on huge workload
� Declining response rate
� Delayed publication release
� High direct costs
� Overburden to countries
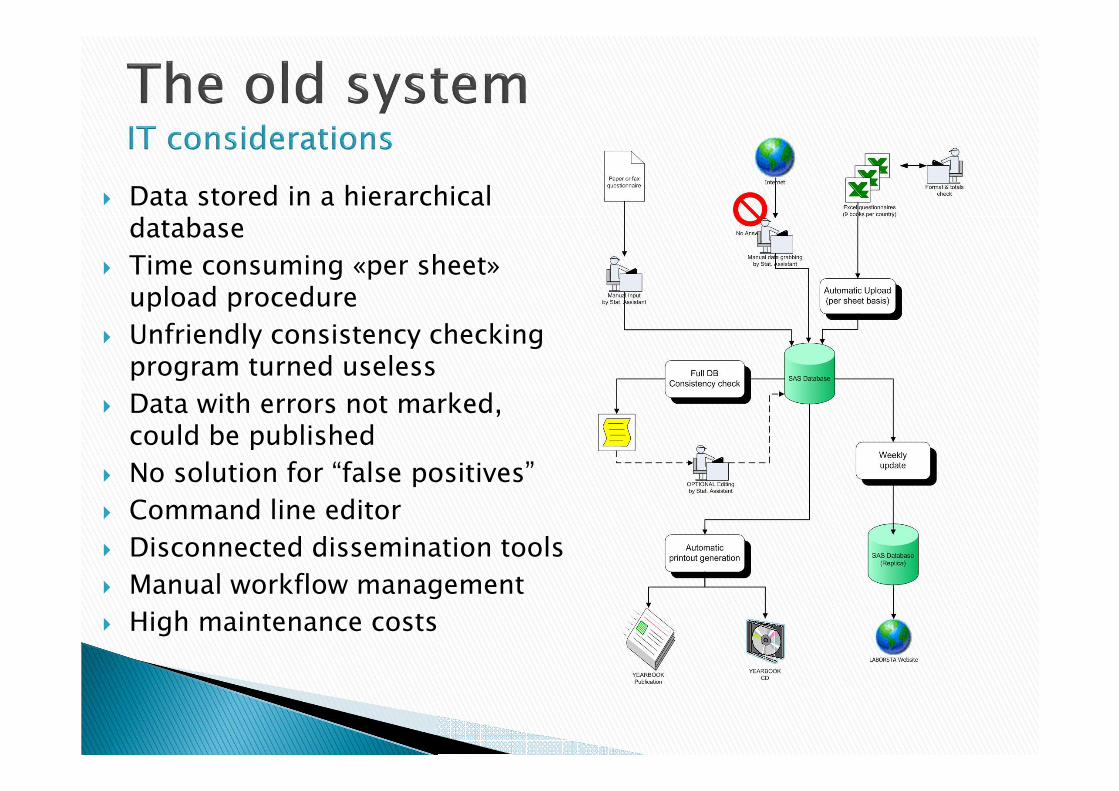
� Data stored in a hierarchicaldatabase
� Time consuming «per sheet» upload procedure
� Unfriendly consistency checkingprogram turned useless
� Data with errors not marked, could be published
� No solution for “false positives”
� Command line editor
� Disconnected dissemination tools
� Manual workflow management
� High maintenance costs
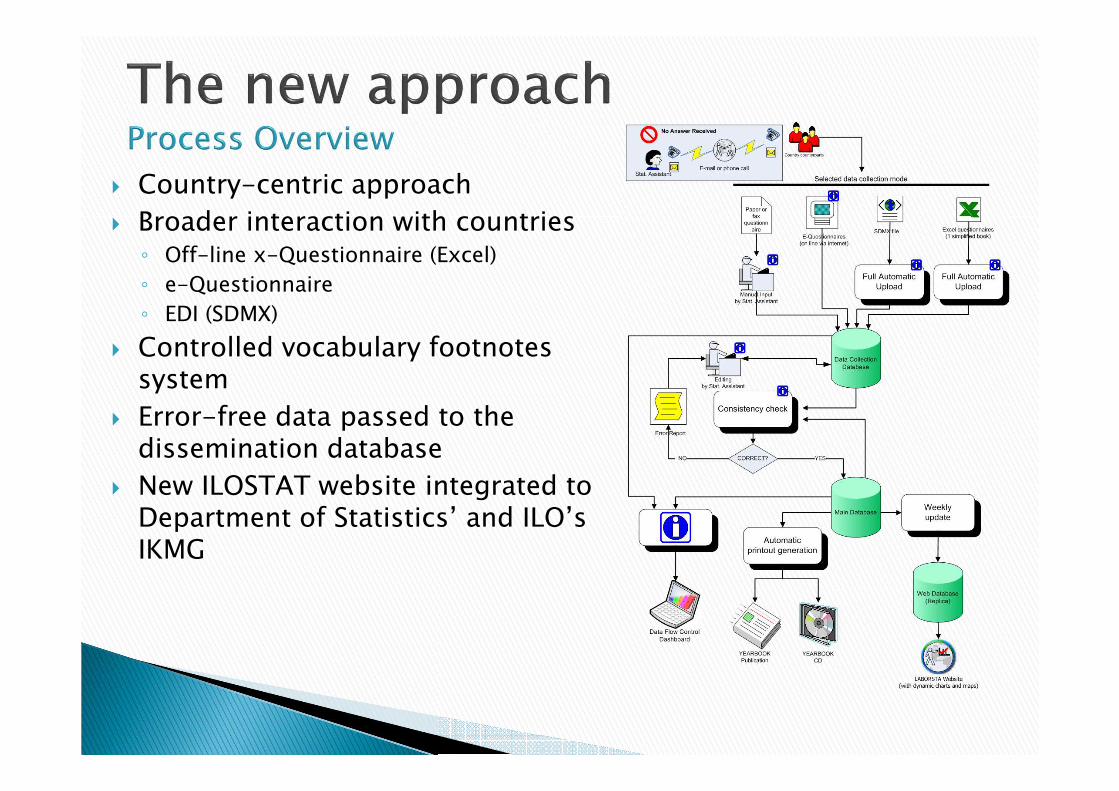
� Country-centric approach
� Broader interaction with countries◦ Off-line x-Questionnaire (Excel)
◦ e-Questionnaire
◦ EDI (SDMX)
� Controlled vocabulary footnotessystem
� Error-free data passed to the dissemination database
� New ILOSTAT website integrated to Department of Statistics’ and ILO’sIKMG
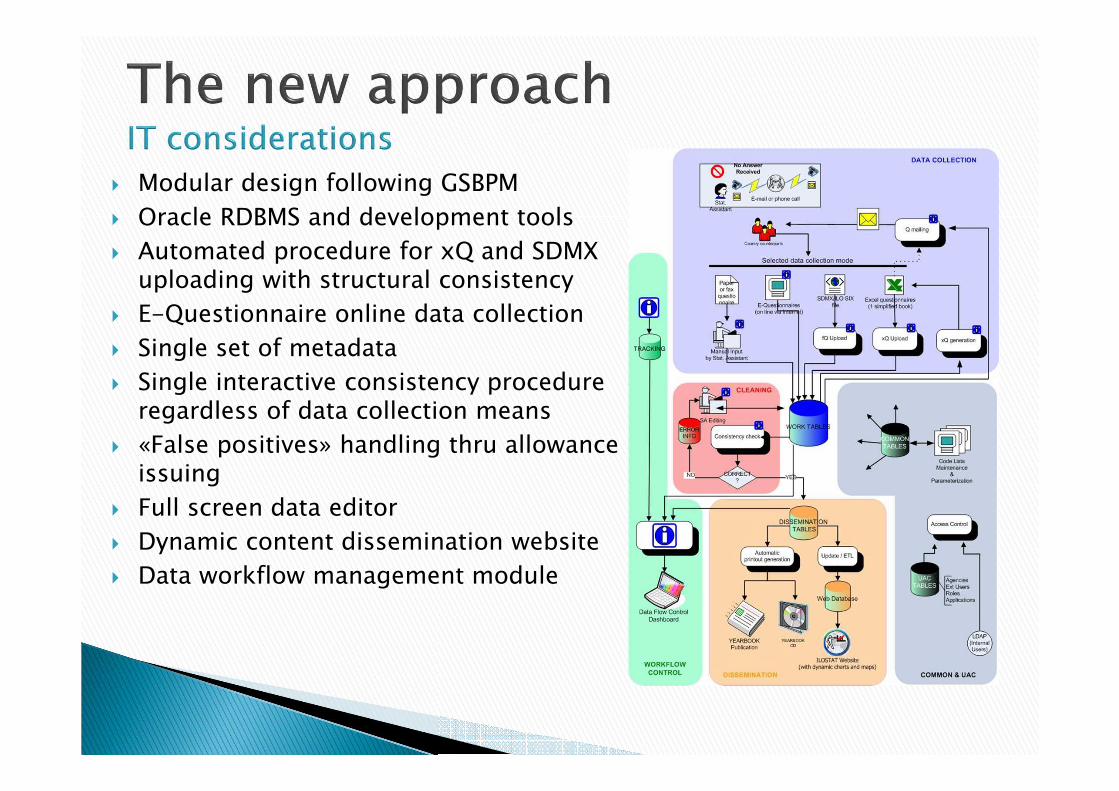
� Modular design following GSBPM
� Oracle RDBMS and development tools
� Automated procedure for xQ and SDMX uploading with structural consistency
� E-Questionnaire online data collection
� Single set of metadata
� Single interactive consistency procedureregardless of data collection means
� «False positives» handling thru allowanceissuing
� Full screen data editor
� Dynamic content dissemination website
� Data workflow management module
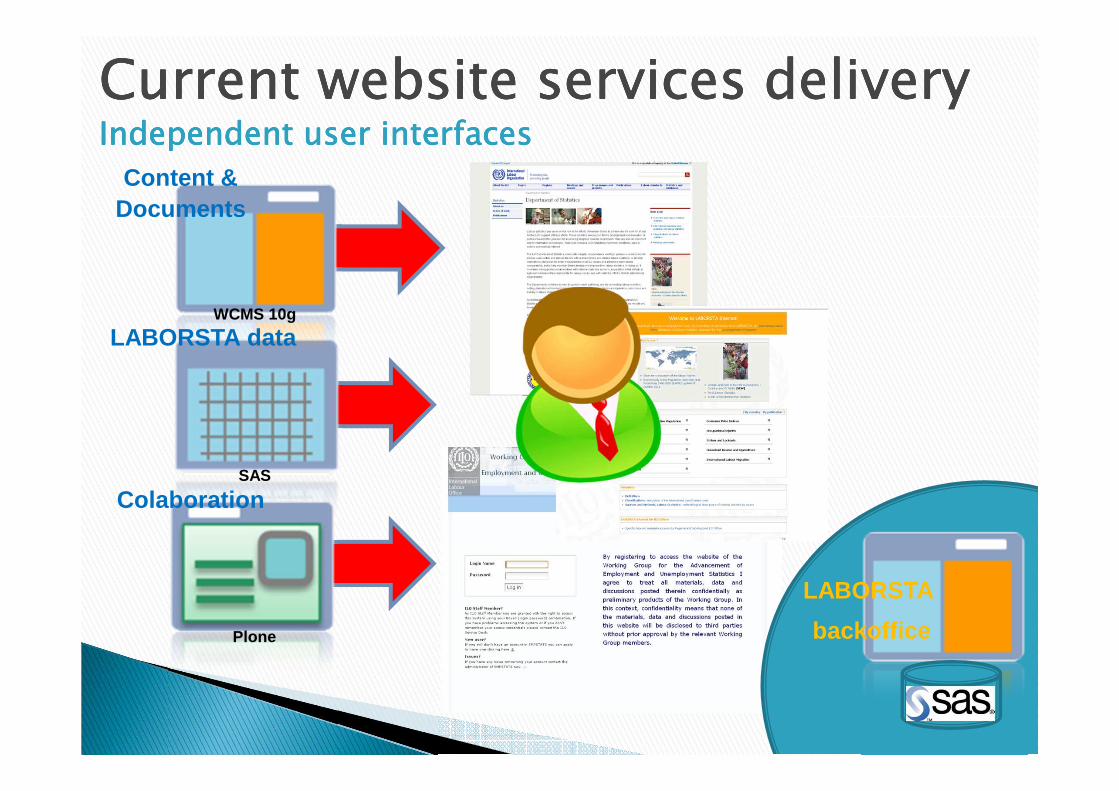
LABORSTA data
Content &Documents
CurrentCurrentCurrentCurrent websitewebsitewebsitewebsite servicesservicesservicesservices deliverydeliverydeliverydeliveryIndependentIndependentIndependentIndependent useruseruseruser interfacesinterfacesinterfacesinterfaces
Colaboration
WCMS 10g
SAS
Plone
LABORSTA
backoffice
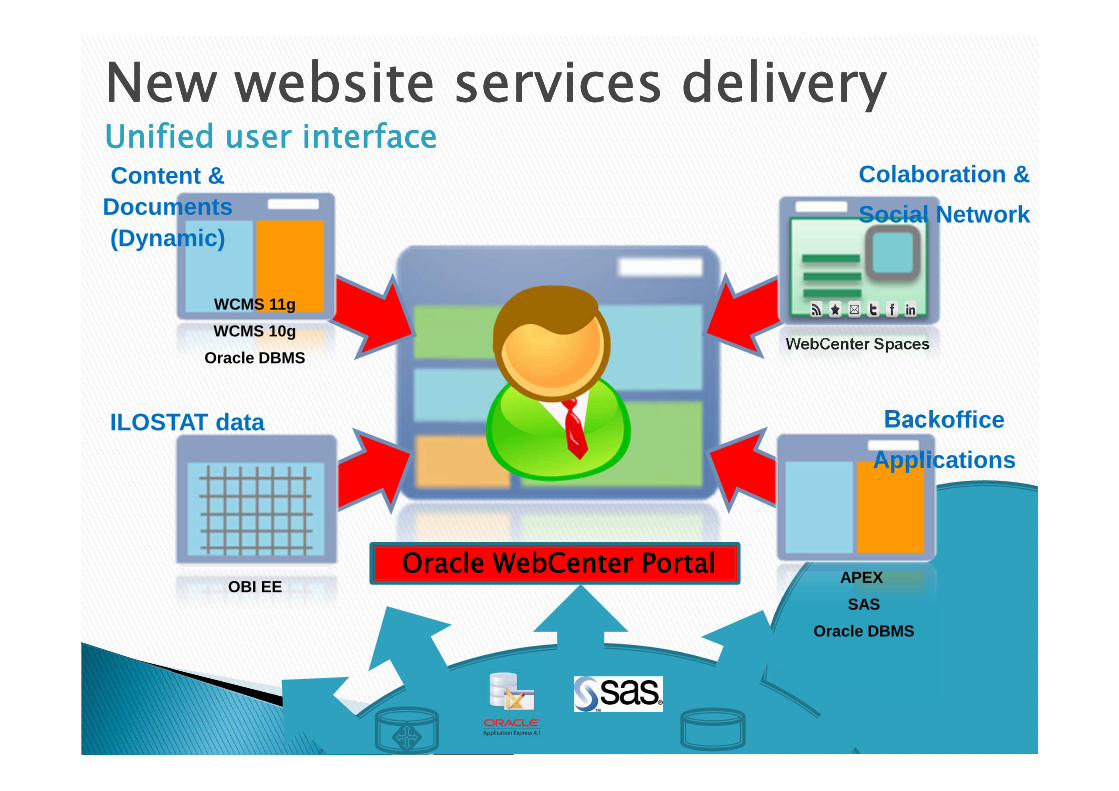
Oracle Oracle Oracle Oracle WebCenterWebCenterWebCenterWebCenter PortalPortalPortalPortal
Content &Documents(Dynamic)
ILOSTAT data Backoffice
Applications
WCMS 11g
WCMS 10g
Oracle DBMS
OBI EE
WebCenter Spaces
APEX
SAS
Oracle DBMS
Colaboration &
Social Network
New New New New websitewebsitewebsitewebsite servicesservicesservicesservices deliverydeliverydeliverydeliveryUnifiedUnifiedUnifiedUnified useruseruseruser interfaceinterfaceinterfaceinterface
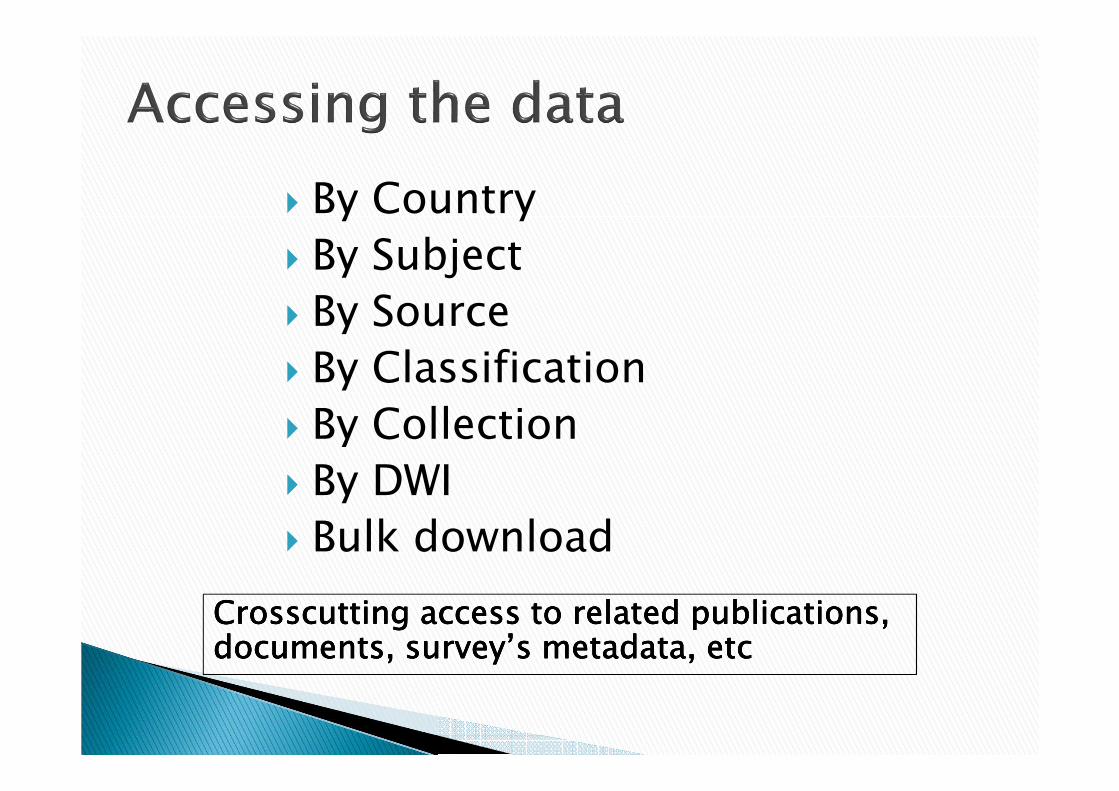
� By Country
� By Subject
� By Source
� By Classification
� By Collection
� By DWI
� Bulk download
Crosscutting access to related publications, Crosscutting access to related publications, Crosscutting access to related publications, Crosscutting access to related publications, documents, survey’s metadata, documents, survey’s metadata, documents, survey’s metadata, documents, survey’s metadata, etcetcetcetc
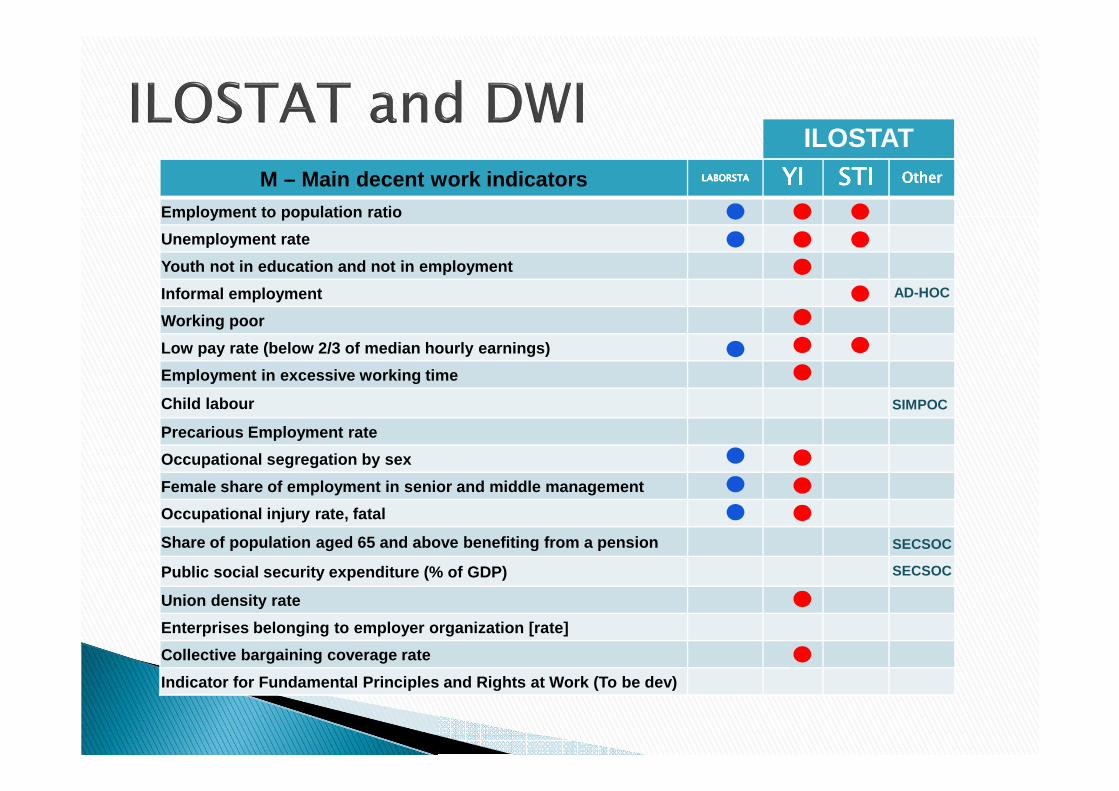
M – Main decent work indicators LABORSTALABORSTALABORSTALABORSTA YIYIYIYI STISTISTISTI OtherOtherOtherOther
Employment to population ratio
Unemployment rate
Youth not in education and not in employment
Informal employment
Working poor
Low pay rate (below 2/3 of median hourly earnings)
Employment in excessive working time
Child labour
Precarious Employment rate
Occupational segregation by sex
Female share of employment in senior and middle man agement
Occupational injury rate, fatal
Share of population aged 65 and above benefiting fr om a pension
Public social security expenditure (% of GDP)
Union density rate
Enterprises belonging to employer organization [rate ]
Collective bargaining coverage rate
Indicator for Fundamental Principles and Rights at Work (To be dev)
AD-HOC
SIMPOC
SECSOC
SECSOC
ILOSTAT
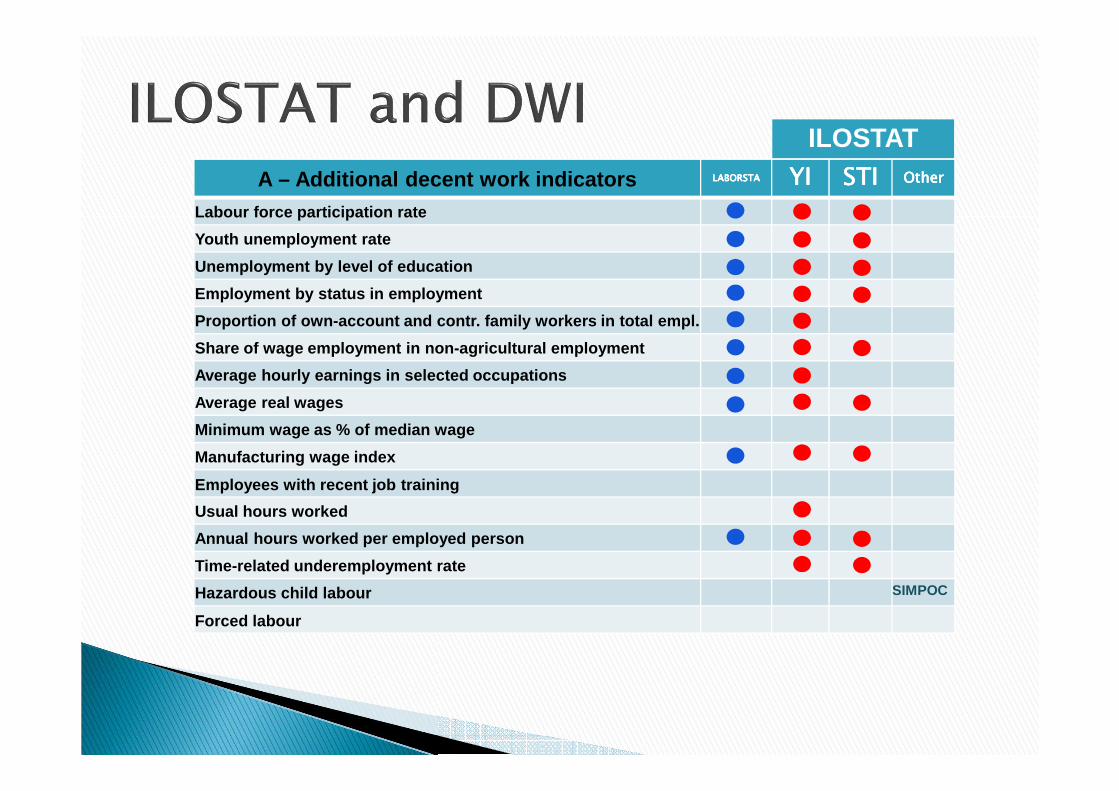
A – Additional decent work indicators LABORSTALABORSTALABORSTALABORSTA YIYIYIYI STISTISTISTI OtherOtherOtherOther
Labour force participation rate
Youth unemployment rate
Unemployment by level of education
Employment by status in employment
Proportion of own-account and contr. family workers in total empl.
Share of wage employment in non-agricultural employ ment
Average hourly earnings in selected occupations
Average real wages
Minimum wage as % of median wage
Manufacturing wage index
Employees with recent job training
Usual hours worked
Annual hours worked per employed person
Time-related underemployment rate
Hazardous child labour
Forced labour
SIMPOC
ILOSTAT
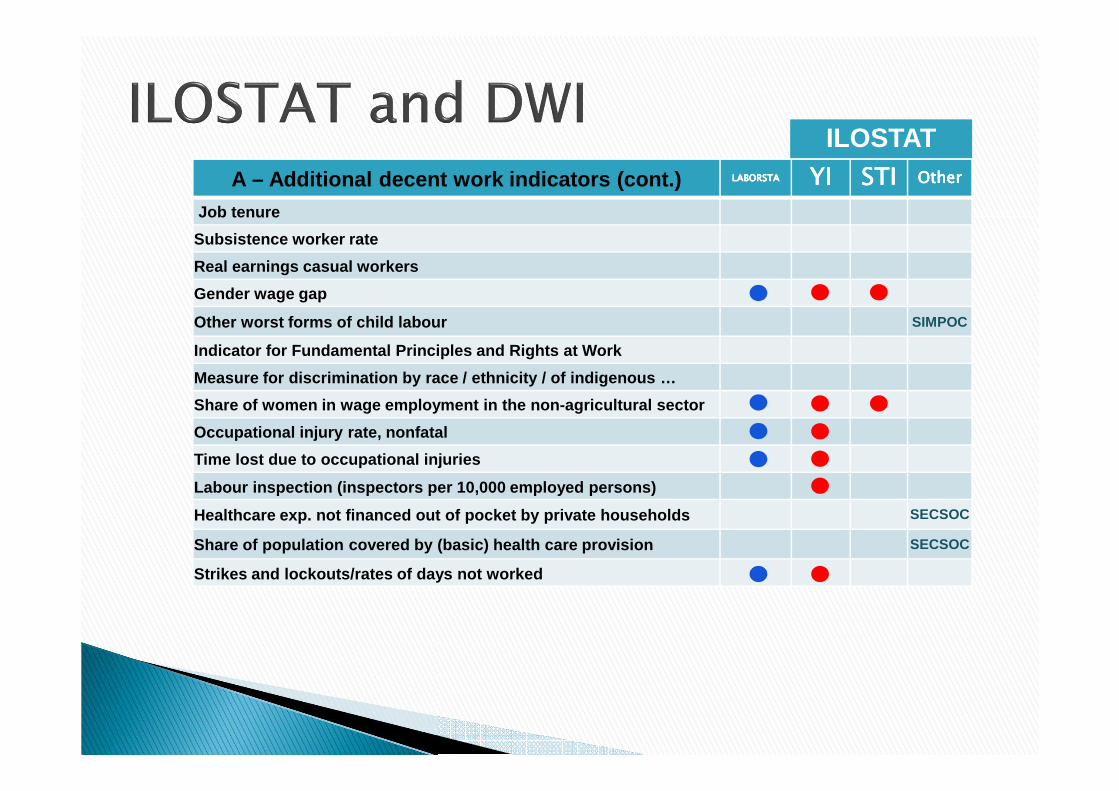
A – Additional decent work indicators (cont.) LABORSTALABORSTALABORSTALABORSTA YIYIYIYI STISTISTISTI OtherOtherOtherOther
Job tenure
Subsistence worker rate
Real earnings casual workers
Gender wage gap
Other worst forms of child labour
Indicator for Fundamental Principles and Rights at Work
Measure for discrimination by race / ethnicity / of indigenous …
Share of women in wage employment in the non-agricu ltural sector
Occupational injury rate, nonfatal
Time lost due to occupational injuries
Labour inspection (inspectors per 10,000 employed pe rsons)
Healthcare exp. not financed out of pocket by priva te households
Share of population covered by (basic) health care provision
Strikes and lockouts/rates of days not worked
SECSOC
SECSOC
ILOSTAT
SIMPOC
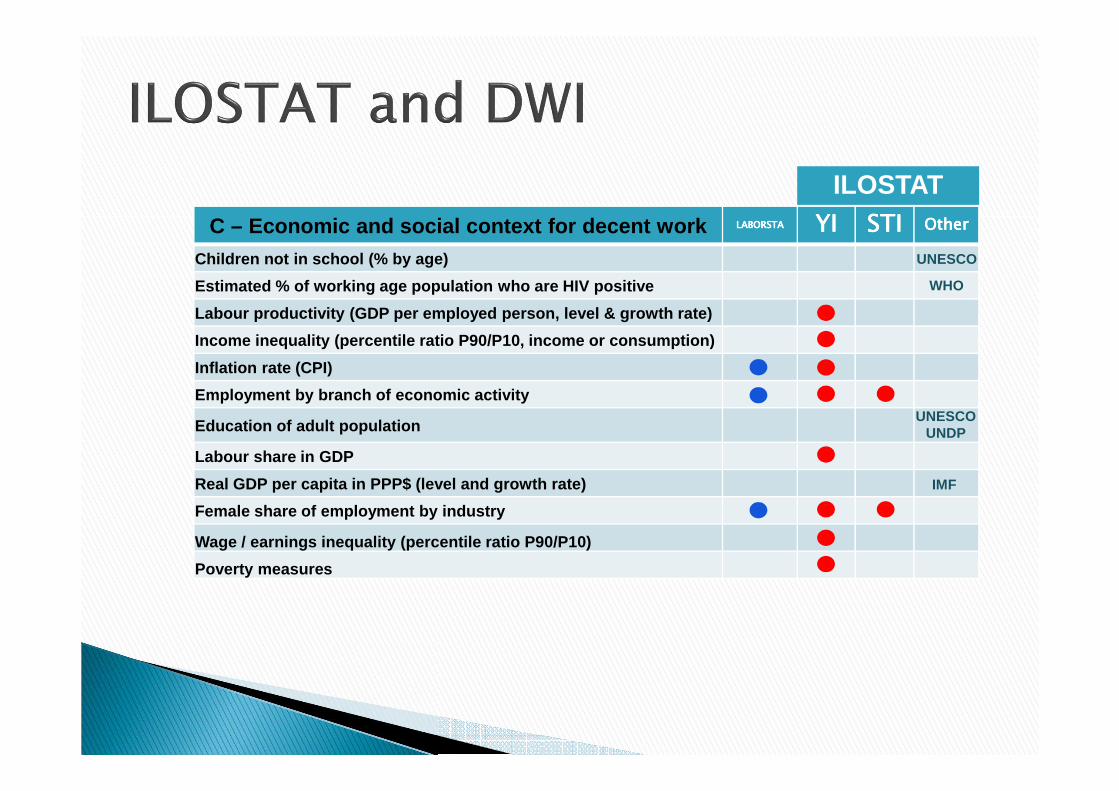
C – Economic and social context for decent work LABORSTALABORSTALABORSTALABORSTA YIYIYIYI STISTISTISTI OtherOtherOtherOther
Children not in school (% by age)
Estimated % of working age population who are HIV p ositive
Labour productivity (GDP per employed person, level & growth rate)
Income inequality (percentile ratio P90/P10, income or consumption)
Inflation rate (CPI)
Employment by branch of economic activity
Education of adult population
Labour share in GDP
Real GDP per capita in PPP$ (level and growth rate)
Female share of employment by industry
Wage / earnings inequality (percentile ratio P90/P1 0)
Poverty measures
UNESCO
WHO
UNESCOUNDP
IMF
ILOSTAT
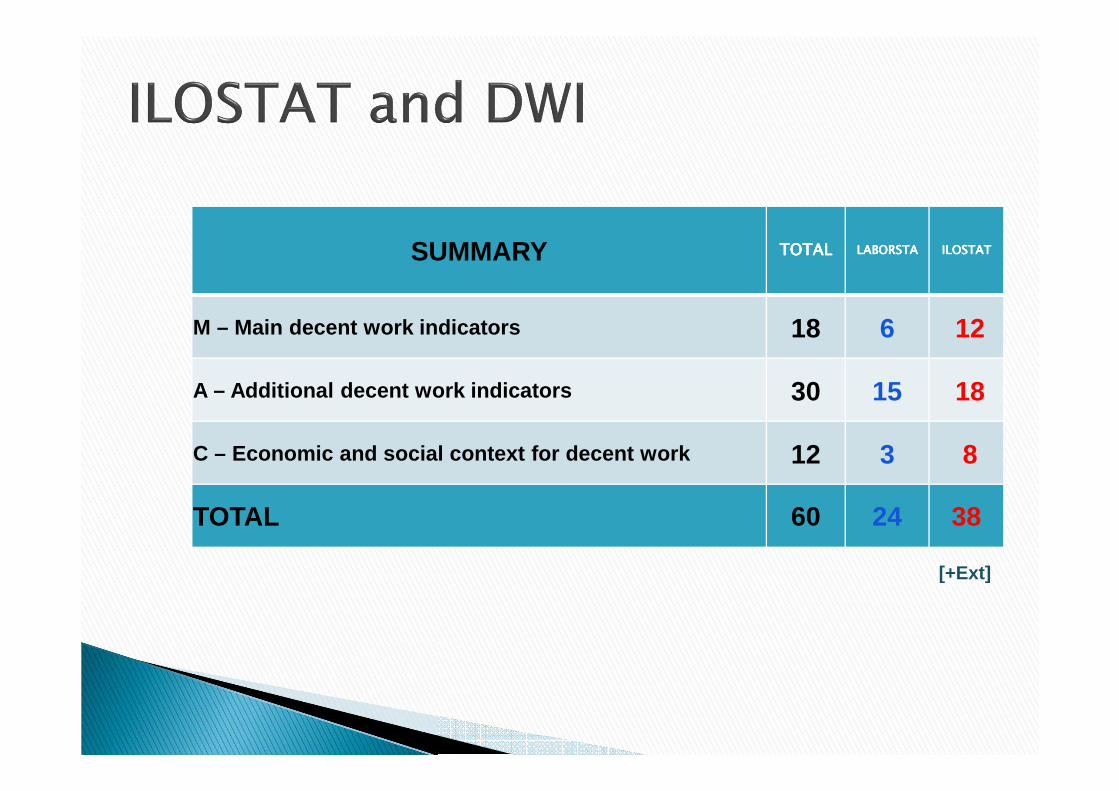
SUMMARY TOTALTOTALTOTALTOTAL LABORSTALABORSTALABORSTALABORSTA ILOSTATILOSTATILOSTATILOSTAT
M – Main decent work indicators 18 6 12
A – Additional decent work indicators 30 15 18
C – Economic and social context for decent work 12 3 8
TOTAL 60 24 38
[+Ext]
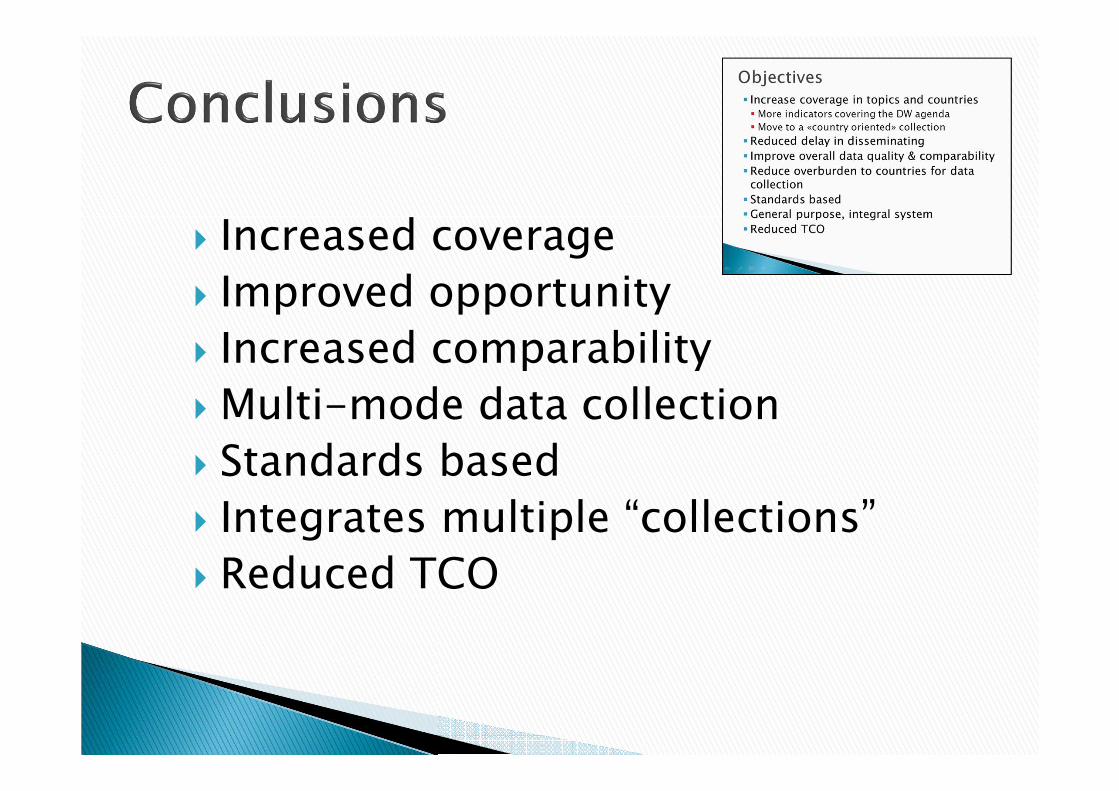
� Increased coverage
� Improved opportunity
� Increased comparability
� Multi-mode data collection
� Standards based
� Integrates multiple “collections”
� Reduced TCO
EEEE----mail:mail:mail:mail:[email protected]
Skype:Skype:Skype:Skype:egreising
Twitter: Twitter: Twitter: Twitter: egreising
LinkedIn: LinkedIn: LinkedIn: LinkedIn: http://www.linkedin.com/in/egreising
EEEE----mail:mail:mail:mail:[email protected]
Skype:Skype:Skype:Skype:egreising
Twitter: Twitter: Twitter: Twitter: egreising
LinkedIn: LinkedIn: LinkedIn: LinkedIn: http://www.linkedin.com/in/egreising