Embed Size (px)
Citation preview
8/8/2019 EDU - IRS 1
http://slidepdf.com/reader/full/edu-irs-1 1/7
8/8/2019 EDU - IRS 1
http://slidepdf.com/reader/full/edu-irs-1 2/7
Education RFW + IRS - English - FINAL.doc 2
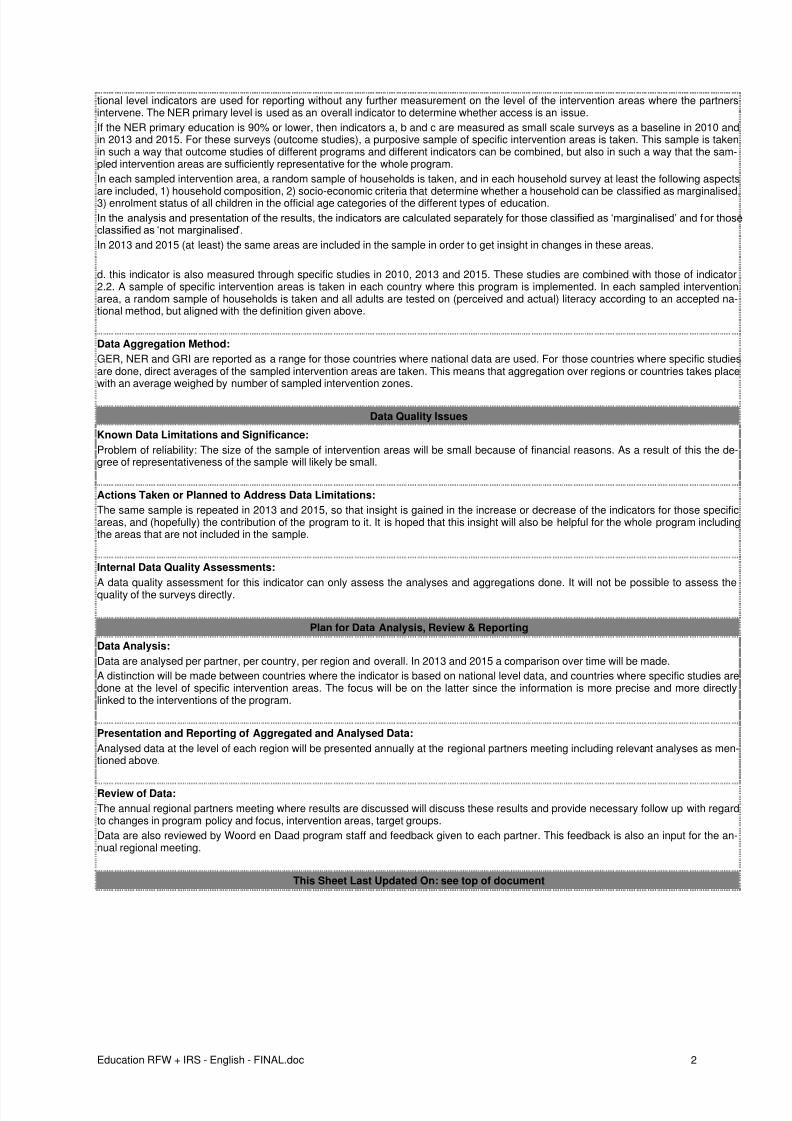
tional level indicators are used for reporting without any further measurement on the level of the intervention areas where the partnersintervene. The NER primary level is used as an overall indicator to determine whether access is an issue.
If the NER primary education is 90% or lower, then indicators a, b and c are measured as small scale surveys as a baseline in 2010 andin 2013 and 2015. For these surveys (outcome studies), a purposive sample of specific intervention areas is taken. This sample is takenin such a way that outcome studies of different programs and different indicators can be combined, but also in such a way that the sam-pled intervention areas are sufficiently representative for the whole program.
In each sampled intervention area, a random sample of households is taken, and in each household survey at least the following aspects
are included, 1) household composition, 2) socio-economic criteria that determine whether a household can be classified as marginalised,3) enrolment status of all children in the official age categories of the different types of education.
In the analysis and presentation of the results, the indicators are calculated separately for those classified as ‘marginalised’ and for thoseclassified as ‘not marginalised’.
In 2013 and 2015 (at least) the same areas are included in the sample in order to get insight in changes in these areas.
d. this indicator is also measured through specific studies in 2010, 2013 and 2015. These studies are combined with those of indicator2.2. A sample of specific intervention areas is taken in each country where this program is implemented. In each sampled interventionarea, a random sample of households is taken and all adults are tested on (perceived and actual) literacy according to an accepted na-tional method, but aligned with the definition given above.
Data Aggregation Method:
GER, NER and GRI are reported as a range for those countries where national data are used. For those countries where specific studiesare done, direct averages of the sampled intervention areas are taken. This means that aggregation over regions or countries takes placewith an average weighed by number of sampled intervention zones.
Data Quality Issues
Known Data Limitations and Significance:
Problem of reliability: The size of the sample of intervention areas will be small because of financial reasons. As a result of this the de-gree of representativeness of the sample will likely be small.
Actions Taken or Planned to Address Data Limitations:
The same sample is repeated in 2013 and 2015, so that insight is gained in the increase or decrease of the indicators for those specificareas, and (hopefully) the contribution of the program to it. It is hoped that this insight will also be helpful for the whole program includingthe areas that are not included in the sample.
Internal Data Quality Assessments:
A data quality assessment for this indicator can only assess the analyses and aggregations done. It will not be possible to assess thequality of the surveys directly.
Plan for Data Analysis, Review & Reporting
Data Analysis:
Data are analysed per partner, per country, per region and overall. In 2013 and 2015 a comparison over time will be made.
A distinction will be made between countries where the indicator is based on national level data, and countries where specific studies aredone at the level of specific intervention areas. The focus will be on the latter since the information is more precise and more directlylinked to the interventions of the program.
Presentation and Reporting of Aggregated and Analysed Data:
Analysed data at the level of each region will be presented annually at the regional partners meeting including relevant analyses as men-tioned above.
Review of Data:
The annual regional partners meeting where results are discussed will discuss these results and provide necessary follow up with regardto changes in program policy and focus, intervention areas, target groups.
Data are also reviewed by Woord en Daad program staff and feedback given to each partner. This feedback is also an input for the an-nual regional meeting.
This Sheet Last Updated On: see top of document
8/8/2019 EDU - IRS 1
http://slidepdf.com/reader/full/edu-irs-1 3/7
Education RFW + IRS - English - FINAL.doc 3
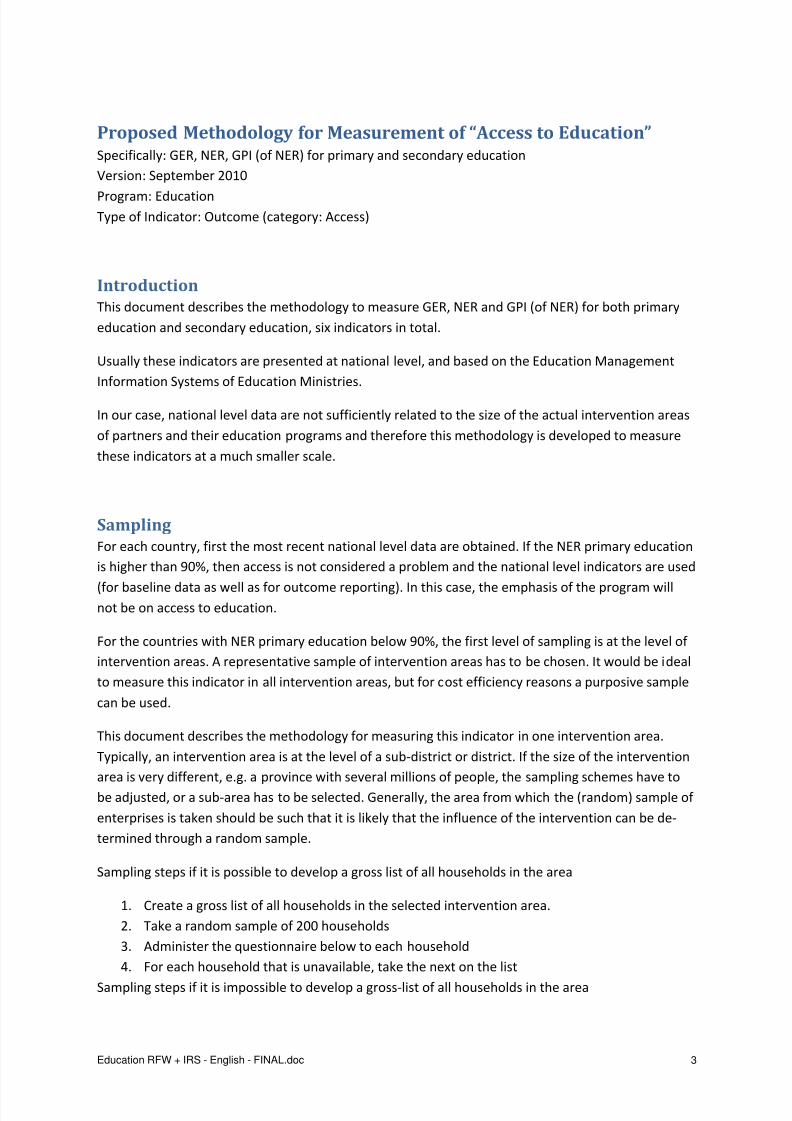
Proposed Methodology for Measurement of “Access to Education” Specifically: GER, NER, GPI (of NER) for primary and secondary education
Version: September 2010
Program: EducationType of Indicator: Outcome (category: Access)
Introduction
This document describes the methodology to measure GER, NER and GPI (of NER) for both primary
education and secondary education, six indicators in total.
Usually these indicators are presented at national level, and based on the Education Management
Information Systems of Education Ministries.
In our case, national level data are not sufficiently related to the size of the actual intervention areas
of partners and their education programs and therefore this methodology is developed to measure
these indicators at a much smaller scale.
Sampling
For each country, first the most recent national level data are obtained. If the NER primary education
is higher than 90%, then access is not considered a problem and the national level indicators are used
(for baseline data as well as for outcome reporting). In this case, the emphasis of the program willnot be on access to education.
For the countries with NER primary education below 90%, the first level of sampling is at the level of
intervention areas. A representative sample of intervention areas has to be chosen. It would be ideal
to measure this indicator in all intervention areas, but for cost efficiency reasons a purposive sample
can be used.
This document describes the methodology for measuring this indicator in one intervention area.
Typically, an intervention area is at the level of a sub-district or district. If the size of the intervention
area is very different, e.g. a province with several millions of people, the sampling schemes have to
be adjusted, or a sub-area has to be selected. Generally, the area from which the (random) sample of
enterprises is taken should be such that it is likely that the influence of the intervention can be de-
termined through a random sample.
Sampling steps if it is possible to develop a gross list of all households in the area
1. Create a gross list of all households in the selected intervention area.
2. Take a random sample of 200 households
3. Administer the questionnaire below to each household
4. For each household that is unavailable, take the next on the list
Sampling steps if it is impossible to develop a gross-list of all households in the area
8/8/2019 EDU - IRS 1
http://slidepdf.com/reader/full/edu-irs-1 4/7
Education RFW + IRS - English - FINAL.doc 4
1. Estimate the total number of households in the selected intervention area.
2. Determine x as this total number divided by 200 (e.g. if there are an estimated 1000 house-
holds, then x = 1000 / 200 = 5). Round to the closest integer (no decimals).
3. Take the first digit y of a random number.
4. Find the yth
household from any logical starting point and take any xth
next household on the
route you follow until you have selected a total of 200 households.
5. Check roughly if you have covered the whole intervention area. E.g. if you have found the
200 households in one village in an intervention area of 25 villages, it indicates you have
made a mistake at step 1.
If this method is also not possible, e.g. for reasons of distance or costs, cluster sampling can be used:
random selection of a number of clusters: small geographic units (e.g. villages, neighbourhoods),
such that for each cluster a complete list of households can be made. All households in the selected
cluster should be included in the sample. The number of randomly selected clusters should be cho-
sen in such a way that the total number of households in the sample reaches 200.
This sampling method can be slightly adapted by taking each second or third household in the cluster(and thus selecting some more clusters).
If there are good statistical reasons to deviate from this sample size (e.g. a very small intervention
area), this should be explained and justified.
Tool
Before administering the tool in an intervention area, the consultant and the partner have to find
one or two easy-to-see, locally defined characteristics to determine if a household can be classified
as marginalized.
In order to calculate GER and NER, the official ages for primary / secondary education are used. The
UNESCO global education database statistics are used for this purpose.
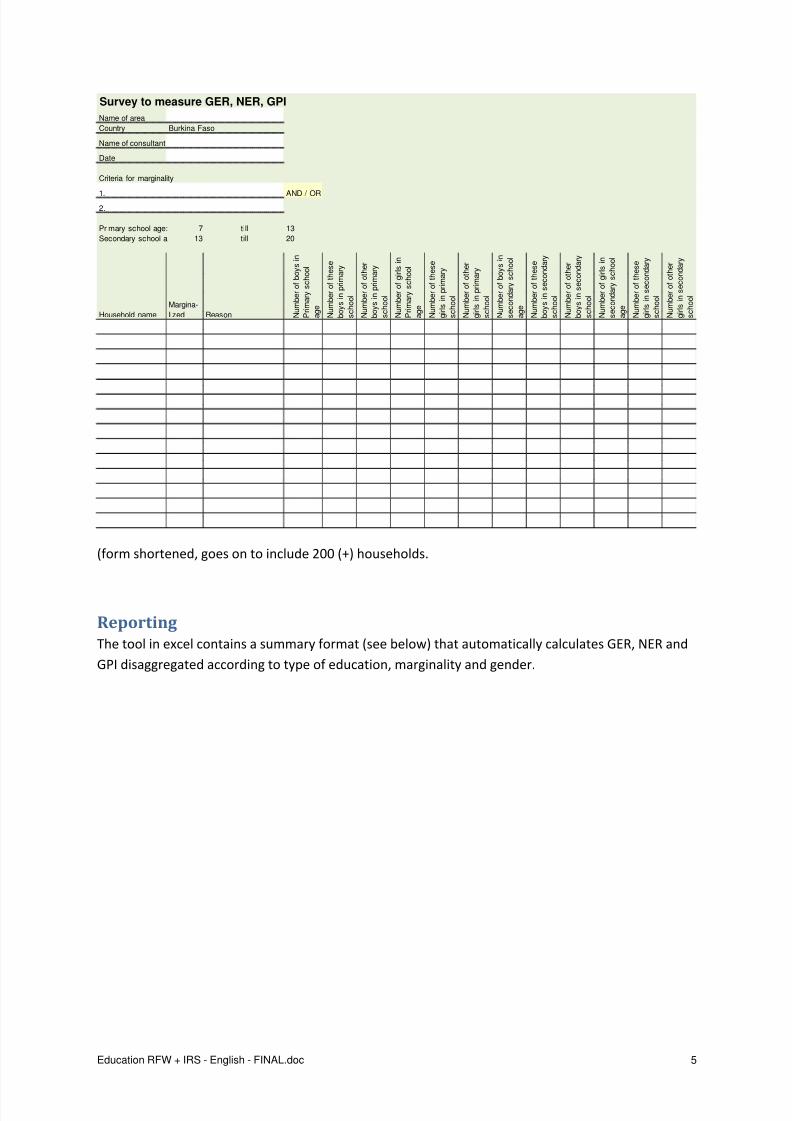
A survey format is developed on which the data for each household can be entered, see below.
8/8/2019 EDU - IRS 1
http://slidepdf.com/reader/full/edu-irs-1 5/7
Education RFW + IRS - English - FINAL.doc 5
Survey to measure GER, NER, GPI
Name of area
Country
Name of consultant
Date
Criteria for marginality
1. AND / OR2.
Primary school age: 7 till 13
Secondary school a 13 till 20
Household name
Margina-
lized Reason N u m b e r o f b o y s i n
P r i m a r y s c h o o l
a g e
N u m b e r o f t h e s e
b o y s i n p r i m a r y
s c h o o l
N u m b e r o f o t h e r
b o y s i n p r i m a r y
s c h o o l
N u m b e r o f g i r l s i n
P r i m a r y s c h o o l
a g e
N u m b e r o f t h e s e
g i r l s i n p r i m a r y
s c h o o l
N u m b e r o f o t h e r
g i r l s i n p r i m a r y
s c h o o l
N u m b e r o f b o y s i n
s e c o n d a r y s c h o o l
a g e
N u m b e r o f t h e s e
b o y s i n s e c o n d a r y
s c h o o l
N u m b e r o f o t h e r
b o y s i n s e c o n d a r y
s c h o o l
N u m b e r o f g i r l s i n
s e c o n d a r y s c h o o l
a g e
N u m b e r o f t h e s e
g i r l s i n s e c o n d a r y
s c h o o l
N u m b e r o f o t h e r
g i r l s i n s e c o n d a r y
s c h o o l
Burkina Faso
(form shortened, goes on to include 200 (+) households.
Reporting
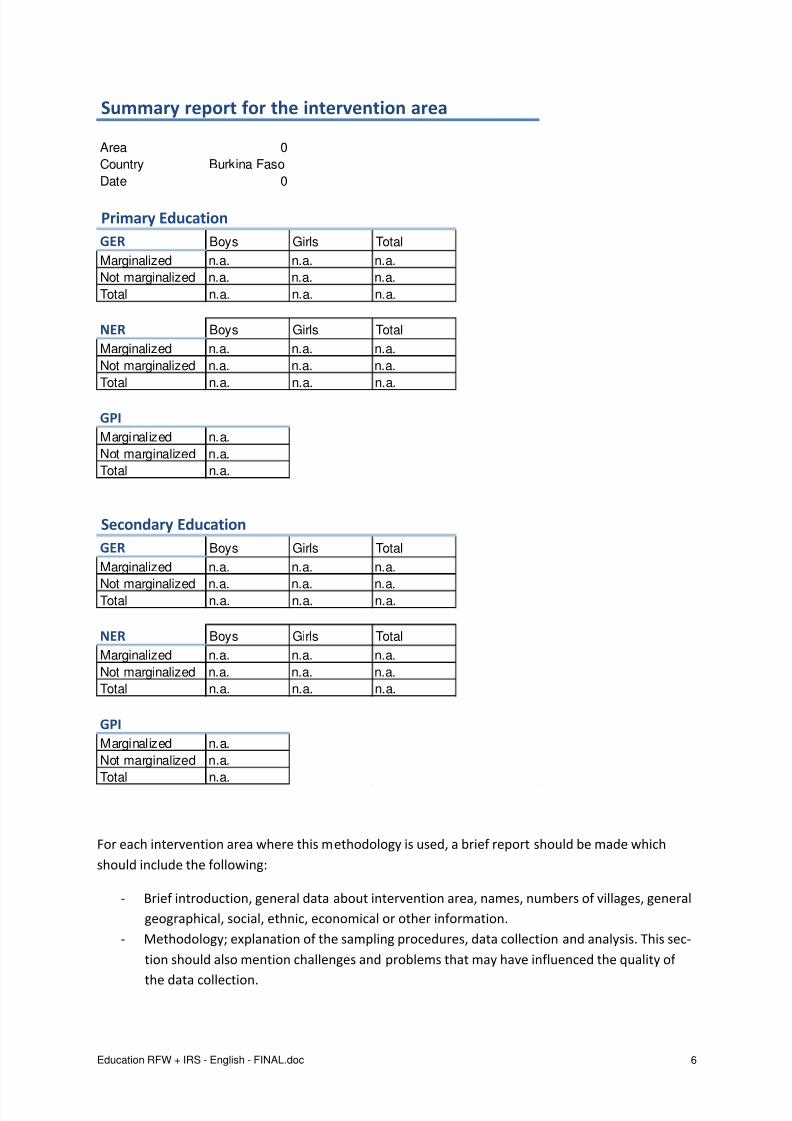
The tool in excel contains a summary format (see below) that automatically calculates GER, NER and
GPI disaggregated according to type of education, marginality and gender.
8/8/2019 EDU - IRS 1
http://slidepdf.com/reader/full/edu-irs-1 6/7
Education RFW + IRS - English - FINAL.doc 6
Summary report for the intervention area
Area 0
Country Burkina Faso
Date 0
Primary Education
GER Boys Girls Total
Marginalized n.a. n.a. n.a.
Not marginalized n.a. n.a. n.a.
Total n.a. n.a. n.a.
NER Boys Girls Total
Marginalized n.a. n.a. n.a.
Not marginalized n.a. n.a. n.a.
Total n.a. n.a. n.a.
GPI
Marginalized n.a.
Not marginalized n.a.
Total n.a.
Secondary Education
GER Boys Girls Total
Marginalized n.a. n.a. n.a.
Not marginalized n.a. n.a. n.a.Total n.a. n.a. n.a.
NER Boys Girls Total
Marginalized n.a. n.a. n.a.
Not marginalized n.a. n.a. n.a.
Total n.a. n.a. n.a.
GPI
Marginalized n.a.
Not marginalized n.a.
Total n.a.
For each intervention area where this methodology is used, a brief report should be made which
should include the following:
- Brief introduction, general data about intervention area, names, numbers of villages, general
geographical, social, ethnic, economical or other information.
- Methodology; explanation of the sampling procedures, data collection and analysis. This sec-
tion should also mention challenges and problems that may have influenced the quality of
the data collection.
8/8/2019 EDU - IRS 1
http://slidepdf.com/reader/full/edu-irs-1 7/7
Education RFW + IRS - English - FINAL.doc 7
- Findings and analyses, presenting the distribution of the different types of enterprises, the
overall percentage of enterprises with sufficient access to resources, and relevant analyses of
which types of resources are mentioned, the weighing attached to the different resources
and differences in access to different types of resources.
The raw data always have to be submitted in Excel format.
![HNgoztechnika.hu/keszletlista/pdf/572.pdf · 0puphfvwvh nnfrv]dniwovdr +dwwipnun,p2h6 u '1 )7 )7 )7 )7 )7 edu edu edu edu edu edu edu edu edu](https://img.pdfslide.tips/doc/110x75/5fc6730ab5393d30f166460f/0puphfvwvh-nnfrvdniwovdr-dwwipnunp2h6-u-1-7-7-7-7-7-edu-edu-edu-edu-edu.jpg)