Embed Size (px)
Citation preview

Biopotential AmplifiersBiopotential Amplifiers
ECG Amplifier

Basic RequirementsBasic Requirements
• Essential function of a biopotential amplifier is to take a weak electric signals of biological origin and increase its amplifier
• They must have high input impedance so that they provide minimal loading to avoid distortion of the signal. Typical input impedances are 1MΩ.
• Input circuit must provide protection. No currents must appear at the input terminals.
• Output circuit is primarily used to drive the amplifier load –output impedance should be low.p p
• Biopotential amplifiers must be designed to be optimal in a particular frequency range as needed by the signal to obtain optimal signal to noise ratios.p g

ECG Recording System
• The first stage is a transducer (AgCl electrode), which i l i l l h l i i hconvert ECG into electrical voltage. The voltage is in the
range of 1 mV ~ 5 mV
• The second stage is an instrumentation amplifier, whichThe second stage is an instrumentation amplifier, which has a very high CMRR (90dB) and high gain (1000)
• Opto‐coupler to isolate the input and output of amplifier by converting the electrical signal to light and then back
• Bandpass filter of 0.04 Hz to 150 Hz filter. Normally implemented by cascading a low‐pass filter and a highimplemented by cascading a low pass filter and a high pass filter.

Cardiac Vector• Heart generates an electrical signal
• Electrical activity of the heart can be modeled as an electric dipole located in a conducting medium where a dipole consists of points of equal positive and negative charge separated from one another and is denoted by the dipole moment
• The dipole moment is a vector from negative charge to positive charge having the magnitude proportional to the separation of these charges.
• This dipole moment is called the cardiac vector, represented by M
• Its magnitude and direction vary during the cardiac cycle as the dipole field varies itself.
• The cardiac vector indicates the direction of the depolarization in time.

We want to capture the cardiac vector M by looking t t t
Va1=M.a1=|M| cosθat vector components .
We can do that bya2
MWe can do that by connecting leads on the surface of the body to d b l h
a1 θ
detect biopotentials, then the voltage difference introduced in the lead is the
Figure 6 2 Relationships between the two lead
υa1
+introduced in the lead is the projection of the cardiac vector
Figure 6.2 Relationships between the two lead vectors a1 and a2 and the cardiac vector M. The component of M in the direction of a1 is given by the dot product of these two vectors and denoted
A lead is defined as a connection between 2
on the figure by val. Lead vector a2 is perpendicular to the cardiac vector, so no voltage component is
seen in this lead.
connection between 2 electrodes placed on the body

Example of Leads – Eindhoven’s triangle
• Connection between 2 electrodes Th i l d• The primary leads are– Lead I: LA to RALead II: LL to RA– Lead II: LL to RA
– Lead III: LL to LA – RL for groundRL for ground
• For a lead II system which is very common, LL and RA are y ,fed to the inputs of the instrumentation ‐diff ti l lifi I+III=IIdifferential amplifier I+III=II

Concept of Wilson’s Central Terminal• Wilson et al. suggested the use
of the central terminal as a reference for measuring thereference for measuring the electrode potentials
• This reference was formed by connecting a 5 kW resistor from the limb electrode to the common pointcommon point.
• Wilson’s terminal is not ground – but the average of the limb potentials with the total current at this point to be zero
• There are other leadThere are other lead configurations called Augmented Leads

Other Leads – Augmented For signal augmentation – Disconnect the unipolarelectrode you are measuring from the wilson’sy gterminal and then measure

Chest Leads
V1‐V6 Chest leadsV3‐V4 best for septal defects
The most commonly used clinical ECG‐system, the 12‐lead ECG system, consists of the following 12 leads whichthe following 12 leads, which are:
I, II, III
aVR, aVL, aVF
V1, V2, V3, V4, V5, V6
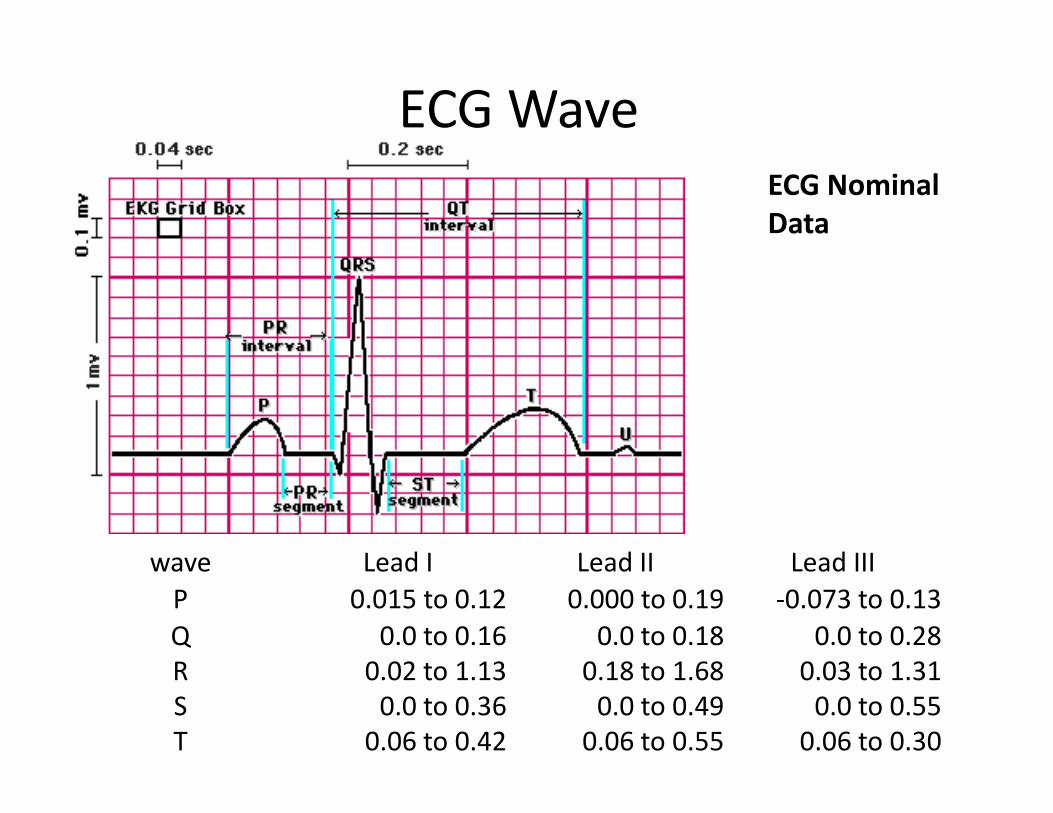
ECG WaveECG Nominal Data
wave Lead I Lead II Lead IIIwave Lead I Lead II Lead IIIP 0.015 to 0.12 0.000 to 0.19 ‐0.073 to 0.13 Q 0.0 to 0.16 0.0 to 0.18 0.0 to 0.28 R 0 02 t 1 13 0 18 t 1 68 0 03 t 1 31R 0.02 to 1.13 0.18 to 1.68 0.03 to 1.31 S 0.0 to 0.36 0.0 to 0.49 0.0 to 0.55 T 0.06 to 0.42 0.06 to 0.55 0.06 to 0.30
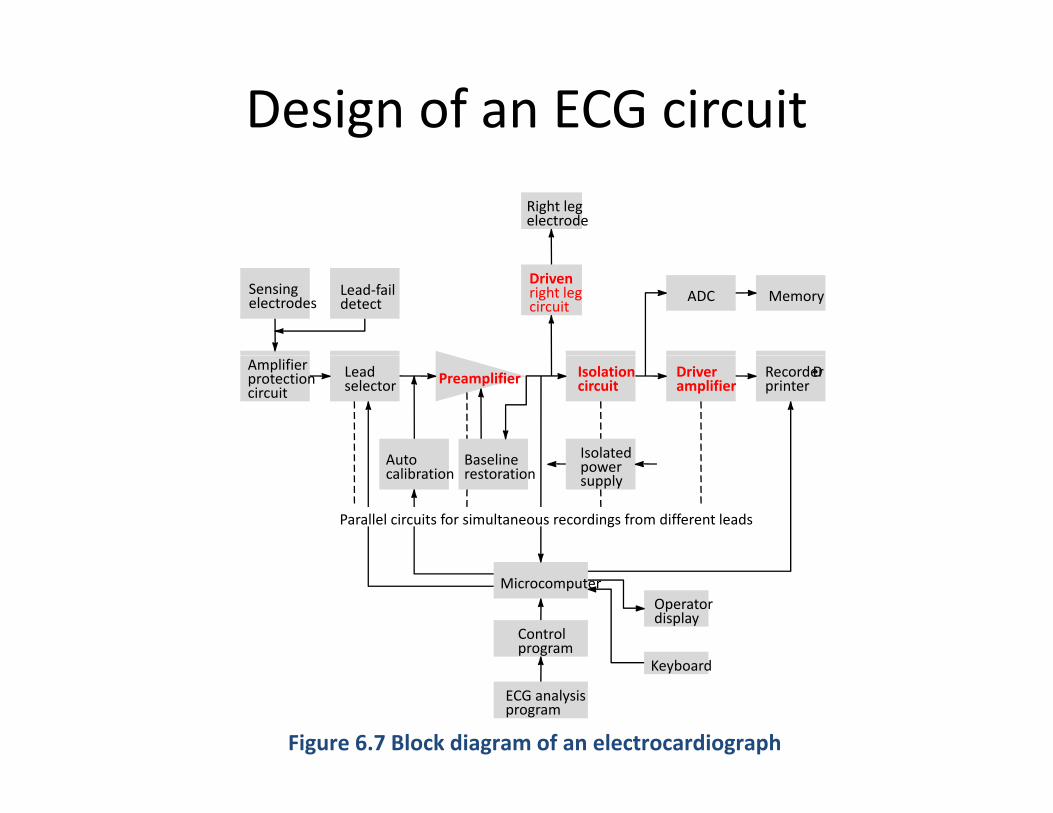
Design of an ECG circuit
Right legelectrode
Drivenright legcircuit
Sensingelectrodes
Lead‐faildetect ADC Memory
Amplifierprotectioncircuit
Leadselector Preamplifier
Auto Baseline Isolated
Isolationcircuit
Driveramplifier
RecorderÐprinter
Autocalibration
Baselinerestoration power
supply
Parallel circuits for simultaneous recordings from different leads
Controlprogram
MicrocomputerOperatordisplay
Ke board
Figure 6.7 Block diagram of an electrocardiograph
ECG analysisprogram
Keyboard

Main Components of the ECG CircuitPreamplifier
‐Initial Amplification
‐Needs very high I/P impedance
‐High CMRR
‐Typically, it is a 3 opamp
Isolation circuitry
‐Blocks the ECG from power line frequencies
differential amplifier with a gain control switch
eque c es
Driven right leg circuit
Provides a reference point on theDriver Amplifier
‐Amplification of the ECG signal for appropriate recording
‐Provides a reference point on the body instead of ground
appropriate recording

Preamplifier DesignDesign Specificationsg p
Amplification Range: 20‐2000Frequency Range (0.05‐150Hz)High Input Impedance 2.5MΩ
Hi h CMRR (E 60dB)High CMRR (Ex 60dB)
Step 1: Single Opamp Differential Amplifier
For this differential amplifier
For a CMRR>60dB or CMRR>1000
VOUT = (V1 – V2)R4/R3
For a CMRR>60dB or CMRR>1000 Gd/Gc>1000Gd is governed by R4/R3 if we choose R4=47K and R3=10K Gd=4 7 andR4 47K and R3 10K, Gd 4.7 and Gc=0.0047 which is good Common Mode rejection. We can replace R4 in this circuit by a potentiometer to y padjust to increase common mode rejection.

Preamplifier Design Cont.• Step 2: Consider the 2 opamp stage and design it for high gain
VOUT = (V1 – V2)(1+2R2/R1) VOUT
Gain= 1+2R2/R1
If we choose R2=22K and R1=10K thenIf we choose R2 22K and R1 10K, then gain=(1+(2*22)/10))=5.4
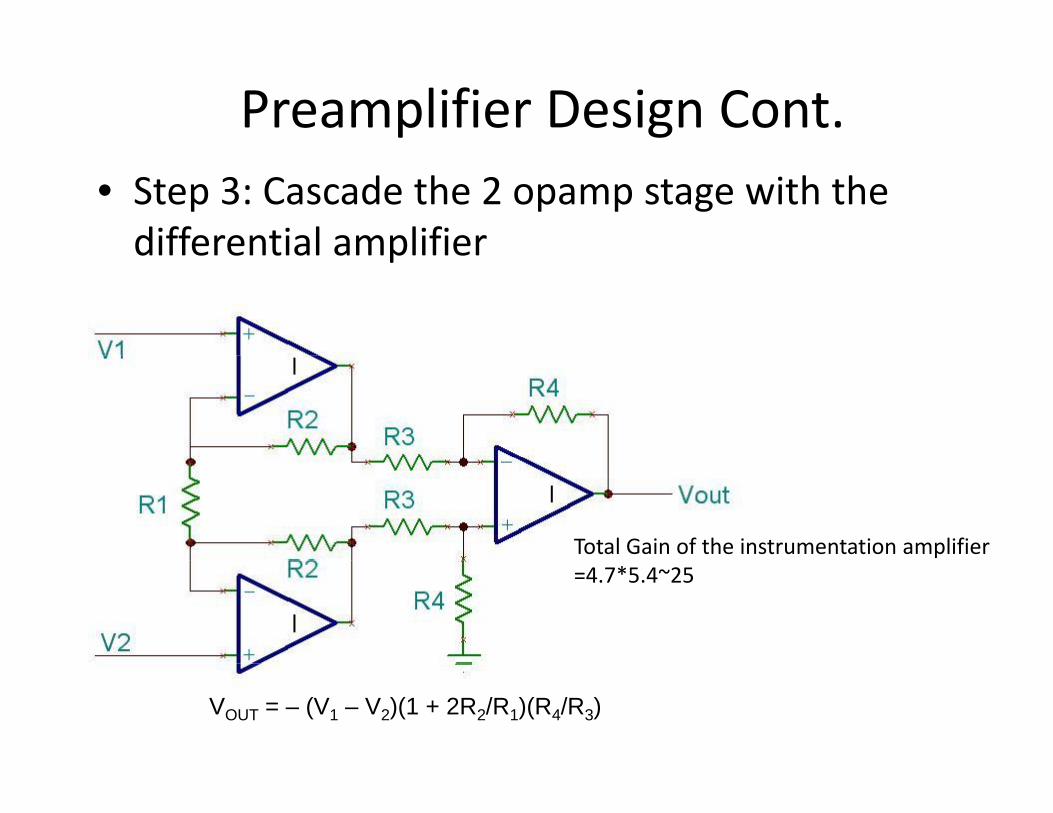
Preamplifier Design Cont.• Step 3: Cascade the 2 opamp stage with the differential amplifierdifferential amplifier
Total Gain of the instrumentation amplifier =4.7*5.4~25
VOUT = – (V1 – V2)(1 + 2R2/R1)(R4/R3)

Preamplifier with FilteringSTEP5
Low Pass f=1/(2*pi*RC)~106HzTruncatesTruncatesfrequencies>106Hz
Non‐inverting amplifierGain=(1+150K/4.7K)~32
STEP6
( / )Total Gain=25*32=800
High Pass τ=RC=3.3sf=1/(2*pi*RC)~0.05Hz
STEP4
Passes frequencies>0.05Hz
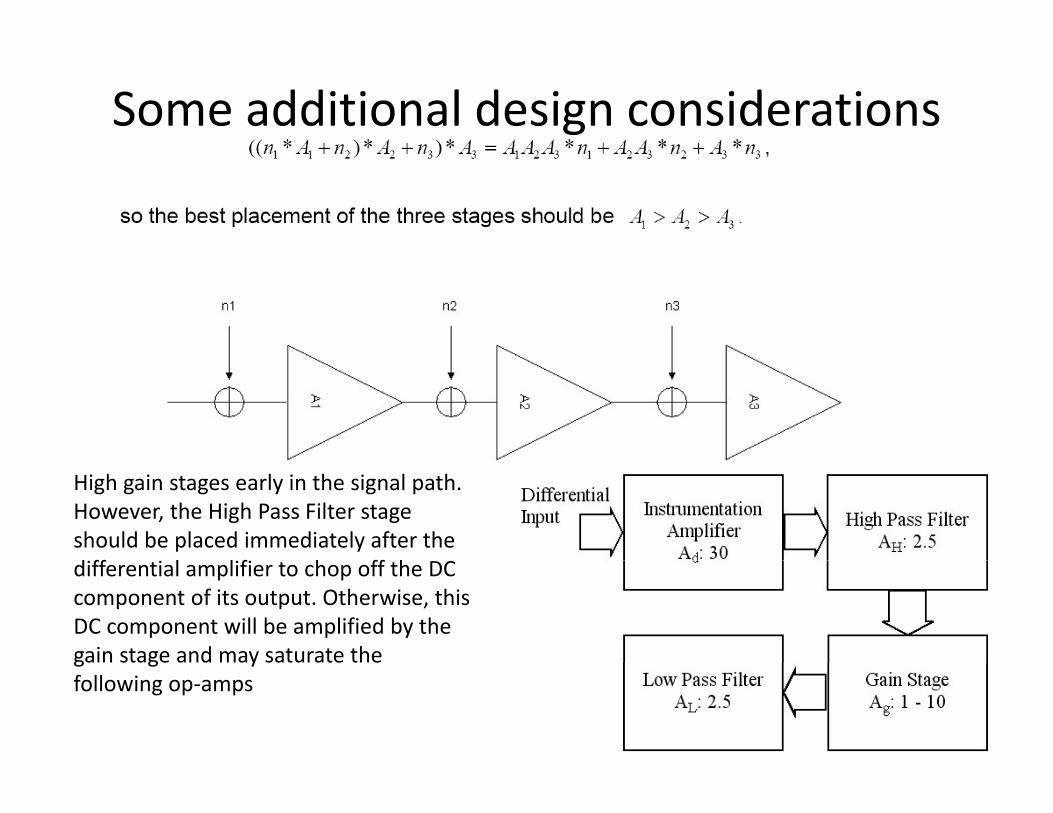
Some additional design considerations
High gain stages early in the signal path. However, the High Pass Filter stageshould be placed immediately after the d ff l l f h ff hdifferential amplifier to chop off the DCcomponent of its output. Otherwise, this DC component will be amplified by thegain stage and may saturate the g g yfollowing op‐amps
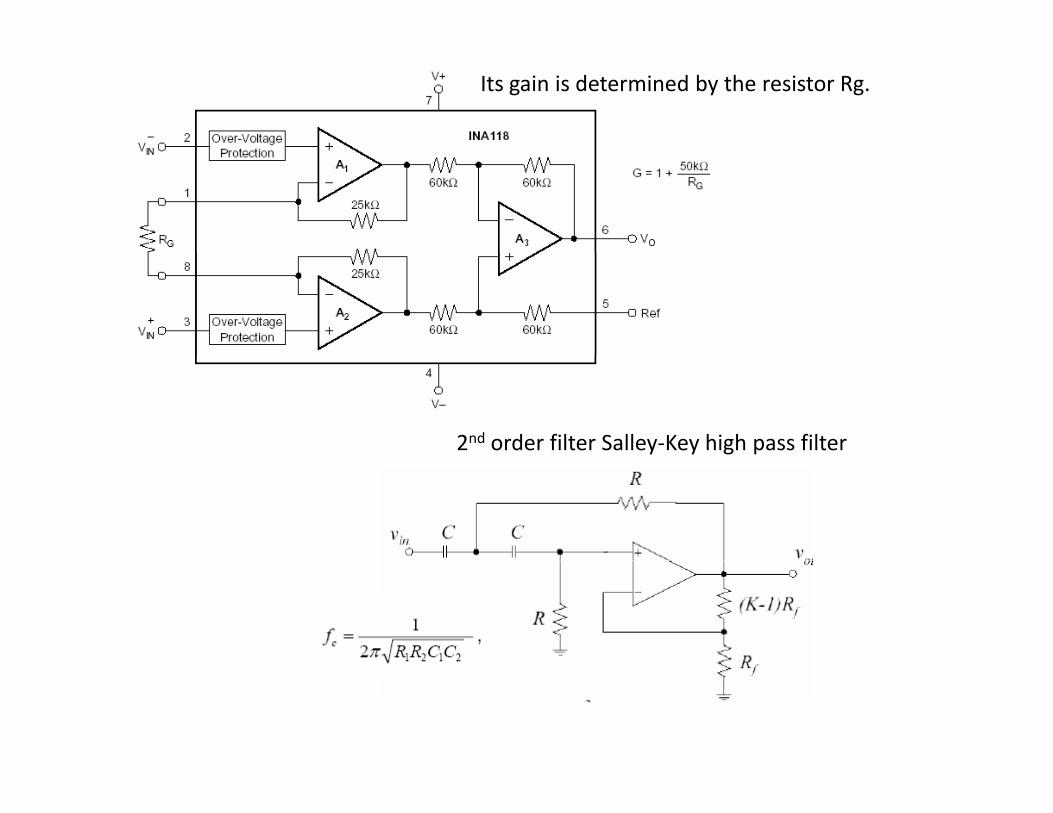
Its gain is determined by the resistor Rg.
2nd order filter Salley‐Key high pass filter

Power line 120 V
Interference from Electric Devices – Power line interference
Problems with ECG.Power line 120 V
C3C1C2
There is electric field coupling between the power line and the lead wires and/or ECG amplifier. This
interference
A
B
Z1
Z2
Id1
Id2
wires and/or ECG amplifier. This coupling is modeled as a capacitor. It causes a current to flow from the power line through the skin‐electrode
Electrocardiograph
G
impedance through the body to ground. Body impedance is low ~ 500Ω. Hence the voltage VA ‐ VB =
ZG Id1+ Id2
Id1*Z1‐Id2*Z2. If the electrodes are placed close together the currents are approximately the same. VA ‐ VB = Id *(Z Z ) ~120µV if Id is in nA and Figure 6.10 A mechanism of electric‐
field pickup of an electrocardiograph resulting from the power line. Coupling capacitance between the hot side of
Id1*(Z1‐Z2) ~120µV if Id1 is in nA and difference of Z1‐Z2 is in KΩ. This is quite high.This can be minimized by shielding the power line and lead wires causes
current to flow through skin‐electrode impedances on its way to ground.
This can be minimized by shielding the leads and grounding each shield at the ECG unit. Also lowering skin‐electrode impedances may help.

Power line 120 V There is also a possibility of current from the power line
Problems with ECG.Cbidb
to flow through the body as shown causing a common model voltage to appear in the signal.
The magnitude of this signal is V =i *Z Typical valuesElectrocardiograph
A
Zin
Z1υcm
B
υcm
The magnitude of this signal is Vcm=idb ZG. Typical values are 10mV for idb=0.2µA and ZG=50KΩ.
For a perfect amplifier this is no problem as the Z2 B
G
Zin
υcm
differential amplifier with reject the common mode signal. But for real amplifiers with finite input impedance, there is some Vcm that appears in the output
ZGidb
output.
VA‐VB=Vcm ((Z2‐Z1)/Zin) if Z1 and Z2 are <<Zin.
h k l d d b l
Figure 6.11 Current flows from the power line through the body and
d i d th ti
Hence the skin electrode impedances become critical in the design of the biopotential amplifiers . Any imbalance in the input contribute to the common mode signal.
ground impedance, thus creating a common‐mode voltage everywhere on
the body.
Hence we need to keep input impedance high And skin‐electrode impedance equal to remove common mode voltages such as powerline interference
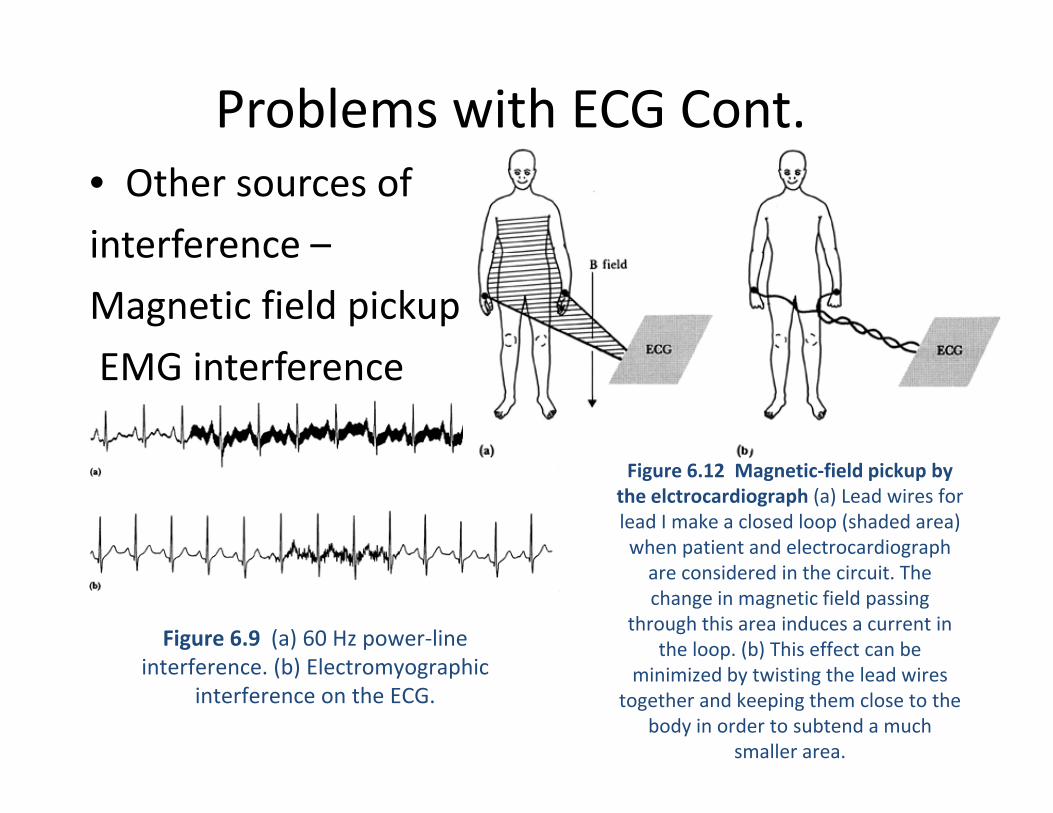
Problems with ECG Cont.• Other sources of
interference –interference
Magnetic field pickup
EMG i t fEMG interference
Figure 6.12 Magnetic‐field pickup by the elctrocardiograph (a) Lead wires for lead I make a closed loop (shaded area) when patient and electrocardiograph
Figure 6.9 (a) 60 Hz power‐line interference (b) Electrom ographic
are considered in the circuit. The change in magnetic field passing
through this area induces a current in the loop. (b) This effect can be
interference. (b) Electromyographicinterference on the ECG.
minimized by twisting the lead wires together and keeping them close to the
body in order to subtend a much smaller area.
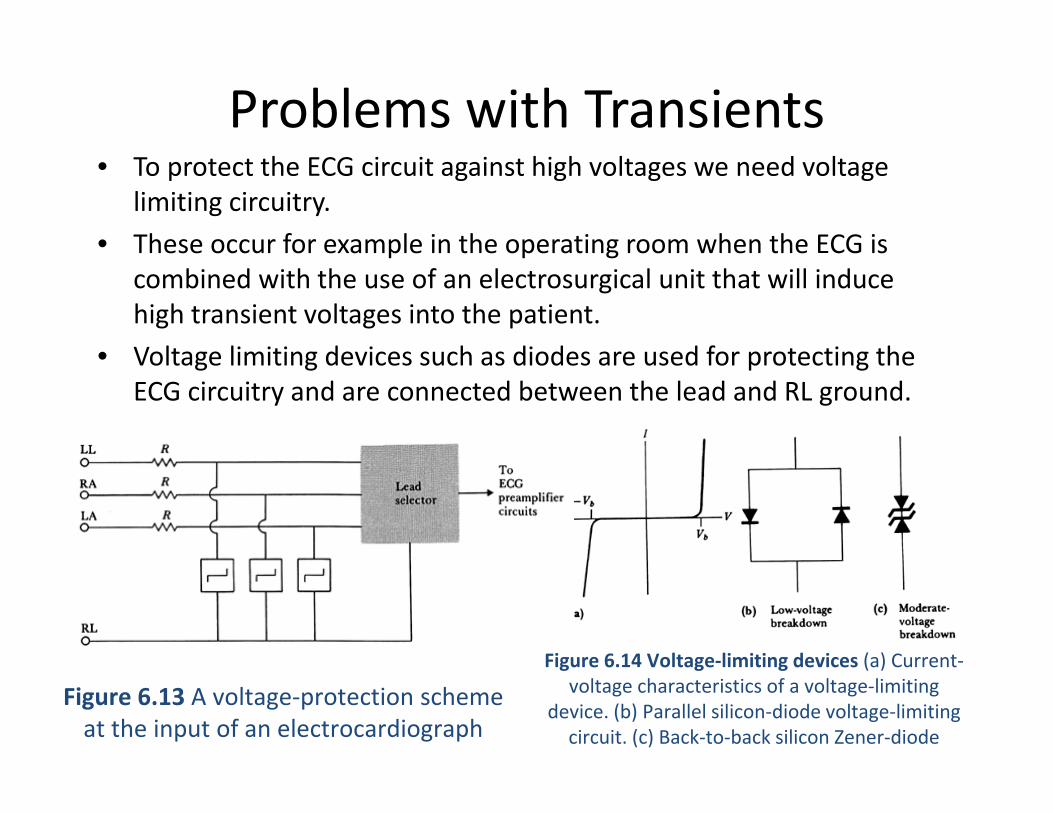
Problems with Transients• To protect the ECG circuit against high voltages we need voltage
limiting circuitry.
• These occur for example in the operating room when the ECG isThese occur for example in the operating room when the ECG is combined with the use of an electrosurgical unit that will induce high transient voltages into the patient.
• Voltage limiting devices such as diodes are used for protecting the• Voltage limiting devices such as diodes are used for protecting the ECG circuitry and are connected between the lead and RL ground.
Figure 6 14 Voltage‐limiting devices (a) Current‐Figure 6.14 Voltage limiting devices (a) Currentvoltage characteristics of a voltage‐limiting
device. (b) Parallel silicon‐diode voltage‐limiting circuit. (c) Back‐to‐back silicon Zener‐diode
Figure 6.13 A voltage‐protection scheme at the input of an electrocardiograph

Other Problems frequently encountered with the ECGencountered with the ECG
• Frequency Distortion: High frequency distortion ‐ Rounding off the QRS waveform and diminishing itswaveform and diminishing its amplitude. Low frequency distortion –baseline is no longer horizontal after an event.
• Saturation or cutoff distortion – High offset voltages and improperly adjusted amplifiers can produce saturated ECGs. Peaks of the QRS are cutoff
Figure 6.8 Effect of a voltage transient on an ECG recorded on an electrocardiograph in which the transient causes the amplifier to
saturate, and a finite period of time is Peaks of the QRS are cutoff• Ground Loops – If 1 ground of 1 device
is higher than the ECG ground, a current will flow through the patient
required for the charge to bleed off enough to bring the ECG back into the amplifier’s
active region of operation. This is followed by a first‐order recovery of the system.
g ppresenting a safety problem as well as elevating the patients body potential projecting erroneous voltages in the ECG
•Artifacts from Large Transients –Cause a large abrupt deflection in the ECG, take long time for recovery due
ECG to the large charge built up in the capacitors.
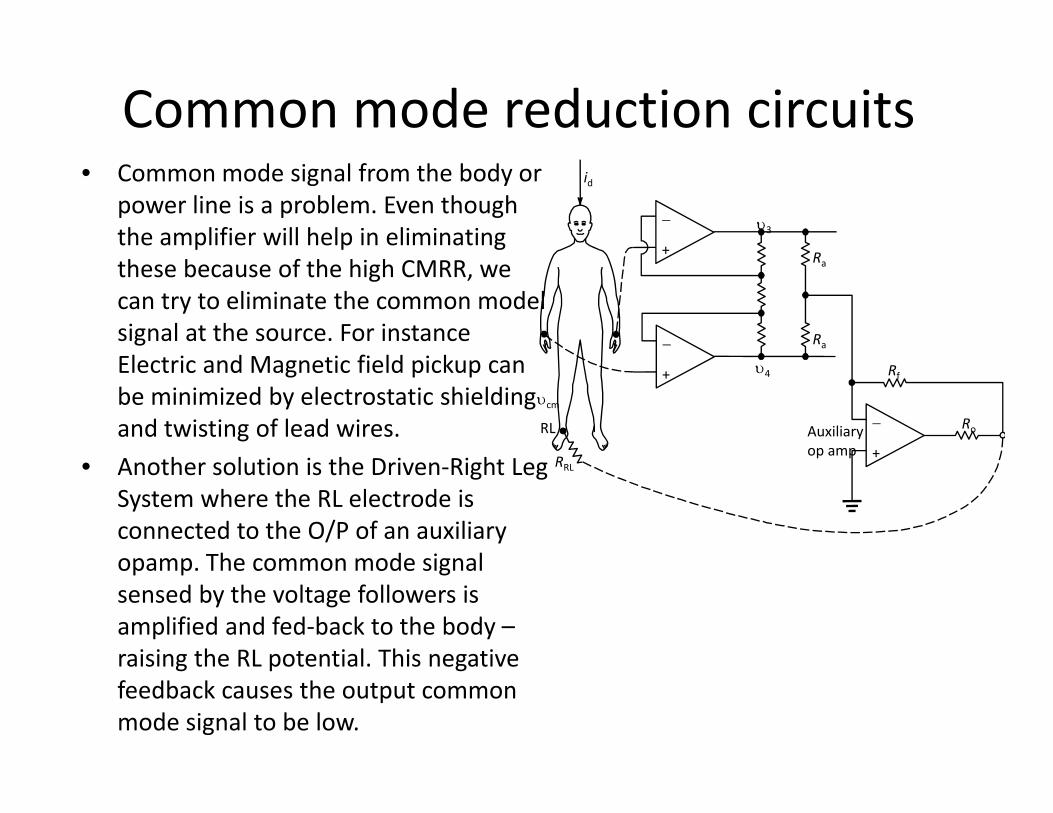
Common mode reduction circuits• Common mode signal from the body or
power line is a problem. Even though the amplifier will help in eliminating
id
R+
− υ3
these because of the high CMRR, we can try to eliminate the common model signal at the source. For instance l d f ld k
Ra
Ra
+
−Electric and Magnetic field pickup can be minimized by electrostatic shielding and twisting of lead wires.
h l i i h i i h R
Rf
RoAuxiliaryop amp +
−
+
RL
υ4
υcm
• Another solution is the Driven‐Right Leg System where the RL electrode is connected to the O/P of an auxiliary opamp The common mode signal
RRLp p
opamp. The common mode signal sensed by the voltage followers is amplified and fed‐back to the body –raising the RL potential This negativeraising the RL potential. This negative feedback causes the output common mode signal to be low.

Design considerations with other amplifiersp
Figure 6.16 Voltage and frequency ranges of some common biopotential signals; dc potentials include intracellular voltages as well as voltages measured from several
points on the body. EOG is the electrooculogram, EEG is the elctroencephalogram, ECG is the electrocardiogram, EMG is the electromyogram, and AAP is the axon action
potential.
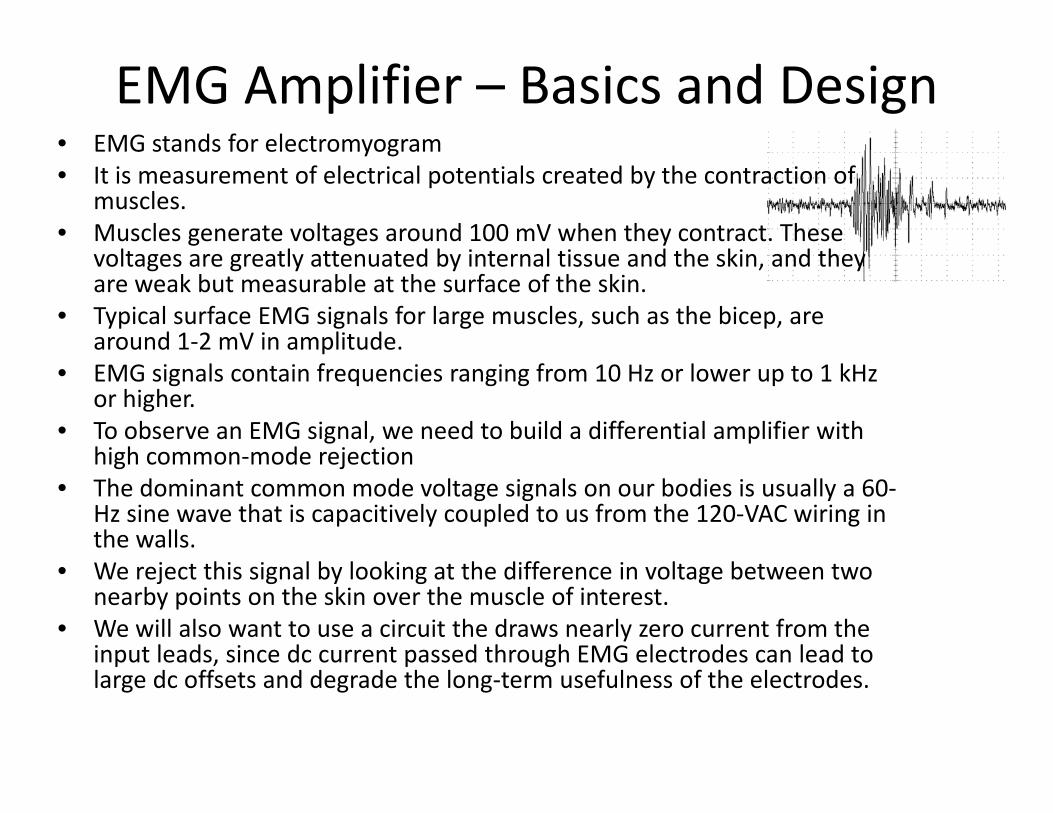
EMG Amplifier – Basics and Design• EMG stands for electromyogramEMG stands for electromyogram• It is measurement of electrical potentials created by the contraction of
muscles. • Muscles generate voltages around 100 mV when they contract. These
lt tl tt t d b i t l ti d th ki d thvoltages are greatly attenuated by internal tissue and the skin, and they are weak but measurable at the surface of the skin.
• Typical surface EMG signals for large muscles, such as the bicep, are around 1‐2 mV in amplitude.
• EMG signals contain frequencies ranging from 10 Hz or lower up to 1 kHz or higher.
• To observe an EMG signal, we need to build a differential amplifier with high common‐mode rejectionhigh common‐mode rejection
• The dominant common mode voltage signals on our bodies is usually a 60‐Hz sine wave that is capacitively coupled to us from the 120‐VAC wiring in the walls.
• We reject this signal by looking at the difference in voltage between two nearby points on the skin over the muscle of interest.
• We will also want to use a circuit the draws nearly zero current from the input leads, since dc current passed through EMG electrodes can lead to p , p glarge dc offsets and degrade the long‐term usefulness of the electrodes.

• We can build an EMG circuit using an instrumentation amplifier with opamps such as LM741 and LM324(BJT devices input currents of 100‐500 nA) or TL084 device with JFETs –input currents <0.2 nA or devices with MOSFETS (lower input currents, but they generally exhibit higher levels of noise) TL084 is identical to that of the LM324 in the pin diagramexhibit higher levels of noise). TL084 is identical to that of the LM324 in the pin diagram
• For safety the best method is to connect two 9V batteries for power supply
• You can design the instrumentation amplifier (3 opamp one) we discussed in class. For example you can set a gain of 201 Gain is (1 + 2R /R )(R /R )example you can set a gain of 201. Gain is
• We can use values like 10KΩ for all resistors except R2 and 1MΩ for R2 to get an overall gain of 201. You can measure the overall gain of your circuit by applying a small amplitude 1KHz sine wave from a function generator. You can essentially plot gain over frequency for
(1 + 2R2/R1)(R4/R3)
varying I/P frequency.
• To observe an EMG we need EMG electrodes. We can stick two of these electrodes on the muscle of interest (ex. bicep, close to each other but not overlapping). The 3rd electrode
b t k t th b i lb f th d th t i t d t d ican be stuck to the bone in your elbow of the same arm and that is connected to ground in the EMG circuit. Connect your elbow to circuit ground. This will keep your body potential near your circuit’s ground potential. Since there are no muscles at your elbow to generate electric potentials, this is a good grounding point. Connect the other two electrodes to the p , g g g pinput of the opamp and observe the response on the oscilloscope by flexing the bicep. Amplitudes visualized should be 100‐300mV. To avoid any DC offsets from the electrodes –we can add high pass filter to the instrumentation amplifier. With cutoff around 10 Hz