Embed Size (px)
Citation preview
城市模型及其规划设计响应Applied Urban Models and Their Applications in Urban Planning & Design
合作者包括杜立群、韩昊英 、赖世刚、刘伦、刘行健、毛其智、沈尧、沈振江、王江浩、吴康、杨东峰、张俊杰和赵怡婷等
龙 瀛
1 城市模型与规划支持系统1.1 规划支持系统在城市规划中的应用探索
1.2 多尺度的北京城市空间发展模型
1.3 规划师主体模型:一项低碳城市形态规划支持的工具
1.4 囊括方法、软件和模型的规划支持系统框架体系
1.5 面向空间规划的微观模拟
2 大模型与定量城市研究2.1 大模型及中国应用案例
2.2 基于OpenStreetMap和兴趣点数据的地块特征自动识别
2.3 地块尺度中国所有城市的空间扩张模拟
2.4 中国PM2.5的人口暴露评估
2.5 利用北京公共交通刷卡数据的若干定量城市研究
2.6 当前定量城市研究的四项变革
3 规划设计响应3.1 数据增强设计:新数据环境下的规划设计回应与改变
3.2 街道城市主义
3.3 城市规划实施评价:针对中国城市的分析框架
3.4 基于人类活动和移动数据的城市增长边界实施评价
3.5 中国收缩城市及其研究框架
3.6 历史上的北京规划
城市模型及其规划设计响应
Applied Urban Models and TheirApplications in Urban Planning & Design
1 Urban Models and Planning Support Systems 1.1 Planning support systems in urban planning1.2 Beijing urban spatial development model families1.3 Planner Agents: A toolkit for support planning a low carbon urban form1.4 An applied planning support toolkit including quantitative methods, software and models in China 1.5 Urban micro-simulation for spatial planning
2 Big Models and Quantitative Urban Studies2.1 Big models: Several fine-scale urban studies for the whole China2.2 Automated identification and characterization of parcels (AICP) with OpenStreetMap and points of interest2.3 Simulating urban expansion at the parcel level for all Chinese cities2.4 Estimating population exposure to PM2.5 in China 2.5 Bus landscapes: Analyzing commuting pattern using bus/metro smartcard data in Beijing2.6 Four changes on quantitative urban studies in the big data era
3 Applications in Urban Planning & Design3.1 Data augmented design (DAD): Planning & design in new data environment3.2 Street urbanism3.3 Evaluation of urban planning implementation: An analytical framework for Chinese cities and case study of Beijing3.4 Evaluating the effectiveness of urban growth boundaries with human mobility data 3.5 Shrinking cities in China and the research agenda3.6 Historical city plans in Beijing
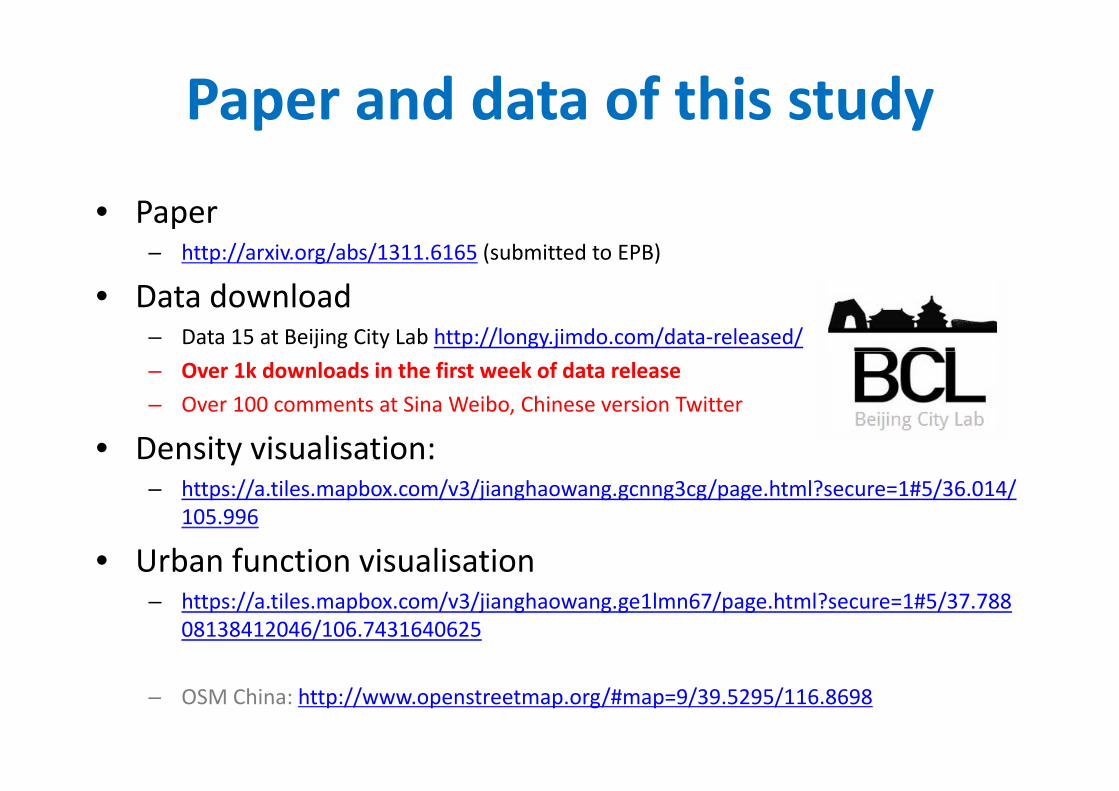
P d d t f thi t dPaper and data of this study
• Paper– http://arxiv.org/abs/1311.6165 (submitted to EPB)p g ( )
• Data download– Data 15 at Beijing City Lab http://longy.jimdo.com/data‐released/– Over 1k downloads in the first week of data release– Over 100 comments at Sina Weibo, Chinese version Twitter
D it i li ti• Density visualisation:– https://a.tiles.mapbox.com/v3/jianghaowang.gcnng3cg/page.html?secure=1#5/36.014/
105.996
• Urban function visualisation– https://a.tiles.mapbox.com/v3/jianghaowang.ge1lmn67/page.html?secure=1#5/37.788
08138412046/106.7431640625
– OSM China: http://www.openstreetmap.org/#map=9/39.5295/116.8698OSM China: http://www.openstreetmap.org/#map 9/39.5295/116.8698
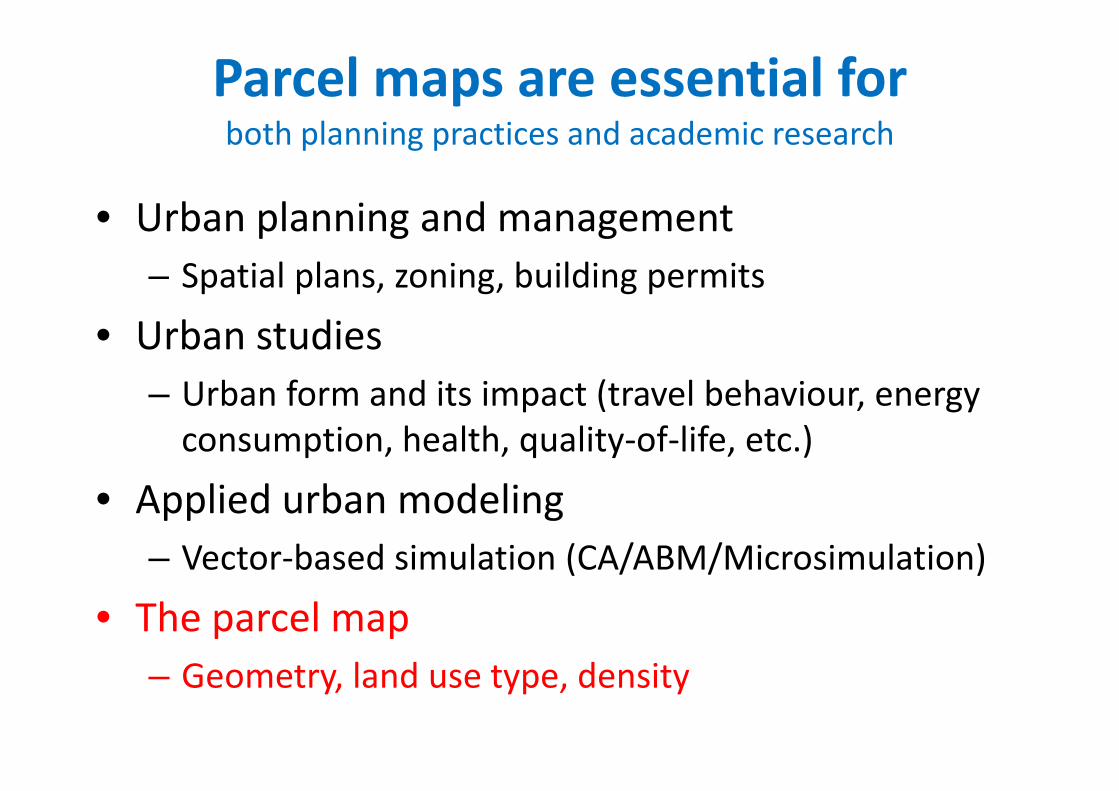
Parcel maps are essential forParcel maps are essential forboth planning practices and academic research
• Urban planning and managementS i l l i b ildi i– Spatial plans, zoning, building permits
• Urban studies– Urban form and its impact (travel behaviour, energy consumption health quality of life etc )consumption, health, quality‐of‐life, etc.)
• Applied urban modeling– Vector‐based simulation (CA/ABM/Microsimulation)
• The parcel map• The parcel map– Geometry, land use type, density
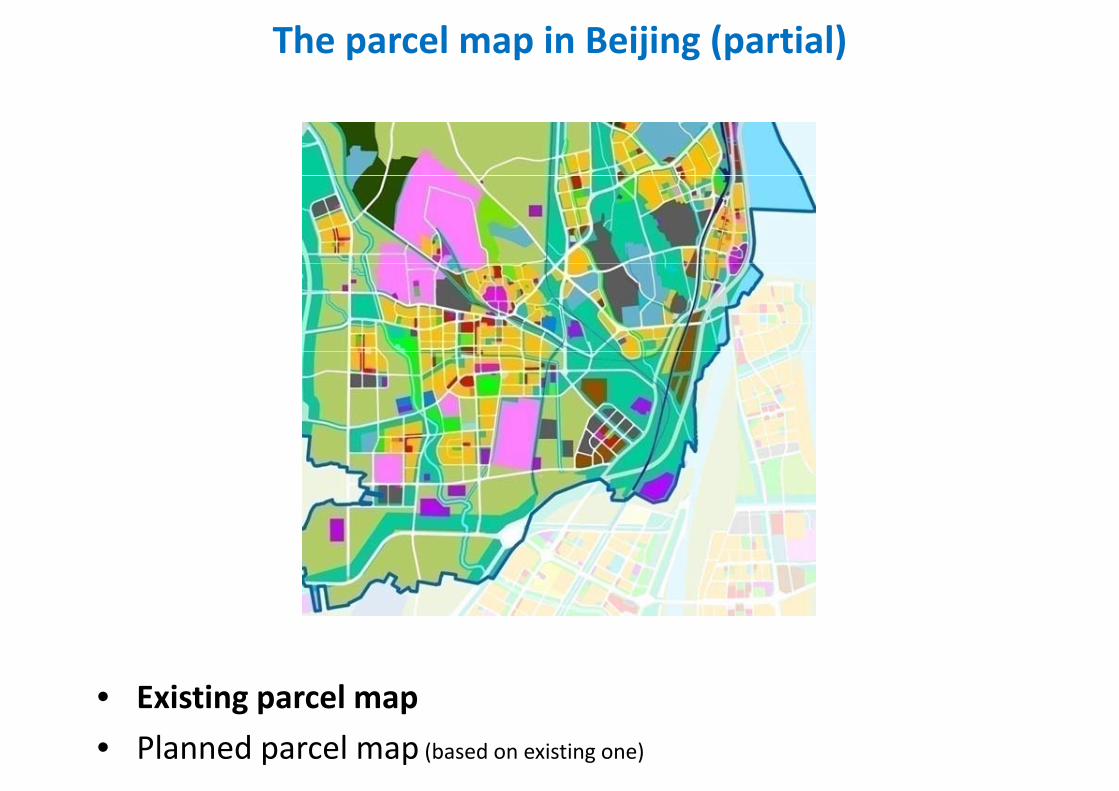
The parcel map in Beijing (partial)
• Existing parcel mapExisting parcel map• Planned parcel map (based on existing one)
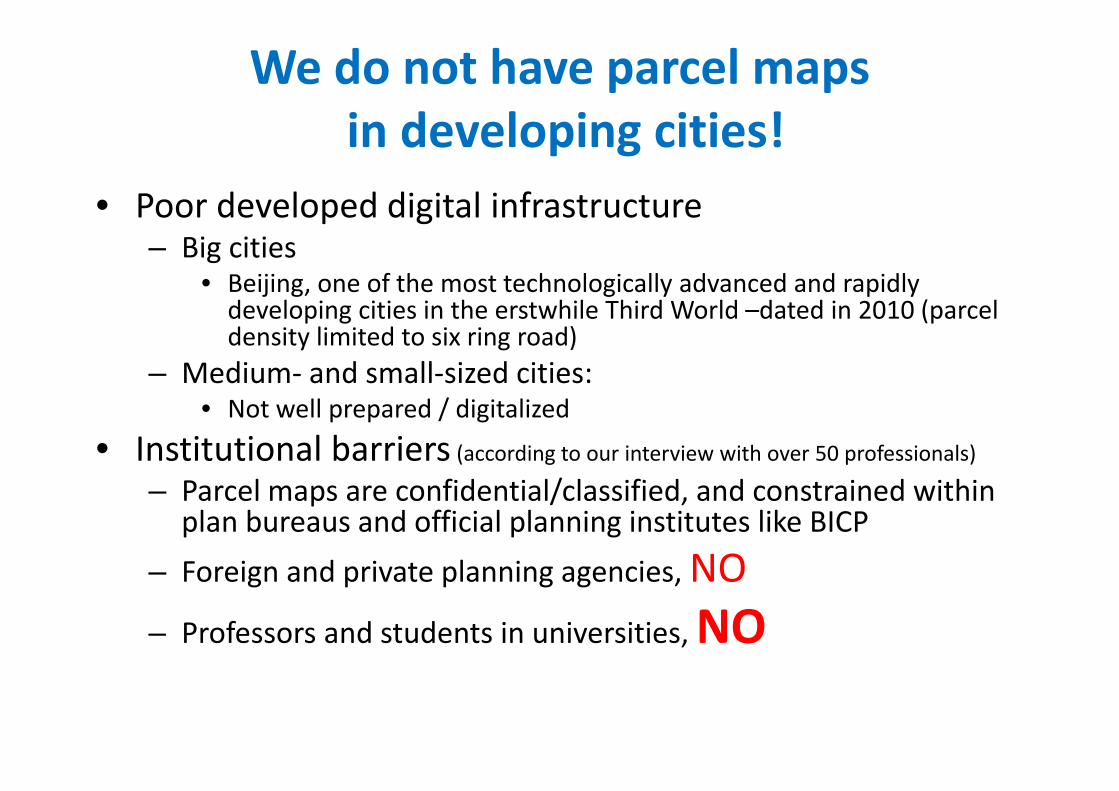
We do not have parcel mapsp pin developing cities!
• Poor developed digital infrastructure– Big cities
• Beijing, one of the most technologically advanced and rapidly developing cities in the erstwhile Third World –dated in 2010 (parcel density limited to six ring road)
– Medium‐ and small‐sized cities:• Not well prepared / digitalized
I tit ti l b i• Institutional barriers (according to our interview with over 50 professionals)
– Parcel maps are confidential/classified, and constrained within plan bureaus and official planning institutes like BICPplan bureaus and official planning institutes like BICP
– Foreign and private planning agencies, NONO– Professors and students in universities, NO
This condition has limited the progress of quantitative urban studies urban planning compilation as well asurban studies, urban planning compilation as well as urban management in developing countries in general,
d i Chi i i land in China in particular.
C ti l hConventional approaches
• Manual interpretation of remote sensing images, ordnance maps and field surveys p y
• Time‐consuming, expensive, and labor‐intensive, thus being not easy for longitudinal updatebeing not easy for longitudinal update1. E.g. it would take an experienced operator 3‐5 hours to draw
parcel geometries and infer their land use for 35‐50 urban parcels in 1 km2
2. Many medium and small cities cannot afford in terms of fi i l d i t lli t tfinancial and intelligent resources cost
3. Expensive building data for calculating parcel density4 Land use mix never measured in the parcel level4. Land use mix never measured in the parcel level5. Generally 3‐5 years in booming expanding Chinese cities
O d t l ti i thiOur open‐data solution in this paper
• A method for automatic identification and characterization of parcels (AICP) based on freelycharacterization of parcels (AICP), based on freely‐available Open Street Map (OSM) and crowd‐sourced P i f I (POI) dPoint‐of‐Interest (POI) data1. Provide quick and robust delineation of land parcels2. Select urban parcels from all generated parcels3. Infer urban functions, development density and mixed3. Infer urban functions, development density and mixed
land uses for urban parcels
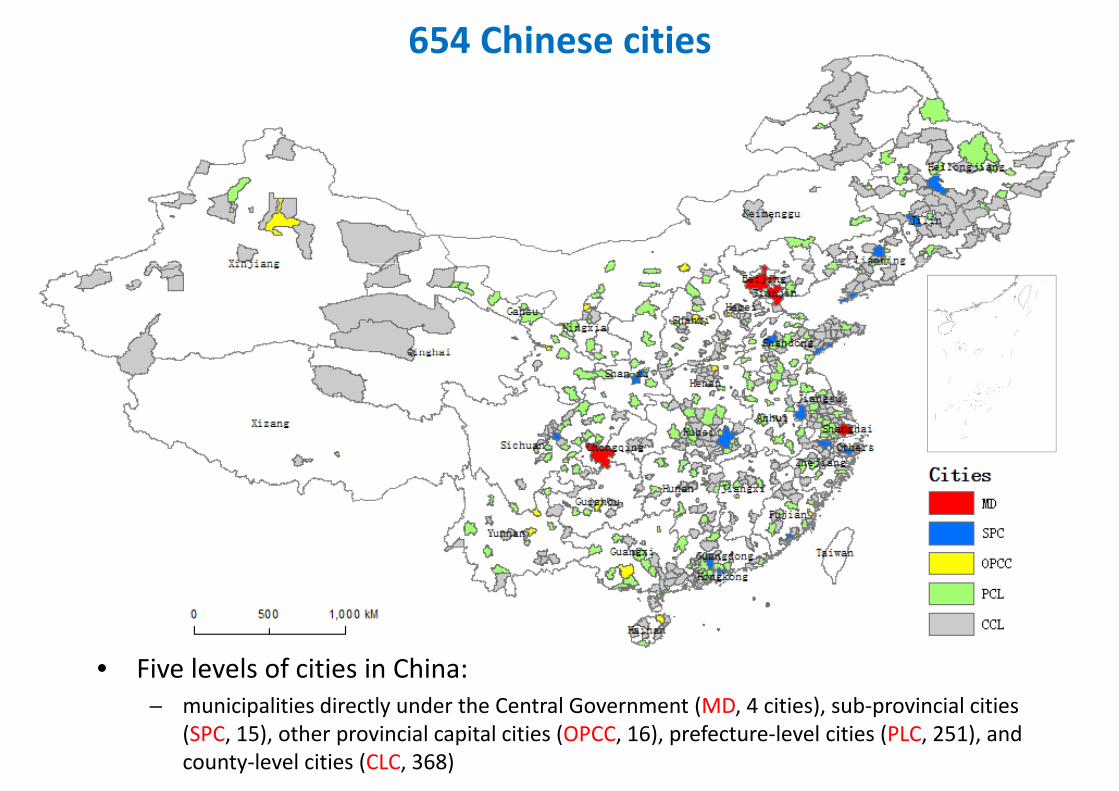
654 Chinese cities
• Five levels of cities in China: municipalities directly under the Central Government (MD 4 cities) sub provincial cities– municipalities directly under the Central Government (MD, 4 cities), sub‐provincial cities (SPC, 15), other provincial capital cities (OPCC, 16), prefecture‐level cities (PLC, 251), and county‐level cities (CLC, 368)
D tData
• Total urban land area for each city in 2012 from the Chinese City Construction Statistics Yearbook 2012City Construction Statistics Yearbook 2012
• 5 m POIs gathered from and geocoded by business cataloging websiteswebsites– 9 categories, including commercial, transport, government, education,
residence, green space, etc, g p ,
• For model validation– The ordnance survey map with all detailed road networks in ChinaThe ordnance survey map with all detailed road networks in China– Urban area of China interpreted from
• DMSP/OLS (1‐km spatial resolution, night light images; Yang et al. 2013)• GLOBCOVER (300‐m spatial resolution; Bontemps 2009)
– Manually generated parcel map for Beijing in 2010 gathered from BICP
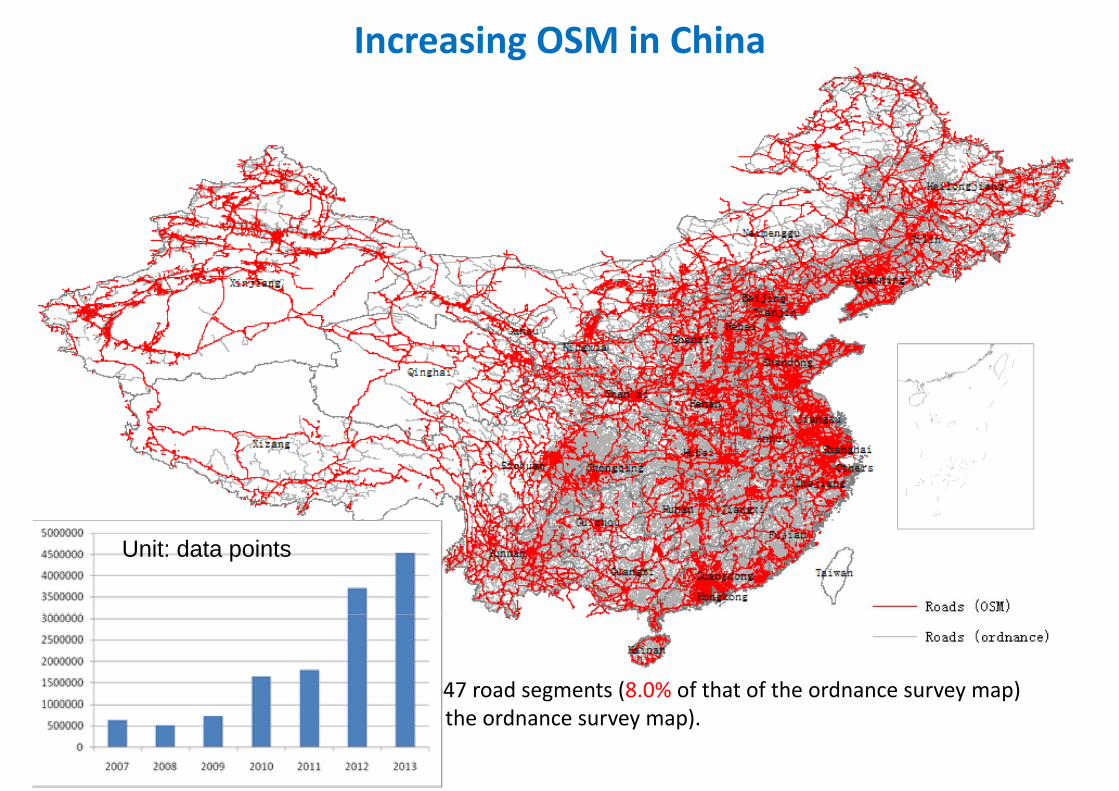
Increasing OSM in China
Unit: data points
• The OSM dataset contains 481,647 road segments (8.0% of that of the ordnance survey map) of 825,382 kilometers (31.5% of the ordnance survey map).
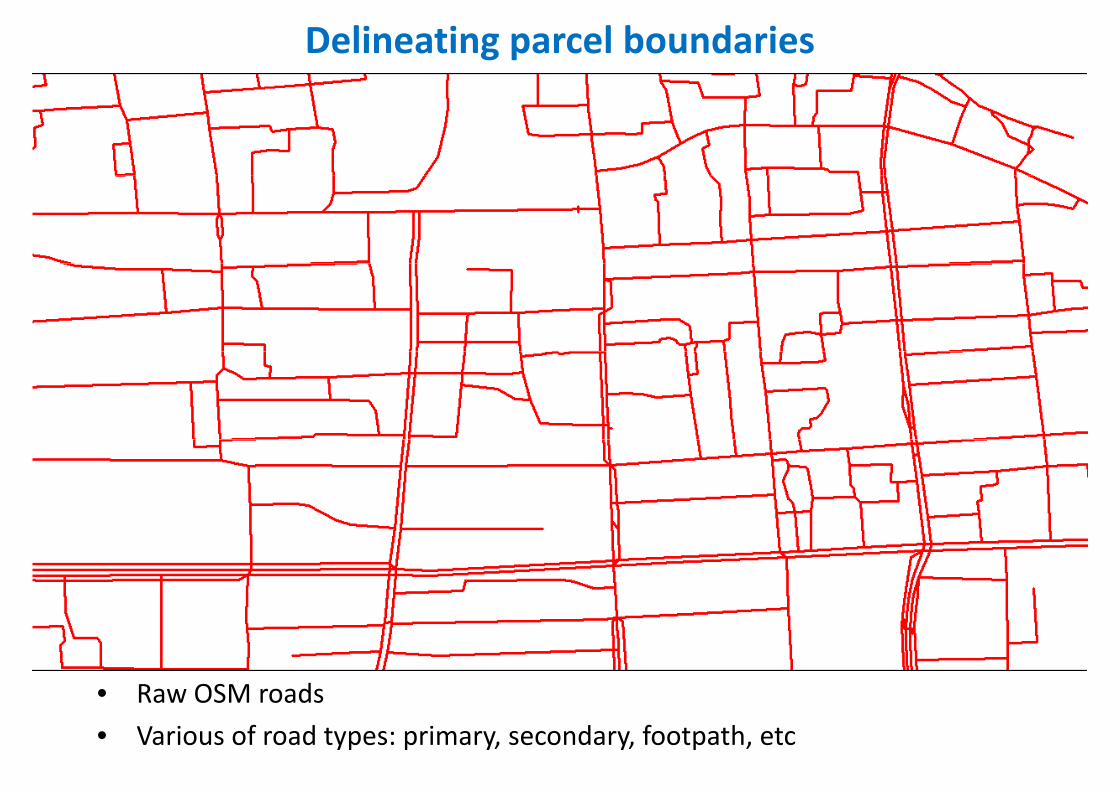
Delineating parcel boundaries
• Raw OSM roadsa OS oads• Various of road types: primary, secondary, footpath, etc
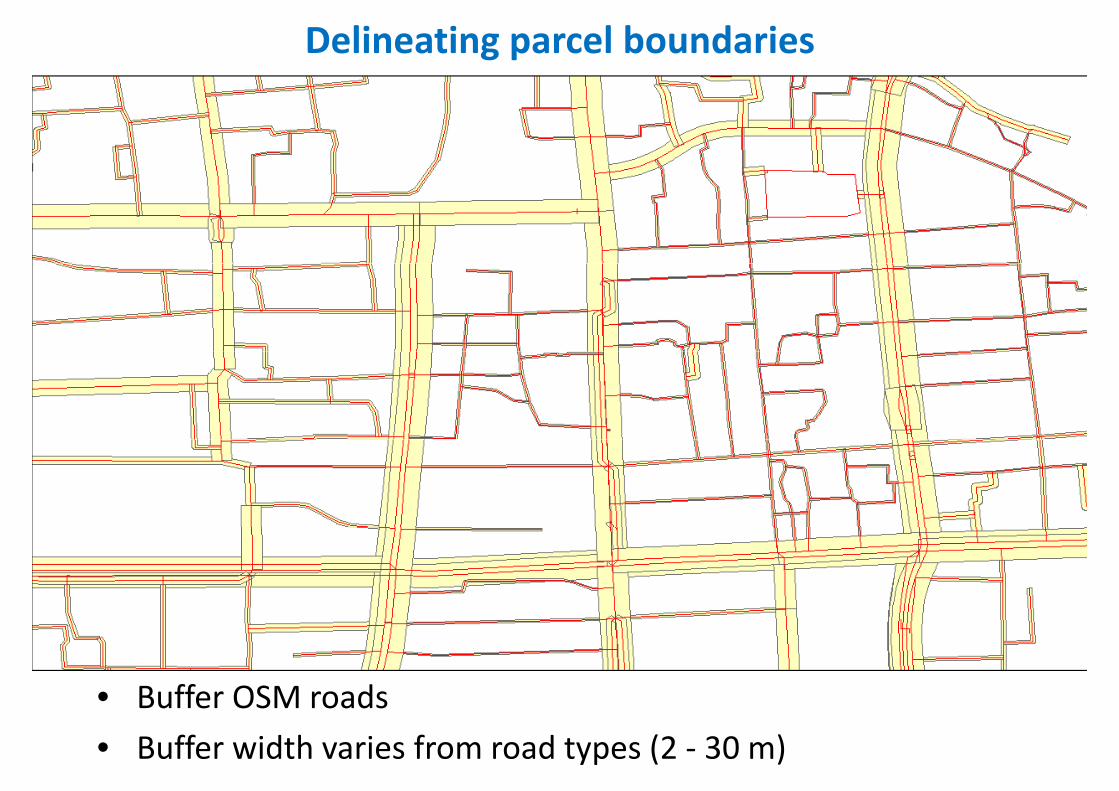
Delineating parcel boundaries
• Buffer OSM roadsBuffer OSM roads• Buffer width varies from road types (2 ‐ 30 m)
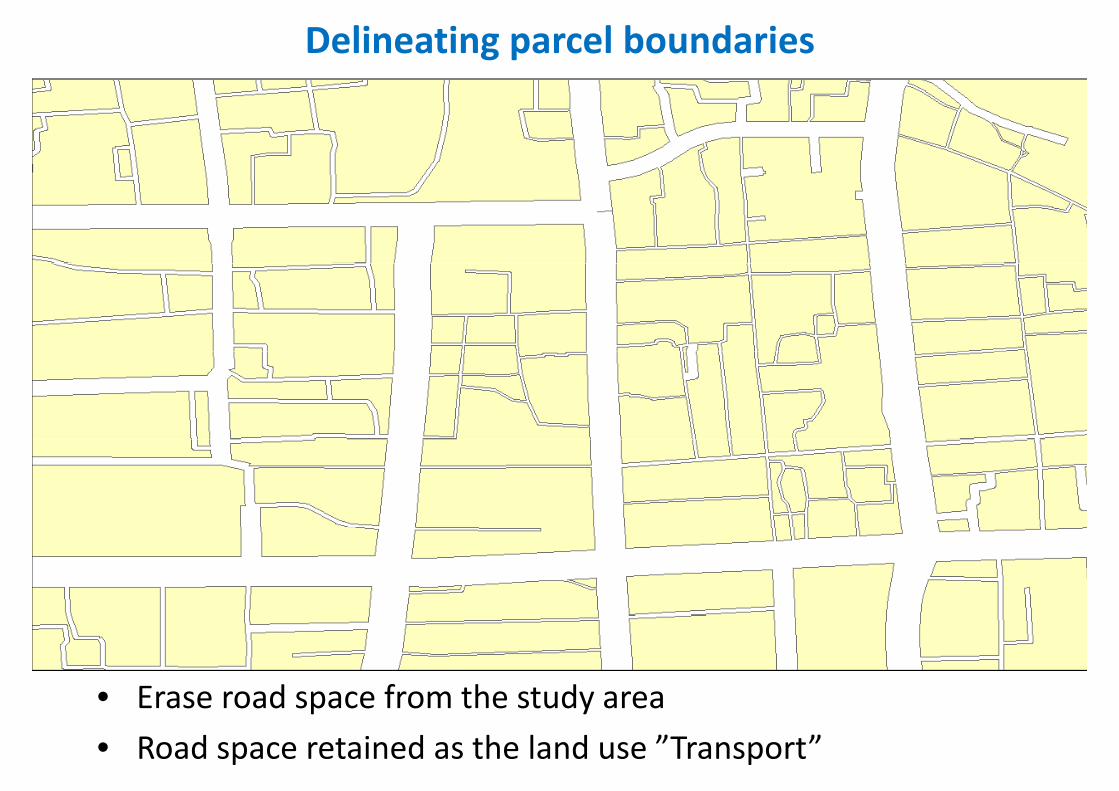
Delineating parcel boundaries
• Erase road space from the study areaErase road space from the study area• Road space retained as the land use ”Transport”
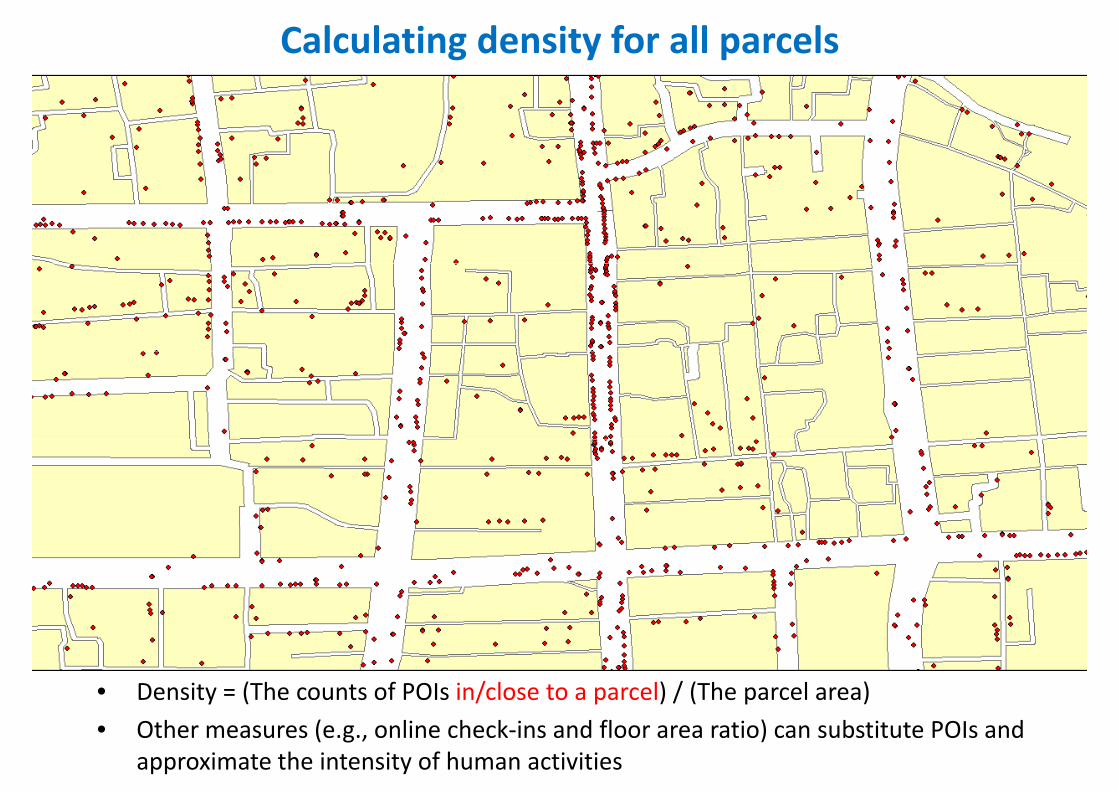
Calculating density for all parcels
• Density = (The counts of POIs in/close to a parcel) / (The parcel area) y ( / p ) / ( p )• Other measures (e.g., online check‐ins and floor area ratio) can substitute POIs and
approximate the intensity of human activities
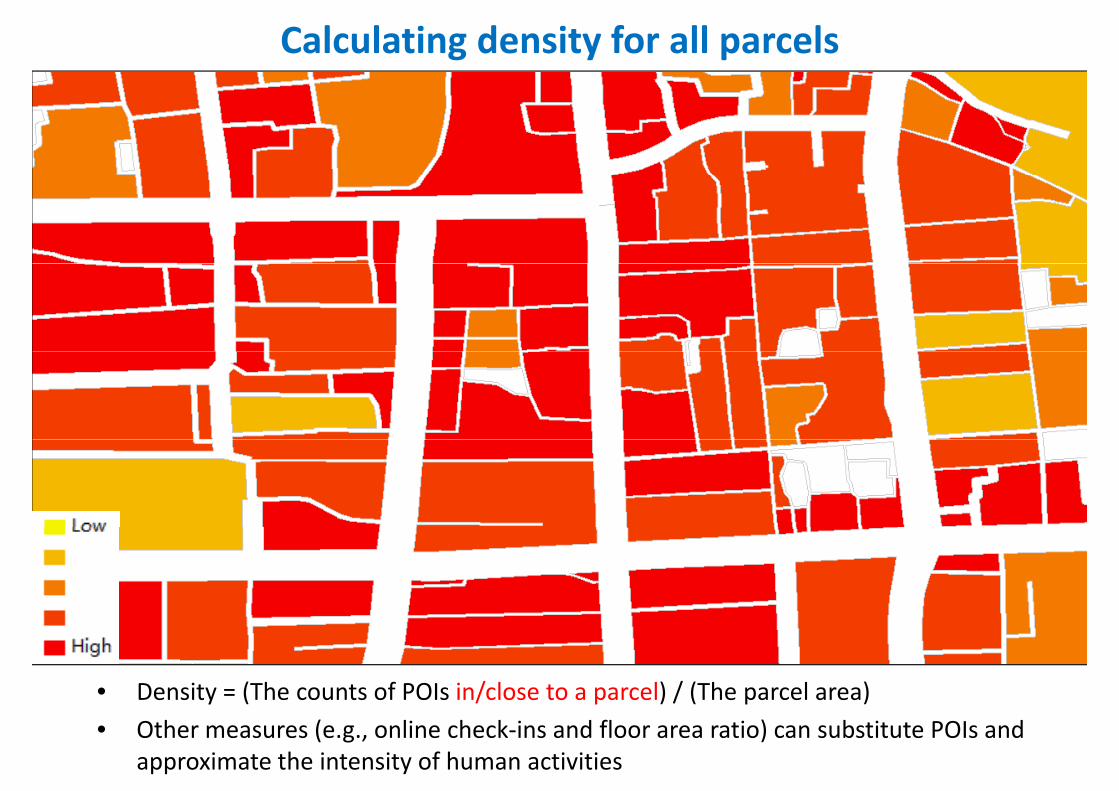
Calculating density for all parcels
• Density = (The counts of POIs in/close to a parcel) / (The parcel area) y ( / p ) / ( p )• Other measures (e.g., online check‐ins and floor area ratio) can substitute POIs and
approximate the intensity of human activities
Selecting urban parcels using vector cellular automata
( ) ( )tij l ij ijP P P
1
01
1( )1 exp[ ( )]
l ij m
k kk
Pa a c
( )( )
tijcon S urban
P
( )ijPn
S t1 Urban for Pij
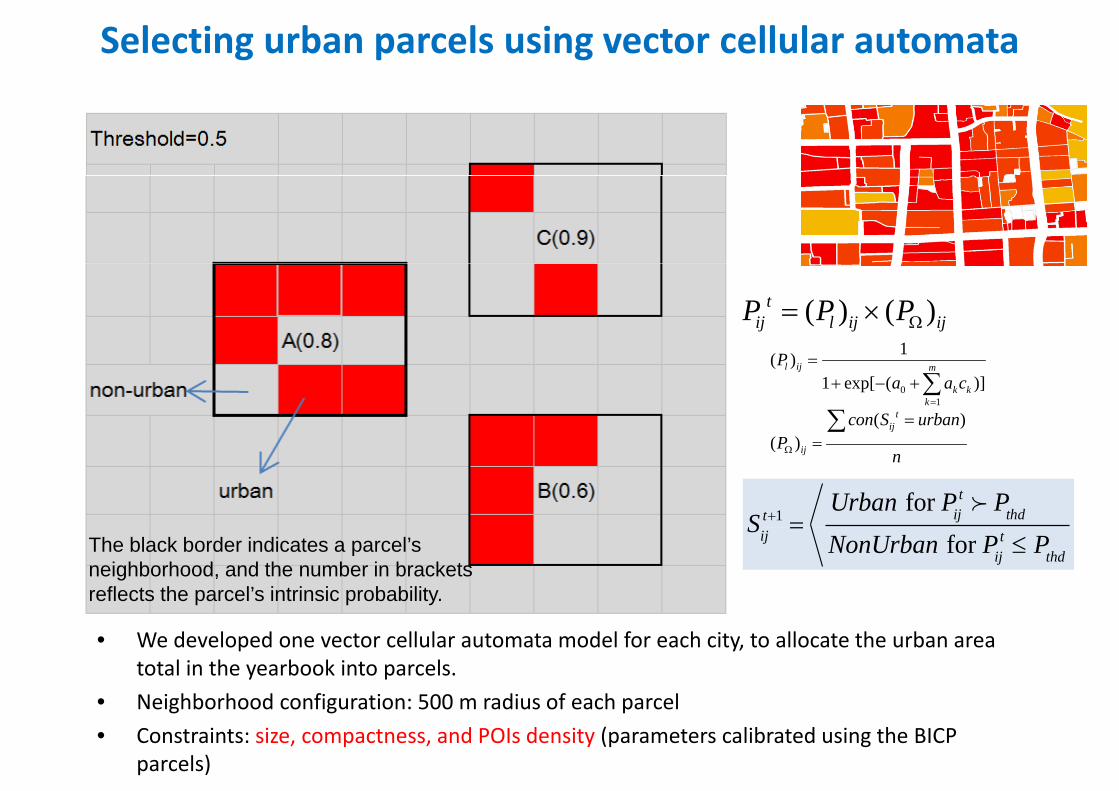
t Pthd The black border indicates a parcel’s neighborhood, and the number in brackets reflects the parcel’s intrinsic probability.
Sij NonUrban for Pij
t Pthd
• We developed one vector cellular automata model for each city, to allocate the urban area total in the yearbook into parcels.
• Neighborhood configuration: 500 m radius of each parcel• Neighborhood configuration: 500 m radius of each parcel• Constraints: size, compactness, and POIs density (parameters calibrated using the BICP
parcels)
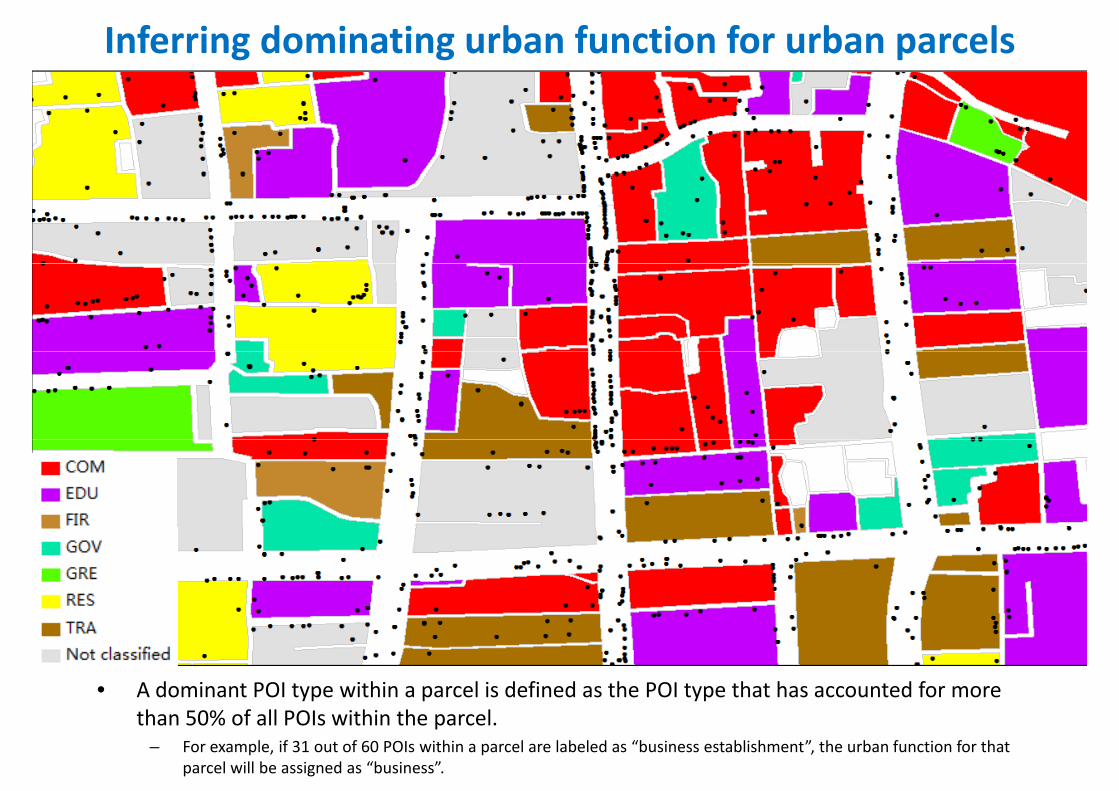
Inferring dominating urban function for urban parcels
• A dominant POI type within a parcel is defined as the POI type that has accounted for more than 50% of all POIs within the parcel.
– For example, if 31 out of 60 POIs within a parcel are labeled as “business establishment”, the urban function for that parcel will be assigned as “business”.
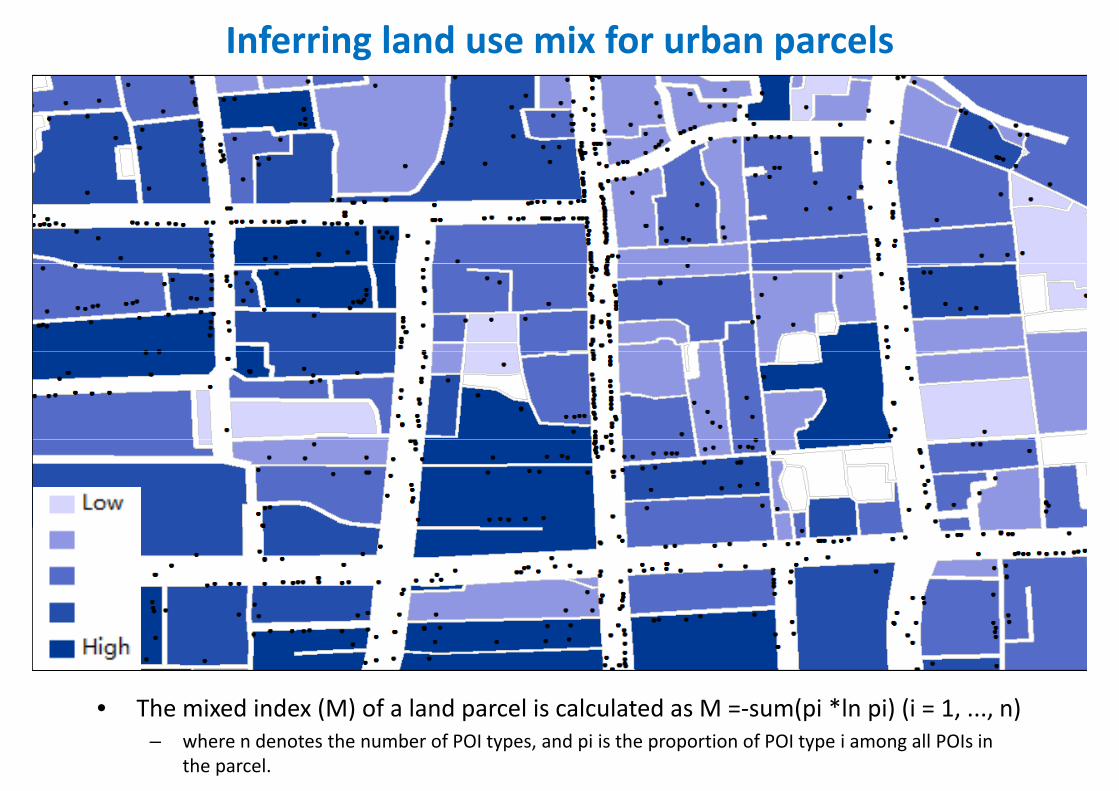
Inferring land use mix for urban parcels
Th i d i d (M) f l d l i l l t d M ( i *l i) (i 1 )• The mixed index (M) of a land parcel is calculated as M =‐sum(pi *ln pi) (i = 1, ..., n)– where n denotes the number of POI types, and pi is the proportion of POI type i among all POIs in
the parcel.
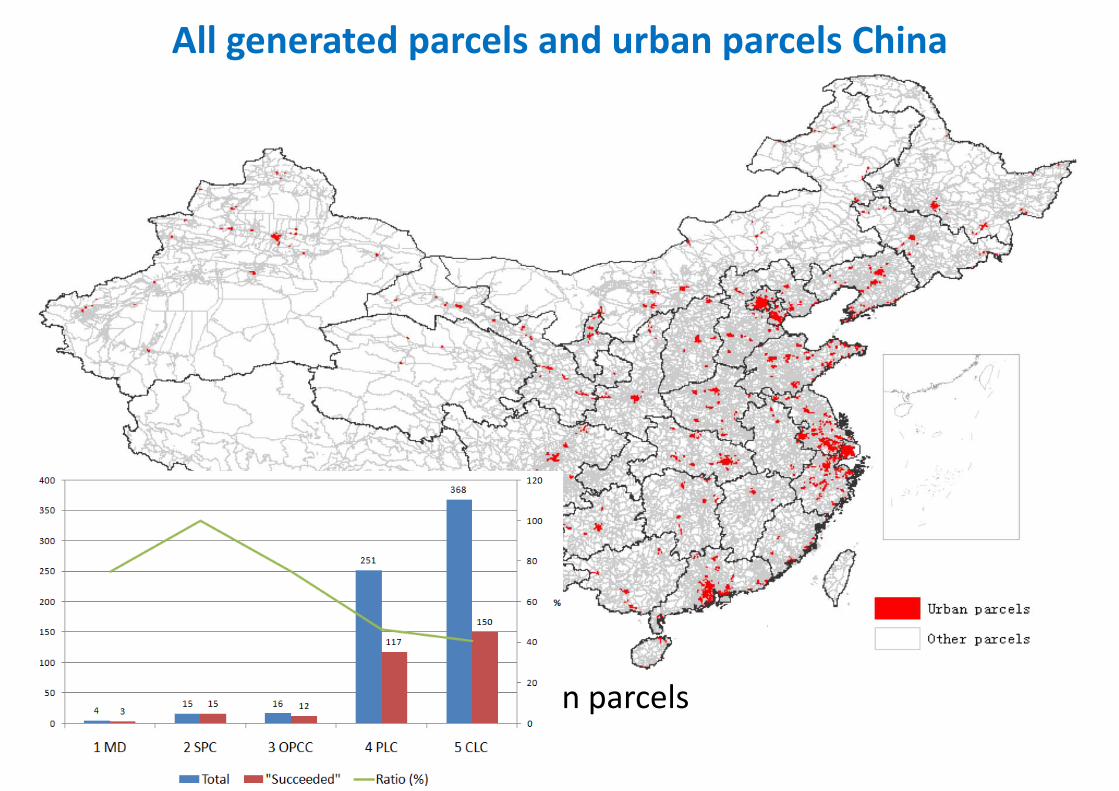
All generated parcels and urban parcels China
• 297 cities with identified urban parcels297 cities with identified urban parcels
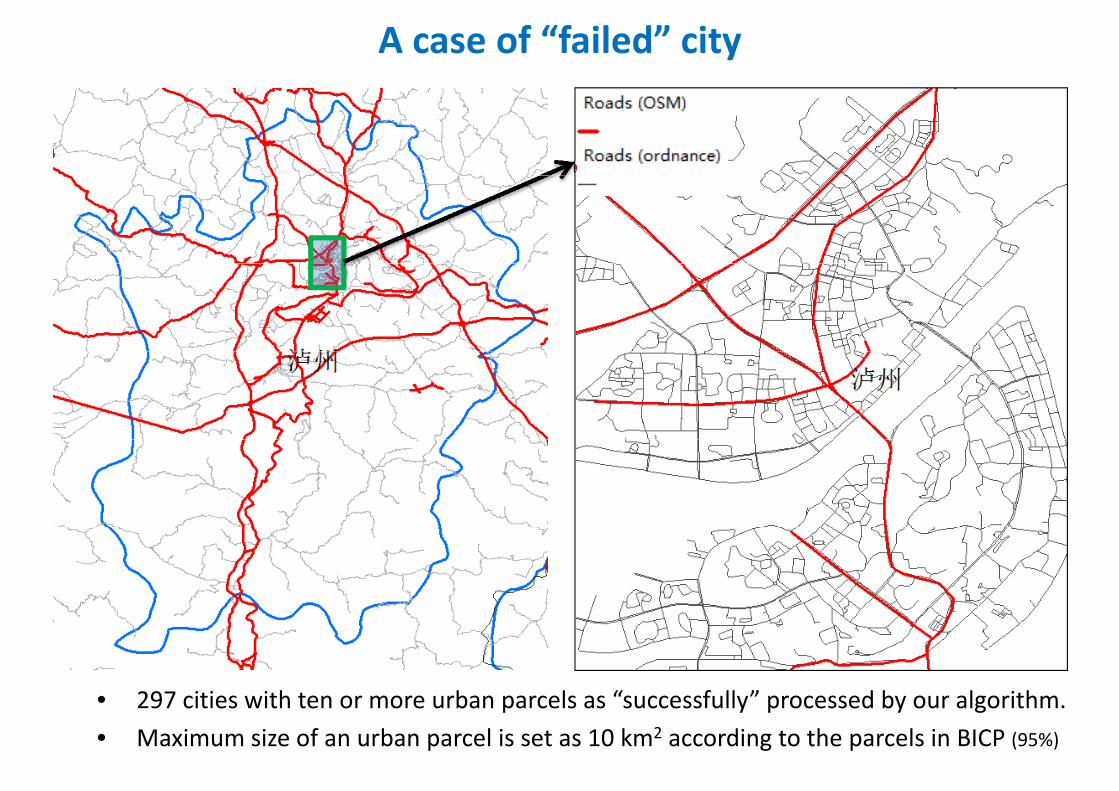
A case of “failed” city
• 297 cities with ten or more urban parcels as “successfully” processed by our algorithm297 cities with ten or more urban parcels as successfully processed by our algorithm.• Maximum size of an urban parcel is set as 10 km2 according to the parcels in BICP (95%)
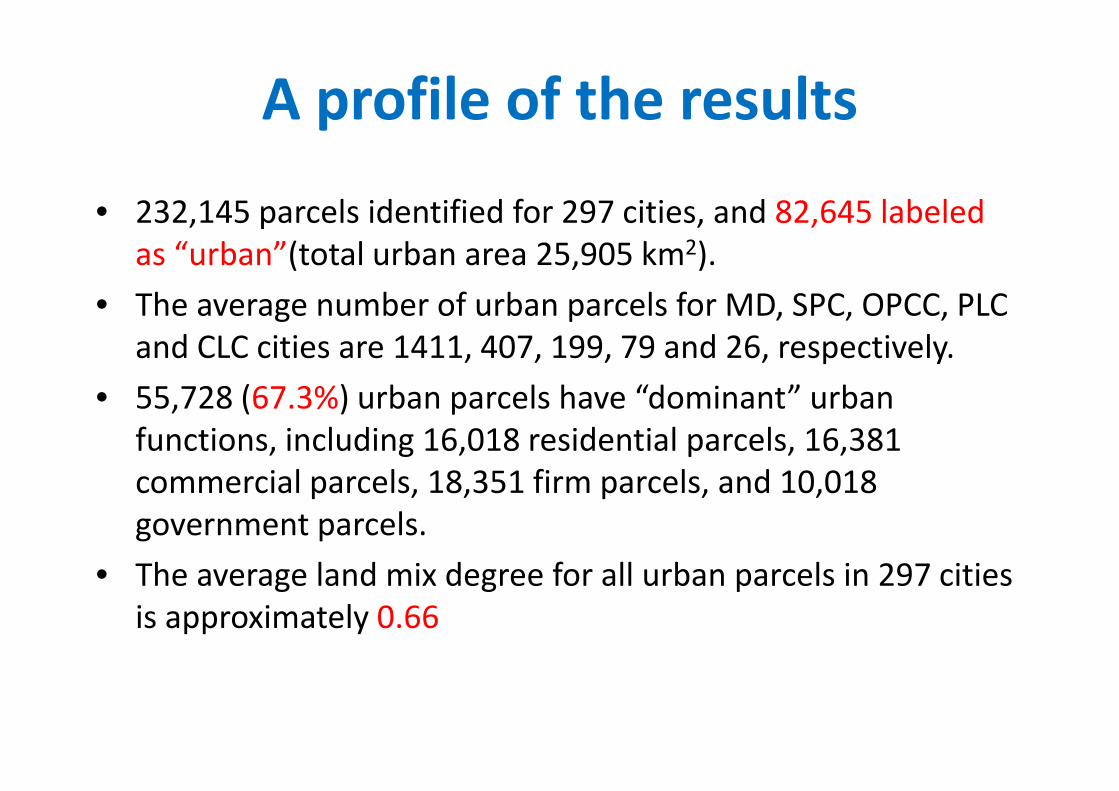
A fil f th ltA profile of the results
• 232,145 parcels identified for 297 cities, and 82,645 labeled as “urban”(total urban area 25,905 km2).as urban (total urban area 25,905 km ).
• The average number of urban parcels for MD, SPC, OPCC, PLC and CLC cities are 1411 407 199 79 and 26 respectivelyand CLC cities are 1411, 407, 199, 79 and 26, respectively.
• 55,728 (67.3%) urban parcels have “dominant” urban functions including 16 018 residential parcels 16 381functions, including 16,018 residential parcels, 16,381 commercial parcels, 18,351 firm parcels, and 10,018 government parcelsgovernment parcels.
• The average land mix degree for all urban parcels in 297 cities is approximately 0 66is approximately 0.66
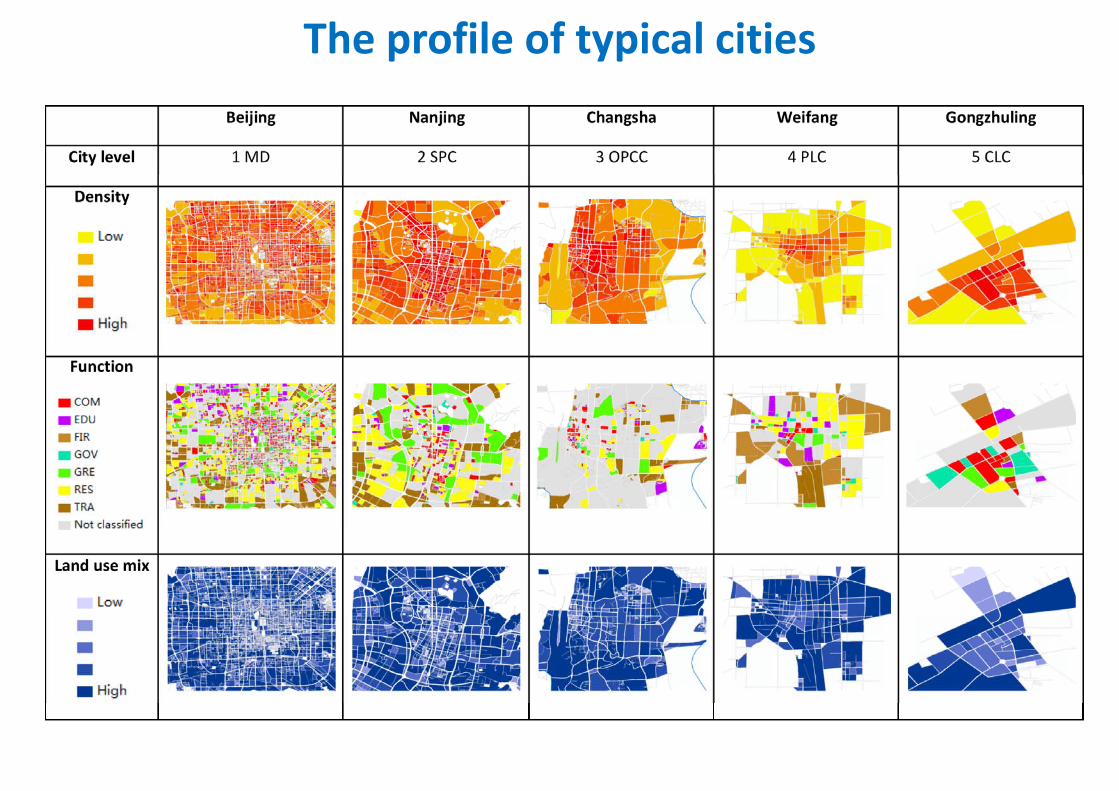
The profile of typical cities
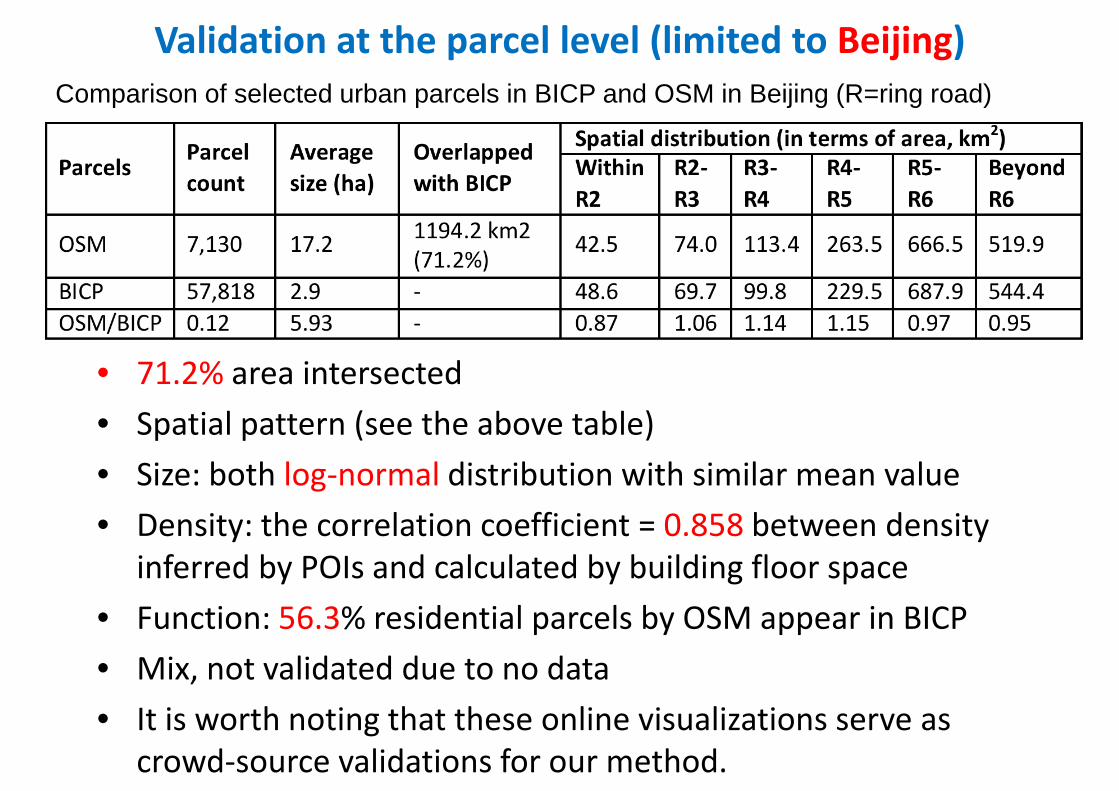
Validation at the parcel level (limited to Beijing)C i f l t d b l i BICP d OSM i B iji (R i d)Comparison of selected urban parcels in BICP and OSM in Beijing (R=ring road)
• 71.2% area intersected• Spatial pattern (see the above table)p p ( )• Size: both log‐normal distribution with similar mean value• Density: the correlation coefficient = 0 858 between density• Density: the correlation coefficient = 0.858 between density
inferred by POIs and calculated by building floor space• Function: 56 3% residential parcels by OSM appear in BICP• Function: 56.3% residential parcels by OSM appear in BICP• Mix, not validated due to no data• It is worth noting that these online visualizations serve as
crowd‐source validations for our method.
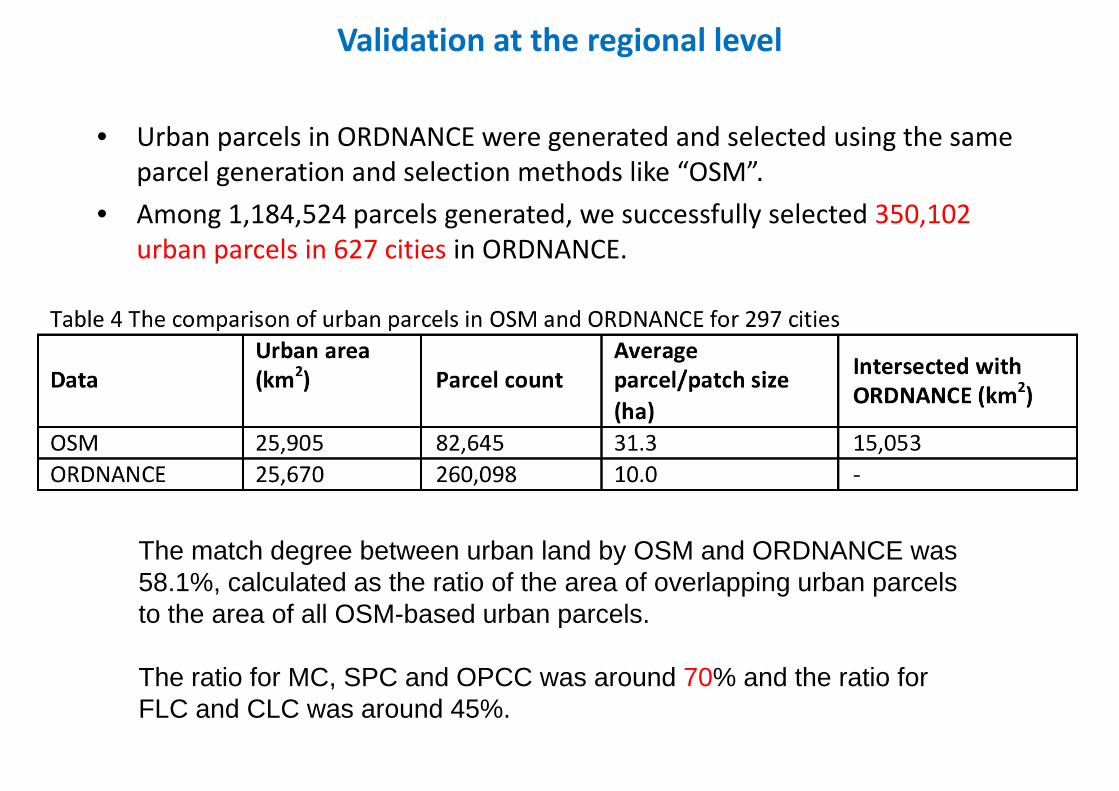
Validation at the regional level
• Urban parcels in ORDNANCE were generated and selected using the same parcel generation and selection methods like “OSM”parcel generation and selection methods like OSM .
• Among 1,184,524 parcels generated, we successfully selected 350,102 urban parcels in 627 cities in ORDNANCE.p
The match degree between urban land by OSM and ORDNANCE was 58.1%, calculated as the ratio of the area of overlapping urban parcels to the area of all OSM-based urban parcelsto the area of all OSM-based urban parcels.
The ratio for MC, SPC and OPCC was around 70% and the ratio for FLC d CLC d 45%FLC and CLC was around 45%.
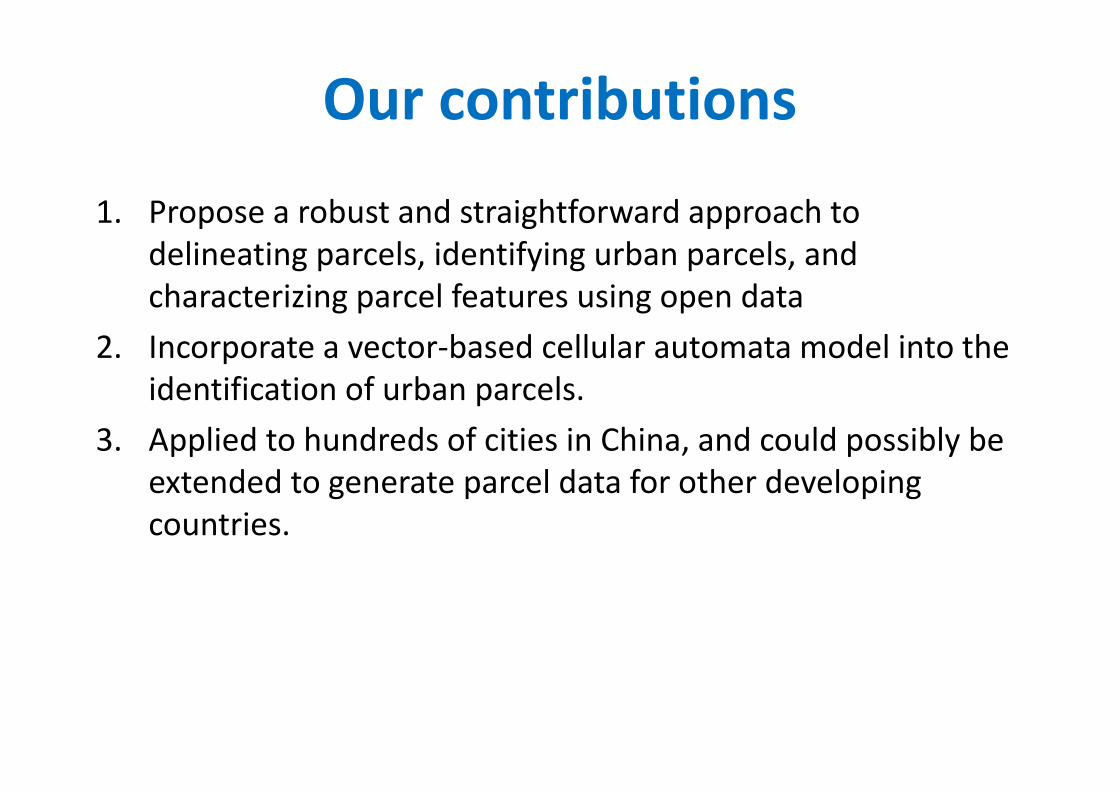
O t ib tiOur contributions
1. Propose a robust and straightforward approach to delineating parcels, identifying urban parcels, anddelineating parcels, identifying urban parcels, and characterizing parcel features using open data
2 Incorporate a vector‐based cellular automata model into the2. Incorporate a vector based cellular automata model into the identification of urban parcels.
3 Applied to hundreds of cities in China and could possibly be3. Applied to hundreds of cities in China, and could possibly be extended to generate parcel data for other developing countriescountries.
P t ti l li tiPotential applications
1. Urban planning and studies in places where digital infrastructure development is weakinfrastructure development is weak
2. Inter‐urban study based on inner‐city datasets– Quality of life– Quality of life
3. As spatial units to incorporate other ubiquitous and spatially referenced (big) datareferenced (big) data– “Big” parcel in the “big data” era
4 Vector based urban modeling4. Vector‐based urban modeling– Simulating urban expansion in the parcel level for all Chinese cities
using a mega‐vector‐parcels cellular automata model (MVP‐CA)using a mega‐vector‐parcels cellular automata model (MVP‐CA)– Each city, big or small, would have an urban expansion model for
decision making / planning support after this studyg / p g pp y
P t ti l biPotential bias
1. OSM data quality is not sound enough for generating parcels in medium and small cities ingenerating parcels in medium and small cities in ChinaH ti ld l it th k f i i– Hope time could solve it, thanks for increasing contributors
2. Use POIs as a proxy of urban density– To enrich by online check‐ins, taxi trajectories, and y , j ,public transport smartcard records (in progressing)
3. Over‐large urban parcels3. Over large urban parcels– Parcel subdivision techniques (Aliaga et al. 2008)
http://www.beijingcitylab.com/新浪微博:@龙瀛a1_b2 @北京城市实验室
微信公众号:beijingcitylab
未来更新将在BCL网站公布,敬请关注。
这套课件为龙瀛及其合作者近年来在城市模型领域研究的部分合集,包括传统的城市模型、基于大数据的城市模型、大模型这一城市与区域研究新范式,以及最近的面向规划设计应用的初步探索。
这些PPT在不同的学术会议和论坛上做过发表,时间和精力有限,并没有专门针对此课件进行调整。课件内容难免有不完善之处,欢迎将意见和建议致信到[email protected]
BCL网站 BCL微信公众号