Embed Size (px)
Citation preview
Hong Kong Exchanges and Clearing Limited and The Stock Exchange of Hong Kong Limited take no responsibility for the contents of this announcement, make no representation as to its accuracy or completeness and expressly disclaim any liability whatsoever for any loss howsoever arising from or in reliance upon the whole or any part of the contents of this announcement.
招商銀行股份有限公司CHINA MERCHANTS BANK CO., LTD.
(A joint stock company incorporated in the People’s Republic of China with limited liability)
(Stock code: 03968)
2014 INTERIM RESULTS ANNOUNCEMENT
The Board of Directors of China Merchants Bank Co., Ltd. (the “Company”) hereby announces the unaudited results of the Company and its subsidiaries for the six months ended 30 June 2014. This announcement, containing the full text of the 2014 Interim Report of the Company, complies with the relevant requirements of the Rules Governing the Listing of Securities on The Stock Exchange of Hong Kong Limited in relation to information to accompany preliminary announcements of interim results. Printed version of the Company’s 2014 Interim Report will in due course be delivered to the H-Share Holders of the Company and available for viewing on the websites of The Stock Exchange of Hong Kong Limited (www.hkex.com.hk) and the Company (www.cmbchina.com).
Publication of Results Announcement
Both the Chinese and English versions of this results announcement are available on the websites of the Company (www.cmbchina.com) and The Stock Exchange of Hong Kong Limited (www.hkex.com.hk). In the event of any discrepancies in interpretations between the English version and the Chinese version, the Chinese version shall prevail.
The Company also prepared the Interim Report in Chinese in accordance with the PRC Generally Accepted Accounting Principles, which is available on the websites of the Company (www.cmbchina.com) and Shanghai Stock Exchange (www.sse.com.cn).
By Order of the BoardChina Merchants Bank Co., Ltd.
Li JianhongChairman
29 August 2014
As at the date of this announcement, the executive directors of the Company are Tian Huiyu, Zhang Guanghua and Li Hao; the non-executive directors of the Company are Li Jianhong, Ma Zehua, Li Yinquan, Fu Gangfeng, Sun Yueying, Fu Junyuan and Hong Xiaoyuan; and the independent non-executive directors of the Company are Xu Shanda, Wong Kwai Lam, Pan Chengwei, Pan Yingli, Guo Xuemeng and Xiao Yuhuai.
China Merchants Bank Interim Report 2014
1
Important Notice
1. The Board of Directors, the Board of Supervisors, directors, supervisors and senior management of the Company confirm that the contents in this report are true, accurate, complete and have no false representations, misleading statements or material omissions, and they will individually and collectively accept legal responsibility for such contents.
2. The 22nd meeting of the Ninth Session of the Board of Directors of the Company was held at the CMB CHINA MERCHANTS BANK University, Shenzhen on 29 August 2014. The meeting was presided by Li Jianhong, Chairman of the Board. 15 out of 16 eligible directors attended the meeting in person. Fu Junyuan (Director) was unable to attend the meeting because of other business engagements, and entrusted Li Yinquan (Director) to exercise the voting right. A total of 16 valid votes were cast. 6 supervisors of the Company were present at the meeting. The convening of the meeting complied with the relevant provisions of the Company Law and the Articles of Association of the Company.
3. The Company would not implement the profit appropriation nor would it transfer any capital reserve into share capital for the first half of 2014.
4. The Company’s 2014 interim financial report was unaudited.
5. Unless otherwise stated, all monetary sums stated in this interim report are expressed in RMB.
6. Li Jianhong, Chairman of the Company, Tian Huiyu, President and Chief Executive Officer, Li Hao, First Executive Vice President and Chief Financial Officer, and Wang Tao, the person in charge of the Finance and Accounting Department, hereby make representations in respect of the truthfulness, accuracy and completeness of the financial statements in this interim report.
7. We have included in this report certain forward-looking statements with respect to the financial position, operating results and business development of the Group. We use words such as “will”, “may”, “expect”, “try”, “strive”, “plan”, “anticipate”, “aim at”, and similar expressions to identify forward-looking statements. These statements are based on current plans, estimates and projections. Although we believe that the expectations reflected in these forward-looking statements are reasonable, we give no assurance that these expectations will prove to be correct. Therefore they should not be deemed as the Group’s commitments. Investors should not place undue reliance on such statements and should pay more attention to investment risks. You are cautioned that such forward-looking statements are related to future events or future financial position, business, or other performance of the Group, and are subject to a number of uncertainties which may cause substantial difference in the actual results.
China Merchants BankInterim Report 2014
2
Contents
Definitions 3Significant Risk Warning 3I Company Information 4II Summary of Accounting Data and Financial Indicators 6III Report of the Board of Directors 8IV Important Events 78V Share Capital Structure and Shareholder Base 84VI Directors, Supervisors, Senior Management, Employees, and Organisational Structure 88VII Corporate Governance 95
China Merchants Bank Interim Report 2014
3
Definitions
The Company, the Bank, CMB or China Merchants Bank: China Merchants Bank Co., Ltd.
The Group: China Merchants Bank Co., Ltd. and its subsidiaries
CBRC: China Banking Regulatory Commission
China Securities Regulatory Commission or CSRC: China Securities Regulatory Commission
Hong Kong Stock Exchange or SEHK: The Stock Exchange of Hong Kong Limited
Hong Kong Listing Rules: the Rules Governing the Listing of Securities on the SEHK
Wing Lung Bank: Wing Lung Bank Limited
Wing Lung Group: Wing Lung Bank and its subsidiaries
CMB Financial Leasing or CMBFL: CMB Financial Leasing Co., Ltd.
CMB International Capital or CMBIC: CMB International Capital Corporation Limited
China Merchants Fund or CMFM: China Merchants Fund Management Co., Ltd.
CIGNA & CMB Life Insurance: CIGNA & CMB Life Insurance Co., Ltd.
CM Securities: China Merchants Securities Co., Ltd.
KPMG Huazhen Certified Public Accountants: KPMG Huazhen Certified Public Accountants (Special General Partnership)
SFO: Securities and Futures Ordinance (Chapter 571 of the Laws of Hong Kong)
Model Code: Model Code for Securities Transactions by Directors of Listed Issuers
Significant Risk WarningThe Company has disclosed herein the major risks involved in its operations and the proposed risk management measures, please refer to Section III for the details in relation to risk management.
China Merchants BankInterim Report 2014
4
I Company Information
1 Company Profile1.1 Registered Company Name in Chinese: 招商銀行股份有限公司 (Chinese abbreviation: 招商銀行) Registered Company Name in English: China Merchants Bank Co., Ltd.
1.2 Legal Representative: Li Jianhong Authorised Representatives: Tian Huiyu, Li Hao Secretary of the Board of Directors: Xu Shiqing Joint Company Secretaries: Xu Shiqing, Seng Sze Ka Mee Natalia (FCIS, FCS(PE), FHKIoD, FTIHK) Securities Representative: Wu Jianbing
1.3 Registered and Office Address: 7088 Shennan Boulevard, Futian District, Shenzhen, Guangdong Province, China
1.4 Mailing Address:7088 Shennan Boulevard, Futian District, Shenzhen, Guangdong Province, China
Postcode: 518040 Tel: 86755-83198888 Fax: 86755-83195109 Email: [email protected] Website: www.cmbchina.com Customer service: 95555
1.5 Principal Place of Business in Hong Kong: 21st Floor, Bank of America Tower, 12 Harcourt Road, Hong Kong
1.6 Share Listing:A Share: Shanghai Stock Exchange Abbreviated Name of A Share: CMB Stock Code: 600036H Share: SEHK Stock Short Name: CM BANK Stock Code: 03968
1.7 Domestic Auditor: KPMG Huazhen Certified Public Accountants Office Address: 8th Floor, Tower 2, Oriental Plaza, 1 East Chang An Avenue,
Beijing, China
International Auditor: KPMG Certified Public Accountants Office Address: 8th Floor, Prince’s Building, 10 Charter Road, Central, Hong Kong
1.8 Legal Advisor as to PRC Law: Jun He Law Offices Legal Advisor as to Hong Kong Law: Herbert Smith Freehills
China Merchants Bank Interim Report 2014
5
I Company Information
1.9 Depository for A Share: China Securities Depository & Clearing Corporation Ltd., Shanghai Branch
1.10 Share Register and Transfer Office as to H Share: Computershare Hong Kong Investor Services Ltd. Shops 1712-1716, 17/F, Hopewell Centre, 183 Queen’s Road East, Wan Chai, Hong Kong
1.11 Websites and Newspapers Designated by the Company for Information Disclosure: Mainland China: “China Securities Journal”, “Securities Times”, “Shanghai Securities News” website of Shanghai Stock Exchange (www.sse.com.cn), website of the Company (www.cmbchina.com) Hong Kong: website of SEHK (www.hkex.com.hk), website of the Company (www.cmbchina.com) Place of maintenance of interim reports: Office of the Board of Directors of the Company
1.12 Other Information about the Company:Initial registration date: 31 March 1987Initial registration place: Administration for Industry and Commerce of Shenzhen, Shekou BranchRegistered No. of business license for an enterprise as a legal person: 440301104433862Taxation Registration No.: Shen Shui Deng Zi 44030010001686XOrganisation Code: 10001686-X
China Merchants BankInterim Report 2014
6
II Summary of Accounting Data and Financial Indicators
2.1 Key Accounting Data and Financial Indicators
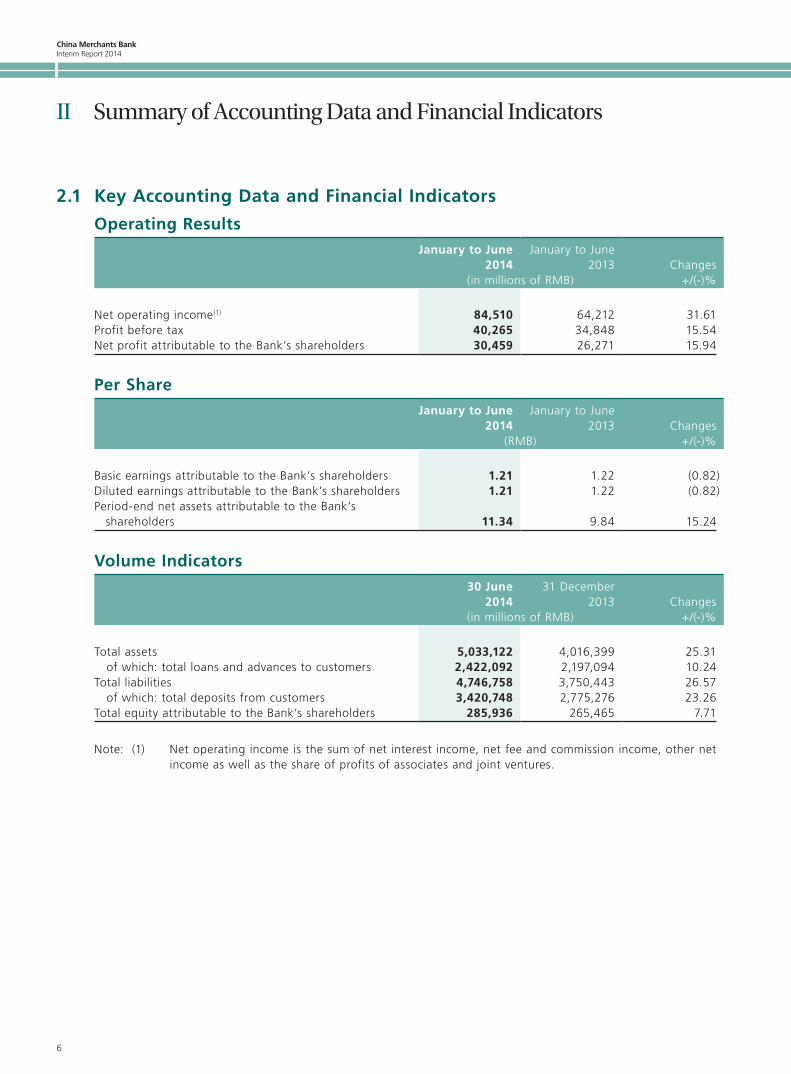
Operating ResultsJanuary to June
2014January to June
2013 Changes (in millions of RMB) +/(-)%
Net operating income(1) 84,510 64,212 31.61Profit before tax 40,265 34,848 15.54Net profit attributable to the Bank’s shareholders 30,459 26,271 15.94
Per ShareJanuary to June
2014January to June
2013 Changes (RMB) +/(-)%
Basic earnings attributable to the Bank’s shareholders 1.21 1.22 (0.82)Diluted earnings attributable to the Bank’s shareholders 1.21 1.22 (0.82)Period-end net assets attributable to the Bank’s
shareholders 11.34 9.84 15.24
Volume Indicators30 June
201431 December
2013 Changes(in millions of RMB) +/(-)%
Total assets 5,033,122 4,016,399 25.31 of which: total loans and advances to customers 2,422,092 2,197,094 10.24Total liabilities 4,746,758 3,750,443 26.57 of which: total deposits from customers 3,420,748 2,775,276 23.26Total equity attributable to the Bank’s shareholders 285,936 265,465 7.71
Note: (1) Net operating income is the sum of net interest income, net fee and commission income, other net income as well as the share of profits of associates and joint ventures.
China Merchants Bank Interim Report 2014
7
II Summary of Accounting Data and Financial Indicators
2.2 Financial Ratios
January to June 2014
(%)
January to December 2013
(%)
January to June 2013
(%)
Changes over the corresponding period of the previous year
+/(-)
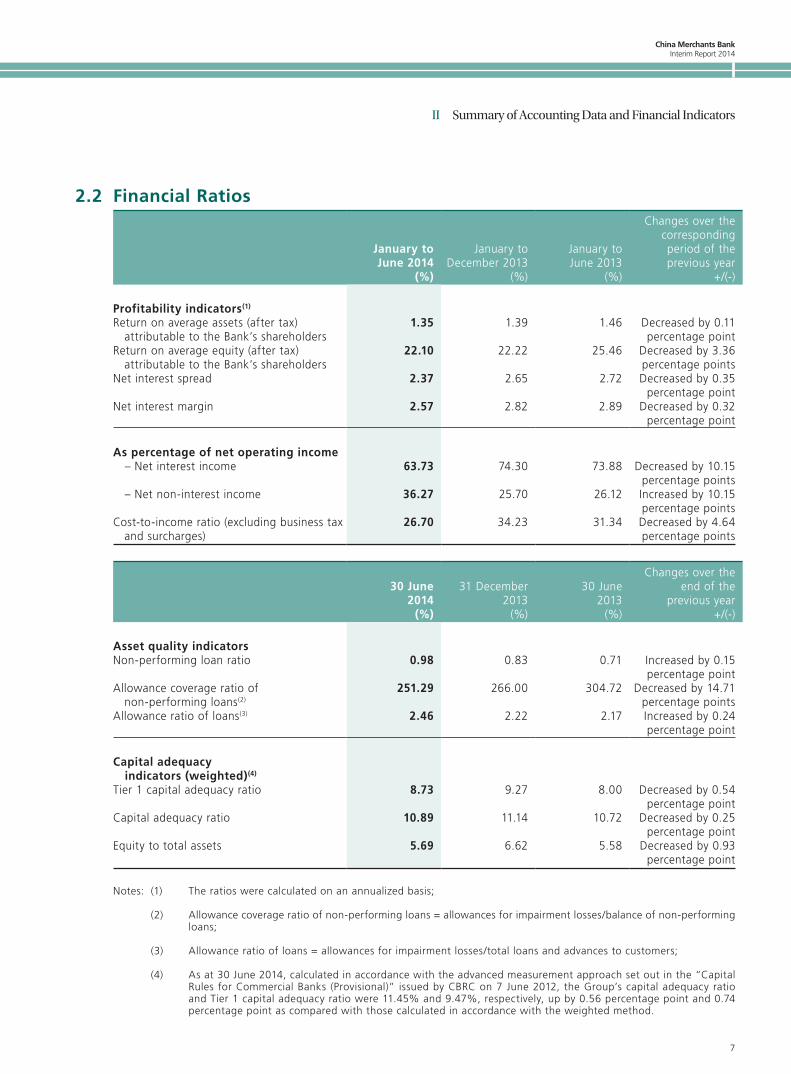
Profitability indicators(1)
Return on average assets (after tax) attributable to the Bank’s shareholders
1.35 1.39 1.46 Decreased by 0.11percentage point
Return on average equity (after tax) attributable to the Bank’s shareholders
22.10 22.22 25.46 Decreased by 3.36percentage points
Net interest spread 2.37 2.65 2.72 Decreased by 0.35percentage point
Net interest margin 2.57 2.82 2.89 Decreased by 0.32percentage point
As percentage of net operating income – Net interest income 63.73 74.30 73.88 Decreased by 10.15
percentage points – Net non-interest income 36.27 25.70 26.12 Increased by 10.15
percentage pointsCost-to-income ratio (excluding business tax
and surcharges)26.70 34.23 31.34 Decreased by 4.64
percentage points
30 June 2014
(%)
31 December 2013
(%)
30 June 2013
(%)
Changes over the end of the
previous year+/(-)
Asset quality indicatorsNon-performing loan ratio 0.98 0.83 0.71 Increased by 0.15
percentage pointAllowance coverage ratio of
non-performing loans(2)251.29 266.00 304.72 Decreased by 14.71
percentage pointsAllowance ratio of loans(3) 2.46 2.22 2.17 Increased by 0.24
percentage point
Capital adequacy indicators (weighted)(4)
Tier 1 capital adequacy ratio 8.73 9.27 8.00 Decreased by 0.54percentage point
Capital adequacy ratio 10.89 11.14 10.72 Decreased by 0.25percentage point
Equity to total assets 5.69 6.62 5.58 Decreased by 0.93percentage point
Notes: (1) The ratios were calculated on an annualized basis;
(2) Allowance coverage ratio of non-performing loans = allowances for impairment losses/balance of non-performing loans;
(3) Allowance ratio of loans = allowances for impairment losses/total loans and advances to customers;
(4) As at 30 June 2014, calculated in accordance with the advanced measurement approach set out in the “Capital Rules for Commercial Banks (Provisional)” issued by CBRC on 7 June 2012, the Group’s capital adequacy ratio and Tier 1 capital adequacy ratio were 11.45% and 9.47%, respectively, up by 0.56 percentage point and 0.74 percentage point as compared with those calculated in accordance with the weighted method.
China Merchants BankInterim Report 2014
8
III Report of the Board of Directors
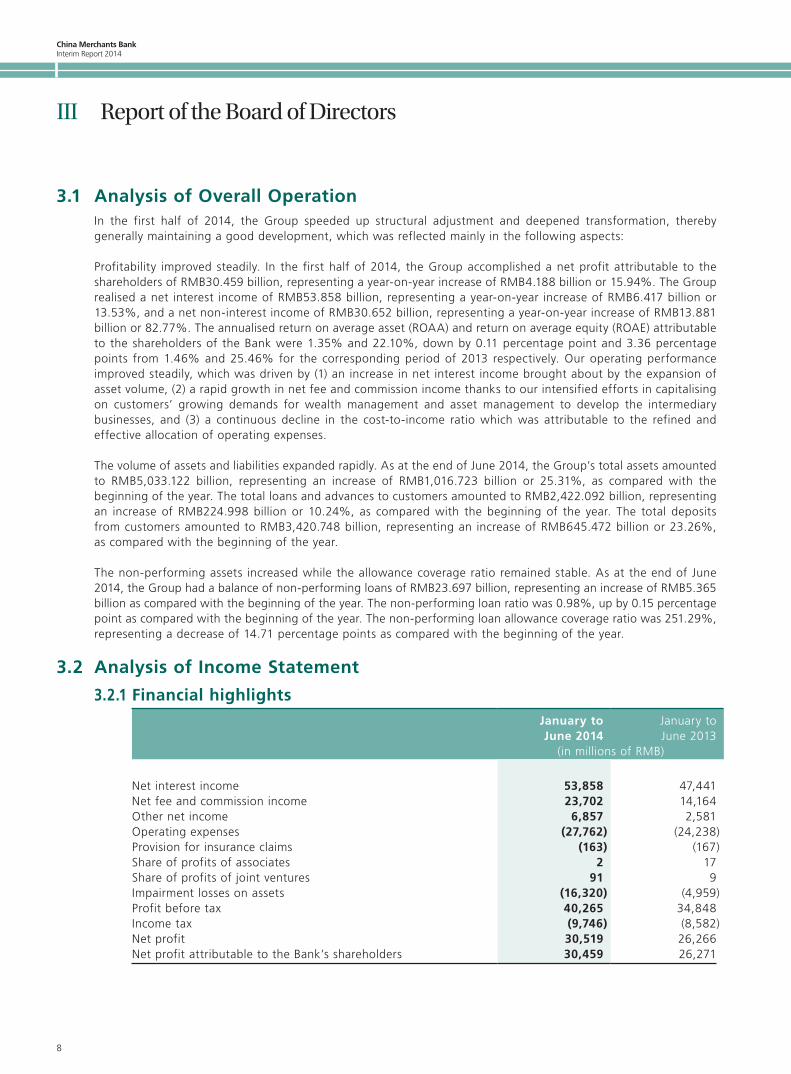
3.1 Analysis of Overall OperationIn the first half of 2014, the Group speeded up structural adjustment and deepened transformation, thereby generally maintaining a good development, which was reflected mainly in the following aspects:
Profitability improved steadily. In the first half of 2014, the Group accomplished a net profit attributable to the shareholders of RMB30.459 billion, representing a year-on-year increase of RMB4.188 billion or 15.94%. The Group realised a net interest income of RMB53.858 billion, representing a year-on-year increase of RMB6.417 billion or 13.53%, and a net non-interest income of RMB30.652 billion, representing a year-on-year increase of RMB13.881 billion or 82.77%. The annualised return on average asset (ROAA) and return on average equity (ROAE) attributable to the shareholders of the Bank were 1.35% and 22.10%, down by 0.11 percentage point and 3.36 percentage points from 1.46% and 25.46% for the corresponding period of 2013 respectively. Our operating performance improved steadily, which was driven by (1) an increase in net interest income brought about by the expansion of asset volume, (2) a rapid growth in net fee and commission income thanks to our intensified efforts in capitalising on customers’ growing demands for wealth management and asset management to develop the intermediary businesses, and (3) a continuous decline in the cost-to-income ratio which was attributable to the refined and effective allocation of operating expenses.
The volume of assets and liabilities expanded rapidly. As at the end of June 2014, the Group’s total assets amounted to RMB5,033.122 billion, representing an increase of RMB1,016.723 billion or 25.31%, as compared with the beginning of the year. The total loans and advances to customers amounted to RMB2,422.092 billion, representing an increase of RMB224.998 billion or 10.24%, as compared with the beginning of the year. The total deposits from customers amounted to RMB3,420.748 billion, representing an increase of RMB645.472 billion or 23.26%, as compared with the beginning of the year.
The non-performing assets increased while the allowance coverage ratio remained stable. As at the end of June 2014, the Group had a balance of non-performing loans of RMB23.697 billion, representing an increase of RMB5.365 billion as compared with the beginning of the year. The non-performing loan ratio was 0.98%, up by 0.15 percentage point as compared with the beginning of the year. The non-performing loan allowance coverage ratio was 251.29%, representing a decrease of 14.71 percentage points as compared with the beginning of the year.
3.2 Analysis of Income Statement
3.2.1 Financial highlightsJanuary to June 2014
January to June 2013
(in millions of RMB)
Net interest income 53,858 47,441Net fee and commission income 23,702 14,164Other net income 6,857 2,581Operating expenses (27,762) (24,238)Provision for insurance claims (163) (167)Share of profits of associates 2 17Share of profits of joint ventures 91 9Impairment losses on assets (16,320) (4,959)Profit before tax 40,265 34,848Income tax (9,746) (8,582)Net profit 30,519 26,266Net profit attributable to the Bank’s shareholders 30,459 26,271
China Merchants Bank Interim Report 2014
9
III Report of the Board of Directors
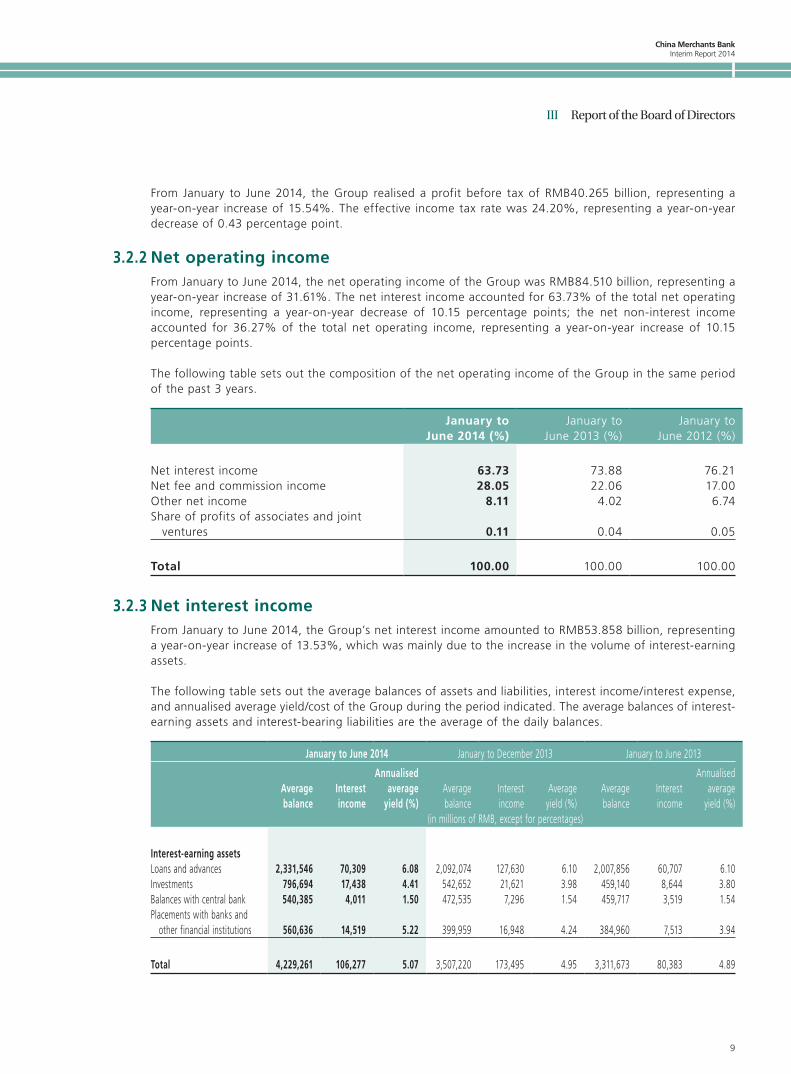
From January to June 2014, the Group realised a profit before tax of RMB40.265 billion, representing a year-on-year increase of 15.54%. The effective income tax rate was 24.20%, representing a year-on-year decrease of 0.43 percentage point.
3.2.2 Net operating incomeFrom January to June 2014, the net operating income of the Group was RMB84.510 billion, representing a year-on-year increase of 31.61%. The net interest income accounted for 63.73% of the total net operating income, representing a year-on-year decrease of 10.15 percentage points; the net non-interest income accounted for 36.27% of the total net operating income, representing a year-on-year increase of 10.15 percentage points.
The following table sets out the composition of the net operating income of the Group in the same period of the past 3 years.
January to June 2014 (%)
January to June 2013 (%)
January to June 2012 (%)
Net interest income 63.73 73.88 76.21Net fee and commission income 28.05 22.06 17.00Other net income 8.11 4.02 6.74Share of profits of associates and joint
ventures 0.11 0.04 0.05
Total 100.00 100.00 100.00
3.2.3 Net interest incomeFrom January to June 2014, the Group’s net interest income amounted to RMB53.858 billion, representing a year-on-year increase of 13.53%, which was mainly due to the increase in the volume of interest-earning assets.
The following table sets out the average balances of assets and liabilities, interest income/interest expense, and annualised average yield/cost of the Group during the period indicated. The average balances of interest-earning assets and interest-bearing liabilities are the average of the daily balances.
January to June 2014 January to December 2013 January to June 2013
Average balance
Interest income
Annualised average
yield (%)Average balance
Interest income
Average yield (%)
Average balance
Interest income
Annualised average
yield (%)(in millions of RMB, except for percentages)
Interest-earning assetsLoans and advances 2,331,546 70,309 6.08 2,092,074 127,630 6.10 2,007,856 60,707 6.10Investments 796,694 17,438 4.41 542,652 21,621 3.98 459,140 8,644 3.80Balances with central bank 540,385 4,011 1.50 472,535 7,296 1.54 459,717 3,519 1.54Placements with banks and other financial institutions 560,636 14,519 5.22 399,959 16,948 4.24 384,960 7,513 3.94
Total 4,229,261 106,277 5.07 3,507,220 173,495 4.95 3,311,673 80,383 4.89
China Merchants BankInterim Report 2014
10
III Report of the Board of Directors
January to June 2014 January to December 2013 January to June 2013
Average balance
Interest expense
Annualised average cost (%)
Average balance
Interest expense
Average cost (%)
Average balance
Interest expense
Annualised average cost (%)
(in millions of RMB, except for percentages)
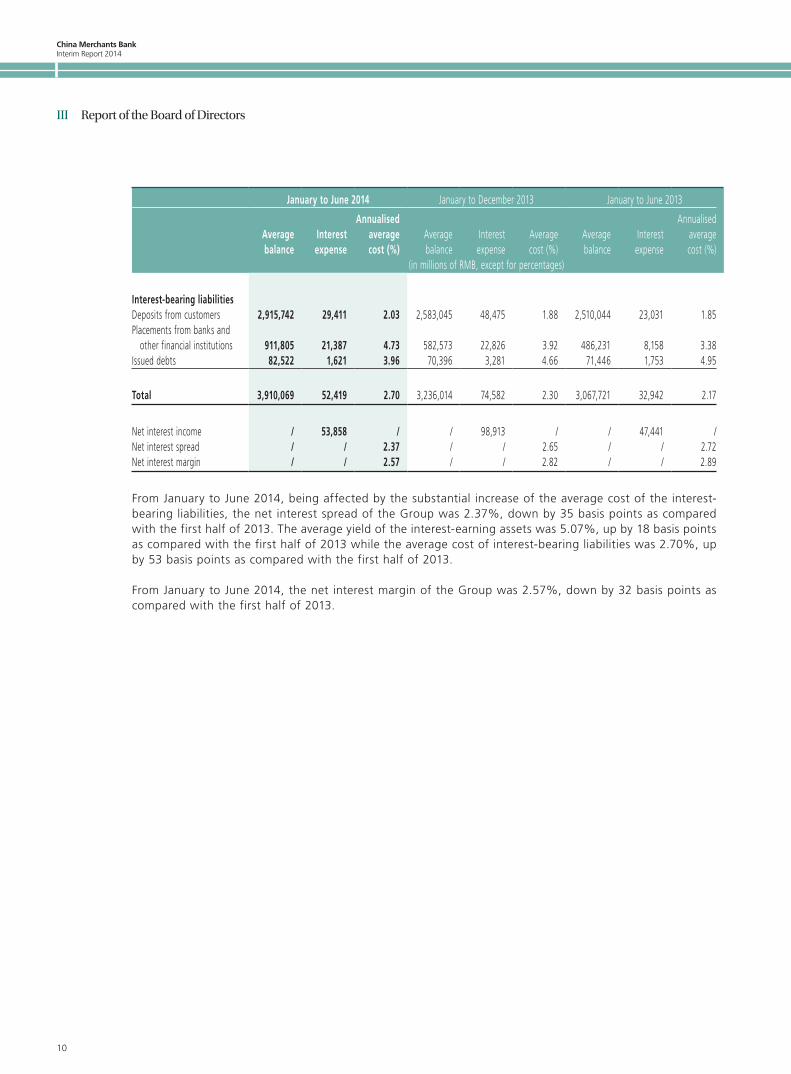
Interest-bearing liabilitiesDeposits from customers 2,915,742 29,411 2.03 2,583,045 48,475 1.88 2,510,044 23,031 1.85Placements from banks and other financial institutions 911,805 21,387 4.73 582,573 22,826 3.92 486,231 8,158 3.38Issued debts 82,522 1,621 3.96 70,396 3,281 4.66 71,446 1,753 4.95
Total 3,910,069 52,419 2.70 3,236,014 74,582 2.30 3,067,721 32,942 2.17
Net interest income / 53,858 / / 98,913 / / 47,441 /Net interest spread / / 2.37 / / 2.65 / / 2.72Net interest margin / / 2.57 / / 2.82 / / 2.89
From January to June 2014, being affected by the substantial increase of the average cost of the interest-bearing liabilities, the net interest spread of the Group was 2.37%, down by 35 basis points as compared with the first half of 2013. The average yield of the interest-earning assets was 5.07%, up by 18 basis points as compared with the first half of 2013 while the average cost of interest-bearing liabilities was 2.70%, up by 53 basis points as compared with the first half of 2013.
From January to June 2014, the net interest margin of the Group was 2.57%, down by 32 basis points as compared with the first half of 2013.
China Merchants Bank Interim Report 2014
11
III Report of the Board of Directors
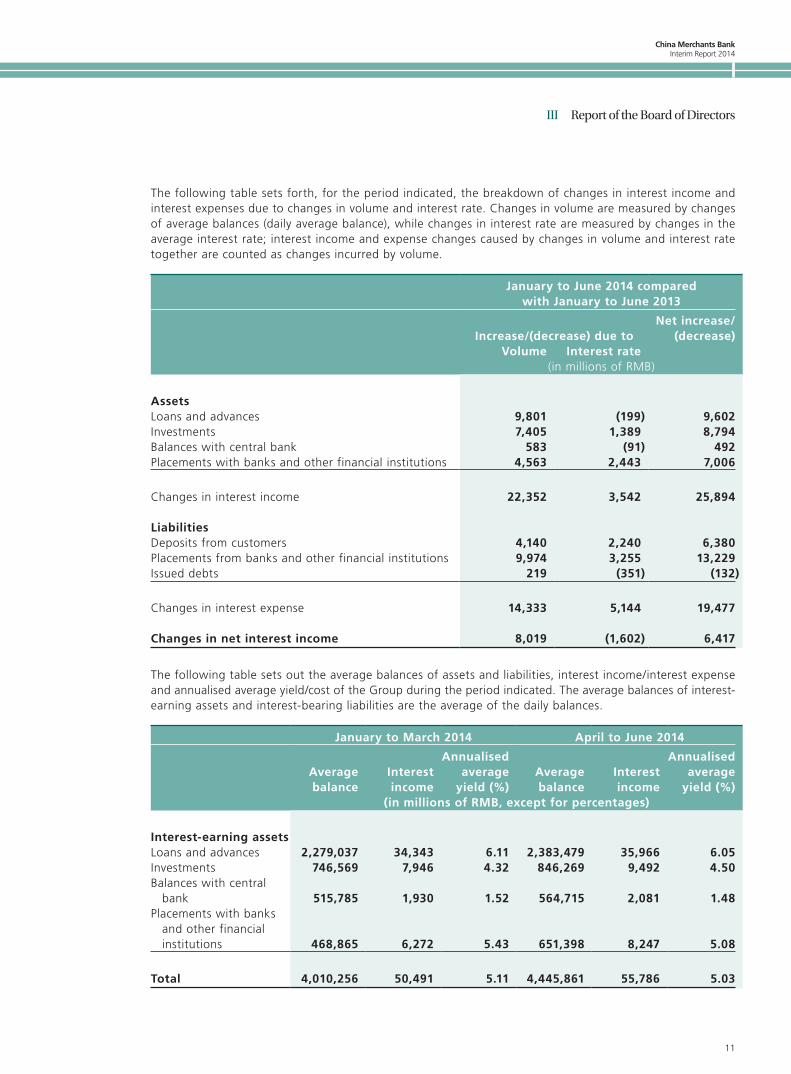
The following table sets forth, for the period indicated, the breakdown of changes in interest income and interest expenses due to changes in volume and interest rate. Changes in volume are measured by changes of average balances (daily average balance), while changes in interest rate are measured by changes in the average interest rate; interest income and expense changes caused by changes in volume and interest rate together are counted as changes incurred by volume.
January to June 2014 compared with January to June 2013
Increase/(decrease) due toNet increase/
(decrease)Volume Interest rate
(in millions of RMB)
AssetsLoans and advances 9,801 (199) 9,602Investments 7,405 1,389 8,794Balances with central bank 583 (91) 492Placements with banks and other financial institutions 4,563 2,443 7,006
Changes in interest income 22,352 3,542 25,894
LiabilitiesDeposits from customers 4,140 2,240 6,380Placements from banks and other financial institutions 9,974 3,255 13,229Issued debts 219 (351) (132)
Changes in interest expense 14,333 5,144 19,477
Changes in net interest income 8,019 (1,602) 6,417
The following table sets out the average balances of assets and liabilities, interest income/interest expense and annualised average yield/cost of the Group during the period indicated. The average balances of interest-earning assets and interest-bearing liabilities are the average of the daily balances.
January to March 2014 April to June 2014
Average balance
Interest income
Annualised average
yield (%)Average balance
Interest income
Annualised average
yield (%)(in millions of RMB, except for percentages)
Interest-earning assetsLoans and advances 2,279,037 34,343 6.11 2,383,479 35,966 6.05Investments 746,569 7,946 4.32 846,269 9,492 4.50Balances with central
bank 515,785 1,930 1.52 564,715 2,081 1.48Placements with banks
and other financial institutions 468,865 6,272 5.43 651,398 8,247 5.08
Total 4,010,256 50,491 5.11 4,445,861 55,786 5.03
China Merchants BankInterim Report 2014
12
III Report of the Board of Directors
January to March 2014 April to June 2014
Average balance
Interest expense
Annualised average
yield (%)Average balance
Interest expense
Annualised average
yield (%)(in millions of RMB, except for percentages)
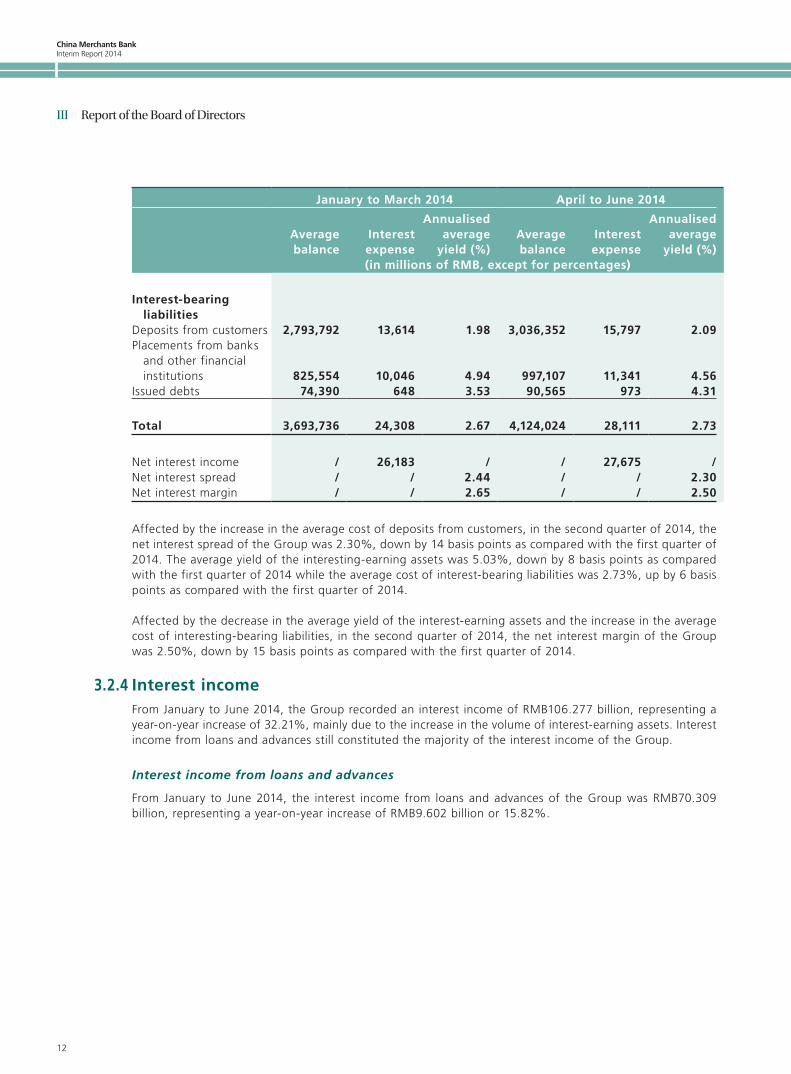
Interest-bearing liabilities
Deposits from customers 2,793,792 13,614 1.98 3,036,352 15,797 2.09Placements from banks
and other financial institutions 825,554 10,046 4.94 997,107 11,341 4.56
Issued debts 74,390 648 3.53 90,565 973 4.31
Total 3,693,736 24,308 2.67 4,124,024 28,111 2.73
Net interest income / 26,183 / / 27,675 /Net interest spread / / 2.44 / / 2.30Net interest margin / / 2.65 / / 2.50
Affected by the increase in the average cost of deposits from customers, in the second quarter of 2014, the net interest spread of the Group was 2.30%, down by 14 basis points as compared with the first quarter of 2014. The average yield of the interesting-earning assets was 5.03%, down by 8 basis points as compared with the first quarter of 2014 while the average cost of interest-bearing liabilities was 2.73%, up by 6 basis points as compared with the first quarter of 2014.
Affected by the decrease in the average yield of the interest-earning assets and the increase in the average cost of interesting-bearing liabilities, in the second quarter of 2014, the net interest margin of the Group was 2.50%, down by 15 basis points as compared with the first quarter of 2014.
3.2.4 Interest incomeFrom January to June 2014, the Group recorded an interest income of RMB106.277 billion, representing a year-on-year increase of 32.21%, mainly due to the increase in the volume of interest-earning assets. Interest income from loans and advances still constituted the majority of the interest income of the Group.
Interest income from loans and advances
From January to June 2014, the interest income from loans and advances of the Group was RMB70.309 billion, representing a year-on-year increase of RMB9.602 billion or 15.82%.
China Merchants Bank Interim Report 2014
13
III Report of the Board of Directors
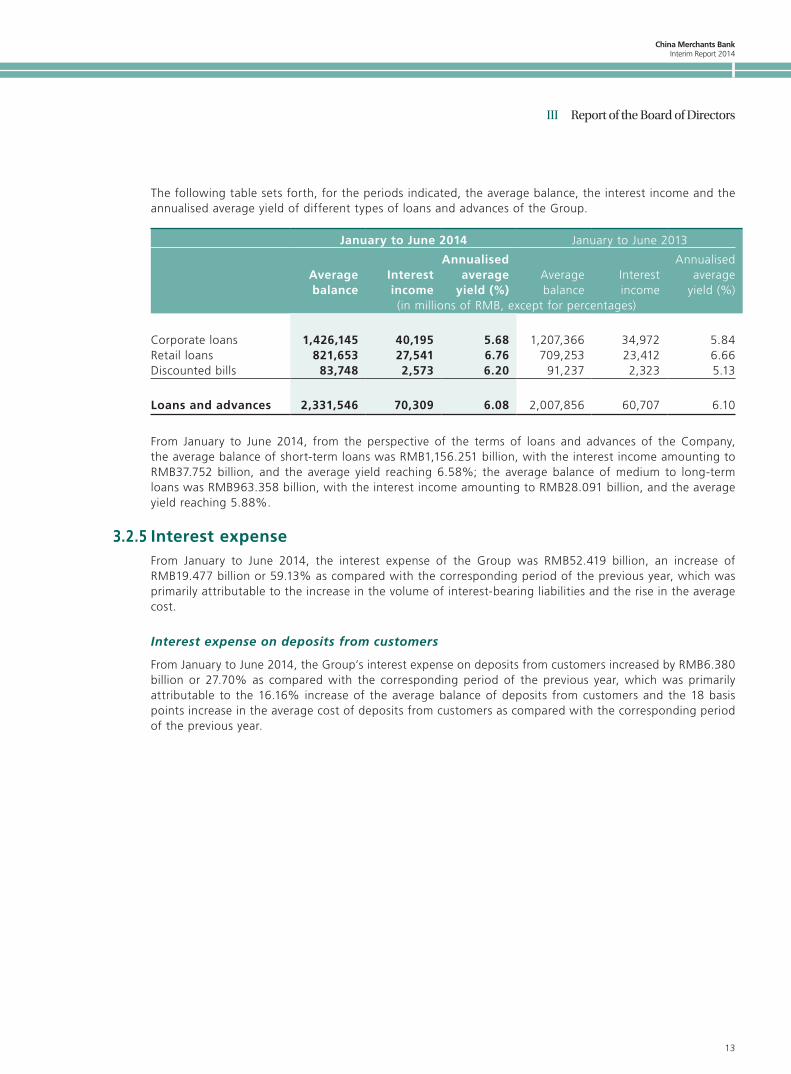
The following table sets forth, for the periods indicated, the average balance, the interest income and the annualised average yield of different types of loans and advances of the Group.
January to June 2014 January to June 2013
Average balance
Interest income
Annualised average
yield (%)Average balance
Interest income
Annualised average
yield (%)(in millions of RMB, except for percentages)
Corporate loans 1,426,145 40,195 5.68 1,207,366 34,972 5.84Retail loans 821,653 27,541 6.76 709,253 23,412 6.66Discounted bills 83,748 2,573 6.20 91,237 2,323 5.13
Loans and advances 2,331,546 70,309 6.08 2,007,856 60,707 6.10
From January to June 2014, from the perspective of the terms of loans and advances of the Company, the average balance of short-term loans was RMB1,156.251 billion, with the interest income amounting to RMB37.752 billion, and the average yield reaching 6.58%; the average balance of medium to long-term loans was RMB963.358 billion, with the interest income amounting to RMB28.091 billion, and the average yield reaching 5.88%.
3.2.5 Interest expenseFrom January to June 2014, the interest expense of the Group was RMB52.419 billion, an increase of RMB19.477 billion or 59.13% as compared with the corresponding period of the previous year, which was primarily attributable to the increase in the volume of interest-bearing liabilities and the rise in the average cost.
Interest expense on deposits from customers
From January to June 2014, the Group’s interest expense on deposits from customers increased by RMB6.380 billion or 27.70% as compared with the corresponding period of the previous year, which was primarily attributable to the 16.16% increase of the average balance of deposits from customers and the 18 basis points increase in the average cost of deposits from customers as compared with the corresponding period of the previous year.
China Merchants BankInterim Report 2014
14
III Report of the Board of Directors
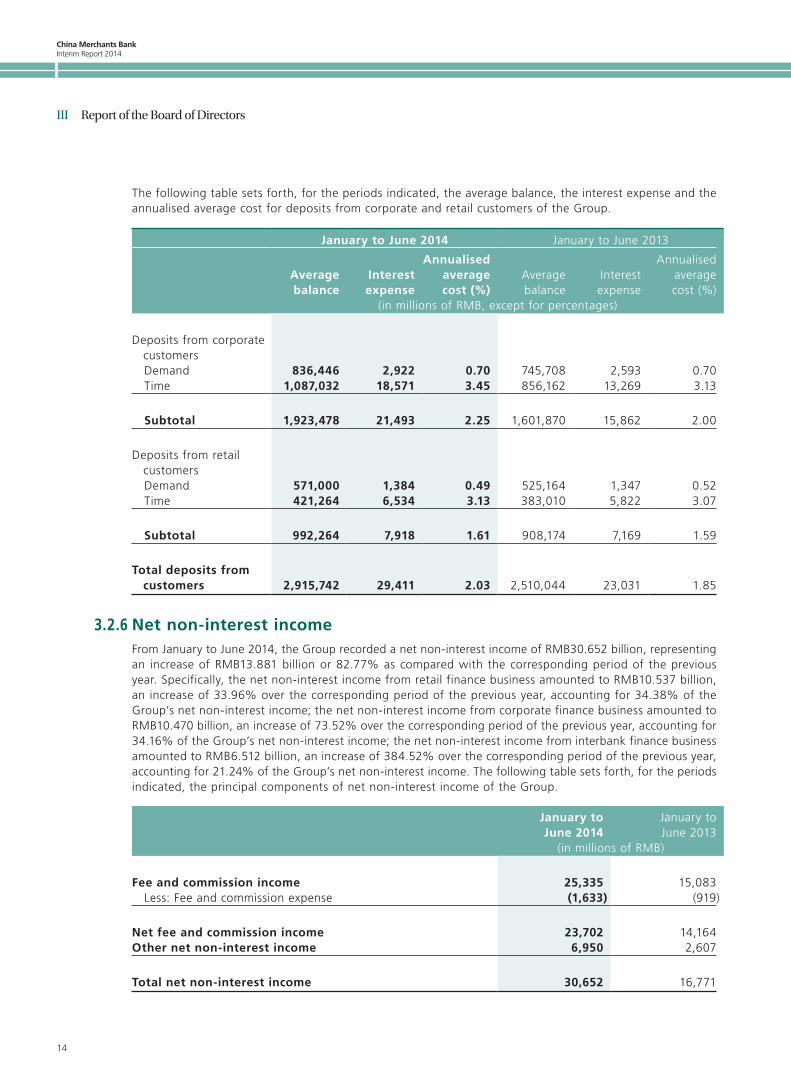
The following table sets forth, for the periods indicated, the average balance, the interest expense and the annualised average cost for deposits from corporate and retail customers of the Group.
January to June 2014 January to June 2013
Average balance
Interest expense
Annualised average cost (%)
Average balance
Interest expense
Annualised average cost (%)
(in millions of RMB, except for percentages)
Deposits from corporate customers
Demand 836,446 2,922 0.70 745,708 2,593 0.70 Time 1,087,032 18,571 3.45 856,162 13,269 3.13
Subtotal 1,923,478 21,493 2.25 1,601,870 15,862 2.00
Deposits from retail customers
Demand 571,000 1,384 0.49 525,164 1,347 0.52 Time 421,264 6,534 3.13 383,010 5,822 3.07
Subtotal 992,264 7,918 1.61 908,174 7,169 1.59
Total deposits from customers 2,915,742 29,411 2.03 2,510,044 23,031 1.85
3.2.6 Net non-interest incomeFrom January to June 2014, the Group recorded a net non-interest income of RMB30.652 billion, representing an increase of RMB13.881 billion or 82.77% as compared with the corresponding period of the previous year. Specifically, the net non-interest income from retail finance business amounted to RMB10.537 billion, an increase of 33.96% over the corresponding period of the previous year, accounting for 34.38% of the Group’s net non-interest income; the net non-interest income from corporate finance business amounted to RMB10.470 billion, an increase of 73.52% over the corresponding period of the previous year, accounting for 34.16% of the Group’s net non-interest income; the net non-interest income from interbank finance business amounted to RMB6.512 billion, an increase of 384.52% over the corresponding period of the previous year, accounting for 21.24% of the Group’s net non-interest income. The following table sets forth, for the periods indicated, the principal components of net non-interest income of the Group.
January to June 2014
January to June 2013
(in millions of RMB)
Fee and commission income 25,335 15,083 Less: Fee and commission expense (1,633) (919)
Net fee and commission income 23,702 14,164Other net non-interest income 6,950 2,607
Total net non-interest income 30,652 16,771
China Merchants Bank Interim Report 2014
15
III Report of the Board of Directors
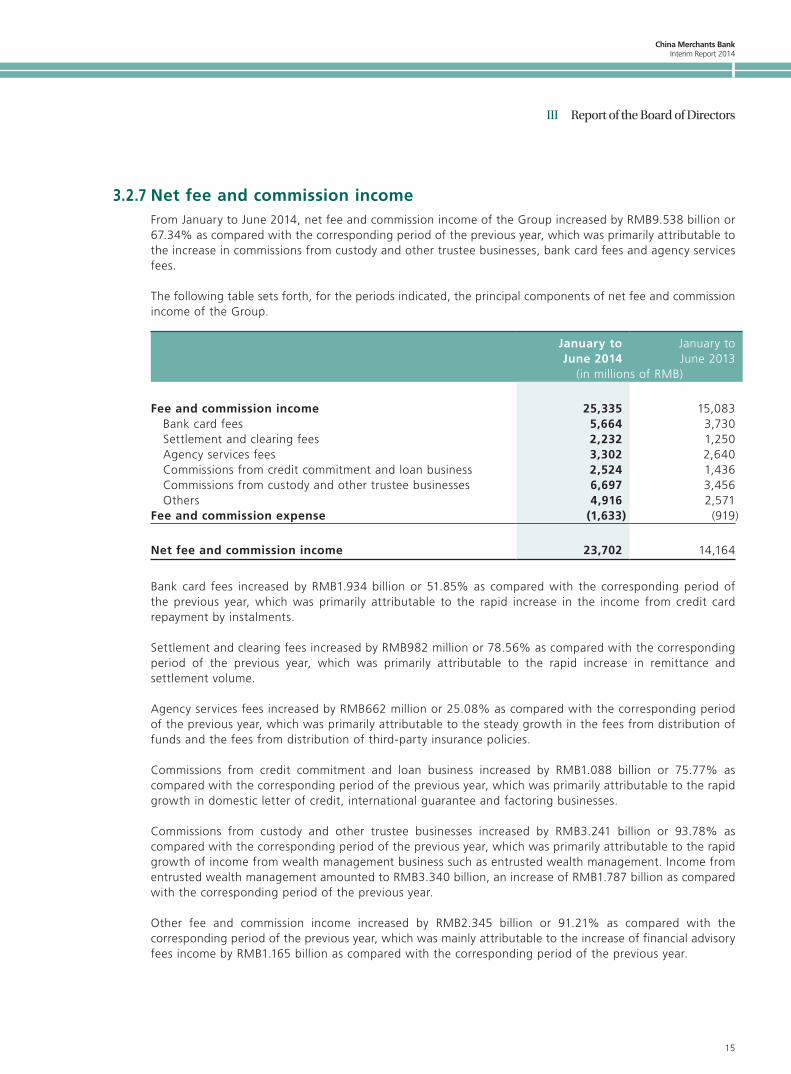
3.2.7 Net fee and commission incomeFrom January to June 2014, net fee and commission income of the Group increased by RMB9.538 billion or 67.34% as compared with the corresponding period of the previous year, which was primarily attributable to the increase in commissions from custody and other trustee businesses, bank card fees and agency services fees.
The following table sets forth, for the periods indicated, the principal components of net fee and commission income of the Group.
January to June 2014
January to June 2013
(in millions of RMB)
Fee and commission income 25,335 15,083 Bank card fees 5,664 3,730 Settlement and clearing fees 2,232 1,250 Agency services fees 3,302 2,640 Commissions from credit commitment and loan business 2,524 1,436 Commissions from custody and other trustee businesses 6,697 3,456 Others 4,916 2,571Fee and commission expense (1,633) (919)
Net fee and commission income 23,702 14,164
Bank card fees increased by RMB1.934 billion or 51.85% as compared with the corresponding period of the previous year, which was primarily attributable to the rapid increase in the income from credit card repayment by instalments.
Settlement and clearing fees increased by RMB982 million or 78.56% as compared with the corresponding period of the previous year, which was primarily attributable to the rapid increase in remittance and settlement volume.
Agency services fees increased by RMB662 million or 25.08% as compared with the corresponding period of the previous year, which was primarily attributable to the steady growth in the fees from distribution of funds and the fees from distribution of third-party insurance policies.
Commissions from credit commitment and loan business increased by RMB1.088 billion or 75.77% as compared with the corresponding period of the previous year, which was primarily attributable to the rapid growth in domestic letter of credit, international guarantee and factoring businesses.
Commissions from custody and other trustee businesses increased by RMB3.241 billion or 93.78% as compared with the corresponding period of the previous year, which was primarily attributable to the rapid growth of income from wealth management business such as entrusted wealth management. Income from entrusted wealth management amounted to RMB3.340 billion, an increase of RMB1.787 billion as compared with the corresponding period of the previous year.
Other fee and commission income increased by RMB2.345 billion or 91.21% as compared with the corresponding period of the previous year, which was mainly attributable to the increase of financial advisory fees income by RMB1.165 billion as compared with the corresponding period of the previous year.
China Merchants BankInterim Report 2014
16
III Report of the Board of Directors
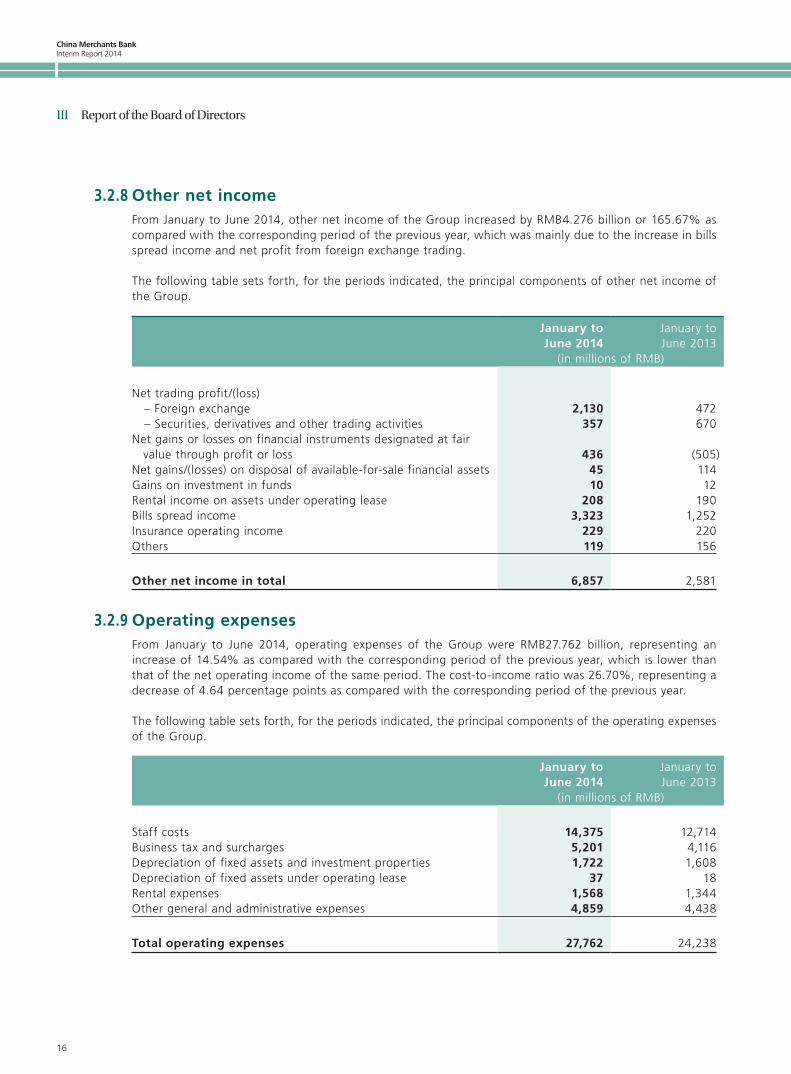
3.2.8 Other net incomeFrom January to June 2014, other net income of the Group increased by RMB4.276 billion or 165.67% as compared with the corresponding period of the previous year, which was mainly due to the increase in bills spread income and net profit from foreign exchange trading.
The following table sets forth, for the periods indicated, the principal components of other net income of the Group.
January to June 2014
January to June 2013
(in millions of RMB)
Net trading profit/(loss) – Foreign exchange 2,130 472 – Securities, derivatives and other trading activities 357 670Net gains or losses on financial instruments designated at fair
value through profit or loss 436 (505)Net gains/(losses) on disposal of available-for-sale financial assets 45 114Gains on investment in funds 10 12Rental income on assets under operating lease 208 190Bills spread income 3,323 1,252Insurance operating income 229 220Others 119 156
Other net income in total 6,857 2,581
3.2.9 Operating expensesFrom January to June 2014, operating expenses of the Group were RMB27.762 billion, representing an increase of 14.54% as compared with the corresponding period of the previous year, which is lower than that of the net operating income of the same period. The cost-to-income ratio was 26.70%, representing a decrease of 4.64 percentage points as compared with the corresponding period of the previous year.
The following table sets forth, for the periods indicated, the principal components of the operating expenses of the Group.
January to June 2014
January to June 2013
(in millions of RMB)
Staff costs 14,375 12,714Business tax and surcharges 5,201 4,116Depreciation of fixed assets and investment properties 1,722 1,608Depreciation of fixed assets under operating lease 37 18Rental expenses 1,568 1,344Other general and administrative expenses 4,859 4,438
Total operating expenses 27,762 24,238
China Merchants Bank Interim Report 2014
17
III Report of the Board of Directors
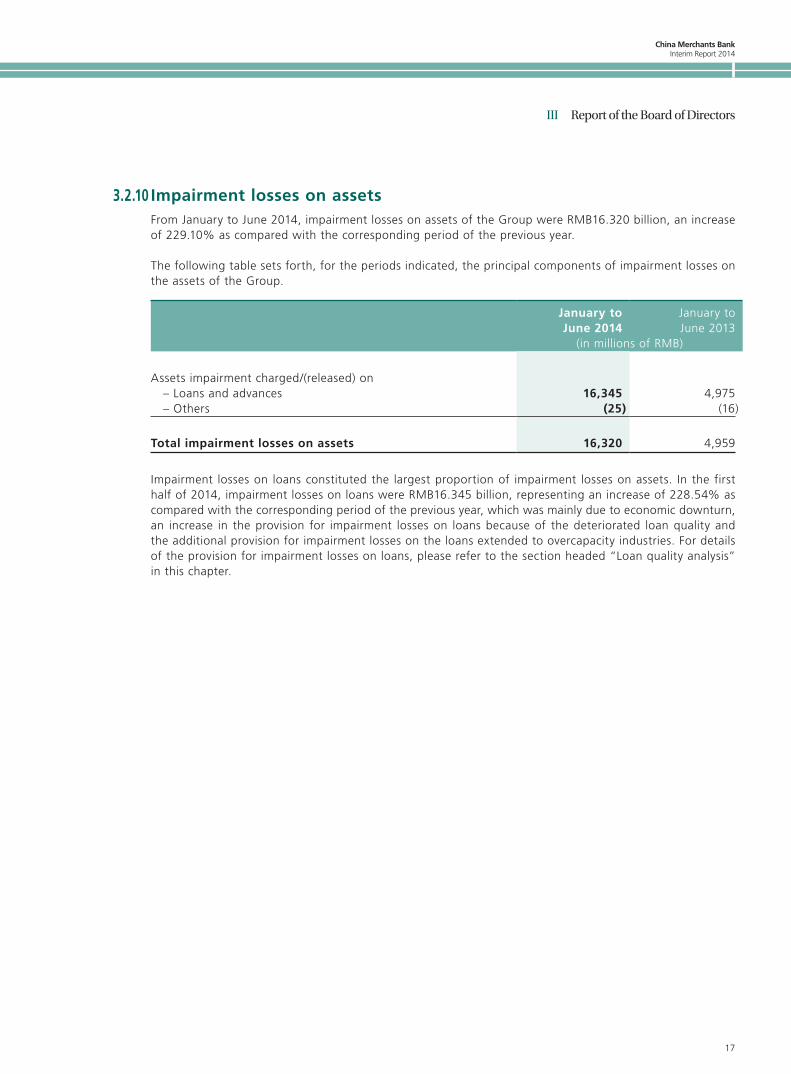
3.2.10 Impairment losses on assetsFrom January to June 2014, impairment losses on assets of the Group were RMB16.320 billion, an increase of 229.10% as compared with the corresponding period of the previous year.
The following table sets forth, for the periods indicated, the principal components of impairment losses on the assets of the Group.
January to June 2014
January to June 2013
(in millions of RMB)
Assets impairment charged/(released) on – Loans and advances 16,345 4,975 – Others (25) (16)
Total impairment losses on assets 16,320 4,959
Impairment losses on loans constituted the largest proportion of impairment losses on assets. In the first half of 2014, impairment losses on loans were RMB16.345 billion, representing an increase of 228.54% as compared with the corresponding period of the previous year, which was mainly due to economic downturn, an increase in the provision for impairment losses on loans because of the deteriorated loan quality and the additional provision for impairment losses on the loans extended to overcapacity industries. For details of the provision for impairment losses on loans, please refer to the section headed “Loan quality analysis” in this chapter.
China Merchants BankInterim Report 2014
18
III Report of the Board of Directors
3.3 Analysis of Balance Sheet
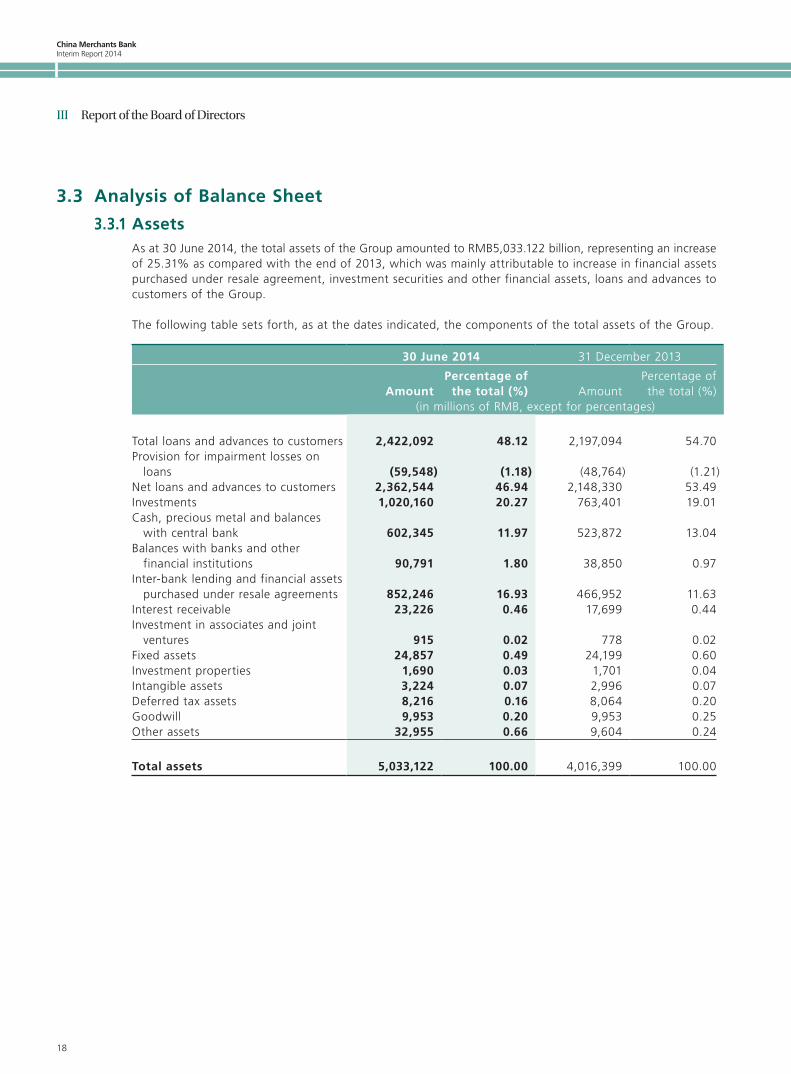
3.3.1 AssetsAs at 30 June 2014, the total assets of the Group amounted to RMB5,033.122 billion, representing an increase of 25.31% as compared with the end of 2013, which was mainly attributable to increase in financial assets purchased under resale agreement, investment securities and other financial assets, loans and advances to customers of the Group.
The following table sets forth, as at the dates indicated, the components of the total assets of the Group.
30 June 2014 31 December 2013
AmountPercentage of
the total (%) AmountPercentage of the total (%)
(in millions of RMB, except for percentages)
Total loans and advances to customers 2,422,092 48.12 2,197,094 54.70Provision for impairment losses on
loans (59,548) (1.18) (48,764) (1.21)Net loans and advances to customers 2,362,544 46.94 2,148,330 53.49Investments 1,020,160 20.27 763,401 19.01Cash, precious metal and balances
with central bank 602,345 11.97 523,872 13.04Balances with banks and other
financial institutions 90,791 1.80 38,850 0.97Inter-bank lending and financial assets
purchased under resale agreements 852,246 16.93 466,952 11.63Interest receivable 23,226 0.46 17,699 0.44Investment in associates and joint
ventures 915 0.02 778 0.02Fixed assets 24,857 0.49 24,199 0.60Investment properties 1,690 0.03 1,701 0.04Intangible assets 3,224 0.07 2,996 0.07Deferred tax assets 8,216 0.16 8,064 0.20Goodwill 9,953 0.20 9,953 0.25Other assets 32,955 0.66 9,604 0.24
Total assets 5,033,122 100.00 4,016,399 100.00
China Merchants Bank Interim Report 2014
19
III Report of the Board of Directors
3.3.1.1 Loans and advances
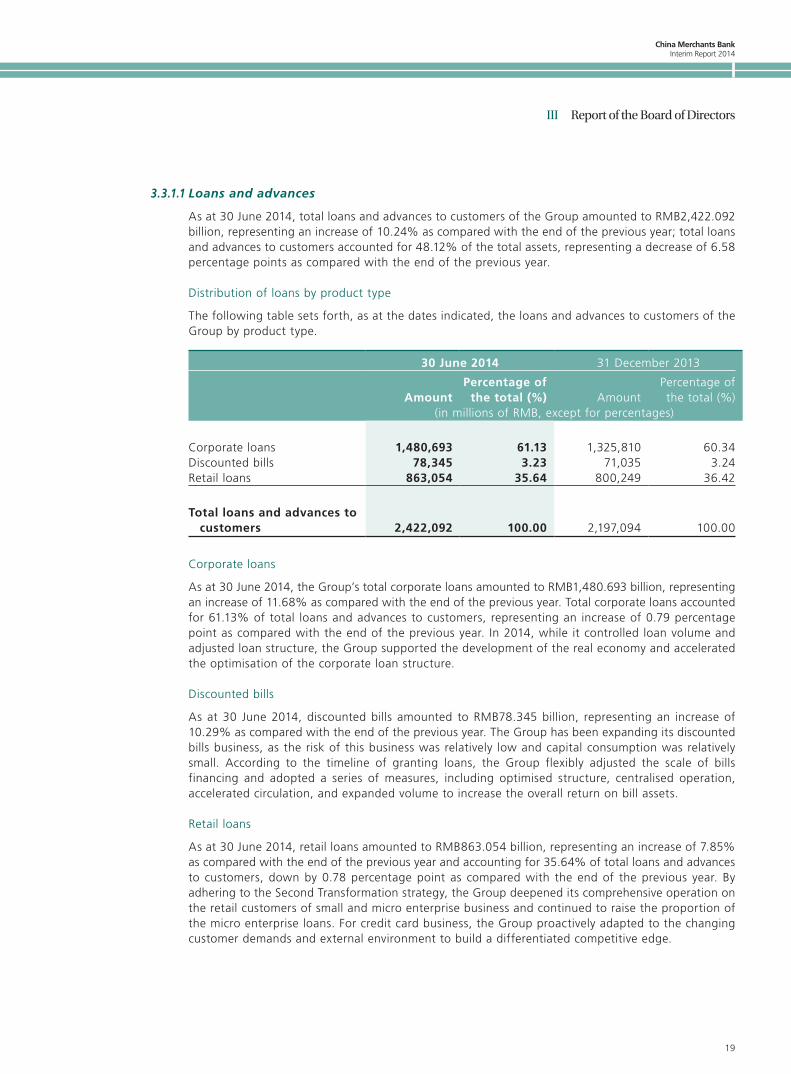
As at 30 June 2014, total loans and advances to customers of the Group amounted to RMB2,422.092 billion, representing an increase of 10.24% as compared with the end of the previous year; total loans and advances to customers accounted for 48.12% of the total assets, representing a decrease of 6.58 percentage points as compared with the end of the previous year.
Distribution of loans by product type
The following table sets forth, as at the dates indicated, the loans and advances to customers of the Group by product type.
30 June 2014 31 December 2013
AmountPercentage of
the total (%) AmountPercentage of the total (%)
(in millions of RMB, except for percentages)
Corporate loans 1,480,693 61.13 1,325,810 60.34Discounted bills 78,345 3.23 71,035 3.24Retail loans 863,054 35.64 800,249 36.42
Total loans and advances to customers 2,422,092 100.00 2,197,094 100.00
Corporate loans
As at 30 June 2014, the Group’s total corporate loans amounted to RMB1,480.693 billion, representing an increase of 11.68% as compared with the end of the previous year. Total corporate loans accounted for 61.13% of total loans and advances to customers, representing an increase of 0.79 percentage point as compared with the end of the previous year. In 2014, while it controlled loan volume and adjusted loan structure, the Group supported the development of the real economy and accelerated the optimisation of the corporate loan structure.
Discounted bills
As at 30 June 2014, discounted bills amounted to RMB78.345 billion, representing an increase of 10.29% as compared with the end of the previous year. The Group has been expanding its discounted bills business, as the risk of this business was relatively low and capital consumption was relatively small. According to the timeline of granting loans, the Group flexibly adjusted the scale of bills financing and adopted a series of measures, including optimised structure, centralised operation, accelerated circulation, and expanded volume to increase the overall return on bill assets.
Retail loans
As at 30 June 2014, retail loans amounted to RMB863.054 billion, representing an increase of 7.85% as compared with the end of the previous year and accounting for 35.64% of total loans and advances to customers, down by 0.78 percentage point as compared with the end of the previous year. By adhering to the Second Transformation strategy, the Group deepened its comprehensive operation on the retail customers of small and micro enterprise business and continued to raise the proportion of the micro enterprise loans. For credit card business, the Group proactively adapted to the changing customer demands and external environment to build a differentiated competitive edge.
China Merchants BankInterim Report 2014
20
III Report of the Board of Directors
3.3.1.2 Investments
Investments
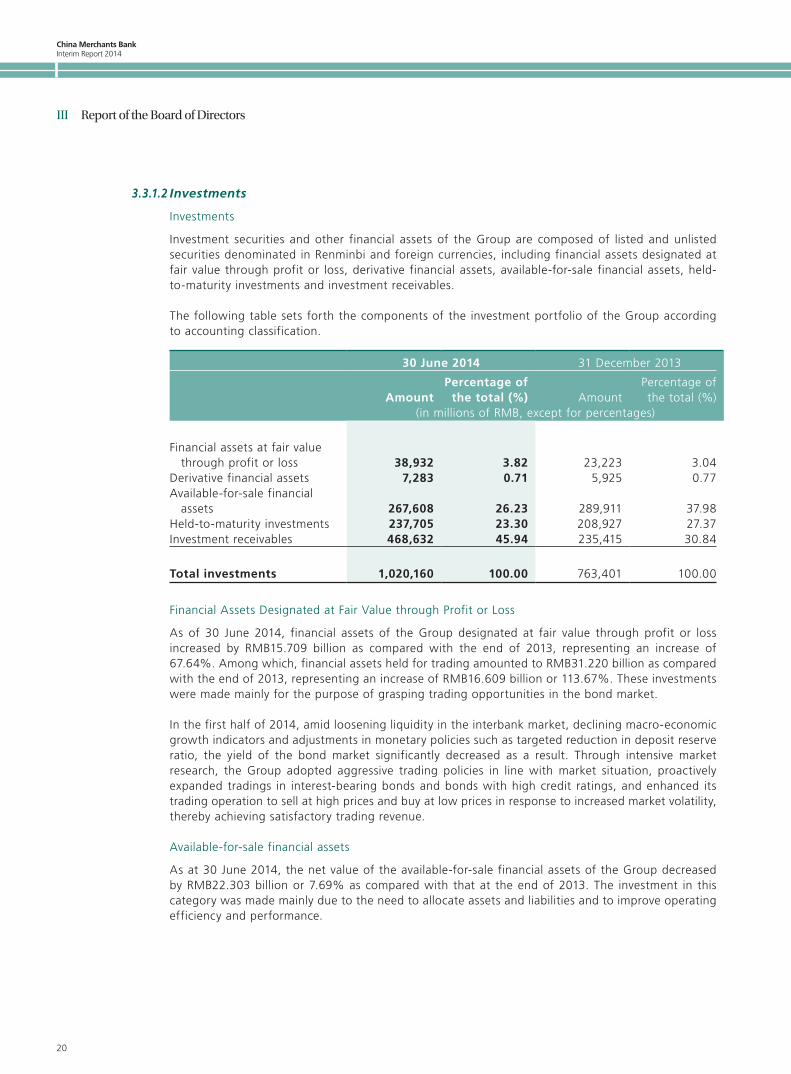
Investment securities and other financial assets of the Group are composed of listed and unlisted securities denominated in Renminbi and foreign currencies, including financial assets designated at fair value through profit or loss, derivative financial assets, available-for-sale financial assets, held-to-maturity investments and investment receivables.
The following table sets forth the components of the investment portfolio of the Group according to accounting classification.
30 June 2014 31 December 2013
AmountPercentage of
the total (%) AmountPercentage of the total (%)
(in millions of RMB, except for percentages)
Financial assets at fair value through profit or loss 38,932 3.82 23,223 3.04
Derivative financial assets 7,283 0.71 5,925 0.77Available-for-sale financial
assets 267,608 26.23 289,911 37.98Held-to-maturity investments 237,705 23.30 208,927 27.37Investment receivables 468,632 45.94 235,415 30.84
Total investments 1,020,160 100.00 763,401 100.00
Financial Assets Designated at Fair Value through Profit or Loss
As of 30 June 2014, financial assets of the Group designated at fair value through profit or loss increased by RMB15.709 billion as compared with the end of 2013, representing an increase of 67.64%. Among which, financial assets held for trading amounted to RMB31.220 billion as compared with the end of 2013, representing an increase of RMB16.609 billion or 113.67%. These investments were made mainly for the purpose of grasping trading opportunities in the bond market.
In the first half of 2014, amid loosening liquidity in the interbank market, declining macro-economic growth indicators and adjustments in monetary policies such as targeted reduction in deposit reserve ratio, the yield of the bond market significantly decreased as a result. Through intensive market research, the Group adopted aggressive trading policies in line with market situation, proactively expanded tradings in interest-bearing bonds and bonds with high credit ratings, and enhanced its trading operation to sell at high prices and buy at low prices in response to increased market volatility, thereby achieving satisfactory trading revenue.
Available-for-sale financial assets
As at 30 June 2014, the net value of the available-for-sale financial assets of the Group decreased by RMB22.303 billion or 7.69% as compared with that at the end of 2013. The investment in this category was made mainly due to the need to allocate assets and liabilities and to improve operating efficiency and performance.
China Merchants Bank Interim Report 2014
21
III Report of the Board of Directors
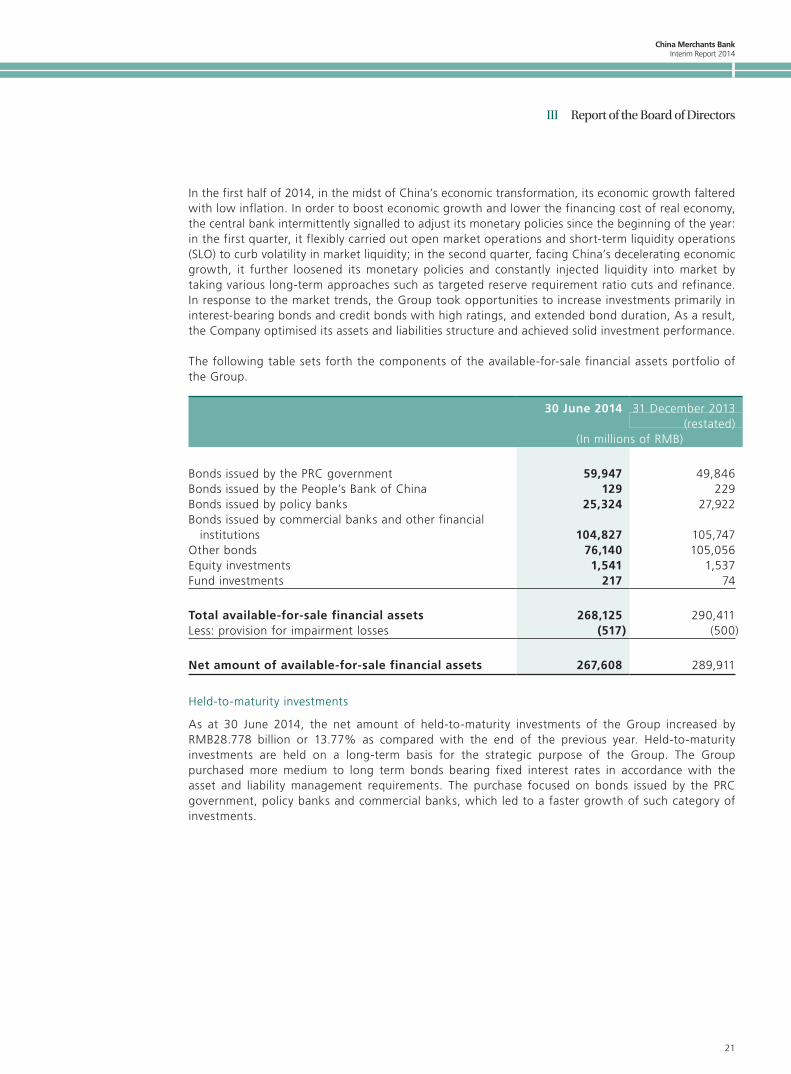
In the first half of 2014, in the midst of China’s economic transformation, its economic growth faltered with low inflation. In order to boost economic growth and lower the financing cost of real economy, the central bank intermittently signalled to adjust its monetary policies since the beginning of the year: in the first quarter, it flexibly carried out open market operations and short-term liquidity operations (SLO) to curb volatility in market liquidity; in the second quarter, facing China’s decelerating economic growth, it further loosened its monetary policies and constantly injected liquidity into market by taking various long-term approaches such as targeted reserve requirement ratio cuts and refinance. In response to the market trends, the Group took opportunities to increase investments primarily in interest-bearing bonds and credit bonds with high ratings, and extended bond duration, As a result, the Company optimised its assets and liabilities structure and achieved solid investment performance.
The following table sets forth the components of the available-for-sale financial assets portfolio of the Group.
30 June 2014 31 December 2013(restated)
(In millions of RMB)
Bonds issued by the PRC government 59,947 49,846Bonds issued by the People’s Bank of China 129 229Bonds issued by policy banks 25,324 27,922Bonds issued by commercial banks and other financial
institutions 104,827 105,747Other bonds 76,140 105,056Equity investments 1,541 1,537Fund investments 217 74
Total available-for-sale financial assets 268,125 290,411Less: provision for impairment losses (517) (500)
Net amount of available-for-sale financial assets 267,608 289,911
Held-to-maturity investments
As at 30 June 2014, the net amount of held-to-maturity investments of the Group increased by RMB28.778 billion or 13.77% as compared with the end of the previous year. Held-to-maturity investments are held on a long-term basis for the strategic purpose of the Group. The Group purchased more medium to long term bonds bearing fixed interest rates in accordance with the asset and liability management requirements. The purchase focused on bonds issued by the PRC government, policy banks and commercial banks, which led to a faster growth of such category of investments.
China Merchants BankInterim Report 2014
22
III Report of the Board of Directors
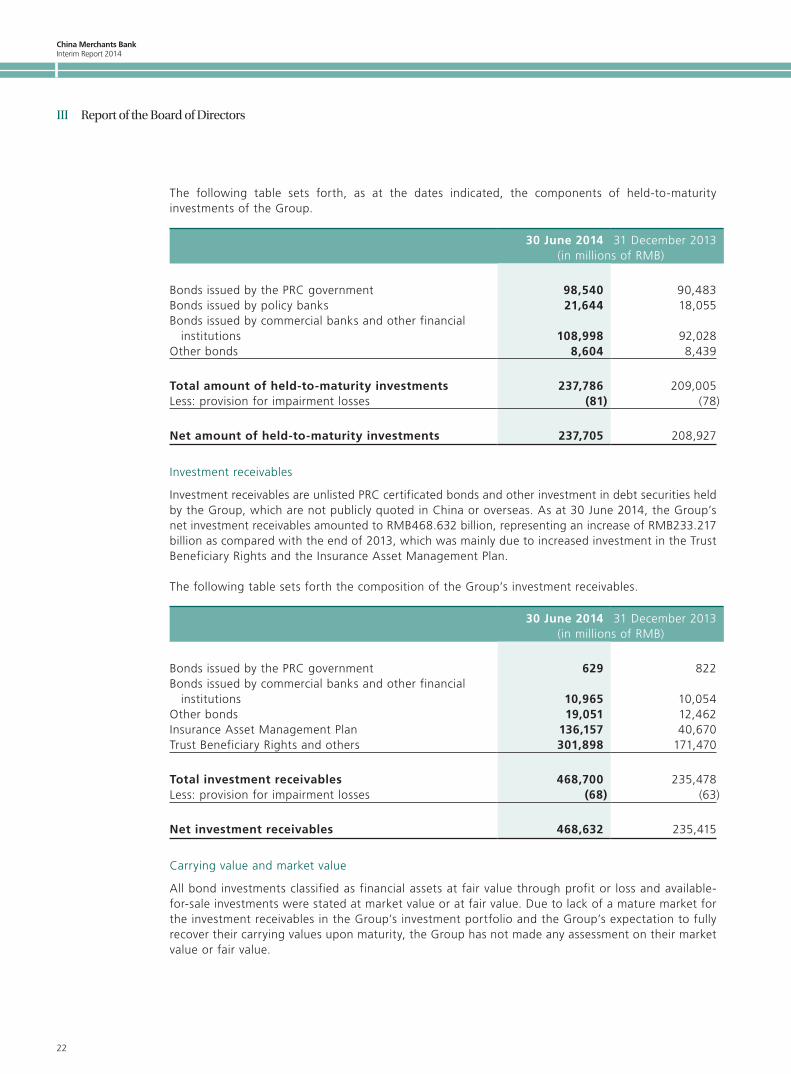
The following table sets forth, as at the dates indicated, the components of held-to-maturity investments of the Group.
30 June 2014 31 December 2013(in millions of RMB)
Bonds issued by the PRC government 98,540 90,483Bonds issued by policy banks 21,644 18,055Bonds issued by commercial banks and other financial
institutions 108,998 92,028Other bonds 8,604 8,439
Total amount of held-to-maturity investments 237,786 209,005Less: provision for impairment losses (81) (78)
Net amount of held-to-maturity investments 237,705 208,927
Investment receivables
Investment receivables are unlisted PRC certificated bonds and other investment in debt securities held by the Group, which are not publicly quoted in China or overseas. As at 30 June 2014, the Group’s net investment receivables amounted to RMB468.632 billion, representing an increase of RMB233.217 billion as compared with the end of 2013, which was mainly due to increased investment in the Trust Beneficiary Rights and the Insurance Asset Management Plan.
The following table sets forth the composition of the Group’s investment receivables.
30 June 2014 31 December 2013(in millions of RMB)
Bonds issued by the PRC government 629 822Bonds issued by commercial banks and other financial
institutions 10,965 10,054Other bonds 19,051 12,462Insurance Asset Management Plan 136,157 40,670Trust Beneficiary Rights and others 301,898 171,470
Total investment receivables 468,700 235,478Less: provision for impairment losses (68) (63)
Net investment receivables 468,632 235,415
Carrying value and market value
All bond investments classified as financial assets at fair value through profit or loss and available-for-sale investments were stated at market value or at fair value. Due to lack of a mature market for the investment receivables in the Group’s investment portfolio and the Group’s expectation to fully recover their carrying values upon maturity, the Group has not made any assessment on their market value or fair value.
China Merchants Bank Interim Report 2014
23
III Report of the Board of Directors
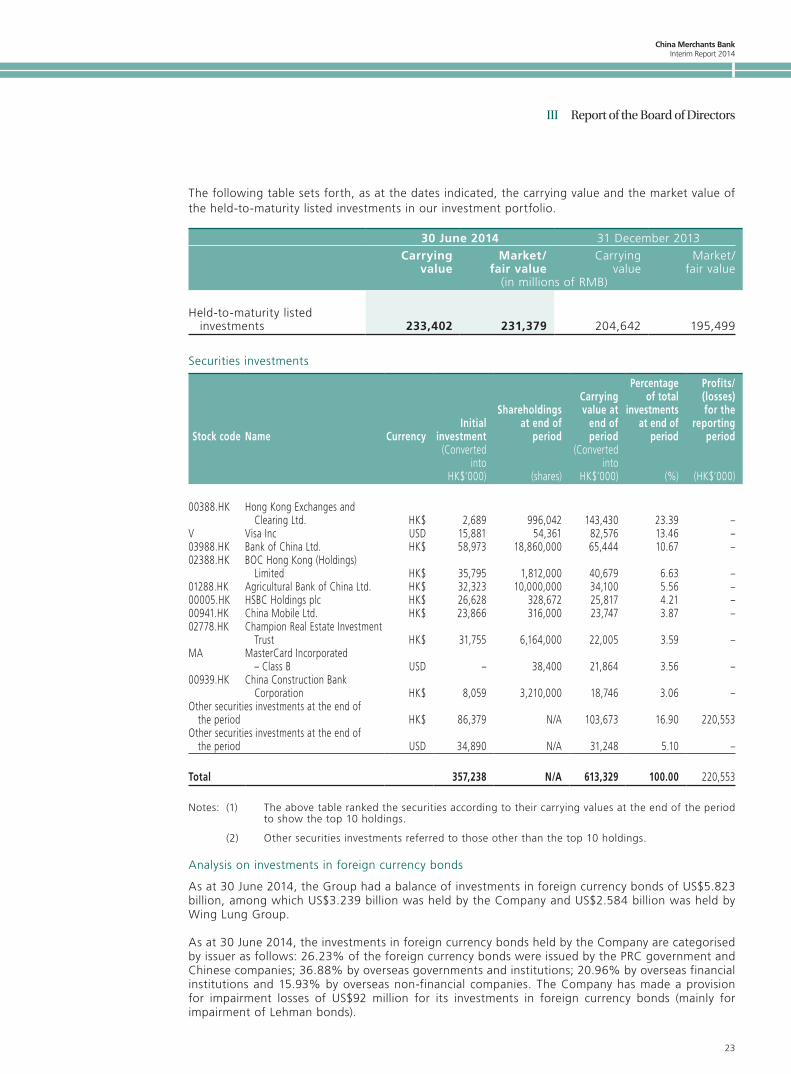
The following table sets forth, as at the dates indicated, the carrying value and the market value of the held-to-maturity listed investments in our investment portfolio.
30 June 2014 31 December 2013
Carrying value
Market/fair value
Carrying value
Market/fair value
(in millions of RMB)
Held-to-maturity listed investments 233,402 231,379 204,642 195,499
Securities investments
Stock code Name CurrencyInitial
investment
Shareholdings at end of
period
Carrying value at
end of period
Percentage of total
investments at end of
period
Profits/(losses) for the
reporting period
(Converted into
HK$‘000) (shares)
(Converted into
HK$‘000) (%) (HK$‘000)
00388.HK Hong Kong Exchanges and Clearing Ltd. HK$ 2,689 996,042 143,430 23.39 –
V Visa Inc USD 15,881 54,361 82,576 13.46 –03988.HK Bank of China Ltd. HK$ 58,973 18,860,000 65,444 10.67 –02388.HK BOC Hong Kong (Holdings)
Limited HK$ 35,795 1,812,000 40,679 6.63 –01288.HK Agricultural Bank of China Ltd. HK$ 32,323 10,000,000 34,100 5.56 –00005.HK HSBC Holdings plc HK$ 26,628 328,672 25,817 4.21 –00941.HK China Mobile Ltd. HK$ 23,866 316,000 23,747 3.87 –02778.HK Champion Real Estate Investment
Trust HK$ 31,755 6,164,000 22,005 3.59 –MA MasterCard Incorporated
– Class B USD – 38,400 21,864 3.56 –00939.HK China Construction Bank
Corporation HK$ 8,059 3,210,000 18,746 3.06 –Other securities investments at the end of
the period HK$ 86,379 N/A 103,673 16.90 220,553Other securities investments at the end of
the period USD 34,890 N/A 31,248 5.10 –
Total 357,238 N/A 613,329 100.00 220,553
Notes: (1) The above table ranked the securities according to their carrying values at the end of the period to show the top 10 holdings.
(2) Other securities investments referred to those other than the top 10 holdings.
Analysis on investments in foreign currency bonds
As at 30 June 2014, the Group had a balance of investments in foreign currency bonds of US$5.823 billion, among which US$3.239 billion was held by the Company and US$2.584 billion was held by Wing Lung Group.
As at 30 June 2014, the investments in foreign currency bonds held by the Company are categorised by issuer as follows: 26.23% of the foreign currency bonds were issued by the PRC government and Chinese companies; 36.88% by overseas governments and institutions; 20.96% by overseas financial institutions and 15.93% by overseas non-financial companies. The Company has made a provision for impairment losses of US$92 million for its investments in foreign currency bonds (mainly for impairment of Lehman bonds).
China Merchants BankInterim Report 2014
24
III Report of the Board of Directors
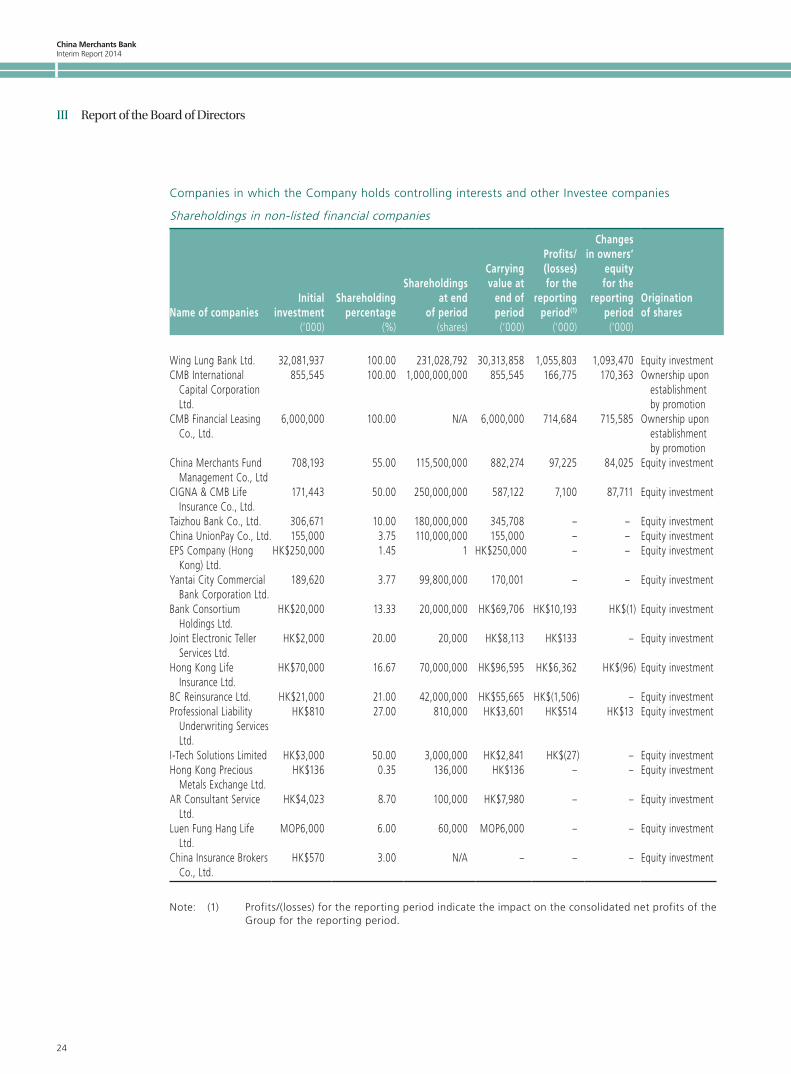
Companies in which the Company holds controlling interests and other Investee companies
Shareholdings in non-listed financial companies
Name of companiesInitial
investmentShareholding
percentage
Shareholdingsat end
of period
Carryingvalue at
end ofperiod
Profits/(losses)for the
reportingperiod(1)
Changesin owners’
equityfor the
reportingperiod
Originationof shares
(‘000) (%) (shares) (‘000) (‘000) (‘000)
Wing Lung Bank Ltd. 32,081,937 100.00 231,028,792 30,313,858 1,055,803 1,093,470 Equity investmentCMB International
Capital Corporation Ltd.
855,545 100.00 1,000,000,000 855,545 166,775 170,363 Ownership upon establishment by promotion
CMB Financial Leasing Co., Ltd.
6,000,000 100.00 N/A 6,000,000 714,684 715,585 Ownership upon establishment by promotion
China Merchants Fund Management Co., Ltd
708,193 55.00 115,500,000 882,274 97,225 84,025 Equity investment
CIGNA & CMB Life Insurance Co., Ltd.
171,443 50.00 250,000,000 587,122 7,100 87,711 Equity investment
Taizhou Bank Co., Ltd. 306,671 10.00 180,000,000 345,708 – – Equity investmentChina UnionPay Co., Ltd. 155,000 3.75 110,000,000 155,000 – – Equity investmentEPS Company (Hong
Kong) Ltd.HK$250,000 1.45 1 HK$250,000 – – Equity investment
Yantai City Commercial Bank Corporation Ltd.
189,620 3.77 99,800,000 170,001 – – Equity investment
Bank Consortium Holdings Ltd.
HK$20,000 13.33 20,000,000 HK$69,706 HK$10,193 HK$(1) Equity investment
Joint Electronic Teller Services Ltd.
HK$2,000 20.00 20,000 HK$8,113 HK$133 – Equity investment
Hong Kong Life Insurance Ltd.
HK$70,000 16.67 70,000,000 HK$96,595 HK$6,362 HK$(96) Equity investment
BC Reinsurance Ltd. HK$21,000 21.00 42,000,000 HK$55,665 HK$(1,506) – Equity investmentProfessional Liability
Underwriting Services Ltd.
HK$810 27.00 810,000 HK$3,601 HK$514 HK$13 Equity investment
I-Tech Solutions Limited HK$3,000 50.00 3,000,000 HK$2,841 HK$(27) – Equity investmentHong Kong Precious
Metals Exchange Ltd.HK$136 0.35 136,000 HK$136 – – Equity investment
AR Consultant Service Ltd.
HK$4,023 8.70 100,000 HK$7,980 – – Equity investment
Luen Fung Hang Life Ltd.
MOP6,000 6.00 60,000 MOP6,000 – – Equity investment
China Insurance Brokers Co., Ltd.
HK$570 3.00 N/A – – – Equity investment
Note: (1) Profits/(losses) for the reporting period indicate the impact on the consolidated net profits of the Group for the reporting period.
China Merchants Bank Interim Report 2014
25
III Report of the Board of Directors
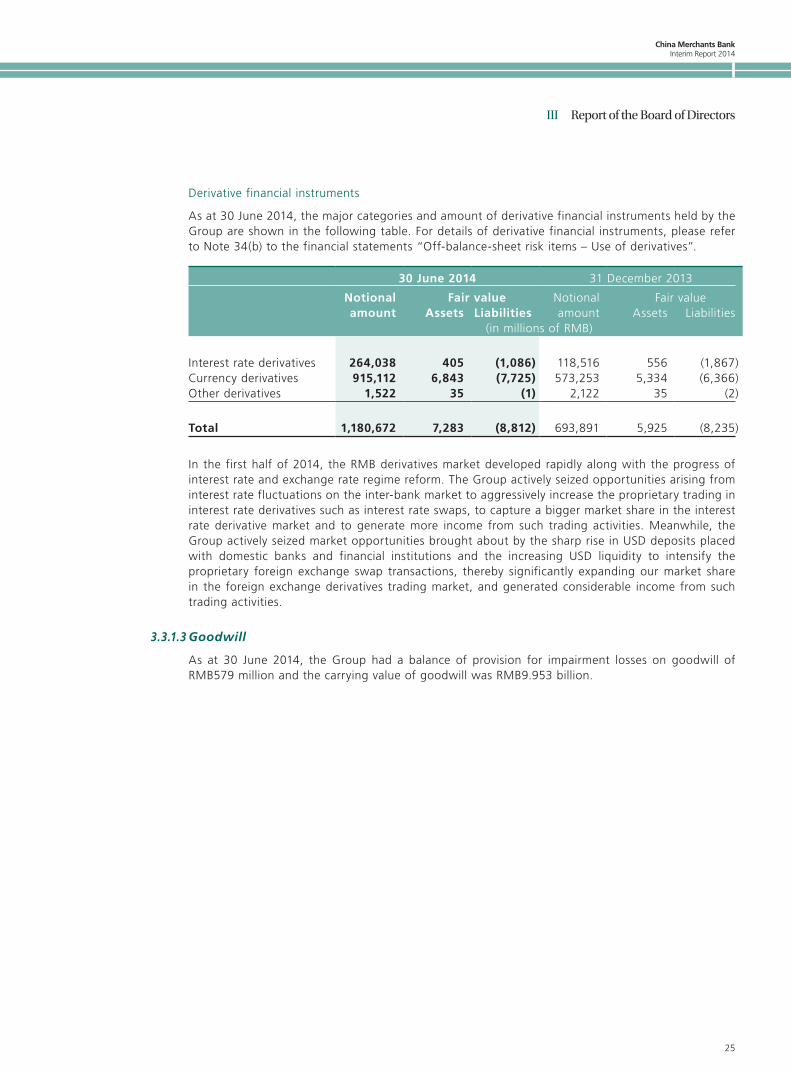
Derivative financial instruments
As at 30 June 2014, the major categories and amount of derivative financial instruments held by the Group are shown in the following table. For details of derivative financial instruments, please refer to Note 34(b) to the financial statements “Off-balance-sheet risk items – Use of derivatives”.
30 June 2014 31 December 2013
Notionalamount
Fair value Notionalamount
Fair value Assets Liabilities Assets Liabilities
(in millions of RMB)
Interest rate derivatives 264,038 405 (1,086) 118,516 556 (1,867)Currency derivatives 915,112 6,843 (7,725) 573,253 5,334 (6,366)Other derivatives 1,522 35 (1) 2,122 35 (2)
Total 1,180,672 7,283 (8,812) 693,891 5,925 (8,235)
In the first half of 2014, the RMB derivatives market developed rapidly along with the progress of interest rate and exchange rate regime reform. The Group actively seized opportunities arising from interest rate fluctuations on the inter-bank market to aggressively increase the proprietary trading in interest rate derivatives such as interest rate swaps, to capture a bigger market share in the interest rate derivative market and to generate more income from such trading activities. Meanwhile, the Group actively seized market opportunities brought about by the sharp rise in USD deposits placed with domestic banks and financial institutions and the increasing USD liquidity to intensify the proprietary foreign exchange swap transactions, thereby significantly expanding our market share in the foreign exchange derivatives trading market, and generated considerable income from such trading activities.
3.3.1.3 Goodwill
As at 30 June 2014, the Group had a balance of provision for impairment losses on goodwill of RMB579 million and the carrying value of goodwill was RMB9.953 billion.
China Merchants BankInterim Report 2014
26
III Report of the Board of Directors
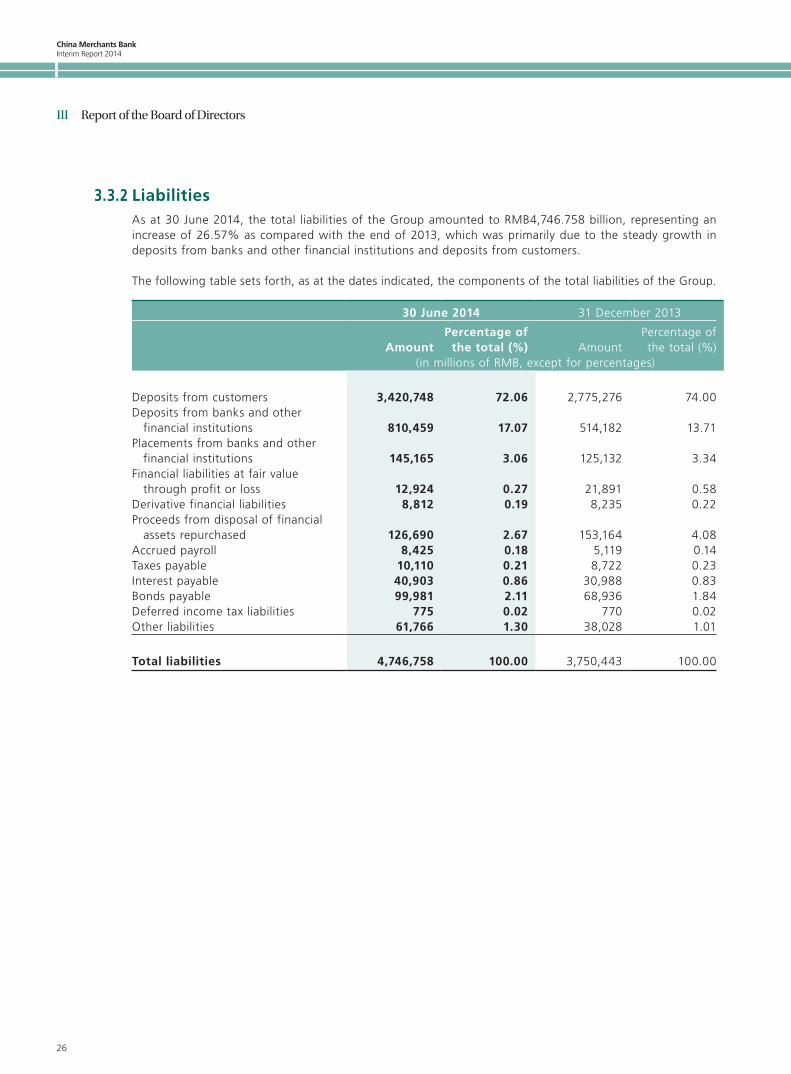
3.3.2 LiabilitiesAs at 30 June 2014, the total liabilities of the Group amounted to RMB4,746.758 billion, representing an increase of 26.57% as compared with the end of 2013, which was primarily due to the steady growth in deposits from banks and other financial institutions and deposits from customers.
The following table sets forth, as at the dates indicated, the components of the total liabilities of the Group.
30 June 2014 31 December 2013
AmountPercentage of
the total (%) AmountPercentage of the total (%)
(in millions of RMB, except for percentages)
Deposits from customers 3,420,748 72.06 2,775,276 74.00Deposits from banks and other
financial institutions 810,459 17.07 514,182 13.71Placements from banks and other
financial institutions 145,165 3.06 125,132 3.34Financial liabilities at fair value
through profit or loss 12,924 0.27 21,891 0.58Derivative financial liabilities 8,812 0.19 8,235 0.22Proceeds from disposal of financial
assets repurchased 126,690 2.67 153,164 4.08Accrued payroll 8,425 0.18 5,119 0.14Taxes payable 10,110 0.21 8,722 0.23Interest payable 40,903 0.86 30,988 0.83Bonds payable 99,981 2.11 68,936 1.84Deferred income tax liabilities 775 0.02 770 0.02Other liabilities 61,766 1.30 38,028 1.01
Total liabilities 4,746,758 100.00 3,750,443 100.00
China Merchants Bank Interim Report 2014
27
III Report of the Board of Directors
Deposits from customers
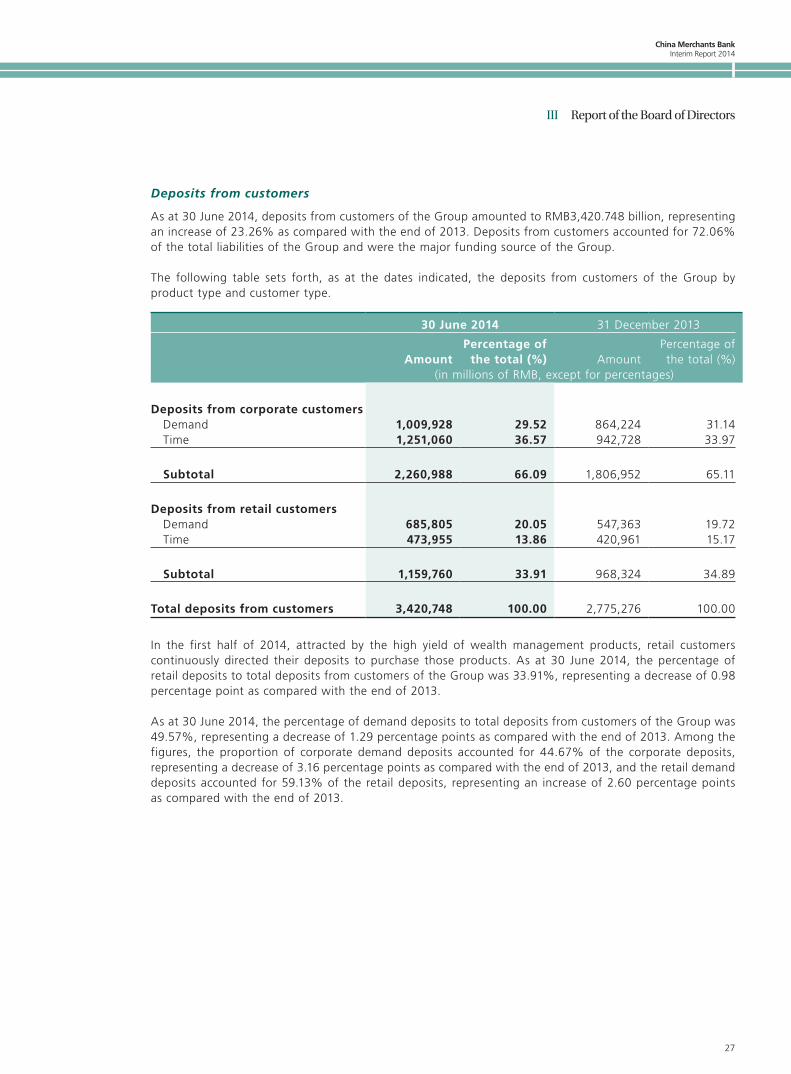
As at 30 June 2014, deposits from customers of the Group amounted to RMB3,420.748 billion, representing an increase of 23.26% as compared with the end of 2013. Deposits from customers accounted for 72.06% of the total liabilities of the Group and were the major funding source of the Group.
The following table sets forth, as at the dates indicated, the deposits from customers of the Group by product type and customer type.
30 June 2014 31 December 2013
AmountPercentage of
the total (%) AmountPercentage of the total (%)
(in millions of RMB, except for percentages)
Deposits from corporate customers Demand 1,009,928 29.52 864,224 31.14 Time 1,251,060 36.57 942,728 33.97
Subtotal 2,260,988 66.09 1,806,952 65.11
Deposits from retail customers Demand 685,805 20.05 547,363 19.72 Time 473,955 13.86 420,961 15.17
Subtotal 1,159,760 33.91 968,324 34.89
Total deposits from customers 3,420,748 100.00 2,775,276 100.00
In the first half of 2014, attracted by the high yield of wealth management products, retail customers continuously directed their deposits to purchase those products. As at 30 June 2014, the percentage of retail deposits to total deposits from customers of the Group was 33.91%, representing a decrease of 0.98 percentage point as compared with the end of 2013.
As at 30 June 2014, the percentage of demand deposits to total deposits from customers of the Group was 49.57%, representing a decrease of 1.29 percentage points as compared with the end of 2013. Among the figures, the proportion of corporate demand deposits accounted for 44.67% of the corporate deposits, representing a decrease of 3.16 percentage points as compared with the end of 2013, and the retail demand deposits accounted for 59.13% of the retail deposits, representing an increase of 2.60 percentage points as compared with the end of 2013.
China Merchants BankInterim Report 2014
28
III Report of the Board of Directors
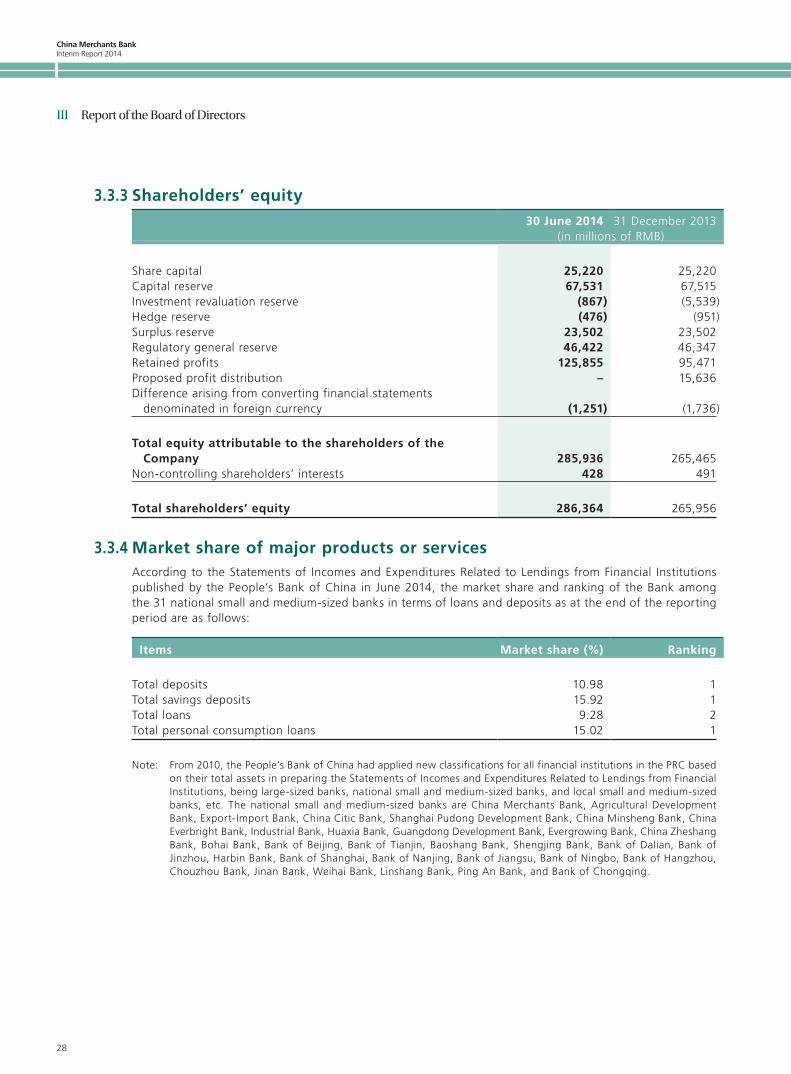
3.3.3 Shareholders’ equity30 June 2014 31 December 2013
(in millions of RMB)
Share capital 25,220 25,220Capital reserve 67,531 67,515Investment revaluation reserve (867) (5,539)Hedge reserve (476) (951)Surplus reserve 23,502 23,502Regulatory general reserve 46,422 46,347Retained profits 125,855 95,471Proposed profit distribution – 15,636Difference arising from converting financial statements
denominated in foreign currency (1,251) (1,736)
Total equity attributable to the shareholders of the Company 285,936 265,465
Non-controlling shareholders’ interests 428 491
Total shareholders’ equity 286,364 265,956
3.3.4 Market share of major products or servicesAccording to the Statements of Incomes and Expenditures Related to Lendings from Financial Institutions published by the People’s Bank of China in June 2014, the market share and ranking of the Bank among the 31 national small and medium-sized banks in terms of loans and deposits as at the end of the reporting period are as follows:
Items Market share (%) Ranking
Total deposits 10.98 1Total savings deposits 15.92 1Total loans 9.28 2Total personal consumption loans 15.02 1
Note: From 2010, the People’s Bank of China had applied new classifications for all financial institutions in the PRC based on their total assets in preparing the Statements of Incomes and Expenditures Related to Lendings from Financial Institutions, being large-sized banks, national small and medium-sized banks, and local small and medium-sized banks, etc. The national small and medium-sized banks are China Merchants Bank, Agricultural Development Bank, Export-Import Bank, China Citic Bank, Shanghai Pudong Development Bank, China Minsheng Bank, China Everbright Bank, Industrial Bank, Huaxia Bank, Guangdong Development Bank, Evergrowing Bank, China Zheshang Bank, Bohai Bank, Bank of Beijing, Bank of Tianjin, Baoshang Bank, Shengjing Bank, Bank of Dalian, Bank of Jinzhou, Harbin Bank, Bank of Shanghai, Bank of Nanjing, Bank of Jiangsu, Bank of Ningbo, Bank of Hangzhou, Chouzhou Bank, Jinan Bank, Weihai Bank, Linshang Bank, Ping An Bank, and Bank of Chongqing.

China Merchants Bank Interim Report 2014
29
III Report of the Board of Directors
3.4 Loan Quality AnalysisDuring the reporting period, the Group saw a steady growth in the volume of its credit assets, an increase in non-performing assets and a stable allowance coverage. As at 30 June 2014, total loans and advances to customers of the Group were RMB2,422.092 billion, representing an increase of RMB224.998 billion or 10.24%, as compared with the end of the previous year; the non-performing loan ratio was 0.98%, 0.15 percentage point up from the end of the previous year; whereas the non-performing loan allowance coverage ratio was 251.29%, representing a decrease of 14.71 percentage points as compared with the end of the previous year; the loan allowance ratio was 2.46%, representing an increase of 0.24 percentage point as compared with the end of the previous year.
3.4.1 Distribution of loans by 5-tier loan classificationThe following table sets forth the 5-tier loan classification of the Group as at the dates indicated.
30 June 2014 31 December 2013
AmountPercentage of
the total (%) AmountPercentage of the total (%)
(in millions of RMB, except for percentages)
Normal 2,368,324 97.78 2,154,159 98.05Special Mention 30,071 1.24 24,603 1.12Substandard 16,019 0.66 9,037 0.41Doubtful 4,804 0.20 5,450 0.25Loss 2,874 0.12 3,845 0.17Total loans and advances to customers 2,422,092 100.00 2,197,094 100.00Total non-performing loans 23,697 0.98 18,332 0.83
Under the 5-tier loan classification system, non-performing loans of the Group are divided into substandard loans, doubtful loans and loss loans. As at the end of the reporting period, the total non-performing loans of the Group amounted to RMB23.697 billion, representing an increase of RMB5.365 billion or 29.27% as compared with the end of the previous year. Of which, the increase of non-performing loans was mainly due to the contribution of substandard loans. During the reporting period, the proportion of substandard loans increased by 0.25 percentage point to 0.66%; the proportion of doubtful and loss loans decreased by 0.05 percentage point as compared with the end of the previous year as a result of write-offs. As at the end of the reporting period, the special mention loans amounted to RMB30.071 billion, accounting for 1.24% of the total loans, representing an increase of 0.12 percentage point over the end of the previous year.
China Merchants BankInterim Report 2014
30
III Report of the Board of Directors
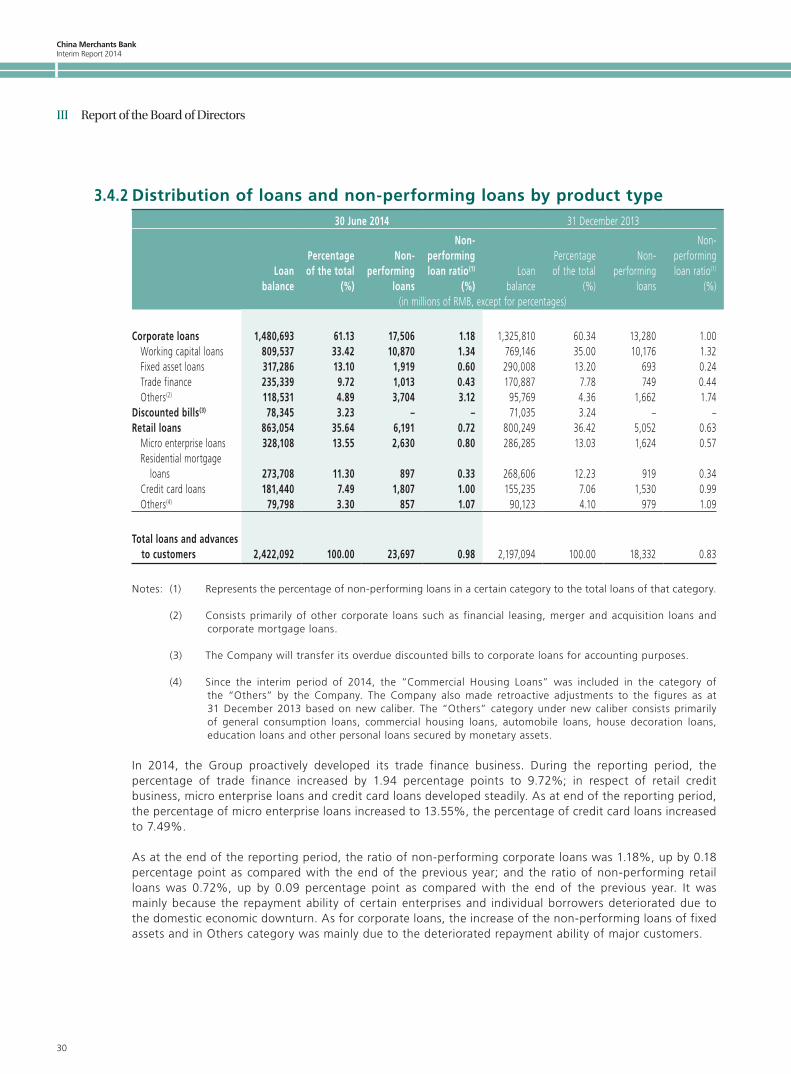
3.4.2 Distribution of loans and non-performing loans by product type30 June 2014 31 December 2013
Loanbalance
Percentageof the total
(%)
Non-performing
loans
Non-performingloan ratio(1)
(%)Loan
balance
Percentageof the total
(%)
Non-performing
loans
Non-performingloan ratio(1)
(%)(in millions of RMB, except for percentages)
Corporate loans 1,480,693 61.13 17,506 1.18 1,325,810 60.34 13,280 1.00 Working capital loans 809,537 33.42 10,870 1.34 769,146 35.00 10,176 1.32 Fixed asset loans 317,286 13.10 1,919 0.60 290,008 13.20 693 0.24 Trade finance 235,339 9.72 1,013 0.43 170,887 7.78 749 0.44 Others(2) 118,531 4.89 3,704 3.12 95,769 4.36 1,662 1.74Discounted bills(3) 78,345 3.23 – – 71,035 3.24 – –Retail loans 863,054 35.64 6,191 0.72 800,249 36.42 5,052 0.63 Micro enterprise loans 328,108 13.55 2,630 0.80 286,285 13.03 1,624 0.57 Residential mortgage
loans 273,708 11.30 897 0.33 268,606 12.23 919 0.34 Credit card loans 181,440 7.49 1,807 1.00 155,235 7.06 1,530 0.99 Others(4) 79,798 3.30 857 1.07 90,123 4.10 979 1.09
Total loans and advances to customers 2,422,092 100.00 23,697 0.98 2,197,094 100.00 18,332 0.83
Notes: (1) Represents the percentage of non-performing loans in a certain category to the total loans of that category.
(2) Consists primarily of other corporate loans such as financial leasing, merger and acquisition loans and corporate mortgage loans.
(3) The Company will transfer its overdue discounted bills to corporate loans for accounting purposes.
(4) Since the interim period of 2014, the “Commercial Housing Loans” was included in the category of the “Others” by the Company. The Company also made retroactive adjustments to the figures as at 31 December 2013 based on new caliber. The “Others” category under new caliber consists primarily of general consumption loans, commercial housing loans, automobile loans, house decoration loans, education loans and other personal loans secured by monetary assets.
In 2014, the Group proactively developed its trade finance business. During the reporting period, the percentage of trade finance increased by 1.94 percentage points to 9.72%; in respect of retail credit business, micro enterprise loans and credit card loans developed steadily. As at end of the reporting period, the percentage of micro enterprise loans increased to 13.55%, the percentage of credit card loans increased to 7.49%.
As at the end of the reporting period, the ratio of non-performing corporate loans was 1.18%, up by 0.18 percentage point as compared with the end of the previous year; and the ratio of non-performing retail loans was 0.72%, up by 0.09 percentage point as compared with the end of the previous year. It was mainly because the repayment ability of certain enterprises and individual borrowers deteriorated due to the domestic economic downturn. As for corporate loans, the increase of the non-performing loans of fixed assets and in Others category was mainly due to the deteriorated repayment ability of major customers.
China Merchants Bank Interim Report 2014
31
III Report of the Board of Directors
3.4.3 Distribution of loans and non-performing loans by industry30 June 2014 31 December 2013
Loanbalance
Percentageof the total
(%)
Non-performing
loans
Non-performingloan ratio(1)
(%)Loan
balance
Percentageof the total
(%)
Non-performing
loans
Non-performingloan ratio(1)
(%)(in millions of RMB, except for percentages)
Corporate loans 1,480,693 61.13 17,506 1.18 1,325,810 60.34 13,280 1.00 Manufacturing 392,012 16.18 7,618 1.94 388,340 17.68 6,904 1.78 Wholesale and retail 326,600 13.48 5,012 1.53 295,174 13.43 4,260 1.44 Property development 160,870 6.64 821 0.51 131,061 5.97 521 0.40 Transportation, storage
and postal services 145,901 6.02 1,642 1.13 127,416 5.80 338 0.27 Construction 97,498 4.03 440 0.45 92,916 4.23 316 0.34 Production and supply of
electric power, heat, gas and water 99,225 4.10 10 0.01 60,097 2.74 148 0.25
Mining 68,820 2.84 1,043 1.52 64,744 2.95 3 – Leasing and commercial
services 43,936 1.81 138 0.31 38,235 1.74 74 0.19 Water conservancy,
environment and public utilities 30,947 1.28 133 0.43 34,383 1.56 115 0.33
Information transmission, software and IT service 19,706 0.81 65 0.33 16,376 0.75 83 0.51
Others(2) 95,178 3.94 584 0.61 77,068 3.49 518 0.67Discounted bills 78,345 3.23 – – 71,035 3.24 – –Retail loans 863,054 35.64 6,191 0.72 800,249 36.42 5,052 0.63
Total loans and advances to customers 2,422,092 100.00 23,697 0.98 2,197,094 100.00 18,332 0.83
Notes: (1) Represents the percentage of non-performing loans in a certain category to the total loans of that category.
(2) Consists primarily of agriculture, forestry, animal husbandry, fishery, accommodation and catering, health care, social security, social welfare, etc.
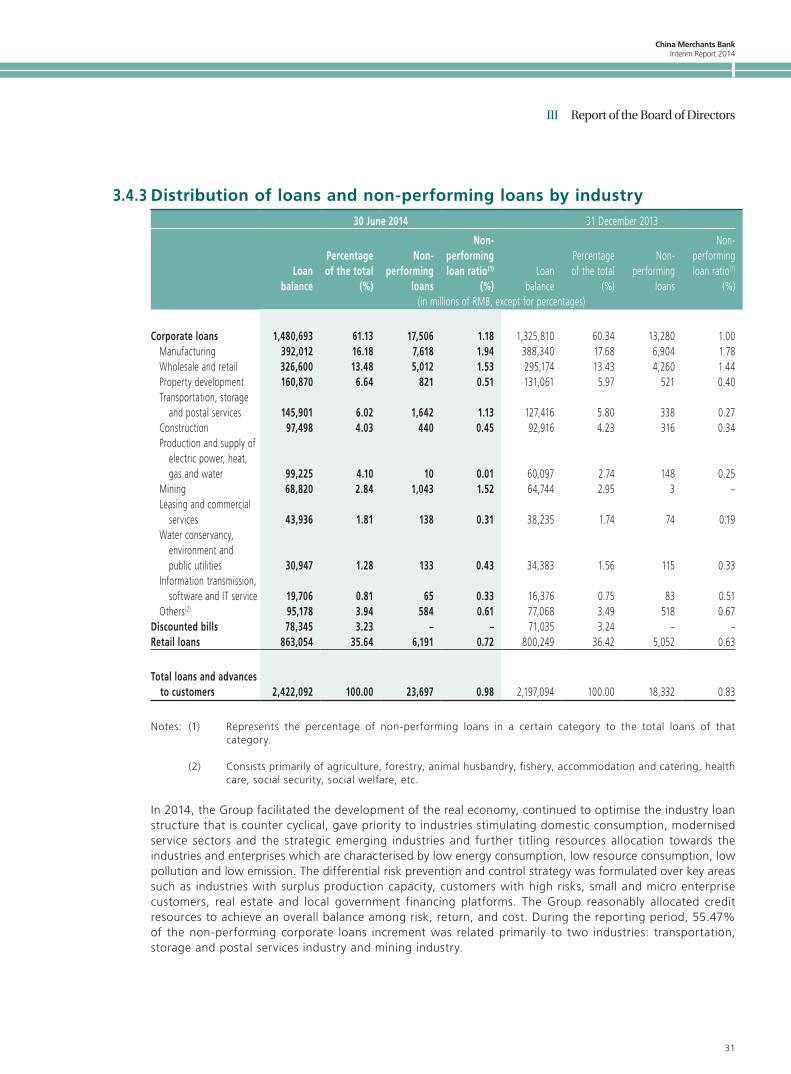
In 2014, the Group facilitated the development of the real economy, continued to optimise the industry loan structure that is counter cyclical, gave priority to industries stimulating domestic consumption, modernised service sectors and the strategic emerging industries and further titling resources allocation towards the industries and enterprises which are characterised by low energy consumption, low resource consumption, low pollution and low emission. The differential risk prevention and control strategy was formulated over key areas such as industries with surplus production capacity, customers with high risks, small and micro enterprise customers, real estate and local government financing platforms. The Group reasonably allocated credit resources to achieve an overall balance among risk, return, and cost. During the reporting period, 55.47% of the non-performing corporate loans increment was related primarily to two industries: transportation, storage and postal services industry and mining industry.
China Merchants BankInterim Report 2014
32
III Report of the Board of Directors
3.4.4 Distribution of loans and non-performing loans by region30 June 2014 31 December 2013
Loanbalance
Percentageof the total
(%)
Non-performing
loans
Non-performingloan ratio(1)
(%)Loan
balance
Percentageof the total
(%)
Non-performing
loans
Non-performingloan ratio(1)
(%)(in millions of RMB, except for percentages)
Head Office 247,627 10.22 2,385 0.96 197,872 9.01 2,627 1.33Yangtze River Delta 476,486 19.67 9,202 1.93 456,889 20.80 8,262 1.81Bohai Rim 333,941 13.79 1,834 0.55 313,312 14.26 1,555 0.50Pearl River Delta and West
Side of Taiwan Strait 377,991 15.61 3,820 1.01 343,894 15.65 2,321 0.67North-east China 125,167 5.17 1,476 1.18 119,404 5.43 591 0.49Central China 262,071 10.82 3,239 1.24 242,455 11.04 1,741 0.72Western China 302,095 12.47 1,481 0.49 284,398 12.94 954 0.34Overseas 74,343 3.07 – – 51,033 2.32 18 0.04Subsidiaries 222,371 9.18 260 0.12 187,837 8.55 263 0.14
Total loans and advances to customers 2,422,092 100.00 23,697 0.98 2,197,094 100.00 18,332 0.83
Note: (1) Represents the percentage of non-performing loans in a certain category to the total loans of that category.
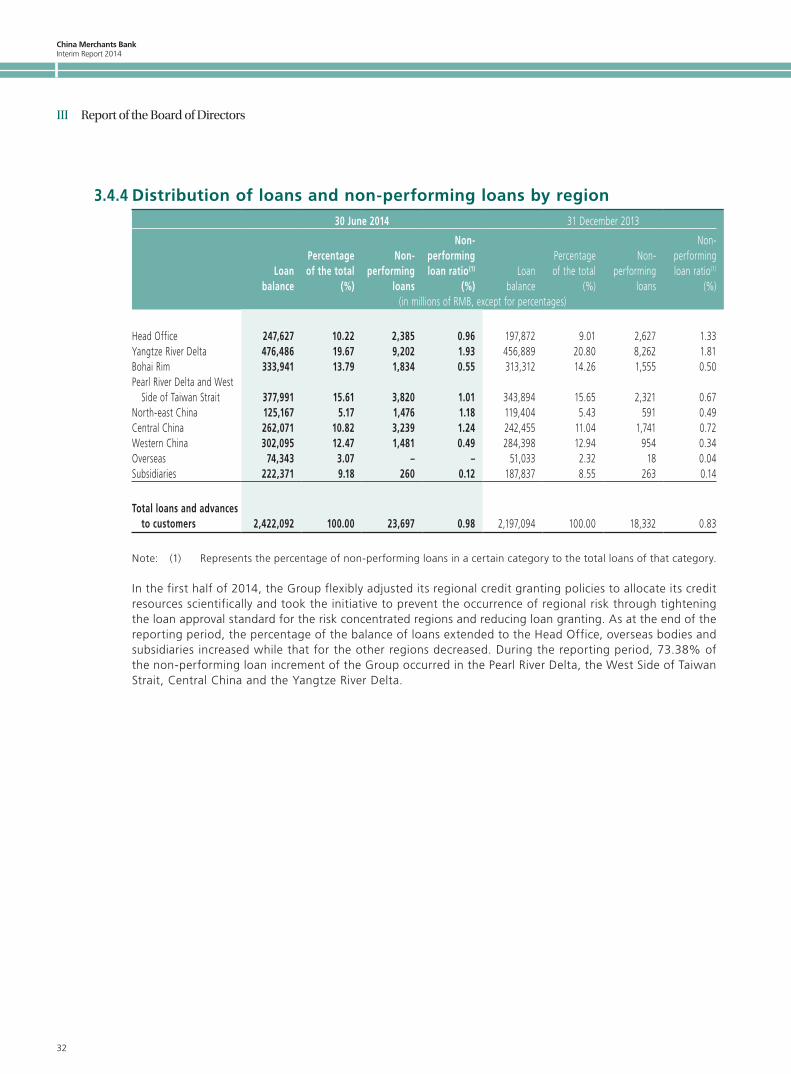
In the first half of 2014, the Group flexibly adjusted its regional credit granting policies to allocate its credit resources scientifically and took the initiative to prevent the occurrence of regional risk through tightening the loan approval standard for the risk concentrated regions and reducing loan granting. As at the end of the reporting period, the percentage of the balance of loans extended to the Head Office, overseas bodies and subsidiaries increased while that for the other regions decreased. During the reporting period, 73.38% of the non-performing loan increment of the Group occurred in the Pearl River Delta, the West Side of Taiwan Strait, Central China and the Yangtze River Delta.
China Merchants Bank Interim Report 2014
33
III Report of the Board of Directors
3.4.5 Distribution of loans and non-performing loans by type of guarantees30 June 2014 31 December 2013
Loanbalance
Percentageof the total
(%)
Non-performing
loans
Non-performingloan ratio(1)
(%)Loan
balance
Percentageof the total
(%)
Non-performing
loans
Non-performingloan ratio(1)
(%)(in millions of RMB, except for percentages)
Credit loans 490,729 20.26 3,080 0.63 446,121 20.30 1,986 0.45Guaranteed loans 488,028 20.15 8,633 1.77 466,568 21.24 7,190 1.54Collateralised loans 976,595 40.32 11,108 1.14 918,500 41.80 8,430 0.92Pledged loans 388,395 16.04 876 0.23 294,870 13.42 726 0.25Discounted bills 78,345 3.23 – – 71,035 3.24 – –
Total loans and advances to customers 2,422,092 100.00 23,697 0.98 2,197,094 100.00 18,332 0.83
Note: (1) Represents the percentage of non-performing loans in a certain category to the total loans of that category.
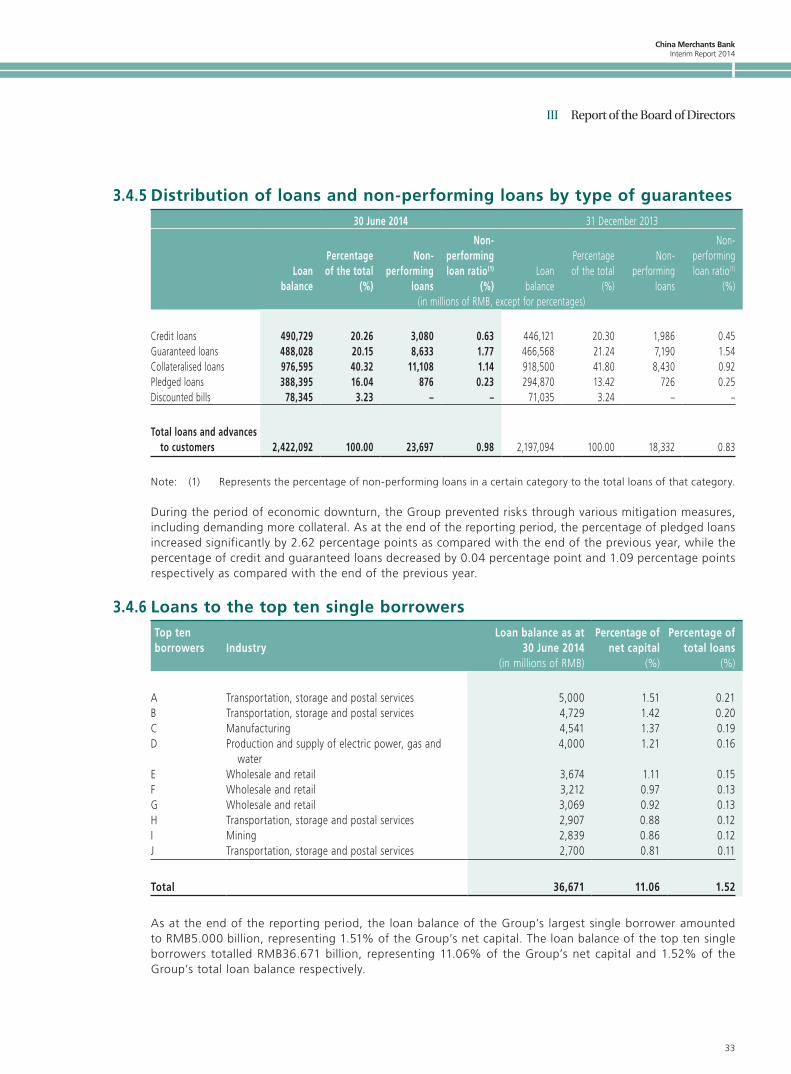
During the period of economic downturn, the Group prevented risks through various mitigation measures, including demanding more collateral. As at the end of the reporting period, the percentage of pledged loans increased significantly by 2.62 percentage points as compared with the end of the previous year, while the percentage of credit and guaranteed loans decreased by 0.04 percentage point and 1.09 percentage points respectively as compared with the end of the previous year.
3.4.6 Loans to the top ten single borrowersTop ten borrowers Industry
Loan balance as at 30 June 2014
Percentage of net capital
Percentage of total loans
(in millions of RMB) (%) (%)
A Transportation, storage and postal services 5,000 1.51 0.21B Transportation, storage and postal services 4,729 1.42 0.20C Manufacturing 4,541 1.37 0.19D Production and supply of electric power, gas and
water4,000 1.21 0.16
E Wholesale and retail 3,674 1.11 0.15F Wholesale and retail 3,212 0.97 0.13G Wholesale and retail 3,069 0.92 0.13H Transportation, storage and postal services 2,907 0.88 0.12I Mining 2,839 0.86 0.12J Transportation, storage and postal services 2,700 0.81 0.11
Total 36,671 11.06 1.52
As at the end of the reporting period, the loan balance of the Group’s largest single borrower amounted to RMB5.000 billion, representing 1.51% of the Group’s net capital. The loan balance of the top ten single borrowers totalled RMB36.671 billion, representing 11.06% of the Group’s net capital and 1.52% of the Group’s total loan balance respectively.
China Merchants BankInterim Report 2014
34
III Report of the Board of Directors
3.4.7 Distribution of loans by overdue term30 June 2014 31 December 2013
AmountPercentage of
the total (%) AmountPercentage of the total (%)
(in millions of RMB, except for percentages)
Overdue within 3 months 25,338 1.05 17,017 0.77Overdue from 3 months up to 1 year 13,228 0.54 8,689 0.40Overdue from 1 year up to 3 years 4,902 0.20 4,743 0.22Overdue more than 3 years 1,582 0.07 2,546 0.11Total overdue loans 45,050 1.86 32,995 1.50Total loans and advances to customers 2,422,092 100.00 2,197,094 100.00
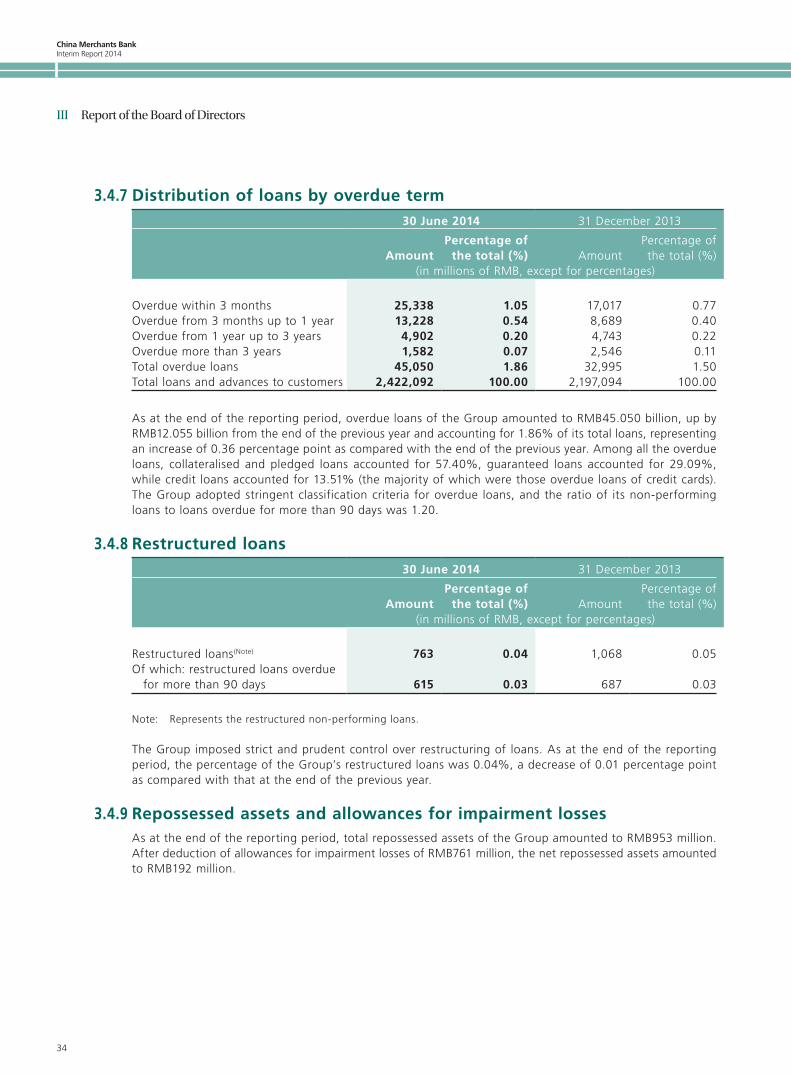
As at the end of the reporting period, overdue loans of the Group amounted to RMB45.050 billion, up by RMB12.055 billion from the end of the previous year and accounting for 1.86% of its total loans, representing an increase of 0.36 percentage point as compared with the end of the previous year. Among all the overdue loans, collateralised and pledged loans accounted for 57.40%, guaranteed loans accounted for 29.09%, while credit loans accounted for 13.51% (the majority of which were those overdue loans of credit cards). The Group adopted stringent classification criteria for overdue loans, and the ratio of its non-performing loans to loans overdue for more than 90 days was 1.20.
3.4.8 Restructured loans30 June 2014 31 December 2013
AmountPercentage of
the total (%) AmountPercentage of the total (%)
(in millions of RMB, except for percentages)
Restructured loans(Note) 763 0.04 1,068 0.05Of which: restructured loans overdue
for more than 90 days 615 0.03 687 0.03
Note: Represents the restructured non-performing loans.
The Group imposed strict and prudent control over restructuring of loans. As at the end of the reporting period, the percentage of the Group’s restructured loans was 0.04%, a decrease of 0.01 percentage point as compared with that at the end of the previous year.
3.4.9 Repossessed assets and allowances for impairment lossesAs at the end of the reporting period, total repossessed assets of the Group amounted to RMB953 million. After deduction of allowances for impairment losses of RMB761 million, the net repossessed assets amounted to RMB192 million.
China Merchants Bank Interim Report 2014
35
III Report of the Board of Directors
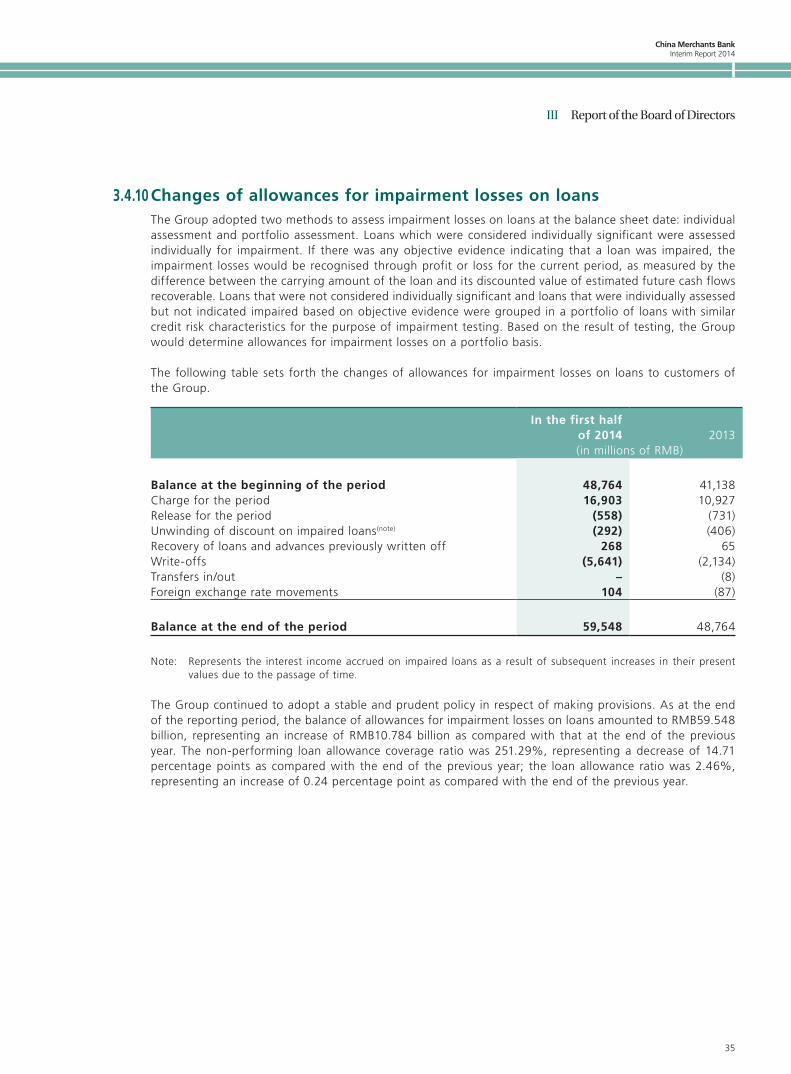
3.4.10 Changes of allowances for impairment losses on loansThe Group adopted two methods to assess impairment losses on loans at the balance sheet date: individual assessment and portfolio assessment. Loans which were considered individually significant were assessed individually for impairment. If there was any objective evidence indicating that a loan was impaired, the impairment losses would be recognised through profit or loss for the current period, as measured by the difference between the carrying amount of the loan and its discounted value of estimated future cash flows recoverable. Loans that were not considered individually significant and loans that were individually assessed but not indicated impaired based on objective evidence were grouped in a portfolio of loans with similar credit risk characteristics for the purpose of impairment testing. Based on the result of testing, the Group would determine allowances for impairment losses on a portfolio basis.
The following table sets forth the changes of allowances for impairment losses on loans to customers of the Group.
In the first half of 2014 2013(in millions of RMB)
Balance at the beginning of the period 48,764 41,138Charge for the period 16,903 10,927Release for the period (558) (731)Unwinding of discount on impaired loans(note) (292) (406)Recovery of loans and advances previously written off 268 65Write-offs (5,641) (2,134)Transfers in/out – (8)Foreign exchange rate movements 104 (87)
Balance at the end of the period 59,548 48,764
Note: Represents the interest income accrued on impaired loans as a result of subsequent increases in their present values due to the passage of time.
The Group continued to adopt a stable and prudent policy in respect of making provisions. As at the end of the reporting period, the balance of allowances for impairment losses on loans amounted to RMB59.548 billion, representing an increase of RMB10.784 billion as compared with that at the end of the previous year. The non-performing loan allowance coverage ratio was 251.29%, representing a decrease of 14.71 percentage points as compared with the end of the previous year; the loan allowance ratio was 2.46%, representing an increase of 0.24 percentage point as compared with the end of the previous year.
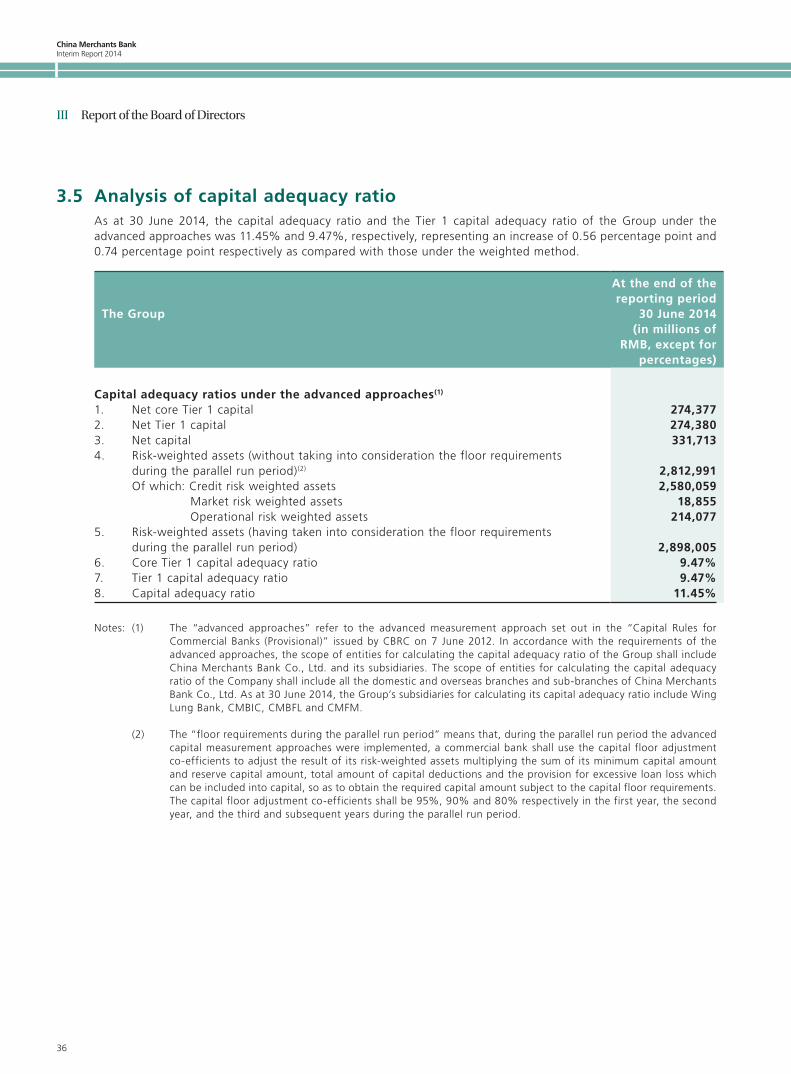
China Merchants BankInterim Report 2014
36
III Report of the Board of Directors
3.5 Analysis of capital adequacy ratioAs at 30 June 2014, the capital adequacy ratio and the Tier 1 capital adequacy ratio of the Group under the advanced approaches was 11.45% and 9.47%, respectively, representing an increase of 0.56 percentage point and 0.74 percentage point respectively as compared with those under the weighted method.
The Group
At the end of the reporting period
30 June 2014(in millions of
RMB, except for percentages)
Capital adequacy ratios under the advanced approaches(1)
1. Net core Tier 1 capital 274,3772. Net Tier 1 capital 274,3803. Net capital 331,7134. Risk-weighted assets (without taking into consideration the floor requirements
during the parallel run period)(2) 2,812,991Of which: Credit risk weighted assets 2,580,059
Market risk weighted assets 18,855Operational risk weighted assets 214,077
5. Risk-weighted assets (having taken into consideration the floor requirements during the parallel run period) 2,898,005
6. Core Tier 1 capital adequacy ratio 9.47%7. Tier 1 capital adequacy ratio 9.47%8. Capital adequacy ratio 11.45%
Notes: (1) The “advanced approaches” refer to the advanced measurement approach set out in the “Capital Rules for Commercial Banks (Provisional)” issued by CBRC on 7 June 2012. In accordance with the requirements of the advanced approaches, the scope of entities for calculating the capital adequacy ratio of the Group shall include China Merchants Bank Co., Ltd. and its subsidiaries. The scope of entities for calculating the capital adequacy ratio of the Company shall include all the domestic and overseas branches and sub-branches of China Merchants Bank Co., Ltd. As at 30 June 2014, the Group’s subsidiaries for calculating its capital adequacy ratio include Wing Lung Bank, CMBIC, CMBFL and CMFM.
(2) The “floor requirements during the parallel run period” means that, during the parallel run period the advanced capital measurement approaches were implemented, a commercial bank shall use the capital floor adjustment co-efficients to adjust the result of its risk-weighted assets multiplying the sum of its minimum capital amount and reserve capital amount, total amount of capital deductions and the provision for excessive loan loss which can be included into capital, so as to obtain the required capital amount subject to the capital floor requirements. The capital floor adjustment co-efficients shall be 95%, 90% and 80% respectively in the first year, the second year, and the third and subsequent years during the parallel run period.
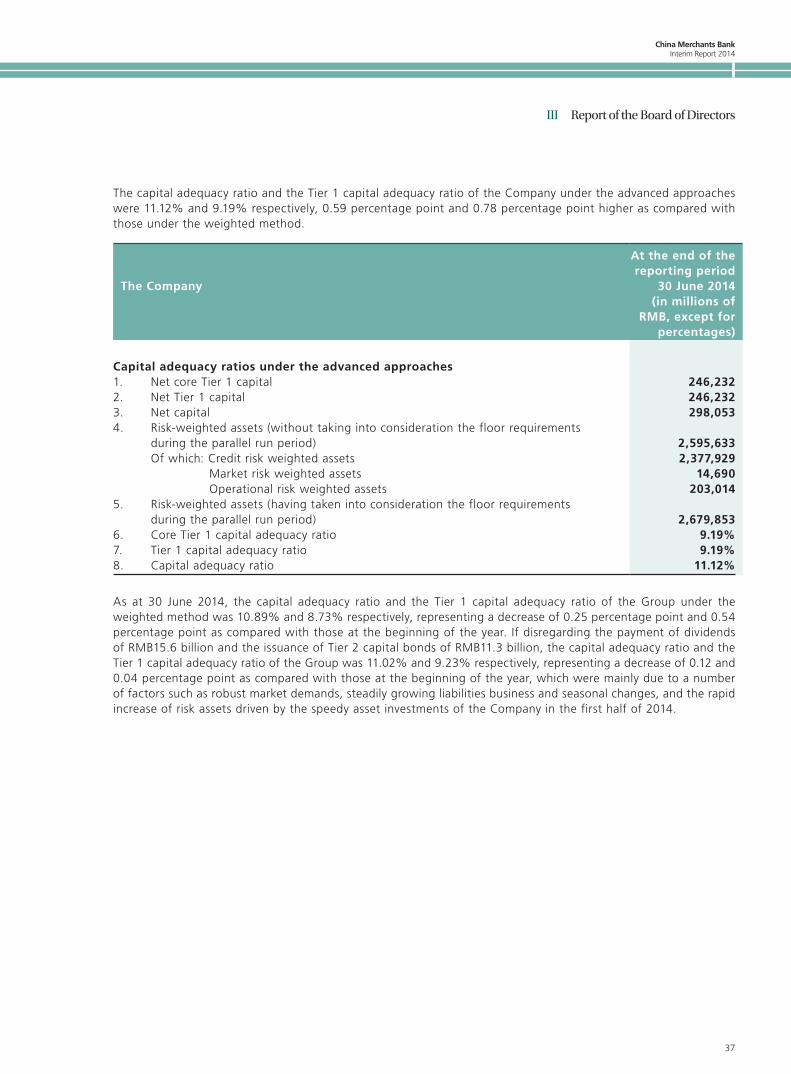
China Merchants Bank Interim Report 2014
37
III Report of the Board of Directors
The capital adequacy ratio and the Tier 1 capital adequacy ratio of the Company under the advanced approaches were 11.12% and 9.19% respectively, 0.59 percentage point and 0.78 percentage point higher as compared with those under the weighted method.
The Company
At the end of the reporting period
30 June 2014(in millions of
RMB, except for percentages)
Capital adequacy ratios under the advanced approaches1. Net core Tier 1 capital 246,2322. Net Tier 1 capital 246,2323. Net capital 298,0534. Risk-weighted assets (without taking into consideration the floor requirements
during the parallel run period) 2,595,633Of which: Credit risk weighted assets 2,377,929
Market risk weighted assets 14,690Operational risk weighted assets 203,014
5. Risk-weighted assets (having taken into consideration the floor requirements during the parallel run period) 2,679,853
6. Core Tier 1 capital adequacy ratio 9.19%7. Tier 1 capital adequacy ratio 9.19%8. Capital adequacy ratio 11.12%
As at 30 June 2014, the capital adequacy ratio and the Tier 1 capital adequacy ratio of the Group under the weighted method was 10.89% and 8.73% respectively, representing a decrease of 0.25 percentage point and 0.54 percentage point as compared with those at the beginning of the year. If disregarding the payment of dividends of RMB15.6 billion and the issuance of Tier 2 capital bonds of RMB11.3 billion, the capital adequacy ratio and the Tier 1 capital adequacy ratio of the Group was 11.02% and 9.23% respectively, representing a decrease of 0.12 and 0.04 percentage point as compared with those at the beginning of the year, which were mainly due to a number of factors such as robust market demands, steadily growing liabilities business and seasonal changes, and the rapid increase of risk assets driven by the speedy asset investments of the Company in the first half of 2014.
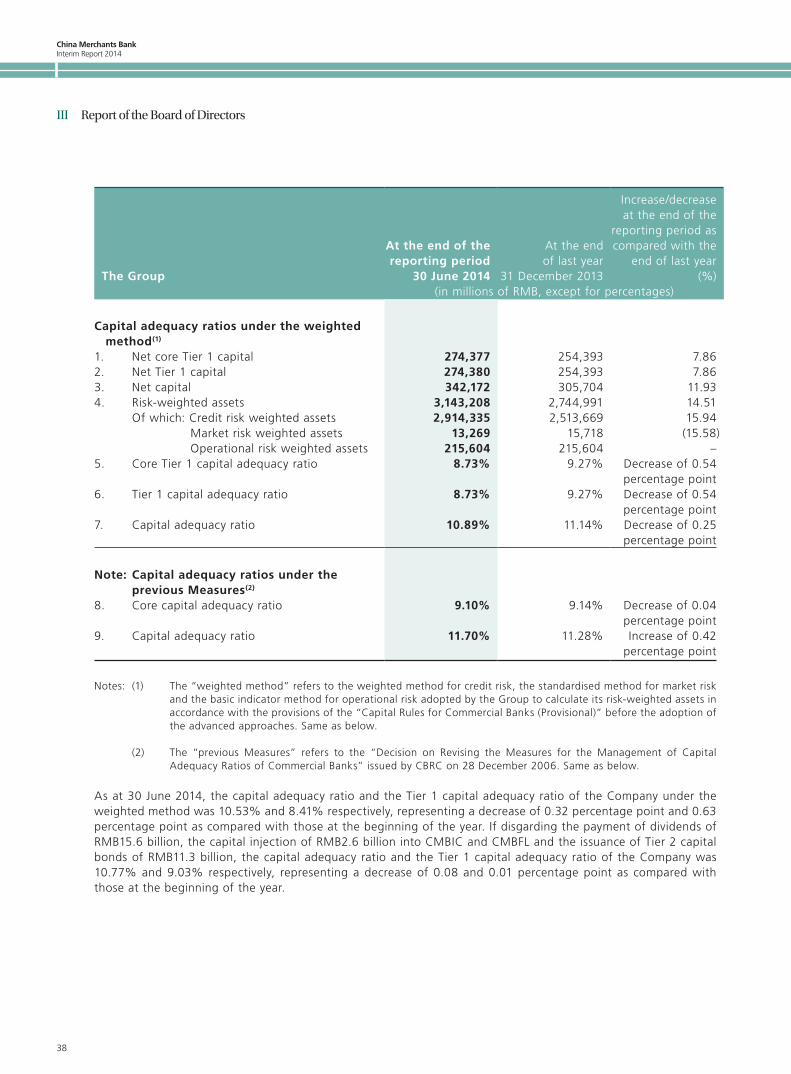
China Merchants BankInterim Report 2014
38
III Report of the Board of Directors
The Group
At the end of the reporting period
30 June 2014
At the end of last year
31 December 2013
Increase/decrease at the end of the
reporting period as compared with the
end of last year (%)
(in millions of RMB, except for percentages)
Capital adequacy ratios under the weighted method(1)
1. Net core Tier 1 capital 274,377 254,393 7.862. Net Tier 1 capital 274,380 254,393 7.863. Net capital 342,172 305,704 11.934. Risk-weighted assets 3,143,208 2,744,991 14.51
Of which: Credit risk weighted assets 2,914,335 2,513,669 15.94Market risk weighted assets 13,269 15,718 (15.58)Operational risk weighted assets 215,604 215,604 –
5. Core Tier 1 capital adequacy ratio 8.73% 9.27% Decrease of 0.54 percentage point
6. Tier 1 capital adequacy ratio 8.73% 9.27% Decrease of 0.54 percentage point
7. Capital adequacy ratio 10.89% 11.14% Decrease of 0.25 percentage point
Note: Capital adequacy ratios under the previous Measures(2)
8. Core capital adequacy ratio 9.10% 9.14% Decrease of 0.04 percentage point
9. Capital adequacy ratio 11.70% 11.28% Increase of 0.42 percentage point
Notes: (1) The “weighted method” refers to the weighted method for credit risk, the standardised method for market risk and the basic indicator method for operational risk adopted by the Group to calculate its risk-weighted assets in accordance with the provisions of the “Capital Rules for Commercial Banks (Provisional)” before the adoption of the advanced approaches. Same as below.
(2) The “previous Measures” refers to the “Decision on Revising the Measures for the Management of Capital Adequacy Ratios of Commercial Banks” issued by CBRC on 28 December 2006. Same as below.
As at 30 June 2014, the capital adequacy ratio and the Tier 1 capital adequacy ratio of the Company under the weighted method was 10.53% and 8.41% respectively, representing a decrease of 0.32 percentage point and 0.63 percentage point as compared with those at the beginning of the year. If disgarding the payment of dividends of RMB15.6 billion, the capital injection of RMB2.6 billion into CMBIC and CMBFL and the issuance of Tier 2 capital bonds of RMB11.3 billion, the capital adequacy ratio and the Tier 1 capital adequacy ratio of the Company was 10.77% and 9.03% respectively, representing a decrease of 0.08 and 0.01 percentage point as compared with those at the beginning of the year.
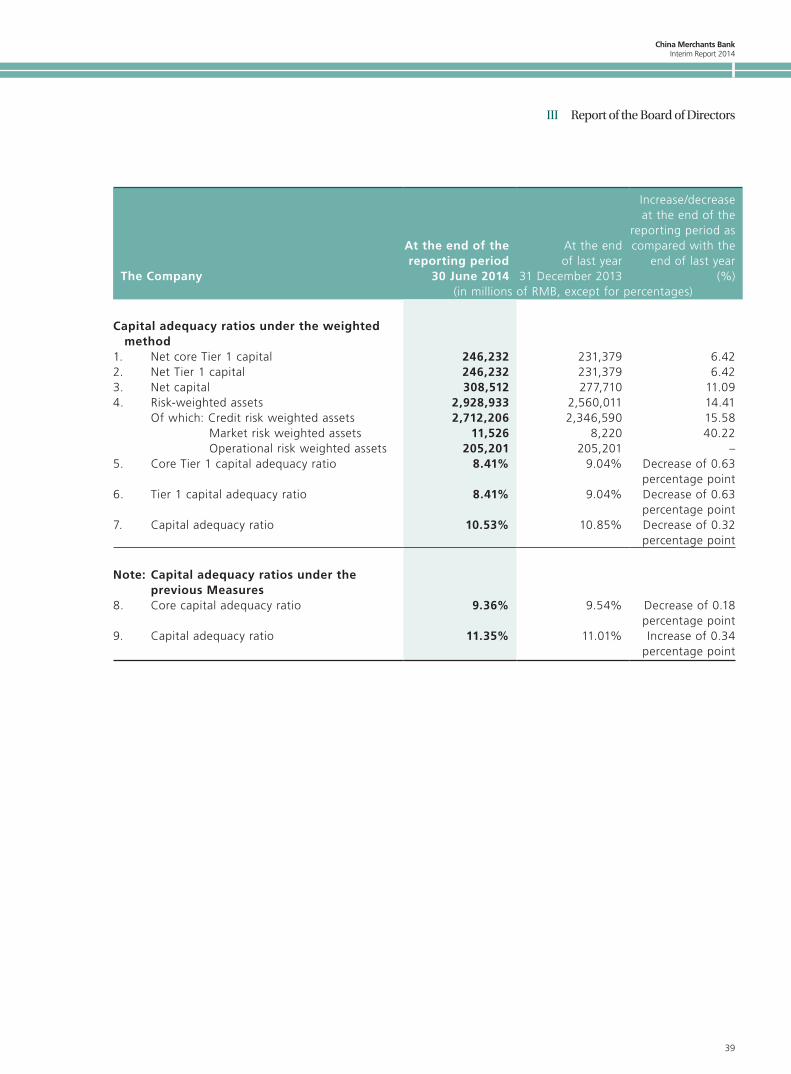
China Merchants Bank Interim Report 2014
39
III Report of the Board of Directors
The Company
At the end of the reporting period
30 June 2014
At the end of last year
31 December 2013
Increase/decrease at the end of the
reporting period as compared with the
end of last year (%)
(in millions of RMB, except for percentages)
Capital adequacy ratios under the weighted method
1. Net core Tier 1 capital 246,232 231,379 6.422. Net Tier 1 capital 246,232 231,379 6.423. Net capital 308,512 277,710 11.094. Risk-weighted assets 2,928,933 2,560,011 14.41
Of which: Credit risk weighted assets 2,712,206 2,346,590 15.58Market risk weighted assets 11,526 8,220 40.22Operational risk weighted assets 205,201 205,201 –
5. Core Tier 1 capital adequacy ratio 8.41% 9.04% Decrease of 0.63 percentage point
6. Tier 1 capital adequacy ratio 8.41% 9.04% Decrease of 0.63 percentage point
7. Capital adequacy ratio 10.53% 10.85% Decrease of 0.32 percentage point
Note: Capital adequacy ratios under the previous Measures
8. Core capital adequacy ratio 9.36% 9.54% Decrease of 0.18 percentage point
9. Capital adequacy ratio 11.35% 11.01% Increase of 0.34 percentage point
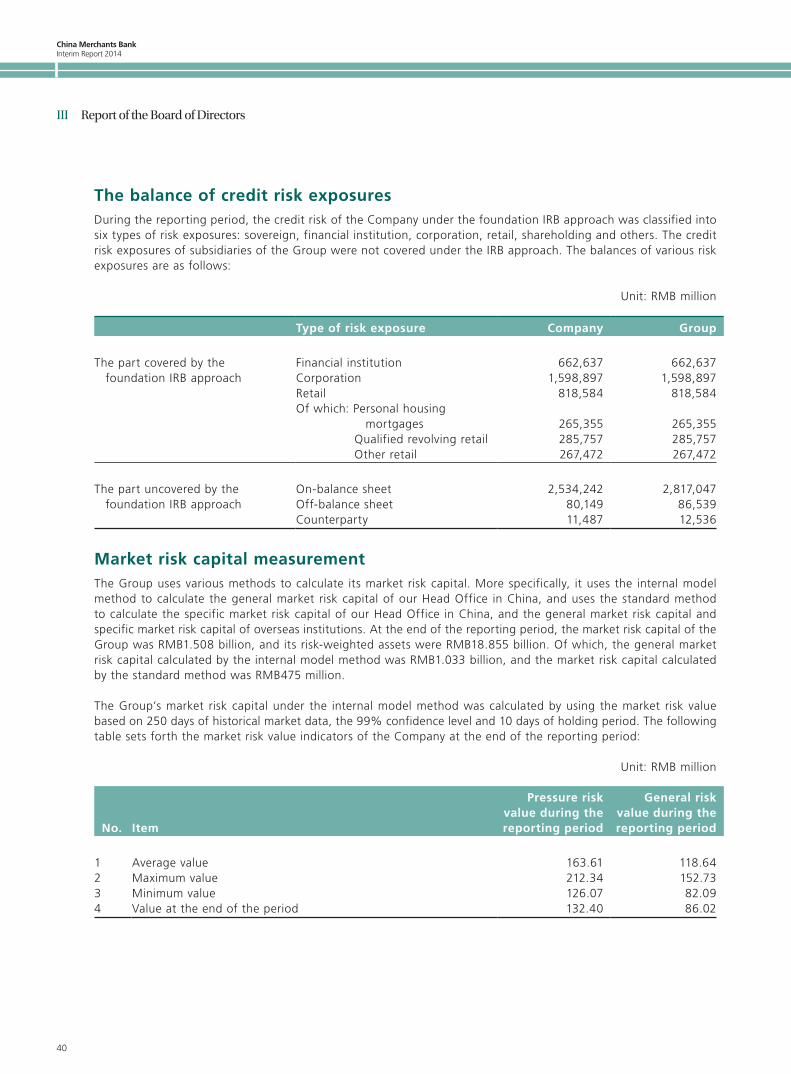
China Merchants BankInterim Report 2014
40
III Report of the Board of Directors
The balance of credit risk exposuresDuring the reporting period, the credit risk of the Company under the foundation IRB approach was classified into six types of risk exposures: sovereign, financial institution, corporation, retail, shareholding and others. The credit risk exposures of subsidiaries of the Group were not covered under the IRB approach. The balances of various risk exposures are as follows:
Unit: RMB million
Type of risk exposure Company Group
The part covered by the foundation IRB approach
Financial institution 662,637 662,637Corporation 1,598,897 1,598,897Retail 818,584 818,584Of which: Personal housing
mortgages 265,355 265,355Qualified revolving retail 285,757 285,757Other retail 267,472 267,472
The part uncovered by the foundation IRB approach
On-balance sheet 2,534,242 2,817,047Off-balance sheet 80,149 86,539Counterparty 11,487 12,536
Market risk capital measurementThe Group uses various methods to calculate its market risk capital. More specifically, it uses the internal model method to calculate the general market risk capital of our Head Office in China, and uses the standard method to calculate the specific market risk capital of our Head Office in China, and the general market risk capital and specific market risk capital of overseas institutions. At the end of the reporting period, the market risk capital of the Group was RMB1.508 billion, and its risk-weighted assets were RMB18.855 billion. Of which, the general market risk capital calculated by the internal model method was RMB1.033 billion, and the market risk capital calculated by the standard method was RMB475 million.
The Group’s market risk capital under the internal model method was calculated by using the market risk value based on 250 days of historical market data, the 99% confidence level and 10 days of holding period. The following table sets forth the market risk value indicators of the Company at the end of the reporting period:
Unit: RMB million
No. Item
Pressure risk value during the reporting period
General risk value during the reporting period
1 Average value 163.61 118.642 Maximum value 212.34 152.733 Minimum value 126.07 82.094 Value at the end of the period 132.40 86.02
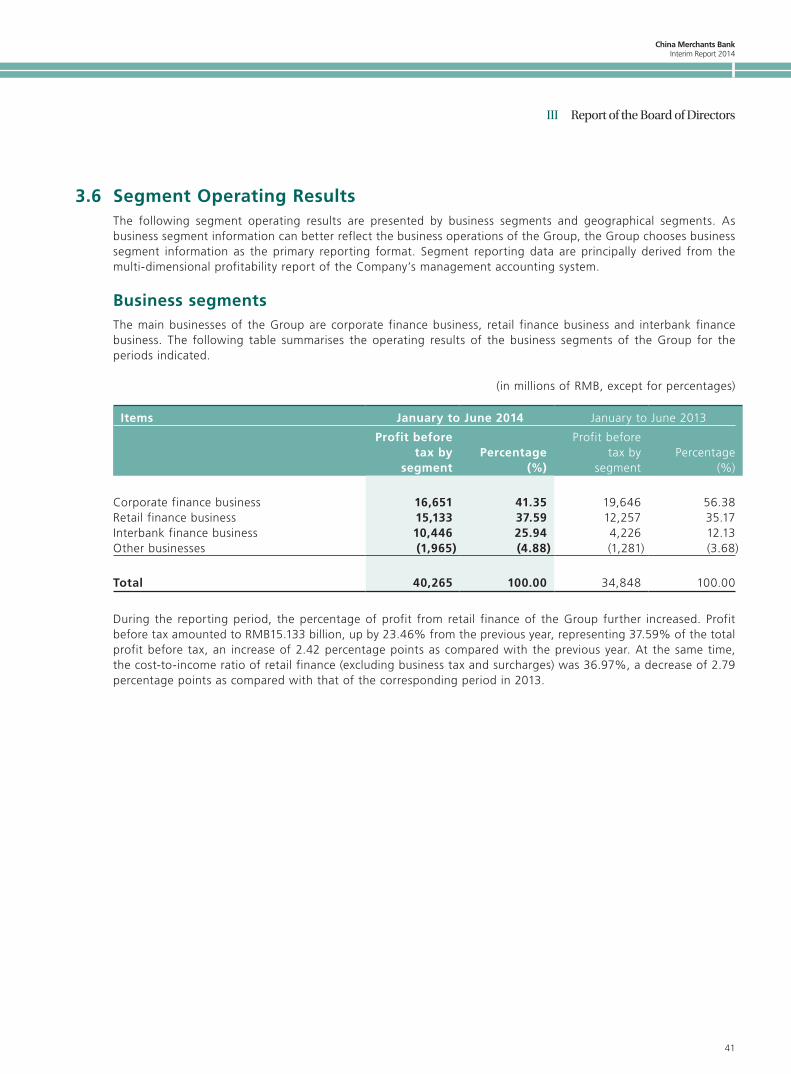
China Merchants Bank Interim Report 2014
41
III Report of the Board of Directors
3.6 Segment Operating ResultsThe following segment operating results are presented by business segments and geographical segments. As business segment information can better reflect the business operations of the Group, the Group chooses business segment information as the primary reporting format. Segment reporting data are principally derived from the multi-dimensional profitability report of the Company’s management accounting system.
Business segmentsThe main businesses of the Group are corporate finance business, retail finance business and interbank finance business. The following table summarises the operating results of the business segments of the Group for the periods indicated.
(in millions of RMB, except for percentages)
Items January to June 2014 January to June 2013
Profit before tax by
segmentPercentage
(%)
Profit before tax by
segmentPercentage
(%)
Corporate finance business 16,651 41.35 19,646 56.38Retail finance business 15,133 37.59 12,257 35.17Interbank finance business 10,446 25.94 4,226 12.13Other businesses (1,965) (4.88) (1,281) (3.68)
Total 40,265 100.00 34,848 100.00
During the reporting period, the percentage of profit from retail finance of the Group further increased. Profit before tax amounted to RMB15.133 billion, up by 23.46% from the previous year, representing 37.59% of the total profit before tax, an increase of 2.42 percentage points as compared with the previous year. At the same time, the cost-to-income ratio of retail finance (excluding business tax and surcharges) was 36.97%, a decrease of 2.79 percentage points as compared with that of the corresponding period in 2013.
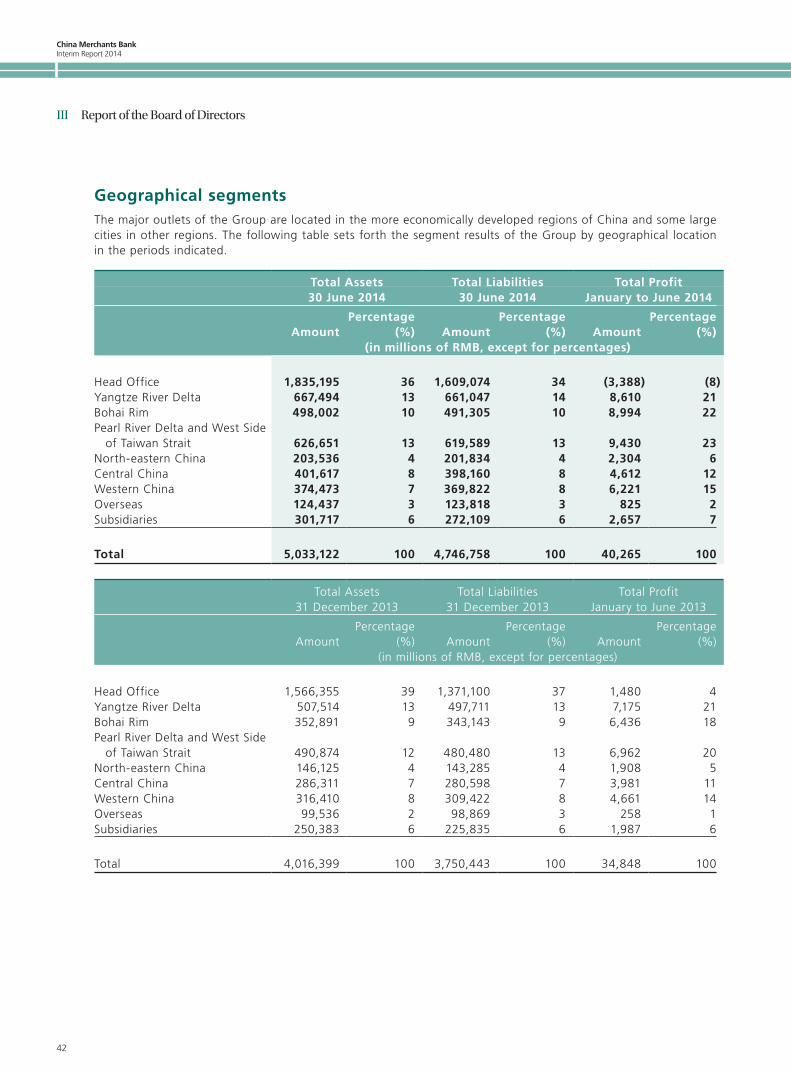
China Merchants BankInterim Report 2014
42
III Report of the Board of Directors
Geographical segmentsThe major outlets of the Group are located in the more economically developed regions of China and some large cities in other regions. The following table sets forth the segment results of the Group by geographical location in the periods indicated.
Total Assets Total Liabilities Total Profit30 June 2014 30 June 2014 January to June 2014
AmountPercentage
(%) AmountPercentage
(%) AmountPercentage
(%)(in millions of RMB, except for percentages)
Head Office 1,835,195 36 1,609,074 34 (3,388) (8)Yangtze River Delta 667,494 13 661,047 14 8,610 21Bohai Rim 498,002 10 491,305 10 8,994 22Pearl River Delta and West Side
of Taiwan Strait 626,651 13 619,589 13 9,430 23North-eastern China 203,536 4 201,834 4 2,304 6Central China 401,617 8 398,160 8 4,612 12Western China 374,473 7 369,822 8 6,221 15Overseas 124,437 3 123,818 3 825 2Subsidiaries 301,717 6 272,109 6 2,657 7
Total 5,033,122 100 4,746,758 100 40,265 100
Total Assets Total Liabilities Total Profit31 December 2013 31 December 2013 January to June 2013
AmountPercentage
(%) AmountPercentage
(%) AmountPercentage
(%)(in millions of RMB, except for percentages)
Head Office 1,566,355 39 1,371,100 37 1,480 4Yangtze River Delta 507,514 13 497,711 13 7,175 21Bohai Rim 352,891 9 343,143 9 6,436 18Pearl River Delta and West Side
of Taiwan Strait 490,874 12 480,480 13 6,962 20North-eastern China 146,125 4 143,285 4 1,908 5Central China 286,311 7 280,598 7 3,981 11Western China 316,410 8 309,422 8 4,661 14Overseas 99,536 2 98,869 3 258 1Subsidiaries 250,383 6 225,835 6 1,987 6
Total 4,016,399 100 3,750,443 100 34,848 100
China Merchants Bank Interim Report 2014
43
III Report of the Board of Directors
3.7 Other
3.7.1 Balance of off-balance-sheet items that may have a material effect on the financial positions and operating results and the related important informationThe Group’s off-balance-sheet items include derivative financial instruments, commitments and contingent liabilities. Commitments and contingent liabilities include credit commitments, operating leasing commitments, capital expenditure commitments, securities underwriting commitments, bonds redemption commitments, outstanding litigations and disputes and other contingent liabilities. Credit commitment is the primary component. As at the end of June 2014, the balance of credit commitments was RMB1,223.628 billion. For details of the contingent liabilities and commitments, please refer to the “Contingent Liabilities and Commitments” in “Notes to the Financial Statements” of this report.
3.7.2 Outstanding overdue debtsAs at the end of June 2014, the Group did not have any outstanding overdue debts.
The contents and data in section 3.8 and below are analysed from the Company’s perspective.
From 2014 onwards, the Company optimised its organizational structure to conduct business decisions, results reporting and performance evaluation based on the three major business lines of retail finance, corporate finance and inter-bank finance. Accordingly, adjustments were made to part of the data of the corresponding period of the previous year set out in the sections headed “Business Development Strategies” and “Business Operation”.
3.8 Business Development Strategies
3.8.1 Strategic transformation
1. The proportion of retail finance business rose steadily
During the first half of 2014, the value contribution of the retail finance business grew steadily. Profit before tax reached RMB15.147 billion, representing a year-on-year increase of 23.54%. The percentage of pre-tax profit of retail finance business in total profit increased continuously to 40.25%, 2.95 percentage points higher than the same period of the previous year.
China Merchants BankInterim Report 2014
44
III Report of the Board of Directors
2. Net non-interest income increased rapidly
In the first half of 2014, the Company continued to vigorously expand wealth management, credit cards, international guarantee and factoring, and other cross-border coordination businesses, thus facilitating a rapid growth in the net non-interest income. From January to June 2014, the Company realised a net non-interest income of RMB28.324 billion, representing a year-on-year increase of RMB13.139 billion or 86.53%. The proportion of the net non-interest income to our net operating income was 35.31%, up by 10.38 percentage points as compared with the corresponding period of the previous year. Fee and commission income amounted to RMB23.638 billion, representing a year-on-year increase of 67.53%, among the total non-interest income, fees and commission income from wealth management services amounted to RMB7.114 billion, representing a year-on-year increase of 49.86% on the same statistical calibres as compared with the first half of 2013 (of which income from entrusted wealth management services amounted to RMB3.340 billion, representing a year-on-year increase of 115.07%; income from sales of third-party trust plans amounted to RMB1.357 billion, representing a year-on-year increase of 5.69%; income from sales of third party insurance policies amounted to RMB1.207 billion, representing a year-on-year increase of 18.80%; income from sales of mutual fund amounted to RMB1.138 billion, representing a year-on-year increase of 44.97%; income from precious metals custody amounted to RMB72 million); bank card fees amounted to RMB5.604 billion, representing a year-on-year increase of 52.16%; and fees from international guarantee and factoring amounted to RMB915 million, representing a year-on-year increase of 62.81%. In addition, settlement and clearing fees amounted to RMB2.232 billion, representing a year-on-year increase of 80.29%, and the bills sell-off spread income amounted to RMB3.323 billion, representing a year-on-year increase of 165.42%.
3. The Company continuously carried forward the small and micro enterprises strategy
In order to carry forward the small and micro enterprises strategy, the Company continuously pushed forward the system reform and process optimisation, actively established a professional management system in line with the development of small and micro enterprise businesses, and focused on enhancing such capabilities as market planning, marketing development, customer service, product innovation, risk management and operation management in respect of small and micro enterprise businesses.
China Merchants Bank Interim Report 2014
45
III Report of the Board of Directors
The calculation caliber for our small and micro enterprise businesses was different from that at the end of the previous year due to the elimination of relevant data after growth of certain enterprises at the beginning of the year, and due to the Company’s adjusted classification of certain products. As at 30 June 2014, balance of the Company’s loans to small and micro enterprises totalled RMB610.617 billion, representing an increase of RMB45.593 billion or 8.07% over the beginning of the year (calculated on the Bank’s caliber), and accounted for 29.68% of domestic general loans (excluding discounted bills), representing a decrease of 0.11 percentage point over the beginning of the year, of which: balance of the small enterprises loans amounted to RMB285.930 billion, up by 1.03% as compared with the beginning of the year, and the proportion of small enterprises loans to domestic corporate loans reached 23.63%, representing a decrease of 1.84 percentage points as compared with the beginning of the year. Such increase and decrease in proportion were mainly due to the fact that the Company prudently withdrew from small enterprises with potential risks in the first half of the year in terms of loan granting, so as to further prevent the general risk of granting loans to small enterprises under current economic slowdown. In the meantime, in the first half of the year, in order to fully implement the asset-light banking development strategy, the Company proactively reduced the granting of general loans, and increased the use of bills of acceptance, letters of guarantee, letters of credit and other types of credits. Balance of micro-enterprise loans amounted to RMB324.687 billion, up by 15.13% as compared with the beginning of the year, and the proportion of micro-enterprise loans to total retail loans reached 38.31%, representing an increase of 2.41 percentage points as compared with the beginning of the year. The non-performing loan ratios of loans granted to small enterprises and micro enterprises were 2.18% and 0.81% respectively, representing an increase of 0.25 percentage point and 0.23 percentage point respectively as compared with the end of the previous year. The floating ranges of weighted average interest rate of newly granted small enterprises loans and newly granted micro-enterprise loans were 23.43% and 31.82% respectively, up by 0.65 percentage point and down by 0.81 percentage point respectively as compared with the previous year. As at the end of the reporting period, the Company had a total of 446,762 small enterprise customers and 1,191,474 micro enterprise customers, representing an increase of 12.75% and 29.89% as compared with the end of the previous year, respectively.
3.8.2 Second transformationIn 2010, the Company started implementing the “Second Transformation” strategy in a bid to accelerate the transformation to an organic and intensive development model, and identified five major objectives, i.e. higher capital utilisation efficiency, stronger loan risk pricing capability, higher operating efficiency, larger proportion of high-net-worth customers and better risk control. Despite the volatile and complicated external environment in 2014, the Company continued to press forward with the “Second Transformation” and made the following remarkable achievements:
Capital utilisation efficiency: since June 2014, the Company has adopted both advanced approaches and weighted method to measure capital indicators. As at 30 June 2014, the capital adequacy ratio and Tier 1 capital adequacy ratio of the Company measured through advanced approaches were 11.12% and 9.19% respectively; the capital adequacy ratio and Tier 1 capital adequacy ratio of the Company measured through weighted method were 10.53% and 8.41% respectively, down by 0.32 percentage point and 0.63 percentage point as compared with the beginning of the year respectively. The annualised return on average equity (ROAE) was 20.62%, representing an increase of 0.07 percentage point as compared with the previous year. The risk adjusted return on capital before tax (RAROC) was 26.12%, representing a decrease of 0.26 percentage point as compared with the previous year.
China Merchants BankInterim Report 2014
46
III Report of the Board of Directors
Loan risk pricing capability: as at 30 June 2014, the floating range of weighted average interest rates of newly granted corporate loans in RMB (weighted at actual amounts, same as below) increased by 1.17 percentage points to 13.86% as compared with the previous year. The floating range of weighted average interest rates of newly granted retail loans in RMB decreased by 0.71 percentage point to 28.78% as compared with the previous year.
Operational efficiency: as at 30 June 2014, the cost-to-income ratio of the Company was 26.77%, representing a decrease of 7.92 percentage points as compared with the previous year; the annualised profit before tax per person was RMB1.46 million, representing an increase of 13.18% as compared with the previous year; the annualised profit before tax per outlet was RMB70.04 million, representing an increase of 9.23% as compared with the previous year.
High-net-worth customers: as at 30 June 2014, the number of Sunflower-level and above customers (retail customers of the Company with minimum total daily average assets of RMB500,000 per month) was 1,190,600, representing an increase of 11.79% as compared with the beginning of the year; the number of private banking customers (retail customers of the Company with minimum total daily average assets of RMB10 million per month) was 29,219, representing an increase of 14.60% as compared with the beginning of the year.
Asset quality and risk control: as at 30 June 2014, the non-performing loan ratio of the Company was 1.07%, representing an increase of 0.17 percentage point as compared with the end of the previous year, while the percentage of special mention loans to the total was 1.24%, which was 0.13 percentage point up as compared with that at the end of the previous year. The allowance coverage ratio of our non-performing loans was 246.41%, representing a decrease of 14.93 percentage points as compared with the end of the previous year. The percentage of credit cost was 1.53%, an increase of 1.02 percentage points as compared with the end of the previous year.
3.9 Core Competitive AdvantagesThe Company has gained a leading position in retail finance such as wealth management, private banking, credit card and electronic banking, etc. The Company also accelerated the development of emerging corporate banking business such as cash management and cross-border finance, and gained a competitive advantage in the market. It has made significant achievements in strategic transformation in terms of further optimisation of its business structure, customer base and revenue structure. The Company vigorously promoted e-channels innovation and proactively explored new operating models for mobile banking and online banking and steadily strengthened its advantages in IT platform. The Company has established the service philosophy of “we are here just for you” through years of practice in banking business, hence high quality service has constituted an important element of its core competitiveness. The Company has a rapidly developing cross-border finance platform which can offer quality cross-border finance services to its customers. With continuously expanding brand influence, the Company has gained increasing recognition in domestic and overseas markets.
China Merchants Bank Interim Report 2014
47
III Report of the Board of Directors
3.10 Operating Environment, the Impact of Changes in Macroeconomic Policies and Key Business Concerns
1. Overview of the macroeconomic and financial outlook in the second half of the yearInternationally, the global economy is expected to continue its mild recovery, witnessed by the gradual recovery of the employment rate and real estate market in the United States, increasing support from European monetary policy, mild recovery of the Japanese economy driven by domestic consumption and investment, and gradual stabilisation of the emerging economies. However, we still need to pay close attention to the speed with which the U.S. shall exit from quantitative easing policies and the uncertainties it has on the global economy. According to the latest forecast of the World Bank, the global economy is expected to grow by 3.4% this year, representing an increase of 0.3 percentage point as compared with the previous year.
Domestically, taking into account the gradual stabilisation of domestic demand, the State’s increased investment in infrastructural projects such as railway construction, improved external environment and further promulgation of state policies, economic growth is expected to resume and stabilise. In respect of monetary and financial outlook, monetary policy is expected to be fine-tuned towards moderately loosening, and overall growth in the monetary market will be higher than that in the first half of the year. The increase in deposits is higher than that in the corresponding period of the previous year, the market will face a relatively loose condition, and market interest rates will remain at low levels. In consideration of the promulgation and implementation of regulatory rules governing the operations of shadow banking such as “Document No. 127”, the off-balance-sheet business of commercial banks may continue to face the pressure of adjustment, while the on-balance-sheet RMB loans are expected to maintain rapid growth.
At present, confronting external challenges such as the gradual slowdown of domestic economic growth, the acceleration of interest rate liberalisation and financial disintermediation, and cross-industry competition from internet finance, the Company is facing greater pressure on asset quality control. The narrowing interest spread is mounting pressure on profitability. The Company will accelerate structural adjustment, continue to optimise its customer base, asset and liability business and income structure, so as to further enhance its market competitiveness and achieve its objective of strategic transformation.
2. Net interest marginIn the first half of 2014, the net interest margin of the Company was 2.63%, down by 26 basis points as compared with the previous year, which was mainly due to: (1) the relatively rapid increase in structured deposits, which resulted in a modest increase in the cost of deposits from customers; (2) rise in the proportion of daily average balance of inter-bank liabilities with relatively higher cost, which drove up the average cost of liabilities; and (3) slight decrease in the yield of general loans. Looking into the second half of the year, in face of the accelerating promotion of interest rate liberalisation and increasingly competitive market, the pressure on liabilities is relatively difficult to be relieved. Meanwhile, under the recent relatively eased monetary policy, there will be limited yield increase in assets such as loans, debt investment and inter-bank assets, as well as great downward pressure on net interest margin. Against such background, the Company will accelerate the adjustment of asset-liability structure, expand customer base, further explore customers’ potential demands and flexibly adjust pricing policy, so as to absorb more low-cost deposits to consolidate its comparative advantage in liability cost. Meanwhile, with effective control and management of risks, the Company will continue to optimise its asset structure to maintain a relatively stable net interest margin.
China Merchants BankInterim Report 2014
48
III Report of the Board of Directors
3. Assets quality of key areasTo proactively cope with the changes in external macroeconomic environment, the Company pre-emptively prevented and controlled the potential risks associated with loans extended to real estate enterprises, local government financing platforms, overcapacity industries and high-risk areas.
In respect of real estate loans, in adherence to the “Five Good Principles on Customer, Region, Project, Team and Revenue”, the Company focused on extending loans to its strategic core customers for their quality projects, gave priority to common residential properties, social security housing projects in urban core areas and reconstruction of shanty areas, set more stringent loan extension criteria and tightened post-lending monitoring. As at the end of the reporting period, the balance of business with domestic real estate exposed to risk (calculated on the broad statistical calibres) amounted to RMB272.102 billion (including businesses such as actual and contingent credit, bond investments, proprietary trading and wealth management non-standard investments), representing an increase of RMB82.424 billion as compared with the beginning of the year. Among which, the balance of loans for domestic corporate real estate amounted to RMB121.679 billion, representing an increase of RMB25.246 billion as compared with the end of the previous year, which accounted for 5.53% of the Company’s total loans, up by 0.73 percentage point as compared with the end of the previous year, and the non-performing loan ratio was 0.67%, up by 0.15 percentage point as compared with the end of the previous year.
In respect of loans extended to local government financing platforms, in adherence to the basic guidance of controlling the total loans amount and stringently following loan extension criteria, the Company optimised loan portfolios by extending loans to government financing platforms at a higher level. As at the end of the reporting period, the balance of business with local government financing platforms exposed to risk (calculated on the broad statistical calibres) amounted to RMB189.427 billion (including businesses such as actual and contingent credit, bond investments, proprietary trading and investment of wealth management products in non-standard assets), representing an increase of RMB45.246 billion as compared with the beginning of the year. Among which, the balance of loans extended to local government financing platforms amounted to RMB97.046 billion, representing an increase of RMB9.781 billion or 11.21% as compared with the end of the previous year, which accounted for 4.41% of the total loans granted by the Company, up by 0.07 percentage point as compared with the end of the previous year, and the non-performing loan ratio was 0.01%, representing a decrease of 0.01 percentage point as compared with the end of the previous year.
For overcapacity industries such as iron and steel, cement, plate glass, electrolytic aluminum, shipbuilding, polysilicon, wind power equipment and coal chemical industry, the Company focused on overall policy controlling total loan amounts, adjusting loan structure, increasing guarantees and exiting risks, by implementing control on total volume of credit and list management to support quality customers and withdraw from risky loans, so as to optimise risk mitigation measures. During the reporting period, the balance of our loans extended to overcapacity industries amounted to RMB47.474 billion, accounting for 2.16% of total loans of the Company, and representing a decrease of 0.27 percentage point as compared with that at the beginning of the year. The non-performing loan ratio of the Company was 0.67%, down by 0.06 percentage point as compared with the beginning of the year.
The Company formulated differentiated regional credit policies, and applied series of tools, such as credit authorisation, approval policies, loan granting volume and asset quality appraisal to consolidate regional risk control and promote the adjustment of regional customer base, with an aim to enhance its regional risk monitoring and pre-warning capability. Meanwhile, the Company held colloquia on prevention and control of regional risk to discuss the relevant measures to be taken to prevent and control the regional risk, so as to control and reduce regional risk on assets gradually.
China Merchants Bank Interim Report 2014
49
III Report of the Board of Directors
4. Risk-weighted assetsAs of 30 June 2014, the balance of the Company’s risk-weighted assets under the weighted method amounted to RMB2,928.933 billion, up by 14.41% from the beginning of the year, mainly due to the moderate acceleration in asset investments in the first half of the year in order to meet customers’ financing needs and the strong growth of our liability business, which delivered favourable results and brought about a corresponding rapid growth of risk-weighted assets. In the second half of the year, the Company will keep the scale of risk-weighted assets within a reasonable range by moderately slowing down the growth in the volume of risk-weighted assets, implementing the business philosophy of asset-light banking, optimising organisational structure, promoting fine management, and increasing investment in light assets business.
5. Assets ManagementOn 18 April 2014, CBRC approved the Company’s implementation of the advanced approaches for capital measurement. Specifically, the Company adopts the foundation IRB approach to measure corporate risk exposure and financial institution risk exposure which are in compliance with regulatory requirements, the Company also adopts the IRB approach to measure retail risk exposure, the internal model approach to measure market risks and the standard method to measure operational risks respectively. Meanwhile, CBRC also allowed a parallel run period for commercial banks which have been approved to adopt the advanced approaches for capital measurement. During the parallel run period, commercial banks shall calculate their respective capital adequacy ratio by using the advanced approaches for capital measurement and other approaches and comply with the capital floor requirements. Under the advanced approaches, the volume of risk weighted assets of the Company is significantly lower than that under the weighted method. This is mainly due to the diversified nature of retail assets which produce significant capital efficient effect under the advanced approaches. As the Company always places emphasis on the strategy of retail banking, retail assets account for a larger proportion in its total assets.
The Company continued to optimise its business structure and enhance capital management. As for the optimisation of asset structure, in the first half of 2014, the Company simultaneously issued two tranches of credit assets-backed securities in the interbank bond market in an aggregate principal amount of RMB15.39 billion. Among which, the Company issued the first credit-card securitization product in China. In the second half of 2014, the Company will further speed up the development of assets securitization business with a view to improve its capital utilization efficiency.
As for the optimisation of capital structure, in the first half of 2014, the Company successfully completed the issuance of Tier 2 capital bonds of RMB11.3 billion. Currently, the Company has no further financing plan for the second half of the year. Meanwhile, the Company will continue to pay close attention to new financing instruments such as preference shares and perpetual bonds.
China Merchants BankInterim Report 2014
50
III Report of the Board of Directors
6. Development of interbank business under the new interbank regulationsAfter the issuance of the “Notice on Regulating the Interbank Business of Financial Institutions” (“Document No. 127”) and the “Notice on Regulating the Governance of Interbank Business of Financial Institutions” (“Document No. 140”), the Company has already ceased the business of beneficial rights transfer from Party B and Party C under resale agreements, and ceased acting as agent for interbank payments as well as settlement and payment of domestic letters of credit under the trade category in China, and regulated and adjusted the model of beneficial rights transfer business (Party A business). As regards the impact on the Company’s asset-liability structure, the above documents clearly specify two applicable indicators, namely “the net interbank financing volume (excluding interbank deposit for settlement purpose) from a commercial bank to another legal-entity financial institution, after deducting zero risk-weighted financial assets, shall not exceed 50 percent of the Tier 1 capital of the bank” and “the outstanding interbank borrowing of a commercial bank shall not exceed one third of total liabilities of the bank”, aiming to restrict the volume of assets and liabilities in the interbank business by setting the asset-to-liability ratio. The Company has complied with the regulatory requirements of these two indicators. In the short term, these requirements might reduce the proportion of interbank assets in the Company’s balance sheet which, however, in the long run, will facilitate the healthy and sustainable development of the interbank business. Taking into consideration the strong positive correlation between interbank deposits and interbank assets, the driving force of interbank assets on interbank deposits will become weaker, and the proportion of interbank deposits will drop accordingly. As at the end of the reporting period, the balance of the Company’s proprietary non-standard investment was RMB438.055 billion, representing an increase of 106.49% as compared with that at the beginning of the year.
The new interbank regulations specify the direction for the development of the Company’s interbank business. While interbank business has returned to its original form, there is still enormous market potential and room for innovation to be further explored. The Company will thoroughly study the collaboration model of interbank customer group, strengthen interbank collaboration, intensify its efforts to design new interbank products, build large-scale asset management model and large-scale transaction product chain, speed up innovation of its interbank business platform, establish modernised Internet finance channels, comply with new regulatory framework and proactively promote the reform of its interbank business governance system.
7. Internet financeIn 2014, under the general strategies of “building on competitive advantages and overcoming weaknesses”, “forging asset-light banking and promoting the transformation of service model”, the Company strived to make breakthroughs in the three aspects of “platform, Big Data and customer experience”, so as to build the Company’s structure of Internet finance.
The establishment of the Company’s platforms focused on Mobile Banking, CMB Life (掌上生活), Small Business E Home (小企業E家) and Yin E Tong (銀E通) and others, which were designed to attract online customers, especially mobile Internet users. The Company intensified product innovation to launch competitive financial products, attracted large groups of customers and maintained operation, and progressively explored the business model to provide comprehensive services and manage customers under the Internet environment. As for the application of Big Data, emphasis had been put on integrating internal data and obtaining external data, strengthening data analysis capability and gradually building an advanced model of operating and managing Big Data. Regarding customer experience, the Company aimed to establish a sound user experience system and enhance its capability to maximize user experience. The Company invested its resources to establish a professional user experience laboratory to satisfy the requirements for standardisation and professionalisation in user experience research.
China Merchants Bank Interim Report 2014
51
III Report of the Board of Directors
Under the strategic framework for bank-wide Internet finance development, the principle of “overall planning, coordinated development” has been adopted in businesses including retail finance, corporate finance and interbank finance to promote the development of Internet finance business.
As for retail finance, the Company strived to promote the establishment of online platforms to develop the two mobile internet operating systems, namely, Mobile Banking and CMB Life. Mobile Banking would be developed as a comprehensive service platform that could provide online and offline retail finance services, which would form a network regarding the whole process of customer management with the mode of light accounts and light products via the combination of the traffic online and offline. CMB Life would be established as an open and highly dynamic comprehensive consumption service platform of mobile internet, which would boldly include the communication mechanism of mobile internet with sharing and social interaction-based characteristics, creatively capitalizing on customer management to secure new customers, so as to establish a positive cycle of securing customers and managing customers.
As for corporate finance, the Company focused on the development of the intelligent supply chain financial platform and Small Business E Home. In the area of supply chain finance, the Company accelerated the promotion of the intelligent supply chain financial platform, achieved online supply chain management with financial service as its core through the information-based synergic cooperation, and planned to connect with more than 400 key enterprises within this year. At the same time, the Company further promoted Small Business E Home and made it an open and comprehensive internet financial service platform for small and medium-sized enterprises. The Company focused on exploring the huge number of non-CMB customers by leveraging on wide Internet connection, securing customers in large numbers and managing customers continuously. Currently, 409,000 members have registered with Small Business E Home and its page views amounted to 77.70 million.
As for interbank finance, the Company strived to establish an open-ended cooperative sales platform for financial products featuring multi-institutions on both the product end and the sales end, and to incorporate a variety of platforms into the value chain of the cooperative platform. Currently, the cooperative platform has launched our wealth management products, and entered into agreements with 59 sales agencies covering seven types of commercial institutions, including regional banks, securities firms, clearing institutions, E-commerce platforms, third-party payment service providers, wealth management companies and bills acceptance companies. In the future, the Company will introduce more capital management institutions and more diversified financial products, so as to build an eco-system for cooperative sales of financial products.
China Merchants BankInterim Report 2014
52
III Report of the Board of Directors
3.11 Business Operation
3.11.1 Retail finance
Business overview
In the first half of 2014, the Company continued to achieve rapid development in retail finance. Balance of total assets under management (AUM) from our retail customers increased by RMB295.2 billion as compared with that at the beginning of the year, recording the highest ever increment for the same period. The number of our high-value retail customers continued to grow rapidly. The number of our Sunflower-level and above customers increased by 11.79% as compared with that at the beginning of the year, among which, the number of private banking customers increased by 14.60% as compared with that at the beginning of the year. The Company was in the forefront among domestic banks in terms of both new sales and stock volume of funds; the Company ranked fifth among domestic listed banks in terms of its agency insurance sales volume and commission income. Balance of deposits from retail customers exceeded RMB1 trillion, representing an increase of 20.25% as compared with that at the beginning of the year and a record high increment. Our demand deposits maintained their low-cost advantage and achieved a quality growth, with an increase of 2.89 percentage points in their proportion to the deposits from retail customers. Retail loans also maintained a continuous healthy growth, with the increase of 7.90% in balance as compared with that at the beginning of the year. According to the data released by the People’s Bank of China, the Company ranked first among domestic small and medium-sized banks in terms of the balance of retail deposits, ranked fifth among domestic listed banks in terms of the increment of retail deposits and ranked second among domestic listed banks in terms of the percentage of increment of retail deposits, among which, the Company ranked third among domestic listed banks in terms of the balance and increment of foreign currency deposits from retail customers. The Bank ranked fifth among domestic listed banks in terms of the balance of retail loans, and ranked first among domestic small and medium-sized banks in terms of the increment of retail loans, among which, the Company ranked second among domestic listed banks in terms of annual increment of personal operating loans.
In the first half of 2014, profit from the retail finance of the Company grew steadily with constantly improved value contribution. Profit before tax reached RMB15.147 billion, representing a year-on-year increase of 23.54%. The percentage of retail profit before tax in total profit before tax increased continuously to 40.25%, representing an increase of 2.95 percentage points over the corresponding period of the previous year. Net operating income from retail finance grew rapidly to RMB32.079 billion, up by 18.28% year-on-year. Among them, net interest income from retail finance reached RMB21.533 billion, increasing by 11.82% year-on-year and accounting for 67.12% of net operating income from retail finance; net non-interest income from retail finance amounted to RMB10.546 billion, up by 34.07% year-on-year and accounting for 32.88% of net operating income from retail finance. In the first half of 2014, the retail finance of the Company recorded a commission income of RMB5.554 billion from bank cards (including credit cards), up by 52.75% year-on-year; fee and commission income from retail wealth management business was RMB4.483 billion, up by 20.80% year-on-year (calculated on the same statistical calibres) and accounting for 44.04% of net fee and commission income from retail finance. In the first half of 2014, the cost-to-income ratio of the retail finance business of the Company was 36.95%, representing a decrease of 2.81 percentage points as compared with the corresponding period of the previous year.
China Merchants Bank Interim Report 2014
53
III Report of the Board of Directors
Wealth management
The Company continued to improve the framework of its wealth management business, optimize the procedures of its wealth management business, strengthen the professional capability of its team, and vigorously promoted the new marketing model based on asset allocation. Moreover, the Company continued to enhance customer experience, and promote the rapid growth of wealth management business through enhancing integrated customer management so as to expand the contribution of the wealth management business.
In the first half of 2014, the Company recorded RMB2,675.655 billion in accumulated sales of personal wealth management products, registered RMB307.4 billion in the distribution of open-ended funds and RMB31.9 billion in standard premiums from the distribution of third-party insurance policies. Fee and commission income from retail wealth management business was RMB4.483 billion. Among them, income from entrusted wealth management amounted to RMB825 million, representing a year-on-year increase of 19.05%; income from distribution of funds amounted to RMB1.135 billion, representing a year-on-year increase of 44.96%; income from distribution of third-party insurance policies amounted to RMB1.204 billion, representing a year-on-year increase of 19.33%; income from distribution of third-party trust plans amounted to RMB1.252 billion, representing a year-on-year increase of 2.12%; and income from precious metals custody amounted to RMB67 million.
Private banking
Our private banking business follows the philosophy of “It’s our job to build your everlasting family fortune”, which provides high-net-worth customers with comprehensive, personalised and private wealth management services. Our private banking business has maintained a rapid and steady growth. In the first half of 2014, the Company fully promoted the upgrading of its private banking service, constantly enhanced its capability in providing the relevant investment advisory services, and continued to optimise and enrich its open-ended product platform. Meanwhile, the Company launched the discretionary assets entrustment business, and completed the signing of contract for the first discretionary assets entrustment deal in China. The Company also consolidated and enhanced its advantage in extra-high-end customer service, fully exerted its advantages in business coordination with overseas financial institutions to promote the building of an overseas investment platform, so as to gradually launch the comprehensive cross-border financial service and satisfy customers’ demand for global assets allocation. In addition, the Company has built a comprehensive financial service platform comprising personal financing and corporate banking services for private banking customers to offer corporate banking services to the enterprises behind our private banking customers.
As at 30 June 2014, the Company had 29,219 private banking customers, representing an increase of 14.60% as compared with that at the beginning of the year; total assets under management from private banking customers amounted to RMB662.1 billion, representing an increase of 15.87% over the beginning of the year. The Company established three new private banking centers in Lanzhou, Kunming and Shanghai Pilot Free Trade Zone. Currently, the Company has established 34 private banking centers and 55 wealth management centers, which form a high-end customer service network covering all major economic regions in China.
China Merchants BankInterim Report 2014
54
III Report of the Board of Directors
Credit cards
In the first half of 2014, the Company actively adapted to changes in customer needs and the external environment, and took the customer-centric and market-oriented approaches to enhance value contribution from its credit card business in retail finance of the Bank.
During the reporting period, the Company capitalised on the development trend of mobile Internet technologies to constantly upgrade our WeChat/Weibo customer service, continuously enhanced the operating platform of the mobile user application “CMB Life (掌上生活)”, vigorously promoted the use of mobile terminals to continuously improve the quality of its customer services and enhance customers’ experience in using our credit cards. The Company broadened the streamlined channels, improved the efficiency and enhanced the efforts in securing customers, so as to optimise its customer mix. The Company actively promoted cross-sales under the retail system of the Bank, leading to a steady growth in cross-sales. The Company also cooperated with Baidu to launch the Baidu Music Co-branded Credit Card (百度音樂聯名信用卡). Meanwhile, the Platinum Instalment Credit Card (白金分期卡) and All Currency Credit Card (全幣種卡) businesses maintained a rapid growth momentum which further optimised our product mix. The Company continued to expand extraordinary marketing activities such as “Extraordinary USA” (非常美國), “Extraordinary Europe” (非常歐洲) and “Extraordinary Overseas Shopping” (非常海購) to further improve its marketing platform and deepen the management of valued customers. The Company constantly upgraded high-yield products and services and continuously optimised the product portfolio with high yield. The Company continued to implement sound risk management strategies to ensure steady and healthy development of business. In general, our credit card business maintained a steady growth momentum.
As at the end of the reporting period, the Company had issued 54.56 million credit cards in total. The total number of active cards was 27.74 million, representing an increase of 2.09 million cards during the reporting period. The Company constantly improved the efficiency of customer acquisition and customer management. The cumulative transaction value of credit cards for the period from January to June 2014 was RMB581.2 billion, representing a year-on-year increase of 39.04%; and the average transaction value per month of each active card was RMB3,623. The percentage of the revolving balances of credit cards was 32.22%. Interest income from credit cards for the period from January to June 2014 amounted to RMB5.533 billion, representing a year-on-year increase of 42.02%. Non-interest income from credit cards was RMB5.322 billion, representing a year-on-year increase of 53.46%. Thanks to enhanced risk control, the risk level of our credit card business remained stable, among which, non-performing loan ratio of credit cards was 0.99%, up by 0.01 percentage point as compared with that at the end of the previous year.
China Merchants Bank Interim Report 2014
55
III Report of the Board of Directors
Retail loans
In the first half of 2014, in adherence to the principle of coordinated improvement in efficiency, quality and volume, the Company actively promoted the structural adjustment and optimisation of the retail loan business, thus achieving a balanced growth in retail loan business. Meanwhile, the Company increased its efforts to explore small and micro enterprise customers, enhanced its risk management capability and level of customer services, strengthened overall customer management and promoted the sustainable and healthy development of its retail loan business. At the same time, the creditworthiness and solvency of some individual customers deteriorated due to the macroeconomic downturn, overcapacity industries and regional risks, resulting in an increase of non-performing loans. However, given that the non-performing loan ratio was generally controllable and the vast majority of such new non-performing loans have been fully secured by collaterals, the possibility of eventual losses on such loans is relatively slim. As at 30 June 2014, the Company’s total retail loans amounted to RMB847.551 billion, representing an increase of RMB62.026 billion or 7.90% as compared with that at the end of the previous year. Among which, micro enterprise loans amounted to RMB324.687 billion, representing an increase of 15.13% as compared with that at the end of the previous year, which accounted for 38.31% of our retail loans, up by 2.41 percentage points as compared with that at the end of the previous year. Non-performing loan ratio of retail loans was 0.72%, up by 0.08 percentage point as compared with that at the end of the previous year (Please refer to the section headed “Strategic Transformation” in Chapter III of this report for further information on the loans granted to micro enterprises).
Retail customers and total assets under management from retail customers
In the first half of 2014, the Company conducted its retail finance in strict adherence to the “customer-centric” principle. By upgrading customer services, increasing its effort in the development and launch of new products, exploring payroll and corporate annuity customers, expanding the customer base of payment and settlement services, further expanding its wealth management business, optimising the allocation of assets of customers and intensifying the overall management of micro customers, the Company actively broadened the sources of deposits, constantly expanded its retail customer base and promoted a rapid growth in total assets under management (AUM) and deposits from retail customers.
As at the end of June 2014, the total number of retail customers of the Company reached 51.54 million, among which, the number of Sunflower-level and above customers reached 1,190,600, representing an increase of 11.79% as compared with that at the beginning of the year. The balance of total assets under management (AUM) from our retail customers amounted to RMB3,120.4 billion, representing an increase of 10.45% as compared with that at the beginning of the year. Among which, the balance of total assets under management from Sunflower-level and above customers amounted to RMB2,321.1 billion, representing an increase of 13.09% as compared with that at the beginning of the year, and accounting for 74.38% of the balance of total assets under management from retail customers of the Bank. Period-end balance of deposits from retail customers amounted to RMB1,081.059 billion, representing an increase of RMB182.066 billion or 20.25% as compared with that at the beginning of the year, of which, demand deposits accounted for 61.27% while the period-end balance of deposits from retail customers accounted for 33.02% of the balance of total customer deposits, of which, the total amount of deposits from Sunflower-level and above customers amounted to RMB523.1 billion. The average balance per All-in-one Card held by retail customers amounted to RMB13,300, representing an increase of RMB1,100 as compared with that at the beginning of the year; and transaction value of All-in-one Cards via POS reached RMB390.1 billion, representing a year-on-year increase of 46.32%.
China Merchants BankInterim Report 2014
56
III Report of the Board of Directors
3.11.2 Corporate banking
Business overview
The Company provides corporate customers, financial institutions and government agencies with a wide range of high quality corporate banking products and services. In the first half of 2014, the Company operated its corporate banking business in strict compliance with the requirements of the “Second Transformation”, thereby facilitating the rapid and healthy development of its various businesses.
Firstly, customer deposits of the Company maintained a rapid growth. According to the statistics of the People’s Bank of China, as at 30 June 2014, domestic corporate deposits in RMB of the Company increased by RMB322.010 billion as compared with that at the beginning of the year, ranking first among domestic small and medium-sized banks in terms of the increment of corporate customer deposits. The market share of our domestic deposits in foreign currencies was 7.28%, representing an increase of 1.29 percentage points as compared with that at the beginning of the year, ranking first among domestic small and medium-sized banks. Secondly, the development of our major corporate finance businesses achieved initial success with our cash management business experiencing a rapid growth. The intermediary business income from cash management recorded a year-on-year increase of 70.92%, while electronic supply chain transaction value recorded a year-on-year increase of 60.26%. Our trade finance business achieved rapid expansion, the granted value of international trade facilities recorded a year-on-year increase of 28.46%, the balance of offshore trade financing increased by 72.32% as compared with the beginning of the year, the amount of domestic trade financing recorded a year-on-year increase of 42.59%, and the market share of our domestic international trade facilities in foreign currencies was 4.60%, ranking second among all domestic small and medium-sized banks (based on the statistics of the People’s Bank of China). Cross-border finance reported a booming development. Our international settlements recorded a year-on-year growth of 38.08%, cross-border Renminbi settlements increased by 188.70% as compared with the same period of the previous year, the market share of our cross-border income and expenses was 3.33%, up by 0.20 percentage point as compared with that at the beginning of the year, and ranking second among all domestic small and medium-sized banks (based on the statistics of the State Administration of Foreign Exchange). The market share of foreign exchange settlements was 4.23%, up by 0.48 percentage point as compared with that at the beginning of the year, and ranking first among all domestic small and medium-sized banks (based on the statistics of the State Administration of Foreign Exchange). M&A advisory business saw a breakthrough by reporting a year-on-year increase of 407% in granted value of M&A financing. Thirdly, the operation of light assets in corporate finance business grew rapidly. In the first half of 2014, debt financing instruments underwritten recorded a year-on-year increase of 56.96%, which almost doubled the growth of the inter-bank bonds market, and accounting for 5.70% of the total market share and representing a year-on-year increase of 0.95 percentage point (based on relevant data of professional financial analysis platform).
In the first half of 2014, as for its corporate banking business, the Company continued to optimise the pricing mechanism and system development, improved its risk pricing capability, and strove to establish new profitability mode. During the reporting period, with respect to its corporate banking business, the Company posted RMB30.536 billion in net interest income, representing a year-on-year increase of 17.67%; net non-interest income amounted to RMB10.483 billion, representing a year-on-year increase of 73.73%; net operating income was RMB41.019 billion, representing a year-on-year increase of 28.25%, and accounting for 51.14% of the net operating income of the Company; profit before tax amounted to RMB16.659 billion, accounting for 44.36% of profit before tax of the Company.
China Merchants Bank Interim Report 2014
57
III Report of the Board of Directors
Corporate loans
Corporate loans of the Company include working capital loans, fixed asset loans, trade finance and other loans, such as merger and acquisition loans and corporate mortgage loans. As at 30 June 2014, total corporate loans of the Company were RMB1,284.192 billion, representing an increase of RMB122.052 billion as compared with that at the end of the previous year and accounting for 58.38% of total customer loans. Among them, the balance of the medium to long-term loans to domestic enterprises amounted to RMB436.455 billion, accounting for 36.08% of the total loans to domestic enterprises, and representing an increase of 1.54 percentage points as compared with that at the end of the previous year. The non-performing loan ratio of our corporate loans was 1.35%, an increase of 0.23 percentage point as compared with that at the end of the previous year, which was mainly due to the weaker debt repayment ability of enterprises as a result of the economic downturn.
In the first half of 2014, the Company further optimised the industry distribution structure of corporate loans, giving priority to industries undergoing structural upgrading, traditionally competitive industries, the strategic emerging industries, modern service sectors, and green industries. Meanwhile, the Company restricted loans to state-regulated industries, such as real estate, local government financing vehicles, and overcapacity industries. As at 30 June 2014, the balance of green credit loans was RMB130.932 billion, representing an increase of RMB14.561 billion (calculated on the same statistical calibres) as compared with that at the end of the previous year, which accounted for 10.20% of the total corporate loans of the Company. The balance of our loans extended to strategic emerging industries amounted to RMB52.127 billion, up by RMB4.126 billion as compared with that at the end of the previous year, which accounted for 4.06% of the total corporate loans of the Company.
In the first half of 2014, the Company vigorously promoted syndicated loan business to enhance inter-bank cooperation and information sharing and diversify the risks associated with large amount loans. As at 30 June 2014, the balance and management fee income of syndicated loans amounted to RMB70.788 billion and RMB52.87 million, respectively.
In the first half of 2014, the Company actively promoted the rapid and healthy development of its SME business. According to the classification standards set out in the “Notice on Issuing the Provisions on the Classification Standards for Small and Medium-sized Enterprises” (《關於印發中小企業劃型標準規定的通知》) (Lian Qi Ye [2011] No. 300) (the “National Standards”) promulgated by the Ministry of Industry and Information Technology, the total balance of loans extended to domestic small and medium-sized enterprises amounted to RMB677.693 billion as at 30 June 2014, representing an increase of 7.01% as compared with that at the end of the previous year, and accounting for 56.02% of our total domestic corporate loans.
Discounted bills
In the first half of 2014, after taking overall consideration of its total credit, liquidities, gains and risks, the Company effectively allocated and promoted its discounted bills business. As at 30 June 2014, the balance of discounted bills amounted to RMB67.978 billion, an increase of 10.37% as compared with that at the end of the previous year, and accounting for 3.09% of total customer loans.
Corporate customer deposits
In the first half of 2014, the Company’s corporate customer deposits maintained a rapid growth momentum. As at 30 June 2014, the balance of corporate customer deposits amounted to RMB2,193.059 billion, representing an increase of 24.90% as compared with that at the end of the previous year, and accounting for 66.98% of the total customer deposits; while its daily average balance amounted to RMB1,862.981 billion, representing a year-on-year increase of 15.85%. As at 30 June 2014, demand deposits accounted for 45.53% of total deposits from our corporate customers, 3.16 percentage points lower than that at the end of the previous year.
China Merchants BankInterim Report 2014
58
III Report of the Board of Directors
Cash management business
Cash management business is of fundamental and strategic importance for the Company to cope with the challenges from the liberalisation of interest rate. The Company provided various types of customers with all-inclusive, multi-model and integrated cash management services, contributing to the acquisition and retention of base customers, acquisition of low cost corporate settlement related deposits, and the cross-sales of other corporate and retail products. As at 30 June 2014, the total number of customers using cash management service reached 395,665, representing an increase of 23.80% as compared with that at the end of the previous year. The Company introduced “C+ cash management solution “, which includes all the features of principal corporate settlement products and services. The number of accounts opened for this service has exceeded 50,000. The Company was the first in the banking industry to launch the “All-in-one Card for Company (公司一卡通)”, a card designed for collecting funds. Currently, the total number of cards issued has reached 20,000. Basic cash management business sustained healthy development with such innovative products as “C+Account-deposits portfolio”, Cross-Border Cash Pool, Virtual Cash Pool, and the release of CBS-TT Version specially for cross-border cash management. Cross-bank cash management products have been applied by more than 300 conglomerates with more than 16,000 companies under management. It effectively promoted the marketing of various key items focusing on customs, tax, social security, provident funds and etc. The Company continued to push forward the innovation of major products including smart time deposits, “Wang Dai Yi (網貸易)”and “Ji Zhang Bao (記賬寶)” and concentrated more efforts on the marketing and promotion of “All-in-one Net for Corporate and Individual Accounts (公私賬戶一網通)” and “Shou Kuan Tong for Small Enterprises (小企業收款通)”. In addition, the Company aggressively developed supply chain settlement products, exploited corporate notes management services and promoted products relating to bill pooling and bill value-added service, resulting in the transaction amount of electronic supply chain for the first half of the year of RMB909.6 billion, representing a year-on year increase of 60.26%. In the first half of 2014, the intermediary business income from cash management of the Company amounted to RMB1.299 billion, representing a year-on-year increase of 70.92%.
Trade finance business and offshore business
With respect to trade finance business, the Company constantly diversified its cross-border financial products and generally upgraded the business model focusing on cross-border finance, domestic trade and integrated finance for domestic and foreign trade and committed to promoting the rapid development of “Zi Ben Tong (資本通)” and “Cai Fu Tong (財富通)”. The Company also rationalised its domestic trade finance product lines to drive the integrated development of domestic and foreign trade, with a view to providing enterprises with trade finance services for the whole industry chain at home and abroad. As at 30 June 2014, non-interest income from cross-border and trade finance amounted to RMB4.503 billion, representing a year-on-year growth of 84.57%. With respect to cross-border finance, the Company completed international settlements of US$259.011 billion, representing a year-on-year growth of 38.08%, cross-border Renminbi settlements of RMB360.301 billion, representing a year-on-year growth of 188.70%, foreign exchange settlements of US$73.447 billion, representing a year-on-year growth of 24.44%, accumulated international trade facilities of US$22.406 billion, representing a year-on-year growth of 28.46%, international factoring of US$10.350 billion, representing a year-on-year growth of 78.82%, and forfeiting of US$10.297 billion, representing a year-on-year growth of 175.37%. With respect to integrated trade financing for domestic trade, and for domestic and foreign trade, the Company provided domestic trade financing of RMB670.070 billion, representing a year-on-year growth of 42.59%.
With regard to offshore business, as at 30 June 2014, the number of offshore customers reached 28,100, representing an increase of 8.91% as compared with the beginning of the year; deposits from offshore customers amounted to US$13.440 billion, representing an increase of 46.52% as compared with the beginning of the year; while offshore trade financing balance reached US$6.550 billion, representing an increase of 72.32% as compared with the beginning of the year; credit assets continued to be of good quality with zero new non-performing loans. Cumulative net non-interest income reached US$73.3258 million, representing a year-on-year increase of 39.15%. According to information exchange among banking peers, for key performance indicators including offshore deposits and offshore net non-interest income, the Company continued to hold the largest market share among Chinese banks offering offshore banking services.
China Merchants Bank Interim Report 2014
59
III Report of the Board of Directors
Investment banking business
With respect to investment banking business, the Company aggressively developed underwriting business for debt financing instruments with a focus on the super short-term commercial papers and instruments issued through private placement, and actively expanded high-end financial advisory business including M&A advisory business, refinancing of listed companies and structured financing. The Company led its peers in issuance of ultra short-term commercial papers and successfully completed the underwriting of the first perpetual bond issued by a local enterprise in China. As at 30 June 2014, a total income of RMB1.588 billion from the investment banking business was achieved, representing a year-on-year increase of 39.42%. Debt financing instruments underwritten by our investment banking department amounted to RMB115.243 billion, representing a year-on-year increase of 56.96%. There were 151 bonds underwritten by the Company, representing a year-on-year increase of 39.81%.
With respect to M&A advisory business, the Company adopted various financing means and multiple-channel collaboration to develop the business. In the first half of 2014, a total of RMB10.990 billion was granted for financing M&A activities, representing a year-on-year increase of 407.15%, among which, RMB7.996 billion was granted for cross-border M&A activities, accounting for 72.76%.
Supply chain finance business
With respect to supply chain finance business, the Company completed development and launch of the intelligent supply chain system, which provides tailored solutions to eight key sectors, including health care, e-commerce, retail and supermarkets. Moreover, the Company cooperated with a number of organisations to promote the rapid development of supply chain finance. As at 30 June 2014, the Company had 486 core customers, of which 134 were effective (who have at least five upstream and/or downstream affiliates); the Company had 2,808 supply chain customers, of which 2,455 were effective (who have been granted credit lines).
“Qian Ying Zhan Yi” Program
The “Qian Ying Zhan Yi (千鷹展翼)” program is a strategic brand of the Company to serve innovative emerging enterprises. Targeting at this group of customers, the Company deepened innovation in marketing methods, product support, service channels and technology through further cooperation with external institutions to support innovative small enterprise customers based on the “equity financing plus debt financing” mode since the beginning of the year. Thanks to our devotion in this business over the past three years, the customer base of the “Qian Ying Zhan Yi” program further expanded. As at the end of June 2014, the total number of registered customers reached 20,806, representing an increase of 19.96% as compared with that at the end of the previous year. Of which, 12,995 customers were granted credit lines by the Company, representing an increase of 1,458 as compared with that at the beginning of the year; the credit lines granted amounted to RMB338.231 billion, representing an increase of RMB60.031 billion as compared with that at the beginning of the year; the balance of loans at the end of the reporting period amounted to RMB160.670 billion, representing an increase of RMB30.142 billion as compared with that at the beginning of the year, the increase was much higher than provision of financing to other types of enterprises. In order to better serve innovative emerging enterprises, the Company proceeded with construction of 100 “Qian Ying Zhan Yi (千鷹展翼)” innovative sub-branches, established and improved service standards for innovative sub-branches, and expanded their scope of services so as to enhance our network service capability for serving customers under the “Qian Ying Zhan Yi (千鷹展翼)” program.
China Merchants BankInterim Report 2014
60
III Report of the Board of Directors
Corporate customers
As at 30 June 2014, the Company has developed 631,600 corporate depositors and 38,900 corporate borrowers, including 77,661 wholesale high-net-worth customers (wholesale customers with overall contribution to the Company of more than RMB100,000), representing a year-on-year increase of 13.79%.
3.11.3 Interbank finance
Overview of business
The interbank finance segment of the Company was established in late 2013. In the past half year, all business lines of this segment saw rapid development under the operational guidance of “building an operational system for macro asset management and seeking a leading position among banks in terms of transactions”. The balance of deposits from other banks grew by 58.40% as compared with that at the beginning of the year. The number of accounts opened with the Company for cross-border RMB clearing business has reached 100, continuously leading small and medium-sized banks across the country. The bank-wide sales of wealth management products registered a new record with a year-on-year increase of 41.20%. Net-worth products and structured products continued to increase as a percentage of the total amount. The balance of assets under custody grew by 40.68% as compared with that at the beginning of the year. The annualised yield of foreign currency investment portfolio in the financial market continued its upward trend.
In the first half of 2014, the interbank finance business of the Company continued to record stable growth in profits with increasing value contribution. During the reporting period, the Company realised net operating income from interbank finance business of RMB11.436 billion, representing a year-on-year increase of 137.51%, and accounting for 14.26% of the net operating income of the Company. In particular, the Company achieved net interest income of RMB4.920 billion, up by 41.75% year-on-year, and net non-interest income of RMB6.516 billion, up by 384.82% year-on-year, pre-tax profit of RMB10.450 billion, up by 147.34% year-on-year.
Given the picture of mixed global economic situations, intensified financial risk exposure, liberalisation of interest rates and foreign exchange rates, accelerated RMB internationalisation, gradual standardisation of interbank business from the regulatory authorities and fierce competition from the Internet financing sector, the Company will speed up transformation of the interbank finance business, enhance professional management of inter-bank customers, and establish an interbank financial product system driven vertically by asset operation and management and horizontally by transaction banking so as to provide better financial products and services for retail and corporate customers as well as financial institutions, and to allow the interbank finance business to provide a stronger driver to the bank-wide businesses.
China Merchants Bank Interim Report 2014
61
III Report of the Board of Directors
Financial institutions business
With regard to businesses with financial institutions, the Company intensified construction of channels and enhanced value contribution from its inter-bank customers for the main purpose of further expanding its customer base of financial institutions. Meanwhile, it proactively analysed changes in the inter-bank market and optimised the structure of the over-the-counter treasury business to generate more revenue. Meanwhile, the cross-border RMB clearing business and bill business of the Company kept a rapid growth, maintaining a leading position in the industry. As at 30 June 2014, the balance of inter-bank placements from other financial institutions reached RMB807.289 billion, representing an increase of 58.40% as compared with the beginning of the year. The balance of over-the-counter asset business with other financial institutions such as inter-bank placements, assets purchased for resale (including bills and beneficial rights) amounted to RMB746.171 billion as at the end of the reporting period. The balance of funds under third-party custody amounted to RMB41.728 billion, representing an increase of 18.80% as compared with the beginning of the year. As for third party custody business, the Company had a total of 3.99 million customers, up by 100,000 customers as compared with the beginning of the year. The volume of inter-bank cross-border RMB clearing service in the first half of 2014 reached RMB334.811 billion, representing an year-on-year increase of 159.71%, and the total number of clearing accounts amounted to 100, an increase by 25 from the beginning of the year. As for margin trading and short selling business, the Company maintained business cooperation with 56 securities firms including three newly added ones. In addition, as one of the first pilot banks to issue interbank fixed-term certificates of deposits, the Company successfully issued its first tranche of three-month interbank fixed-term certificates of deposits in the total amount of RMB3 billion in December 2013. As at the end of the reporting period, the Company had issued a total of ten tranches of interbank fixed-term certificates of deposits in an aggregate value of RMB23.5 billion.
The Company has been qualified as a futures margin depository bank by China Financial Futures Exchange (CFFEX) and by Zhengzhou Commodity Exchange (ZCE). As at 30 June 2014, the Company’s balance of futures deposits was RMB9.528 billion with 93 futures margin depository accounts.
Assets management business
The Company continued to improve the development of wealth management business. Firstly, the Company increased product innovation to introduce a number of new products such as “Rui Yi”(a net-worth pension product), China’s first note swap wealth management product and “Bu Bu Sheng Jin (步步生金)”(a foreign currency product) in the first half of the year, which gave a strong impetus to the expansion in scale of various products. Secondly, the Company strengthened asset allocation to enhance investment yield on assets through expansion of inter-bank deposits and long and medium-term bond investments, proactive purchase of high-yield inter-bank private bonds and reduction of the proportion of non-standard assets in favour of standard assets and growth of the asset package of securities margin and short selling trading. Thirdly, the Company increased its marketing efforts and increased sales of products significantly in the first half of 2014 by enhancing efficiency in selling products off-line and exploring more inter-bank and Internet finance sale channels.
China Merchants BankInterim Report 2014
62
III Report of the Board of Directors
During the reporting period, the wealth management business of the Company maintained good development momentum. The Company developed 1,528 wealth management products in total and recorded RMB3.53 trillion in the sales of wealth management products. As at the end of the reporting period, the balance of wealth management products under operation by the Company amounted to RMB798.159 billion, representing an increase of 21.14% as compared with that at the beginning of the year (calculated on the same statistical calibres. Of which, RMB726.465 billion was off-balance sheet, representing an increase of 24.71% as compared with that at the beginning of the year.
The Company is committed to transforming its wealth management business through aggressive development of net-worth products and structured products. As at the end of the reporting period, the balance of net-worth wealth management products under operation amounted to RMB148.674 billion, representing an increase of 201.09% as compared with that at the beginning of the year, and accounting for 14.63% of the balance of total wealth management products under operation of the Company. During the reporting period, the Company issued 186 structured wealth management products with a sales value of RMB38.755 billion. As at the end of the reporting period, the balance of structured wealth management products of the Company amounted to RMB29.493 billion, representing more than twelve-fold increase as compared with that at the beginning of the year.
With respect to the asset custody business, the Company put more efforts in marketing various custody services and set new record in terms of volume of assets under custody despite unfavourable circumstances such as the slowdown of the domestic economy and the volatile stock market. As at the end of the reporting period, the balance of assets under custody amounted to RMB2,612.819 billion, representing an increase of 40.68% as compared with that at the beginning of the year. Nine open-ended funds were added to the portfolio of assets under custody with a sales volume of RMB9.416 billion. The outsourcing services newly introduced has opened up a new area for custody services.
Financial market business
RMB investment business: the Company, after making an intensive study of domestic financial market, grasped the trend of local-currency bond market and formulated its investment plan in a scientific way. Firstly, the Company actively extended the duration of its investments, increased investments primarily in medium to long-term bonds with maturity of 5 years or above. Meanwhile, the Company prioritised its investments in government bonds, and the credit bonds with good credit standing. Secondly, by capitalising on the opportunities of fluctuations in interest rates and credit spreads, the Company proactively adjusted and optimised the structure of its debt portfolios to increase earnings. As at the end of the reporting period, the balance of the Company’s RMB debt portfolio was RMB514.97 billion, with portfolio duration of 3.65 years and the annualised portfolio yield rate of 4.34%.
Foreign currency investments: the Company seized opportunities to implement stable operation based on its judgment on the international market. This has laid a good foundation for fulfillment of the Company’s annual investment plan. Firstly, the Company implemented its prudent investment strategy, adjusted its investment pace and controlled the duration of its new investments. Meanwhile, the Company actively participated in the spread transactions of newly issued bonds and range trading operation to realise interest spread gains. Secondly, the Company proactively developed derivative products to increase returns of debt portfolio. As at the end of the reporting period, the balance of the Company’s foreign exchange debt portfolio amounted to US$3.239 billion, with a portfolio duration of 1.98 years and the annualized portfolio yield of 2.12%.
China Merchants Bank Interim Report 2014
63
III Report of the Board of Directors
3.11.4 Distribution channelsThe Company provides products and services via multiple distribution channels. Our distribution channels are mainly divided into physical distribution channels and e-banking channels.
Physical distribution channels
The efficiently operated physical outlets of the Company are primarily located in Yangtze River Delta, Pearl River Delta and Bohai Rim, and some large and medium cities in other regions. As at 30 June 2014, the Company had 115 branches, 986 sub-branches, 1 exclusive branch-level operation center (the credit card center), 1 representative office, 2,420 self-service centers and 9,770 cash self-service machines (including 2,435 automatic teller machines and 7,335 cash recycle machines) in more than 110 cities of Mainland China. Meanwhile, the Company also had two subsidiaries, namely CMB Financial Leasing and China Merchants Fund, and one joint venture, namely CIGNA & CMB Life Insurance. The Company also has a number of subsidiaries including Wing Lung Bank Ltd. and CMB International Capital in Hong Kong, and a branch in Hong Kong (Hong Kong Branch); a branch and a representative office in New York, the United States; a representative office in London, the United Kingdom; a representative office in Taipei; and a branch in Singapore.
E-banking channels
The Company attaches great importance to developing and improving e-banking channels such as online banking, mobile banking and direct banking, which have effectively relieved the pressure on outlets of the Company. In the first half of 2014, the overall counter replacement ratio in respect of retail e-banking channels reached 94.35%, representing an increase of 1.85 percentage points over the previous year and overall counter replacement ratio in respect of corporate e-banking channels reached 55.50%; whereas it was 92.90% in respect of transaction settlement using online corporate banking services, representing an increase of 0.85 percentage point and 0.48 percentage point respectively over the previous year.
Online banking
The Company’s online banking business grew rapidly as online banking customers were getting more and more active in the first half of 2014.
As for its retail online banking business, as at 30 June 2014, the number of active users of the retail online banking professional edition of the Company reached 17,458,200, and the relevant replacement ratio in respect of retail online banking was 91.92%, up by 2.56 percentage points as compared with that of last year. Starting from 2014, the Company would distinguish online payment transactions and mobile payment transactions respectively in calculating the number of electric payment transactions and has made an adjustment to the year-on-year comparative figures. The total cumulative number of retail online banking transactions was 581,995,000, up by 37.89% as compared with that in the corresponding period of the previous year; and the accumulated transaction amount was RMB12,448.110 billion, up by 36.57% as compared with that in the corresponding period of the previous year. Specifically, the accumulative number of online payment transactions was 418,000,000, up by 35.35% as compared with that in the corresponding period of the previous year; and the accumulative amount of online banking transactions was RMB391.328 billion, up by 147.22% as compared with that in the corresponding period of the previous year.
China Merchants BankInterim Report 2014
64
III Report of the Board of Directors
As for its corporate online banking business, as at 30 June 2014, the total number of corporate online banking customers of the Company reached 392,441, representing an increase of 23.99% as compared with that at the end of the previous year. Of which, the number of small enterprise customers exceeded 326,600, and the number of small enterprise customers who entirely used our online banking services to conduct settlement transactions surpassed 110,000. The accumulated number of corporate online banking transactions of the whole Bank was 32,970,000, representing an increase of 40.60% as compared with that in the corresponding period of the previous year. Of which the number of settlement transactions of small enterprise customers reached 14,330,000, accounting for 43.46% of the number of corporate online banking transactions of the whole Bank. The accumulated transaction amount of corporate online banking transactions of the whole Bank was RMB23.80 trillion, representing an increase of 55.66% as compared with that in the corresponding period of the previous year.
Mobile banking
The personal mobile banking service of the Company continued to maintain rapid growth in the first half of 2014 as mobile banking customers were getting more and more active. The mobile banking recorded more than 55,000,000 login times each month. Mobile banking has become the most dynamic e-channel for customers of the whole Bank. As at 30 June 2014, the aggregate number of downloads of mobile banking apps had exceeded 40,000,000. The total number of mobile banking contracts signed had reached 19,265,900, of which number of active customers had reached 6,467,200. Meanwhile, the number of mobile banking transactions and payments has been increasing rapidly. In the first half of 2014, the number of login times made by mobile banking users reached 273,736,800, representing a year-on-year increase of 182.47%. The number of mobile banking transactions (excluding mobile payment) amounted to 72,498,200, up by 320.94% as compared with the corresponding period of the previous year; and the transaction volume reached RMB1,129.991 billion, up by 168.53% as compared with the corresponding period of the previous year. Both the number of transactions and transaction value had outperformed those in the full year of 2013. In the first half of the year, the number of mobile payment transactions amounted to 261,000,000, up by 273.06% as compared with the corresponding period of the previous year; and the transaction value was RMB177.743 billion, up by 1,297.46% as compared with the corresponding period of the previous year. In addition, the Company had continuously optimised and upgraded “WeChat Banking” since it launched the first WeChat Banking in China, and introduced certain featured services, namely notification of account activity, reminder of wealth management calendar and no-card cash withdrawal, which has attracted 2.20 million users to follow and use “WeChat Banking”. By doing so, the Company has set up a multilevel and diversified streamlined and intelligent customer service model.
As at 30 June 2014, the number of users of corporate mobile banking services amounted to 144,000. The total number of transactions such as account enquiries, payments and settlements completed through corporate mobile banking reached 1,040,000, which effectively met our corporate customers’ demand for mobile financial services, and also enabled the Company to form a brand new service channel for its online marketing campaign targeting corporate customers.
China Merchants Bank Interim Report 2014
65
III Report of the Board of Directors
Direct banking
The direct banking service provided by the Company integrates the convenience of direct banking channels and the face-to-face friendly and attentive service at counters, which is performed by direct banking relationship managers to provide customers with immediate, comprehensive, speedy and professional service, including a variety of banking transactions, investment and financial advisory services, one-stop loan services and product sales. Currently, the primary function of direct banking is to provide online loan services, online wealth management, and direct transactions and distance assistant service.
Since the beginning of this year, according to the overall arrangement of “asset-light banking” for the whole bank, the Company worked hard to shift direct banking service from transactional model to operational model, and divert direct banking customers to use more streamlined channels such as mobile banking and online banking so as to transform the transaction practice of customers from using phone calls to using streamlined channels. Up to now, remarkable results have been achieved in this regard. In the first half of 2014, the number of transactions conducted through direct banking reached 2,785,100 and the transaction value amounted to RMB365.495 billion, down by 12.16% as compared with that in the corresponding period of the previous year. The sales of various types of funds (including monetary funds), trusts and wealth management products amounted to RMB135.499 billion, down by 21.74% from the corresponding period of the previous year. Total loans granted through online channel amounted to RMB13.545 billion, up by 38.30% than that in the corresponding period of the previous year. 38,600 All-in-one Cards were activated through direct banking, up by 103.80% as compared with that in the corresponding period of the previous year.
3.11.5 IT research and developmentDuring the reporting period, the Company continued to focus on the development of electronic channels and mobile finance. Online banking, mobile banking and direct banking of the Company have effectively supplemented its physical outlets. Professional edition 7.0 of the personal online banking application of the Company has been launched successfully, with the number of downloads of its mobile banking and iPad banking ranking at the forefront in the banking industry. The Company has preliminarily established the new outlet model of the simple-and-easy sub-branches based on visible counters with no physical presence of counter staff. Our WeChat banking provides customers with self-served interactive services anytime and anywhere which in turn create superior customer experience in the banking industry.
Meanwhile, the Company also improved its IT management capability. The Company has fully implemented the CMMI system in its Information Technology Department, enhanced its overall capabilities of operation and maintenance and promoted its IT support and maintenance set-up, in order to support the strategic development of asset-light banking. During the reporting period, the Company completed the revamping of Phase II of the new-generation database system, the big data platform, and systems associated with the free trade zone, and the development and launch of cash management C+ settlement package, smoothly promoted the revamping and launch of a network optimisation project, the revamping of credit transfer system and the upgrading of corporate customer core fundamentals system and OPICS. The Company’s dual data centres in Shenzhen and Shanghai are operating smoothly, and have further promoted the continuous optimisation of key systems and infrastructure facilities. According to the statistics from China UnionPay, the Company continued to outperform domestic peers in terms of transaction acceptance ratio, successful transaction ratio and system processing ratio.
China Merchants BankInterim Report 2014
66
III Report of the Board of Directors
3.11.6 Overseas businesses
Hong Kong Branch
The Company established its Hong Kong Branch in 2002, which principally engaged in corporate banking and retail banking. In respect of corporate banking, Hong Kong Branch mainly provides the enterprises located in Hong Kong (including the companies based in Hong Kong with a Mainland background) and cross-border trade customers with diversified corporate banking products and services, such as deposits, loans (including syndicated loans and trade facilities), settlement and assets custody, inter-bank transaction of funds, bonds and foreign exchange trading. Hong Kong Branch is also allowed to conduct clearing and asset transfer with customers in banking industry. In respect of retail banking, relying on China Merchants Bank’s competitive strength in retail banking, Hong Kong Branch proactively developed featured retail banking services and provided cross-border personal banking services for individual customers in Hong Kong and Mainland China. The featured products were the “Hong Kong All-in-one Card” and “Hong Kong Bank-Securities Express”.
In the first half of 2014, facing a historic opportunity arising from the internationalisation of the RMB, Hong Kong Branch continued to leverage on its competitive edge in cross-border RMB business. Meanwhile, through strengthening innovation on financial services, optimising customer base, streamlining operation procedures and improving risk pricing, the Hong Kong Branch made good use of opportunities of business coordination with branches in Mainland China and comprehensively promoted its operation and internal management.
In the first half of 2014, the Hong Kong Branch realised operating income of HK$1,185 million, up by 84% as compared with the corresponding period of the previous year; among which, net interest income of HK$589 million, net non-interest income of HK$596 million, and profit before tax of HK$941 million, up by 250% as compared with the corresponding period of the previous year, the profit per capita exceeded HK$6.86 million.
New York Branch
Established in 2008, the New York Branch of the Company was positioned as a bank committed to facilitating economic and trade cooperation between China and the U.S.. It provided various services including corporate deposits, corporate loans, project financing, trade financing, merger and acquisition financing and cash management for Chinese companies and US enterprises. In addition, our New York Branch also acted as a showcase and platform in improving our internationalisation and global service capabilities. It was committed to providing a featured cross-border financial platform characterised by mutual coordination.
In the first half of 2014, the New York Branch achieved remarkable progress in broadening channels of funding sources and asset sales, exploring a new development mode of asset operation, strengthening management of internal control and improving internal management. In the first half of 2014, the New York Branch recorded a net operating income of US$53.02 million, up by 137.65% as compared with the corresponding period of the previous year.
Singapore Branch
The Singapore Branch of the Company commenced operation on 22 November 2013. It was positioned as a significant cross-border financial platform in Southeast Asia to provide quality one-stop cross-border finance solutions to Chinese companies “going global” and Singaporean companies “brought in”. In addition to general loans and deposit services, the Singapore Branch also offered featured products including Cross-Border Trade Express, global credit line and cross-border Settlement and Sales of foreign exchange.
In the first half of 2014, the Singapore Branch grasped the opportunity brought about by the robust development of economic and trade relationship between China and Singapore so as to vigorously expand the cross-border finance. It completed its first foreign delisting financing deal, pioneered in Chinese banks to provide cross-border RMB loans between China and Singapore, actively expanded trading-based business and explored the development mode of “asset-light banking”. All business lines have achieved rapid growth.
China Merchants Bank Interim Report 2014
67
III Report of the Board of Directors
3.11.7 Wing Lung GroupWing Lung Bank was founded in 1933, with a capital of HK$1.161 billion as at 30 June 2014, and is a wholly-owned subsidiary of the Company in Hong Kong.
For the period ended 30 June 2014, profits attributable to the shareholders of Wing Lung Group was HK$1.562 billion, representing an increase of 20.99% as compared with the corresponding period of the previous year, which was driven by net interest income. Non-interest income also increased significantly. Wing Lung Group recorded a net interest income of HK$1.914 billion, representing a year-on-year increase of 40.72%, which was mainly attributable to the increase in average loan volume and the widening of the net interest margin for the first half of 2014 by 23 basis points to 1.75% as compared with that for the corresponding period of the previous year. Net non-interest income was HK$781 million, representing a year-on-year increase of 20.10%. Operating expenses amounted to HK$858 million, representing a year-on-year increase of 12.92%.The cost-to-income ratio in the first half of 2014 was 31.81%, representing a decrease of 5.96 percentage points as compared with that in the corresponding period of the previous year. The impairment losses on loans and advances and accrued interest increased by 96.03% to HK$62.86 million. Write-back of impairment loss on available-for-sale securities amounted to HK$4.25 million. The non-performing loan ratio (including trade bills) was 0.10%.
As at 30 June 2014, the total assets of Wing Lung Group amounted to HK$246.258 billion, representing an increase of 13.39% as compared with that at the end of 2013. Total equity attributable to shareholders amounted to HK$21.418 billion, representing an increase of 8.30% as compared with that at the end of 2013. Total loans and advances to customers (including trade bills) amounted to HK$144.107 billion, representing an increase of 9.14% as compared with that at the end of 2013. Deposits from customers amounted to HK$184.103 billion, representing an increase of 18.67% as compared with that at the end of 2013. Loan-to-deposit ratio was 61.90%, down by 4.29 percentage points as compared with that at the end of 2013. As at 30 June 2014, the total capital ratio of Wing Lung Group was 14.60%, and its common equity Tier 1 capital ratio and Tier 1 capital ratio were both 10.30%, and the average liquidity ratio for the reporting period was 42.30%, all above statutory requirements.
For detailed information on Wing Lung Group, please refer to the 2014 interim results of Wing Lung Bank, which is published at the website of Wing Lung Bank (www.winglungbank.com).
3.11.8 CMB Financial LeasingCMB Financial Leasing is one of the first five pilot bank-affiliated financial leasing firms approved by the State Council. Registered in Shanghai, it is wholly owned by the Company and commenced operation on 23 April 2008. CMBFL is guided by national industrial policies, and is mainly engaged in the provision of financial leasing services in respect of large and medium-sized equipments to domestic large enterprises and SMEs and overseas customers in electricity, manufacturing, transportation, construction and mining sectors. It satisfies different needs in respect of procurement of equipment, promotion of sales, revitalisation of assets, balance of tax liabilities and improvement of financial structure. CMBFL also provides new financial leasing services such as capital and commodity finance (融資融物), asset management and financial advisory.
As at 30 June 2014, CMBFL had a registered capital of RMB6.0 billion and 146 employees; total assets of RMB100.471 billion, up by 29.86% as compared with the end of the previous year; net assets of RMB9.639 billion, up by 39.21% as compared with the end of the previous year. In the first half of 2014, it made a net profit of RMB714 million, up by 5.78% as compared with the corresponding period of the previous year.
China Merchants BankInterim Report 2014
68
III Report of the Board of Directors
3.11.9 CMB International CapitalCMB International Capital, which was established in 1993, is a wholly-owned subsidiary of the Company in Hong Kong. Currently, the business scope of CMBIC and its subsidiaries mainly covers investment banking, securities brokerage, assets management and share investments.
As at 30 June 2014, CMBIC had a registered capital of HK$1.0 billion, 89 employees, total assets of HK$2.250 billion, representing an increase of 110.08% as compared with the end of the previous year and net assets of HK$1.682 billion, representing an increase of 142.01% as compared with the end of the previous year. In the first half of 2014, it achieved an operating income of HK$327 million, representing an increase of 20.66% as compared with the corresponding period of the previous year, and net profit of HK$210 million, representing an increase of 22.09% as compared with the corresponding period of the previous year.
3.11.10 China Merchants FundChina Merchants Fund was the first sino-foreign joint venture fund manager approved by CSRC. CMFM was established on 27 December 2002 with a registered capital of RMB210 million. As at the end of the reporting period, the Company had 55% equity interests in CMFM. The businesses of CMFM include fund establishment, fund management and other operations approved by CSRC.
As at 30 June 2014, CMFM reported total assets of RMB1.207 billion, up by 11.76% as compared with the end of the previous year, net assets of RMB839 million, up by 9.96% as compared with the end of the previous year and a workforce of 241 employees (excluding subsidiaries). CMFM managed 38 mutual funds, 5 social security portfolios, 11 annuity portfolios, 55 specific asset management plan portfolios and 1 QFII portfolio, with total assets under management of RMB107.259 billion, up by 21.19% as compared with the end of the previous year. In the first half of 2014, CMFM realised an operating income of RMB459 million, representing an increase of 45.71% as compared with the corresponding period of the previous year, and a net profit of RMB128 million, representing an increase of 60.00% as compared with the corresponding period of the previous year.
3.11.11 CIGNA & CMB Life InsuranceCIGNA & CMB Life Insurance was established in Shenzhen in August 2003, and is the first sino-foreign joint venture life insurance company after China’s entry into WTO. As at the end of the reporting period, the Company had 50% equity interests in CIGNA & CMB Life Insurance, a joint venture of the Company. CIGNA & CMB Life Insurance is mainly engaged in insurance businesses such as life insurance, health insurance and accident injury insurance, as well as the reinsurance of the above insurances.
As at 30 June 2014, CIGNA & CMB Life Insurance had a registered capital of RMB500 million, total assets of RMB11.404 billion, representing an increase of 6.80% as compared with the end of the previous year, and net assets of RMB1.344 billion, representing an increase of 14.48% as compared with the end of the previous year. In the first half of 2014, it realised insurance income of RMB2.179 billion, representing a year-on-year increase of 47.80%, and a net profit of RMB142 million, representing a year-on-year increase of 5.76%.
3.12 Risk Management
3.12.1 Credit risk managementCredit risk refers to risks arising from failure to fulfill the obligations by the borrowers or the counterparties under the negotiated terms and conditions. Credit risks borne by the Company were mainly from credit business, investment business, financing business and other businesses on and off balance sheet. The Company endeavors to formulate a credit risk management framework with independent functions, balanced and checked risks and three dedicated defence lines and implements bank-wide policies and processes regarding credit risk identification, measurement, monitoring and management to maintain a balance among risk, capital and profit of the Company.
China Merchants Bank Interim Report 2014
69
III Report of the Board of Directors
The Risk and Compliance Management Committee of the Head Office is the highest authority of the Company in credit risk management. Under the framework of the risk management preference, strategies, policies and authorisations that has been approved by the Board, the Committee is responsible for reviewing and deciding the most significant bank-wide risk management policies. Based on different credit risk conditions, the Company reviews the grant of its loans at different authorisation levels. The decision-making entities include: Risk and Compliance Management Committee of the Head Office, the Loan Approval Committee of the Head Office, the Professional Loan Approval Committee of the Head Office, the Risk Control Committee of Branches and the Professional Loan Approval Committee of Branches. From business origination, due diligence, review and approval of credit, loan disbursement and post-loan management, the Company ensured that the risk management procedures were effectively implemented by introducing advanced risk quantifiable modelling tools and a risk management system. In accordance with regulatory requirements, based on factors like borrowers’ ability and willingness to repay, guarantor’s position, conditions of pledges and overdue period, and with the employment of the 5-category classification, the Company divided credit assets into different categories under an internal 10-category classification system. The classification of a credit may be initiated by a relationship manager or risk control officer and then reviewed by credit risk management departments of the Head Office and branches according to their respective authorisations.
In the first half of 2014, the Company consistently followed national industrial policies and regulatory policies, improved the efficiency to serve the real economy and strengthened the management of both non-performing loans and non-performing loan ratio in a comprehensive manner, thereby effectively preventing relevant risks. Firstly, the Company strengthened risk control with the asset quality-centric philosophy. The Company increased its efforts in the prevention and control of key operational risks and promoted the voluntary exit from the risks associated with overcapacity, customers with high risks, customers with small enterprise risks and private guarantee companies. Secondly, the Company optimised its credit structure while focusing on the revitalisation of supply of funds. The Company refined its credit acceptance standards to clarify control, maintenance and development directions for risk management, and made dynamic adjustments to its credit policies by monitoring 12 key industries such as coal, steel, cement, photovoltaic and real estate. Thirdly, the Company supported the development of an asset-light banking business by means of innovation and process optimisation. Specifically, the Company vigorously expanded supply chain financing, actively carried out M&A financial service innovation and strengthened risk management of and control over emerging financing businesses; optimised the intensive and sound development model of small and micro enterprise businesses; refined credit-approving investigation process and formulated guidelines for industry investigation; and promoted centralised operation of loan extension to improve process effectiveness. Fourthly, the Company strengthened risk management based on institutional improvement, system construction and team building. Specifically, the Company improved its credit risk management system by formulating or improving institutional documents regarding the requirements for personnel qualifications in credit business, credit risk monitoring of customers granted with substantial amount of loans, management of restructured loans and non-performing accountability; continued to strengthen the building of teams of client managers, risk managers and loan-approving officers; improved risk management tools and developed access to a centralised overview of customer risks so as to establish credit risk management system at all levels. Fifthly, focusing on the handling and accountability of non-performing loans, the Company speeded up the handling of non-performing assets in various channels, improved accountability management, tightened credit discipline and strengthened risk culture building. During the reporting period, the Company recorded an increase in non-performing loans as adversely affected by economic downturns at home and abroad. However, thanks to the comprehensive countermeasures including the accelerated clearance, recovery, writing off and transfer of non-performing loans, the asset quality of the Company remained stable.
China Merchants BankInterim Report 2014
70
III Report of the Board of Directors
3.12.2 Country risk managementCountry risk represents risk of business loss or other losses suffered by banks due to the incapability or unwillingness of changes and incidents occurred in the economy, politics and society in a specific country or region, which result in the borrowers or debtors in that country or region to pay off their debts owed to the banks, or the banks in that country or region suffering from commercial or other losses. Country risks may be triggered by conditions such as deterioration in the economy, chaos in the politics and society of a country or region, assets being nationalised or confiscated, governments refusing to pay their foreign debts, foreign exchange control or currency depreciation, etc.
The Company includes country risk management into its overall risk management system, dynamically monitors the change in its country risk in accordance with relevant regulatory requirements, sets limit on its country risk based on the rating results from international rating agencies, and evaluates its country risk and makes provisions on a quarterly basis. As at the end of June 2014, the assets of the Company exposed to the country risks remained limited, which indicated low country risk ratings. Moreover, we have made adequate provision for country risks according to the regulatory requirements. As a result, country risk will not have any material effect on our operations.
3.12.3 Market risk managementMarket risk is the risk of possible loss caused by fluctuations of the fair value or future cash flows of the Company’s financial instruments because of changes in observable market factors such as exchange rates, interest rates, commodity prices and equity prices. The Group is exposed to market risk primarily from two aspects, namely trading accounts and bank accounts, among which, trading accounts include positions in financial instruments held for proprietary trading purposes or hedging risks of trading accounts; bank accounts refer to the asset and liability business and related financial instruments recorded in the bank’s balance sheet and off-balance sheet, with relatively stable market value, and maintained by the bank for obtaining stable income or hedging risks and for which the bank is willing to held. The Company considers that the market risk currently exposed by it is not material.
The Company controlled the market risk by setting authorizations and limits on market risk for its business departments. In order to curb the market risk of trading accounts, the Company uses the limit indicators such as risk exposure indicator, market risk value indicator, loss indicator for stress test, sensibility indicator and accumulated loss indicator. In order to curb the market risk of its bank accounts, discrepancy analysis and scenario analysis are used by the Company to quantify the difference between assets and liabilities in a given future time frame, so as to predict its future cash flows and monitor its market risk. The Company also conducts regular stress tests as a supplement to the above measurement indicators.
In 2014, the Company continued to optimize its market risk policies and management process, and improved and innovated its market risk measurement and monitoring tools based on its existing measures. In the first half of 2014, the Company was permitted to apply the risk exposure internal model method to make provision for market risk capital as a legal person, thus becoming China’s first joint-stock bank permitted to implement the market risk exposure internal model method.
China Merchants Bank Interim Report 2014
71
III Report of the Board of Directors
In the first half of 2014, the central bank continued to implement prudent monetary policies and flexibly applied various monetary policy tools to maintain the overall moderate liquidity in the interbank market. Driven by relatively abundant capital and business institutions’ demand for assets allocation, in the first half of the year, the yield of various bonds with different maturities recorded a substantial decline as compared with that at the end of 2013 which, in general, demonstrated a steep downward trend. As a result, the valuation of the Company’s local-currency bond portfolio rebounded significantly. Meanwhile, in the first half of 2014, the Company had formulated appropriate investment strategies based on in-depth research and timely tracking of domestic and overseas macro-economic situations, monetary policies and market liquidity conditions, as well as the trends of various kinds of bonds. Currently, the Company’s investment portfolio mainly includes bonds issued by the Chinese government, the PBOC and China’s policy banks, as well as by Chinese commercial banks, insurance companies and large-scale non-financial institutions with high credit ratings. All market risk indicators in relation to these investments remained satisfactory.
In the first half of 2014, facing slowly recovering global economy and high level of geopolitical risk, the Company continued to closely monitor the risks associated with overseas markets and their potential spillover impact. The Company focused mainly on bonds issued by Chinese enterprises, Chinese financial institutions and foreign financial institutions with good credit standings. Currently, the foreign currency bond investments of the Company are of superior quality with controllable risk exposure.
3.12.4 Operational risk managementOperational risk refers to the risk of loss arising from inappropriate or problematic internal procedures, personnel, IT systems, or external events.
During the reporting period, the Company further enhanced the capability of operational risk management and its effectiveness, with major risk indicators meeting the Company’s risk preference requirements. The specific measures include further improving the framework and methodology of operational risk management, perfecting operational risk appraisal and assessment mechanisms, strengthening the prevention and control of key operational risks, further implementing risk monitoring and alerting, improving risk management mechanism and enhancing outsourced management and financial consolidation management.
3.12.5 Liquidity risk managementLiquidity risk is the risk that the Company cannot satisfy its customers by repaying deposits that fall due, granting new loans or providing financing, or that the Company cannot satisfy these requirements at a normal cost.
Under the principle of keeping the formulation, implementation and monitoring functions of liquidity risk management policy separated, the Company established its liquidity risk management governance structure, and specified the roles, duties and reporting process of the Board of Directors, the Board of Supervisors (supervisors), the senior management, specialised committees and related departments in liquidity risk management, so as to enhance the effectiveness of liquidity risk management. The Company’s cautious attitude towards liquidity risk is more appropriate for the current development stage of the Company. The current liquidity risk management policies and systems of the Company are basically in line with regulatory requirements and its own management requirements.
The Company’s liquidity risk management is coordinated by the Head Office with the branches acting in concert. The Asset and Liability Management Department of the Head Office as a treasurer of the Company is in charge of routine liquidity risk management. The treasurer is responsible for managing liquidity on a prudent basis to meet relevant regulatory requirements, and conducting centralised liquidity management through quota management, budget and control as well as internal funds transfer pricing, etc.
China Merchants BankInterim Report 2014
72
III Report of the Board of Directors
The Company measures, monitors and identifies liquidity risk for short-term reserves and duration structure and emergency purpose. It monitors the limit indicators closely at fixed intervals. Stress tests are regularly used to judge whether the Company is able to meet liquidity requirements under extreme circumstances. The Company has put in place liquidity contingency plans and organised liquidity contingency drillings to guard against any liquidity crisis.
In the first half of 2014, with monetary policy gradually easing to a moderate-to-loose level, the central bank increased its efforts in presetting and finetuning relevant policy mainly through operations in the open market, while releasing liquidity by implementing micro-stimulation and directed loose policy. The liquidity of the Company was basically in line with that of the market, and the overall liquidity was eased due to the continuous growth in customer deposits and the steady increase of assets. As of the end of June 2014, the Company’s liquidity coverage was 84.40%1, 24.40 percentage points higher than the minimum requirement of CBRC; local-currency 3-month liquidity gap ratio and foreign-currency 3-month liquidity gap ratio were -15.20%2 and 20.79% respectively, both within the limits on liquidity risk exposure, and the maturity mix of local currency and foreign currencies remained relatively reasonable; the stress tests3 conducted for local currency and foreign currencies at light, medium and heavy levels all reached their respective minimum sustainable requirements of no less than 7D, 14D and 30D, leading to a better contingency buffer capacity for both local currency and foreign currencies.
In the context of eased liquidity, the Company implemented the following measures to improve capital efficiency and optimise liquidity structure. Firstly, the Company directed its business development by flexibly using FTP and achieved a balance between funding sources and use of funds so as to continuously improve maturity mismatch of assets and liabilities. Secondly, the Company optimised asset allocation structure while moderately accelerating the increase of assets. The increased assets were primarily weighted assets with low risks. Thirdly, the Company strengthened management of active liability taking and aggressively expanded new varieties of debts including inter-bank deposit certificates, with a view to improving debt maturity structure. Fourthly, the Company steadily promoted the securitisation of assets and issued corporate loan and credit card asset securitised products of RMB15.389 billion in the first half of the year.
In the first half of 2014, the People’s Bank of China made directional adjustments to the RMB deposit reserve ratio, such that certain banks including the Company met the standards to reduce their deposit reserve ratios. As at the end of June 2014, 17.5% (2013: 18%) of the total RMB deposits and 5% (2013: 5%) of the foreign currency deposits of the Company were required to be placed with the People’s Bank of China.
3.12.6 The management of interest rate riskInterest rate risk refers to the risk of unfavorable fluctuation of interest rates, maturity structure and other factors which may result in losses in gross profit and economic value of banking accounts. The interest rate risk faced by the Company includes the benchmark risk, re-pricing risk, yield curve risk and option risk. In particular, benchmark risk and re-pricing risk are the primary risks faced by the Company.
The Company has established the interest rate risk management governance structure in accordance with its interest rate risk management policies, and clearly defined the roles, duties and reporting process of the Board of Directors, senior management, specialised committees and relevant departments in interest rate risk management, thus ensuring the effectiveness of interest rate risk management.
1 Liquidity coverage is calculated at the level of external regulatory requirements – legal person basis2 Liquidity gap ratio is calculated at the level of internal management – domestic basis3 Stress tests are conducted at the level of internal management – domestic basis
China Merchants Bank Interim Report 2014
73
III Report of the Board of Directors
The Company mainly adopts the scenario simulation analysis, re-pricing gap analysis, duration analysis, stress test among other methods to measure and analyse interest rate risk. The Company monitors and reports interest rate risk on a monthly basis under its quota limit framework. The Company analyzes the causes of interest rate risk, puts forward management proposals and implements risk control measures through the system of routine assets and liabilities analysis meetings.
In the first half of 2014, the Company continued to manage its interest rate risk in a proactive and forward looking manner and reduced fluctuation in net interest income of the whole Bank through on-balance sheet structural adjustment and off-balance sheet interest rate derivative hedges, thus keeping its interest rate risk stable and controllable. While implementing interest rate risk management measures in a proactive manner, the Company also optimized various measurement models, so as to improve the accuracy of interest rate risk measurement and the scientificalness and predictability of risk management of the Company.
3.12.7 Exchange rate risk managementExchange rate risk refers to the impairment risk of bank’s gross profit caused by losses in positions of foreign exchange and foreign exchange derivatives due to the unfavorable fluctuation in exchange rate. The Company’s functional currency is RMB. The majority of assets and liabilities of the Company are denominated in RMB and the rest mainly in USD and HKD.
Under the principle of keeping the formulation, implementation and monitoring functions of exchange rate risk management policy separated, the Company established its exchange rate risk management governance structure, specifying the roles, duties and reporting process of the Board of Directors, the Board of Supervisors (supervisors), the senior management, special committees and related departments in exchange rate risk management to enhance the effectiveness of exchange rate risk management. The Company’s cautious attitude towards exchange rate risk, meaning in principle the Company does not bear risks voluntarily, is more appropriate for the current development stage of the Company. The current exchange rate risk management policies and systems of the Company are basically in line with relevant regulatory requirements and its own management requirements.
The Company’s exchange rate risk management is coordinated by the Head Office. The Assets and Liabilities Management Department of the Head Office as a treasurer of the Company is in charge of routine exchange rate risk management. The treasurer is responsible for managing exchange rate risk on a prudent basis to meet relevant regulatory requirements, and conducting centralised exchange rate management through quota management, budget and control, etc.
The primary exchange rate risk of the Company comes from the mismatch of non-RMB denominated assets and liabilities. Through rigorous management of exchange rate risk, the Company keeps the exposure within the acceptable range.
The Company mainly uses foreign exchange exposure analysis, scenario simulation analysis, stress test, Value at Risk (“VaR”) and other methods to measure and analyse exchange rate risk. The Company regularly measures and analyses changes in its foreign exchange exposure and monitors and reports exchange rate risk on a monthly basis under its quota limit framework. Based on the trend of foreign exchange movements, the Company adjusts its foreign exchange exposure accordingly to mitigate the relevant foreign exchange risk.
In the first half of 2014, the Company further optimized its foreign exchange risk assessment system which provides scientific reference standards for accurately assessing its foreign exchange risk and appropriately making management strategies. The Company also implemented the exchange rate risk management measures in a proactive manner, took opportunities to reduce the volume of structural exposure, and implemented new exchange rate risk management system and quota authorization management system.
China Merchants BankInterim Report 2014
74
III Report of the Board of Directors
In the first half of 2014, the RMB-USD exchange rate ended the unilateral RMB appreciation trend and entered into a two-way volatility stage. The Company’s exposure to foreign exchange risk was therefore mitigated. The Company has taken various measures to control its exchange rate risk within the endurable range.
3.12.8 Reputational risk managementReputation risk refers to the risk that the Company might be negatively evaluated by relevant interested parties due to the Company’s operations, management and other activities or external events.
Reputation risk management is an important part of the corporate governance and the overall risk management system of the Company, covering all activities, operations and businesses undertaken by the Company and its subsidiaries. The Company established and formulated the reputation risk management system and relevant requirements and took initiatives to effectively prevent the reputation risk and respond to any reputation events, so as to reduce loss and negative impact to the greatest extent.
In the first half of 2014, while improving management and services, the Company updated its management philosophy, established a systematic reputation risk management system, strengthened its reputation risk assessment and front-line management, further optimised its procedures to handle delicate media reports, enhanced the prevention and early warning mechanisms of reputation risk, and actively responded to crisis events, thereby effectively avoiding reputation loss.
3.12.9 Compliance risk managementCompliance risk refers to the risks of commercial banks being subject to legal sanctions, regulatory punishments, major financial losses, or reputation damage as a result of violation of the laws, rules and guidelines. The Board of Directors of the Company is ultimately responsible for the compliance of the operating activities, and authorises the Risk and Capital Management Committee under the Board to supervise the compliance risk management. The Compliance Management Committee of the Head Office is the supreme organisation to manage compliance risk of the whole Company under the senior management. The Company has established a complete and effective compliance risk management system, completed an organisational management structure which comprises a Compliance Management Committee, compliance head, compliance officers, legal and compliance departments at the Head Office and branches, and compliance supervisors at the branch and sub-branch management levels, improved the three defense lines for compliance risk management and the double-line reporting mechanism, and continued to improve the compliance risk management mechanism and the risk management techniques and procedures, so as to ensure effective management of compliance risk.
During the reporting period, the Company proactively adapted to adjustments in regulatory policy, effectively prevented and mitigated systemic risks, importance risks and domestic and overseas compliance risks, thereby effectively ensuring the legal and compliant operations of the whole Company. Without compromising the compliance bottom line, the Company carried out legal compliance verification covering all businesses, products, systems and procedures, and carefully identified and assessed the compliance risk associated with new businesses and key projects. In addition, the Company actively encouraged business innovation to the extent that legal compliance framework permits. The Company also aggressively launched compliance risk programs, thus enhancing its compliance management personnel’s capability in risk management and raising its staff’s awareness of compliance during the deepening of management reform, promotion of business innovation and steady development. Furthermore, the Company proactively built integrated internal control compliance management mechanisms by coordinating supervision and inspection work and promoting the integration and optimisation process, so as to improve the efficiency of legal compliance risk management.
China Merchants Bank Interim Report 2014
75
III Report of the Board of Directors
3.12.10 Anti-money laundering managementThe Company takes anti-money laundering as its social responsibility and legal obligation. It attaches great importance to anti-money laundering through establishing a professional anti-money laundering team, launching a sound anti-money laundering system and procedures, possessing database of name list and filtering system for anti-money laundering, as well as a monitoring and reporting system for large-sum transactions and suspicious transactions.
In the first half of 2014, the Company further strengthened the building of anti-money laundering system and finetuned the anti-money laundering workflow with a view to improving its anti-money laundering work. Firstly, the Company further improved the anti-money laundering monitoring and analysis system, optimised the due diligence process on customers and perfected the anti-money laundering reporting system. Secondly, the Company organised its efforts to develop a money laundering risk rating system. Thirdly, the Head Office handled the monitoring and analysis work in a centralised manner of certain suspicious transactions reported from the Company, thereby enhancing the Company’s professionalism and intensification level in respect of the monitoring and analysis of suspicious transactions.
3.12.11 Implementation of Basel AccordsIn April 2014, the Company received “CBRC’s Approval on Use of Advanced Approaches for Capital Measurement under Basel Accords by CMB” (《中國銀監會關於招商銀行使用資本計量高級方法的批覆》), and officially became one of the banks approved by CBRC to implement advanced approaches for capital measurement under Basel Accords. Specifically, to measure capital requirements, the Company adopts the foundation IRB approach to corporate risk exposure and financial institution risk exposure which are in compliance with regulatory requirements, the IRB approach to retail exposures, the internal model approach to market risks and the standard method to operational risks, respectively.
3.13 Profit Appropriation
2013 Profit Appropriation Plan2013 Profit Appropriation Plan of the Company was considered and passed at the 2013 Annual General Meeting held on 30 June 2014.
The Company’s profit after tax as stated in the audited financial statement (domestic section) of 2013 amounted to RMB48.842 billion, and was appropriated, in accordance with the availability and the relevant regulatory requirements, as follows: 1) RMB4.884 billion was appropriated to the statutory surplus reserve. 2) 1.5% of the total amount of the increased risk assets, totalling RMB6.913 billion, was appropriated to the general reserve. 3) Based on the total share capital of A Shares and H Shares on the record date for profit appropriation, the Company declared a cash dividend of RMB6.20 (tax included) for every 10 shares, payable in RMB for all A shareholders and in HKD for all H shareholders. The actual distribution amount in HKD will be calculated based on the average RMB/HKD benchmark rates to be released by the People’s Bank of China for the week before the date of the general meeting (inclusive of the day of the general meeting). The retained profit will be carried forward to the next year. In 2013, the Company did not transfer any capital reserve into share capital.
The Board of Directors of the Company has already implemented the above-mentioned dividend appropriation plan. For further information, please refer to the announcement published by the Company on the websites of Shanghai Stock Exchange, Hong Kong Stock Exchange and the Company on 2 July 2014.
China Merchants BankInterim Report 2014
76
III Report of the Board of Directors
The formulation and implementation of the Company’s cash dividend policies1. As specified in the Articles of Association (revised in 2013), the profit distribution policies of the Company
are:
(1) profit distribution of the Company shall focus on reasonable returns on investment of the investors, and such policies shall maintain continuity and stability;
(2) the Company may distribute dividends in cash, shares or a combination of cash and shares, and it shall distribute dividends mainly in cash. Subject to compliance with prevailing laws, regulations and the requirements of relevant regulatory authority on the capital adequacy ratio, as well as the requirements of general working capital, business development and the need for substantial investment, merger and acquisition plans of the Company, the cash dividends to be distributed by the bank each year in principle shall not be less than 30% of the net profit after taxation audited in accordance with PRC accounting standards for that year. The Company may pay interim cash dividend. Unless another resolution is passed at the shareholders’ general meeting, the Board of Directors shall be authorised at the shareholders’ general meeting to approve the interim dividend distribution policy;
(3) if the Company generated profits in the previous accounting year but the Board of Directors did not make any cash profit distribution proposal after the end of the previous accounting year, the Company shall state the reasons for not distributing the profit and the usage of the profit retained in the periodic report and the independent directors shall give an independent opinion in such regard;
(4) if the Board of Directors opines that the price of the shares of the Company does not match the size of share capital of the Company or where the Board of Directors considers necessary, the Board of Directors may propose a dividend distribution plan and implement the same upon consideration and approval at a general meeting on the premise that the abovementioned cash dividend distribution methods are satisfied;
(5) the Company shall pay cash dividends and other amounts to holders of domestic shares and such sums shall be calculated, declared and paid in Renminbi. The Company shall pay cash dividends and other amounts to holders of H Shares and such sums shall be calculated and declared in Renminbi and paid in Hong Kong dollars. The foreign currencies needed by the Company for payment of cash dividends and other sums to shareholders of overseas listed foreign shares shall be handled according to the relevant provisions on foreign exchange administration of the State;
(6) where appropriation of the Company’s fund by a shareholder, which is in violation of relevant rules, has been identified, the Company shall make deduction against the cash dividend to be paid to such shareholder, and such amount shall be used as the reimbursement of the funds appropriated;
(7) the Company shall disclose the implementation progress of the cash dividend policy and other relevant matters in its periodic reports in accordance with the applicable requirements.
2. The Company implemented the 2013 Equity Distribution Plan in strict compliance with the relevant provisions of the Articles of Association, which was passed at the 14th meeting of the Ninth Session of the Board of Directors of the Company and approved at the 2013 Annual General Meeting. The criteria and proportion of cash dividend were clear and specific. The independent directors of the Company have expressed their independent opinions on those profit appropriation plans for 2013 that the equity distribution plans of the Company and their implementation process have adequately protected the legal rights and interests of minority shareholders.
China Merchants Bank Interim Report 2014
77
III Report of the Board of Directors
3.14 Interim Dividend Appropriation for the Year 2014The Company would not distribute interim dividend for the year 2014, nor would it capitalise the capital reserve (for January-June 2013: Nil).
3.15 Social ResponsibilityIn 2014, following the philosophy of “committing to sustainable finance, enhancing sustainable value and contributing to sustainable development”, the Company implemented the “Second Transformation” strategy with customer-centric philosophy and fulfilled social responsibility with improved service. During the reporting period, the Company continued to support the development of Wuding County and Yongren County by encouraging its employees to making donations of RMB10.24 million and 51,000 articles of clothes for poverty relief. On World Autism Day, the Company and One Foundation jointly launched the “No Speaking Today” event to show love for special children with autism, which was strongly supported by its customers as well as Internet users. In addition, the Head Office launched a bank-wide volunteer campaign, in which its branches and sub-branches carried out a variety of public events including environment protection, children caring and education aid.
3.16 Outlook and MeasuresAt present, China’s economic and financial conditions remain challenging. The acceleration of interest rate liberalisation and financial disintermediation, intensifying competition from online banking across industries and tighter regulatory constraints pose great threats to the growth of commercial banks. Meanwhile, along with the economic structural adjustments and deepened economic reform, the economic environment will continue to improve, and resulting business opportunities will gradually arise, especially emerging new businesses in the market, the reshuffle of main market structure, the rapidly changing form of resident investment and consumer behavior as well as the gradual emergence of benefits of financial reform, which will bring about vast potential for the optimisation of credit structure and the innovation of retail banking, corporate banking and interbank finance businesses of the Company.
Amidst new challenges and opportunities, in the second half of the year, the Company will commit to the following five priorities while focusing on the two core objectives of “service upgrade” and “asset-light banking”: Firstly, the strategic position of retail finance will be further highlighted with the support of the corporate finance and interbank finance, thus forming a development pattern of “one body with two wings”; at the same time, the Company will increase its efforts to finetune the internal structure of all business segments, so as to build its retail finance business into the best banking service, grow its corporate finance business into professional banking service and develop its interbank finance business into elite banking service. Secondly, the Company will further specify and implement the strategic plan regarding service upgrade, and continue to improve customer experience while paying special attention to the importance of customer management. Thirdly, the Company will effectively strengthen credit risk management in different ways including concept promotion, system building, method selection and system implementation, so as to constantly improve the capability and level of risk management. Fourthly, the Company will deepen the reform of human resources, streamline administrative procedures and decentralise powers, establish an internal talent market, improve performance management, optimise professional sequence management, promote the appraisal of post value, with an aim to release the productivity of human resources. Fifthly, the Company will further proceed with process re-engineering. Specifically, based on the organisational structure reform at the Head Office, the Company will put efforts on the streamlining and design of follow-up mechanism and process based on the “customer-centric” principle, and promote organisational structure reform and process re-engineering across the Company in due course.
By Order of the Board of DirectorsLi JianhongChairman29 August 2014
China Merchants BankInterim Report 2014
78
IV Important Events
4.1 Purchase, Sale or Repurchase of Listed Securities of the CompanyNeither the Company, nor any of its subsidiaries had purchased, sold or repurchased any of the Company’s listed securities during the reporting period.
4.2 Use of Raised Funds and Major Investment Not Financed by the Raised Funds
Use of RMB11.3 billion raised from Tier 2 capital bondsDuring the reporting period, the Company issued Tier 2 capital bonds in an amount of RMB11.3 billion within the domestic interbank bond markets. They are all fixed rate bonds for a term of 10 years. The coupon rate is 6.40% and the issuer has an option to redeem the bonds by the end of the fifth year. The proceeds raised from issuance of the bonds were fully used to replenish the Tier 2 capital of the Company.
Major investment not financed by the raised fundsIn 2013, the Company entered into a purchase agreement with Financial Street Holdings Co., Ltd., to purchase an office complex to be constructed at an agreed provisional consideration of RMB3.902 billion. As of 30 June 2014, the Company has paid 80% of the provisional consideration, totaling RMB3.1216 billion. Currently, the office complex is still under construction. For further details of the purchase agreement, please refer to the announcement regarding the discloseable transaction of the Company published on the websites of Shanghai Stock Exchange, Hong Kong Stock Exchange, and the Company on 26 June 2013.
4.3 Interests and Short Positions of the Directors, Supervisors and Senior ManagementAs at 30 June 2014, the interests and short positions of the Directors, Supervisors, and Senior Management of the Company in the shares, underlying shares, and debentures of the Company and its associated corporations (as defined in the SFO, which have been notified to the Company and the Hong Kong Stock Exchange pursuant to Divisions 7 and 8 of Part XV of the SFO, including interests and short positions which the Directors, Supervisors and Senior Management of the Company are taken or deemed to have under such provisions of the SFO, or which are required to be and are recorded in the register required to be kept pursuant to Section 352 of the SFO or as otherwise required to be notified to the Company and the Hong Kong Stock Exchange pursuant to the Model Code set out in Appendix 10 to the Hong Kong Listing Rules, were as follows:
Name PositionClass of shares
Long/short position Capacity
No. of shares
Percentage ofthe relevant
class of sharesin issue (%)
Percentage ofall the issued
shares (%)
Peng Zhijian Supervisor A Long position Beneficial Owner 23,480 0.00011 0.00009
China Merchants Bank Interim Report 2014
79
IV Important Events
4.4 Disciplinary Actions Imposed on the Company, Directors, Supervisors and Senior Management and the Shareholders Holding More Than 5% of Our SharesSo far as the Company is aware, during the reporting period, none of the Company, its Directors, Supervisors or senior management or the shareholders holding more than 5% of our shares was subject to investigation by relevant authorities or subject to mandatory measures imposed by judicial organs or discipline inspection authorities. None of them was referred or handed over to judicial authorities or being prosecuted for criminal liability, under investigation or administrative sanction by the CSRC, nor being prohibited from engagement in the securities markets, given notice of criticism, nor determined as unqualified, nor been publicly censured by any stock exchange. Neither the Company nor the shareholders holding more than 5% of the shares of the Company has been penalised by other regulatory bodies which have significant impact on the businesses of the Company.
4.5 Undertakings Made by the Company and Shareholders Holding More Than 5% of Our SharesIn the course of the rights issue of A shares in 2013, China Merchants Group Limited, China Merchants Steam Navigation Company Ltd. and China Ocean Shipping (Group) Company had individually undertaken that, they would not seek for related-party transactions with terms more favourable than those given to other shareholders; they would repay the principal and interest thereon to the Company on time; they would not intervene the ordinary operations of the Company. Should they participate in the subscription of the rights shares, they would neither transfer or entrust others to manage the allocated shares within five years from the transfer of such shares, nor would they seek for a repurchase by the Company of the allocated shares held by them. Upon expiration of the lock-up period of the allocated shares, they would not transfer their allocated shares until they obtain approval from the regulatory authorities on the share transfer and the shareholder qualification of transferees; and upon obtaining the approval from the Board of Directors and shareholders’ general meeting, they would continue to supplement the reasonable capital demand of the Company; they would not impose improper performance indicators on the Company. In the course of the rights issue of H shares in 2013, China Merchants Group Limited had also made a number of undertakings to the Company and joint global coordinators. For details of the aforesaid undertakings, please refer to the A Share Rights Issue prospectus dated 22 August 2013 and the H Share Rights Issue prospectus dated 5 September 2013 on the website of the Company (www.cmbchina.com). As far as the Company is aware, as at the date of the report, the above shareholders did not violate the aforesaid undertakings.
China Merchants BankInterim Report 2014
80
IV Important Events
4.6 Significant Connected Transactions
4.6.1 Overview of connected transactionsAll the connected transactions of the Company have been conducted on normal commercial terms which are fair and reasonable and in the interests of the Company and its shareholders as a whole. Pursuant to Chapter 14A of the Hong Kong Listing Rules, the non-exempt continuing connected transactions of the Company during the reporting period were those conducted between the Company and China Merchants Group Ltd. and its members, subject to the requirements of non-exempt continuing connected transactions set by the Hong Kong Stock Exchange.
4.6.2 Non-exempt continuing connected transactionsPursuant to Chapter 14A of Hong Kong Listing Rules, the non-exempt continuing connected transactions of the Company during the reporting period were those conducted between the Company and CMFM and CM Securities, respectively.
On 28 December 2011, with the approval of the Board of Directors, the Company announced the continuing connected transactions between the Company and CMFM and CM Securities respectively. The Company approved the cap for each of the years of 2012, 2013 and 2014 to be RMB500 million (in case of CMFM, for which the annual cap for 2014 has been revised to RMB1.537 billion) and RMB300 million (in case of CM Securities) respectively. Further details were disclosed in the Announcement on Continuing Connected Transactions issued by the Company on 28 December 2011 and 26 August 2014, respectively.
CMFM
The fund distribution agency services between the Company and CMFM constituted continuing connected transactions of the Company under the Hong Kong Listing Rules.
The Company and CM Securities held 55% and 45% of the equity interest in CMFM respectively. Pursuant to the Hong Kong Listing Rules, CMFM is a connected subsidiary of the Company.
The Company entered into a service co-operation agreement with CMFM on 28 December 2011 for a term commencing on 1 January 2012 and expiring on 31 December 2014. The agreement was entered into on normal commercial terms. The agency service fees payable to the Company by CMFM pursuant to the service co-operation agreement will be calculated on an arm’s length basis and normal commercial terms, having regard to the fees and charges specified in the funds offering documents and/or the offering prospectus.
The annual cap of the continuing connected transactions between the Company and CMFM for 2014 was revised to RMB1.537 billion which was less than 5% of the relevant percentage ratio calculated in accordance with Rule 14.07 of the Hong Kong Listing Rules. Therefore, these transactions would only be subject to the reporting, announcement and annual review requirements under the Hong Kong Listing Rules, and exempt from the independent shareholders’ approval requirement.
As at 30 June 2014, the aggregate amount of continuing connected transactions between the Company and CMFM was RMB413.23 million.
China Merchants Bank Interim Report 2014
81
IV Important Events
CM Securities
The third-party custodian account, the wealth management agency services and collective investment products between the Company and CM Securities constituted continuing connected transactions of the Company under the Hong Kong Listing Rules.
China Merchants Steam Navigation Company Ltd., a wholly owned subsidiary of CM Group, is a substantial shareholder of the Company. CM Group currently holds approximately 18.80% of indirect equity interest in the Company (including those interest deemed to be held through connected companies). As CM Group also holds 50.86% equity interest in CM Securities, pursuant to the Hong Kong Listing Rules, CM Securities is an associate of the connected person of the Company and therefore a connected person of the Company.
The Company entered into a service co-operation agreement with CM Securities on 28 December 2011 for a term commencing on 1 January 2012 and expiring on 31 December 2014. The agreement was entered into on normal commercial terms. The service fees payable by CM Securities to the Company should be determined in accordance with the following pricing policies:
(1) where there are State prescribed prices, to follow these prices; or
(2) where there are no State prescribed prices but there are applicable State guided prices, to follow the State guided prices; or
(3) where there are no State prescribed prices or State guided prices, to follow the market fee rates for ordinary business transactions agreed between the parties on arm’s length negotiations.
The annual cap for continuing connected transactions between the Company and CM Securities for 2014 was set at RMB300 million which was less than 5% of the relevant percentage ratio calculated in accordance with Rule 14.07 of the Hong Kong Listing Rules. Therefore, these transactions would be subject only to the reporting, announcement and annual review requirements under the Hong Kong Listing Rules, and exempt from the independent shareholders’ approval requirement.
As at 30 June 2014, the aggregate amount of continuing connected transactions between the Company and CM Securities was RMB46.46 million.
The independent non-executive directors of the Company had reviewed the above-mentioned non-exempt continuing connected transactions between the Company and each of CMFM and CM Securities, respectively, and confirmed that:
(1) the transactions were conducted in the ordinary and usual course of business of the Company;
(2) the terms related to the transactions were fair and reasonable and in the interest of the Company and its shareholders as a whole;
(3) the transactions were entered into on normal commercial terms and conditions which were no more favorable than those to or from independent third parties; and
(4) the transactions were conducted in accordance with the terms of relevant agreements.
China Merchants BankInterim Report 2014
82
IV Important Events
4.7 Material Litigations and ArbitrationsSo far as the Company is aware, as at 30 June 2014, the Company was involved in the following litigation cases in the course of business: the number of pending litigation and arbitration cases in which the Company was involved totalled 4,310 with a total principal amount of approximately RMB11,290,577,600 and total interest of approximately RMB782,195,100. Of which, there were a total of 106 pending litigation and arbitration cases against the Company as at 30 June 2014, with a total principal amount of approximately RMB547,097,500 and total interest of approximately RMB27,995,800. There were 6 pending cases each with a principal amount exceeding RMB100 million, involving total principal amounts of approximately RMB939,124,900 and total interest of RMB83,022,200. None of the above litigation and arbitration cases would have a significant adverse impact on the financial position or operating results of the Company.
4.8 Material Contracts and Their Performance
Significant events in respect of holding in custody, contracting, hiring or leasing of assetsDuring the reporting period, none of the material contracts of the Company involving holding in custody, contracting or hiring or leasing of any assets of other companies by the Company or vice versa was entered into beyond the normal business scope of the Bank.
Significant guaranteesGuarantee business falls within the Company’s ordinary course of business. During the reporting period, save for the financial guarantees entered into in our normal business scope approved by the People’s Bank of China and the CBRC, there was no other significant discloseable guarantee.
Significant entrustments in respect of fund and asset managementDuring the reporting period, there was no significant entrustment in respect of fund and asset management.
4.9 Implementation of the Appreciation Rights Incentive Scheme during the Reporting PeriodFor details about the implementation of the Company’s Appreciation Rights Incentive Scheme, please refer to the section headed “H Share Appreciation Rights Incentive Scheme” in Chapter VI.
4.10 Use of Funds by Related PartiesDuring the reporting period, so far as the Company is aware, neither the major shareholders of the Company nor their related parties had used any funds of the Company for non-operating purposes, and none of them had used the funds of the Company through any related party transactions on anything other than on arm’s length basis.
China Merchants Bank Interim Report 2014
83
IV Important Events
4.11 Explanation of Changes in Accounting PoliciesFor details about the changes in accounting policies, please refer to Chapter II and note 2 to the financial report.
4.12 Review on Interim ResultsKPMG Certified Public Accountants, being the external auditor of the Company, has reviewed the interim financial report of the Company prepared in accordance with the disclosure requirements of the International Accounting Standards and the Hong Kong Listing Rules. In addition, the Audit Committee under the Board of Directors of the Company has also reviewed and approved the interim results and financial report of the Company for the period ended 30 June 2014.
4.13 Publication of Interim ReportThe Company prepared the interim report in both English and Chinese in accordance with the International Accounting Standards and the Hong Kong Listing Rules. These reports are available on the websites of Hong Kong Stock Exchange and the Company. In the event of any discrepancies in interpretation between the English and Chinese versions, the Chinese version shall prevail.
The Company also prepared the interim report in Chinese in accordance with the PRC Generally Accepted Accounting Principles and the preparation rules for interim reports, which is available on the websites of Shanghai Stock Exchange and the Company.
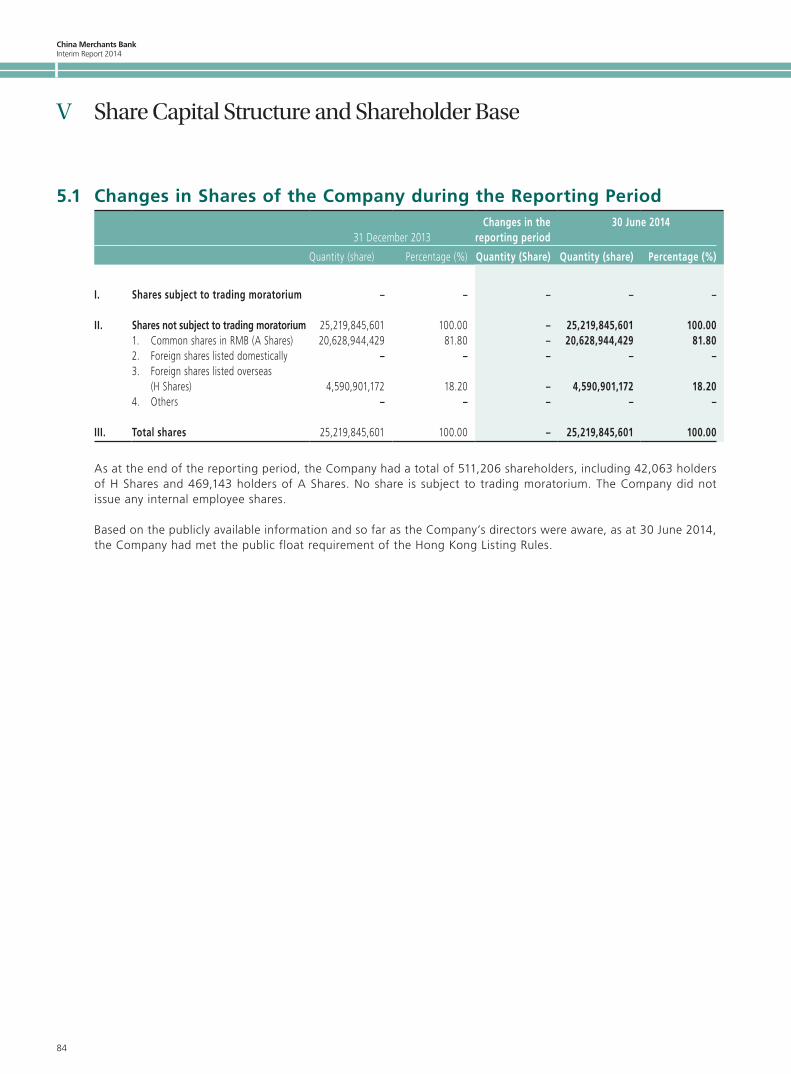
China Merchants BankInterim Report 2014
84
V Share Capital Structure and Shareholder Base
5.1 Changes in Shares of the Company during the Reporting Period
31 December 2013Changes in the
reporting period 30 June 2014
Quantity (share) Percentage (%) Quantity (Share) Quantity (share) Percentage (%)
I. Shares subject to trading moratorium – – – – –
II. Shares not subject to trading moratorium 25,219,845,601 100.00 – 25,219,845,601 100.001. Common shares in RMB (A Shares) 20,628,944,429 81.80 – 20,628,944,429 81.802. Foreign shares listed domestically – – – – –3. Foreign shares listed overseas
(H Shares) 4,590,901,172 18.20 – 4,590,901,172 18.204. Others – – – – –
III. Total shares 25,219,845,601 100.00 – 25,219,845,601 100.00
As at the end of the reporting period, the Company had a total of 511,206 shareholders, including 42,063 holders of H Shares and 469,143 holders of A Shares. No share is subject to trading moratorium. The Company did not issue any internal employee shares.
Based on the publicly available information and so far as the Company’s directors were aware, as at 30 June 2014, the Company had met the public float requirement of the Hong Kong Listing Rules.
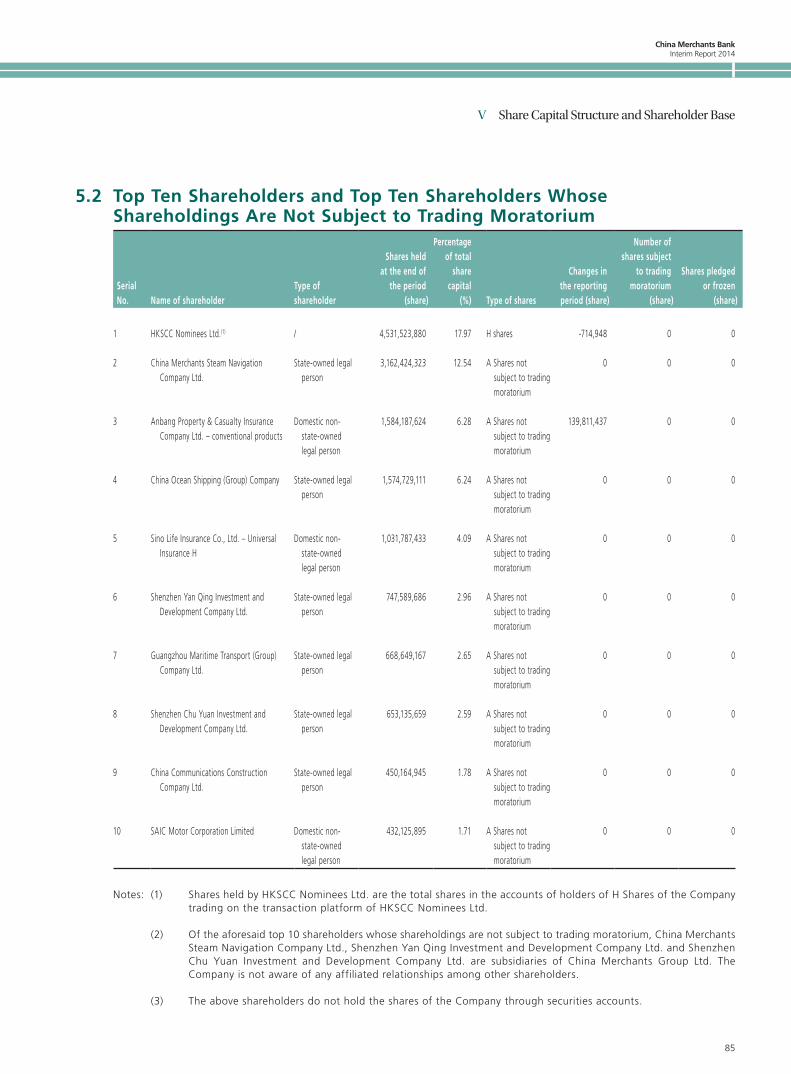
China Merchants Bank Interim Report 2014
85
V Share Capital Structure and Shareholder Base
5.2 Top Ten Shareholders and Top Ten Shareholders Whose Shareholdings Are Not Subject to Trading Moratorium
Serial No. Name of shareholder
Type of shareholder
Shares held at the end of
the period (share)
Percentage of total
share capital
(%) Type of shares
Changes in the reporting period (share)
Number of shares subject
to trading moratorium
(share)
Shares pledged or frozen
(share)
1 HKSCC Nominees Ltd.(1) / 4,531,523,880 17.97 H shares -714,948 0 0
2 China Merchants Steam Navigation Company Ltd.
State-owned legal person
3,162,424,323 12.54 A Shares not subject to trading moratorium
0 0 0
3 Anbang Property & Casualty Insurance Company Ltd. – conventional products
Domestic non-state-owned legal person
1,584,187,624 6.28 A Shares not subject to trading moratorium
139,811,437 0 0
4 China Ocean Shipping (Group) Company State-owned legal person
1,574,729,111 6.24 A Shares not subject to trading moratorium
0 0 0
5 Sino Life Insurance Co., Ltd. – Universal Insurance H
Domestic non-state-owned legal person
1,031,787,433 4.09 A Shares not subject to trading moratorium
0 0 0
6 Shenzhen Yan Qing Investment and Development Company Ltd.
State-owned legal person
747,589,686 2.96 A Shares not subject to trading moratorium
0 0 0
7 Guangzhou Maritime Transport (Group) Company Ltd.
State-owned legal person
668,649,167 2.65 A Shares not subject to trading moratorium
0 0 0
8 Shenzhen Chu Yuan Investment and Development Company Ltd.
State-owned legal person
653,135,659 2.59 A Shares not subject to trading moratorium
0 0 0
9 China Communications Construction Company Ltd.
State-owned legal person
450,164,945 1.78 A Shares not subject to trading moratorium
0 0 0
10 SAIC Motor Corporation Limited Domestic non-state-owned legal person
432,125,895 1.71 A Shares not subject to trading moratorium
0 0 0
Notes: (1) Shares held by HKSCC Nominees Ltd. are the total shares in the accounts of holders of H Shares of the Company trading on the transaction platform of HKSCC Nominees Ltd.
(2) Of the aforesaid top 10 shareholders whose shareholdings are not subject to trading moratorium, China Merchants Steam Navigation Company Ltd., Shenzhen Yan Qing Investment and Development Company Ltd. and Shenzhen Chu Yuan Investment and Development Company Ltd. are subsidiaries of China Merchants Group Ltd. The Company is not aware of any affiliated relationships among other shareholders.
(3) The above shareholders do not hold the shares of the Company through securities accounts.
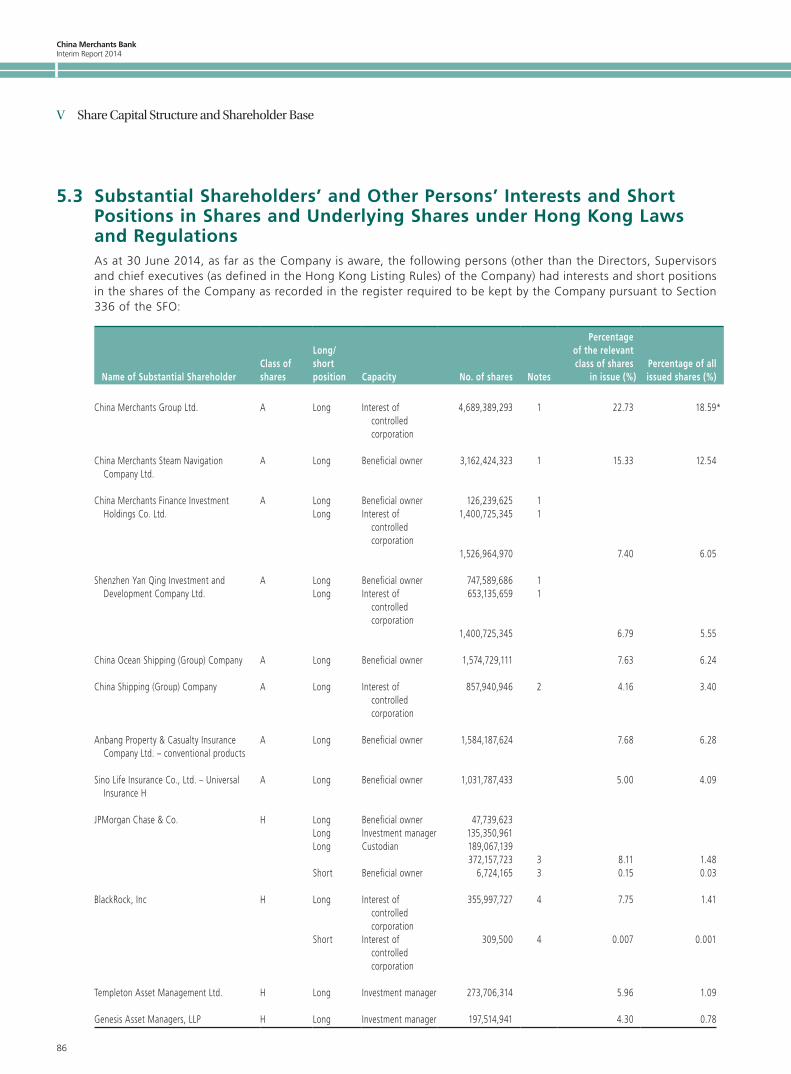
China Merchants BankInterim Report 2014
86
V Share Capital Structure and Shareholder Base
5.3 Substantial Shareholders’ and Other Persons’ Interests and Short Positions in Shares and Underlying Shares under Hong Kong Laws and RegulationsAs at 30 June 2014, as far as the Company is aware, the following persons (other than the Directors, Supervisors and chief executives (as defined in the Hong Kong Listing Rules) of the Company) had interests and short positions in the shares of the Company as recorded in the register required to be kept by the Company pursuant to Section 336 of the SFO:
Name of Substantial ShareholderClass of shares
Long/short position Capacity No. of shares Notes
Percentage of the relevant class of shares
in issue (%)Percentage of all issued shares (%)
China Merchants Group Ltd. A Long Interest of controlled corporation
4,689,389,293 1 22.73 18.59*
China Merchants Steam Navigation Company Ltd.
A Long Beneficial owner 3,162,424,323 1 15.33 12.54
China Merchants Finance Investment Holdings Co. Ltd.
A Long Beneficial owner 126,239,625 1Long Interest of
controlled corporation
1,400,725,345 1
1,526,964,970 7.40 6.05
Shenzhen Yan Qing Investment and Development Company Ltd.
A Long Beneficial owner 747,589,686 1Long Interest of
controlled corporation
653,135,659 1
1,400,725,345 6.79 5.55
China Ocean Shipping (Group) Company A Long Beneficial owner 1,574,729,111 7.63 6.24
China Shipping (Group) Company A Long Interest of controlled corporation
857,940,946 2 4.16 3.40
Anbang Property & Casualty Insurance Company Ltd. – conventional products
A Long Beneficial owner 1,584,187,624 7.68 6.28
Sino Life Insurance Co., Ltd. – Universal Insurance H
A Long Beneficial owner 1,031,787,433 5.00 4.09
JPMorgan Chase & Co. H Long Beneficial owner 47,739,623Long Investment manager 135,350,961Long Custodian 189,067,139
372,157,723 3 8.11 1.48Short Beneficial owner 6,724,165 3 0.15 0.03
BlackRock, Inc H Long Interest of controlled corporation
355,997,727 4 7.75 1.41
Short Interest of controlled corporation
309,500 4 0.007 0.001
Templeton Asset Management Ltd. H Long Investment manager 273,706,314 5.96 1.09
Genesis Asset Managers, LLP H Long Investment manager 197,514,941 4.30 0.78
China Merchants Bank Interim Report 2014
87
V Share Capital Structure and Shareholder Base
* As at 30 June 2014, China Merchants Group Ltd. indirectly held an aggregate of 18.80% of the total issued shares of the Company. A shares held by the Group consist of 18.59% of the shares of the Company while H shares held by the Group consist of 0.21% of the shares of the Company.
Notes:
(1) China Merchants Group Ltd. was deemed to hold interests in a total of 4,689,389,293 A shares (long position) of the Company by virtue of its control over the following corporations, which held direct interests in the Company:
(1.1) China Merchants Steam Navigation Company Ltd. held 3,162,424,323 A shares (long position) in the Company. China Merchants Steam Navigation Company Ltd. was a wholly-owned subsidiary of China Merchants Group Ltd..
(1.2) China Merchants Finance Investment Holdings Co. Ltd. held 126,239,625 A shares (long position) in the Company. China Merchants Finance Investment Holdings Co. Ltd. was owned as to 90% and 10% by China Merchants Group Ltd. and China Merchants Steam Navigation Company Ltd., referred to in (1.1) above, respectively.
(1.3) Shenzhen Yan Qing Investment and Development Company Ltd. held 747,589,686 A shares (long position) in the Company. Shenzhen Yan Qing Investment and Development Company Ltd. was owned as to 51% and 49% by China Merchants Finance Investment Holdings Co. Ltd., referred to in (1.2) above, and China Merchants Group Ltd. respectively.
(1.4) Shenzhen Chu Yuan Investment and Development Company Ltd. held 653,135,659 A shares (long position) in the Company. Shenzhen Chu Yuan Investment and Development Company Ltd. was owned as to 50% by each of China Merchants Finance Investment Holdings Co. Ltd., referred to in (1.2) above, and Shenzhen Yan Qing Investment and Development Company Ltd., referred to in (1.3) above, respectively.
(2) China Shipping (Group) Company was deemed to hold interests in a total of 857,940,946 A shares (long position) in the Company by virtue of its control over the following enterprises which directly held interests in the Company:
(2.1) Guangzhou Maritime Transport (Group) Company Limited directly held 668,649,167 A shares (long position) in the Company;
(2.2) Shanghai Shipping (Group) Company directly held 75,617,340 A shares (long position) in the Company;
(2.3) Guangzhou Haining Maritime Service Co. directly held 103,552,616 A shares (long position) in the Company; and
(2.4) Shenzhen Tri-Dynas Oil & Shipping Co., Ltd. directly held 10,121,823 A shares (long position) in the Company.
(3) JPMorgan Chase & Co. was deemed to hold interests in a total of 372,157,723 H shares (long position) and 6,724,165 H shares (short position) in the Company by virtue of its control over a number of its indirect or direct wholly-owned subsidiaries.
The entire interest and short position of JPMorgan Chase & Co. in the Company included a lending pool of 189,067,139 H shares. Besides, 15,530,418 H shares (long position) and 3,824,165 H shares (short position) were held through derivatives as follows:
340,318 H shares (long position) and 298,345 H shares (short position)
– through physically settled derivatives (on exchange)
561,627 H shares (short position) – through cash settled derivatives (on exchange)15,190,100 H shares (long position) and 2,964,193 H shares (short position)
– through cash settled derivatives (off exchange)
(4) BlackRock, Inc. had a long position in 355,997,727 H shares (in which 1,884,000 H shares were held through cash settled derivatives (on exchange) and a short position in 309,500 H shares (in which 22,500 H shares were held through cash settled derivatives (on exchange)) of the Company by virtue of its control over a number of direct wholly-owned subsidiaries.
Save as disclosed above, the Company is not aware of any other person (other than the Directors, Supervisors and chief executives (as defined in the Hong Kong Listing Rules) of the Company) having any interests or short positions in the shares and underlying shares of the Company as at 30 June 2014 as recorded in the register required to be kept by the Company pursuant to Section 336 of the SFO.
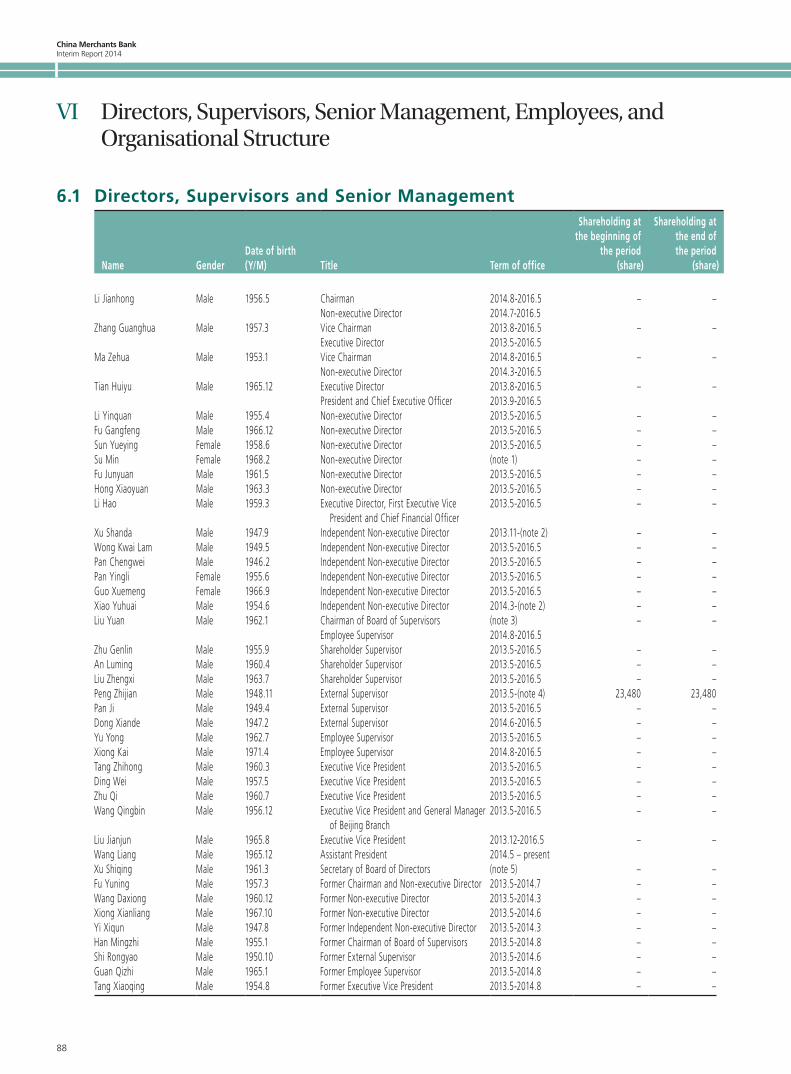
China Merchants BankInterim Report 2014
88
VI Directors, Supervisors, Senior Management, Employees, and Organisational Structure
6.1 Directors, Supervisors and Senior Management
Name GenderDate of birth (Y/M) Title Term of office
Shareholding at the beginning of
the period (share)
Shareholding at the end of the period
(share)
Li Jianhong Male 1956.5 Chairman 2014.8-2016.5 – –Non-executive Director 2014.7-2016.5
Zhang Guanghua Male 1957.3 Vice Chairman 2013.8-2016.5 – –Executive Director 2013.5-2016.5
Ma Zehua Male 1953.1 Vice Chairman 2014.8-2016.5 – –Non-executive Director 2014.3-2016.5
Tian Huiyu Male 1965.12 Executive Director 2013.8-2016.5 – –President and Chief Executive Officer 2013.9-2016.5
Li Yinquan Male 1955.4 Non-executive Director 2013.5-2016.5 – –Fu Gangfeng Male 1966.12 Non-executive Director 2013.5-2016.5 – –Sun Yueying Female 1958.6 Non-executive Director 2013.5-2016.5 – –Su Min Female 1968.2 Non-executive Director (note 1) – –Fu Junyuan Male 1961.5 Non-executive Director 2013.5-2016.5 – –Hong Xiaoyuan Male 1963.3 Non-executive Director 2013.5-2016.5 – –Li Hao Male 1959.3 Executive Director, First Executive Vice
President and Chief Financial Officer2013.5-2016.5 – –
Xu Shanda Male 1947.9 Independent Non-executive Director 2013.11-(note 2) – –Wong Kwai Lam Male 1949.5 Independent Non-executive Director 2013.5-2016.5 – –Pan Chengwei Male 1946.2 Independent Non-executive Director 2013.5-2016.5 – –Pan Yingli Female 1955.6 Independent Non-executive Director 2013.5-2016.5 – –Guo Xuemeng Female 1966.9 Independent Non-executive Director 2013.5-2016.5 – –Xiao Yuhuai Male 1954.6 Independent Non-executive Director 2014.3-(note 2) – –Liu Yuan Male 1962.1 Chairman of Board of Supervisors (note 3) – –
Employee Supervisor 2014.8-2016.5Zhu Genlin Male 1955.9 Shareholder Supervisor 2013.5-2016.5 – –An Luming Male 1960.4 Shareholder Supervisor 2013.5-2016.5 – –Liu Zhengxi Male 1963.7 Shareholder Supervisor 2013.5-2016.5 – –Peng Zhijian Male 1948.11 External Supervisor 2013.5-(note 4) 23,480 23,480Pan Ji Male 1949.4 External Supervisor 2013.5-2016.5 – –Dong Xiande Male 1947.2 External Supervisor 2014.6-2016.5 – –Yu Yong Male 1962.7 Employee Supervisor 2013.5-2016.5 – –Xiong Kai Male 1971.4 Employee Supervisor 2014.8-2016.5 – –Tang Zhihong Male 1960.3 Executive Vice President 2013.5-2016.5 – –Ding Wei Male 1957.5 Executive Vice President 2013.5-2016.5 – –Zhu Qi Male 1960.7 Executive Vice President 2013.5-2016.5 – –Wang Qingbin Male 1956.12 Executive Vice President and General Manager
of Beijing Branch2013.5-2016.5 – –
Liu Jianjun Male 1965.8 Executive Vice President 2013.12-2016.5 – –Wang Liang Male 1965.12 Assistant President 2014.5 – presentXu Shiqing Male 1961.3 Secretary of Board of Directors (note 5) – –Fu Yuning Male 1957.3 Former Chairman and Non-executive Director 2013.5-2014.7 – –Wang Daxiong Male 1960.12 Former Non-executive Director 2013.5-2014.3 – –Xiong Xianliang Male 1967.10 Former Non-executive Director 2013.5-2014.6 – –Yi Xiqun Male 1947.8 Former Independent Non-executive Director 2013.5-2014.3 – –Han Mingzhi Male 1955.1 Former Chairman of Board of Supervisors 2013.5-2014.8 – –Shi Rongyao Male 1950.10 Former External Supervisor 2013.5-2014.6 – –Guan Qizhi Male 1965.1 Former Employee Supervisor 2013.5-2014.8 – –Tang Xiaoqing Male 1954.8 Former Executive Vice President 2013.5-2014.8 – –
China Merchants Bank Interim Report 2014
89
VI Directors, Supervisors, Senior Management, Employees, and Organisational Structure
Notes: (1) Ms. Su Min was elected as a Non-executive Director of the Ninth Session of the Board of Directors of the Company at the 2013 Annual General Meeting held by the Company on 30 June 2014, her qualification is still subject to approval by the banking regulator(s) in the PRC;
(2) Mr. Xu Shanda and Mr. Xiao Yuhuai submitted a letter of resignation to the Company on 30 April and 20 June 2014 respectively, applying to resign from the Independent Non-executive Directors of the Company. In order to comply with the regulatory requirements of maintaining independent non-executive directors representing at least one third of the Board of Directors of the Company, Mr. Xu Shanda and Mr. Xiao Yuhuai will continue to fulfill their duties as Independent Non-executive Directors before new independent non-executive directors are elected at the general meeting of the Company and whose qualifications for serving as independent non-executive director are approved by the banking regulator(s) in the PRC to fill the vacancies;
(3) Mr. Liu Yuan was elected as the Chairman of the Ninth Session of the Board of Supervisors at the 14th meeting of the Ninth Session of the Board of Supervisors of the Company, and his qualification for serving as the Chairman of the Board of Supervisors is still subject to approval by the banking regulator(s) in the PRC;
(4) Mr. Peng Zhijian submitted a letter of resignation to the Company on 7 May 2014, applying to resign from the External Supervisor of the Company. In order to comply with the regulatory requirements of maintaining external supervisors representing at least one third of the Board of Supervisors of the Company, Mr. Peng Zhijian will continue to fulfill his duty as an External Supervisor before the new external supervisor who is elected at the general meeting of the Company officially assumes duty to fill the vacancy;
(5) Mr. Xu Shiqing was appointed as the Secretary of the Board of Directors at the first meeting of the Ninth Session of the Board of Directors of the Company. He has obtained qualification as the Secretary of the Board of Directors from the Shanghai Stock Exchange, but his appointment qualification is still subject to approval by the banking regulator(s) in the PRC;
(6) None of the persons listed in the above table holds any share options of the Company nor had they been granted with restricted shares of the Company.
6.2 Appointment and Resignation of Directors, Supervisors and Senior ManagementAccording to the relevant resolutions passed at the 2014 First Extraordinary General Meeting and the 2013 Annual General Meeting of the Company held on 13 January 2014 and 30 June 2014, respectively, Mr. Li Jianhong, Mr. Ma Zehua, Mr. Xiao Yuhuai and Ms. Su Min were newly elected as Non-executive Directors of the Ninth Session of the Board of Directors of the Company. Mr. Fu Yuning submitted a letter of resignation to the Company on 10 July 2014 due to the change of job assignment, and ceased to be the Chairman and Non-executive Director of the Company; Mr. Wang Daxiong and Mr. Xiong Xianliang submitted a letter of resignation to the Company on 21 March 2014 and 4 June 2014 respectively, due to the change of job assignment, and ceased to be Non-executive Directors of the Company; Mr. Yi Xiqun ceased to be an Independent Non-executive Director of the Company from March 2014; Mr. Xu Shanda and Mr. Xiao Yuhuai submitted a letter of resignation to the Company on 30 April 2014 and 20 June 2014 respectively, due to the change of job assignment, and ceased to be Independent Non-executive Directors of the Company (Mr. Xu Shanda and Mr. Xiao Yuhuai will continue to fulfill their duties as Independent Non-executive Directors before new independent non-executive directors are elected at the general meeting of the Company and whose qualifications are approved to fill the vacancies left by Mr. Xu and Mr. Xiao).
Mr. Li Jianhong was elected as the Chairman of the Company at the 19th meeting of the Ninth Session of the Board of Directors of the Company, and his qualification for serving as the Chairman was approved by the banking regulator(s) in the PRC on 8 August 2014. Mr. Ma Zehua was elected as the Vice Chairman of the Company at the 14th meeting of the Ninth Session of the Board of Directors of the Company, and his qualification for serving as Vice Chairman was approved by the banking regulator(s) in the PRC on 25 August 2014.
China Merchants BankInterim Report 2014
90
VI Directors, Supervisors, Senior Management, Employees, and Organisational Structure
According to the relevant resolutions passed at the 2013 Annual General Meeting of the Company, Mr. Dong Xiande was newly elected as an External Supervisor of the Ninth Session of the Board of Supervisors of the Company. According to the voting results at the meeting of employee representatives held on 26 August 2014, Mr. Liu Yuan and Mr. Xiong Kai were elected as Employee Supervisors of the Ninth Session of the Board of Supervisors of the Company. Mr. Shi Rongyao and Mr. Peng Zhijian submitted a letter of resignation to the Company on 20 March 2014 and 7 May 2014, respectively, due to the change of job assignment, and ceased to be External Supervisors of the Company (Mr. Peng Zhijian will continue to perform his duties as an External Supervisor before the new external supervisor who is elected at the general meeting of the Company officially assumes duty to fill the vacancy); Mr. Han Mingzhi submitted a letter of resignation to the Company on 25 August 2014, due to the change of job assignment, to resign as the Chairman of the Board of Supervisors and an Employee Supervisor of the Company; and Mr. Guan Qizhi submitted a letter of resignation to the Company on 25 August 2014, due to the change of job assignment, to resign as an Employee Supervisor of the Company.
The “Resolution Regarding the Resignation of Tang Xiaoqing as Executive Vice President of China Merchants Bank” was passed at the 21st meeting of the Ninth Session of the Board of Directors of the Company, whereby the resignation of Mr. Tang Xiaoqing due to the change of job assignment was approved.
For details, please refer to relevant announcements published on China Securities Journal, Shanghai Securities News and Securities Times, and on the websites of the Shanghai Stock Exchange, the Hong Kong Stock Exchange and the Company.
6.3 Changes of Occupations of Directors and Supervisors1. Mr. Li Jianhong, Chairman and Non-executive Director of the Company, serves as the Chairman of China
Merchants Group Ltd. and China Merchants Capital Management, Ltd. and ceased to be the director and the President of China Merchants Group Ltd..
2. Mr. Zhang Guanghua, Vice Chairman and Executive Director of the Company, ceased to be the Chairman of CMB Financial Leasing Co., Ltd..
3. Mr. Li Yinquan, Non-executive Director of the Company, also serves as the CEO of China Merchants Capital Management Ltd..
4. Mr. Fu Gangfeng, Non-executive Director of the Company, serves as the director of China Merchants Property Development Co., Ltd., and ceased to be the director of China Merchants Securities Co., Ltd. and China Merchants Energy Shipping Co., Ltd..
5. Mr. Wong Kwai Lam, Independent Non-executive Director of the Company, serves as a member of the Governance Committee of Medical Center of the Chinese University of Hong Kong, and ceased to be a member of the New Hospital Project Committee of the Chinese University of Hong Kong.
6.4 H Share Appreciation Rights Incentive SchemeTo further establish and enhance its incentive system for reconciling the interests of shareholders, the Company and the senior management, the Company approved the H Share Appreciation Rights Incentive Scheme for senior management at the 2007 First Extraordinary General Meeting. On 30 October 2007, 7 November 2008, 16 November 2009, 18 February 2011, 4 May 2012, 22 May 2013 and 7 July 2014, the Board of Directors of the Company granted the H Share appreciation rights of Phase I to Phase VII under the Scheme respectively. Please refer to the relevant announcements published on the websites of the Shanghai Stock Exchange, the Hong Kong Stock Exchange and the Company for details.
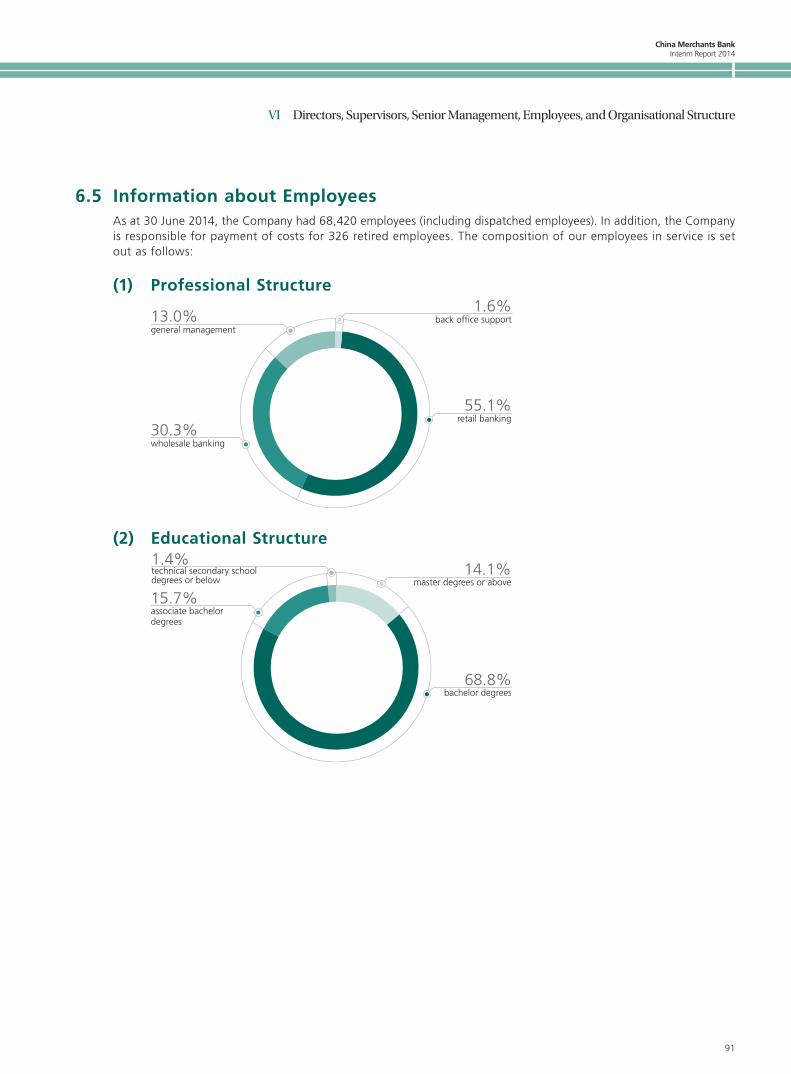
China Merchants Bank Interim Report 2014
91
VI Directors, Supervisors, Senior Management, Employees, and Organisational Structure
6.5 Information about EmployeesAs at 30 June 2014, the Company had 68,420 employees (including dispatched employees). In addition, the Company is responsible for payment of costs for 326 retired employees. The composition of our employees in service is set out as follows:
(1) Professional Structure
13.0%general management
30.3%wholesale banking
55.1%retail banking
1.6%back office support
(2) Educational Structure
15.7%associate bachelor degrees
68.8%bachelor degrees
14.1%master degrees or above
1.4%technical secondary school degrees or below
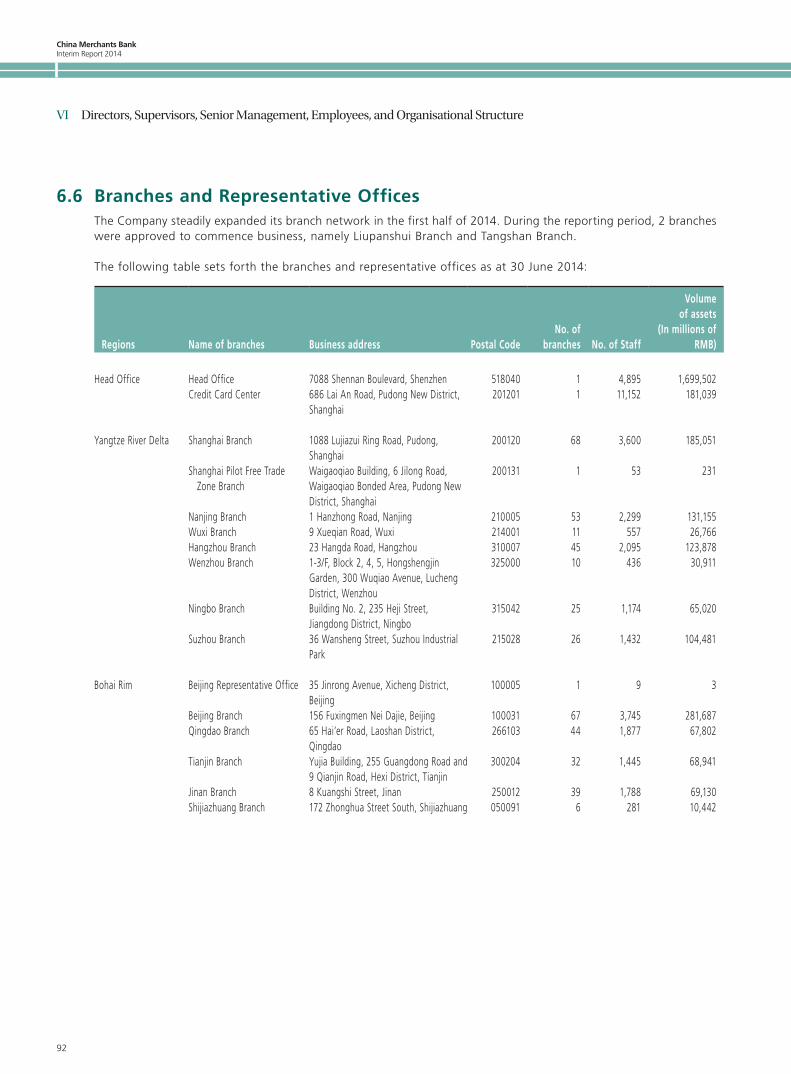
China Merchants BankInterim Report 2014
92
VI Directors, Supervisors, Senior Management, Employees, and Organisational Structure
6.6 Branches and Representative OfficesThe Company steadily expanded its branch network in the first half of 2014. During the reporting period, 2 branches were approved to commence business, namely Liupanshui Branch and Tangshan Branch.
The following table sets forth the branches and representative offices as at 30 June 2014:
Regions Name of branches Business address Postal CodeNo. of
branches No. of Staff
Volume of assets
(In millions of RMB)
Head Office Head Office 7088 Shennan Boulevard, Shenzhen 518040 1 4,895 1,699,502Credit Card Center 686 Lai An Road, Pudong New District,
Shanghai201201 1 11,152 181,039
Yangtze River Delta Shanghai Branch 1088 Lujiazui Ring Road, Pudong, Shanghai
200120 68 3,600 185,051
Shanghai Pilot Free Trade Zone Branch
Waigaoqiao Building, 6 Jilong Road, Waigaoqiao Bonded Area, Pudong New District, Shanghai
200131 1 53 231
Nanjing Branch 1 Hanzhong Road, Nanjing 210005 53 2,299 131,155Wuxi Branch 9 Xueqian Road, Wuxi 214001 11 557 26,766Hangzhou Branch 23 Hangda Road, Hangzhou 310007 45 2,095 123,878Wenzhou Branch 1-3/F, Block 2, 4, 5, Hongshengjin
Garden, 300 Wuqiao Avenue, Lucheng District, Wenzhou
325000 10 436 30,911
Ningbo Branch Building No. 2, 235 Heji Street, Jiangdong District, Ningbo
315042 25 1,174 65,020
Suzhou Branch 36 Wansheng Street, Suzhou Industrial Park
215028 26 1,432 104,481
Bohai Rim Beijing Representative Office 35 Jinrong Avenue, Xicheng District, Beijing
100005 1 9 3
Beijing Branch 156 Fuxingmen Nei Dajie, Beijing 100031 67 3,745 281,687Qingdao Branch 65 Hai’er Road, Laoshan District,
Qingdao266103 44 1,877 67,802
Tianjin Branch Yujia Building, 255 Guangdong Road and 9 Qianjin Road, Hexi District, Tianjin
300204 32 1,445 68,941
Jinan Branch 8 Kuangshi Street, Jinan 250012 39 1,788 69,130Shijiazhuang Branch 172 Zhonghua Street South, Shijiazhuang 050091 6 281 10,442
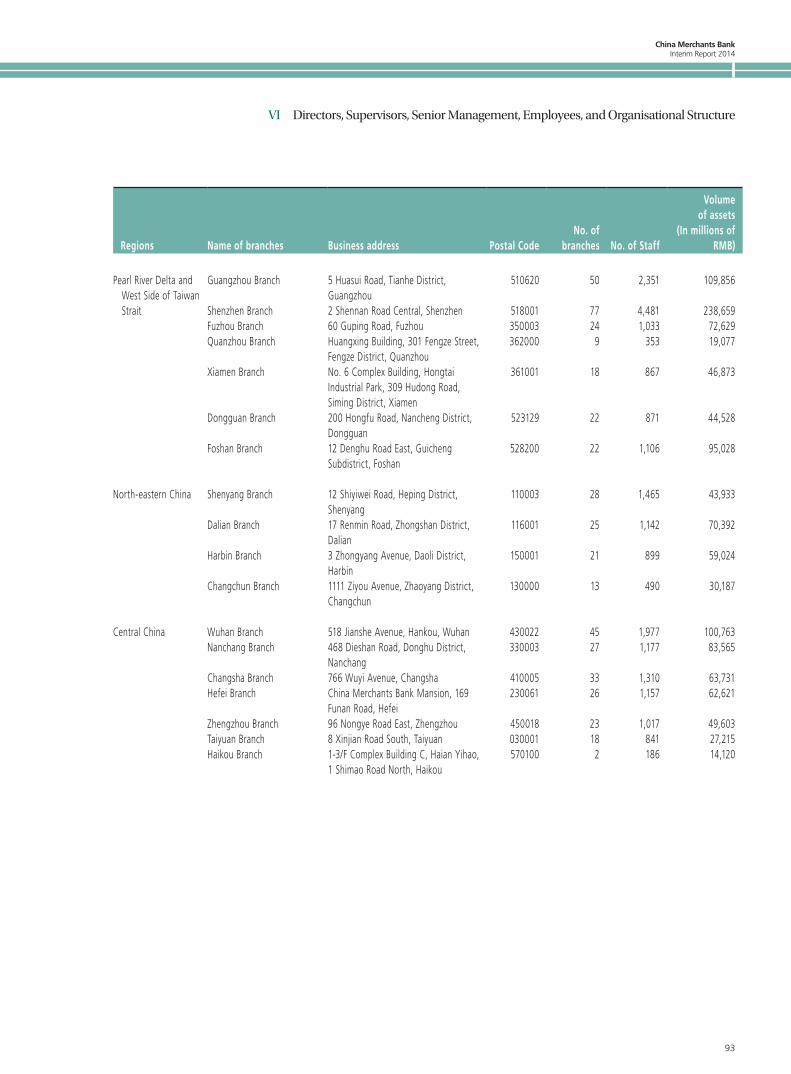
China Merchants Bank Interim Report 2014
93
VI Directors, Supervisors, Senior Management, Employees, and Organisational Structure
Regions Name of branches Business address Postal CodeNo. of
branches No. of Staff
Volume of assets
(In millions of RMB)
Pearl River Delta and West Side of Taiwan Strait
Guangzhou Branch 5 Huasui Road, Tianhe District, Guangzhou
510620 50 2,351 109,856
Shenzhen Branch 2 Shennan Road Central, Shenzhen 518001 77 4,481 238,659Fuzhou Branch 60 Guping Road, Fuzhou 350003 24 1,033 72,629Quanzhou Branch Huangxing Building, 301 Fengze Street,
Fengze District, Quanzhou362000 9 353 19,077
Xiamen Branch No. 6 Complex Building, Hongtai Industrial Park, 309 Hudong Road, Siming District, Xiamen
361001 18 867 46,873
Dongguan Branch 200 Hongfu Road, Nancheng District, Dongguan
523129 22 871 44,528
Foshan Branch 12 Denghu Road East, Guicheng Subdistrict, Foshan
528200 22 1,106 95,028
North-eastern China Shenyang Branch 12 Shiyiwei Road, Heping District, Shenyang
110003 28 1,465 43,933
Dalian Branch 17 Renmin Road, Zhongshan District, Dalian
116001 25 1,142 70,392
Harbin Branch 3 Zhongyang Avenue, Daoli District, Harbin
150001 21 899 59,024
Changchun Branch 1111 Ziyou Avenue, Zhaoyang District, Changchun
130000 13 490 30,187
Central China Wuhan Branch 518 Jianshe Avenue, Hankou, Wuhan 430022 45 1,977 100,763Nanchang Branch 468 Dieshan Road, Donghu District,
Nanchang330003 27 1,177 83,565
Changsha Branch 766 Wuyi Avenue, Changsha 410005 33 1,310 63,731Hefei Branch China Merchants Bank Mansion, 169
Funan Road, Hefei230061 26 1,157 62,621
Zhengzhou Branch 96 Nongye Road East, Zhengzhou 450018 23 1,017 49,603Taiyuan Branch 8 Xinjian Road South, Taiyuan 030001 18 841 27,215Haikou Branch 1-3/F Complex Building C, Haian Yihao,
1 Shimao Road North, Haikou570100 2 186 14,120
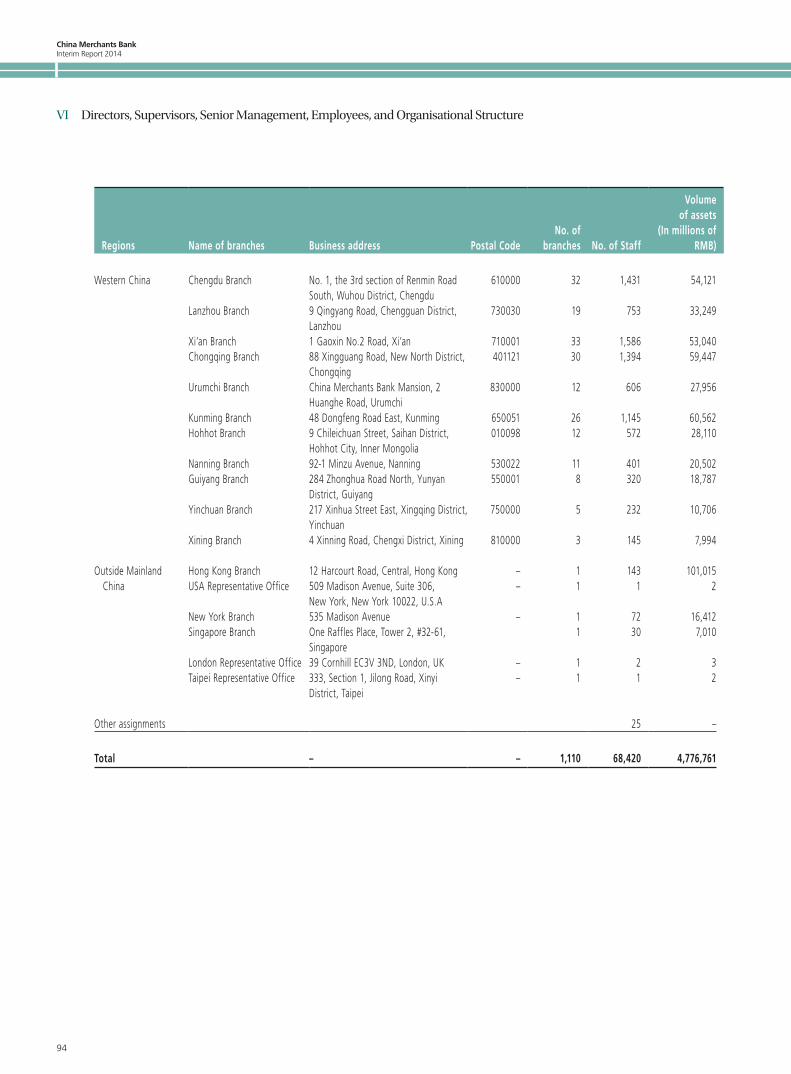
China Merchants BankInterim Report 2014
94
VI Directors, Supervisors, Senior Management, Employees, and Organisational Structure
Regions Name of branches Business address Postal CodeNo. of
branches No. of Staff
Volume of assets
(In millions of RMB)
Western China Chengdu Branch No. 1, the 3rd section of Renmin Road South, Wuhou District, Chengdu
610000 32 1,431 54,121
Lanzhou Branch 9 Qingyang Road, Chengguan District, Lanzhou
730030 19 753 33,249
Xi’an Branch 1 Gaoxin No.2 Road, Xi’an 710001 33 1,586 53,040Chongqing Branch 88 Xingguang Road, New North District,
Chongqing401121 30 1,394 59,447
Urumchi Branch China Merchants Bank Mansion, 2 Huanghe Road, Urumchi
830000 12 606 27,956
Kunming Branch 48 Dongfeng Road East, Kunming 650051 26 1,145 60,562Hohhot Branch 9 Chileichuan Street, Saihan District,
Hohhot City, Inner Mongolia010098 12 572 28,110
Nanning Branch 92-1 Minzu Avenue, Nanning 530022 11 401 20,502Guiyang Branch 284 Zhonghua Road North, Yunyan
District, Guiyang550001 8 320 18,787
Yinchuan Branch 217 Xinhua Street East, Xingqing District, Yinchuan
750000 5 232 10,706
Xining Branch 4 Xinning Road, Chengxi District, Xining 810000 3 145 7,994
Outside Mainland China
Hong Kong Branch 12 Harcourt Road, Central, Hong Kong – 1 143 101,015USA Representative Office 509 Madison Avenue, Suite 306, – 1 1 2
New York, New York 10022, U.S.ANew York Branch 535 Madison Avenue – 1 72 16,412Singapore Branch One Raffles Place, Tower 2, #32-61,
Singapore1 30 7,010
London Representative Office 39 Cornhill EC3V 3ND, London, UK – 1 2 3Taipei Representative Office 333, Section 1, Jilong Road, Xinyi
District, Taipei– 1 1 2
Other assignments 25 –
Total – – 1,110 68,420 4,776,761

China Merchants Bank Interim Report 2014
95
VII Corporate Governance
7.1 Overview of Corporate GovernanceDuring the reporting period, the Shareholders’ General Meeting, the Board of Directors, the Board of Supervisors and the special committees under the Board of Directors and the Board of Supervisors of the Company functioned proactively and effectively, secured prudence and compliance with the Company’s operation, and ensured sustainable and healthy growth of the Company. During the reporting period, the Company held a total of 29 meetings of all sorts. Among them, there were 2 shareholders’ general meetings, 6 meetings of the Board of Directors, 14 meetings of the special committees under the Board of Directors, 4 meetings of the Board of Supervisors and 3 meetings of the special committees under the Board of Supervisors.
Having conducted thorough self-inspection, the Company was not aware of any non-compliance with its corporate governance practice during the reporting period with the requirements set out in CSRC’s regulatory documents governing the corporate governance of listed companies. There were no irregularities in the Company’s corporate governance, nor was there any undisclosed information provided to its major shareholders or de facto controllers.
7.2 Information about General MeetingsDuring the reporting period, the Company convened two shareholders’ general meetings.
On 13 January 2014, the 2014 First Extraordinary General Meeting of the Company was held in Shenzhen. The notifying, convening, holding and voting procedures of the meeting complied with the Company Law, the Articles of Association of the Company and the relevant requirements of the Hong Kong Listing Rules. For details of the relevant proposals considered at the meeting, please refer to the announcements in respect of the resolutions passed at the 2014 First Extraordinary General Meeting dated 13 January 2014 published on China Securities Journal, Shanghai Securities News and Securities Times, and on the websites of the Shanghai Stock Exchange, the Hong Kong Stock Exchange and the Company.
On 30 June 2014, the 2013 Annual General Meeting of the Company was held in Shenzhen. The notifying, convening, holding and voting procedures of the meeting complied with the Company Law, the Articles of Association of the Company and the relevant requirements of the Hong Kong Listing Rules. For details of the relevant proposals considered at the meeting, please refer to the announcements in respect of the resolutions passed at the 2013 Annual General Meeting dated 30 June 2014 published on China Securities Journal, Shanghai Securities News and Securities Times, and on the websites of the Shanghai Stock Exchange, the Hong Kong Stock Exchange and the Company.
7.3 Information about Meetings of the Board of Directors and its Special CommitteesDuring the reporting period, the Company convened 6 meetings of the Board of Directors (1 on-site meeting, 5 meetings voted by correspondence), considered and approved 37 proposals, heard 9 theme reports. Special committees under the Board of Directors convened 14 meetings (1 by the Strategy Committee, 1 by the Nomination Committee, 2 by the Remuneration and Appraisal Committee, 4 by the Risk and Capital Management Committee, 3 by the Audit Committee, and 3 by the Related-Party Transactions Control Committee), studied and reviewed 42 proposals and heard 18 theme reports.
China Merchants BankInterim Report 2014
96
VII Corporate Governance
7.4 Information about Meetings of the Board of Supervisors and its Special CommitteesDuring the reporting period, the Board of Supervisors held 4 meetings (1 on-site meeting, 3 meetings voted by correspondence), considered 19 proposals, and heard 9 theme reports. Special committees under the Board of Supervisors convened 3 meetings (1 by the Nomination Committee, with 3 proposals considered; 2 by the Supervision Committee, with 2 proposals considered).
The Board of Supervisors attended 1 on-site meeting of the Board of Directors and 2 general meetings. The chairman and members of the Supervision Committee under the Board of Supervisors attended 4 meetings of the special committees under the Board of Directors, including 1 meeting convened by each of the Strategy Committee and the Audit Committee respectively, and 2 meetings convened by the Risk and Capital Management Committee.
7.5 Securities Transactions of Directors, Supervisors and the Relevant EmployeesThe Company has adopted the Model Code set out in Appendix 10 to the Hong Kong Listing Rules as the code of conduct for directors and supervisors of the Company in respect of their dealings in the Company’s securities. Having made specific enquiry of all the directors and supervisors, the Company confirmed that they had complied with the aforesaid Model Code throughout the period ended 30 June 2014.
The Company has also established guidelines for the relevant employees’ securities transactions, which are no less exacting than the Model Code. The Company is not aware of any non-compliance with the aforesaid guidelines by employees.
7.6 Internal ControlDuring the reporting period, focusing on the overall objective of “building asset-light banking and realising smart growth”, the Company steadily promoted the reform on the organisational structure of corporate finance, retail finance, interbank finance businesses and middle and back-office segments, further streamlined management procedures and decentralised powers through continuous optimisation of management process to increase the operational and managerial efficiency. In order to further promote concentrated operation, the Company realised not only the centralised operation of several businesses such as foreign exchange services, online banking and general auditing services but also the unified management of counter staff at its outlets. The Company made continuous improvement in the performance assessment system governing its domestic and overseas branches, wholly-owned subsidiaries and departments of the Head Office to strengthen the whole process management of performance assessment. By further improving its existing risk management policy system, strengthening the development and monitoring of risk measurement models to continuously enhance the overall risk management level, the Company became one of the first banks in China approved to adopt the advanced approaches for capital measurement. The Company also actively promoted the integration of internal control resources in the middle and back offices and established the general control mechanism for supervision and inspection so as to implement unified management for rectification of problems identified in external inspections. The Company continued with system management to improve and perfect its management systems. In this regard, the Head Office issued or amended a total of 110 regulations in the first half of the year. The Company intensified its audit and inspection efforts in branches to timely expose misconducts and risks in operation and management activities. In addition, the Company investigated case risks and misconducts of employees to implement the relevant measures required for case prevention and build a long-term mechanism for case prevention. In the first half of the year, the Company reported no cases or severe accidents.
During the reporting period, the Company organised evaluation campaigns regarding internal control during the year 2013 across all departments of the Head Office, its branches and sub-branches. As reviewed by the Board of Directors of the Company, no significant defects in terms of completeness, reasonableness and effectiveness were found in the Company’s internal control system.
China Merchants Bank Interim Report 2014
97
VII Corporate Governance
7.7 Statement of Compliance with the Hong Kong Listing RulesDuring the reporting period, save as disclosed below, the Company has applied the principles of the Corporate Governance Code set out in Appendix 14 of the Hong Kong Listing Rules, and has complied with all the code provisions and recommended practices (if applicable). In respect of code provision E.1.2 of the Corporate Governance Code, the former Chairman (and Chairman of Strategy Committee) and the chairman of Remuneration and Appraisal Committee were unable to attend the 2013 Annual General Meeting of the Company held on 30 June 2014 due to business engagement.
China Merchants BankInterim Report 2014
98
Review Report to the Board of Directors
Review report to the Board of Directors of
China Merchants Bank Co., Ltd.(A joint stock limited company incorporated in the People’s Republic of China with limited liability)
IntroductionWe have reviewed the interim financial report set out on pages 99 to 175 which comprises the consolidated statement of financial position of China Merchants Bank Co., Ltd. as at 30 June 2014 and the related consolidated statement of comprehensive income, and consolidated statement of changes in equity and consolidated cash flow statement for the six months period then ended and explanatory notes. The Rules Governing the Listing of Securities on The Stock Exchange of Hong Kong Limited require the preparation of an interim financial report to be in compliance with the relevant provisions thereof and International Accounting Standard 34 “Interim financial reporting” issued by the International Accounting Standards Board. The directors are responsible for the preparation and presentation of the interim financial report in accordance with International Accounting Standard 34.
Our responsibility is to form a conclusion, based on our review, on the interim financial report and to report our conclusion solely to you, as a body, in accordance with our agreed terms of engagement, and for no other purpose. We do not assume responsibility towards or accept liability to any other person for the contents of this report.
Scope of reviewWe conducted our review in accordance with International Standard on Review Engagements 2410 “Review of Interim Financial Information Performed by the Independent Auditor of the Entity”. A review of the interim financial report consists of making enquiries, primarily of persons responsible for financial and accounting matters, and applying analytical and other review procedures. A review is substantially less in scope than an audit conducted in accordance with International Standards on Auditing and consequently does not enable us to obtain assurance that we would become aware of all significant matters that might be identified in an audit. Accordingly we do not express an audit opinion.
ConclusionBased on our review, nothing has come to our attention that causes us to believe that the interim financial report as at 30 June 2014 is not prepared, in all material respects, in accordance with International Accounting Standard 34 “Interim financial reporting”.
KPMGCertified Public Accountants
8th Floor, Prince’s Building10 Chater RoadCentral, Hong Kong
29 August 2014
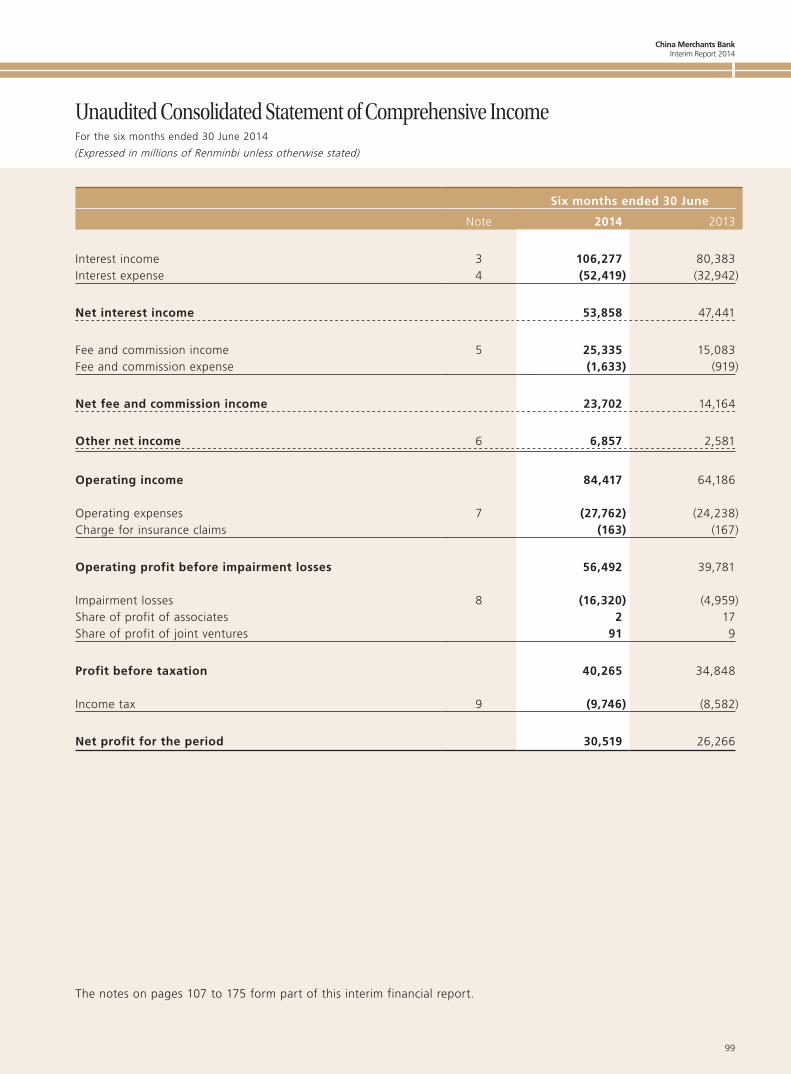
China Merchants BankInterim Report 2014
99
For the six months ended 30 June 2014
(Expressed in millions of Renminbi unless otherwise stated)
Unaudited Consolidated Statement of Comprehensive Income
Six months ended 30 June
Note 2014 2013
Interest income 3 106,277 80,383Interest expense 4 (52,419) (32,942)
Net interest income 53,858 47,441
Fee and commission income 5 25,335 15,083Fee and commission expense (1,633) (919)
Net fee and commission income 23,702 14,164
Other net income 6 6,857 2,581
Operating income 84,417 64,186
Operating expenses 7 (27,762) (24,238)Charge for insurance claims (163) (167)
Operating profit before impairment losses 56,492 39,781
Impairment losses 8 (16,320) (4,959)Share of profit of associates 2 17Share of profit of joint ventures 91 9
Profit before taxation 40,265 34,848
Income tax 9 (9,746) (8,582)
Net profit for the period 30,519 26,266
The notes on pages 107 to 175 form part of this interim financial report.
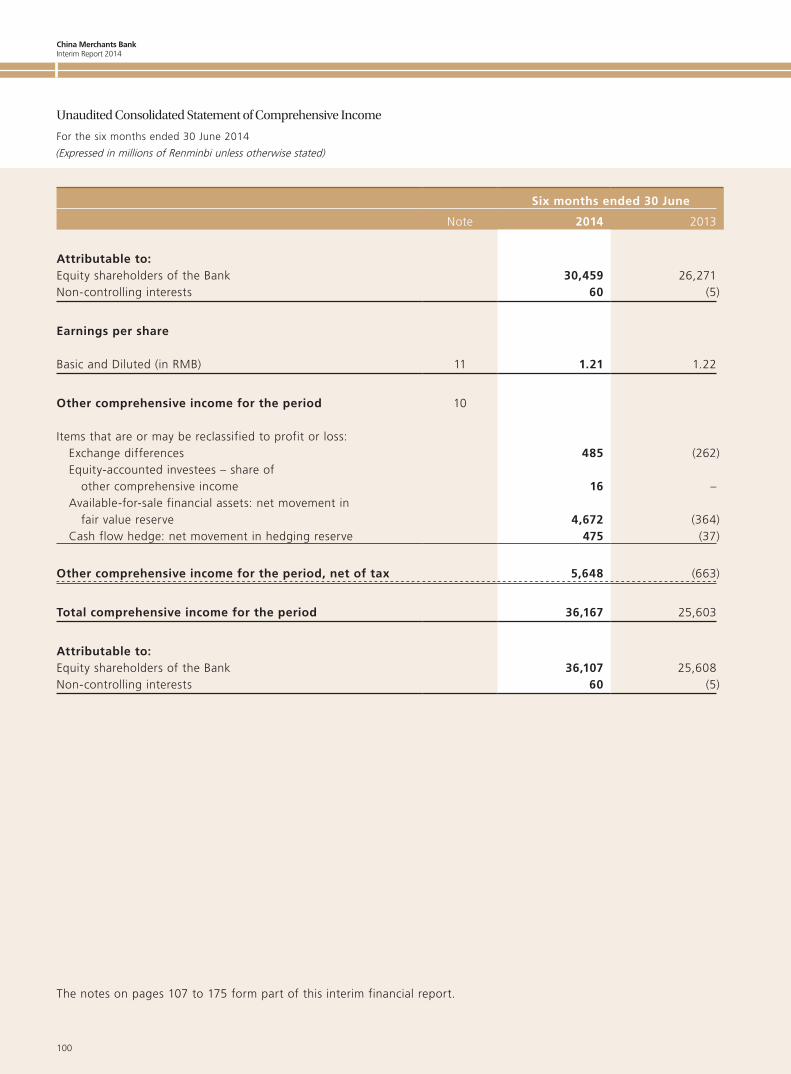
China Merchants BankInterim Report 2014
100
Unaudited Consolidated Statement of Comprehensive Income
For the six months ended 30 June 2014
(Expressed in millions of Renminbi unless otherwise stated)
Six months ended 30 June
Note 2014 2013
Attributable to:Equity shareholders of the Bank 30,459 26,271Non-controlling interests 60 (5)
Earnings per share
Basic and Diluted (in RMB) 11 1.21 1.22
Other comprehensive income for the period 10
Items that are or may be reclassified to profit or loss: Exchange differences 485 (262) Equity-accounted investees – share of
other comprehensive income 16 – Available-for-sale financial assets: net movement in fair value reserve 4,672 (364) Cash flow hedge: net movement in hedging reserve 475 (37)
Other comprehensive income for the period, net of tax 5,648 (663)
Total comprehensive income for the period 36,167 25,603
Attributable to:Equity shareholders of the Bank 36,107 25,608Non-controlling interests 60 (5)
The notes on pages 107 to 175 form part of this interim financial report.
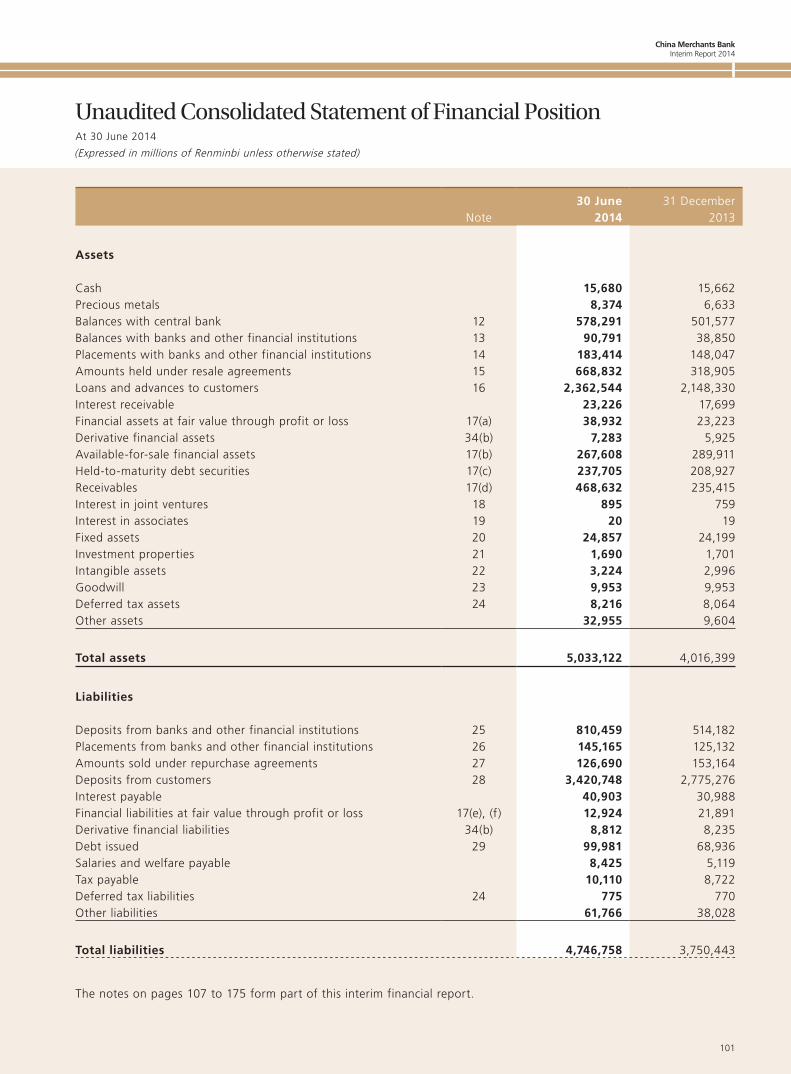
China Merchants BankInterim Report 2014
101
At 30 June 2014
(Expressed in millions of Renminbi unless otherwise stated)
Unaudited Consolidated Statement of Financial Position
Note30 June
201431 December
2013
Assets
Cash 15,680 15,662Precious metals 8,374 6,633Balances with central bank 12 578,291 501,577Balances with banks and other financial institutions 13 90,791 38,850Placements with banks and other financial institutions 14 183,414 148,047Amounts held under resale agreements 15 668,832 318,905Loans and advances to customers 16 2,362,544 2,148,330Interest receivable 23,226 17,699Financial assets at fair value through profit or loss 17(a) 38,932 23,223Derivative financial assets 34(b) 7,283 5,925Available-for-sale financial assets 17(b) 267,608 289,911Held-to-maturity debt securities 17(c) 237,705 208,927Receivables 17(d) 468,632 235,415Interest in joint ventures 18 895 759Interest in associates 19 20 19Fixed assets 20 24,857 24,199Investment properties 21 1,690 1,701Intangible assets 22 3,224 2,996Goodwill 23 9,953 9,953Deferred tax assets 24 8,216 8,064Other assets 32,955 9,604
Total assets 5,033,122 4,016,399
Liabilities
Deposits from banks and other financial institutions 25 810,459 514,182Placements from banks and other financial institutions 26 145,165 125,132Amounts sold under repurchase agreements 27 126,690 153,164Deposits from customers 28 3,420,748 2,775,276Interest payable 40,903 30,988Financial liabilities at fair value through profit or loss 17(e), (f) 12,924 21,891Derivative financial liabilities 34(b) 8,812 8,235Debt issued 29 99,981 68,936Salaries and welfare payable 8,425 5,119Tax payable 10,110 8,722Deferred tax liabilities 24 775 770Other liabilities 61,766 38,028
Total liabilities 4,746,758 3,750,443
The notes on pages 107 to 175 form part of this interim financial report.
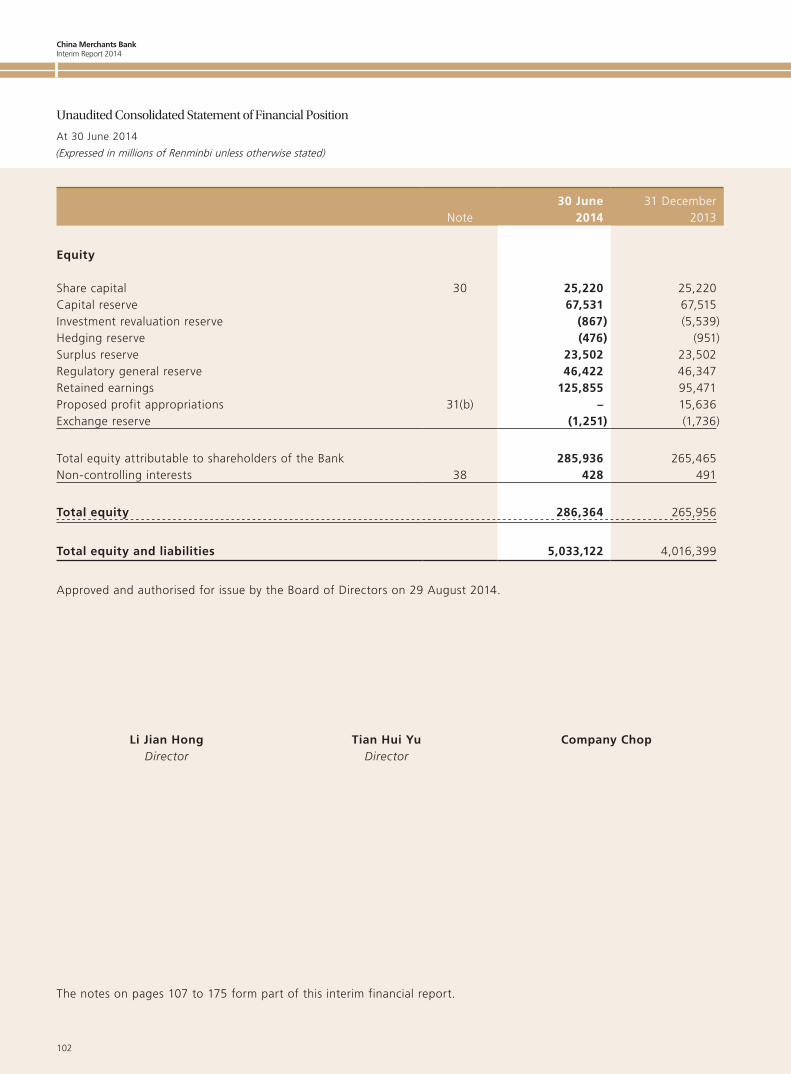
China Merchants BankInterim Report 2014
102
Unaudited Consolidated Statement of Financial Position
At 30 June 2014
(Expressed in millions of Renminbi unless otherwise stated)
Note30 June
201431 December
2013
Equity
Share capital 30 25,220 25,220Capital reserve 67,531 67,515Investment revaluation reserve (867) (5,539)Hedging reserve (476) (951)Surplus reserve 23,502 23,502Regulatory general reserve 46,422 46,347Retained earnings 125,855 95,471Proposed profit appropriations 31(b) – 15,636Exchange reserve (1,251) (1,736)
Total equity attributable to shareholders of the Bank 285,936 265,465Non-controlling interests 38 428 491
Total equity 286,364 265,956
Total equity and liabilities 5,033,122 4,016,399
Approved and authorised for issue by the Board of Directors on 29 August 2014.
Li Jian Hong Tian Hui Yu Company ChopDirector Director
The notes on pages 107 to 175 form part of this interim financial report.
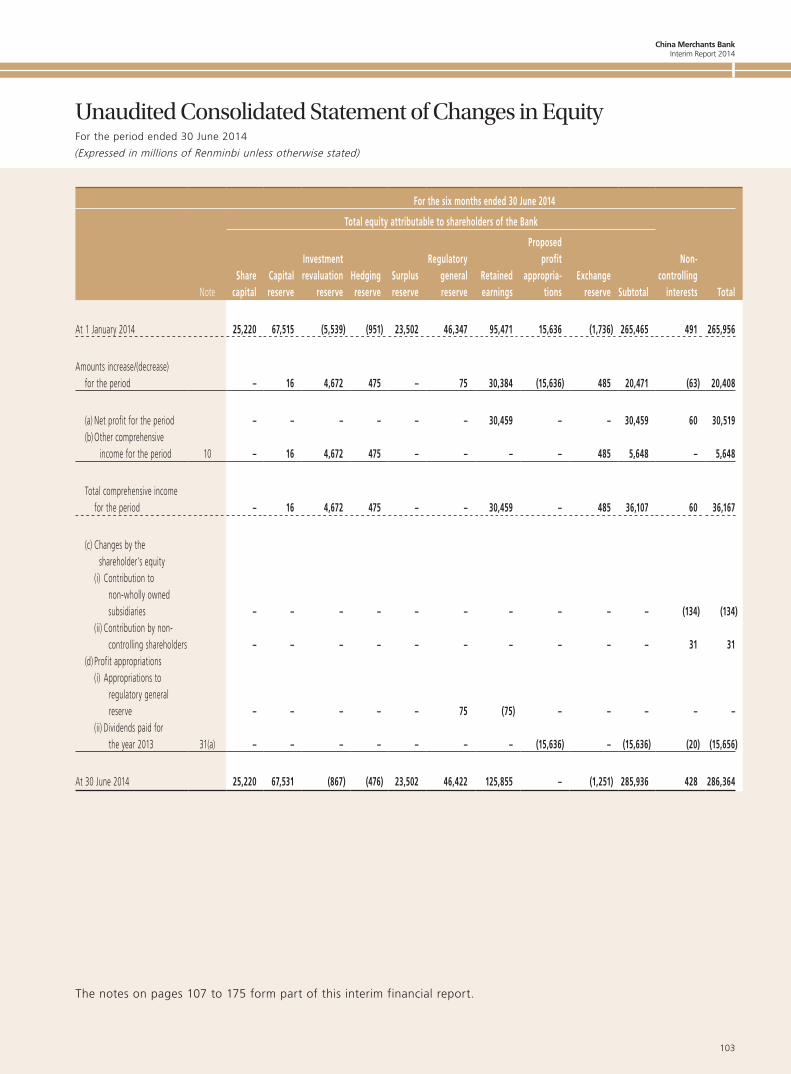
China Merchants BankInterim Report 2014
103
For the period ended 30 June 2014
(Expressed in millions of Renminbi unless otherwise stated)
Unaudited Consolidated Statement of Changes in Equity
For the six months ended 30 June 2014
Total equity attributable to shareholders of the Bank
Share CapitalInvestment revaluation Hedging Surplus
Regulatory general Retained
Proposed profit
appropria- ExchangeNon-
controllingNote capital reserve reserve reserve reserve reserve earnings tions reserve Subtotal interests Total
At 1 January 2014 25,220 67,515 (5,539) (951) 23,502 46,347 95,471 15,636 (1,736) 265,465 491 265,956
Amounts increase/(decrease) for the period – 16 4,672 475 – 75 30,384 (15,636) 485 20,471 (63) 20,408
(a) Net profit for the period – – – – – – 30,459 – – 30,459 60 30,519(b) O ther comprehensive
income for the period 10 – 16 4,672 475 – – – – 485 5,648 – 5,648
Total comprehensive income for the period – 16 4,672 475 – – 30,459 – 485 36,107 60 36,167
(c) C hanges by the shareholder’s equity
(i) C ontribution to non-wholly owned subsidiaries – – – – – – – – – – (134) (134)
(ii) C ontribution by non-controlling shareholders – – – – – – – – – – 31 31
(d) Profit appropriations(i) A ppropriations to
regulatory general reserve – – – – – 75 (75) – – – – –
(ii) D ividends paid for the year 2013 31(a) – – – – – – – (15,636) – (15,636) (20) (15,656)
At 30 June 2014 25,220 67,531 (867) (476) 23,502 46,422 125,855 – (1,251) 285,936 428 286,364
The notes on pages 107 to 175 form part of this interim financial report.
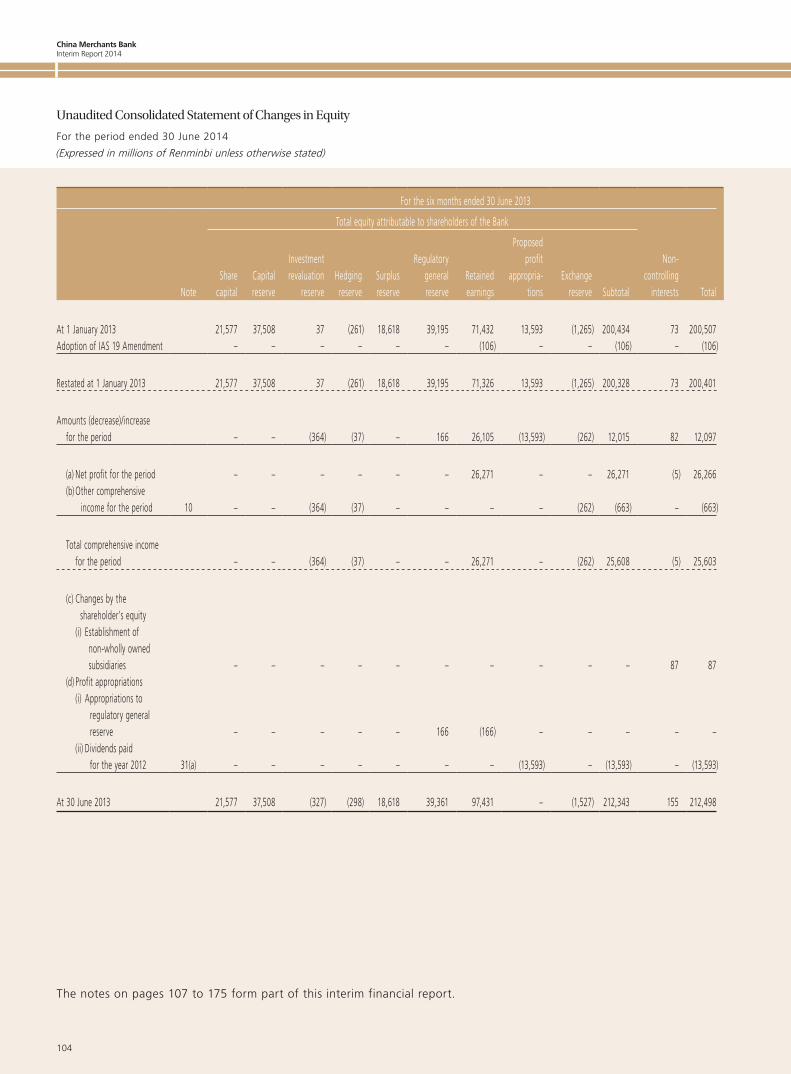
China Merchants BankInterim Report 2014
104
Unaudited Consolidated Statement of Changes in Equity
For the period ended 30 June 2014
(Expressed in millions of Renminbi unless otherwise stated)
For the six months ended 30 June 2013
Total equity attributable to shareholders of the Bank
Share CapitalInvestment revaluation Hedging Surplus
Regulatory general Retained
Proposed profit
appropria- ExchangeNon-
controllingNote capital reserve reserve reserve reserve reserve earnings tions reserve Subtotal interests Total
At 1 January 2013 21,577 37,508 37 (261) 18,618 39,195 71,432 13,593 (1,265) 200,434 73 200,507Adoption of IAS 19 Amendment – – – – – – (106) – – (106) – (106)
Restated at 1 January 2013 21,577 37,508 37 (261) 18,618 39,195 71,326 13,593 (1,265) 200,328 73 200,401
Amounts (decrease)/increase for the period – – (364) (37) – 166 26,105 (13,593) (262) 12,015 82 12,097
(a) Net profit for the period – – – – – – 26,271 – – 26,271 (5) 26,266(b) O ther comprehensive
income for the period 10 – – (364) (37) – – – – (262) (663) – (663)
Total comprehensive income for the period – – (364) (37) – – 26,271 – (262) 25,608 (5) 25,603
(c) C hanges by the shareholder’s equity
(i) E stablishment of non-wholly owned subsidiaries – – – – – – – – – – 87 87
(d) Profit appropriations(i) A ppropriations to
regulatory general reserve – – – – – 166 (166) – – – – –
(ii) D ividends paid for the year 2012 31(a) – – – – – – – (13,593) – (13,593) – (13,593)
At 30 June 2013 21,577 37,508 (327) (298) 18,618 39,361 97,431 – (1,527) 212,343 155 212,498
The notes on pages 107 to 175 form part of this interim financial report.
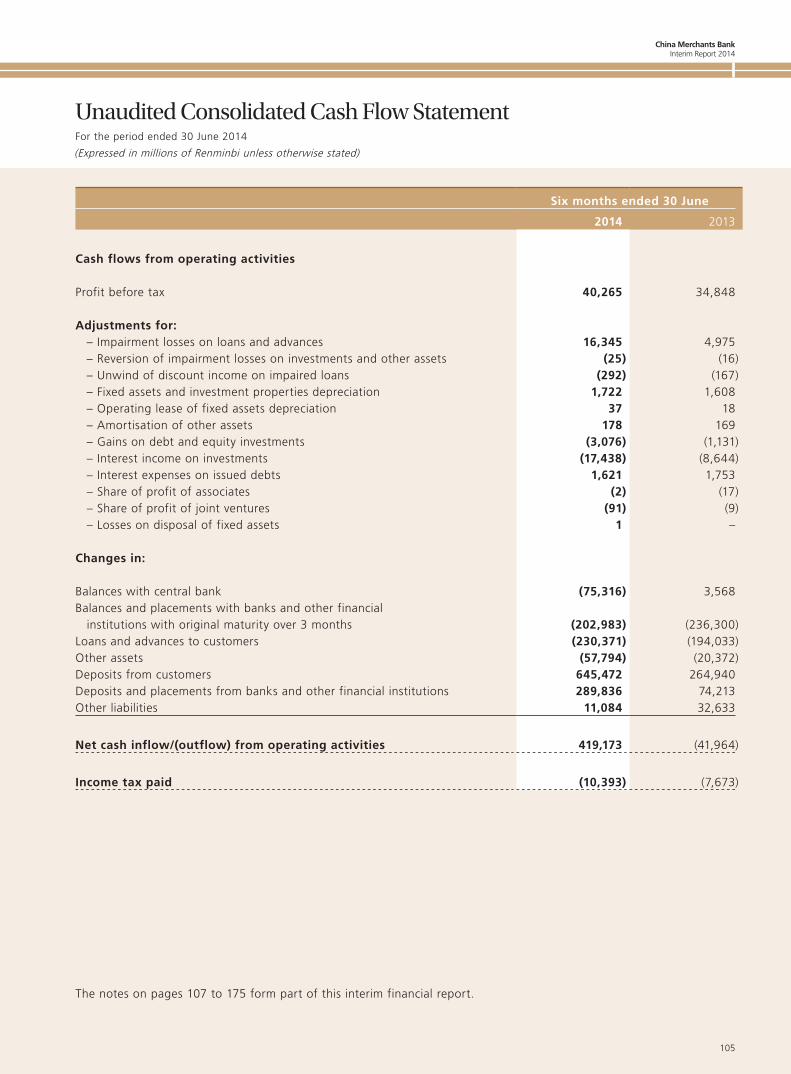
China Merchants BankInterim Report 2014
105
For the period ended 30 June 2014
(Expressed in millions of Renminbi unless otherwise stated)
Unaudited Consolidated Cash Flow Statement
The notes on pages 107 to 175 form part of this interim financial report.
Six months ended 30 June
2014 2013
Cash flows from operating activities
Profit before tax 40,265 34,848
Adjustments for:– Impairment losses on loans and advances 16,345 4,975– Reversion of impairment losses on investments and other assets (25) (16)– Unwind of discount income on impaired loans (292) (167)– Fixed assets and investment properties depreciation 1,722 1,608– Operating lease of fixed assets depreciation 37 18– Amortisation of other assets 178 169– Gains on debt and equity investments (3,076) (1,131)– Interest income on investments (17,438) (8,644)– Interest expenses on issued debts 1,621 1,753– Share of profit of associates (2) (17)– Share of profit of joint ventures (91) (9)– Losses on disposal of fixed assets 1 –
Changes in:
Balances with central bank (75,316) 3,568Balances and placements with banks and other financial
institutions with original maturity over 3 months (202,983) (236,300)Loans and advances to customers (230,371) (194,033)Other assets (57,794) (20,372)Deposits from customers 645,472 264,940Deposits and placements from banks and other financial institutions 289,836 74,213Other liabilities 11,084 32,633
Net cash inflow/(outflow) from operating activities 419,173 (41,964)
Income tax paid (10,393) (7,673)
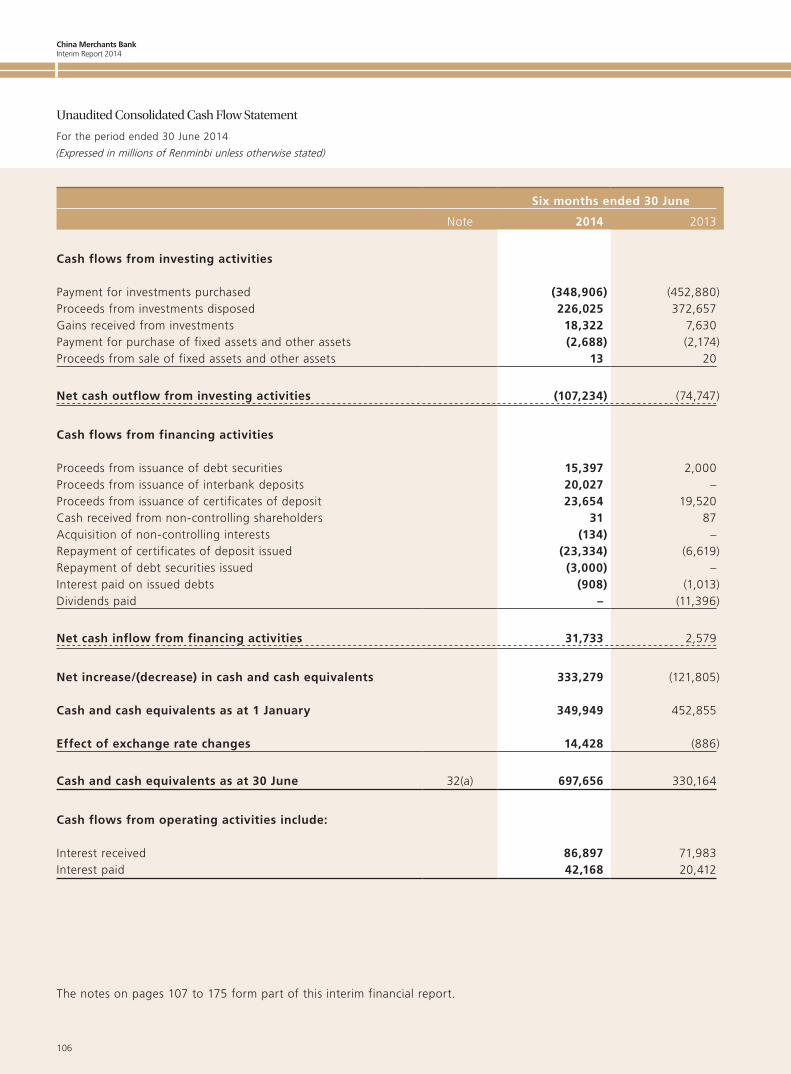
China Merchants BankInterim Report 2014
106
Unaudited Consolidated Cash Flow Statement
For the period ended 30 June 2014
(Expressed in millions of Renminbi unless otherwise stated)
The notes on pages 107 to 175 form part of this interim financial report.
Six months ended 30 June
Note 2014 2013
Cash flows from investing activities
Payment for investments purchased (348,906) (452,880)Proceeds from investments disposed 226,025 372,657Gains received from investments 18,322 7,630Payment for purchase of fixed assets and other assets (2,688) (2,174)Proceeds from sale of fixed assets and other assets 13 20
Net cash outflow from investing activities (107,234) (74,747)
Cash flows from financing activities
Proceeds from issuance of debt securities 15,397 2,000Proceeds from issuance of interbank deposits 20,027 –Proceeds from issuance of certificates of deposit 23,654 19,520Cash received from non-controlling shareholders 31 87Acquisition of non-controlling interests (134) –Repayment of certificates of deposit issued (23,334) (6,619)Repayment of debt securities issued (3,000) –Interest paid on issued debts (908) (1,013)Dividends paid – (11,396)
Net cash inflow from financing activities 31,733 2,579
Net increase/(decrease) in cash and cash equivalents 333,279 (121,805)
Cash and cash equivalents as at 1 January 349,949 452,855
Effect of exchange rate changes 14,428 (886)
Cash and cash equivalents as at 30 June 32(a) 697,656 330,164
Cash flows from operating activities include:
Interest received 86,897 71,983Interest paid 42,168 20,412
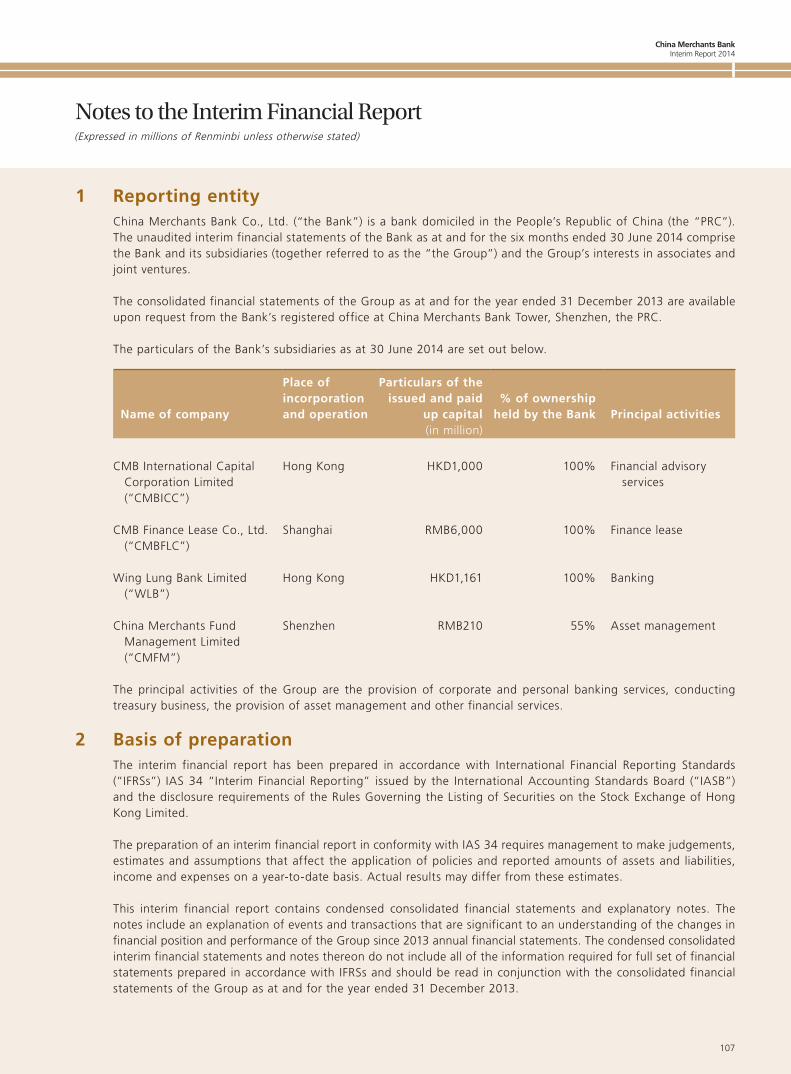
China Merchants BankInterim Report 2014
107
(Expressed in millions of Renminbi unless otherwise stated)
Notes to the Interim Financial Report
1 Reporting entityChina Merchants Bank Co., Ltd. (“the Bank”) is a bank domiciled in the People’s Republic of China (the “PRC”). The unaudited interim financial statements of the Bank as at and for the six months ended 30 June 2014 comprise the Bank and its subsidiaries (together referred to as the “the Group”) and the Group’s interests in associates and joint ventures.
The consolidated financial statements of the Group as at and for the year ended 31 December 2013 are available upon request from the Bank’s registered office at China Merchants Bank Tower, Shenzhen, the PRC.
The particulars of the Bank’s subsidiaries as at 30 June 2014 are set out below.
Name of company
Place of incorporation and operation
Particulars of the issued and paid
up capital% of ownership
held by the Bank Principal activities(in million)
CMB International Capital Corporation Limited (“CMBICC”)
Hong Kong HKD1,000 100% Financial advisory services
CMB Finance Lease Co., Ltd. (“CMBFLC”)
Shanghai RMB6,000 100% Finance lease
Wing Lung Bank Limited (“WLB”)
Hong Kong HKD1,161 100% Banking
China Merchants Fund Management Limited (“CMFM”)
Shenzhen RMB210 55% Asset management
The principal activities of the Group are the provision of corporate and personal banking services, conducting treasury business, the provision of asset management and other financial services.
2 Basis of preparationThe interim financial report has been prepared in accordance with International Financial Reporting Standards (“IFRSs”) IAS 34 “Interim Financial Reporting” issued by the International Accounting Standards Board (“IASB”) and the disclosure requirements of the Rules Governing the Listing of Securities on the Stock Exchange of Hong Kong Limited.
The preparation of an interim financial report in conformity with IAS 34 requires management to make judgements, estimates and assumptions that affect the application of policies and reported amounts of assets and liabilities, income and expenses on a year-to-date basis. Actual results may differ from these estimates.
This interim financial report contains condensed consolidated financial statements and explanatory notes. The notes include an explanation of events and transactions that are significant to an understanding of the changes in financial position and performance of the Group since 2013 annual financial statements. The condensed consolidated interim financial statements and notes thereon do not include all of the information required for full set of financial statements prepared in accordance with IFRSs and should be read in conjunction with the consolidated financial statements of the Group as at and for the year ended 31 December 2013.
China Merchants BankInterim Report 2014
108
Notes to the Interim Financial Report
(Expressed in millions of Renminbi unless otherwise stated)
2 Basis of preparation (continued)
The financial information relating to the financial year ended 31 December 2013 that is included in the interim financial report as being previously reported information does not constitute the Group’s statutory financial statements for that financial year. Statutory financial statements for the year ended 31 December 2013 are available from the Group’s registered office. The auditors have expressed an unqualified opinion on those financial statements in their report dated 28 March 2014.
This interim financial report is unaudited, but has been reviewed by the Audit Committee of the Bank. The interim financial report has also been reviewed by the Bank’s auditor, KPMG, in accordance with International Standard on Review Engagements 2410 “Review of Interim Financial Information Performed by the Independent Auditor of the Entity”.
Significant accounting policiesThe interim financial report has been prepared in accordance with the same accounting policies adopted in the 2013 annual financial statements, except for the adoption of the following amendments to IFRSs and one new Interpretation that are first effective for the current accounting period of the Group:
• Amendments to IFRS 10 – Consolidated Financial Statement, IFRS 12 – Disclosure of Interests in Other Entities and IAS 27 – Separate Financial Statements, Investment entities
The amendments provide consolidation relief to those parents which qualify to be an investment entity as defined in the amended IFRS 10. Investment entities are required to measure their subsidiaries at fair value through profit or loss. The adoption does not have any material impact on the Group’s financial statements.
• Amendments to IAS 32 – Financial Instrument: Presentation, Offsetting financial assets and financial liabilities
The amendments to IAS 32 clarify the offsetting criteria in IAS 32. The adoption does not have any material impact on the Group’s financial statements.
• Amendments to IAS 36 – Impairment of Assets, Recoverable amount disclosures for non-financial assets
The amendments to IAS 36 modify the disclosure requirements for impaired non-financial assets. Among them, the amendments expand the disclosures required for an impaired asset or CGU whose recoverable amount is based on fair value less costs of disposal. The adoption does not have any material impact on the Group’s financial statements.
• Amendments to IAS 39 – Financial Instruments: Recognition and Measurement, Novation of derivatives and continuation of hedge accounting
The amendments to IAS 39 provide relief from discontinuing hedge accounting when novation of a derivative designated as a hedging instrument meets certain criteria. The adoption does not have any material impact on the Group’s financial statements.
The Group has not applied any other new standard, interpretation or amendment that was issued but is not yet effective.
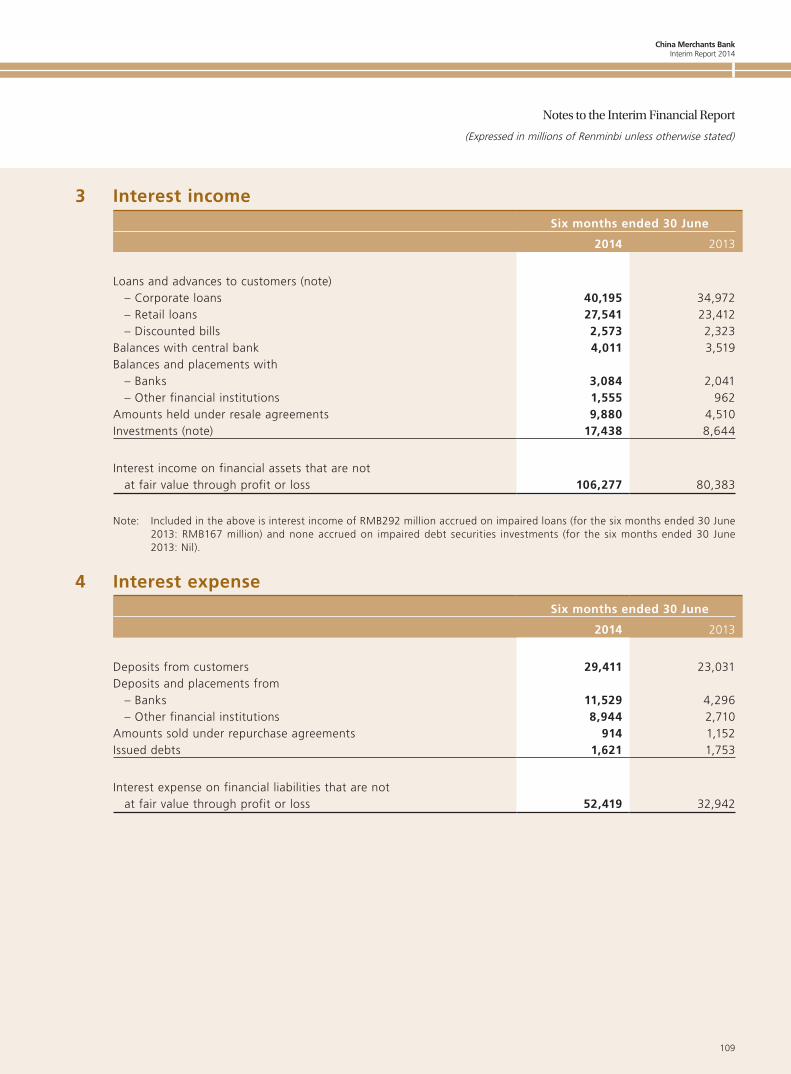
China Merchants BankInterim Report 2014
109
Notes to the Interim Financial Report
(Expressed in millions of Renminbi unless otherwise stated)
3 Interest incomeSix months ended 30 June
2014 2013
Loans and advances to customers (note)– Corporate loans 40,195 34,972– Retail loans 27,541 23,412– Discounted bills 2,573 2,323
Balances with central bank 4,011 3,519Balances and placements with
– Banks 3,084 2,041– Other financial institutions 1,555 962
Amounts held under resale agreements 9,880 4,510Investments (note) 17,438 8,644
Interest income on financial assets that are not at fair value through profit or loss 106,277 80,383
Note: Included in the above is interest income of RMB292 million accrued on impaired loans (for the six months ended 30 June 2013: RMB167 million) and none accrued on impaired debt securities investments (for the six months ended 30 June 2013: Nil).
4 Interest expenseSix months ended 30 June
2014 2013
Deposits from customers 29,411 23,031Deposits and placements from
– Banks 11,529 4,296– Other financial institutions 8,944 2,710
Amounts sold under repurchase agreements 914 1,152Issued debts 1,621 1,753
Interest expense on financial liabilities that are not at fair value through profit or loss 52,419 32,942
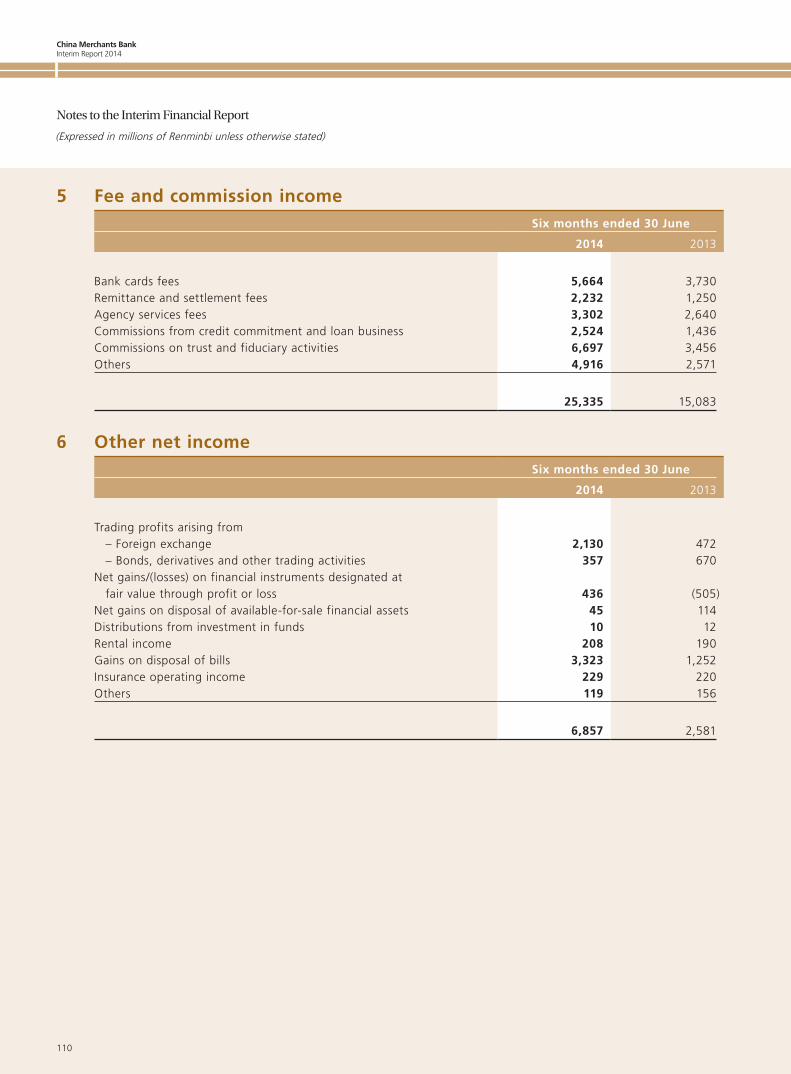
China Merchants BankInterim Report 2014
110
Notes to the Interim Financial Report
(Expressed in millions of Renminbi unless otherwise stated)
5 Fee and commission incomeSix months ended 30 June
2014 2013
Bank cards fees 5,664 3,730Remittance and settlement fees 2,232 1,250Agency services fees 3,302 2,640Commissions from credit commitment and loan business 2,524 1,436Commissions on trust and fiduciary activities 6,697 3,456Others 4,916 2,571
25,335 15,083
6 Other net incomeSix months ended 30 June
2014 2013
Trading profits arising from– Foreign exchange 2,130 472– Bonds, derivatives and other trading activities 357 670
Net gains/(losses) on financial instruments designated at fair value through profit or loss 436 (505)
Net gains on disposal of available-for-sale financial assets 45 114Distributions from investment in funds 10 12Rental income 208 190Gains on disposal of bills 3,323 1,252Insurance operating income 229 220Others 119 156
6,857 2,581
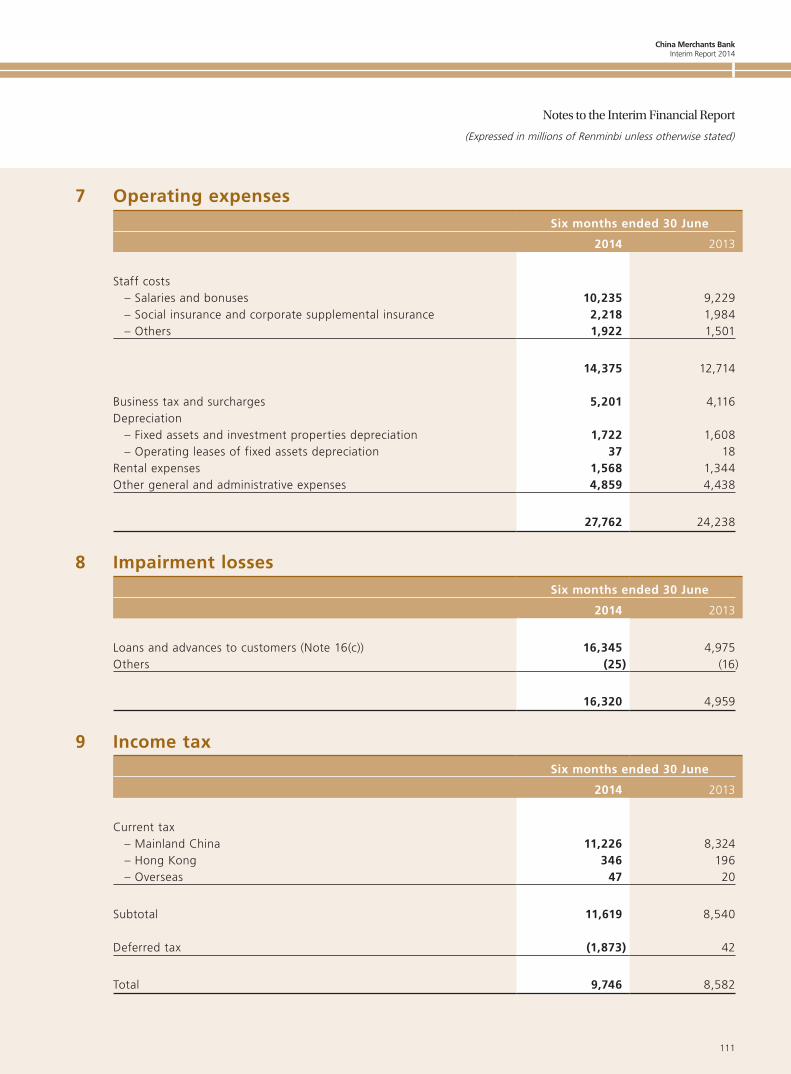
China Merchants BankInterim Report 2014
111
Notes to the Interim Financial Report
(Expressed in millions of Renminbi unless otherwise stated)
7 Operating expensesSix months ended 30 June
2014 2013
Staff costs– Salaries and bonuses 10,235 9,229– Social insurance and corporate supplemental insurance 2,218 1,984– Others 1,922 1,501
14,375 12,714
Business tax and surcharges 5,201 4,116Depreciation
– Fixed assets and investment properties depreciation 1,722 1,608– Operating leases of fixed assets depreciation 37 18
Rental expenses 1,568 1,344Other general and administrative expenses 4,859 4,438
27,762 24,238
8 Impairment lossesSix months ended 30 June
2014 2013
Loans and advances to customers (Note 16(c)) 16,345 4,975Others (25) (16)
16,320 4,959
9 Income taxSix months ended 30 June
2014 2013
Current tax– Mainland China 11,226 8,324– Hong Kong 346 196– Overseas 47 20
Subtotal 11,619 8,540
Deferred tax (1,873) 42
Total 9,746 8,582
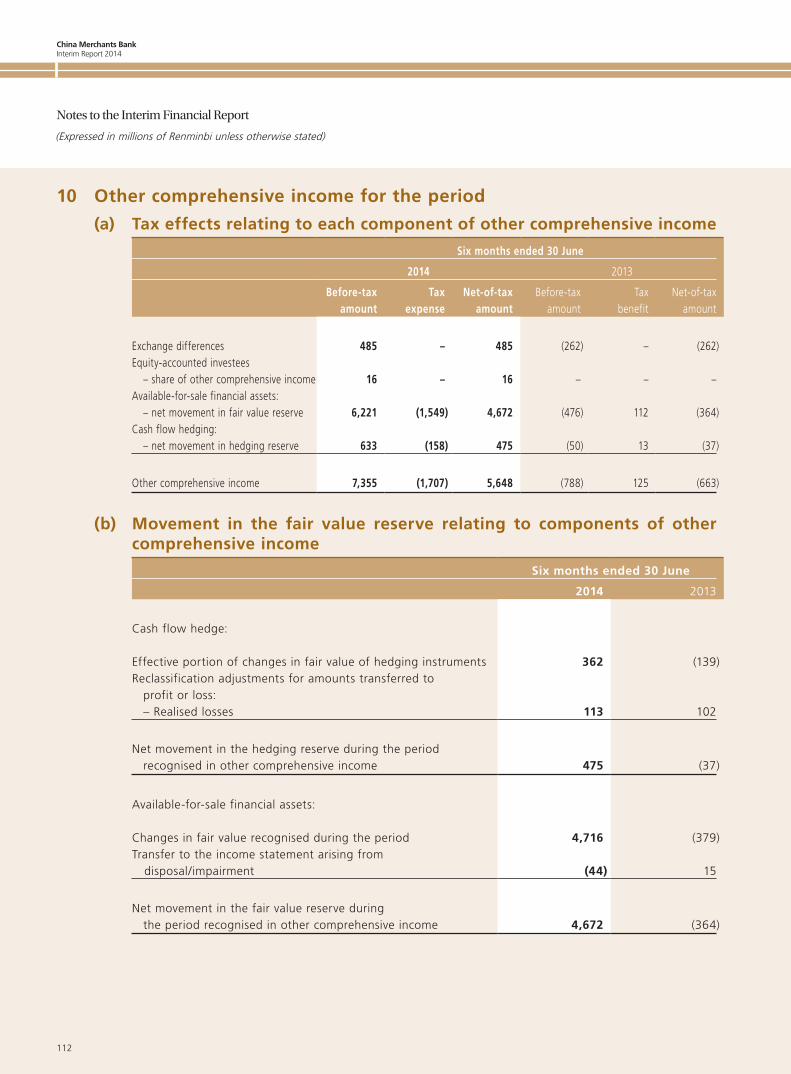
China Merchants BankInterim Report 2014
112
Notes to the Interim Financial Report
(Expressed in millions of Renminbi unless otherwise stated)
10 Other comprehensive income for the period
(a) Tax effects relating to each component of other comprehensive income
Six months ended 30 June
2014 2013
Before-tax amount
Tax expense
Net-of-tax amount
Before-tax amount
Tax benefit
Net-of-tax amount
Exchange differences 485 – 485 (262) – (262)Equity-accounted investees
– share of other comprehensive income 16 – 16 – – –Available-for-sale financial assets:
– net movement in fair value reserve 6,221 (1,549) 4,672 (476) 112 (364)Cash flow hedging:
– net movement in hedging reserve 633 (158) 475 (50) 13 (37)
Other comprehensive income 7,355 (1,707) 5,648 (788) 125 (663)
(b) Movement in the fair value reserve relating to components of other comprehensive income
Six months ended 30 June
2014 2013
Cash flow hedge:
Effective portion of changes in fair value of hedging instruments 362 (139)Reclassification adjustments for amounts transferred to
profit or loss:– Realised losses 113 102
Net movement in the hedging reserve during the period recognised in other comprehensive income 475 (37)
Available-for-sale financial assets:
Changes in fair value recognised during the period 4,716 (379)Transfer to the income statement arising from disposal/impairment (44) 15
Net movement in the fair value reserve during the period recognised in other comprehensive income 4,672 (364)
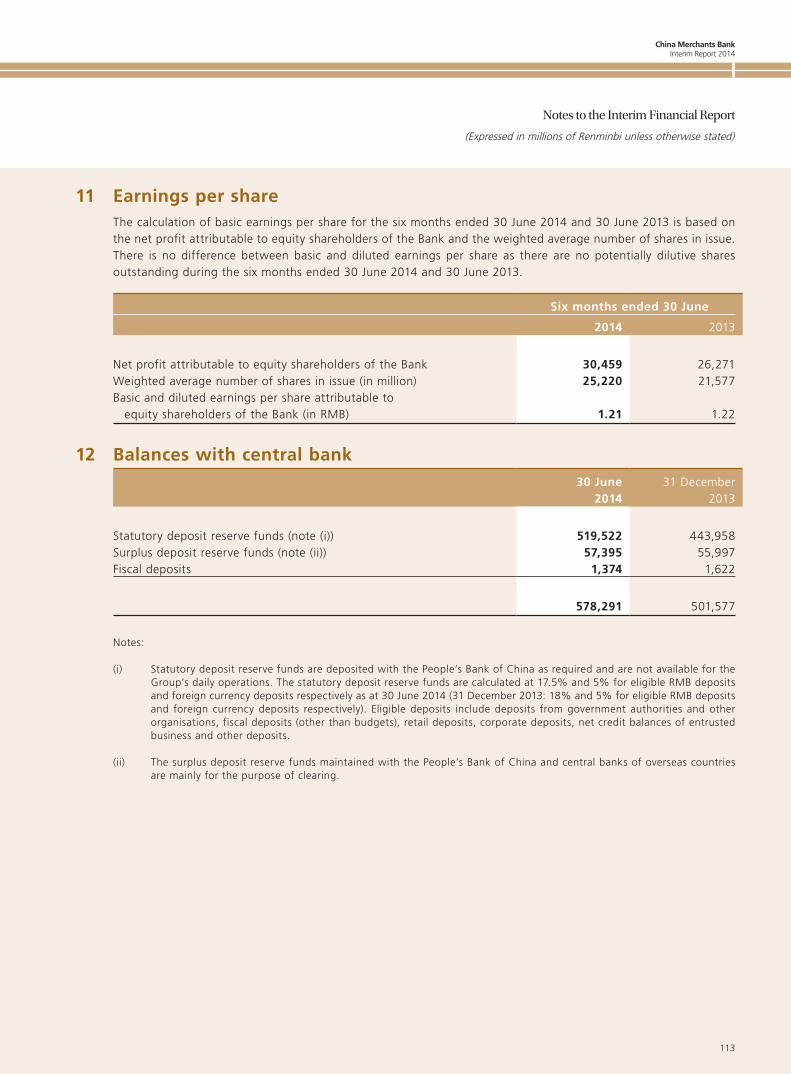
China Merchants BankInterim Report 2014
113
Notes to the Interim Financial Report
(Expressed in millions of Renminbi unless otherwise stated)
11 Earnings per shareThe calculation of basic earnings per share for the six months ended 30 June 2014 and 30 June 2013 is based on the net profit attributable to equity shareholders of the Bank and the weighted average number of shares in issue. There is no difference between basic and diluted earnings per share as there are no potentially dilutive shares outstanding during the six months ended 30 June 2014 and 30 June 2013.
Six months ended 30 June
2014 2013
Net profit attributable to equity shareholders of the Bank 30,459 26,271Weighted average number of shares in issue (in million) 25,220 21,577Basic and diluted earnings per share attributable to
equity shareholders of the Bank (in RMB) 1.21 1.22
12 Balances with central bank30 June
201431 December
2013
Statutory deposit reserve funds (note (i)) 519,522 443,958Surplus deposit reserve funds (note (ii)) 57,395 55,997Fiscal deposits 1,374 1,622
578,291 501,577
Notes:
(i) Statutory deposit reserve funds are deposited with the People’s Bank of China as required and are not available for the Group’s daily operations. The statutory deposit reserve funds are calculated at 17.5% and 5% for eligible RMB deposits and foreign currency deposits respectively as at 30 June 2014 (31 December 2013: 18% and 5% for eligible RMB deposits and foreign currency deposits respectively). Eligible deposits include deposits from government authorities and other organisations, fiscal deposits (other than budgets), retail deposits, corporate deposits, net credit balances of entrusted business and other deposits.
(ii) The surplus deposit reserve funds maintained with the People’s Bank of China and central banks of overseas countries are mainly for the purpose of clearing.
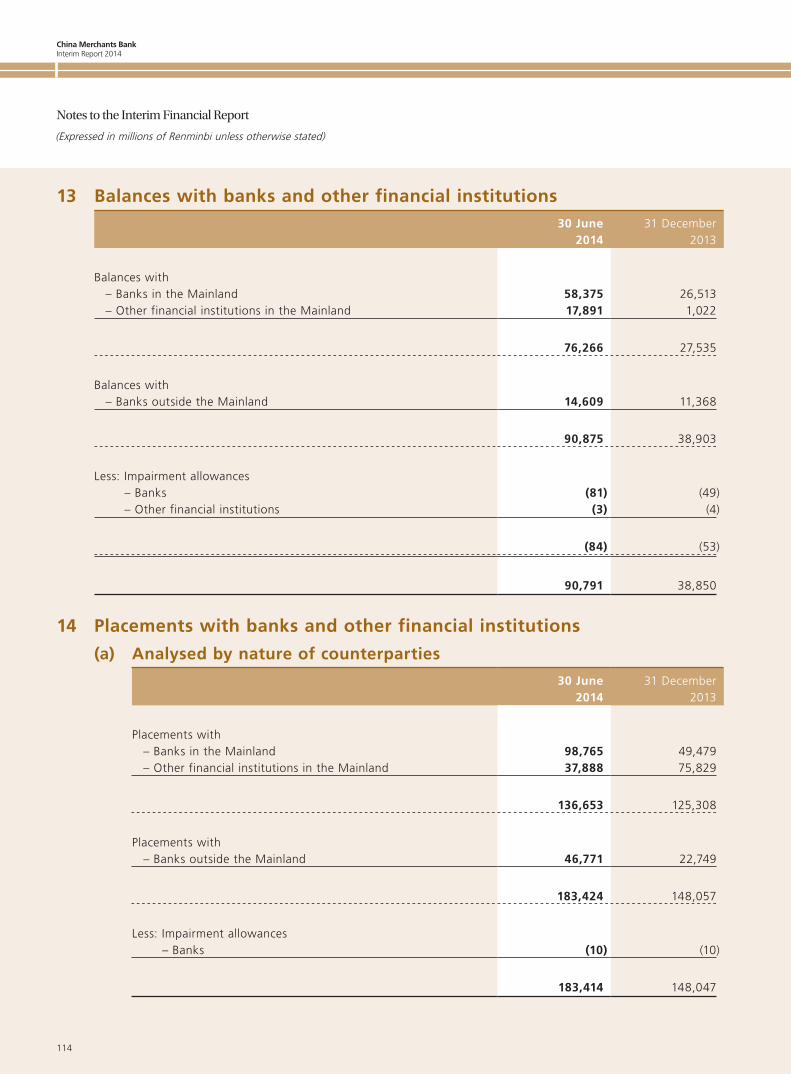
China Merchants BankInterim Report 2014
114
Notes to the Interim Financial Report
(Expressed in millions of Renminbi unless otherwise stated)
13 Balances with banks and other financial institutions30 June
201431 December
2013
Balances with– Banks in the Mainland 58,375 26,513– Other financial institutions in the Mainland 17,891 1,022
76,266 27,535
Balances with– Banks outside the Mainland 14,609 11,368
90,875 38,903
Less: Impairment allowances– Banks (81) (49)– Other financial institutions (3) (4)
(84) (53)
90,791 38,850
14 Placements with banks and other financial institutions
(a) Analysed by nature of counterparties
30 June2014
31 December2013
Placements with– Banks in the Mainland 98,765 49,479– Other financial institutions in the Mainland 37,888 75,829
136,653 125,308
Placements with– Banks outside the Mainland 46,771 22,749
183,424 148,057
Less: Impairment allowances– Banks (10) (10)
183,414 148,047
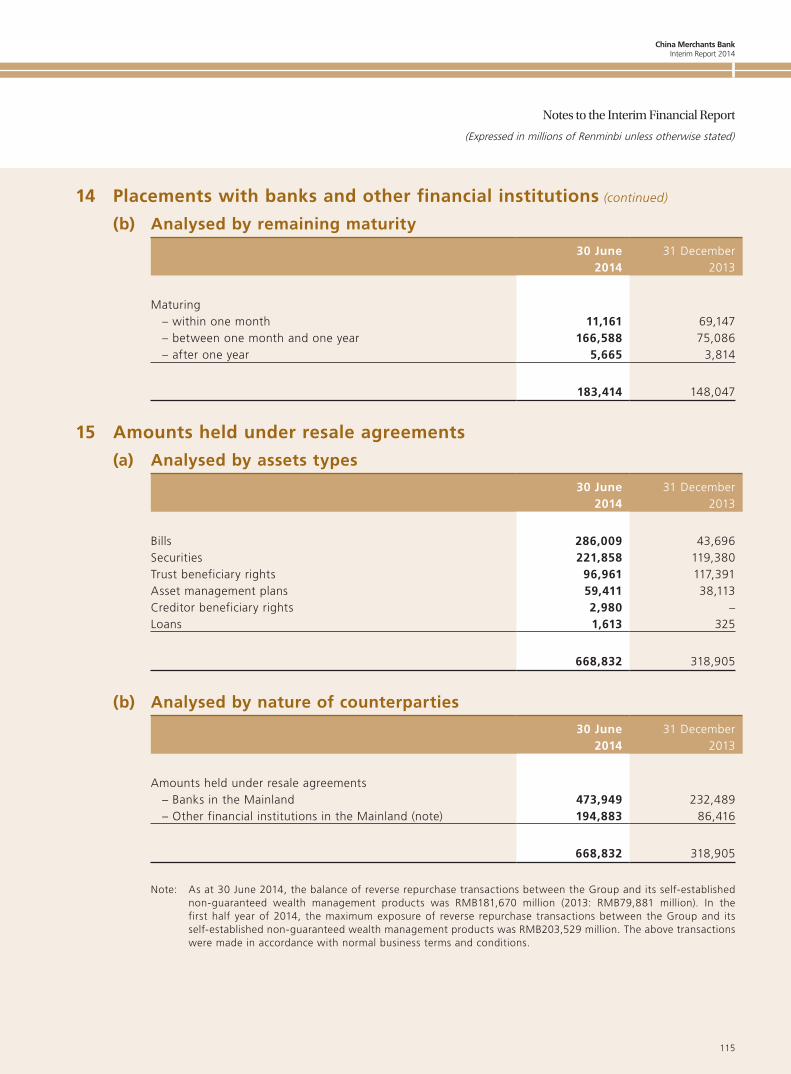
China Merchants BankInterim Report 2014
115
Notes to the Interim Financial Report
(Expressed in millions of Renminbi unless otherwise stated)
14 Placements with banks and other financial institutions (continued)
(b) Analysed by remaining maturity
30 June2014
31 December2013
Maturing– within one month 11,161 69,147– between one month and one year 166,588 75,086– after one year 5,665 3,814
183,414 148,047
15 Amounts held under resale agreements
(a) Analysed by assets types
30 June2014
31 December2013
Bills 286,009 43,696Securities 221,858 119,380Trust beneficiary rights 96,961 117,391Asset management plans 59,411 38,113Creditor beneficiary rights 2,980 –Loans 1,613 325
668,832 318,905
(b) Analysed by nature of counterparties
30 June2014
31 December2013
Amounts held under resale agreements– Banks in the Mainland 473,949 232,489– Other financial institutions in the Mainland (note) 194,883 86,416
668,832 318,905
Note: As at 30 June 2014, the balance of reverse repurchase transactions between the Group and its self-established non-guaranteed wealth management products was RMB181,670 million (2013: RMB79,881 million). In the first half year of 2014, the maximum exposure of reverse repurchase transactions between the Group and its self-established non-guaranteed wealth management products was RMB203,529 million. The above transactions were made in accordance with normal business terms and conditions.
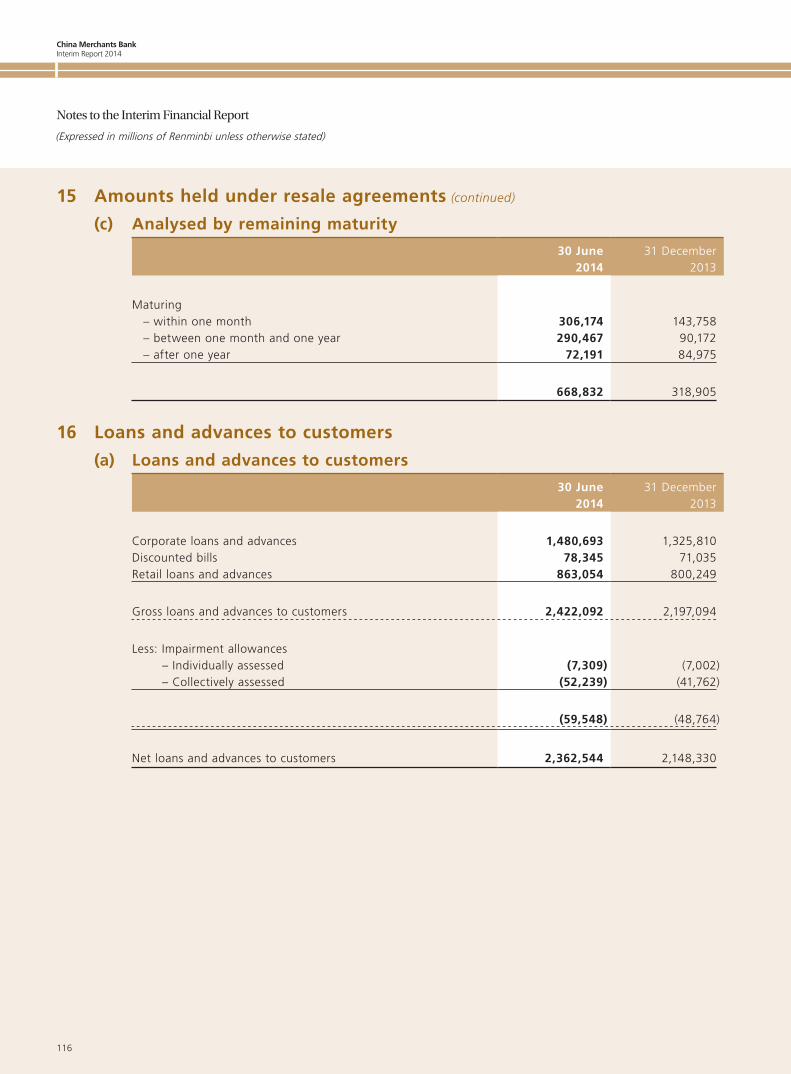
China Merchants BankInterim Report 2014
116
Notes to the Interim Financial Report
(Expressed in millions of Renminbi unless otherwise stated)
15 Amounts held under resale agreements (continued)
(c) Analysed by remaining maturity
30 June2014
31 December2013
Maturing– within one month 306,174 143,758– between one month and one year 290,467 90,172– after one year 72,191 84,975
668,832 318,905
16 Loans and advances to customers
(a) Loans and advances to customers
30 June2014
31 December2013
Corporate loans and advances 1,480,693 1,325,810Discounted bills 78,345 71,035Retail loans and advances 863,054 800,249
Gross loans and advances to customers 2,422,092 2,197,094
Less: Impairment allowances– Individually assessed (7,309) (7,002)– Collectively assessed (52,239) (41,762)
(59,548) (48,764)
Net loans and advances to customers 2,362,544 2,148,330
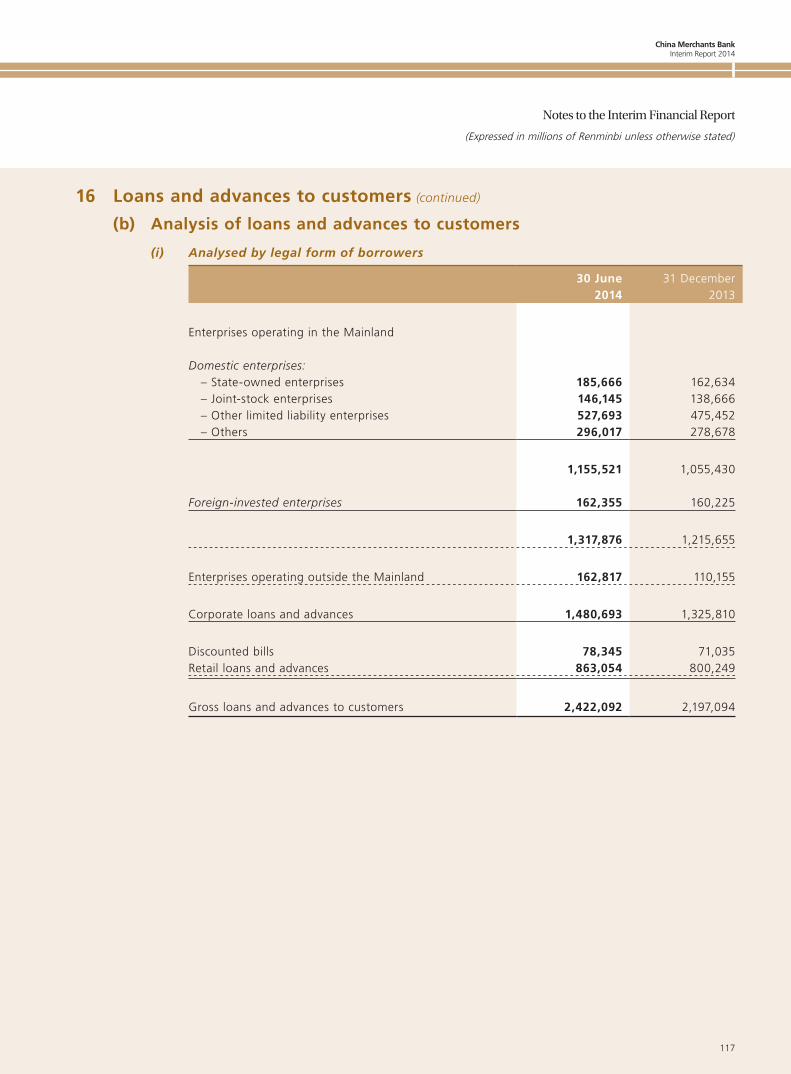
China Merchants BankInterim Report 2014
117
Notes to the Interim Financial Report
(Expressed in millions of Renminbi unless otherwise stated)
16 Loans and advances to customers (continued)
(b) Analysis of loans and advances to customers
(i) Analysed by legal form of borrowers
30 June2014
31 December2013
Enterprises operating in the Mainland
Domestic enterprises: – State-owned enterprises 185,666 162,634 – Joint-stock enterprises 146,145 138,666 – Other limited liability enterprises 527,693 475,452 – Others 296,017 278,678
1,155,521 1,055,430
Foreign-invested enterprises 162,355 160,225
1,317,876 1,215,655
Enterprises operating outside the Mainland 162,817 110,155
Corporate loans and advances 1,480,693 1,325,810
Discounted bills 78,345 71,035Retail loans and advances 863,054 800,249
Gross loans and advances to customers 2,422,092 2,197,094
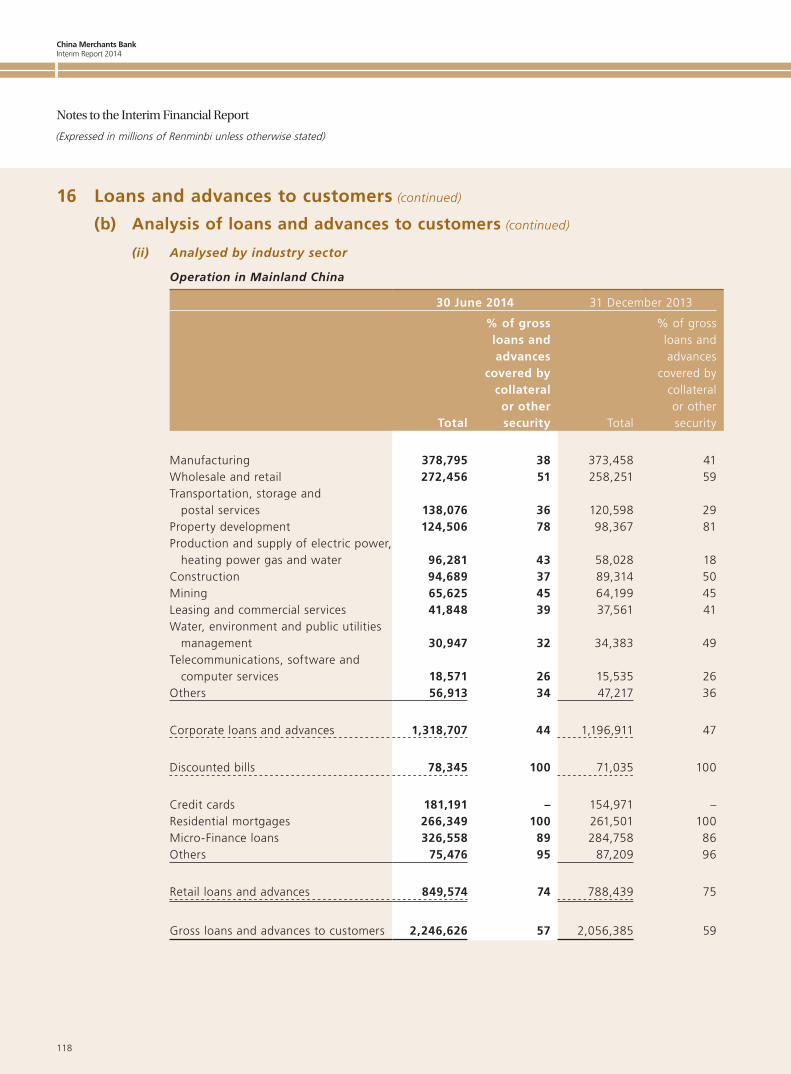
China Merchants BankInterim Report 2014
118
Notes to the Interim Financial Report
(Expressed in millions of Renminbi unless otherwise stated)
16 Loans and advances to customers (continued)
(b) Analysis of loans and advances to customers (continued)
(ii) Analysed by industry sector
Operation in Mainland China
30 June 2014 31 December 2013
Total
% of gross loans and advances
covered by collateral or other security Total
% of gross loans and advances
covered by collateral or other security
Manufacturing 378,795 38 373,458 41Wholesale and retail 272,456 51 258,251 59Transportation, storage and
postal services 138,076 36 120,598 29Property development 124,506 78 98,367 81Production and supply of electric power,
heating power gas and water 96,281 43 58,028 18Construction 94,689 37 89,314 50Mining 65,625 45 64,199 45Leasing and commercial services 41,848 39 37,561 41Water, environment and public utilities
management 30,947 32 34,383 49Telecommunications, software and
computer services 18,571 26 15,535 26Others 56,913 34 47,217 36
Corporate loans and advances 1,318,707 44 1,196,911 47
Discounted bills 78,345 100 71,035 100
Credit cards 181,191 – 154,971 –Residential mortgages 266,349 100 261,501 100Micro-Finance loans 326,558 89 284,758 86Others 75,476 95 87,209 96
Retail loans and advances 849,574 74 788,439 75
Gross loans and advances to customers 2,246,626 57 2,056,385 59
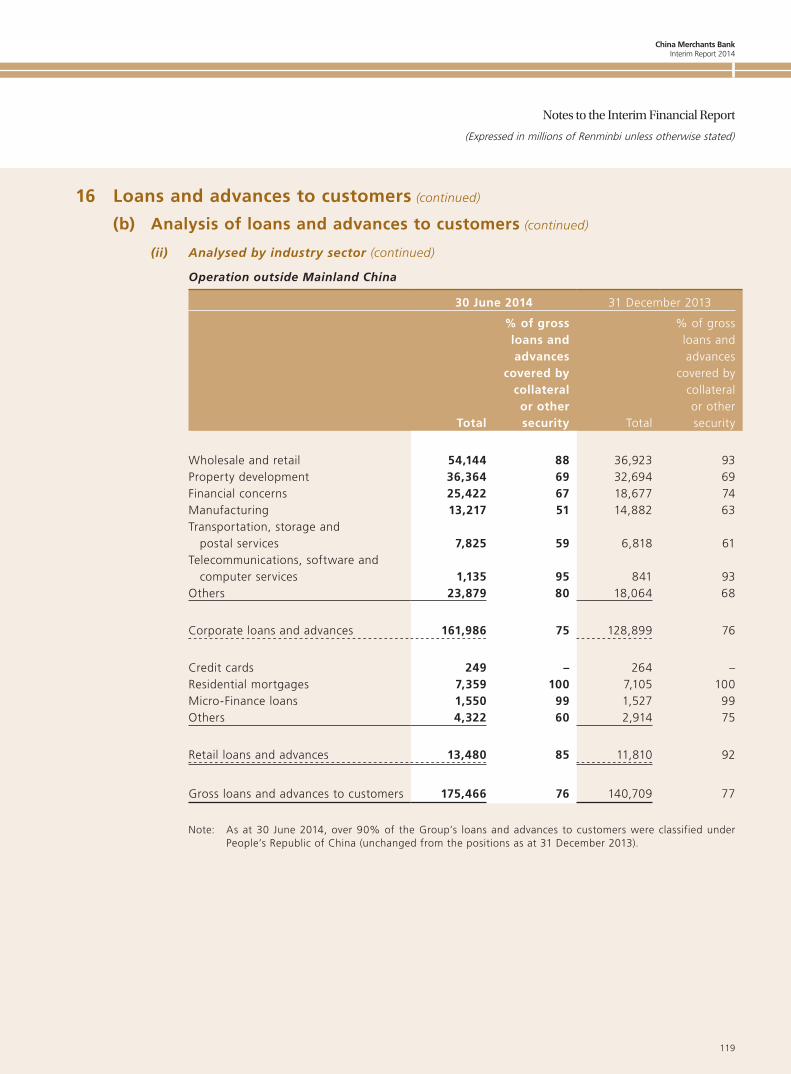
China Merchants BankInterim Report 2014
119
Notes to the Interim Financial Report
(Expressed in millions of Renminbi unless otherwise stated)
16 Loans and advances to customers (continued)
(b) Analysis of loans and advances to customers (continued)
(ii) Analysed by industry sector (continued)
Operation outside Mainland China
30 June 2014 31 December 2013
Total
% of gross loans and advances
covered by collateral or other security Total
% of gross loans and advances
covered by collateral or other security
Wholesale and retail 54,144 88 36,923 93Property development 36,364 69 32,694 69Financial concerns 25,422 67 18,677 74Manufacturing 13,217 51 14,882 63Transportation, storage and
postal services 7,825 59 6,818 61Telecommunications, software and
computer services 1,135 95 841 93Others 23,879 80 18,064 68
Corporate loans and advances 161,986 75 128,899 76
Credit cards 249 – 264 –Residential mortgages 7,359 100 7,105 100Micro-Finance loans 1,550 99 1,527 99Others 4,322 60 2,914 75
Retail loans and advances 13,480 85 11,810 92
Gross loans and advances to customers 175,466 76 140,709 77
Note: As at 30 June 2014, over 90% of the Group’s loans and advances to customers were classified under People’s Republic of China (unchanged from the positions as at 31 December 2013).
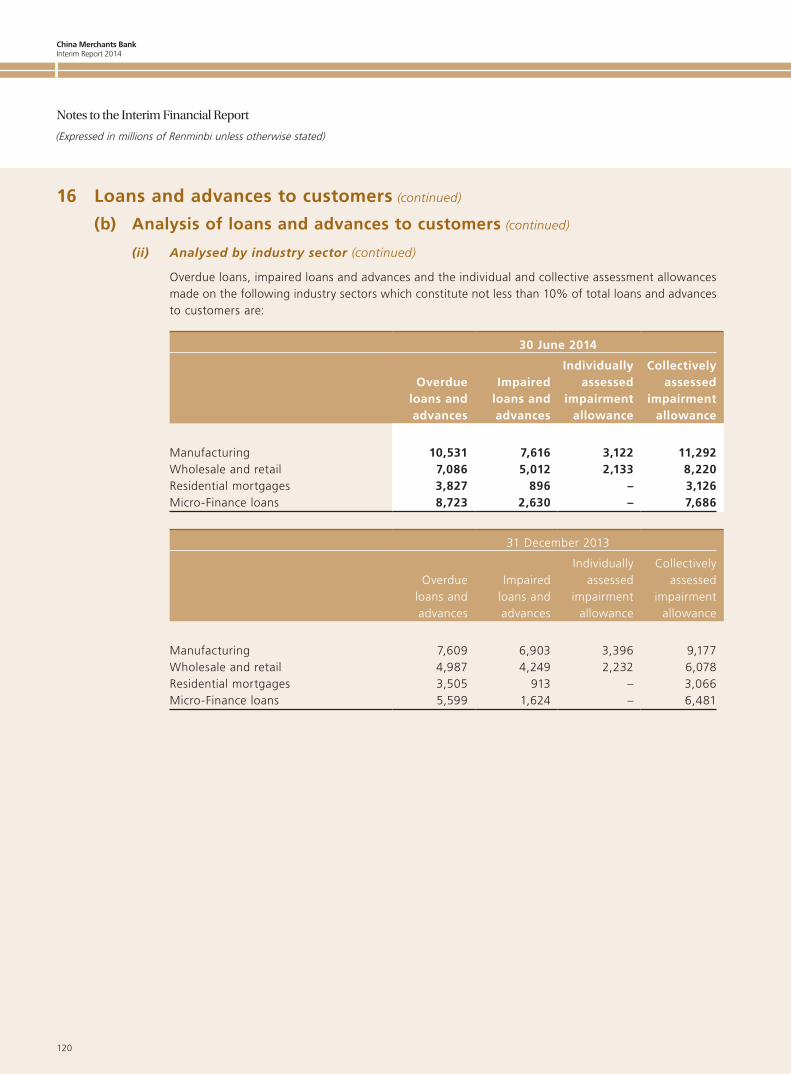
China Merchants BankInterim Report 2014
120
Notes to the Interim Financial Report
(Expressed in millions of Renminbi unless otherwise stated)
16 Loans and advances to customers (continued)
(b) Analysis of loans and advances to customers (continued)
(ii) Analysed by industry sector (continued)
Overdue loans, impaired loans and advances and the individual and collective assessment allowances made on the following industry sectors which constitute not less than 10% of total loans and advances to customers are:
30 June 2014
Overdueloans andadvances
Impairedloans andadvances
Individuallyassessed
impairmentallowance
Collectivelyassessed
impairmentallowance
Manufacturing 10,531 7,616 3,122 11,292Wholesale and retail 7,086 5,012 2,133 8,220Residential mortgages 3,827 896 – 3,126Micro-Finance loans 8,723 2,630 – 7,686
31 December 2013
Overdueloans andadvances
Impairedloans andadvances
Individuallyassessed
impairmentallowance
Collectivelyassessed
impairmentallowance
Manufacturing 7,609 6,903 3,396 9,177Wholesale and retail 4,987 4,249 2,232 6,078Residential mortgages 3,505 913 – 3,066Micro-Finance loans 5,599 1,624 – 6,481
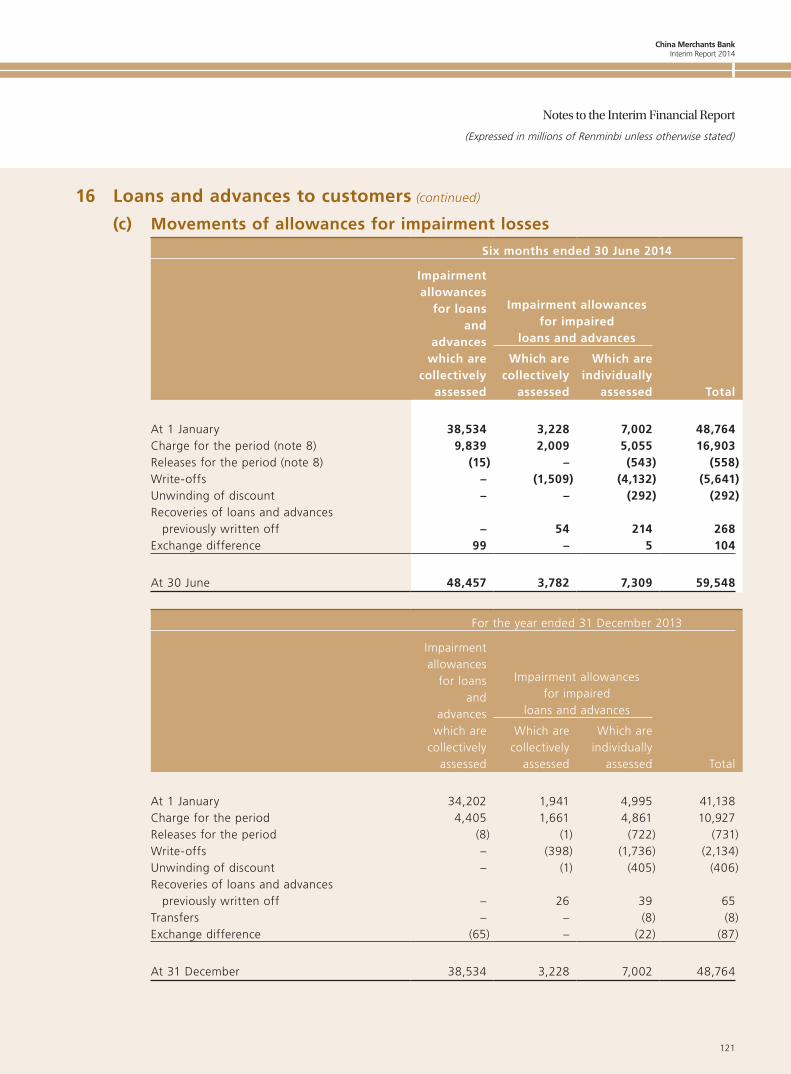
China Merchants BankInterim Report 2014
121
Notes to the Interim Financial Report
(Expressed in millions of Renminbi unless otherwise stated)
16 Loans and advances to customers (continued)
(c) Movements of allowances for impairment losses
Six months ended 30 June 2014
Impairment allowances
for loans and
advances which are
collectively assessed
Impairment allowances for impaired
loans and advances
Total
Which are collectively
assessed
Which are individually
assessed
At 1 January 38,534 3,228 7,002 48,764Charge for the period (note 8) 9,839 2,009 5,055 16,903Releases for the period (note 8) (15) – (543) (558)Write-offs – (1,509) (4,132) (5,641)Unwinding of discount – – (292) (292)Recoveries of loans and advances
previously written off – 54 214 268Exchange difference 99 – 5 104
At 30 June 48,457 3,782 7,309 59,548
For the year ended 31 December 2013
Impairment allowances
for loans and
advances which are
collectively assessed
Impairment allowances for impaired
loans and advances
Total
Which are collectively
assessed
Which are individually
assessed
At 1 January 34,202 1,941 4,995 41,138Charge for the period 4,405 1,661 4,861 10,927Releases for the period (8) (1) (722) (731)Write-offs – (398) (1,736) (2,134)Unwinding of discount – (1) (405) (406)Recoveries of loans and advances
previously written off – 26 39 65Transfers – – (8) (8)Exchange difference (65) – (22) (87)
At 31 December 38,534 3,228 7,002 48,764
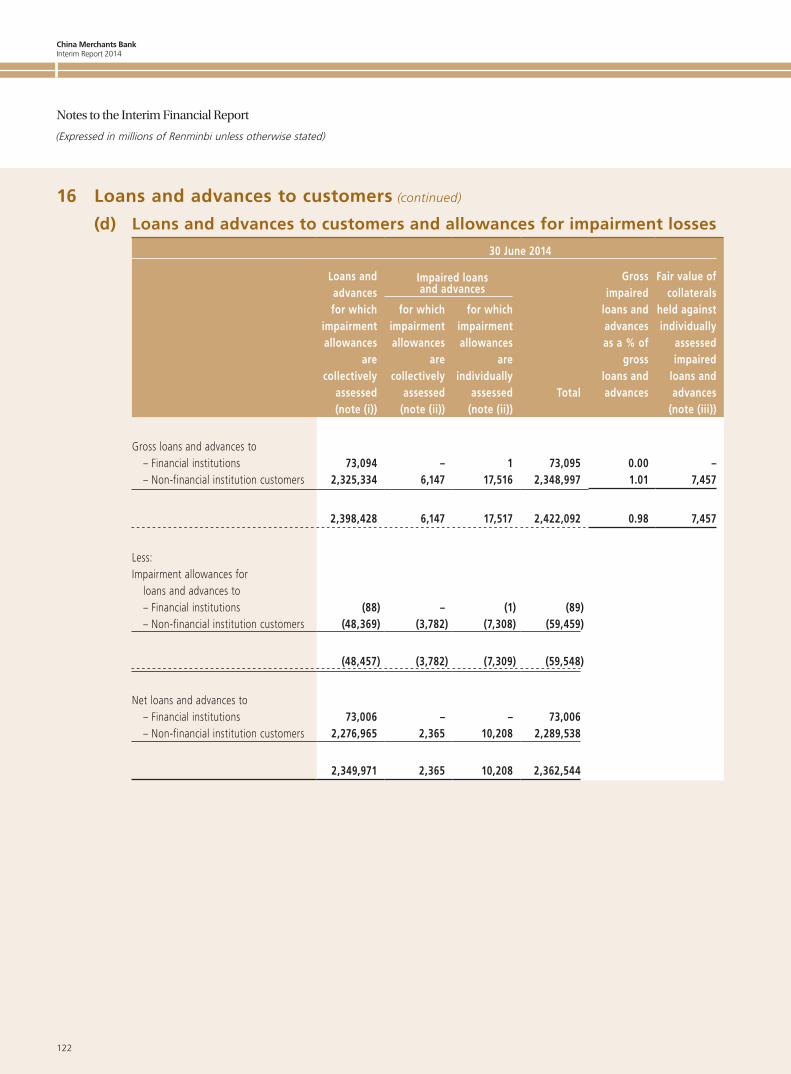
China Merchants BankInterim Report 2014
122
Notes to the Interim Financial Report
(Expressed in millions of Renminbi unless otherwise stated)
16 Loans and advances to customers (continued)
(d) Loans and advances to customers and allowances for impairment losses
30 June 2014
Loans and advances for which
impairment allowances
are collectively
assessed
Impaired loans and advances
Total
Gross impaired
loans and advances as a % of
gross loans and advances
Fair value of collaterals
held against individually
assessed impaired
loans and advances
for which impairment allowances
are collectively
assessed
for which impairment allowances
are individually
assessed(note (i)) (note (ii)) (note (ii)) (note (iii))
Gross loans and advances to– Financial institutions 73,094 – 1 73,095 0.00 –– Non-financial institution customers 2,325,334 6,147 17,516 2,348,997 1.01 7,457
2,398,428 6,147 17,517 2,422,092 0.98 7,457
Less:Impairment allowances for
loans and advances to– Financial institutions (88) – (1) (89)– Non-financial institution customers (48,369) (3,782) (7,308) (59,459)
(48,457) (3,782) (7,309) (59,548)
Net loans and advances to– Financial institutions 73,006 – – 73,006– Non-financial institution customers 2,276,965 2,365 10,208 2,289,538
2,349,971 2,365 10,208 2,362,544
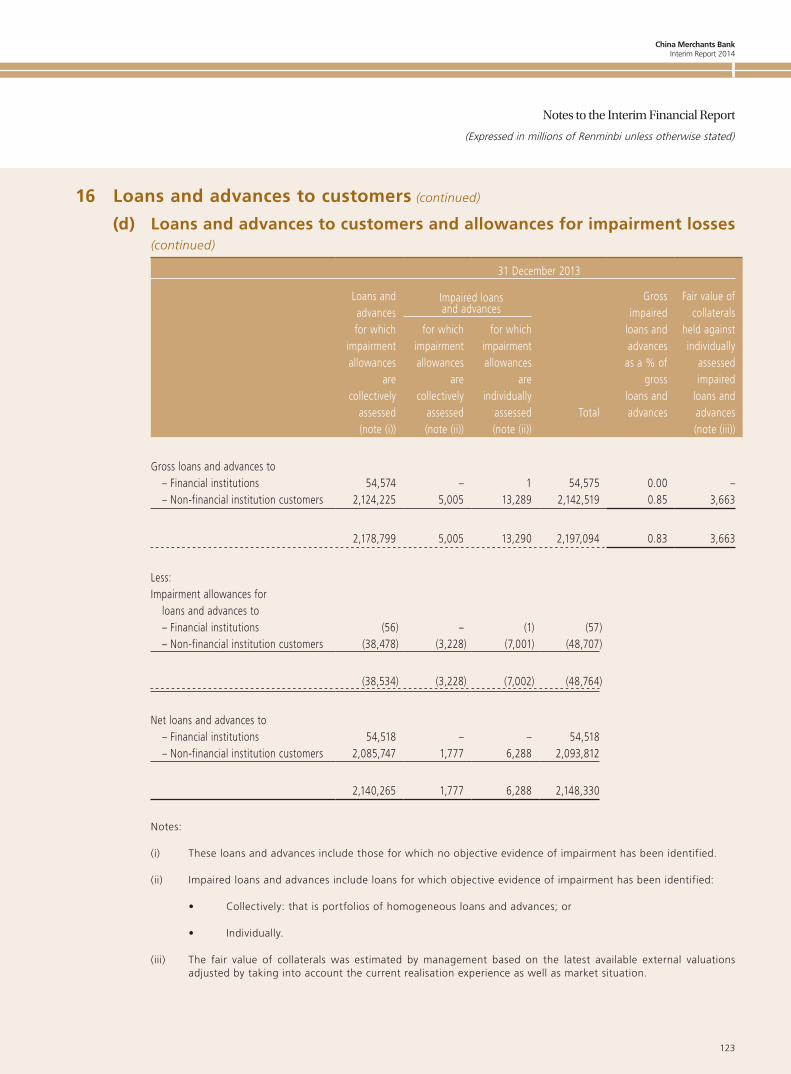
China Merchants BankInterim Report 2014
123
Notes to the Interim Financial Report
(Expressed in millions of Renminbi unless otherwise stated)
16 Loans and advances to customers (continued)
(d) Loans and advances to customers and allowances for impairment losses
(continued)
31 December 2013
Loans and advances for which
impairment allowances
are collectively
assessed
Impaired loans and advances
Total
Gross impaired
loans and advances
as a % of gross
loans and advances
Fair value of collaterals
held against individually
assessed impaired
loans and advances
for which impairment allowances
are collectively
assessed
for which impairment allowances
are individually
assessed(note (i)) (note (ii)) (note (ii)) (note (iii))
Gross loans and advances to– Financial institutions 54,574 – 1 54,575 0.00 –– Non-financial institution customers 2,124,225 5,005 13,289 2,142,519 0.85 3,663
2,178,799 5,005 13,290 2,197,094 0.83 3,663
Less:Impairment allowances for
loans and advances to– Financial institutions (56) – (1) (57)– Non-financial institution customers (38,478) (3,228) (7,001) (48,707)
(38,534) (3,228) (7,002) (48,764)
Net loans and advances to– Financial institutions 54,518 – – 54,518– Non-financial institution customers 2,085,747 1,777 6,288 2,093,812
2,140,265 1,777 6,288 2,148,330
Notes:
(i) These loans and advances include those for which no objective evidence of impairment has been identified.
(ii) Impaired loans and advances include loans for which objective evidence of impairment has been identified:
• Collectively: that is portfolios of homogeneous loans and advances; or
• Individually.
(iii) The fair value of collaterals was estimated by management based on the latest available external valuations adjusted by taking into account the current realisation experience as well as market situation.
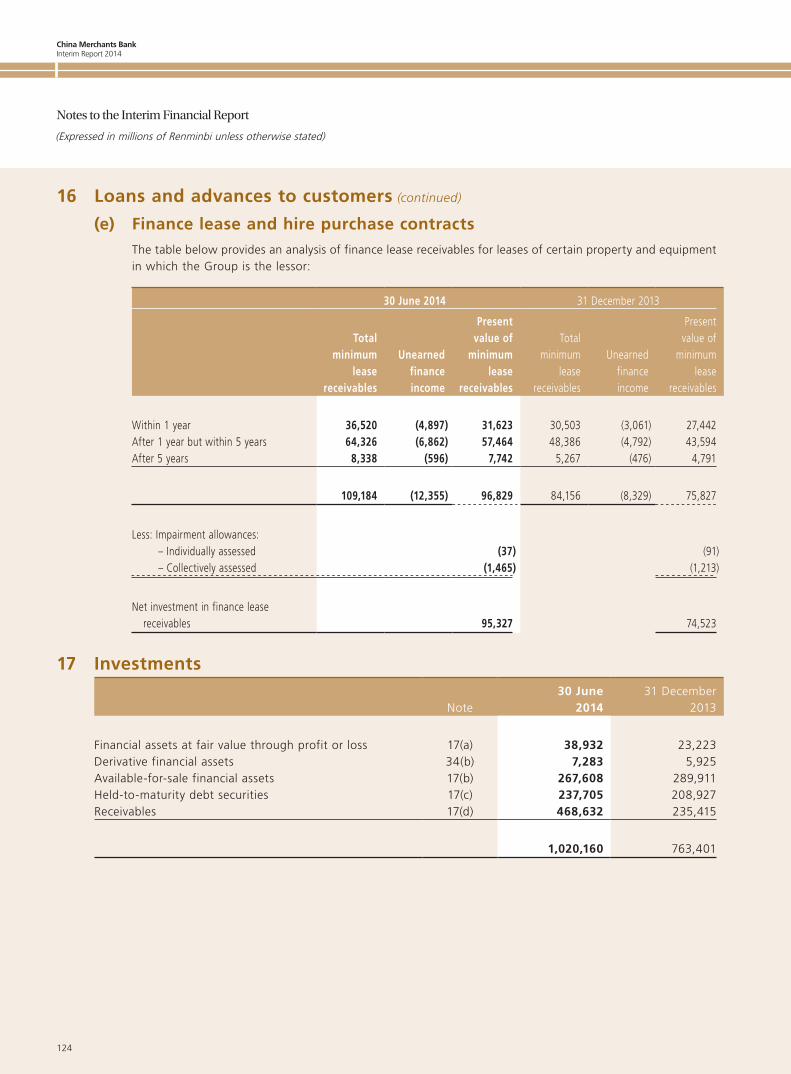
China Merchants BankInterim Report 2014
124
Notes to the Interim Financial Report
(Expressed in millions of Renminbi unless otherwise stated)
16 Loans and advances to customers (continued)
(e) Finance lease and hire purchase contractsThe table below provides an analysis of finance lease receivables for leases of certain property and equipment in which the Group is the lessor:
30 June 2014 31 December 2013
Totalminimum
leasereceivables
Unearnedfinanceincome
Presentvalue of
minimum lease
receivables
Totalminimum
leasereceivables
Unearnedfinanceincome
Presentvalue of
minimum lease
receivables
Within 1 year 36,520 (4,897) 31,623 30,503 (3,061) 27,442After 1 year but within 5 years 64,326 (6,862) 57,464 48,386 (4,792) 43,594After 5 years 8,338 (596) 7,742 5,267 (476) 4,791
109,184 (12,355) 96,829 84,156 (8,329) 75,827
Less: Impairment allowances:– Individually assessed (37) (91)– Collectively assessed (1,465) (1,213)
Net investment in finance lease receivables 95,327 74,523
17 Investments
Note30 June
201431 December
2013
Financial assets at fair value through profit or loss 17(a) 38,932 23,223Derivative financial assets 34(b) 7,283 5,925Available-for-sale financial assets 17(b) 267,608 289,911Held-to-maturity debt securities 17(c) 237,705 208,927Receivables 17(d) 468,632 235,415
1,020,160 763,401
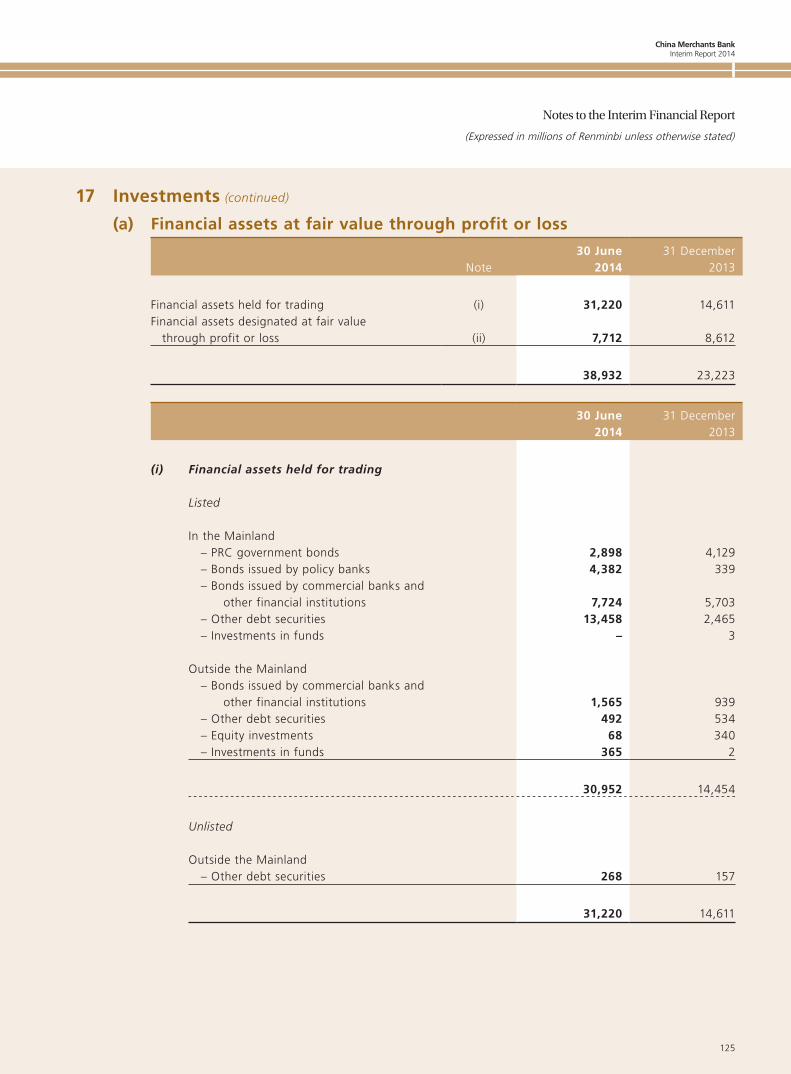
China Merchants BankInterim Report 2014
125
Notes to the Interim Financial Report
(Expressed in millions of Renminbi unless otherwise stated)
17 Investments (continued)
(a) Financial assets at fair value through profit or loss
Note30 June
201431 December
2013
Financial assets held for trading (i) 31,220 14,611Financial assets designated at fair value
through profit or loss (ii) 7,712 8,612
38,932 23,223
30 June2014
31 December2013
(i) Financial assets held for trading
Listed
In the Mainland – PRC government bonds 2,898 4,129 – Bonds issued by policy banks 4,382 339 – Bonds issued by commercial banks and
other financial institutions 7,724 5,703 – Other debt securities 13,458 2,465 – Investments in funds – 3
Outside the Mainland – Bonds issued by commercial banks and
other financial institutions 1,565 939 – Other debt securities 492 534 – Equity investments 68 340 – Investments in funds 365 2
30,952 14,454
Unlisted
Outside the Mainland – Other debt securities 268 157
31,220 14,611
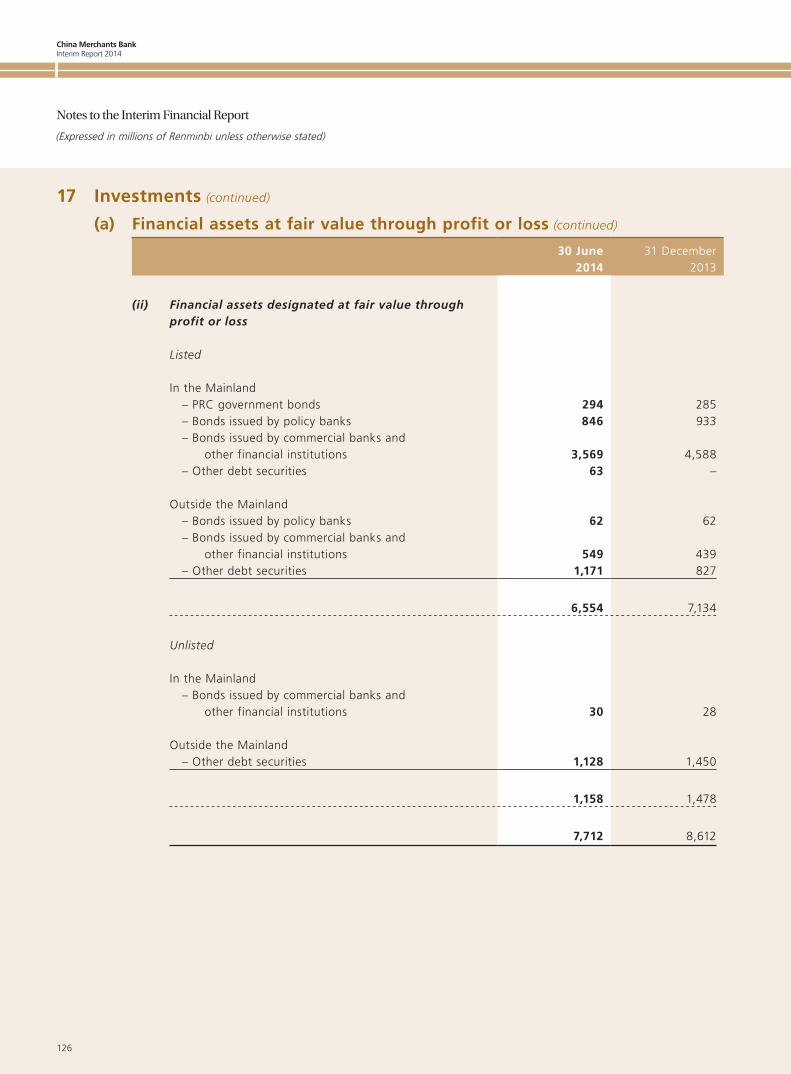
China Merchants BankInterim Report 2014
126
Notes to the Interim Financial Report
(Expressed in millions of Renminbi unless otherwise stated)
17 Investments (continued)
(a) Financial assets at fair value through profit or loss (continued)
30 June2014
31 December2013
(ii) Financial assets designated at fair value through profit or loss
Listed
In the Mainland – PRC government bonds 294 285 – Bonds issued by policy banks 846 933 – Bonds issued by commercial banks and
other financial institutions 3,569 4,588 – Other debt securities 63 –
Outside the Mainland – Bonds issued by policy banks 62 62 – Bonds issued by commercial banks and
other financial institutions 549 439 – Other debt securities 1,171 827
6,554 7,134
Unlisted
In the Mainland – Bonds issued by commercial banks and
other financial institutions 30 28
Outside the Mainland – Other debt securities 1,128 1,450
1,158 1,478
7,712 8,612
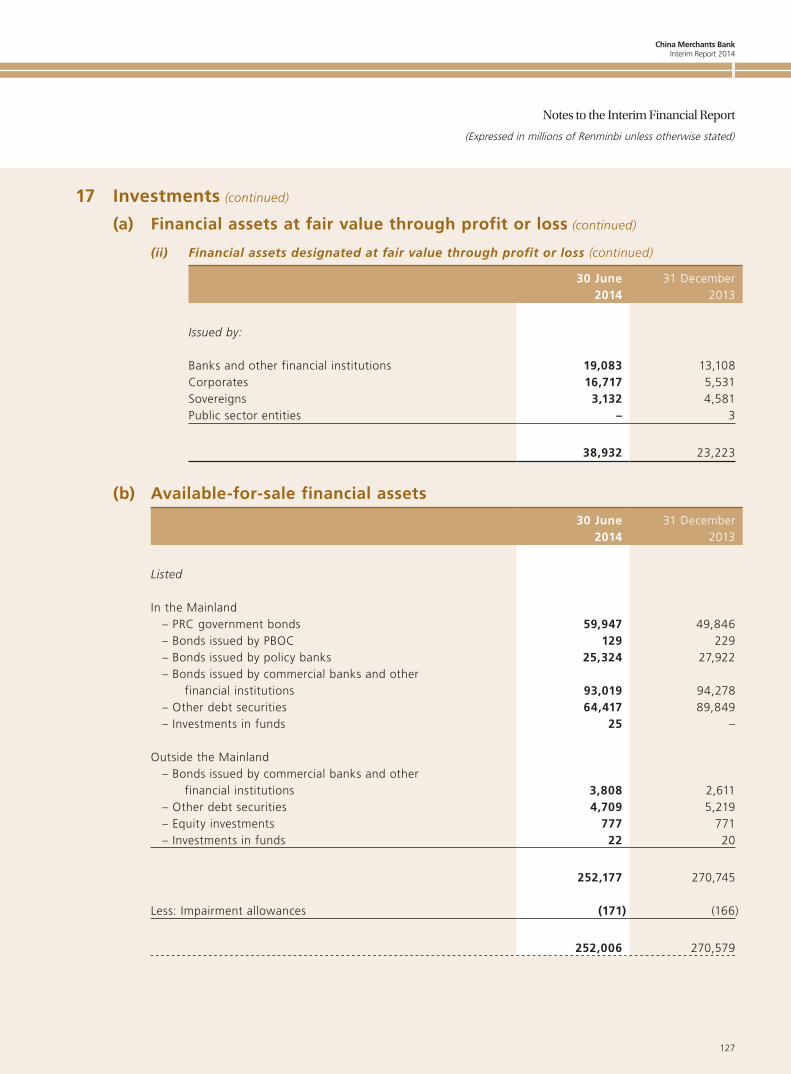
China Merchants BankInterim Report 2014
127
Notes to the Interim Financial Report
(Expressed in millions of Renminbi unless otherwise stated)
17 Investments (continued)
(a) Financial assets at fair value through profit or loss (continued)
(ii) Financial assets designated at fair value through profit or loss (continued)
30 June2014
31 December2013
Issued by:
Banks and other financial institutions 19,083 13,108Corporates 16,717 5,531Sovereigns 3,132 4,581Public sector entities – 3
38,932 23,223
(b) Available-for-sale financial assets
30 June2014
31 December2013
Listed
In the Mainland– PRC government bonds 59,947 49,846– Bonds issued by PBOC 129 229– Bonds issued by policy banks 25,324 27,922– Bonds issued by commercial banks and other
financial institutions 93,019 94,278– Other debt securities 64,417 89,849– Investments in funds 25 –
Outside the Mainland– Bonds issued by commercial banks and other
financial institutions 3,808 2,611– Other debt securities 4,709 5,219– Equity investments 777 771– Investments in funds 22 20
252,177 270,745
Less: Impairment allowances (171) (166)
252,006 270,579
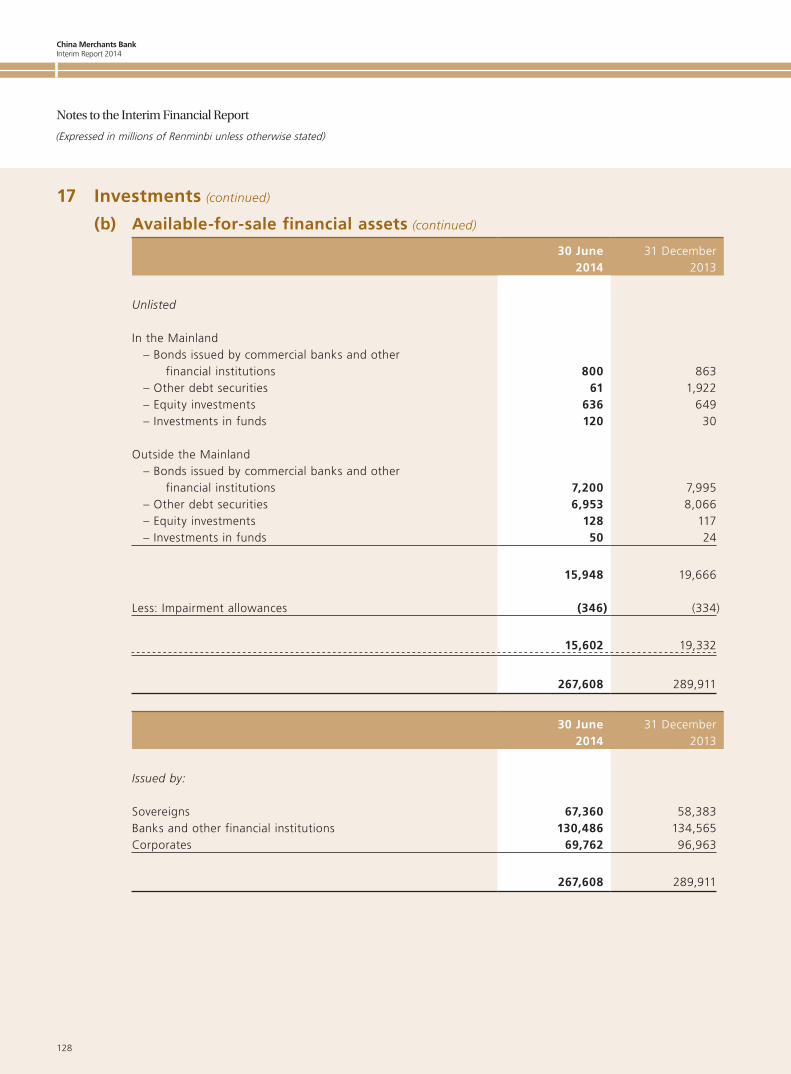
China Merchants BankInterim Report 2014
128
Notes to the Interim Financial Report
(Expressed in millions of Renminbi unless otherwise stated)
17 Investments (continued)
(b) Available-for-sale financial assets (continued)
30 June2014
31 December2013
Unlisted
In the Mainland– Bonds issued by commercial banks and other
financial institutions 800 863– Other debt securities 61 1,922– Equity investments 636 649– Investments in funds 120 30
Outside the Mainland– Bonds issued by commercial banks and other
financial institutions 7,200 7,995– Other debt securities 6,953 8,066– Equity investments 128 117– Investments in funds 50 24
15,948 19,666
Less: Impairment allowances (346) (334)
15,602 19,332
267,608 289,911
30 June2014
31 December2013
Issued by:
Sovereigns 67,360 58,383Banks and other financial institutions 130,486 134,565Corporates 69,762 96,963
267,608 289,911
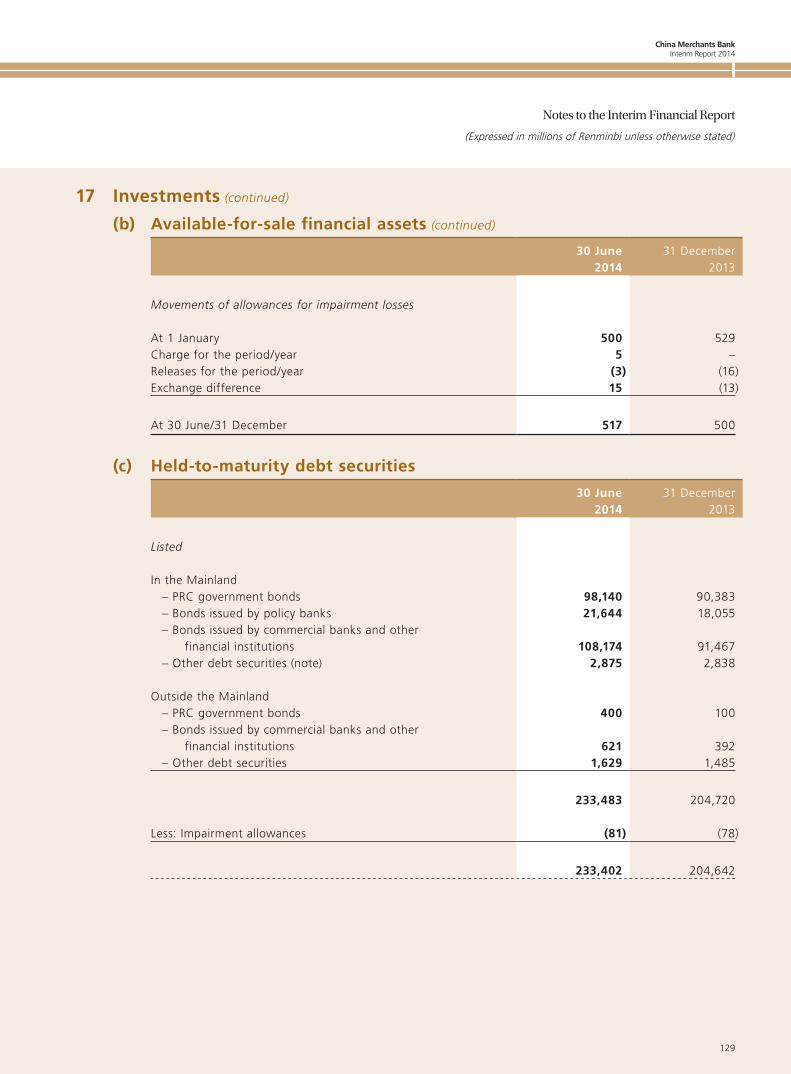
China Merchants BankInterim Report 2014
129
Notes to the Interim Financial Report
(Expressed in millions of Renminbi unless otherwise stated)
17 Investments (continued)
(b) Available-for-sale financial assets (continued)
30 June2014
31 December2013
Movements of allowances for impairment losses
At 1 January 500 529Charge for the period/year 5 –Releases for the period/year (3) (16)Exchange difference 15 (13)
At 30 June/31 December 517 500
(c) Held-to-maturity debt securities
30 June2014
31 December2013
Listed
In the Mainland– PRC government bonds 98,140 90,383– Bonds issued by policy banks 21,644 18,055– Bonds issued by commercial banks and other
financial institutions 108,174 91,467– Other debt securities (note) 2,875 2,838
Outside the Mainland– PRC government bonds 400 100– Bonds issued by commercial banks and other
financial institutions 621 392– Other debt securities 1,629 1,485
233,483 204,720
Less: Impairment allowances (81) (78)
233,402 204,642
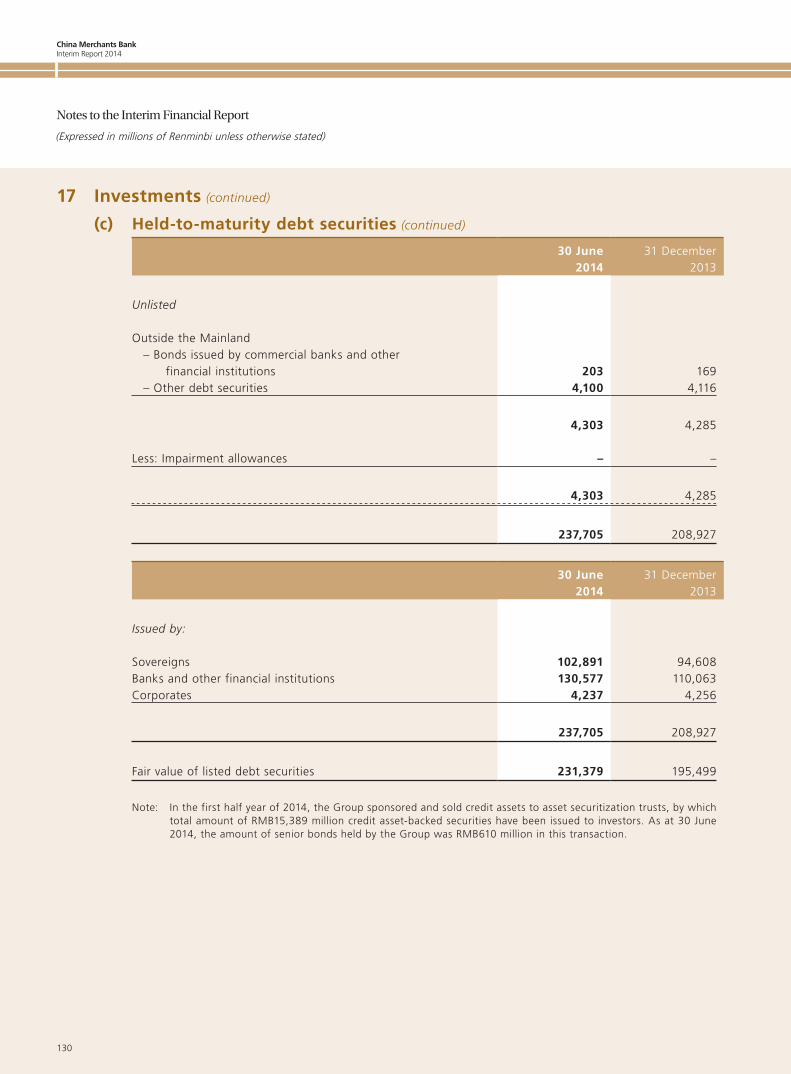
China Merchants BankInterim Report 2014
130
Notes to the Interim Financial Report
(Expressed in millions of Renminbi unless otherwise stated)
17 Investments (continued)
(c) Held-to-maturity debt securities (continued)
30 June2014
31 December2013
Unlisted
Outside the Mainland– Bonds issued by commercial banks and other
financial institutions 203 169– Other debt securities 4,100 4,116
4,303 4,285
Less: Impairment allowances – –
4,303 4,285
237,705 208,927
30 June2014
31 December2013
Issued by:
Sovereigns 102,891 94,608Banks and other financial institutions 130,577 110,063Corporates 4,237 4,256
237,705 208,927
Fair value of listed debt securities 231,379 195,499
Note: In the first half year of 2014, the Group sponsored and sold credit assets to asset securitization trusts, by which total amount of RMB15,389 million credit asset-backed securities have been issued to investors. As at 30 June 2014, the amount of senior bonds held by the Group was RMB610 million in this transaction.
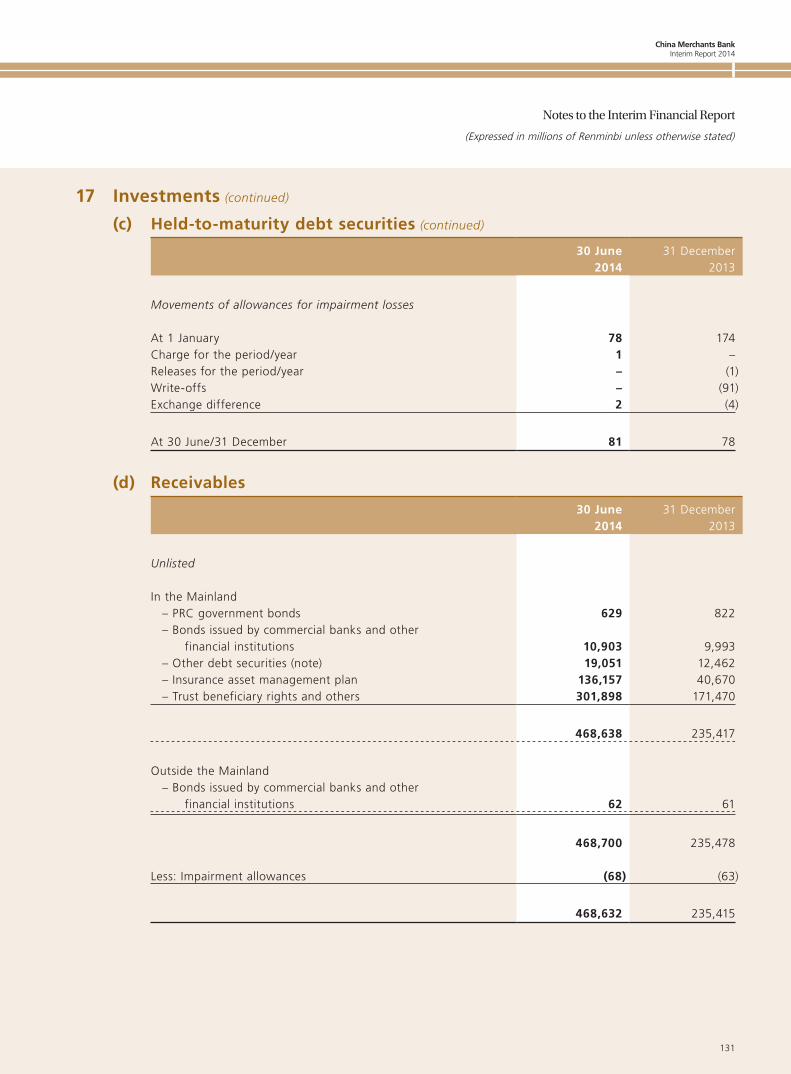
China Merchants BankInterim Report 2014
131
Notes to the Interim Financial Report
(Expressed in millions of Renminbi unless otherwise stated)
17 Investments (continued)
(c) Held-to-maturity debt securities (continued)
30 June2014
31 December2013
Movements of allowances for impairment losses
At 1 January 78 174Charge for the period/year 1 –Releases for the period/year – (1)Write-offs – (91)Exchange difference 2 (4)
At 30 June/31 December 81 78
(d) Receivables
30 June2014
31 December2013
Unlisted
In the Mainland– PRC government bonds 629 822– Bonds issued by commercial banks and other
financial institutions 10,903 9,993– Other debt securities (note) 19,051 12,462– Insurance asset management plan 136,157 40,670– Trust beneficiary rights and others 301,898 171,470
468,638 235,417
Outside the Mainland– Bonds issued by commercial banks and other
financial institutions 62 61
468,700 235,478
Less: Impairment allowances (68) (63)
468,632 235,415
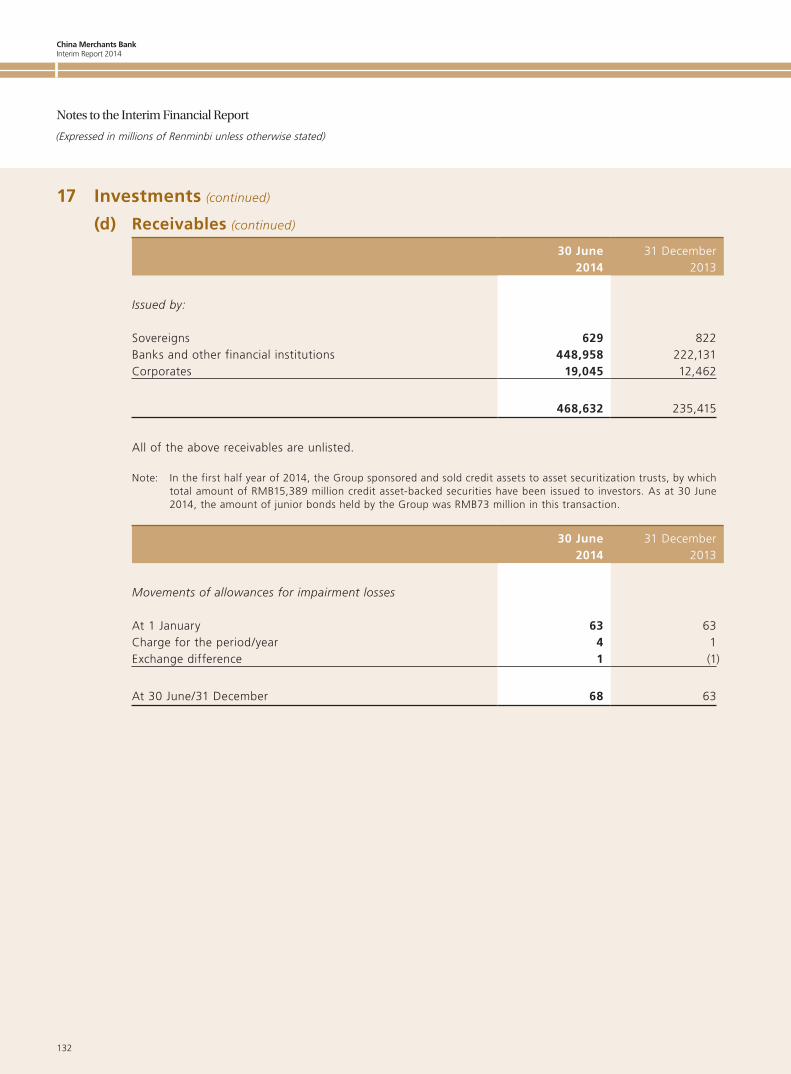
China Merchants BankInterim Report 2014
132
Notes to the Interim Financial Report
(Expressed in millions of Renminbi unless otherwise stated)
17 Investments (continued)
(d) Receivables (continued)
30 June2014
31 December2013
Issued by:
Sovereigns 629 822Banks and other financial institutions 448,958 222,131Corporates 19,045 12,462
468,632 235,415
All of the above receivables are unlisted.
Note: In the first half year of 2014, the Group sponsored and sold credit assets to asset securitization trusts, by which total amount of RMB15,389 million credit asset-backed securities have been issued to investors. As at 30 June 2014, the amount of junior bonds held by the Group was RMB73 million in this transaction.
30 June2014
31 December2013
Movements of allowances for impairment losses
At 1 January 63 63Charge for the period/year 4 1Exchange difference 1 (1)
At 30 June/31 December 68 63
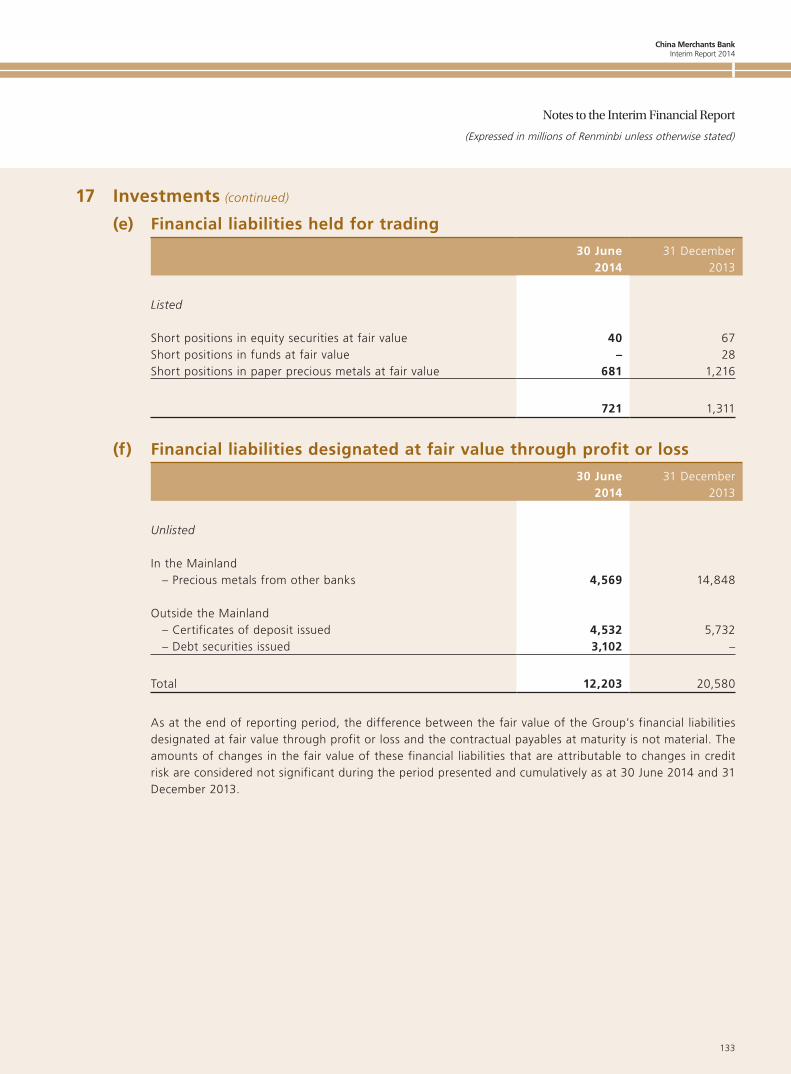
China Merchants BankInterim Report 2014
133
Notes to the Interim Financial Report
(Expressed in millions of Renminbi unless otherwise stated)
17 Investments (continued)
(e) Financial liabilities held for trading
30 June2014
31 December2013
Listed
Short positions in equity securities at fair value 40 67Short positions in funds at fair value – 28Short positions in paper precious metals at fair value 681 1,216
721 1,311
(f) Financial liabilities designated at fair value through profit or loss
30 June2014
31 December2013
Unlisted
In the Mainland– Precious metals from other banks 4,569 14,848
Outside the Mainland– Certificates of deposit issued 4,532 5,732– Debt securities issued 3,102 –
Total 12,203 20,580
As at the end of reporting period, the difference between the fair value of the Group’s financial liabilities designated at fair value through profit or loss and the contractual payables at maturity is not material. The amounts of changes in the fair value of these financial liabilities that are attributable to changes in credit risk are considered not significant during the period presented and cumulatively as at 30 June 2014 and 31 December 2013.
China Merchants BankInterim Report 2014
134
Notes to the Interim Financial Report
(Expressed in millions of Renminbi unless otherwise stated)
17 Investments (continued)
(g) Fair values of financial instrumentsA number of the Group’s accounting policies and disclosures require the measurement of fair values, for both financial and non-financial assets and liabilities.
The Group has an established control framework with respect to the measurement of fair values. This includes a valuation team that has overall responsibility for overseeing all significant fair value measurements including level 3 fair values, and reports directly to the CFO.
The valuation team regularly reviews significant unobservable inputs and valuation adjustments. If third party information, such as broker quotes or pricing services, is used to measure fair values, then the valuation team assesses the evidence obtained from the third parties to support the conclusion that such valuations meet the requirements of IFRS, including the level in the fair value hierarchy in which such valuations should be classified.
Significant valuation issues are reported to the Group Audit Committee.
When measuring the fair value of an asset or a liability, the Group uses market observable data as far as possible. Fair values are categorized into different levels in a fair value hierarchy based on the inputs used in the valuation techniques as follows.
• Level 1 – Quoted market price (unadjusted) in an active market for an identical instrument.
• Level 2 – Valuation techniques based on observable inputs, either directly (i. e., quoted prices) or indirectly (i. e., derived from prices). This category includes instruments valued using: quoted market prices in active markets for similar instruments; quoted prices for identical or similar instruments in markets that are considered less than active; or other valuation techniques where all significant inputs are directly or indirectly observable from market data.
• Level 3 – Valuation techniques using significant unobservable inputs. This category includes all instruments where the valuation technique includes inputs not based on observable data and the unobservable inputs have a significant effect on the instruments’ valuation. This category includes instruments that are valued based on quoted prices for similar instruments where significant unobservable adjustments or assumptions are required to reflect differences between the instruments.
If the inputs used to measure the fair value of an asset or a liability might be categorised in different levels of the fair value hierarchy, then the fair value measurement is categorised in its entirety in the same level of the fair value hierarchy as the lowest level input that is significant to the entire measurement.
The Group recognises transfers between levels of the fair value hierarchy at the end of the reporting period during which the change has occurred.
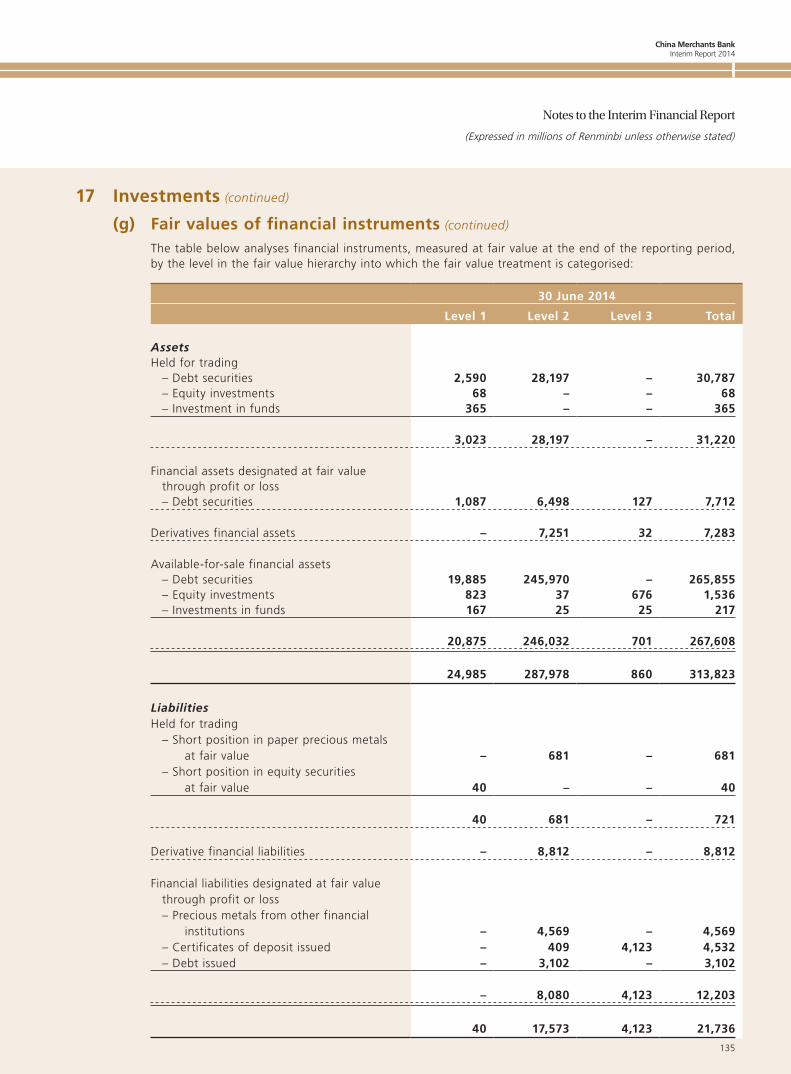
China Merchants BankInterim Report 2014
135
Notes to the Interim Financial Report
(Expressed in millions of Renminbi unless otherwise stated)
17 Investments (continued)
(g) Fair values of financial instruments (continued)
The table below analyses financial instruments, measured at fair value at the end of the reporting period, by the level in the fair value hierarchy into which the fair value treatment is categorised:
30 June 2014
Level 1 Level 2 Level 3 Total
AssetsHeld for trading
– Debt securities 2,590 28,197 – 30,787– Equity investments 68 – – 68– Investment in funds 365 – – 365
3,023 28,197 – 31,220
Financial assets designated at fair value through profit or loss– Debt securities 1,087 6,498 127 7,712
Derivatives financial assets – 7,251 32 7,283
Available-for-sale financial assets– Debt securities 19,885 245,970 – 265,855– Equity investments 823 37 676 1,536– Investments in funds 167 25 25 217
20,875 246,032 701 267,608
24,985 287,978 860 313,823
LiabilitiesHeld for trading
– Short position in paper precious metals at fair value – 681 – 681
– Short position in equity securities at fair value 40 – – 40
40 681 – 721
Derivative financial liabilities – 8,812 – 8,812
Financial liabilities designated at fair value through profit or loss– Precious metals from other financial
institutions – 4,569 – 4,569– Certificates of deposit issued – 409 4,123 4,532– Debt issued – 3,102 – 3,102
– 8,080 4,123 12,203
40 17,573 4,123 21,736
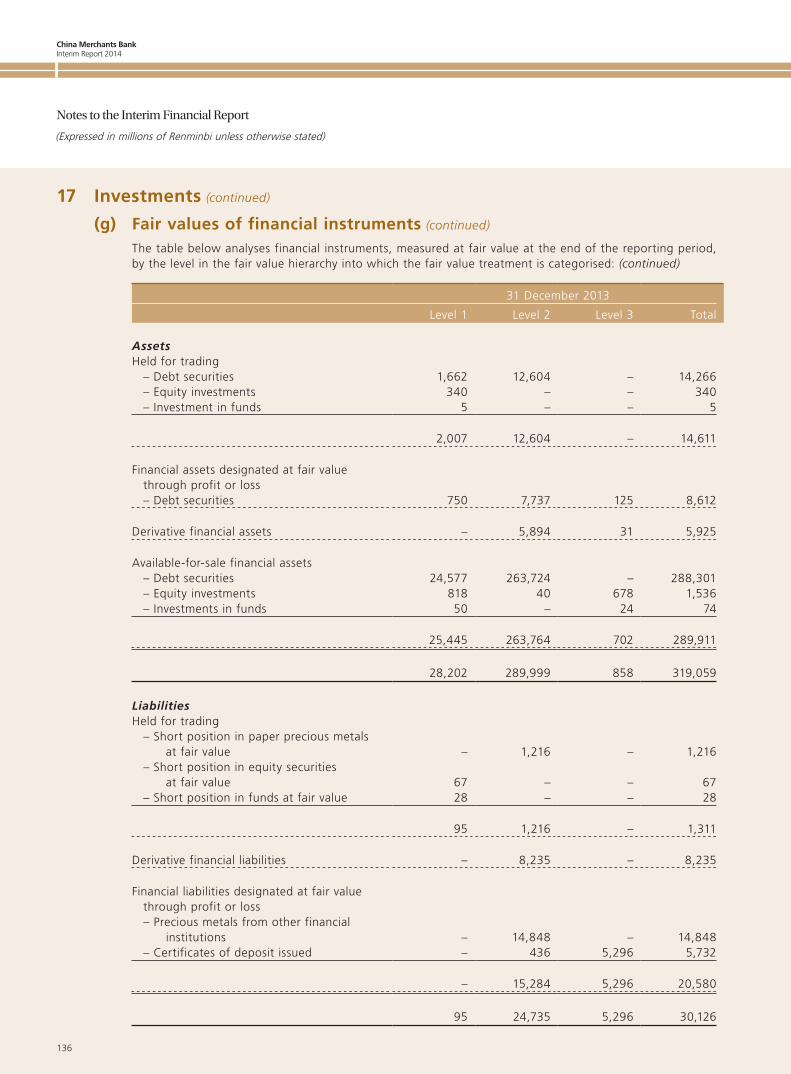
China Merchants BankInterim Report 2014
136
Notes to the Interim Financial Report
(Expressed in millions of Renminbi unless otherwise stated)
17 Investments (continued)
(g) Fair values of financial instruments (continued)
The table below analyses financial instruments, measured at fair value at the end of the reporting period, by the level in the fair value hierarchy into which the fair value treatment is categorised: (continued)
31 December 2013
Level 1 Level 2 Level 3 Total
AssetsHeld for trading
– Debt securities 1,662 12,604 – 14,266– Equity investments 340 – – 340– Investment in funds 5 – – 5
2,007 12,604 – 14,611
Financial assets designated at fair value through profit or loss– Debt securities 750 7,737 125 8,612
Derivative financial assets – 5,894 31 5,925
Available-for-sale financial assets– Debt securities 24,577 263,724 – 288,301– Equity investments 818 40 678 1,536– Investments in funds 50 – 24 74
25,445 263,764 702 289,911
28,202 289,999 858 319,059
LiabilitiesHeld for trading
– Short position in paper precious metals at fair value – 1,216 – 1,216
– Short position in equity securities at fair value 67 – – 67
– Short position in funds at fair value 28 – – 28
95 1,216 – 1,311
Derivative financial liabilities – 8,235 – 8,235
Financial liabilities designated at fair value through profit or loss– Precious metals from other financial
institutions – 14,848 – 14,848– Certificates of deposit issued – 436 5,296 5,732
– 15,284 5,296 20,580
95 24,735 5,296 30,126
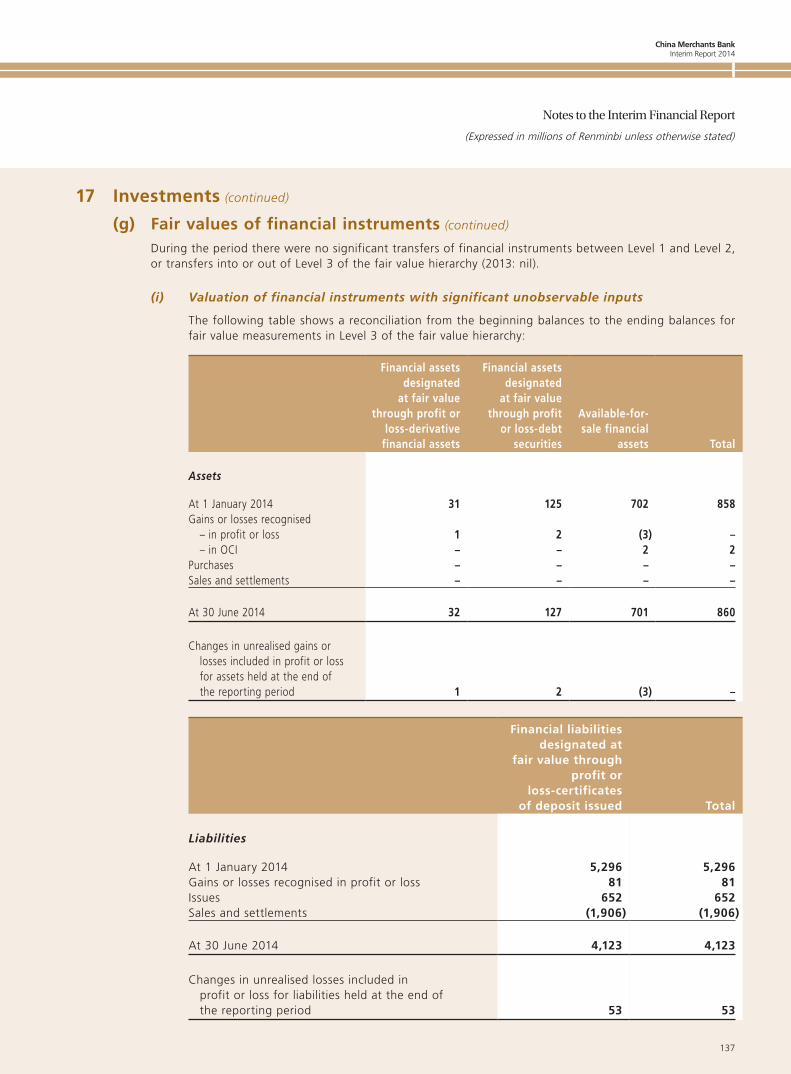
China Merchants BankInterim Report 2014
137
Notes to the Interim Financial Report
(Expressed in millions of Renminbi unless otherwise stated)
17 Investments (continued)
(g) Fair values of financial instruments (continued)
During the period there were no significant transfers of financial instruments between Level 1 and Level 2, or transfers into or out of Level 3 of the fair value hierarchy (2013: nil).
(i) Valuation of financial instruments with significant unobservable inputs
The following table shows a reconciliation from the beginning balances to the ending balances for fair value measurements in Level 3 of the fair value hierarchy:
Financial assets designated
at fair value through profit or
loss-derivative financial assets
Financial assets designated
at fair value through profit
or loss-debt securities
Available-for- sale financial
assets Total
Assets
At 1 January 2014 31 125 702 858Gains or losses recognised
– in profit or loss 1 2 (3) –– in OCI – – 2 2
Purchases – – – –Sales and settlements – – – –
At 30 June 2014 32 127 701 860
Changes in unrealised gains or losses included in profit or loss for assets held at the end of the reporting period 1 2 (3) –
Financial liabilities designated at
fair value through profit or
loss-certificates of deposit issued Total
Liabilities
At 1 January 2014 5,296 5,296Gains or losses recognised in profit or loss 81 81Issues 652 652Sales and settlements (1,906) (1,906)
At 30 June 2014 4,123 4,123
Changes in unrealised losses included in profit or loss for liabilities held at the end of the reporting period 53 53
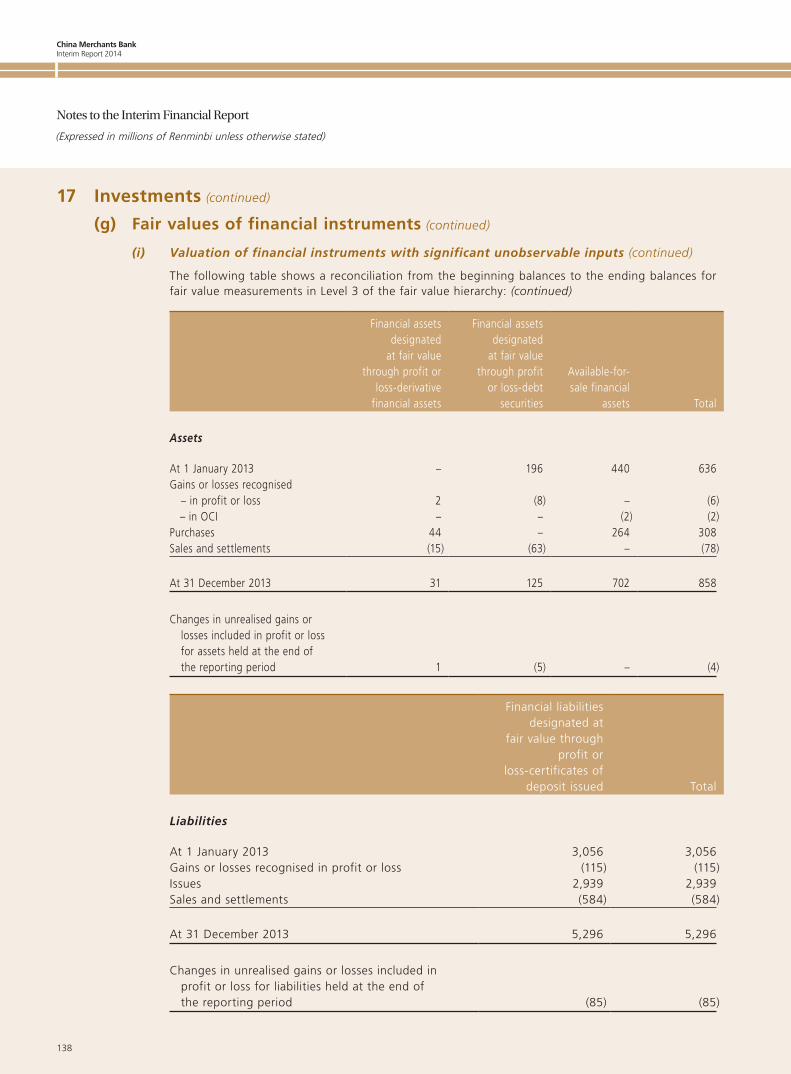
China Merchants BankInterim Report 2014
138
Notes to the Interim Financial Report
(Expressed in millions of Renminbi unless otherwise stated)
17 Investments (continued)
(g) Fair values of financial instruments (continued)
(i) Valuation of financial instruments with significant unobservable inputs (continued)
The following table shows a reconciliation from the beginning balances to the ending balances for fair value measurements in Level 3 of the fair value hierarchy: (continued)
Financial assets designated
at fair value through profit or
loss-derivative financial assets
Financial assets designated
at fair value through profit
or loss-debt securities
Available-for- sale financial
assets Total
Assets
At 1 January 2013 – 196 440 636Gains or losses recognised
– in profit or loss 2 (8) – (6) – in OCI – – (2) (2)Purchases 44 – 264 308Sales and settlements (15) (63) – (78)
At 31 December 2013 31 125 702 858
Changes in unrealised gains or losses included in profit or loss for assets held at the end of the reporting period 1 (5) – (4)
Financial liabilities designated at
fair value through profit or
loss-certificates of deposit issued Total
Liabilities
At 1 January 2013 3,056 3,056Gains or losses recognised in profit or loss (115) (115)Issues 2,939 2,939Sales and settlements (584) (584)
At 31 December 2013 5,296 5,296
Changes in unrealised gains or losses included in profit or loss for liabilities held at the end of the reporting period (85) (85)
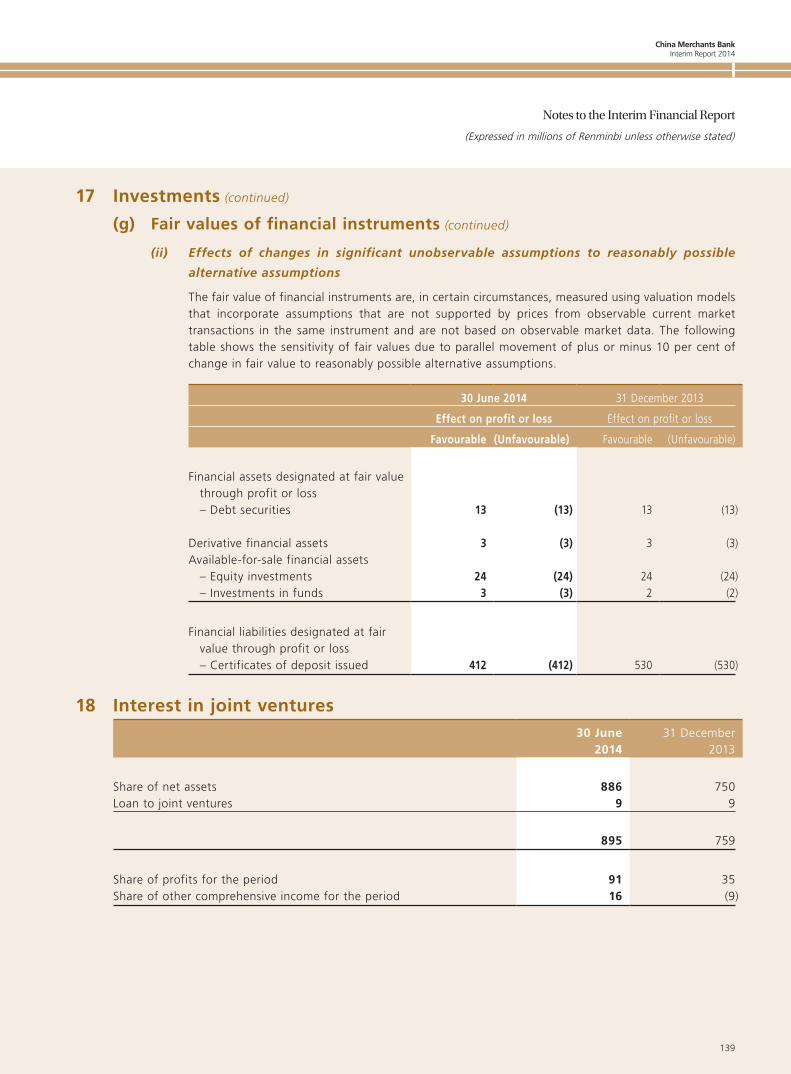
China Merchants BankInterim Report 2014
139
Notes to the Interim Financial Report
(Expressed in millions of Renminbi unless otherwise stated)
17 Investments (continued)
(g) Fair values of financial instruments (continued)
(ii) Effects of changes in significant unobservable assumptions to reasonably possible
alternative assumptions
The fair value of financial instruments are, in certain circumstances, measured using valuation models that incorporate assumptions that are not supported by prices from observable current market transactions in the same instrument and are not based on observable market data. The following table shows the sensitivity of fair values due to parallel movement of plus or minus 10 per cent of change in fair value to reasonably possible alternative assumptions.
30 June 2014 31 December 2013
Effect on profit or loss Effect on profit or loss
Favourable (Unfavourable) Favourable (Unfavourable)
Financial assets designated at fair value through profit or loss– Debt securities 13 (13) 13 (13)
Derivative financial assets 3 (3) 3 (3)Available-for-sale financial assets
– Equity investments 24 (24) 24 (24)– Investments in funds 3 (3) 2 (2)
Financial liabilities designated at fair value through profit or loss– Certificates of deposit issued 412 (412) 530 (530)
18 Interest in joint ventures30 June
201431 December
2013
Share of net assets 886 750Loan to joint ventures 9 9
895 759
Share of profits for the period 91 35Share of other comprehensive income for the period 16 (9)
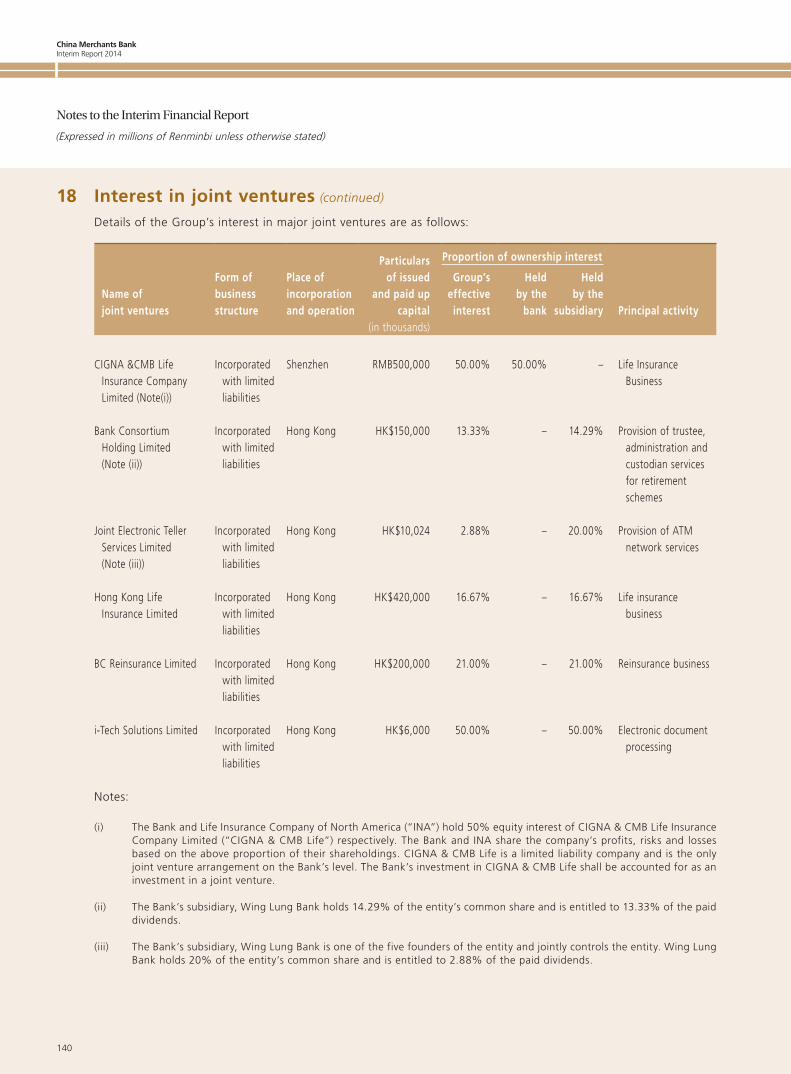
China Merchants BankInterim Report 2014
140
Notes to the Interim Financial Report
(Expressed in millions of Renminbi unless otherwise stated)
18 Interest in joint ventures (continued)
Details of the Group’s interest in major joint ventures are as follows:
Name of joint ventures
Form ofbusinessstructure
Place ofincorporationand operation
Particulars of issued
and paid upcapital
Proportion of ownership interest
Principal activity
Group’seffectiveinterest
Heldby the
bank
Heldby the
subsidiary(in thousands)
CIGNA &CMB Life Insurance Company Limited (Note(i))
Incorporated with limited liabilities
Shenzhen RMB500,000 50.00% 50.00% – Life Insurance Business
Bank Consortium Holding Limited (Note (ii))
Incorporated with limited liabilities
Hong Kong HK$150,000 13.33% – 14.29% Provision of trustee, administration and custodian services for retirement schemes
Joint Electronic Teller Services Limited (Note (iii))
Incorporated with limited liabilities
Hong Kong HK$10,024 2.88% – 20.00% Provision of ATM network services
Hong Kong Life Insurance Limited
Incorporated with limited liabilities
Hong Kong HK$420,000 16.67% – 16.67% Life insurance business
BC Reinsurance Limited Incorporated with limited liabilities
Hong Kong HK$200,000 21.00% – 21.00% Reinsurance business
i-Tech Solutions Limited Incorporated with limited liabilities
Hong Kong HK$6,000 50.00% – 50.00% Electronic document processing
Notes:
(i) The Bank and Life Insurance Company of North America (“INA”) hold 50% equity interest of CIGNA & CMB Life Insurance Company Limited (“CIGNA & CMB Life”) respectively. The Bank and INA share the company’s profits, risks and losses based on the above proportion of their shareholdings. CIGNA & CMB Life is a limited liability company and is the only joint venture arrangement on the Bank’s level. The Bank’s investment in CIGNA & CMB Life shall be accounted for as an investment in a joint venture.
(ii) The Bank’s subsidiary, Wing Lung Bank holds 14.29% of the entity’s common share and is entitled to 13.33% of the paid dividends.
(iii) The Bank’s subsidiary, Wing Lung Bank is one of the five founders of the entity and jointly controls the entity. Wing Lung Bank holds 20% of the entity’s common share and is entitled to 2.88% of the paid dividends.
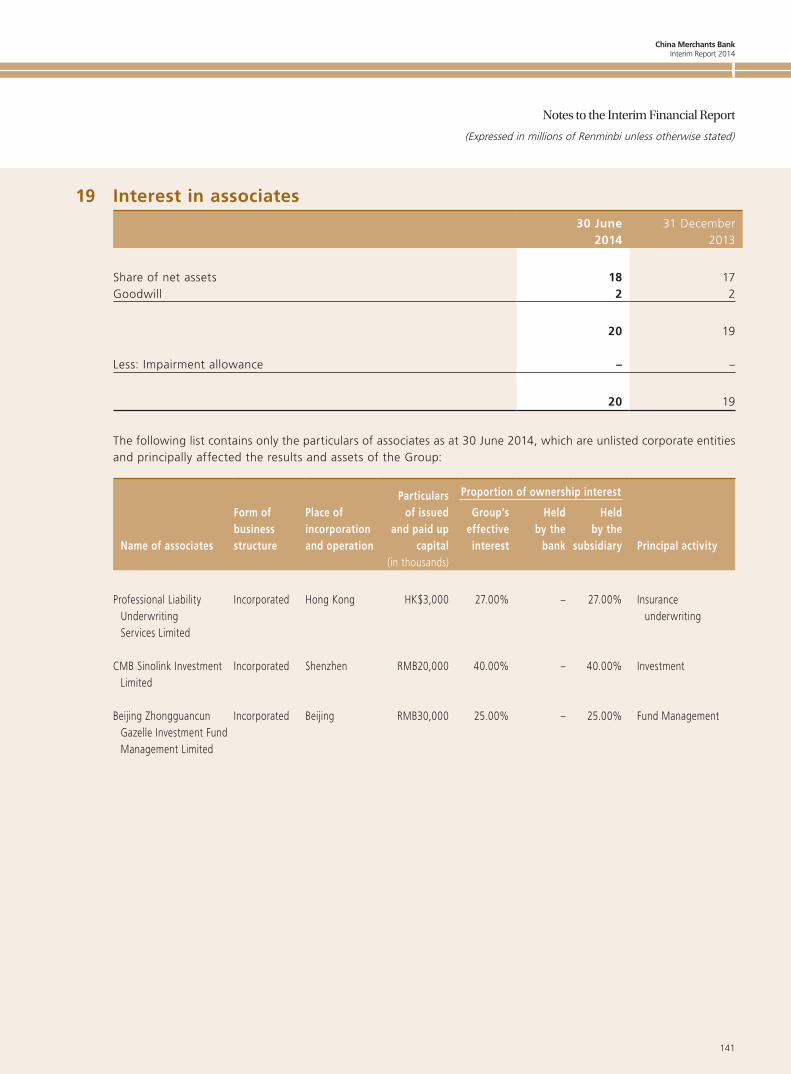
China Merchants BankInterim Report 2014
141
Notes to the Interim Financial Report
(Expressed in millions of Renminbi unless otherwise stated)
19 Interest in associates30 June
201431 December
2013
Share of net assets 18 17Goodwill 2 2
20 19
Less: Impairment allowance – –
20 19
The following list contains only the particulars of associates as at 30 June 2014, which are unlisted corporate entities and principally affected the results and assets of the Group:
Name of associates
Form of business structure
Place of incorporation and operation
Particulars of issued
and paid up capital
Proportion of ownership interest
Principal activity
Group’s effective interest
Held by the
bank
Held by the
subsidiary(in thousands)
Professional Liability Underwriting Services Limited
Incorporated Hong Kong HK$3,000 27.00% – 27.00% Insurance underwriting
CMB Sinolink Investment Limited
Incorporated Shenzhen RMB20,000 40.00% – 40.00% Investment
Beijing Zhongguancun Gazelle Investment Fund Management Limited
Incorporated Beijing RMB30,000 25.00% – 25.00% Fund Management
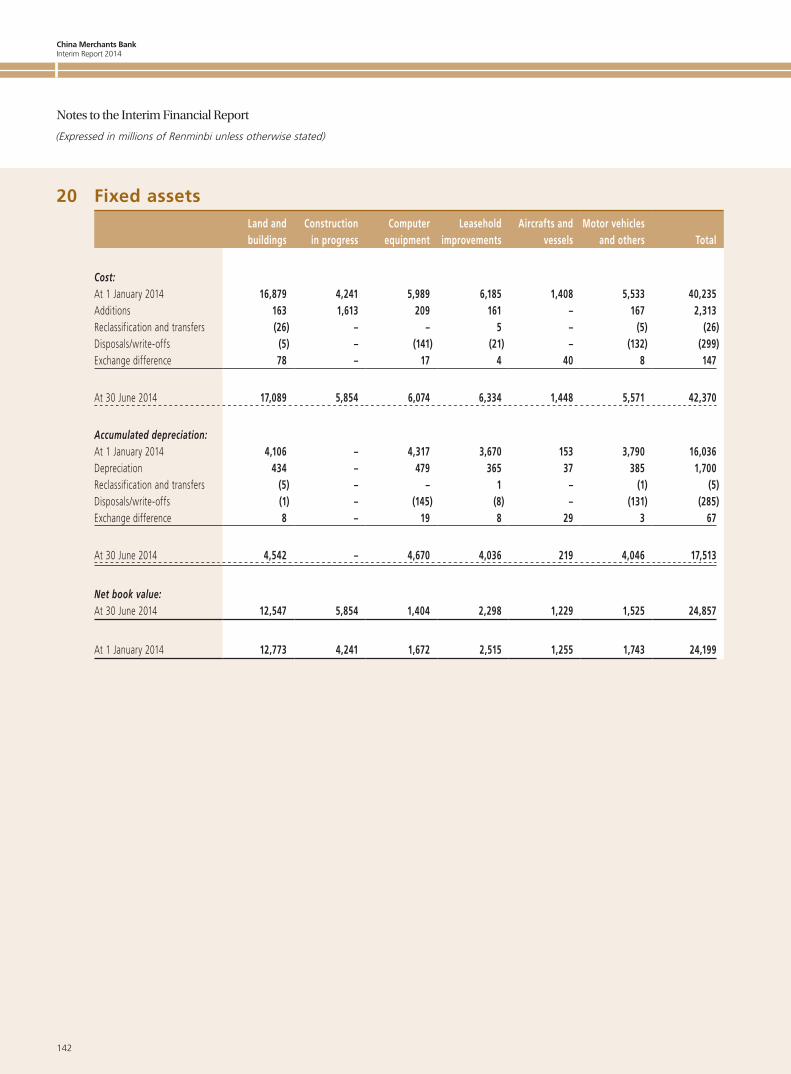
China Merchants BankInterim Report 2014
142
Notes to the Interim Financial Report
(Expressed in millions of Renminbi unless otherwise stated)
20 Fixed assetsLand and buildings
Construction in progress
Computer equipment
Leasehold improvements
Aircrafts and vessels
Motor vehicles and others Total
Cost:At 1 January 2014 16,879 4,241 5,989 6,185 1,408 5,533 40,235Additions 163 1,613 209 161 – 167 2,313Reclassification and transfers (26) – – 5 – (5) (26)Disposals/write-offs (5) – (141) (21) – (132) (299)Exchange difference 78 – 17 4 40 8 147
At 30 June 2014 17,089 5,854 6,074 6,334 1,448 5,571 42,370
Accumulated depreciation:At 1 January 2014 4,106 – 4,317 3,670 153 3,790 16,036Depreciation 434 – 479 365 37 385 1,700Reclassification and transfers (5) – – 1 – (1) (5)Disposals/write-offs (1) – (145) (8) – (131) (285)Exchange difference 8 – 19 8 29 3 67
At 30 June 2014 4,542 – 4,670 4,036 219 4,046 17,513
Net book value:At 30 June 2014 12,547 5,854 1,404 2,298 1,229 1,525 24,857
At 1 January 2014 12,773 4,241 1,672 2,515 1,255 1,743 24,199
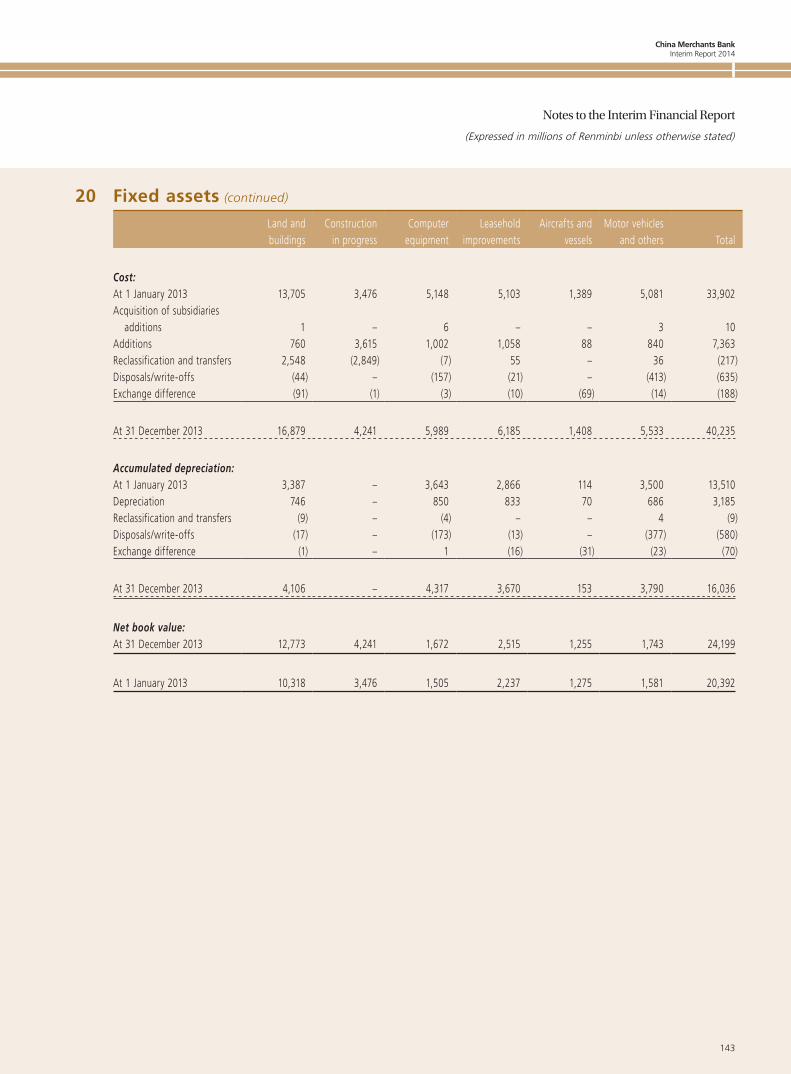
China Merchants BankInterim Report 2014
143
Notes to the Interim Financial Report
(Expressed in millions of Renminbi unless otherwise stated)
20 Fixed assets (continued)
Land and buildings
Construction in progress
Computer equipment
Leasehold improvements
Aircrafts and vessels
Motor vehicles and others Total
Cost:At 1 January 2013 13,705 3,476 5,148 5,103 1,389 5,081 33,902Acquisition of subsidiaries
additions 1 – 6 – – 3 10Additions 760 3,615 1,002 1,058 88 840 7,363Reclassification and transfers 2,548 (2,849) (7) 55 – 36 (217)Disposals/write-offs (44) – (157) (21) – (413) (635)Exchange difference (91) (1) (3) (10) (69) (14) (188)
At 31 December 2013 16,879 4,241 5,989 6,185 1,408 5,533 40,235
Accumulated depreciation:At 1 January 2013 3,387 – 3,643 2,866 114 3,500 13,510Depreciation 746 – 850 833 70 686 3,185Reclassification and transfers (9) – (4) – – 4 (9)Disposals/write-offs (17) – (173) (13) – (377) (580)Exchange difference (1) – 1 (16) (31) (23) (70)
At 31 December 2013 4,106 – 4,317 3,670 153 3,790 16,036
Net book value:At 31 December 2013 12,773 4,241 1,672 2,515 1,255 1,743 24,199
At 1 January 2013 10,318 3,476 1,505 2,237 1,275 1,581 20,392
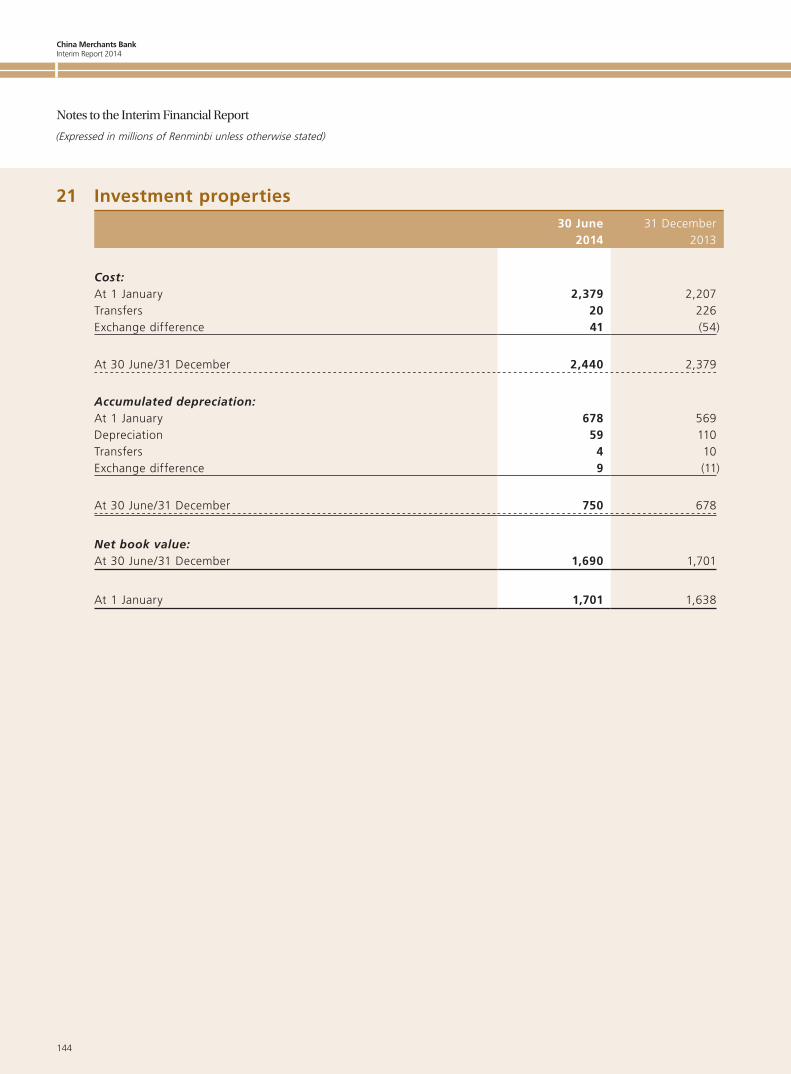
China Merchants BankInterim Report 2014
144
Notes to the Interim Financial Report
(Expressed in millions of Renminbi unless otherwise stated)
21 Investment properties30 June
201431 December
2013
Cost:At 1 January 2,379 2,207Transfers 20 226Exchange difference 41 (54)
At 30 June/31 December 2,440 2,379
Accumulated depreciation:At 1 January 678 569Depreciation 59 110Transfers 4 10Exchange difference 9 (11)
At 30 June/31 December 750 678
Net book value:At 30 June/31 December 1,690 1,701
At 1 January 1,701 1,638
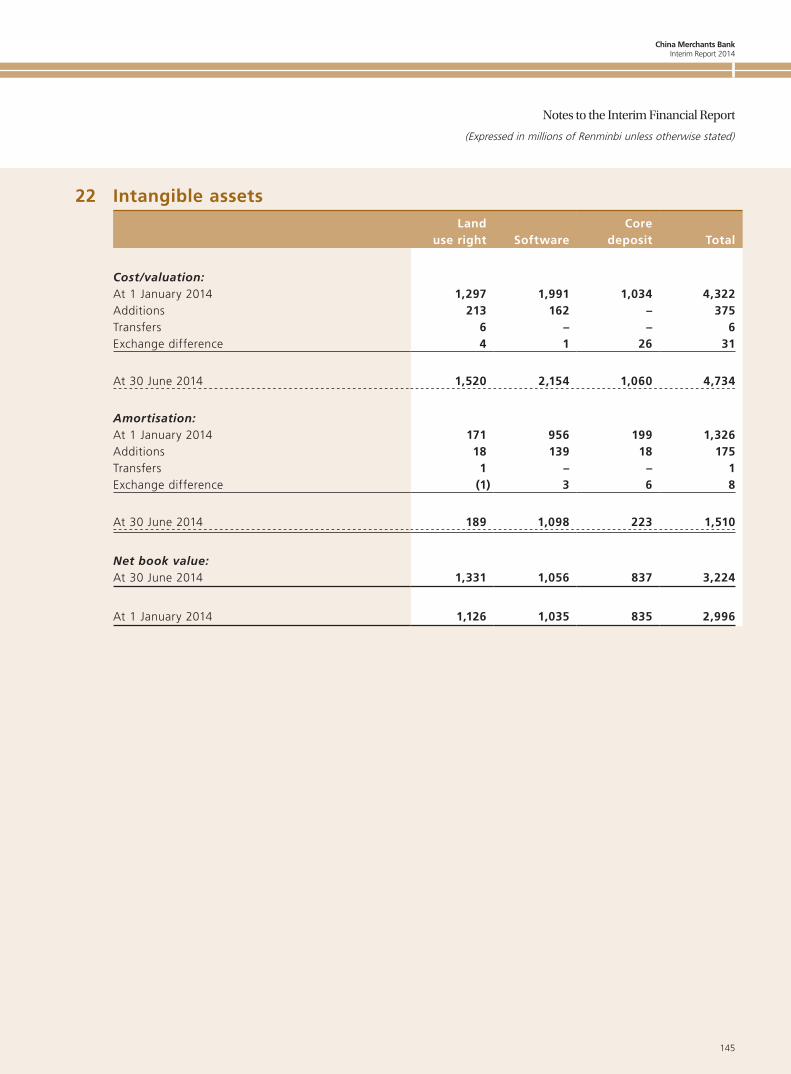
China Merchants BankInterim Report 2014
145
Notes to the Interim Financial Report
(Expressed in millions of Renminbi unless otherwise stated)
22 Intangible assetsLand
use right SoftwareCore
deposit Total
Cost/valuation:At 1 January 2014 1,297 1,991 1,034 4,322Additions 213 162 – 375Transfers 6 – – 6Exchange difference 4 1 26 31
At 30 June 2014 1,520 2,154 1,060 4,734
Amortisation:At 1 January 2014 171 956 199 1,326Additions 18 139 18 175Transfers 1 – – 1Exchange difference (1) 3 6 8
At 30 June 2014 189 1,098 223 1,510
Net book value:At 30 June 2014 1,331 1,056 837 3,224
At 1 January 2014 1,126 1,035 835 2,996
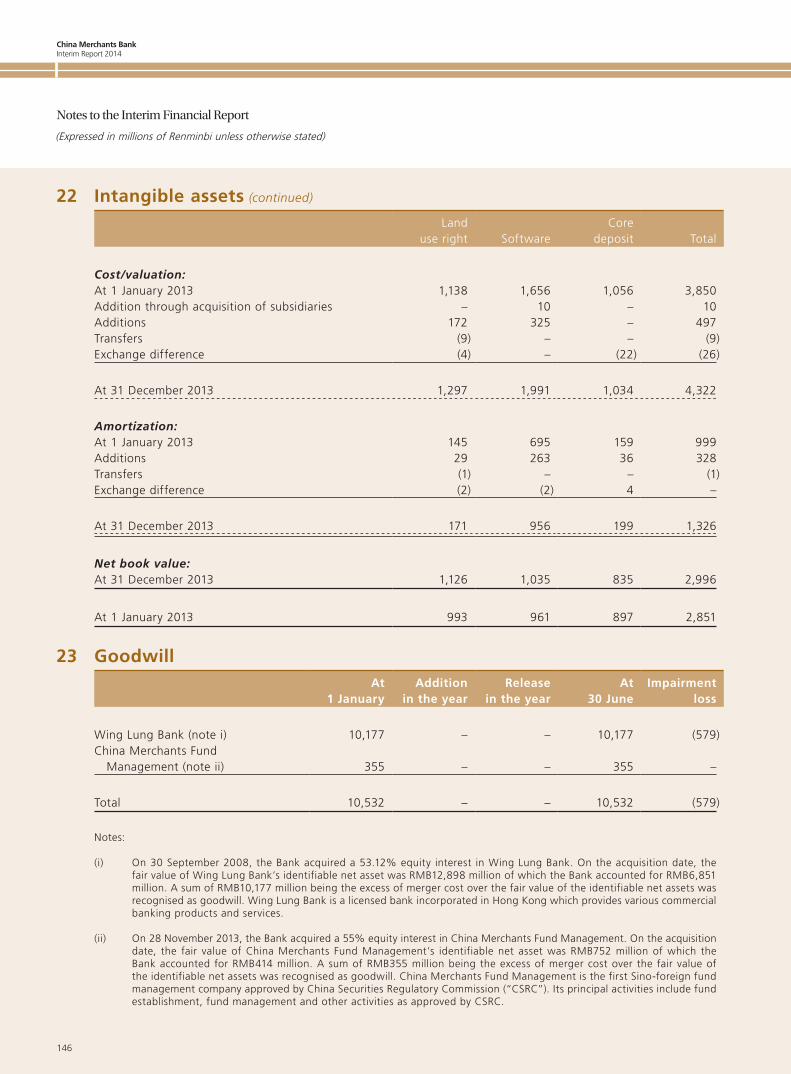
China Merchants BankInterim Report 2014
146
Notes to the Interim Financial Report
(Expressed in millions of Renminbi unless otherwise stated)
22 Intangible assets (continued)
Landuse right Software
Coredeposit Total
Cost/valuation:At 1 January 2013 1,138 1,656 1,056 3,850Addition through acquisition of subsidiaries – 10 – 10Additions 172 325 – 497Transfers (9) – – (9)Exchange difference (4) – (22) (26)
At 31 December 2013 1,297 1,991 1,034 4,322
Amortization:At 1 January 2013 145 695 159 999Additions 29 263 36 328Transfers (1) – – (1)Exchange difference (2) (2) 4 –
At 31 December 2013 171 956 199 1,326
Net book value:At 31 December 2013 1,126 1,035 835 2,996
At 1 January 2013 993 961 897 2,851
23 GoodwillAt
1 JanuaryAddition
in the yearRelease
in the yearAt
30 JuneImpairment
loss
Wing Lung Bank (note i) 10,177 – – 10,177 (579)China Merchants Fund Management (note ii) 355 – – 355 –
Total 10,532 – – 10,532 (579)
Notes:
(i) On 30 September 2008, the Bank acquired a 53.12% equity interest in Wing Lung Bank. On the acquisition date, the fair value of Wing Lung Bank’s identifiable net asset was RMB12,898 million of which the Bank accounted for RMB6,851 million. A sum of RMB10,177 million being the excess of merger cost over the fair value of the identifiable net assets was recognised as goodwill. Wing Lung Bank is a licensed bank incorporated in Hong Kong which provides various commercial banking products and services.
(ii) On 28 November 2013, the Bank acquired a 55% equity interest in China Merchants Fund Management. On the acquisition date, the fair value of China Merchants Fund Management’s identifiable net asset was RMB752 million of which the Bank accounted for RMB414 million. A sum of RMB355 million being the excess of merger cost over the fair value of the identifiable net assets was recognised as goodwill. China Merchants Fund Management is the first Sino-foreign fund management company approved by China Securities Regulatory Commission (“CSRC”). Its principal activities include fund establishment, fund management and other activities as approved by CSRC.
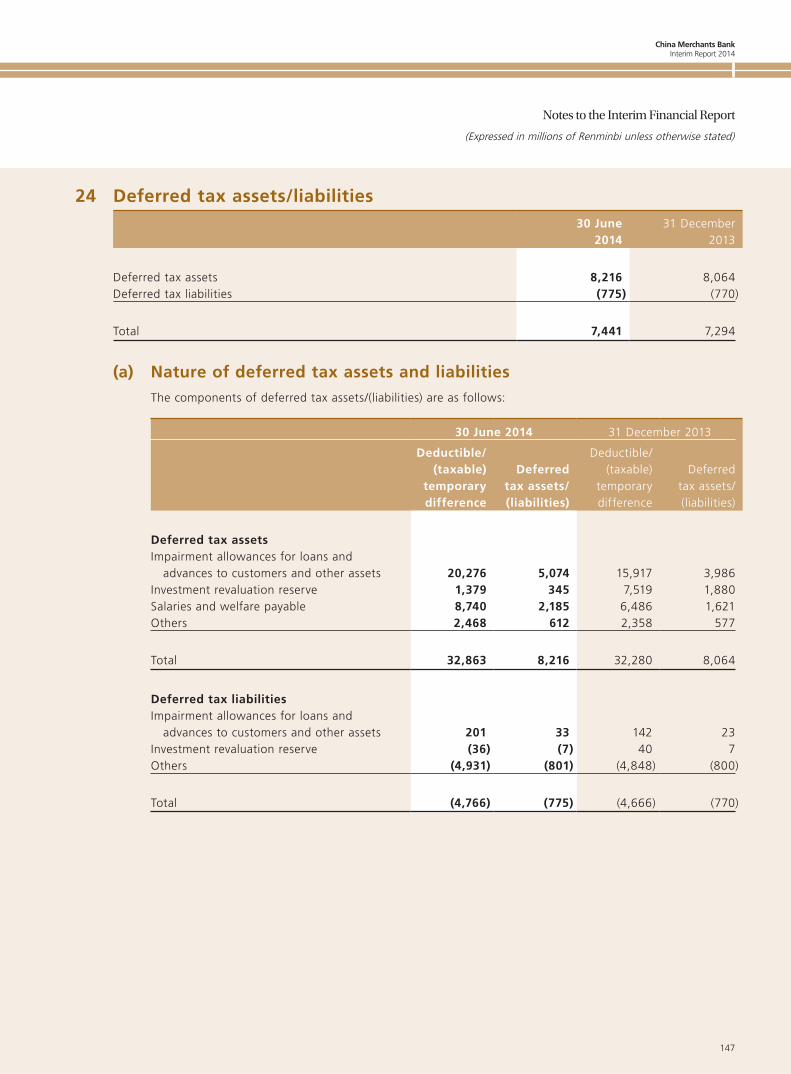
China Merchants BankInterim Report 2014
147
Notes to the Interim Financial Report
(Expressed in millions of Renminbi unless otherwise stated)
24 Deferred tax assets/liabilities30 June
201431 December
2013
Deferred tax assets 8,216 8,064Deferred tax liabilities (775) (770)
Total 7,441 7,294
(a) Nature of deferred tax assets and liabilitiesThe components of deferred tax assets/(liabilities) are as follows:
30 June 2014 31 December 2013
Deductible/(taxable)
temporary difference
Deferred tax assets/(liabilities)
Deductible/(taxable)
temporary difference
Deferred tax assets/(liabilities)
Deferred tax assetsImpairment allowances for loans and advances to customers and other assets 20,276 5,074 15,917 3,986Investment revaluation reserve 1,379 345 7,519 1,880Salaries and welfare payable 8,740 2,185 6,486 1,621Others 2,468 612 2,358 577
Total 32,863 8,216 32,280 8,064
Deferred tax liabilitiesImpairment allowances for loans and advances to customers and other assets 201 33 142 23Investment revaluation reserve (36) (7) 40 7Others (4,931) (801) (4,848) (800)
Total (4,766) (775) (4,666) (770)
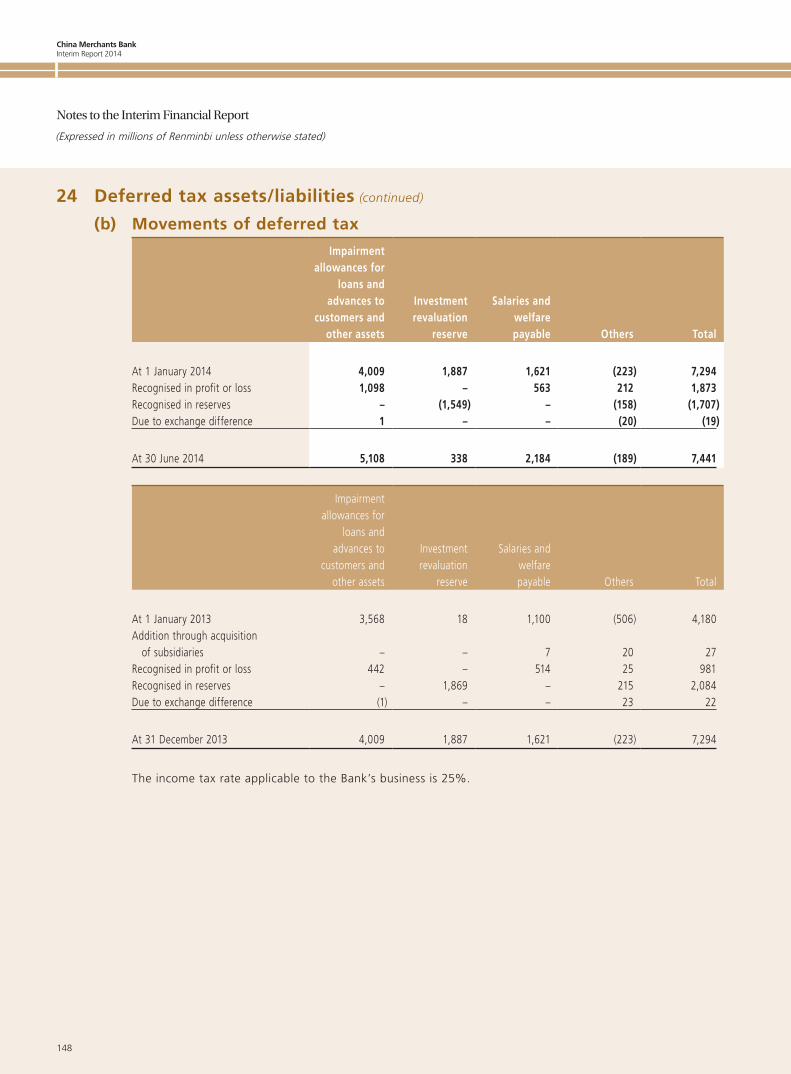
China Merchants BankInterim Report 2014
148
Notes to the Interim Financial Report
(Expressed in millions of Renminbi unless otherwise stated)
24 Deferred tax assets/liabilities (continued)
(b) Movements of deferred tax
Impairmentallowances for
loans andadvances to
customers andother assets
Investmentrevaluation
reserve
Salaries andwelfarepayable Others Total
At 1 January 2014 4,009 1,887 1,621 (223) 7,294Recognised in profit or loss 1,098 – 563 212 1,873Recognised in reserves – (1,549) – (158) (1,707)Due to exchange difference 1 – – (20) (19)
At 30 June 2014 5,108 338 2,184 (189) 7,441
Impairmentallowances for
loans andadvances to
customers andother assets
Investmentrevaluation
reserve
Salaries andwelfarepayable Others Total
At 1 January 2013 3,568 18 1,100 (506) 4,180Addition through acquisition of subsidiaries – – 7 20 27Recognised in profit or loss 442 – 514 25 981Recognised in reserves – 1,869 – 215 2,084Due to exchange difference (1) – – 23 22
At 31 December 2013 4,009 1,887 1,621 (223) 7,294
The income tax rate applicable to the Bank’s business is 25%.
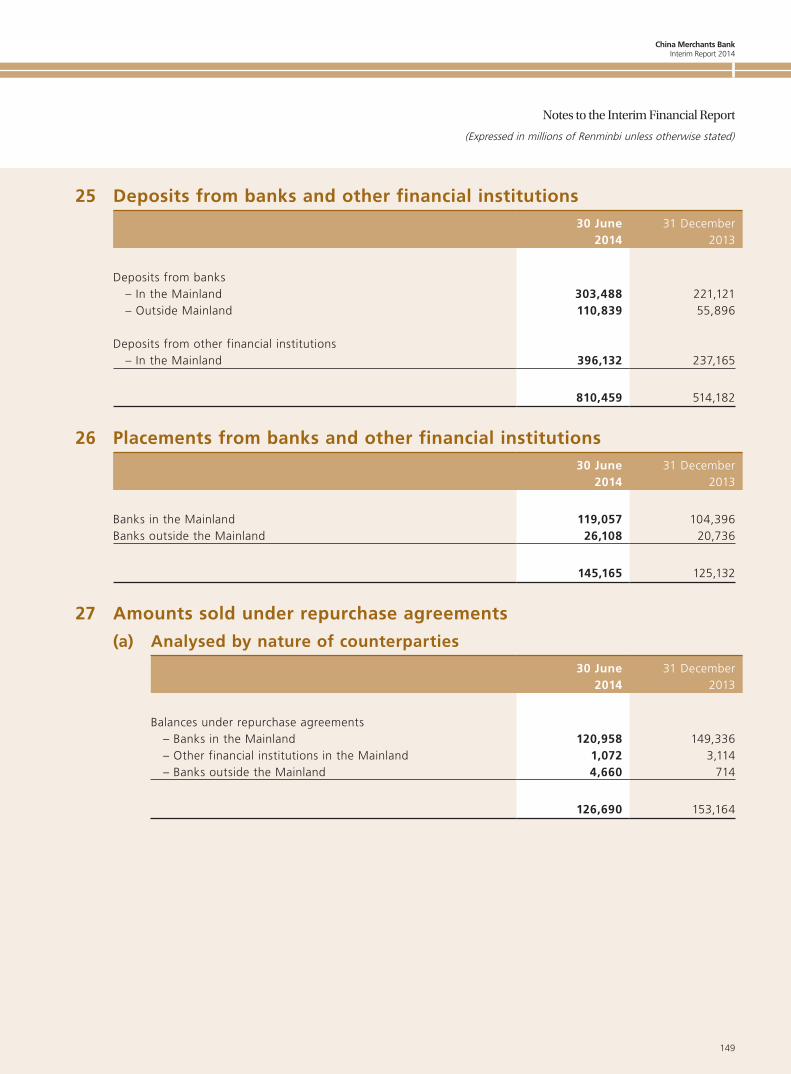
China Merchants BankInterim Report 2014
149
Notes to the Interim Financial Report
(Expressed in millions of Renminbi unless otherwise stated)
25 Deposits from banks and other financial institutions30 June
201431 December
2013
Deposits from banks – In the Mainland 303,488 221,121 – Outside Mainland 110,839 55,896
Deposits from other financial institutions – In the Mainland 396,132 237,165
810,459 514,182
26 Placements from banks and other financial institutions30 June
201431 December
2013
Banks in the Mainland 119,057 104,396Banks outside the Mainland 26,108 20,736
145,165 125,132
27 Amounts sold under repurchase agreements
(a) Analysed by nature of counterparties
30 June2014
31 December2013
Balances under repurchase agreements – Banks in the Mainland 120,958 149,336 – Other financial institutions in the Mainland 1,072 3,114 – Banks outside the Mainland 4,660 714
126,690 153,164
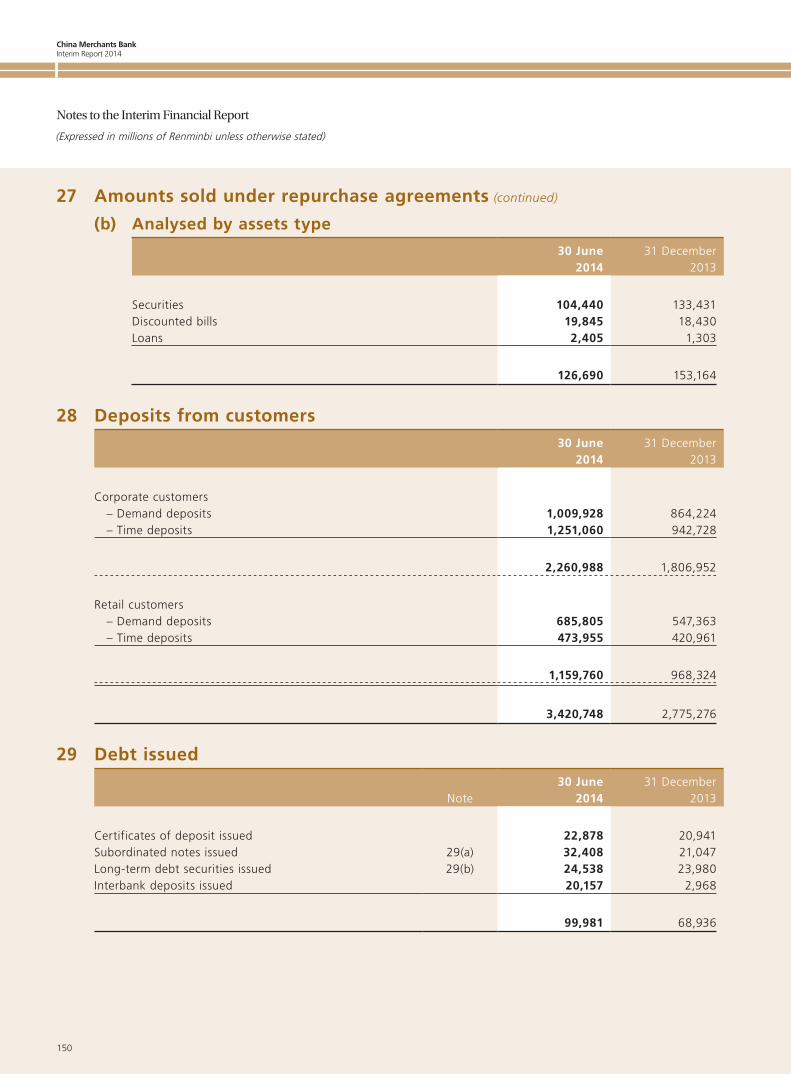
China Merchants BankInterim Report 2014
150
Notes to the Interim Financial Report
(Expressed in millions of Renminbi unless otherwise stated)
27 Amounts sold under repurchase agreements (continued)
(b) Analysed by assets type
30 June2014
31 December2013
Securities 104,440 133,431Discounted bills 19,845 18,430Loans 2,405 1,303
126,690 153,164
28 Deposits from customers30 June
201431 December
2013
Corporate customers – Demand deposits 1,009,928 864,224 – Time deposits 1,251,060 942,728
2,260,988 1,806,952
Retail customers – Demand deposits 685,805 547,363 – Time deposits 473,955 420,961
1,159,760 968,324
3,420,748 2,775,276
29 Debt issued
Note30 June
201431 December
2013
Certificates of deposit issued 22,878 20,941Subordinated notes issued 29(a) 32,408 21,047Long-term debt securities issued 29(b) 24,538 23,980Interbank deposits issued 20,157 2,968
99,981 68,936
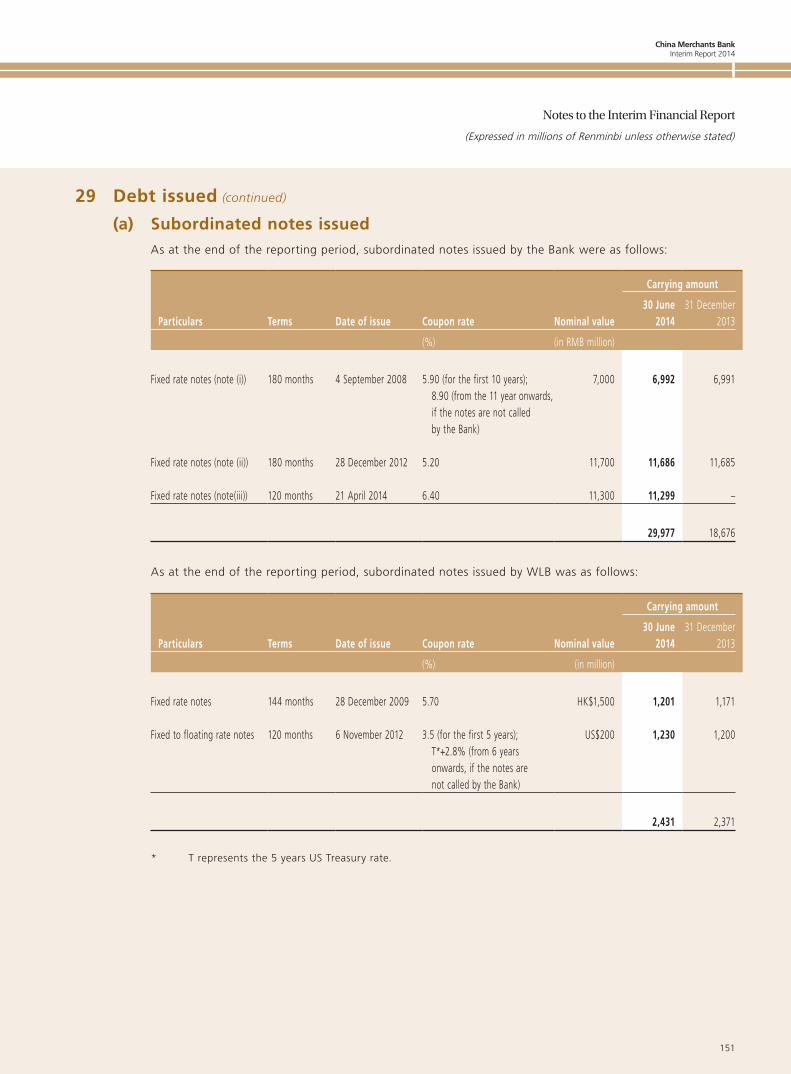
China Merchants BankInterim Report 2014
151
Notes to the Interim Financial Report
(Expressed in millions of Renminbi unless otherwise stated)
29 Debt issued (continued)
(a) Subordinated notes issuedAs at the end of the reporting period, subordinated notes issued by the Bank were as follows:
Carrying amount
Particulars Terms Date of issue Coupon rate Nominal value30 June
201431 December
2013
(%) (in RMB million)
Fixed rate notes (note (i)) 180 months 4 September 2008 5.90 (for the first 10 years); 8.90 (from the 11 year onwards, if the notes are not called by the Bank)
7,000 6,992 6,991
Fixed rate notes (note (ii)) 180 months 28 December 2012 5.20 11,700 11,686 11,685
Fixed rate notes (note(iii)) 120 months 21 April 2014 6.40 11,300 11,299 –
29,977 18,676
As at the end of the reporting period, subordinated notes issued by WLB was as follows:
Carrying amount
Particulars Terms Date of issue Coupon rate Nominal value30 June
201431 December
2013
(%) (in million)
Fixed rate notes 144 months 28 December 2009 5.70 HK$1,500 1,201 1,171
Fixed to floating rate notes 120 months 6 November 2012 3.5 (for the first 5 years); T*+2.8% (from 6 years onwards, if the notes are not called by the Bank)
US$200 1,230 1,200
2,431 2,371
* T represents the 5 years US Treasury rate.
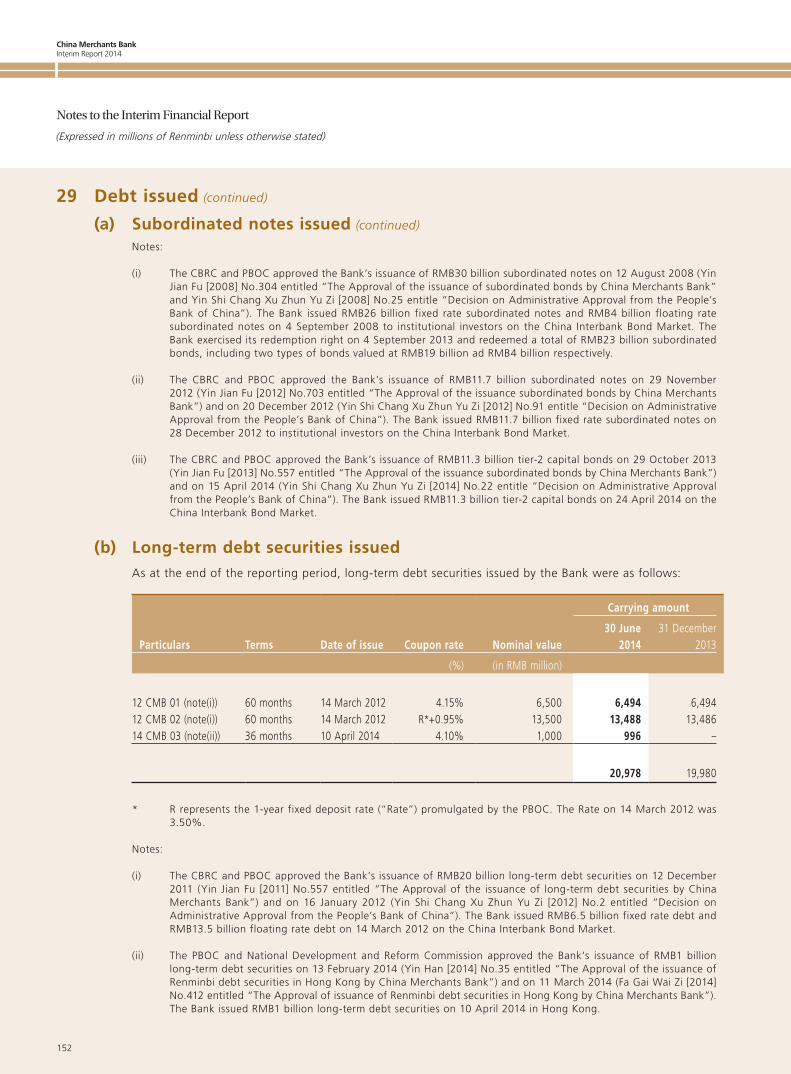
China Merchants BankInterim Report 2014
152
Notes to the Interim Financial Report
(Expressed in millions of Renminbi unless otherwise stated)
29 Debt issued (continued)
(a) Subordinated notes issued (continued)
Notes:
(i) The CBRC and PBOC approved the Bank’s issuance of RMB30 billion subordinated notes on 12 August 2008 (Yin Jian Fu [2008] No.304 entitled “The Approval of the issuance of subordinated bonds by China Merchants Bank” and Yin Shi Chang Xu Zhun Yu Zi [2008] No.25 entitle “Decision on Administrative Approval from the People’s Bank of China”). The Bank issued RMB26 billion fixed rate subordinated notes and RMB4 billion floating rate subordinated notes on 4 September 2008 to institutional investors on the China Interbank Bond Market. The Bank exercised its redemption right on 4 September 2013 and redeemed a total of RMB23 billion subordinated bonds, including two types of bonds valued at RMB19 billion ad RMB4 billion respectively.
(ii) The CBRC and PBOC approved the Bank’s issuance of RMB11.7 billion subordinated notes on 29 November 2012 (Yin Jian Fu [2012] No.703 entitled “The Approval of the issuance subordinated bonds by China Merchants Bank”) and on 20 December 2012 (Yin Shi Chang Xu Zhun Yu Zi [2012] No.91 entitle “Decision on Administrative Approval from the People’s Bank of China”). The Bank issued RMB11.7 billion fixed rate subordinated notes on 28 December 2012 to institutional investors on the China Interbank Bond Market.
(iii) The CBRC and PBOC approved the Bank’s issuance of RMB11.3 billion tier-2 capital bonds on 29 October 2013 (Yin Jian Fu [2013] No.557 entitled “The Approval of the issuance subordinated bonds by China Merchants Bank”) and on 15 April 2014 (Yin Shi Chang Xu Zhun Yu Zi [2014] No.22 entitle “Decision on Administrative Approval from the People’s Bank of China”). The Bank issued RMB11.3 billion tier-2 capital bonds on 24 April 2014 on the China Interbank Bond Market.
(b) Long-term debt securities issuedAs at the end of the reporting period, long-term debt securities issued by the Bank were as follows:
Carrying amount
Particulars Terms Date of issue Coupon rate Nominal value30 June
201431 December
2013
(%) (in RMB million)
12 CMB 01 (note(i)) 60 months 14 March 2012 4.15% 6,500 6,494 6,49412 CMB 02 (note(i)) 60 months 14 March 2012 R*+0.95% 13,500 13,488 13,48614 CMB 03 (note(ii)) 36 months 10 April 2014 4.10% 1,000 996 –
20,978 19,980
* R represents the 1-year fixed deposit rate (“Rate”) promulgated by the PBOC. The Rate on 14 March 2012 was 3.50%.
Notes:
(i) The CBRC and PBOC approved the Bank’s issuance of RMB20 billion long-term debt securities on 12 December 2011 (Yin Jian Fu [2011] No.557 entitled “The Approval of the issuance of long-term debt securities by China Merchants Bank”) and on 16 January 2012 (Yin Shi Chang Xu Zhun Yu Zi [2012] No.2 entitled “Decision on Administrative Approval from the People’s Bank of China”). The Bank issued RMB6.5 billion fixed rate debt and RMB13.5 billion floating rate debt on 14 March 2012 on the China Interbank Bond Market.
(ii) The PBOC and National Development and Reform Commission approved the Bank’s issuance of RMB1 billion long-term debt securities on 13 February 2014 (Yin Han [2014] No.35 entitled “The Approval of the issuance of Renminbi debt securities in Hong Kong by China Merchants Bank”) and on 11 March 2014 (Fa Gai Wai Zi [2014] No.412 entitled “The Approval of issuance of Renminbi debt securities in Hong Kong by China Merchants Bank”). The Bank issued RMB1 billion long-term debt securities on 10 April 2014 in Hong Kong.
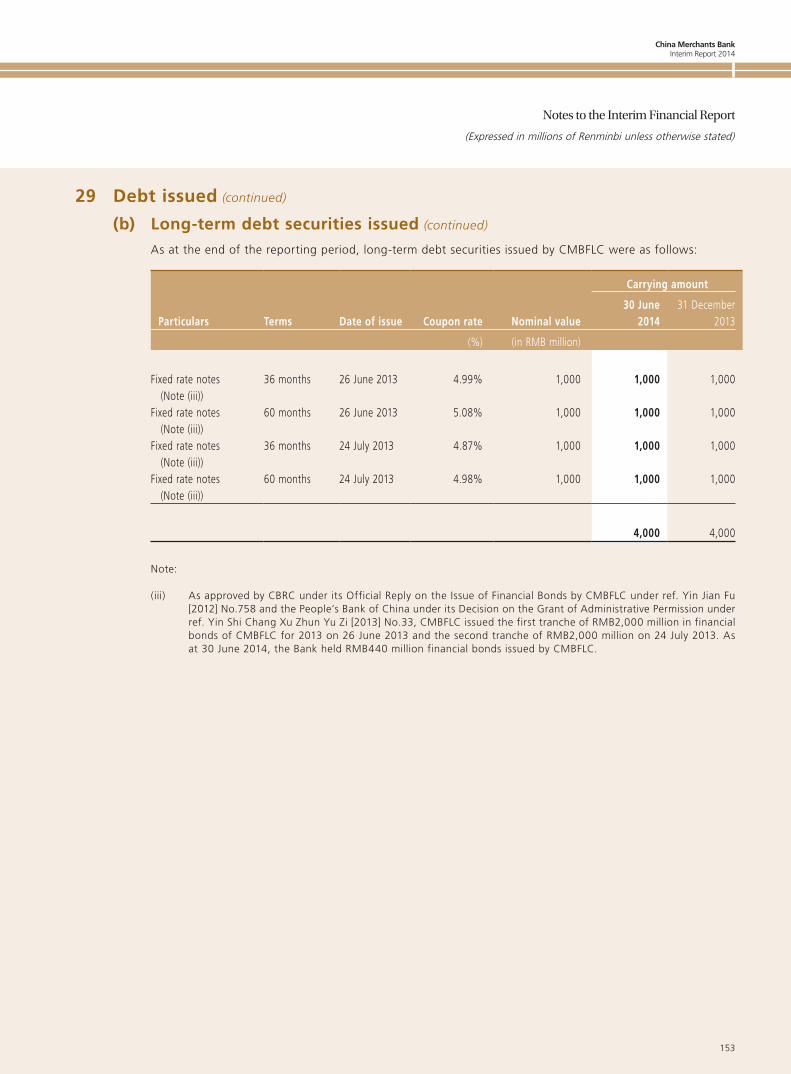
China Merchants BankInterim Report 2014
153
Notes to the Interim Financial Report
(Expressed in millions of Renminbi unless otherwise stated)
29 Debt issued (continued)
(b) Long-term debt securities issued (continued)
As at the end of the reporting period, long-term debt securities issued by CMBFLC were as follows:
Carrying amount
Particulars Terms Date of issue Coupon rate Nominal value30 June
201431 December
2013
(%) (in RMB million)
Fixed rate notes (Note (iii))
36 months 26 June 2013 4.99% 1,000 1,000 1,000
Fixed rate notes (Note (iii))
60 months 26 June 2013 5.08% 1,000 1,000 1,000
Fixed rate notes (Note (iii))
36 months 24 July 2013 4.87% 1,000 1,000 1,000
Fixed rate notes (Note (iii))
60 months 24 July 2013 4.98% 1,000 1,000 1,000
4,000 4,000
Note:
(iii) As approved by CBRC under its Official Reply on the Issue of Financial Bonds by CMBFLC under ref. Yin Jian Fu [2012] No.758 and the People’s Bank of China under its Decision on the Grant of Administrative Permission under ref. Yin Shi Chang Xu Zhun Yu Zi [2013] No.33, CMBFLC issued the first tranche of RMB2,000 million in financial bonds of CMBFLC for 2013 on 26 June 2013 and the second tranche of RMB2,000 million on 24 July 2013. As at 30 June 2014, the Bank held RMB440 million financial bonds issued by CMBFLC.
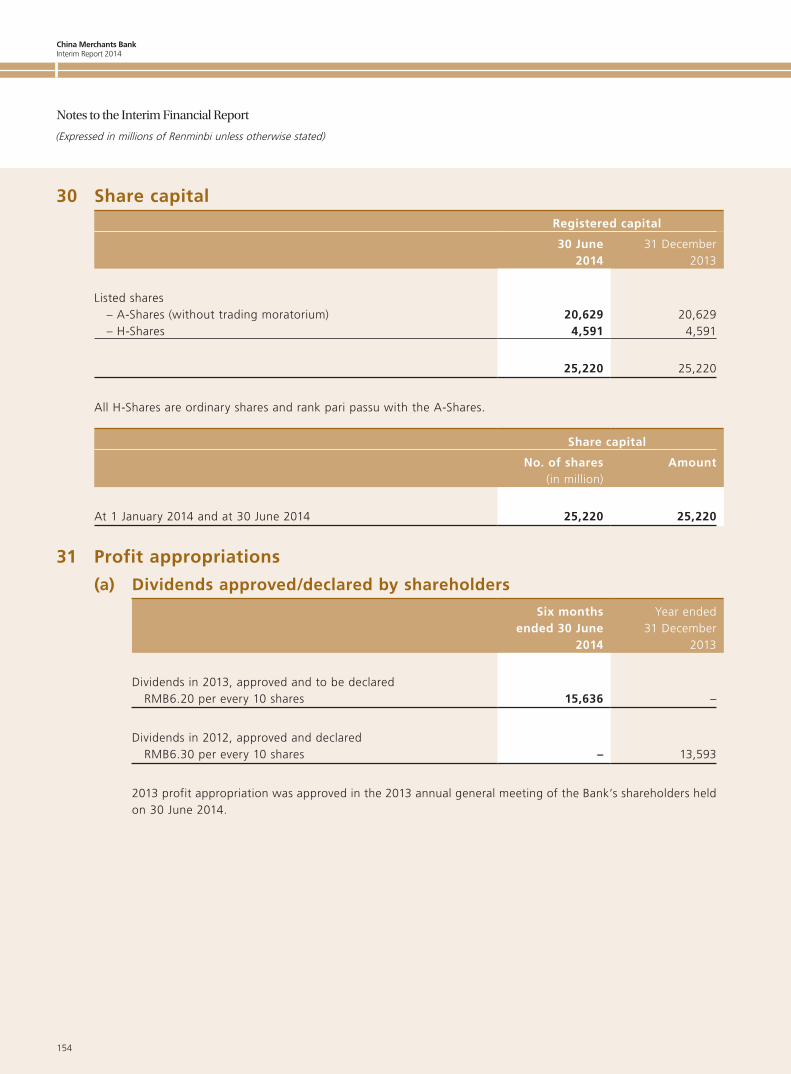
China Merchants BankInterim Report 2014
154
Notes to the Interim Financial Report
(Expressed in millions of Renminbi unless otherwise stated)
30 Share capitalRegistered capital
30 June2014
31 December2013
Listed shares – A-Shares (without trading moratorium) 20,629 20,629 – H-Shares 4,591 4,591
25,220 25,220
All H-Shares are ordinary shares and rank pari passu with the A-Shares.
Share capital
No. of shares Amount(in million)
At 1 January 2014 and at 30 June 2014 25,220 25,220
31 Profit appropriations
(a) Dividends approved/declared by shareholders
Six monthsended 30 June
2014
Year ended31 December
2013
Dividends in 2013, approved and to be declared RMB6.20 per every 10 shares 15,636 –
Dividends in 2012, approved and declared RMB6.30 per every 10 shares – 13,593
2013 profit appropriation was approved in the 2013 annual general meeting of the Bank’s shareholders held on 30 June 2014.
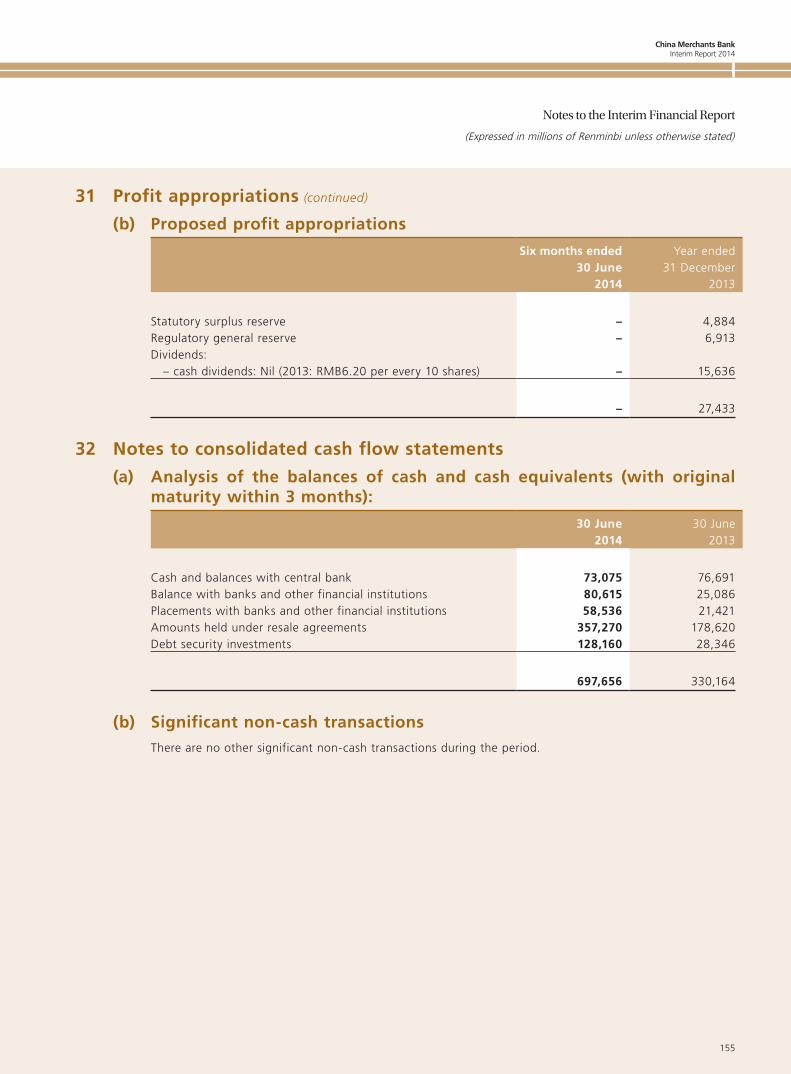
China Merchants BankInterim Report 2014
155
Notes to the Interim Financial Report
(Expressed in millions of Renminbi unless otherwise stated)
31 Profit appropriations (continued)
(b) Proposed profit appropriations
Six months ended30 June
2014
Year ended31 December
2013
Statutory surplus reserve – 4,884Regulatory general reserve – 6,913Dividends: – cash dividends: Nil (2013: RMB6.20 per every 10 shares) – 15,636
– 27,433
32 Notes to consolidated cash flow statements
(a) Analysis of the balances of cash and cash equivalents (with original maturity within 3 months):
30 June2014
30 June2013
Cash and balances with central bank 73,075 76,691Balance with banks and other financial institutions 80,615 25,086Placements with banks and other financial institutions 58,536 21,421Amounts held under resale agreements 357,270 178,620Debt security investments 128,160 28,346
697,656 330,164
(b) Significant non-cash transactionsThere are no other significant non-cash transactions during the period.
China Merchants BankInterim Report 2014
156
Notes to the Interim Financial Report
(Expressed in millions of Renminbi unless otherwise stated)
33 Operating segmentsThe Group’s principal activities are commercial lending and deposits taking. The funding of existing retail and corporate loans are mainly from customer deposits.
The Group manages its businesses by divisions, which are organised by a mixture of both business lines and geography.
In 2014, the Bank adjusted its organisational structure in respect of corporate finance, retail finance and interbank finance, and assesses their business decisions, reporting and performance. The Bank management accounting report also adjusted segment reporting of different business lines in 2014. The “interbank business” and “custody activities” in the wholesale banking segment and “financial market business” in the treasury business segment are classified as “interbank financial service”. The “treasurer business” in the treasury business segment is classified as “other business”. The Group’s three main business reporting segments after adjustment are as follows:
– Corporate bankingThe provision of financial services to corporations and institutions includes lending and deposit taking activities, clearing and cash management service, trade finance and offshore business, investment banking and other services.
– Retail bankingThe provision of financial services to retail customers includes lending and deposit taking activities, bank card business, wealth management services, private banking and other services.
– Interbank financial serviceThis segment business includes interbank organisation transactions such as interbank lending and repurchasing activities, custody activities and financial market service.
– Other BusinessOthers covers treasurer services, transfer pricing within the Bank’s virtual fund pool, investment properties, investment in subsidiaries, associates and joint ventures, and other relevant businesses. None of these segments meets any of the quantitative thresholds so far for determining reportable segments.
For the purpose of operating segment analysis, external net interest income/expense represents the net interest income earned or expense incurred on external banking services. Internal net interest income/expense represents the assumed profit or loss by the internal funds transfer pricing mechanism, which has taken into account the structure and market returns of the assets and liabilities portfolio. Cost allocation is based on direct costs attributable to each reporting segment and the relevant agent apportion.
Corresponding comparative figures of business segment reporting have been restated.
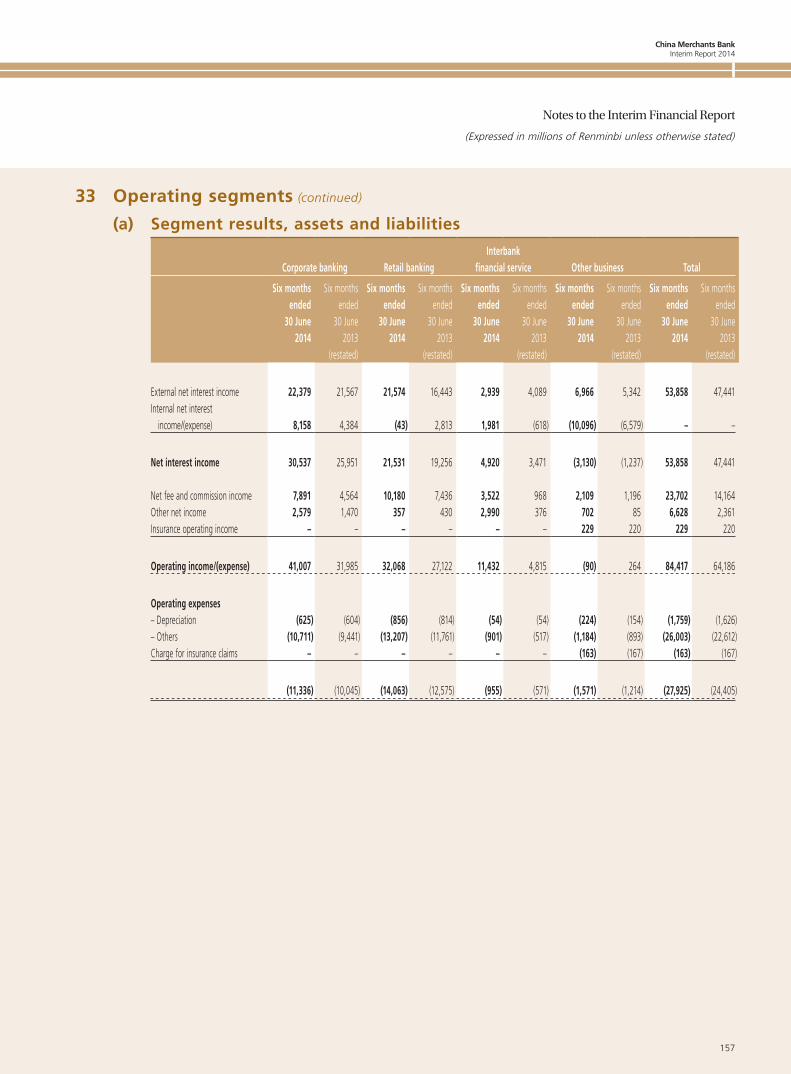
China Merchants BankInterim Report 2014
157
Notes to the Interim Financial Report
(Expressed in millions of Renminbi unless otherwise stated)
33 Operating segments (continued)
(a) Segment results, assets and liabilities
Corporate banking Retail bankingInterbank
financial service Other business Total
Six monthsended
30 June 2014
Six monthsended
30 June 2013
Six monthsended
30 June 2014
Six monthsended
30 June 2013
Six monthsended
30 June 2014
Six monthsended
30 June 2013
Six monthsended
30 June 2014
Six monthsended
30 June 2013
Six monthsended
30 June 2014
Six monthsended
30 June 2013
(restated) (restated) (restated) (restated) (restated)
External net interest income 22,379 21,567 21,574 16,443 2,939 4,089 6,966 5,342 53,858 47,441Internal net interest income/(expense) 8,158 4,384 (43) 2,813 1,981 (618) (10,096) (6,579) – –
Net interest income 30,537 25,951 21,531 19,256 4,920 3,471 (3,130) (1,237) 53,858 47,441
Net fee and commission income 7,891 4,564 10,180 7,436 3,522 968 2,109 1,196 23,702 14,164Other net income 2,579 1,470 357 430 2,990 376 702 85 6,628 2,361Insurance operating income – – – – – – 229 220 229 220
Operating income/(expense) 41,007 31,985 32,068 27,122 11,432 4,815 (90) 264 84,417 64,186
Operating expenses– Depreciation (625) (604) (856) (814) (54) (54) (224) (154) (1,759) (1,626)– Others (10,711) (9,441) (13,207) (11,761) (901) (517) (1,184) (893) (26,003) (22,612)Charge for insurance claims – – – – – – (163) (167) (163) (167)
(11,336) (10,045) (14,063) (12,575) (955) (571) (1,571) (1,214) (27,925) (24,405)
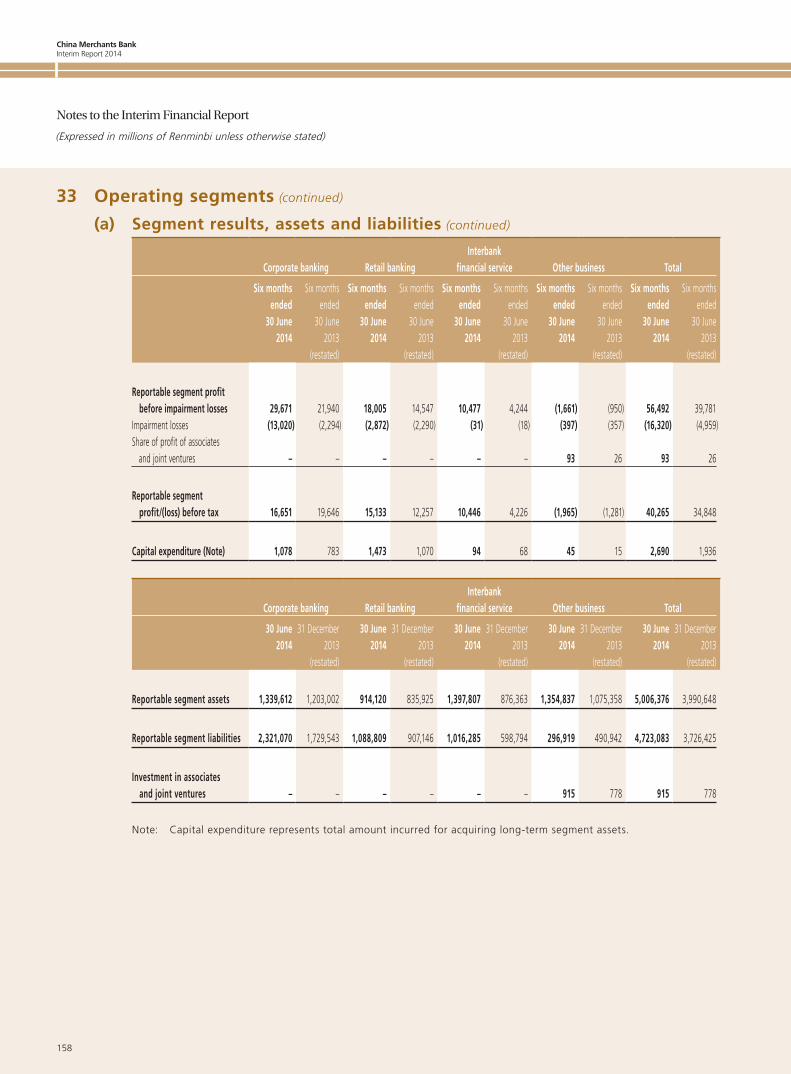
China Merchants BankInterim Report 2014
158
Notes to the Interim Financial Report
(Expressed in millions of Renminbi unless otherwise stated)
33 Operating segments (continued)
(a) Segment results, assets and liabilities (continued)
Corporate banking Retail bankingInterbank
financial service Other business Total Six months
ended 30 June
2014
Six monthsended
30 June 2013
Six monthsended
30 June 2014
Six monthsended
30 June 2013
Six monthsended
30 June 2014
Six monthsended
30 June 2013
Six monthsended
30 June 2014
Six monthsended
30 June 2013
Six monthsended
30 June 2014
Six monthsended
30 June 2013
(restated) (restated) (restated) (restated) (restated)
Reportable segment profit before impairment losses 29,671 21,940 18,005 14,547 10,477 4,244 (1,661) (950) 56,492 39,781Impairment losses (13,020) (2,294) (2,872) (2,290) (31) (18) (397) (357) (16,320) (4,959)Share of profit of associates and joint ventures – – – – – – 93 26 93 26
Reportable segment profit/(loss) before tax 16,651 19,646 15,133 12,257 10,446 4,226 (1,965) (1,281) 40,265 34,848
Capital expenditure (Note) 1,078 783 1,473 1,070 94 68 45 15 2,690 1,936
Corporate banking Retail bankingInterbank
financial service Other business Total 30 June 31 December 30 June 31 December 30 June 31 December 30 June 31 December 30 June 31 December
2014 2013 2014 2013 2014 2013 2014 2013 2014 2013(restated) (restated) (restated) (restated) (restated)
Reportable segment assets 1,339,612 1,203,002 914,120 835,925 1,397,807 876,363 1,354,837 1,075,358 5,006,376 3,990,648
Reportable segment liabilities 2,321,070 1,729,543 1,088,809 907,146 1,016,285 598,794 296,919 490,942 4,723,083 3,726,425
Investment in associates and joint ventures – – – – – – 915 778 915 778
Note: Capital expenditure represents total amount incurred for acquiring long-term segment assets.
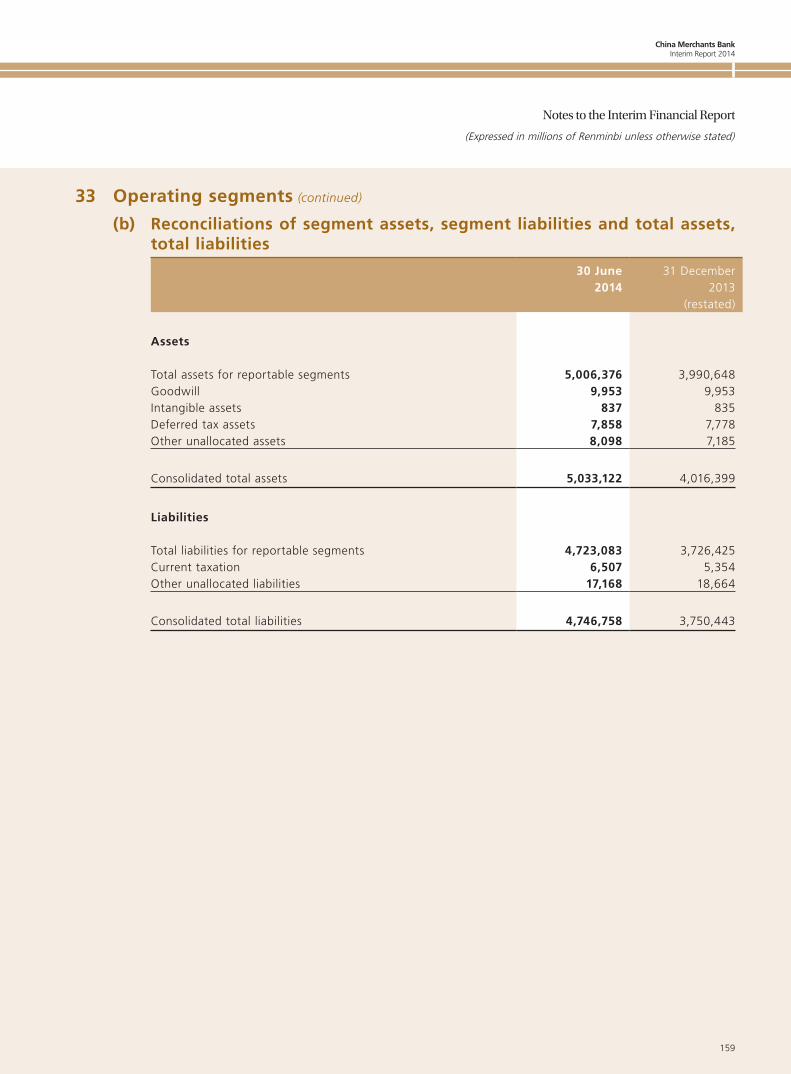
China Merchants BankInterim Report 2014
159
Notes to the Interim Financial Report
(Expressed in millions of Renminbi unless otherwise stated)
33 Operating segments (continued)
(b) Reconciliations of segment assets, segment liabilities and total assets, total liabilities
30 June2014
31 December2013
(restated)
Assets
Total assets for reportable segments 5,006,376 3,990,648Goodwill 9,953 9,953Intangible assets 837 835Deferred tax assets 7,858 7,778Other unallocated assets 8,098 7,185
Consolidated total assets 5,033,122 4,016,399
Liabilities
Total liabilities for reportable segments 4,723,083 3,726,425Current taxation 6,507 5,354Other unallocated liabilities 17,168 18,664
Consolidated total liabilities 4,746,758 3,750,443
China Merchants BankInterim Report 2014
160
Notes to the Interim Financial Report
(Expressed in millions of Renminbi unless otherwise stated)
33 Operating segments (continued)
(c) Geographical segmentsThe Group operates principally in the PRC with branches located in major provinces, autonomous regions and municipalities directly under the central government. The Group also has branches operation in Hong Kong, New York and Singapore; subsidiaries operating in Hong Kong and Shanghai and representative offices in London, the United States of America and Taiwan.
In presenting information on the basis of geographical segments, operating income is allocated based on the location of the branches that generated the revenue. Segment assets and non-current assets are allocated based on the geographical location of the underlying assets.
Geographical segments, as defined for bank operation and management reporting purposes, are as follows:
– “Headquarter” refers to the Group headquarter, special purpose vehicles at the branch level which are directly under the headquarter, associates and joint ventures, including the headquarter and credit card centres, etc;
– “Yangtze River Delta region” refers to branches in Shanghai municipality, Zhejiang province and Jiangsu province;
– “Bohai Rim region” refers to branches in Beijing municipality, Tianjin municipality, Shandong province and Hebei province;
– “Pearl River Delta and West Coast region” refers to branches in Guangdong province and Fujian province;
– “Northeast region” refers to branches in Liaoning province, Heilongjiang province and Jilin province;
– “Central region” refers to branches in Henan province, Anhui province, Hunan province, Hubei province, Jiangxi province, Shanxi province and Hainan province;
– “Western region” refers to branches in Sichuan province, Chongqing municipality, Guizhou province, Yunnan province, Shanxi province, Gansu province, Ningxia Hui Autonomous region, Xinjiang Uyghur Autonomous region, Guangxi Zhuang Autonomous region, Inner Mongolia Autonomous region, Qinghai province and Tibet Autonomous region;
– “Overseas” refers to overseas branches in Hong Kong, New York, Singapore and representative offices in London, United States of America and Taiwan; and
– “Subsidiaries” refers to subsidiaries of the Group, including WLB, CMBICC, CMBFLC and CMFM.
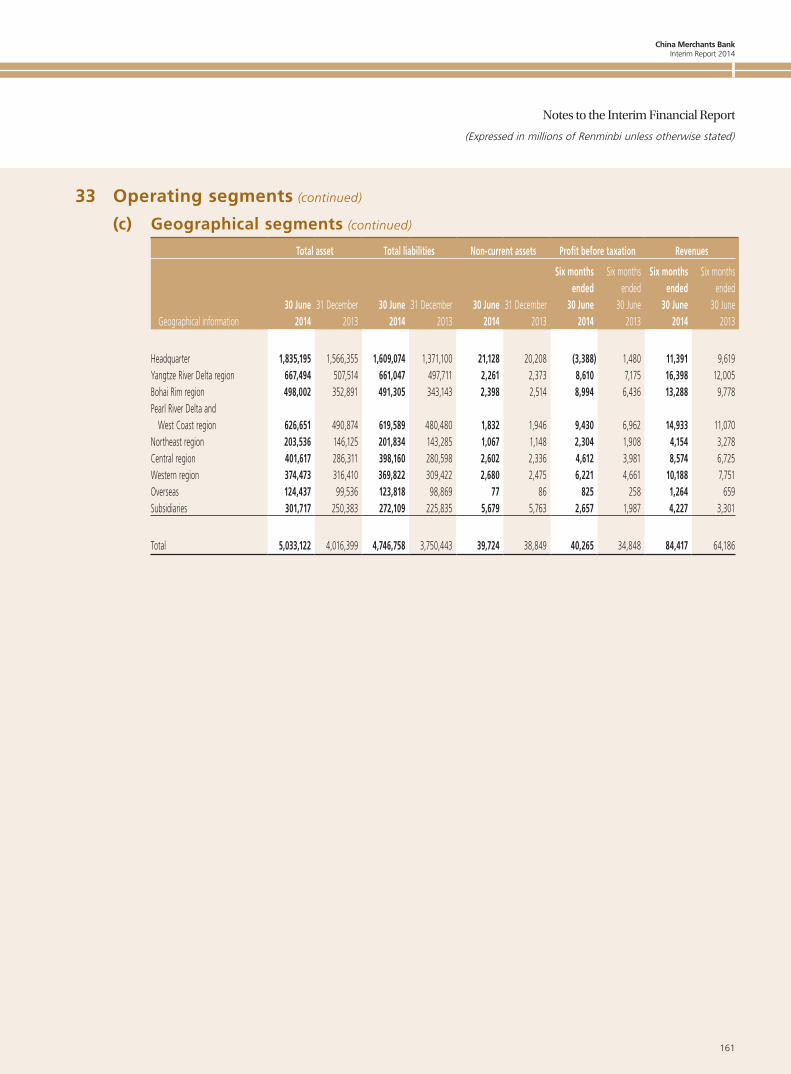
China Merchants BankInterim Report 2014
161
Notes to the Interim Financial Report
(Expressed in millions of Renminbi unless otherwise stated)
33 Operating segments (continued)
(c) Geographical segments (continued)
Total asset Total liabilities Non-current assets Profit before taxation Revenues
Geographical information30 June
201431 December
201330 June
201431 December
201330 June
201431 December
2013
Six months ended
30 June 2014
Six months ended
30 June 2013
Six months ended
30 June 2014
Six months ended
30 June 2013
Headquarter 1,835,195 1,566,355 1,609,074 1,371,100 21,128 20,208 (3,388) 1,480 11,391 9,619Yangtze River Delta region 667,494 507,514 661,047 497,711 2,261 2,373 8,610 7,175 16,398 12,005Bohai Rim region 498,002 352,891 491,305 343,143 2,398 2,514 8,994 6,436 13,288 9,778Pearl River Delta and West Coast region 626,651 490,874 619,589 480,480 1,832 1,946 9,430 6,962 14,933 11,070Northeast region 203,536 146,125 201,834 143,285 1,067 1,148 2,304 1,908 4,154 3,278Central region 401,617 286,311 398,160 280,598 2,602 2,336 4,612 3,981 8,574 6,725Western region 374,473 316,410 369,822 309,422 2,680 2,475 6,221 4,661 10,188 7,751Overseas 124,437 99,536 123,818 98,869 77 86 825 258 1,264 659Subsidiaries 301,717 250,383 272,109 225,835 5,679 5,763 2,657 1,987 4,227 3,301
Total 5,033,122 4,016,399 4,746,758 3,750,443 39,724 38,849 40,265 34,848 84,417 64,186
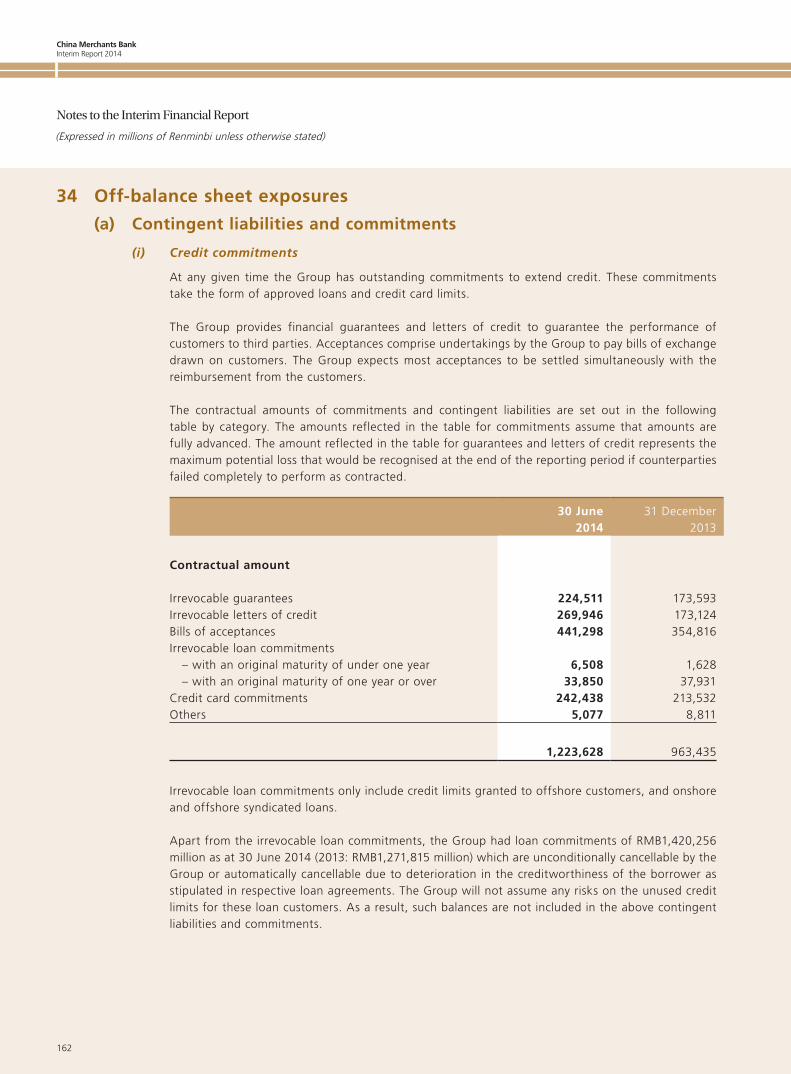
China Merchants BankInterim Report 2014
162
Notes to the Interim Financial Report
(Expressed in millions of Renminbi unless otherwise stated)
34 Off-balance sheet exposures
(a) Contingent liabilities and commitments
(i) Credit commitments
At any given time the Group has outstanding commitments to extend credit. These commitments take the form of approved loans and credit card limits.
The Group provides financial guarantees and letters of credit to guarantee the performance of customers to third parties. Acceptances comprise undertakings by the Group to pay bills of exchange drawn on customers. The Group expects most acceptances to be settled simultaneously with the reimbursement from the customers.
The contractual amounts of commitments and contingent liabilities are set out in the following table by category. The amounts reflected in the table for commitments assume that amounts are fully advanced. The amount reflected in the table for guarantees and letters of credit represents the maximum potential loss that would be recognised at the end of the reporting period if counterparties failed completely to perform as contracted.
30 June2014
31 December2013
Contractual amount
Irrevocable guarantees 224,511 173,593Irrevocable letters of credit 269,946 173,124Bills of acceptances 441,298 354,816Irrevocable loan commitments – with an original maturity of under one year 6,508 1,628 – with an original maturity of one year or over 33,850 37,931Credit card commitments 242,438 213,532Others 5,077 8,811
1,223,628 963,435
Irrevocable loan commitments only include credit limits granted to offshore customers, and onshore and offshore syndicated loans.
Apart from the irrevocable loan commitments, the Group had loan commitments of RMB1,420,256 million as at 30 June 2014 (2013: RMB1,271,815 million) which are unconditionally cancellable by the Group or automatically cancellable due to deterioration in the creditworthiness of the borrower as stipulated in respective loan agreements. The Group will not assume any risks on the unused credit limits for these loan customers. As a result, such balances are not included in the above contingent liabilities and commitments.
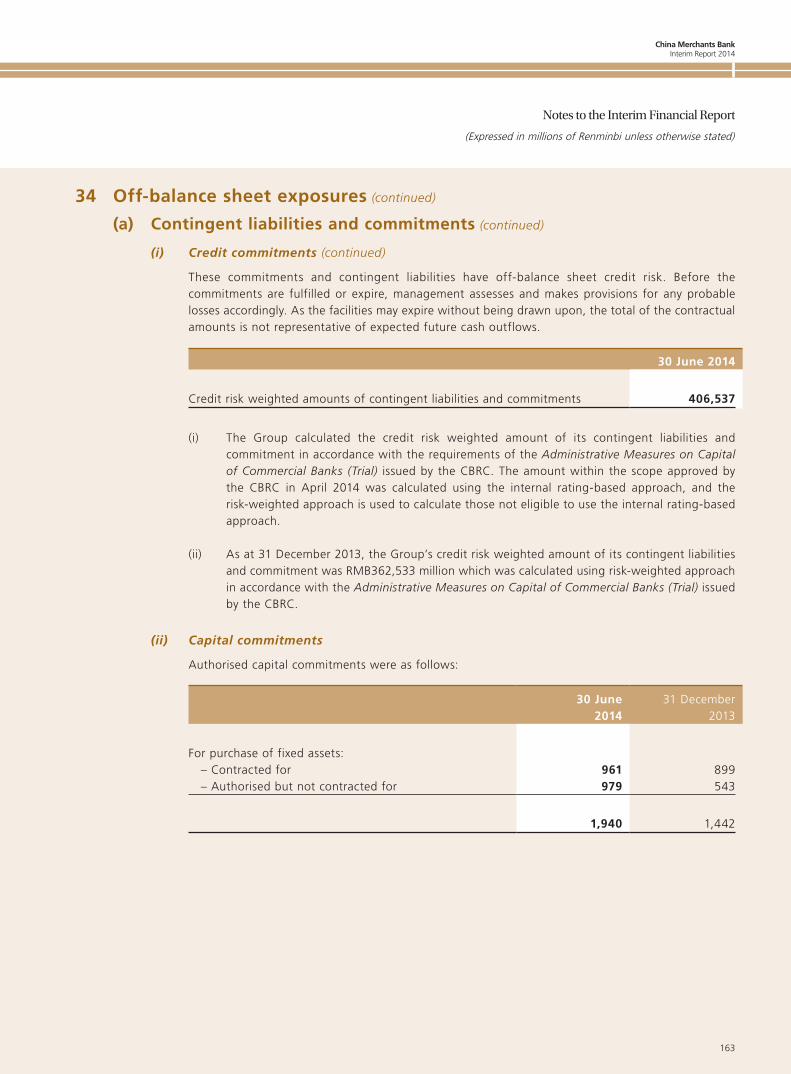
China Merchants BankInterim Report 2014
163
Notes to the Interim Financial Report
(Expressed in millions of Renminbi unless otherwise stated)
34 Off-balance sheet exposures (continued)
(a) Contingent liabilities and commitments (continued)
(i) Credit commitments (continued)
These commitments and contingent liabilities have off-balance sheet credit risk. Before the commitments are fulfilled or expire, management assesses and makes provisions for any probable losses accordingly. As the facilities may expire without being drawn upon, the total of the contractual amounts is not representative of expected future cash outflows.
30 June 2014
Credit risk weighted amounts of contingent liabilities and commitments 406,537
(i) The Group calculated the credit risk weighted amount of its contingent liabilities and commitment in accordance with the requirements of the Administrative Measures on Capital of Commercial Banks (Trial) issued by the CBRC. The amount within the scope approved by the CBRC in April 2014 was calculated using the internal rating-based approach, and the risk-weighted approach is used to calculate those not eligible to use the internal rating-based approach.
(ii) As at 31 December 2013, the Group’s credit risk weighted amount of its contingent liabilities and commitment was RMB362,533 million which was calculated using risk-weighted approach in accordance with the Administrative Measures on Capital of Commercial Banks (Trial) issued by the CBRC.
(ii) Capital commitments
Authorised capital commitments were as follows:
30 June2014
31 December2013
For purchase of fixed assets: – Contracted for 961 899 – Authorised but not contracted for 979 543
1,940 1,442
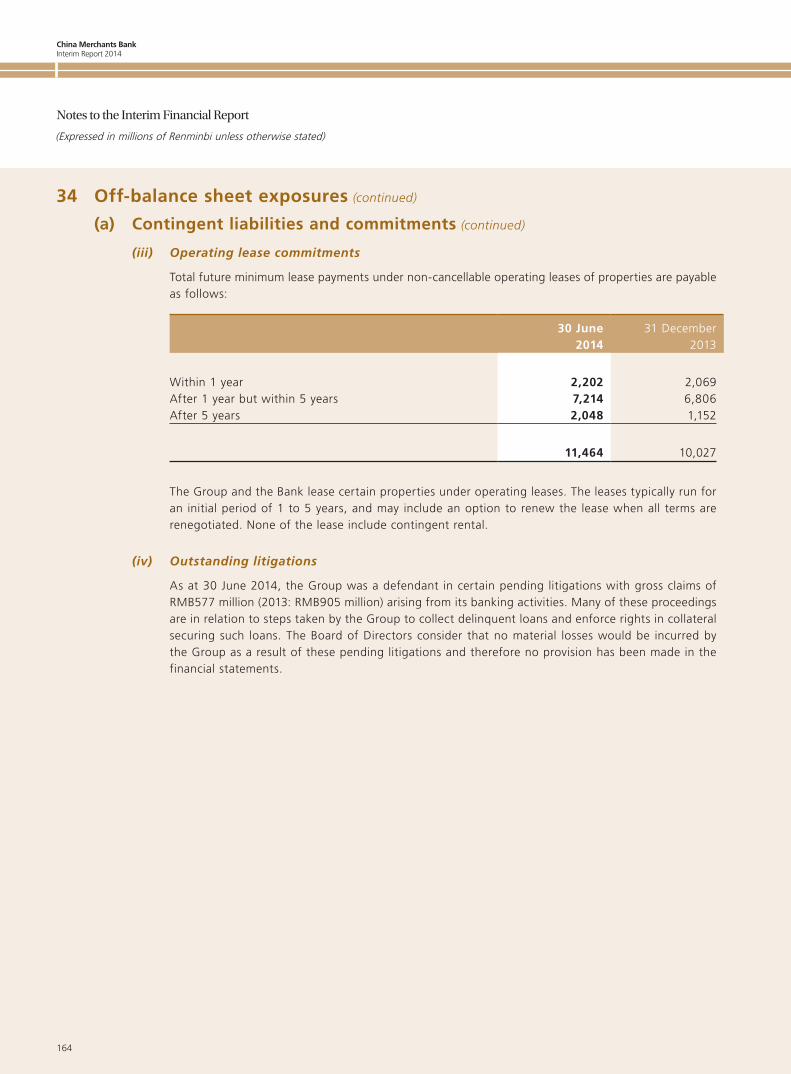
China Merchants BankInterim Report 2014
164
Notes to the Interim Financial Report
(Expressed in millions of Renminbi unless otherwise stated)
34 Off-balance sheet exposures (continued)
(a) Contingent liabilities and commitments (continued)
(iii) Operating lease commitments
Total future minimum lease payments under non-cancellable operating leases of properties are payable as follows:
30 June2014
31 December2013
Within 1 year 2,202 2,069After 1 year but within 5 years 7,214 6,806After 5 years 2,048 1,152
11,464 10,027
The Group and the Bank lease certain properties under operating leases. The leases typically run for an initial period of 1 to 5 years, and may include an option to renew the lease when all terms are renegotiated. None of the lease include contingent rental.
(iv) Outstanding litigations
As at 30 June 2014, the Group was a defendant in certain pending litigations with gross claims of RMB577 million (2013: RMB905 million) arising from its banking activities. Many of these proceedings are in relation to steps taken by the Group to collect delinquent loans and enforce rights in collateral securing such loans. The Board of Directors consider that no material losses would be incurred by the Group as a result of these pending litigations and therefore no provision has been made in the financial statements.
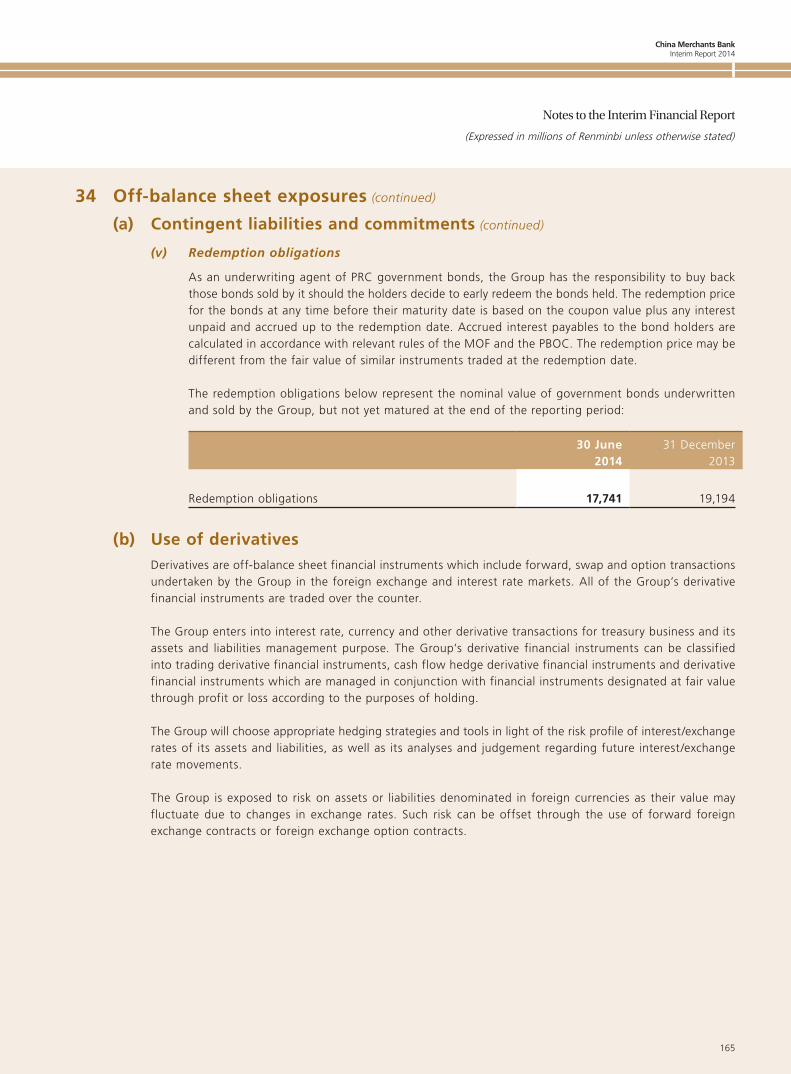
China Merchants BankInterim Report 2014
165
Notes to the Interim Financial Report
(Expressed in millions of Renminbi unless otherwise stated)
34 Off-balance sheet exposures (continued)
(a) Contingent liabilities and commitments (continued)
(v) Redemption obligations
As an underwriting agent of PRC government bonds, the Group has the responsibility to buy back those bonds sold by it should the holders decide to early redeem the bonds held. The redemption price for the bonds at any time before their maturity date is based on the coupon value plus any interest unpaid and accrued up to the redemption date. Accrued interest payables to the bond holders are calculated in accordance with relevant rules of the MOF and the PBOC. The redemption price may be different from the fair value of similar instruments traded at the redemption date.
The redemption obligations below represent the nominal value of government bonds underwritten and sold by the Group, but not yet matured at the end of the reporting period:
30 June2014
31 December2013
Redemption obligations 17,741 19,194
(b) Use of derivativesDerivatives are off-balance sheet financial instruments which include forward, swap and option transactions undertaken by the Group in the foreign exchange and interest rate markets. All of the Group’s derivative financial instruments are traded over the counter.
The Group enters into interest rate, currency and other derivative transactions for treasury business and its assets and liabilities management purpose. The Group’s derivative financial instruments can be classified into trading derivative financial instruments, cash flow hedge derivative financial instruments and derivative financial instruments which are managed in conjunction with financial instruments designated at fair value through profit or loss according to the purposes of holding.
The Group will choose appropriate hedging strategies and tools in light of the risk profile of interest/exchange rates of its assets and liabilities, as well as its analyses and judgement regarding future interest/exchange rate movements.
The Group is exposed to risk on assets or liabilities denominated in foreign currencies as their value may fluctuate due to changes in exchange rates. Such risk can be offset through the use of forward foreign exchange contracts or foreign exchange option contracts.
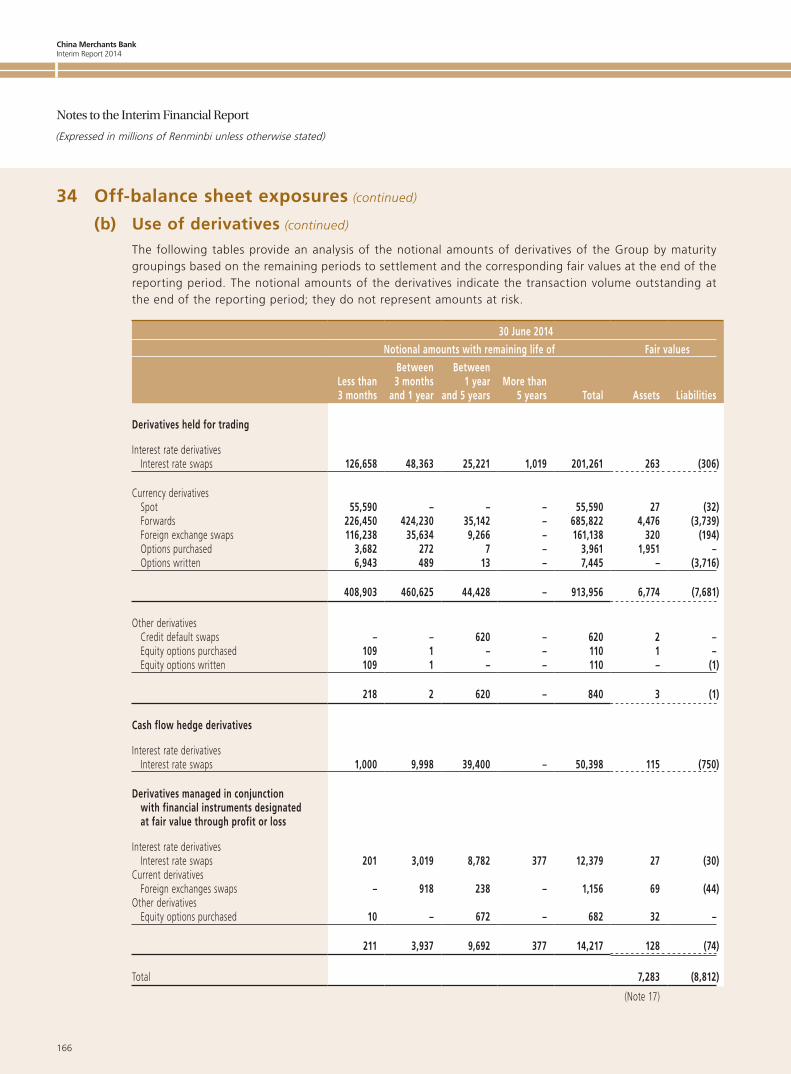
China Merchants BankInterim Report 2014
166
Notes to the Interim Financial Report
(Expressed in millions of Renminbi unless otherwise stated)
34 Off-balance sheet exposures (continued)
(b) Use of derivatives (continued)
The following tables provide an analysis of the notional amounts of derivatives of the Group by maturity groupings based on the remaining periods to settlement and the corresponding fair values at the end of the reporting period. The notional amounts of the derivatives indicate the transaction volume outstanding at the end of the reporting period; they do not represent amounts at risk.
30 June 2014
Notional amounts with remaining life of Fair values
Less than3 months
Between3 months
and 1 year
Between1 year
and 5 yearsMore than
5 years Total Assets Liabilities
Derivatives held for trading
Interest rate derivatives Interest rate swaps 126,658 48,363 25,221 1,019 201,261 263 (306)
Currency derivatives Spot 55,590 – – – 55,590 27 (32) Forwards 226,450 424,230 35,142 – 685,822 4,476 (3,739) Foreign exchange swaps 116,238 35,634 9,266 – 161,138 320 (194) Options purchased 3,682 272 7 – 3,961 1,951 – Options written 6,943 489 13 – 7,445 – (3,716)
408,903 460,625 44,428 – 913,956 6,774 (7,681)
Other derivatives Credit default swaps – – 620 – 620 2 – Equity options purchased 109 1 – – 110 1 – Equity options written 109 1 – – 110 – (1)
218 2 620 – 840 3 (1)
Cash flow hedge derivatives
Interest rate derivatives Interest rate swaps 1,000 9,998 39,400 – 50,398 115 (750)
Derivatives managed in conjunction with financial instruments designated at fair value through profit or loss
Interest rate derivatives Interest rate swaps 201 3,019 8,782 377 12,379 27 (30)Current derivatives Foreign exchanges swaps – 918 238 – 1,156 69 (44)Other derivatives Equity options purchased 10 – 672 – 682 32 –
211 3,937 9,692 377 14,217 128 (74)
Total 7,283 (8,812)
(Note 17)
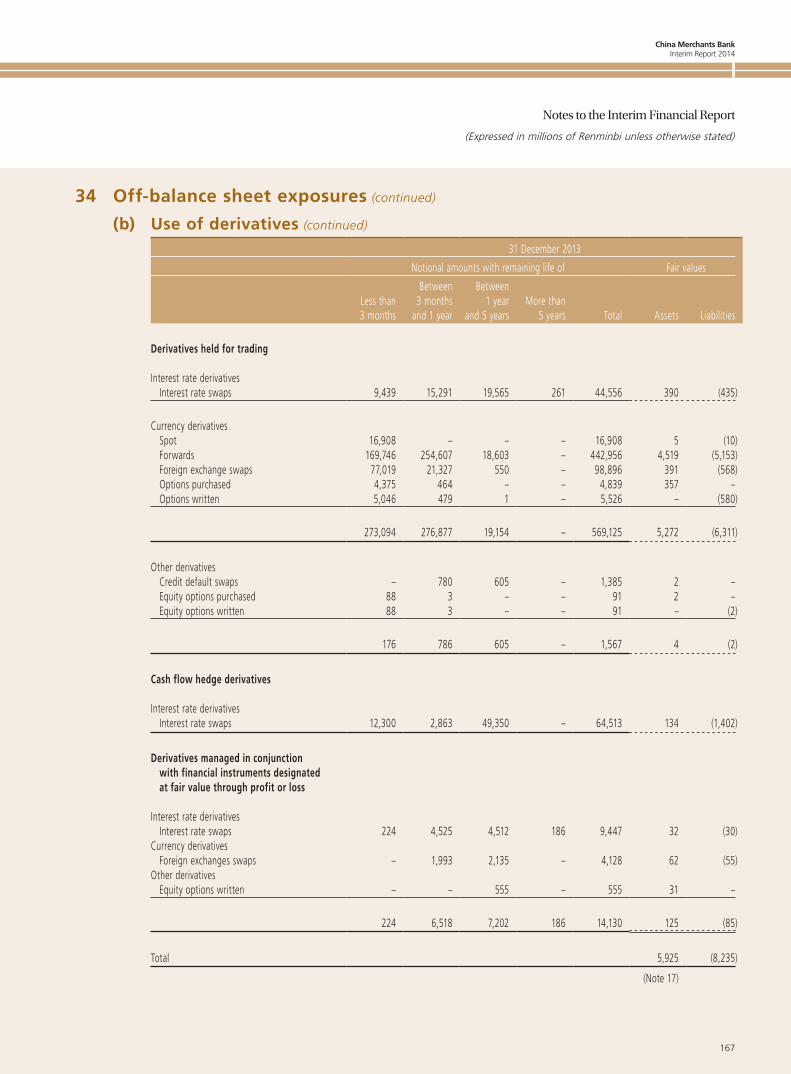
China Merchants BankInterim Report 2014
167
Notes to the Interim Financial Report
(Expressed in millions of Renminbi unless otherwise stated)
34 Off-balance sheet exposures (continued)
(b) Use of derivatives (continued)
31 December 2013
Notional amounts with remaining life of Fair values
Less than3 months
Between3 months
and 1 year
Between1 year
and 5 yearsMore than
5 years Total Assets Liabilities
Derivatives held for trading
Interest rate derivatives Interest rate swaps 9,439 15,291 19,565 261 44,556 390 (435)
Currency derivatives Spot 16,908 – – – 16,908 5 (10) Forwards 169,746 254,607 18,603 – 442,956 4,519 (5,153) Foreign exchange swaps 77,019 21,327 550 – 98,896 391 (568) Options purchased 4,375 464 – – 4,839 357 – Options written 5,046 479 1 – 5,526 – (580)
273,094 276,877 19,154 – 569,125 5,272 (6,311)
Other derivatives Credit default swaps – 780 605 – 1,385 2 – Equity options purchased 88 3 – – 91 2 – Equity options written 88 3 – – 91 – (2)
176 786 605 – 1,567 4 (2)
Cash flow hedge derivatives
Interest rate derivatives Interest rate swaps 12,300 2,863 49,350 – 64,513 134 (1,402)
Derivatives managed in conjunction with financial instruments designated at fair value through profit or loss
Interest rate derivatives Interest rate swaps 224 4,525 4,512 186 9,447 32 (30)Currency derivatives Foreign exchanges swaps – 1,993 2,135 – 4,128 62 (55)Other derivatives Equity options written – – 555 – 555 31 –
224 6,518 7,202 186 14,130 125 (85)
Total 5,925 (8,235)
(Note 17)
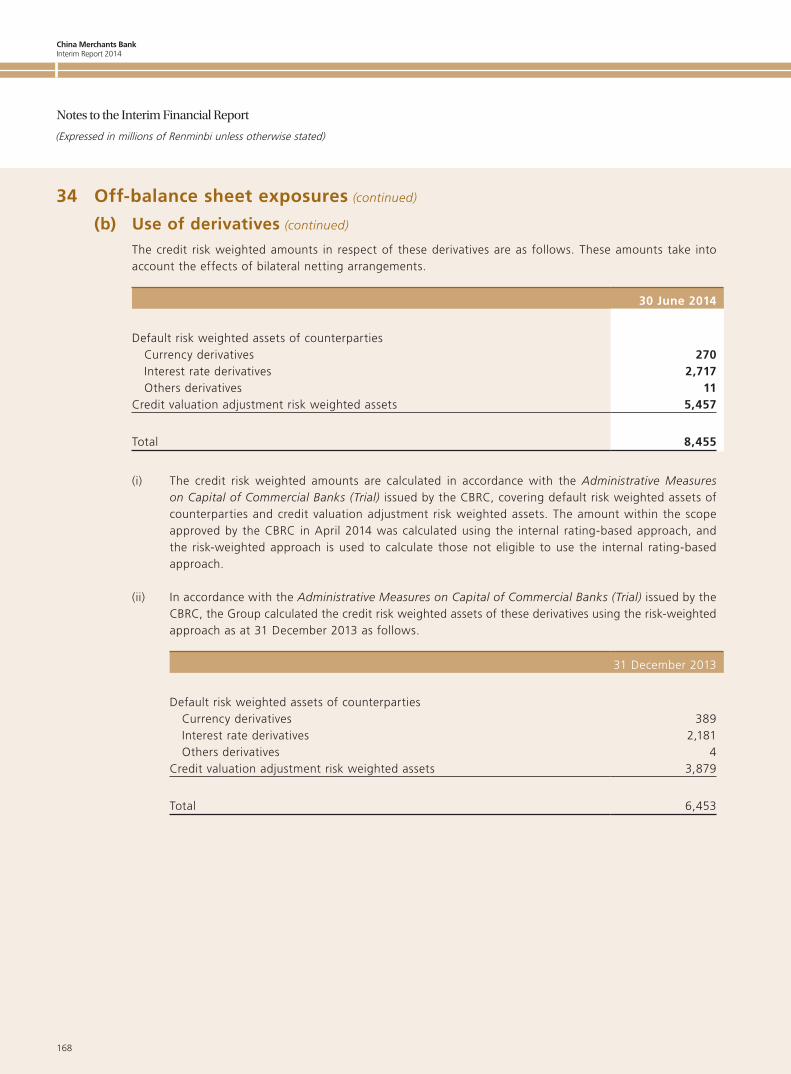
China Merchants BankInterim Report 2014
168
Notes to the Interim Financial Report
(Expressed in millions of Renminbi unless otherwise stated)
34 Off-balance sheet exposures (continued)
(b) Use of derivatives (continued)
The credit risk weighted amounts in respect of these derivatives are as follows. These amounts take into account the effects of bilateral netting arrangements.
30 June 2014
Default risk weighted assets of counterparties Currency derivatives 270 Interest rate derivatives 2,717 Others derivatives 11Credit valuation adjustment risk weighted assets 5,457
Total 8,455
(i) The credit risk weighted amounts are calculated in accordance with the Administrative Measures on Capital of Commercial Banks (Trial) issued by the CBRC, covering default risk weighted assets of counterparties and credit valuation adjustment risk weighted assets. The amount within the scope approved by the CBRC in April 2014 was calculated using the internal rating-based approach, and the risk-weighted approach is used to calculate those not eligible to use the internal rating-based approach.
(ii) In accordance with the Administrative Measures on Capital of Commercial Banks (Trial) issued by the CBRC, the Group calculated the credit risk weighted assets of these derivatives using the risk-weighted approach as at 31 December 2013 as follows.
31 December 2013
Default risk weighted assets of counterparties Currency derivatives 389 Interest rate derivatives 2,181 Others derivatives 4Credit valuation adjustment risk weighted assets 3,879
Total 6,453
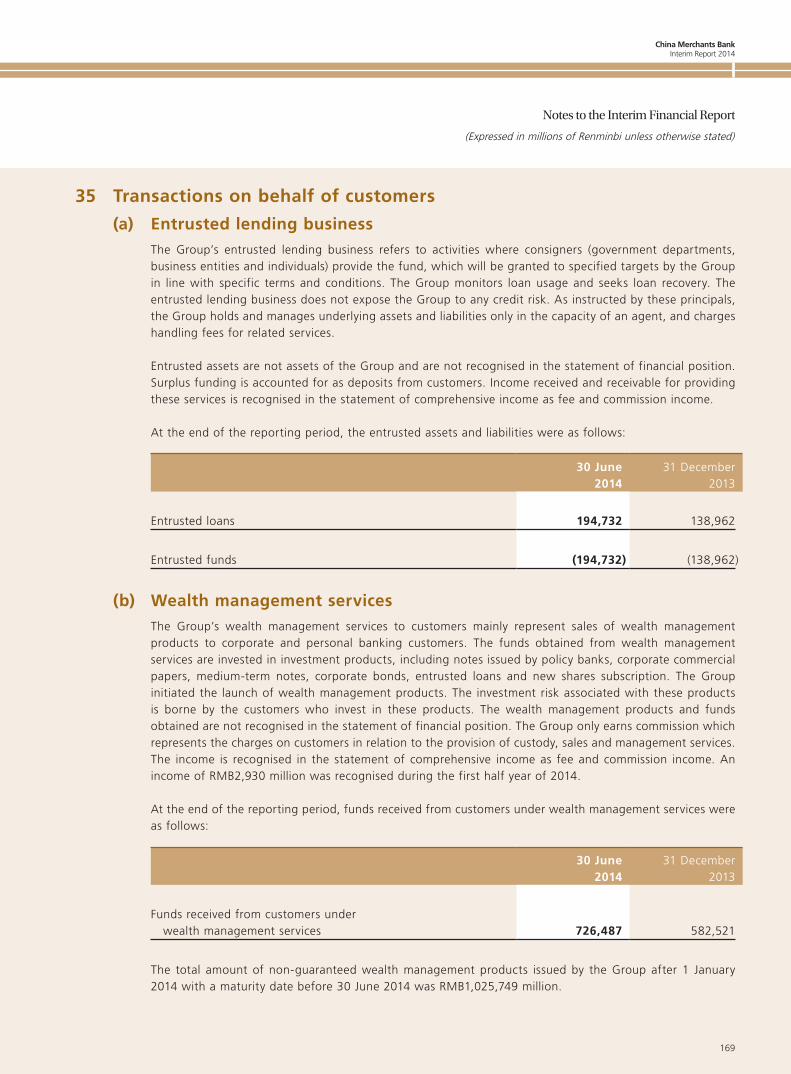
China Merchants BankInterim Report 2014
169
Notes to the Interim Financial Report
(Expressed in millions of Renminbi unless otherwise stated)
35 Transactions on behalf of customers
(a) Entrusted lending businessThe Group’s entrusted lending business refers to activities where consigners (government departments, business entities and individuals) provide the fund, which will be granted to specified targets by the Group in line with specific terms and conditions. The Group monitors loan usage and seeks loan recovery. The entrusted lending business does not expose the Group to any credit risk. As instructed by these principals, the Group holds and manages underlying assets and liabilities only in the capacity of an agent, and charges handling fees for related services.
Entrusted assets are not assets of the Group and are not recognised in the statement of financial position. Surplus funding is accounted for as deposits from customers. Income received and receivable for providing these services is recognised in the statement of comprehensive income as fee and commission income.
At the end of the reporting period, the entrusted assets and liabilities were as follows:
30 June2014
31 December2013
Entrusted loans 194,732 138,962
Entrusted funds (194,732) (138,962)
(b) Wealth management servicesThe Group’s wealth management services to customers mainly represent sales of wealth management products to corporate and personal banking customers. The funds obtained from wealth management services are invested in investment products, including notes issued by policy banks, corporate commercial papers, medium-term notes, corporate bonds, entrusted loans and new shares subscription. The Group initiated the launch of wealth management products. The investment risk associated with these products is borne by the customers who invest in these products. The wealth management products and funds obtained are not recognised in the statement of financial position. The Group only earns commission which represents the charges on customers in relation to the provision of custody, sales and management services. The income is recognised in the statement of comprehensive income as fee and commission income. An income of RMB2,930 million was recognised during the first half year of 2014.
At the end of the reporting period, funds received from customers under wealth management services were as follows:
30 June2014
31 December2013
Funds received from customers under wealth management services 726,487 582,521
The total amount of non-guaranteed wealth management products issued by the Group after 1 January 2014 with a maturity date before 30 June 2014 was RMB1,025,749 million.
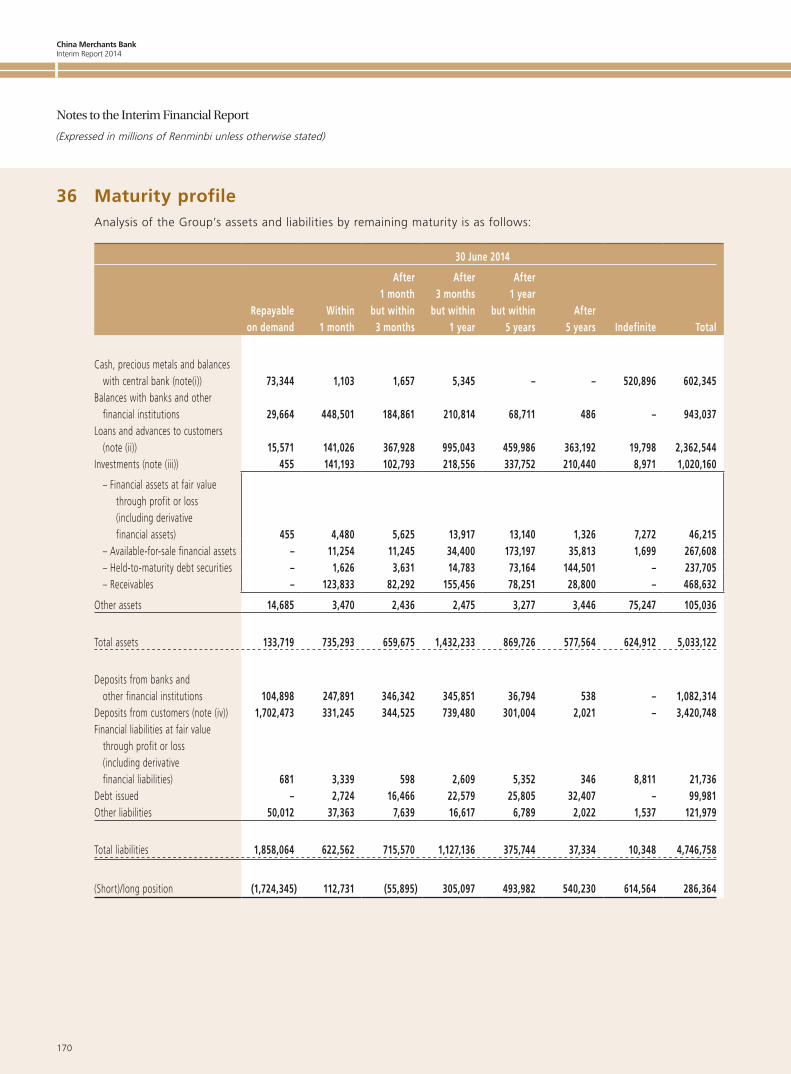
China Merchants BankInterim Report 2014
170
Notes to the Interim Financial Report
(Expressed in millions of Renminbi unless otherwise stated)
36 Maturity profileAnalysis of the Group’s assets and liabilities by remaining maturity is as follows:
30 June 2014
Repayable on demand
Within 1 month
After 1 month
but within 3 months
After 3 months
but within 1 year
After 1 year
but within 5 years
After 5 years Indefinite Total
Cash, precious metals and balances with central bank (note(i)) 73,344 1,103 1,657 5,345 – – 520,896 602,345Balances with banks and other financial institutions 29,664 448,501 184,861 210,814 68,711 486 – 943,037Loans and advances to customers (note (ii)) 15,571 141,026 367,928 995,043 459,986 363,192 19,798 2,362,544Investments (note (iii)) 455 141,193 102,793 218,556 337,752 210,440 8,971 1,020,160
– Fi nancial assets at fair value through profit or loss (including derivative financial assets) 455 4,480 5,625 13,917 13,140 1,326 7,272 46,215
– Available-for-sale financial assets – 11,254 11,245 34,400 173,197 35,813 1,699 267,608 – Held-to-maturity debt securities – 1,626 3,631 14,783 73,164 144,501 – 237,705 – Receivables – 123,833 82,292 155,456 78,251 28,800 – 468,632
Other assets 14,685 3,470 2,436 2,475 3,277 3,446 75,247 105,036
Total assets 133,719 735,293 659,675 1,432,233 869,726 577,564 624,912 5,033,122
Deposits from banks and other financial institutions 104,898 247,891 346,342 345,851 36,794 538 – 1,082,314Deposits from customers (note (iv)) 1,702,473 331,245 344,525 739,480 301,004 2,021 – 3,420,748Financial liabilities at fair value through profit or loss (including derivative financial liabilities) 681 3,339 598 2,609 5,352 346 8,811 21,736Debt issued – 2,724 16,466 22,579 25,805 32,407 – 99,981Other liabilities 50,012 37,363 7,639 16,617 6,789 2,022 1,537 121,979
Total liabilities 1,858,064 622,562 715,570 1,127,136 375,744 37,334 10,348 4,746,758
(Short)/long position (1,724,345) 112,731 (55,895) 305,097 493,982 540,230 614,564 286,364
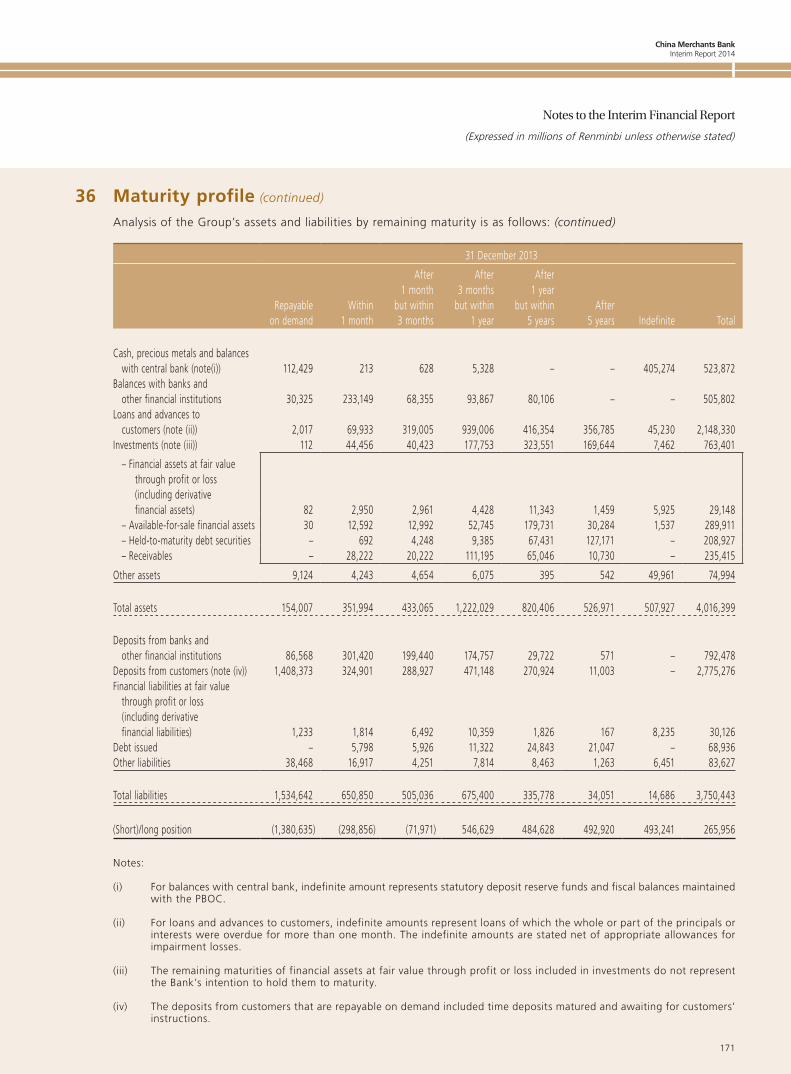
China Merchants BankInterim Report 2014
171
Notes to the Interim Financial Report
(Expressed in millions of Renminbi unless otherwise stated)
36 Maturity profile (continued)
Analysis of the Group’s assets and liabilities by remaining maturity is as follows: (continued)
31 December 2013
Repayable on demand
Within 1 month
After 1 month
but within 3 months
After 3 months
but within 1 year
After 1 year
but within 5 years
After 5 years Indefinite Total
Cash, precious metals and balances with central bank (note(i)) 112,429 213 628 5,328 – – 405,274 523,872Balances with banks and other financial institutions 30,325 233,149 68,355 93,867 80,106 – – 505,802Loans and advances to customers (note (ii)) 2,017 69,933 319,005 939,006 416,354 356,785 45,230 2,148,330Investments (note (iii)) 112 44,456 40,423 177,753 323,551 169,644 7,462 763,401
– Fi nancial assets at fair value through profit or loss (including derivative financial assets) 82 2,950 2,961 4,428 11,343 1,459 5,925 29,148
– Available-for-sale financial assets 30 12,592 12,992 52,745 179,731 30,284 1,537 289,911 – Held-to-maturity debt securities – 692 4,248 9,385 67,431 127,171 – 208,927 – Receivables – 28,222 20,222 111,195 65,046 10,730 – 235,415
Other assets 9,124 4,243 4,654 6,075 395 542 49,961 74,994
Total assets 154,007 351,994 433,065 1,222,029 820,406 526,971 507,927 4,016,399
Deposits from banks and other financial institutions 86,568 301,420 199,440 174,757 29,722 571 – 792,478Deposits from customers (note (iv)) 1,408,373 324,901 288,927 471,148 270,924 11,003 – 2,775,276Financial liabilities at fair value through profit or loss (including derivative financial liabilities) 1,233 1,814 6,492 10,359 1,826 167 8,235 30,126Debt issued – 5,798 5,926 11,322 24,843 21,047 – 68,936Other liabilities 38,468 16,917 4,251 7,814 8,463 1,263 6,451 83,627
Total liabilities 1,534,642 650,850 505,036 675,400 335,778 34,051 14,686 3,750,443
(Short)/long position (1,380,635) (298,856) (71,971) 546,629 484,628 492,920 493,241 265,956
Notes:
(i) For balances with central bank, indefinite amount represents statutory deposit reserve funds and fiscal balances maintained with the PBOC.
(ii) For loans and advances to customers, indefinite amounts represent loans of which the whole or part of the principals or interests were overdue for more than one month. The indefinite amounts are stated net of appropriate allowances for impairment losses.
(iii) The remaining maturities of financial assets at fair value through profit or loss included in investments do not represent the Bank’s intention to hold them to maturity.
(iv) The deposits from customers that are repayable on demand included time deposits matured and awaiting for customers’ instructions.
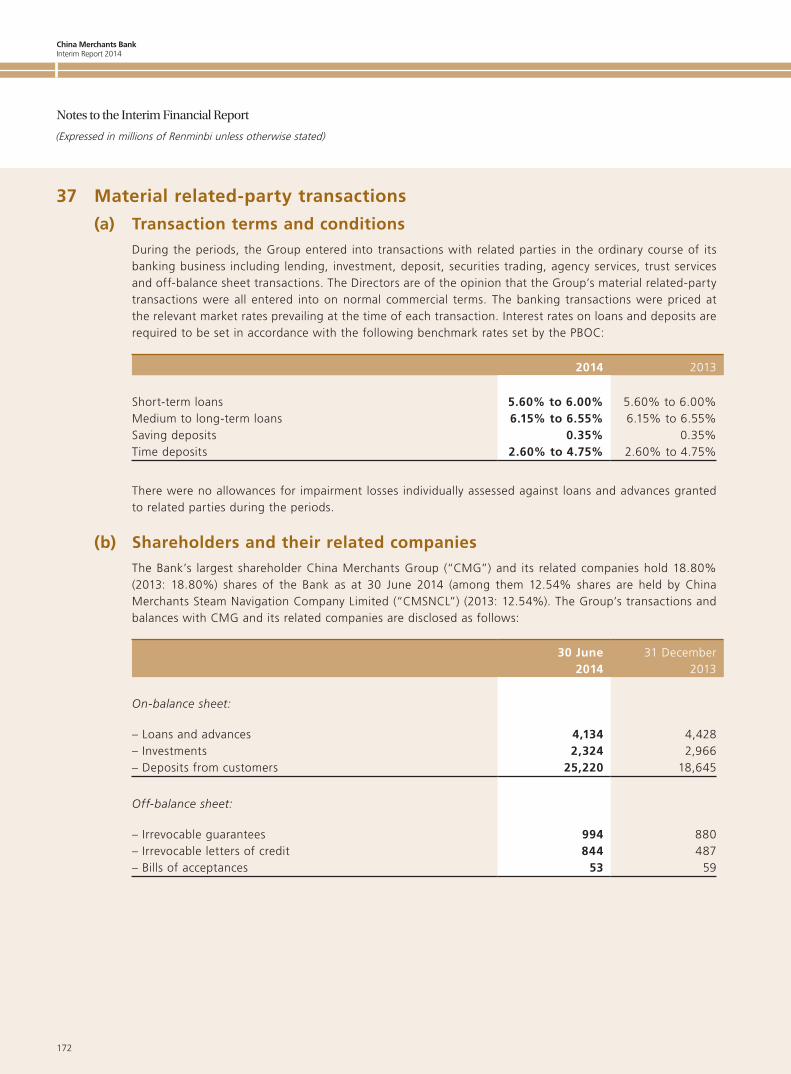
China Merchants BankInterim Report 2014
172
Notes to the Interim Financial Report
(Expressed in millions of Renminbi unless otherwise stated)
37 Material related-party transactions
(a) Transaction terms and conditionsDuring the periods, the Group entered into transactions with related parties in the ordinary course of its banking business including lending, investment, deposit, securities trading, agency services, trust services and off-balance sheet transactions. The Directors are of the opinion that the Group’s material related-party transactions were all entered into on normal commercial terms. The banking transactions were priced at the relevant market rates prevailing at the time of each transaction. Interest rates on loans and deposits are required to be set in accordance with the following benchmark rates set by the PBOC:
2014 2013
Short-term loans 5.60% to 6.00% 5.60% to 6.00%Medium to long-term loans 6.15% to 6.55% 6.15% to 6.55%Saving deposits 0.35% 0.35%Time deposits 2.60% to 4.75% 2.60% to 4.75%
There were no allowances for impairment losses individually assessed against loans and advances granted to related parties during the periods.
(b) Shareholders and their related companiesThe Bank’s largest shareholder China Merchants Group (“CMG”) and its related companies hold 18.80% (2013: 18.80%) shares of the Bank as at 30 June 2014 (among them 12.54% shares are held by China Merchants Steam Navigation Company Limited (“CMSNCL”) (2013: 12.54%). The Group’s transactions and balances with CMG and its related companies are disclosed as follows:
30 June2014
31 December2013
On-balance sheet:
– Loans and advances 4,134 4,428– Investments 2,324 2,966– Deposits from customers 25,220 18,645
Off-balance sheet:
– Irrevocable guarantees 994 880– Irrevocable letters of credit 844 487– Bills of acceptances 53 59
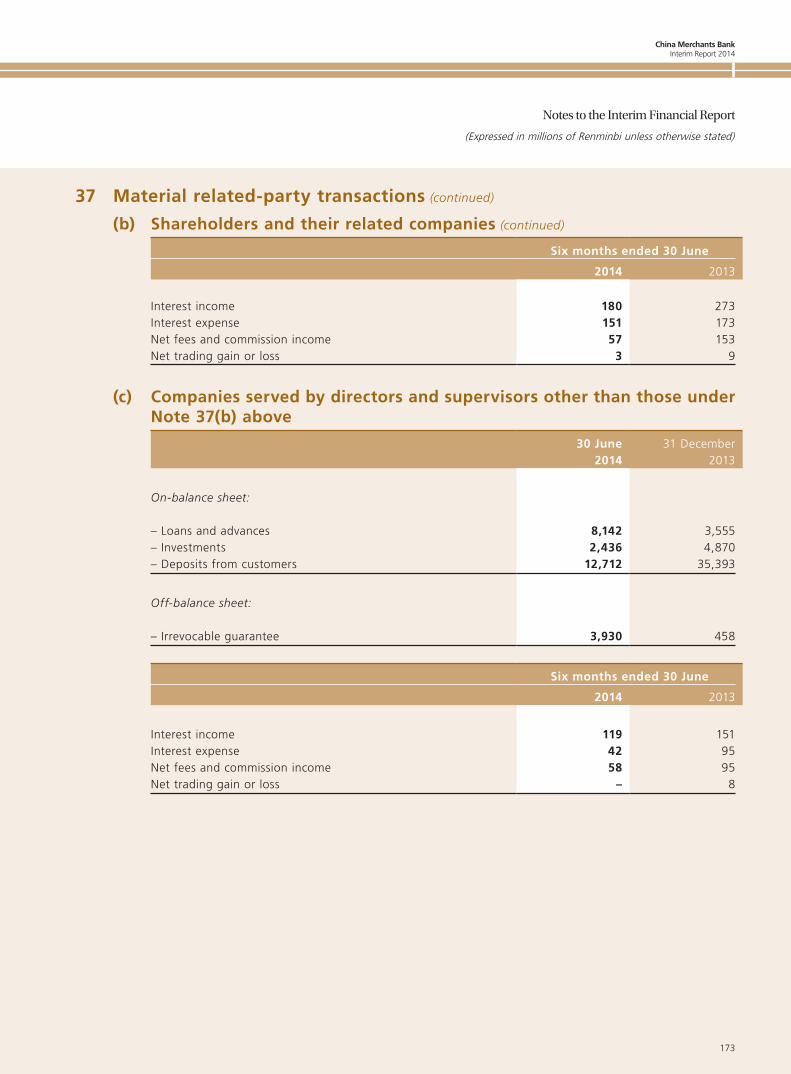
China Merchants BankInterim Report 2014
173
Notes to the Interim Financial Report
(Expressed in millions of Renminbi unless otherwise stated)
37 Material related-party transactions (continued)
(b) Shareholders and their related companies (continued)
Six months ended 30 June
2014 2013
Interest income 180 273Interest expense 151 173Net fees and commission income 57 153Net trading gain or loss 3 9
(c) Companies served by directors and supervisors other than those under Note 37(b) above
30 June2014
31 December2013
On-balance sheet:
– Loans and advances 8,142 3,555– Investments 2,436 4,870– Deposits from customers 12,712 35,393
Off-balance sheet:
– Irrevocable guarantee 3,930 458
Six months ended 30 June
2014 2013
Interest income 119 151Interest expense 42 95Net fees and commission income 58 95Net trading gain or loss – 8
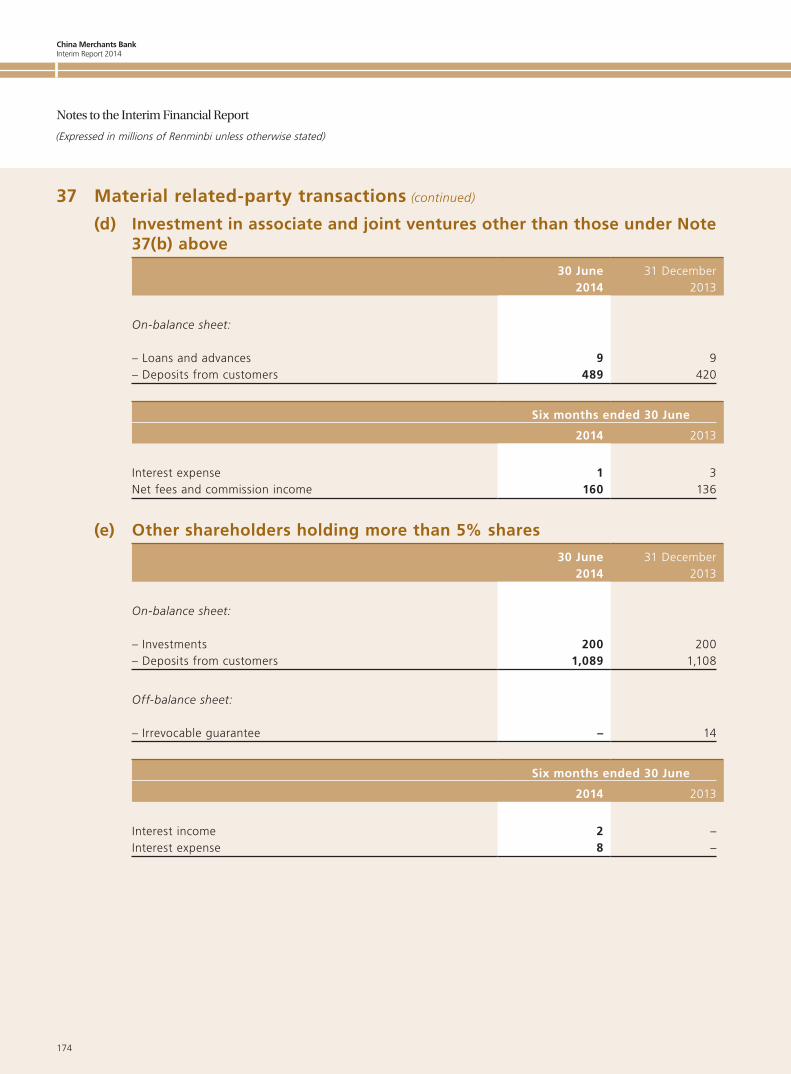
China Merchants BankInterim Report 2014
174
Notes to the Interim Financial Report
(Expressed in millions of Renminbi unless otherwise stated)
37 Material related-party transactions (continued)
(d) Investment in associate and joint ventures other than those under Note 37(b) above
30 June2014
31 December2013
On-balance sheet:
– Loans and advances 9 9– Deposits from customers 489 420
Six months ended 30 June
2014 2013
Interest expense 1 3Net fees and commission income 160 136
(e) Other shareholders holding more than 5% shares
30 June2014
31 December2013
On-balance sheet:
– Investments 200 200– Deposits from customers 1,089 1,108
Off-balance sheet:
– Irrevocable guarantee – 14
Six months ended 30 June
2014 2013
Interest income 2 –Interest expense 8 –
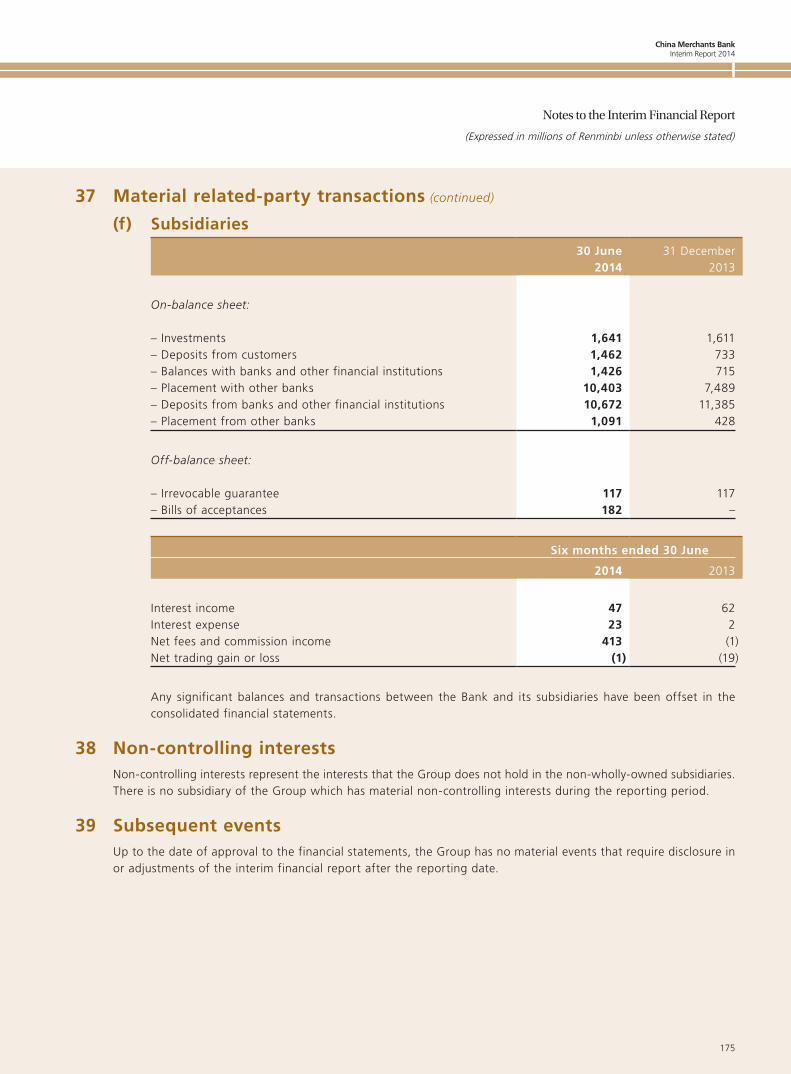
China Merchants BankInterim Report 2014
175
Notes to the Interim Financial Report
(Expressed in millions of Renminbi unless otherwise stated)
37 Material related-party transactions (continued)
(f) Subsidiaries
30 June2014
31 December2013
On-balance sheet:
– Investments 1,641 1,611– Deposits from customers 1,462 733– Balances with banks and other financial institutions 1,426 715– Placement with other banks 10,403 7,489– Deposits from banks and other financial institutions 10,672 11,385– Placement from other banks 1,091 428
Off-balance sheet:
– Irrevocable guarantee 117 117– Bills of acceptances 182 –
Six months ended 30 June
2014 2013
Interest income 47 62Interest expense 23 2Net fees and commission income 413 (1)Net trading gain or loss (1) (19)
Any significant balances and transactions between the Bank and its subsidiaries have been offset in the consolidated financial statements.
38 Non-controlling interestsNon-controlling interests represent the interests that the Group does not hold in the non-wholly-owned subsidiaries. There is no subsidiary of the Group which has material non-controlling interests during the reporting period.
39 Subsequent eventsUp to the date of approval to the financial statements, the Group has no material events that require disclosure in or adjustments of the interim financial report after the reporting date.
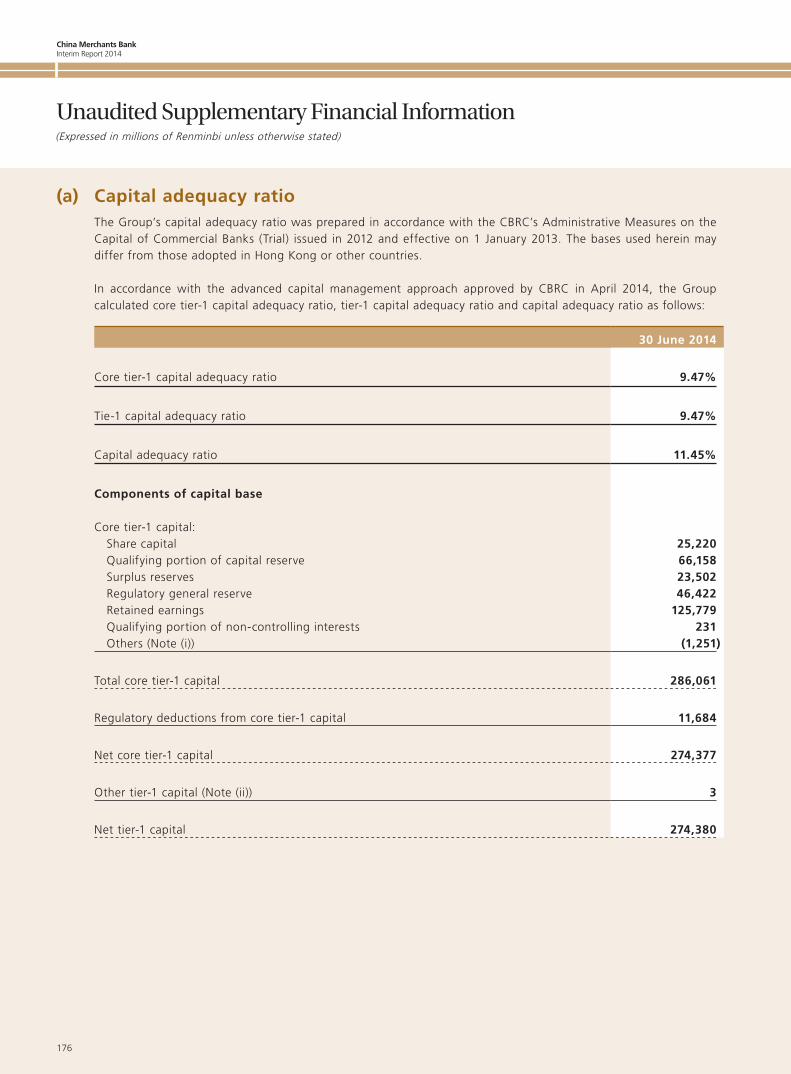
China Merchants BankInterim Report 2014
176
(Expressed in millions of Renminbi unless otherwise stated)
Unaudited Supplementary Financial Information
(a) Capital adequacy ratioThe Group’s capital adequacy ratio was prepared in accordance with the CBRC’s Administrative Measures on the Capital of Commercial Banks (Trial) issued in 2012 and effective on 1 January 2013. The bases used herein may differ from those adopted in Hong Kong or other countries.
In accordance with the advanced capital management approach approved by CBRC in April 2014, the Group calculated core tier-1 capital adequacy ratio, tier-1 capital adequacy ratio and capital adequacy ratio as follows:
30 June 2014
Core tier-1 capital adequacy ratio 9.47%
Tie-1 capital adequacy ratio 9.47%
Capital adequacy ratio 11.45%
Components of capital base
Core tier-1 capital: Share capital 25,220 Qualifying portion of capital reserve 66,158 Surplus reserves 23,502 Regulatory general reserve 46,422 Retained earnings 125,779 Qualifying portion of non-controlling interests 231 Others (Note (i)) (1,251)
Total core tier-1 capital 286,061
Regulatory deductions from core tier-1 capital 11,684
Net core tier-1 capital 274,377
Other tier-1 capital (Note (ii)) 3
Net tier-1 capital 274,380
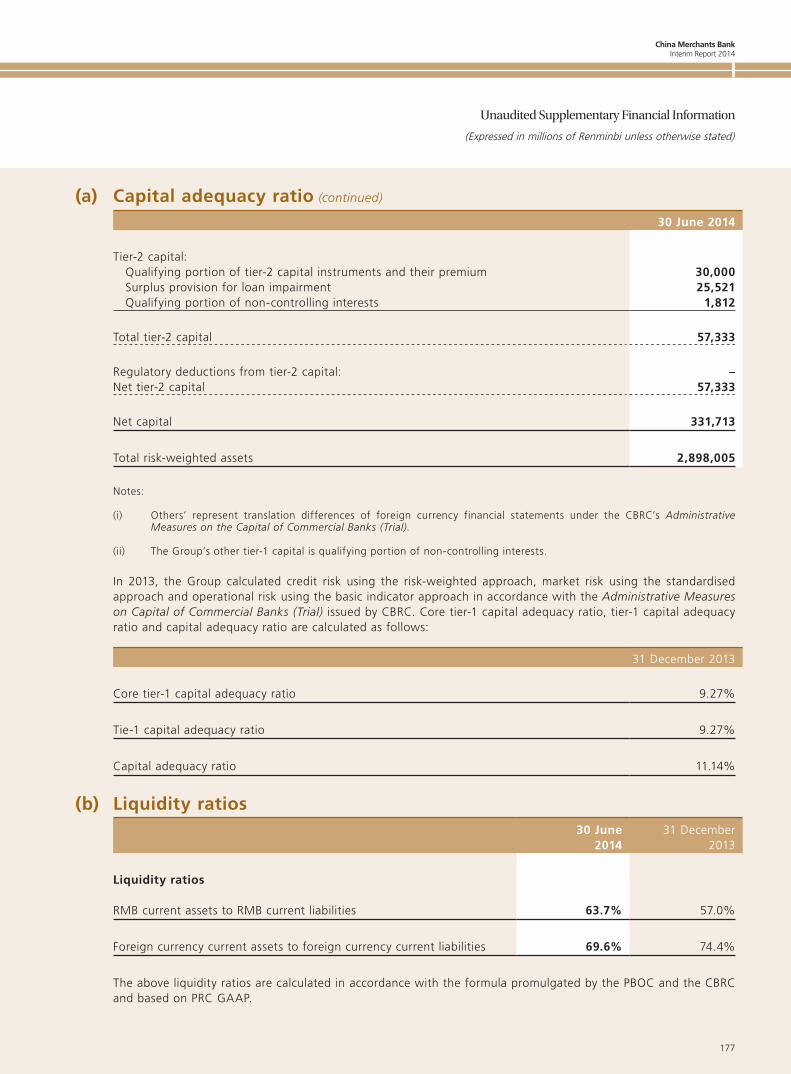
China Merchants BankInterim Report 2014
177
Unaudited Supplementary Financial Information
(Expressed in millions of Renminbi unless otherwise stated)
(a) Capital adequacy ratio (continued)
30 June 2014
Tier-2 capital: Qualifying portion of tier-2 capital instruments and their premium 30,000 Surplus provision for loan impairment 25,521 Qualifying portion of non-controlling interests 1,812
Total tier-2 capital 57,333
Regulatory deductions from tier-2 capital: –Net tier-2 capital 57,333
Net capital 331,713
Total risk-weighted assets 2,898,005
Notes:
(i) Others’ represent translation differences of foreign currency financial statements under the CBRC’s Administrative Measures on the Capital of Commercial Banks (Trial).
(ii) The Group’s other tier-1 capital is qualifying portion of non-controlling interests.
In 2013, the Group calculated credit risk using the risk-weighted approach, market risk using the standardised approach and operational risk using the basic indicator approach in accordance with the Administrative Measures on Capital of Commercial Banks (Trial) issued by CBRC. Core tier-1 capital adequacy ratio, tier-1 capital adequacy ratio and capital adequacy ratio are calculated as follows:
31 December 2013
Core tier-1 capital adequacy ratio 9.27%
Tie-1 capital adequacy ratio 9.27%
Capital adequacy ratio 11.14%
(b) Liquidity ratios30 June
201431 December
2013
Liquidity ratios
RMB current assets to RMB current liabilities 63.7% 57.0%
Foreign currency current assets to foreign currency current liabilities 69.6% 74.4%
The above liquidity ratios are calculated in accordance with the formula promulgated by the PBOC and the CBRC and based on PRC GAAP.
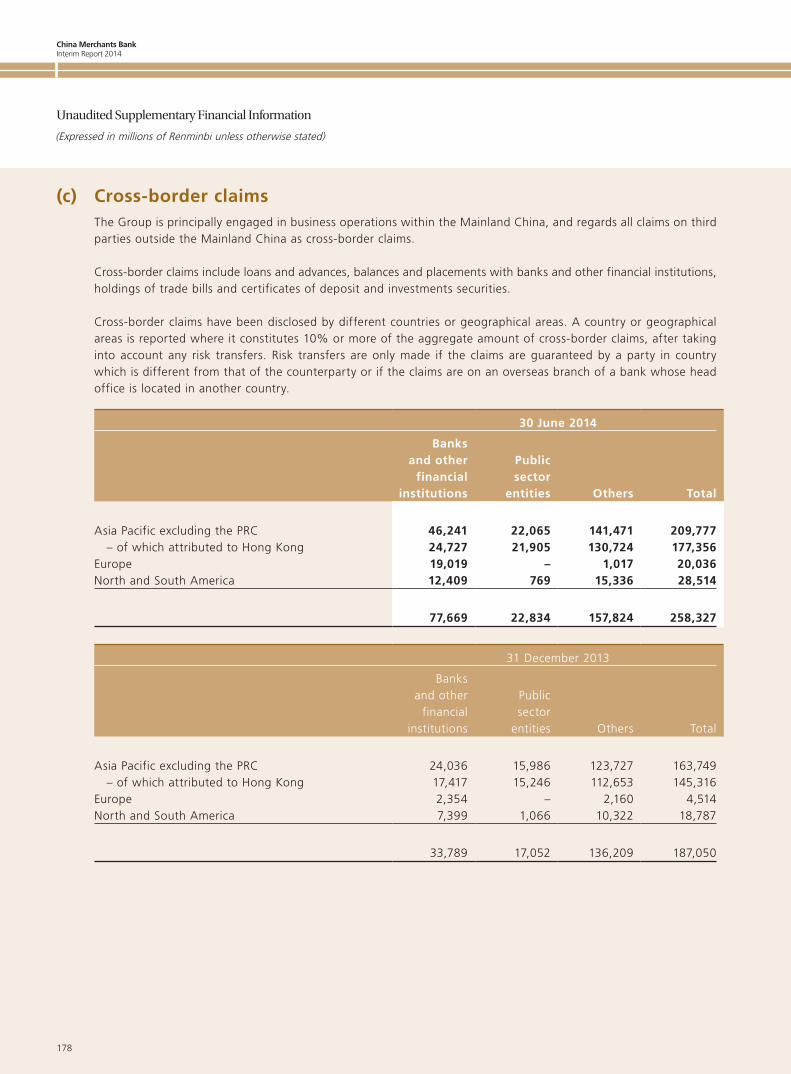
China Merchants BankInterim Report 2014
178
Unaudited Supplementary Financial Information
(Expressed in millions of Renminbi unless otherwise stated)
(c) Cross-border claimsThe Group is principally engaged in business operations within the Mainland China, and regards all claims on third parties outside the Mainland China as cross-border claims.
Cross-border claims include loans and advances, balances and placements with banks and other financial institutions, holdings of trade bills and certificates of deposit and investments securities.
Cross-border claims have been disclosed by different countries or geographical areas. A country or geographical areas is reported where it constitutes 10% or more of the aggregate amount of cross-border claims, after taking into account any risk transfers. Risk transfers are only made if the claims are guaranteed by a party in country which is different from that of the counterparty or if the claims are on an overseas branch of a bank whose head office is located in another country.
30 June 2014
Banksand other
financialinstitutions
Publicsector
entities Others Total
Asia Pacific excluding the PRC 46,241 22,065 141,471 209,777 – of which attributed to Hong Kong 24,727 21,905 130,724 177,356Europe 19,019 – 1,017 20,036North and South America 12,409 769 15,336 28,514
77,669 22,834 157,824 258,327
31 December 2013
Banksand other
financialinstitutions
Publicsector
entities Others Total
Asia Pacific excluding the PRC 24,036 15,986 123,727 163,749 – of which attributed to Hong Kong 17,417 15,246 112,653 145,316Europe 2,354 – 2,160 4,514North and South America 7,399 1,066 10,322 18,787
33,789 17,052 136,209 187,050
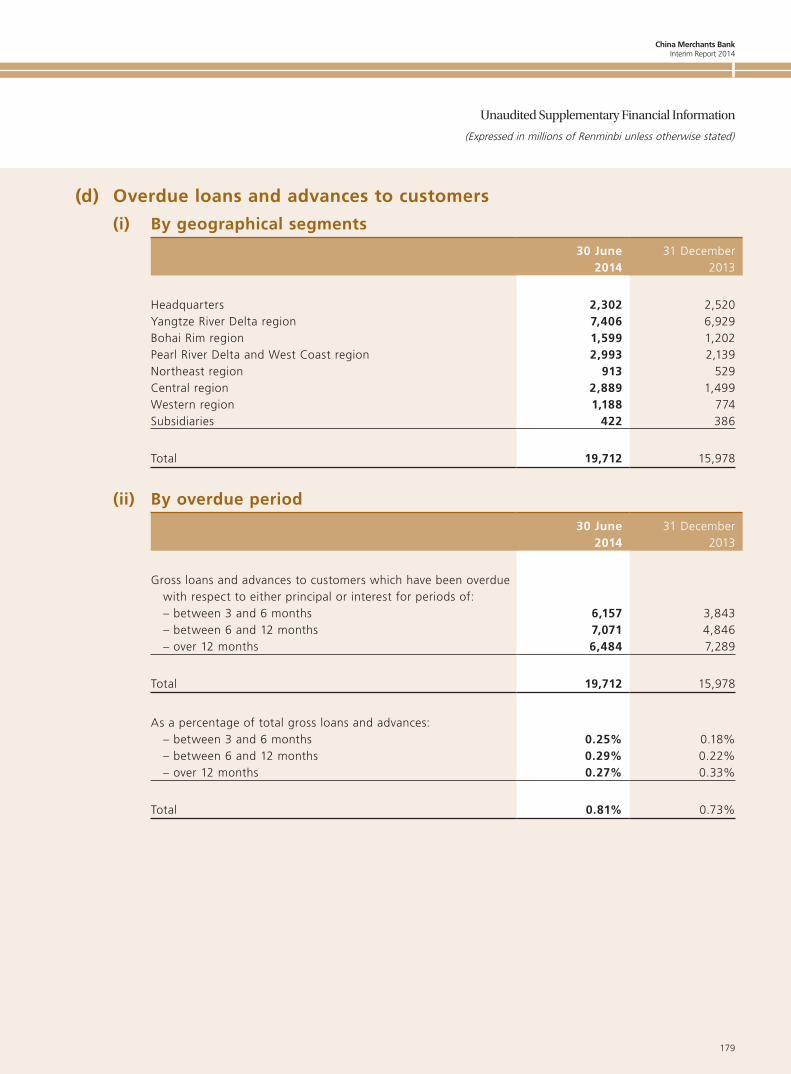
China Merchants BankInterim Report 2014
179
Unaudited Supplementary Financial Information
(Expressed in millions of Renminbi unless otherwise stated)
(d) Overdue loans and advances to customers
(i) By geographical segments
30 June2014
31 December2013
Headquarters 2,302 2,520Yangtze River Delta region 7,406 6,929Bohai Rim region 1,599 1,202Pearl River Delta and West Coast region 2,993 2,139Northeast region 913 529Central region 2,889 1,499Western region 1,188 774Subsidiaries 422 386
Total 19,712 15,978
(ii) By overdue period
30 June2014
31 December2013
Gross loans and advances to customers which have been overdue with respect to either principal or interest for periods of: – between 3 and 6 months 6,157 3,843 – between 6 and 12 months 7,071 4,846 – over 12 months 6,484 7,289
Total 19,712 15,978
As a percentage of total gross loans and advances: – between 3 and 6 months 0.25% 0.18% – between 6 and 12 months 0.29% 0.22% – over 12 months 0.27% 0.33%
Total 0.81% 0.73%
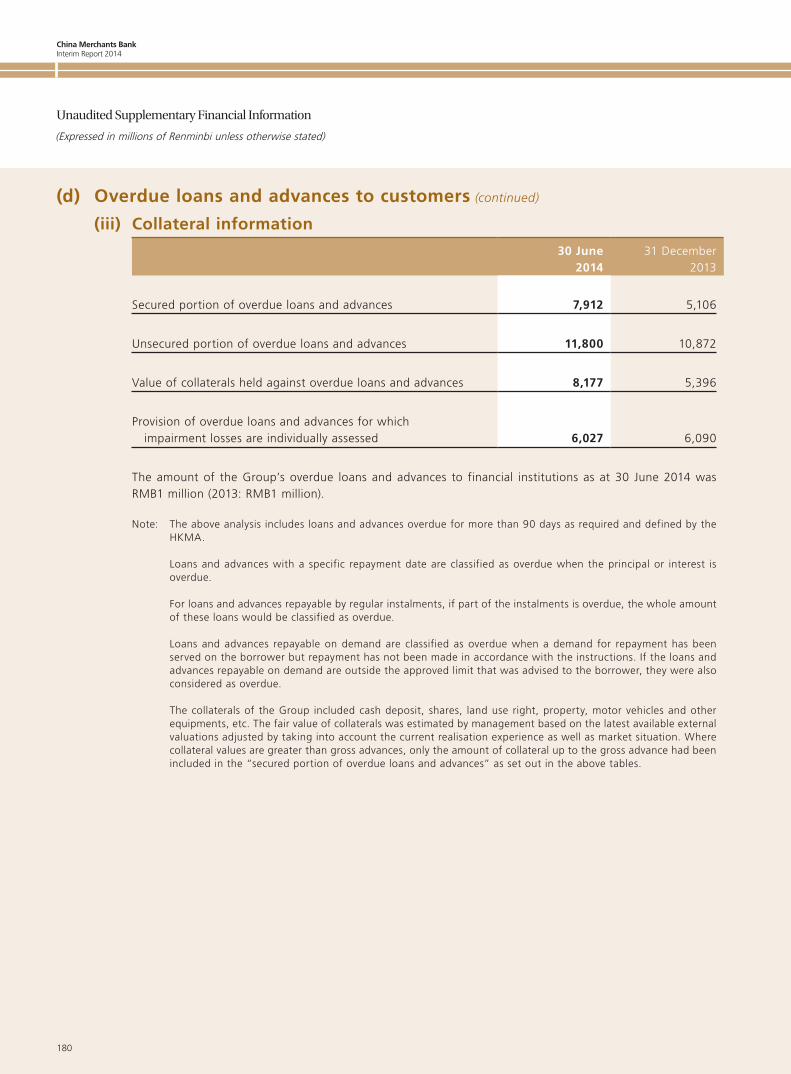
China Merchants BankInterim Report 2014
180
Unaudited Supplementary Financial Information
(Expressed in millions of Renminbi unless otherwise stated)
(d) Overdue loans and advances to customers (continued)
(iii) Collateral information
30 June2014
31 December2013
Secured portion of overdue loans and advances 7,912 5,106
Unsecured portion of overdue loans and advances 11,800 10,872
Value of collaterals held against overdue loans and advances 8,177 5,396
Provision of overdue loans and advances for which impairment losses are individually assessed 6,027 6,090
The amount of the Group’s overdue loans and advances to financial institutions as at 30 June 2014 was RMB1 million (2013: RMB1 million).
Note: The above analysis includes loans and advances overdue for more than 90 days as required and defined by the HKMA.
Loans and advances with a specific repayment date are classified as overdue when the principal or interest is overdue.
For loans and advances repayable by regular instalments, if part of the instalments is overdue, the whole amount of these loans would be classified as overdue.
Loans and advances repayable on demand are classified as overdue when a demand for repayment has been served on the borrower but repayment has not been made in accordance with the instructions. If the loans and advances repayable on demand are outside the approved limit that was advised to the borrower, they were also considered as overdue.
The collaterals of the Group included cash deposit, shares, land use right, property, motor vehicles and other equipments, etc. The fair value of collaterals was estimated by management based on the latest available external valuations adjusted by taking into account the current realisation experience as well as market situation. Where collateral values are greater than gross advances, only the amount of collateral up to the gross advance had been included in the “secured portion of overdue loans and advances” as set out in the above tables.
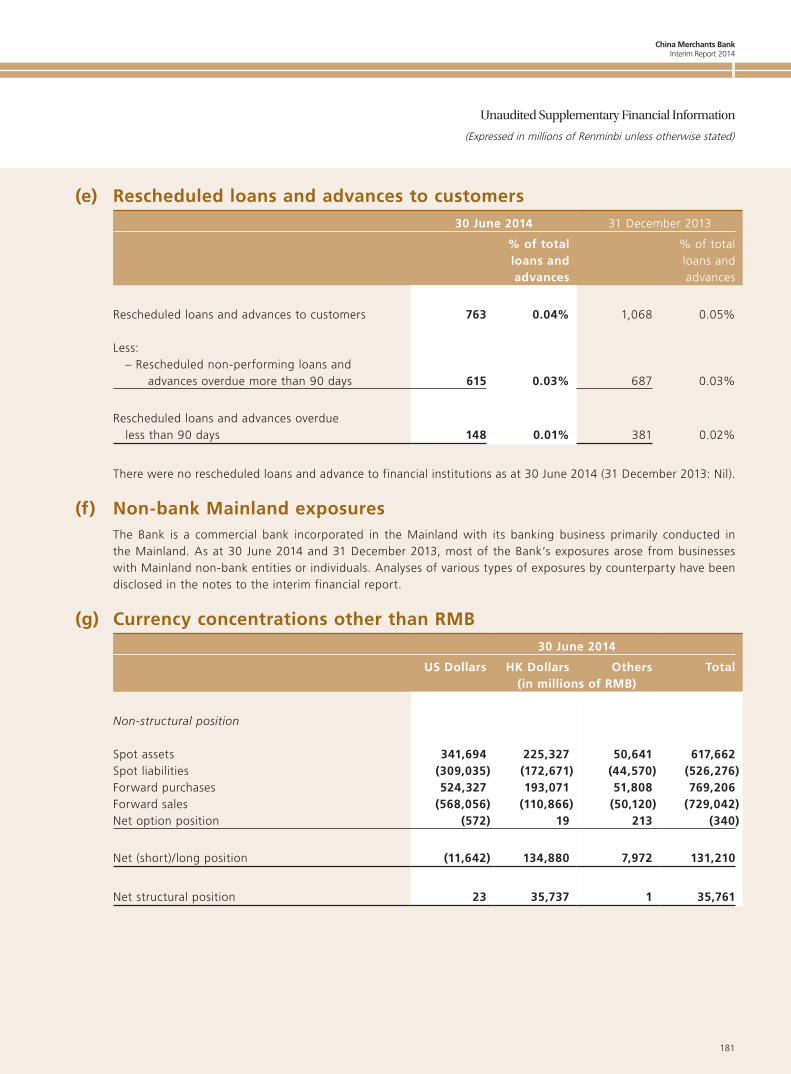
China Merchants BankInterim Report 2014
181
Unaudited Supplementary Financial Information
(Expressed in millions of Renminbi unless otherwise stated)
(e) Rescheduled loans and advances to customers30 June 2014 31 December 2013
% of totalloans andadvances
% of totalloans andadvances
Rescheduled loans and advances to customers 763 0.04% 1,068 0.05%
Less: – Rescheduled non-performing loans and
advances overdue more than 90 days 615 0.03% 687 0.03%
Rescheduled loans and advances overdue less than 90 days 148 0.01% 381 0.02%
There were no rescheduled loans and advance to financial institutions as at 30 June 2014 (31 December 2013: Nil).
(f) Non-bank Mainland exposuresThe Bank is a commercial bank incorporated in the Mainland with its banking business primarily conducted in the Mainland. As at 30 June 2014 and 31 December 2013, most of the Bank’s exposures arose from businesses with Mainland non-bank entities or individuals. Analyses of various types of exposures by counterparty have been disclosed in the notes to the interim financial report.
(g) Currency concentrations other than RMB30 June 2014
US Dollars HK Dollars Others Total(in millions of RMB)
Non-structural position
Spot assets 341,694 225,327 50,641 617,662Spot liabilities (309,035) (172,671) (44,570) (526,276)Forward purchases 524,327 193,071 51,808 769,206Forward sales (568,056) (110,866) (50,120) (729,042)Net option position (572) 19 213 (340)
Net (short)/long position (11,642) 134,880 7,972 131,210
Net structural position 23 35,737 1 35,761
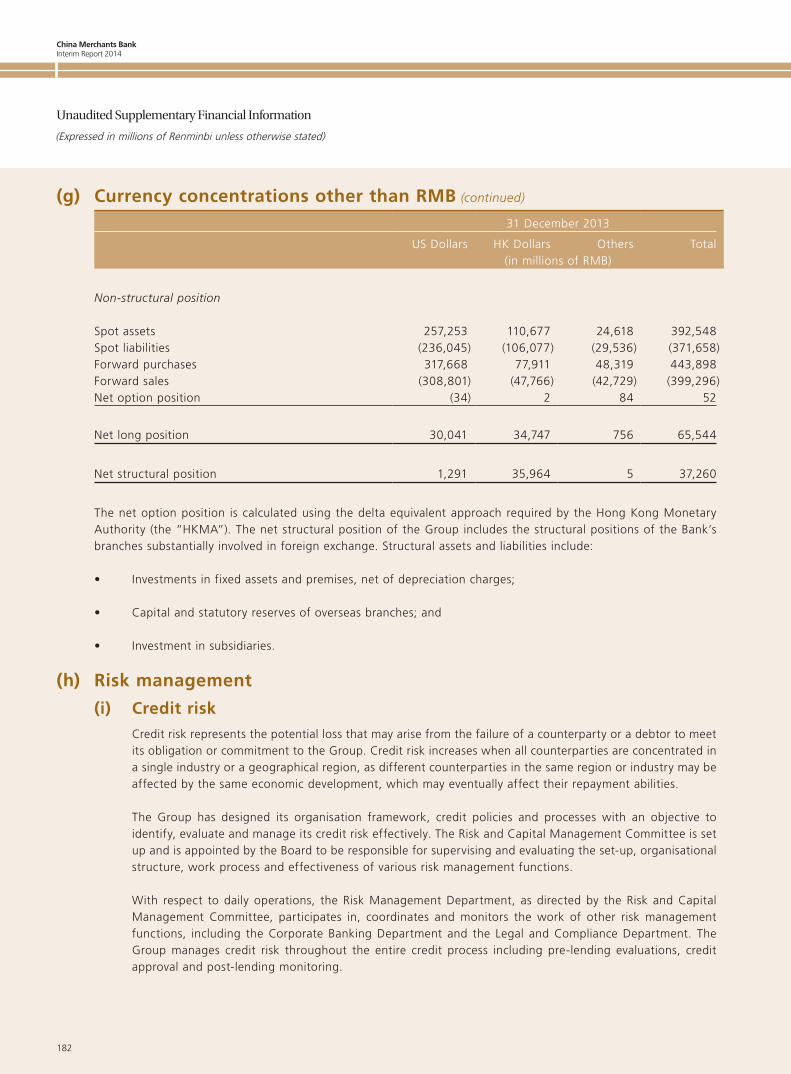
China Merchants BankInterim Report 2014
182
Unaudited Supplementary Financial Information
(Expressed in millions of Renminbi unless otherwise stated)
(g) Currency concentrations other than RMB (continued)
31 December 2013
US Dollars HK Dollars Others Total(in millions of RMB)
Non-structural position
Spot assets 257,253 110,677 24,618 392,548Spot liabilities (236,045) (106,077) (29,536) (371,658)Forward purchases 317,668 77,911 48,319 443,898Forward sales (308,801) (47,766) (42,729) (399,296)Net option position (34) 2 84 52
Net long position 30,041 34,747 756 65,544
Net structural position 1,291 35,964 5 37,260
The net option position is calculated using the delta equivalent approach required by the Hong Kong Monetary Authority (the “HKMA”). The net structural position of the Group includes the structural positions of the Bank’s branches substantially involved in foreign exchange. Structural assets and liabilities include:
• Investments in fixed assets and premises, net of depreciation charges;
• Capital and statutory reserves of overseas branches; and
• Investment in subsidiaries.
(h) Risk management
(i) Credit riskCredit risk represents the potential loss that may arise from the failure of a counterparty or a debtor to meet its obligation or commitment to the Group. Credit risk increases when all counterparties are concentrated in a single industry or a geographical region, as different counterparties in the same region or industry may be affected by the same economic development, which may eventually affect their repayment abilities.
The Group has designed its organisation framework, credit policies and processes with an objective to identify, evaluate and manage its credit risk effectively. The Risk and Capital Management Committee is set up and is appointed by the Board to be responsible for supervising and evaluating the set-up, organisational structure, work process and effectiveness of various risk management functions.
With respect to daily operations, the Risk Management Department, as directed by the Risk and Capital Management Committee, participates in, coordinates and monitors the work of other risk management functions, including the Corporate Banking Department and the Legal and Compliance Department. The Group manages credit risk throughout the entire credit process including pre-lending evaluations, credit approval and post-lending monitoring.
China Merchants BankInterim Report 2014
183
Unaudited Supplementary Financial Information
(Expressed in millions of Renminbi unless otherwise stated)
(h) Risk management (continued)
(i) Credit risk (continued)
With respect to the credit risk management of corporate and institutional business, the Group formulated credit policy baseline, and enhanced credit acceptance and exit policies for corporate and institutional clients. These policies with quota limit management have contributed to the improvement in credit structure.
With respect to the personal credit business, the Group relies on credit assessment of applicants as the basis for loan approval. Customer relationship managers are required to assess the income level, credit history, and repayment ability of the applicant. The Group monitors borrowers’ repayment ability, the status of collateral and any changes to collateral value. Once a loan becomes overdue, the Group starts the recovery process according to standard personal loan recovery procedures.
To mitigate risks, where appropriate, the Group requests customers to provide collateral and guarantees. It also sets guidelines as to the acceptability of specific types of collateral or credit risk offset. Collateral structures and legal covenants are regularly reviewed to ensure that they still serve their intended purposes and conform to market practices.
In respect of loan classification, the Group adopts a risk based loan classification methodology. Currently, the Group categorises its loans on a ten-grade loan classification basis (normal (grades 1-5), special mention (grades 1-2), substandard, doubtful and loss). The loans and advances for which objective evidence of impairment exists based on a loss event or several events and which bear significant impairment losses are classified as impaired loans and advances. The allowances for impairment losses for the impaired loans and advances are assessed collectively or individually as appropriate.
The risks involved in credit-related commitments and contingencies are essentially the same as the credit risk involved in extending loan facilities to customers. These transactions are, therefore, subject to the same credit application, portfolio maintenance and collateral requirements as for customers applying for loans.
Concentration of credit risk: when certain number of customers are in the same business, located in the same geographical region or their industries share similar economic characteristics, their ability to meet their obligations may be affected by the same economic changes. The level of concentration of credit risk reflects the sensitivity of the Group’s operating result to a specific industry or geographical region. To prevent concentration of credit risk, the Group formulated the quota limit management policy to monitor and analyse the loan portfolio.
Analyses of loans and advances by industry, customer type and nature, and loan portfolio are stated in Note 16.
The Group’s credit risk management policy for financial derivatives is the same as that for other transactions. In order to mitigate the credit risk arising from the financial derivatives, the Group has signed netting agreements with certain counterparties.
China Merchants BankInterim Report 2014
184
Unaudited Supplementary Financial Information
(Expressed in millions of Renminbi unless otherwise stated)
(h) Risk management (continued)
(ii) Market riskMarket risk is the risk that the fair value or future cash flows of the Group’s financial instruments will fluctuate because of changes in exchange rate, interest rate, commodity price, stock price and other observable market tractors, which may result in loss. The Group is exposed to market risk primarily through trading accounts and banking accounts. Trading accounts include financial instruments and positions held for proprietary trading or risk hedging; banking accounts refer to assets and liabilities and related financial instruments willingly held by the Bank for stable income or risk hedging, which have been recorded on- and off-balance sheet with relatively stable market values.
The Board of Directors is ultimately responsible for monitoring market risk management. The Executive Office of the President is authorised by the Board of Directors to make market risk management decisions. President in charge of risk performs the duties authorised by the Executive Office and is responsible for formulating market risk management policies and procedures, supervising the implementation of the policies and procedures and making decision on significant market risk management issues. The Market Risk Management Department and the Asset and Liability Management Department, tasked with the market risk management function for trading and banking accounts respectively, centrally manage the Group’s market risk on those accounts. As an independent model verification department, the Office for the Implementation of Basel III Capital Accord continues to verity market risk measurement models while the Audit Department regularly conducts market risk management audit.
By adhering to sound and prudent market risk management principles, the Group takes market risk for trading and banking accounts within the limit set by the Board of Directors. Engagement in new businesses for which risk is hard to quantify and assess as well as businesses in risky areas such as in emerging countries and emerging markets are stringently controlled. As a result, market risk is kept within a tolerable level.
For trading accounts, the Group uses Value-at-risk (“VaR”), various sensitive indicators, stop loss indicators and stress testing loss indicators to measure, analyse and report the market risk. The Group also manages foreground departments by limits set by various market risk indicators, which keeps market risk within an ongoing tolerable level. VaR is a technique that estimates the potential losses that could occur on risk positions as a result of movements in market rates and prices over a specified time horizon and to a given level of confidence. The Group calculates VaR using the historical simulation model at a 99% confidence level, the observation period is 250 trading days and the holding period is 10 days. Stress testing is an approach to calculate and analyse the potential loss of portfolios under a defined particular adverse scenario. Stress testing could reflect the tail end risk, as important supplement to VaR and other market risk indicators. According to risk characteristics of trading accounts, the Group sets up individual and collective stress testing scenarios, which cover interest rate, foreign exchange rate, commodity risk and other market risk. The Group updates and optimises these stress scenarios according to the market conditions continuously.
For banking accounts, the Group uses gap analysis and scenario analysis, which projects future cash flows in order to quantify the differences between assets and liabilities for a range of future dates, to measure and monitor the market risk. The Group also regularly conducts stress testing as supplement to the above measurement indicators.
In the first half year of 2014, the Group continued to streamline its market risk management policy based on its existing practice. It optimised the procedure, process and tool for measuring and monitoring market risk and promoted the enhanced application of management tools for market risk. It also focused on training the management team for market risk and enhanced the professionalism of market risk management.
China Merchants BankInterim Report 2014
185
Unaudited Supplementary Financial Information
(Expressed in millions of Renminbi unless otherwise stated)
(h) Risk management (continued)
(ii) Market risk (continued)
In the first half year of 2014, the Group was approved to adopt the internal model approach to calculate market risk capital requirement at the bank level. The Bank becomes the first joint-stock banks approved to use the internal model approach. On this basis, the Group continues to promote the enhanced application of internal model approach.
(iii) Interest rate riskInterest rate risk arises from the loss on overall banking account income and economic value as a result of unfavourable changes in interest rate and maturity structures. The Group is exposed to interest rate risk including base rate risk, re-pricing risk, yield curve risk and option risk. In particular, base rate risk and re-pricing risk are the primary risks faced by the Group.
The Group has primarily adopted scenario simulation analyses, re-pricing gap analyses, duration analyses and stress testing for measuring and analysing interest rate risk. The Group’s financial assets and liabilities are largely RMB-denominated. As the base rate for RMB deposits and loans are set by the PBOC, the Group conducts lending and deposit-taking activities largely in accordance with the PBOC’s interest rate policies.
In the first half of 2014, the Bank continued to manage interest rate risk in an active and forward-looking manner. Through on-balance sheet structural adjustment and by hedging risk using derivatives off the balance sheet, the fluctuation in the Bank’s net interest income was reduced and the interest rate risk was under control. In addition to adopting active risk management measures, risk measurement was optimised to improve accuracy and achieve rational and innovative risk management.
(iv) Exchange rate riskExchange rate risk arises from the loss on overall bank income caused by foreign exchange and foreign exchange derivative positions in light of unfavourable exchange rate changes. The Group has adopted RMB as its functional currency. The Group’s assets and liabilities are mainly denominated in RMB, with the rest being mainly in US dollar and HK dollar. The Group is exposed to exchange rate risk mainly because of mismatches in its non-RMB assets and liabilities. The Group stringently controlled its foreign exchange exposures to keep exchange rate risk within a tolerable level.
The Group has largely adopted foreign exchange exposure analyses, scenario simulation analyses, stress testing and VaR for measuring and studying exchange rate risk. While regularly measuring and analysing foreign exchange exposure changes, the Group monitors and reports exchange rate risk on a monthly basis under the limit framework. Based on the trend of foreign exchange movements, the Group adjusts its foreign exchange exposures to mitigate exchange rate risk.
In the first half of 2014, the Group continued to enhance exchange risk assessment systems, which have provided reference standards for accurately evaluating exchange rate risk and setting out precise management strategies; actively manage exchange rate risk, aptly reduce structural exposure, and start using a new exchange rate risk management system and a quota authorisation management system.
China Merchants BankInterim Report 2014
186
Unaudited Supplementary Financial Information
(Expressed in millions of Renminbi unless otherwise stated)
(h) Risk management (continued)
(v) Liquidity riskLiquidity risk arises when the Group fails to satisfy customers demand for drawing down on maturing liabilities, new loans and reasonable finances, or when it fails to meet their needs at a normal cost.
In line with its liquidity risk management policies, the Group sets out and implements the principle of supervisory duty segregation. It also puts in place a governing framework under which the roles, responsibilities and reporting lines of the directors, supervisors, senior management, special-purpose committees and relevant departments in this area are specified for better liquidity risk management. The Group is prudent in managing the risk, which better suits its current development stage. Basically, the Group’s existing liquidity risk management polices and systems meet regulatory requirements and its own management needs.
The Bank’s liquidity risk management is coordinated by Head Office with branches acting in concert. The Asset and Liability management department of Head Office as the treasurer of the Bank is in charge of routine liquidity risk management. The treasurer is responsible for managing liquidity on a prudent basis under regulatory requirement, and conducting centralised liquidity management through quota management, budget control as well as internal fund transfer pricing.
The Group measures, monitors and identifies liquidity risk by short-term reserves as well as duration structures and contingencies. It closely monitors various limit indicators at regular intervals, performs regular stress testing to judge whether it can address liquidity needs under extreme circumstances. In addition, the Group draws up liquidity contingency plans and conducts liquidity contingency drills to prepare for liquidity crises.
In the first half of 2014, the state monetary policy was gradually changed from neutral to slightly lax. The central bank fine-tuned liquidity flows through open market operations, and released liquidity into the market under a slightly stimulative, lax policy. The Group’s liquidity condition is similar to that of the market, with customer deposits on the rise, steady asset allocation and overall loose liquidity. Amid a loose liquidity environment, the Group adopted the following measures to improve its capital efficiency: (a) using FTP flexibly to guide business development, and balancing the source and use of funds to solve maturity mismatches in assets and liabilities; (b) aptly accelerating asset allocation while optimising the structure of assets by acquiring chiefly low risk-weighted assets; (c) strengthening liability management to explore new products (e.g. interbank certificates of deposits) to improve the maturity structure of liabilities; and (d) steadily pushing forward asset securitisation with a total of RMB15,389 million of corporate and credit assets being securitised in the first half of 2014.
In 2014, PBOC lowered the statutory reserve ratios for Renminbi deposits of some banks, including the Bank. As at the end of June 2014, the Group had to place 17.5% (2013: 18%) of its gross RMB deposits and 5% (2013: 5%) of its gross foreign currency deposits with the PBOC.
China Merchants BankInterim Report 2014
187
Unaudited Supplementary Financial Information
(Expressed in millions of Renminbi unless otherwise stated)
(h) Risk management (continued)
(vi) Operational riskOperational risk arises from the loss due to defective or troubled internal processes; staff and IT systems; as well as external events.
During the reporting period, the Group continued to enhance its operational risk management capabilities and effectiveness by further improving operational risk management frameworks and methodologies; strengthening operational risk appraisal and assessment mechanisms; stepping up the identification, evaluation and monitoring of operational risk in key areas; and subjecting operational risk to its economic capital management. Various key risk indicators were compliant with the Group’s risk preference requirements.
In face of challenges from internal and external operations and management, the Group will, based on its risk preference, continue to upgrade its risk management skills, step up operational risk monitoring and controls, as well as endeavour to prevent and reduce operational risk losses.
(i) Capital managementThe objectives of the Group’s capital management are to:
• Keep capital adequacy ratios at reasonable levels, satisfy capital-specific regulatory provisions and policy requirements on an ongoing basis, and maintain a solid capital base in support of its business expansion and strategic planning implementation for comprehensive, coordinated and sustainable growth;
• Comply with capital regulatory requirements, perform procedures to assess internal capital adequacy, openly disclose information related to capital management, fully cover all risks, ensure safe operation of the entire group;
• Put in place an economic capital-centred banking value management system by fully applying various risk-specific quantitative deliverables, enhance decision-making processes and management application regimes, strengthen capital restraint and capital incentive mechanisms, reinforce capabilities to facilitate client pricing and decision-making, and increase capital deployment efficiency; and
• Reasonably use all kinds of capital instruments, continue to upgrade capital strengths, improve capital structures, raise capital quality, lower capital costs, and create the best returns to shareholders.
The Group manages its capital structure and adjust the same based on economic settings and risk characteristics of its operations. To maintain or adjust its capital structure, the Group may modify its profit distribution policy; issue or repurchase shares, other tier-1 capital instruments, eligible tier-2 capital instruments, and convertible debentures. The Group’s management regularly monitors capital adequacy ratio levels under an approach as required by the CBRC. The Group and the Bank file required information with the CBRC in a half-yearly and quarterly manner.
The Group’s capital adequacy ratio calculation covers the Bank and its subsidiaries. The Bank’s capital adequacy ratio calculation covers China Merchants Bank Co., Ltd.’s all branch entities at home and abroad. As at 30 June 2013, the Group’s subsidiaries that were within the scope of consolidated statements in respect of the capital adequacy ratio included: WLB, CMBICC, CMBFLC and CMFM.
China Merchants BankInterim Report 2014
188
Unaudited Supplementary Financial Information
(Expressed in millions of Renminbi unless otherwise stated)
(i) Capital management (continued)
Since 1 January 2013, the Group has calculated its capital adequacy ratio in accordance with the CBRC’s Administrative Measures on the Capital of Commercial Banks (Trial) and other relevant regulations. On 18 April 2014, the CBRC approved the Bank to adopt the advanced capital management approach. Within the scope of approval of the CBRC, the Bank could calculate corporation and financial institutions risk exposure using the primary internal rating-based approach, retail risk exposure using the internal rating-based approach, market risk using the internal model approach, and operational risk using the standardised approach. At the same time, the CBRC implemented a transition period for commercial banks approved to use the advanced approach to calculate capital. During the period, commercial banks should use both the advanced approach and other approaches to calculate capital adequacy ratios, and comply with minimum capital requirements. During the period, the Group has complied with the capital requirement set by the regulatory authority.
Capital adequacy ratio management is the focus of the Group’s capital management. The capital adequacy ratio reflects the Group’s capability of sound operations and risk resisting. The Group’s capital adequacy ratio management objectives are to carefully determine capital adequacy ratio goals, as legally required by regulators, according to actual risk profiles and with reference to capital adequacy ratio levels of globally leading market peers and the Group’s operating conditions.
The Group adopts the scenario simulation and stress testing methods to forecast, plan and manage its capital adequacy ratio with considerations of factors such as strategic development planning, business expansion status, and risk movement trends.