Embed Size (px)
Citation preview

Effect of Thermo-Mechanical Treatment on Electrical Conductivity and Strength ofCu0.29mass%Zr Alloy Wires+1
Hikaru Watanabe1,+2,+3, Kenta Miyamoto1,+2, Takahiro Kunimine1,+4, Ryoichi Monzen1,Naokuni Muramatsu2, Kazuhiro Nomura2 and Shinya Ueno3
1Division of Mechanical Science and Engineering, Graduate School of Natural Science and Technology, Kanazawa University,Kanazawa 920-1192, Japan2Research and Development, New Metals Division, NGK INSULATORS, LTD., Handa 475-0825, Japan3Development Division, SAN-ETSU METALS CO., LTD., Takaoka 933-0002, Japan
In our previous study, a thin wire of a Cu0.29mass%Zr alloy produced by repeated intermediate annealing during rolling and wire-drawing (IAwire) exhibited a 0.2% proof stress, ·0.2, of 600MPa, an ultimate tensile strength, ·u, of 630MPa, and an electrical conductivity, E,of 91.7%IACS. A thin wire of the alloy produced by ECAP-conform processing and subsequent rolling and wire-drawing (ECAP wire) showedlarger values of ·0.2 = 730MPa and ·u = 790MPa but a smaller value of E = 73.0%IACS than the IAwire. This study investigates the causes ofthe lower value of E and the higher value of ·0.2 of the ECAP wire, and the higher value of E of the IA wire. The higher value of ·0.2 of theECAP wire is attributed to its smaller grain size and higher dislocation density. The lower value of E of the ECAP wire is primarily attributableto the fact that newly found, ordered face-centered cubic (fcc) precipitates having a cube-on-cube orientation relationship to the Cu matrix in thealloy produced by the ECAP-conform processing were cut by dislocations during rolling and wire drawing, resulting in dissolution in the Cumatrix. The IA wire showed the higher value of E because recrystallization by repeated intermediate annealing changed all the fcc precipitatesinto incoherent fcc precipitates that were not cut by dislocations. Further, based on the obtained results, an attempt was made to fabricate thinwires of the alloy having good strength, ductility and electrical conductivity. All the fcc precipitates in the alloy were made incoherent with theCu matrix by utilizing recrystallization after sufficient precipitation. Then the alloy was processed by ECAP and subsequently wire-drawn. Thefabricated thin wire exhibited higher values of ·u = 820MPa, ¾t = 4.0% and E = 86.9%IACS. [doi:10.2320/matertrans.MT-D2021001]
(Received July 29, 2021; Accepted September 28, 2021; Published November 25, 2021)
Keywords: copperzirconium alloy, ECAP-conform, wire drawing, microstructure, electrical conductivity, precipitation, strength
1. Introduction
In recent years, Cu alloy wires used for electroniccomponents have become extremely thinner. As a result,strength enough to prevent breakage and high electricalconductivity are required for Cu alloy wires. Tin-plated softCu wires and dilute CuCr alloy wires1) with electricalconductivities, E, of 8590%IACS have been proposed aswires with high electrical conductivity so far. However, theirtensile strengths, ·u, ranging from 200 to 450MPa areinsufficient.
Recently, Muramatsu et al. have conducted a series ofstudies on the mechanical properties of drawn wires ofhypoeutectic Cu0.727.2mass%Zr alloys (hereinaftermass% will be omitted in the notation).2) Muramatsu et al.reported that the Cu7.2Zr alloy wire with a drawing ratio,©, of 8.6 had a high tensile strength, ·u, of 2.2GPa and theCu0.72Zr alloy wire with © = 9.4 had a high electricalconductivity, E, of 83%IACS.2)
Applications such as power transmission cables requirea high electrical conductivity of 90%IACS or higher. Forimproving the electrical conductivity of CuZr wires further,Muramatsu et al. conducted repeated intermediate annealingduring rolling and subsequent wire drawing, followed byfinal wire drawing for a CuZr alloy produced by verticalupward continuous casting (VUCC) with a low Zr
concentration of 0.29 (0.2 at%).3) As a result, a CuZr wirehaving properties of a tensile strength, ·u, of 630MPa, a totalelongation, ¾t, of 1.1%, and an electrical conductivity, E,of 91.7%IACS was obtained. On the other hand, the wireproduced by rolling of the as-cast CuZr alloy andsubsequent annealing, followed by rolling and wire drawingwithout intermediate annealing, showed ·u = 820MPa, ¾t =1.5%, and E = 78.2%IACS. In other words, the wiresubjected to intermediate annealing possessed the highervalue of E, but the lower value of ¾t despite the lower valueof ·u.
In the previous paper,4) ECAP-conform processing, whichwas one of the severe plastic deformation, was introducedprior to rolling and subsequent wire drawing of the Cu0.29Zr alloy in order to improve the strength and ductility bygrain refinement. The ECAP-conform processing enhancedthe degree of grain refinement, resulting in a grain size of120 nm of the Cu0.29Zr alloy after subsequent tandemrolling followed by wire drawing. This grain size was finerthan that of 180 nm of the Cu0.29Zr alloy wire producedwithout the ECAP-conform processing. Although a goodstrength, ·u, of 790MPa and a ductility, ¾t, of 3.9% wereachieved by introducing the ECAP-conform processing, theelectrical conductivity, E, decreased from 88%IACS to73%IACS before and after the wire drawing. However, thereason for the decrease in electrical conductivity by wiredrawing was not elucidated.
In the present study, detailed microstructural observationswere performed on the Cu0.29Zr alloy subjected to differentprocessing routes: 1. round-bars subjected to ECAP-conformprocessing, 2. wires subjected to ECAP-conform processingwith subsequent rolling and wire drawing, and 3. wires
+1This Paper was Originally Published in Japanese in J. Jpn. Inst. Copper58 (2019) 712. The captions of all figures and tables have been modifiedslightly.
+2Graduate Student, Kanazawa University+3Present address: Daido Steel Co., Ltd., Nagoya 457-8545, Japan+4Corresponding author, E-mail: [email protected]
Materials Transactions, Vol. 62, No. 12 (2021) pp. 1710 to 1715©2021 Journal of Japan Institute of Copper
subjected to intermediate annealing with high electricalconductivity. Through these experiments, the following threeunclear points were examined: (1) the reason for the decreasein electrical conductivity by the rolling and wire drawingafter the ECAP-conform processing, (2) the reason for thehigh strength of the wire after the rolling and wire drawing,and (3) the reason for the high electrical conductivity of thewire subjected to the intermediate annealing. Furthermore,based on the obtained results, an attempt was made toproduce an alloy wire with a good balance of strength,ductility, and electrical conductivity.
2. Experimental Procedures
The processing routes for the ECAP-conform processingof Cu0.29Zr alloy round-bars with a diameter, d, of 14mmproduced by VUCC and subsequent tandem rolling followedby wire drawing have already been described in the previouspaper.4) First, a cast round-bar was subjected to conformextrusion from d = 14mm to 10mm, followed by ECAP-conform processing for four times. Then, the round-bar wastandem-rolled to d = 3mm and machined to d = 2.7mm.This machined specimen before being subjected to wiredrawing is referred to as “ECAP specimen”. The wiresproduced by wire drawing from d = 2.7mm to 0.6mm or0.2mm are referred to as “0.6ECAP wire” and “0.2ECAPwire”, respectively. In addition, a cast round-bar withd = 10mm without ECAP-conform processing was annealedat 650°C for 1 h, and then subjected to rolling and subsequentwire drawing to d = 0.2mm4) for comparison. The specimenbefore being subjected to wire drawing is referred to as “Aspecimen”. The wires with annealing are referred to as “Awire”. Especially, the wires subjected to wire drawing tod = 0.6 or 0.2mm are expressed as “0.6A wire” and “0.2Awire”, respectively.
Furthermore, referring to the processing route forproducing wires with intermediate annealing in the previousstudy,3) cast round-bars with d = 10mm were tandem-rolledto d = 5mm, and then annealed at 650°C for 1 h. Afterthat, the wires with d = 1mm were obtained by repeatedwire drawing and subsequent intermediate annealing at650°C for 1 h for three times. This wire before beingsubjected to subsequent final wire drawing is referred to as“IA specimen”. Besides, the wires subjected to the final wiredrawing are referred to as “IA wire”. Specifically, the wiressubjected to the final wire drawing to d = 0.6 or 0.2mm arereferred to as “0.6IA wire” and “0.2IA wire”, respectively.
Microstructural observations were carried out using atransmission electron microscope (TEM: Tecnai G2 30, FEI,Hillsboro, OR, USA) and a field-emission scanning electronmicroscope (FE-SEM: JSM-7100F, JEOL, Tokyo, Japan).TEM specimens were prepared as follows. In the case ofspecimens of the alloy before being subjected to wiredrawing, disk-shaped specimens with a diameter of 3mmwere cut out from the alloy along the longitudinal section.Then, the disk-shaped specimens were polished to a thicknessof 0.2mm, and subsequently electro-polished using asolution of 20% nitric acid and 80% methanol at atemperature of about ¹60°C and a voltage of 4.0V. On theother hand, in the case of the drawn wires, wires with a
diameter, d, of 0.6mm were used for TEM microstructuralobservations due to the difficulty in preparing TEMspecimens of the wires with a diameter, d, of 0.2mm. First,the 0.6mm wires were cut to an appropriate size, followedby polishing into strips with a thickness of 100 µm. Then, ionbeam processing was carried out using an ion slicer (EM-09100IS, JEOL, Tokyo, Japan) at a voltage of 5.0 kV.
Tensile tests were performed using a universal testingmachine (AUTOGRAPH AG-X, Shimadzu, Kyoto, Japan)for the alloy specimens before being subjected to wiredrawing. Flat tensile specimens having shoulders and a gaugesection with a gauge length of 5mm, a gauge width of 3mm,and a thickness of 0.3mm were cut from the round-bars andtested. The drawn wires were tensile-tested using a universaltesting machine (AUTOGRAPH AG-I, Shimadzu, Kyoto,Japan) with a distance of 100mm between the grippers.
To evaluate the dislocation density, X-ray diffraction(XRD) experiments were performed using an X-raydiffractometer (RINT-2500, Rigaku Corporation, Tokyo,Japan) with Cu-K¡ radiation. The dislocation densities wereestimated by converting the amount of strain calculated fromthe full widths at half maximum (FWHM) of the X-raydiffraction peaks corresponding to the (111), (200), (220),and (311) planes by the modified Williamson-Hall method.5)
The electrical conductivities were determined as E =(μ0/μ) © 100 using a resistivity, μ0, of pure copper (μ0 =17.2 n³m) and a measured resistivity, μ, by the four-terminalmethod.
3. Results
3.1 Mechanical properties and electrical conductivitiesTable 1 lists the 0.2% proof stress ·0.2, ·u, ¾t, and E of the
0.2ECAP, 0.2A, and 0.2IA wires. The data for the 0.2ECAPand 0.2A wires were taken from the previous study.4) Notonly the values of ·0.2 and ·u but also the value of ¾t ofthe 0.2ECAP wire was higher than those of the 0.2A wire.The 0.2IA wire possesses the lowest ductility in the threewires despite the lowest strength. The reason for the lowductility of the 0.2IA wire will be reported in another paper.
The electrical conductivity of the cast alloy was76.0%IACS, while those of the ECAP, A, and IA specimensbefore wire drawing were 88.2, 88.9, and 93.3%IACS,respectively. Thus, the values of E of the ECAP, A, and IAspecimens were higher than that of the cast alloy. Theelectrical conductivities of the 0.2ECAP, 0.2A, and 0.2IAwires decreased to 73.0, 74.1, and 90.5%IACS, respectively,as shown in Table 1, due to the subsequent rolling and wire
Table 1 0.2% proof stress, ·0.2, ultimate tensile strength, ·u, totalelongation, ¾t, and electrical conductivity, E, for the 0.2ECAP, 0.2A,0.2IA and 0.2IM wires.
Effect of Thermo-Mechanical Treatment on Electrical Conductivity and Strength of Cu0.29mass%Zr Alloy Wires 1711

drawing. While the electrical conductivity of the 0.2IA wirehardly decreased, the decrease in electrical conductivity ofthe 0.2ECAP and 0.2Awires was significant. The 0.2IM wireshown in Table 1 will be explained in Section 4.3.
3.2 MicrostructuresThe grain size, D, of the cast alloy was 13 µm. Granular
eutectics consisting of Cu and Cu5Zr with an averagediameter of about 1.5 µm were observed inside the grains,while plate-shaped eutectics with a length of about 10 µmwere seen at the grain boundaries.
In addition, inside the grains of the cast alloy, there werefine spherical precipitates clearly observed by the dark-field TEM imaging rather than the bright-field imaging.Figure 1(a) shows a dark-field TEM image of sphericalprecipitates taken using a reflection spot of the precipitates.Figure 1(b) is the [110]Cu selected-area diffraction pattern(SADP) corresponding to (a). The average diameter of thespherical precipitates was about 12 nm. In Fig. 1(b),reflection spots of the precipitates can be seen near all ofthe spots of the Cu matrix between the transmitted spot andthe Cu reflection spots. An analysis of the reflection spotsof the precipitates using the lattice constant of pure Cu(a = 0.3615 nm) revealed that the precipitates had a cube-on-cube orientation relationship with the Cu matrix and a latticeconstant, a, of 0.42 nm. The subscript for the reflection spotsof the precipitates having the cube-on-cube orientationrelationship with the Cu matrix is written as CP. It can bejudged that the precipitates are coherent or semi-coherentwith the Cu matrix. Hereafter, these precipitates are referredto as coherent face-centered cubic (fcc) precipitates (orphase). In Fig. 1(b), the reflection spots of 1�10CP and �110CPof the coherent fcc precipitates, indicated by the arrows, are
also observed, indicating that the fcc phase is an orderedstructure. This ordered fcc phase does not have the samelattice constant as the Cu5Zr phase with the fcc lattice systemexisting on the Cu side in the CuZr binary phase diagram,6)
and its structure is also different from that of the Cu51Zr14phase around the Cu-rich corner of the phase diagram.Furthermore, the fcc ordered phase has not been reported asa GP zone or an intermediate phase as well. Thus, this fccphase was newly found for the first time in the present study.
As in the previous paper,4) recrystallized grains wereobserved in the specimens after conform extrusion as well asin the specimens after ECAP-conform processing for fourtimes. Besides, it was confirmed that the grain size of theECAP specimen (subjected to ECAP-conform processing forfour times) was refined to 0.9 µm. Figure 2(a) and (b) depicta bright-field TEM image of spherical precipitates and a dark-field TEM image of the coherent fcc precipitates within thesame recrystallized grain in the ECAP specimen. Figure 2(c)is the [110]Cu SADP corresponding to (a). The sphericalprecipitates in the recrystallized grain had an average size ofabout 10 nm. In Fig. 2(c), it can be seen that reflection spotsof these precipitates, such as 1�11IP, are observed at different
Fig. 1 (a) Dark-field TEM image of fcc precipitates in an as-cast Cu0.29mass%Zr alloy, (b) [110]Cu selected-area diffraction pattern (SADP)corresponding to (a).
Fig. 2 (a) Bright-field TEM image of incoherent fcc precipitates inside agrain in an ECAP specimen, (b) dark-field TEM image of fcc precipitatesin the same grain as in (a), (c) [110]Cu SADP corresponding to (a).
H. Watanabe et al.1712

positions from the fcc precipitates. Analyses of many SADPsrevealed that the precipitates had the same lattice constantof 0.42 nm and the same ordered structure as the fccprecipitates, but were incoherent with the Cu matrix. It wasfound that recrystallization during conform extrusion orECAP-conform processing changed the coherent fcc precip-itates into the incoherent fcc precipitates. The subscripts ofthe reflection spots for the incoherent precipitates weredenoted as IP. As shown in Fig. 2(b), fine fcc precipitates,which were newly precipitated after recrystallization, withan average size of about 7 nm were also found in therecrystallized grains. In addition to the incoherent precip-itates, as shown in Fig. 2(b), the fine coherent fcc precipitatesnewly formed after recrystallization and having an averagesize of about 7 nm coexisted in the recrystallized grains.Grains with the coherent and incoherent fcc precipitatesaccounted for about 80% of the observed grains. In the other20% of the grains, only the incoherent fcc precipitates withan average size of about 11 nm were observed. The coherentfcc precipitates became incoherent during the grain-refine-ment process from D = 13 µm in the cast alloy to 0.9 µmafter ECAP-conform processing for four times. On the otherhand, the grain size of the A specimen prepared forcomparison was 13 µm, and the average size of the coherentfcc precipitates was about 11 nm.
The grain size of the IA specimen was 5 µm. In theintermediate process, recrystallization occurred by repeatedintermediate annealing after rolling or wire drawing, and thecoherent and incoherent fcc precipitates coexisted in therecrystallized grains. After final annealing, the coherent fccprecipitates were no longer observed in the recrystallizedgrains of the IA specimens, and only the incoherent fccprecipitates were present.
Subsequent rolling and wire drawing to d = 0.6mmresulted in the formation of the incoherent fcc precipitatesas well as grain refinement. In the 0.6ECAP wire, the grainshaving both the coherent fcc precipitates with an average sizeof about 9 nm and the incoherent fcc precipitates with anaverage size of about 10 nm and the grains having only theincoherent fcc precipitates with an average size of 11 nmwere observed at a ratio of about 7:3. In the 0.6A wire, thegrains having only the coherent precipitates with an averagesize of about 12 nm and the grains having only the incoherentprecipitates with an average size of about 11 nm wereobserved at a ratio of about 6:4. In the 0.6IA wire, only theincoherent precipitates were confirmed in all of the observedgrains.
Table 2 lists the grain size, D, of the 0.2ECAP and 0.2Awires, reported in the previous paper,4) and the 0.2IA wire.
The grains were elongated along the wire drawing direction,and the grain boundary spacing parallel to the wire drawingdirection was defined as D. The grains of all wires wererefined by rolling and wire drawing, and the D value of the0.2ECAP wire was the smallest of the three types of wires.Table 2 also summarizes the dislocation density, μd, of thewires. The 0.2ECAP wire showed the highest valueof μd, while the 0.2IA wire showed the lowest value of μd.
4. Discussion
4.1 Decrease in electrical conductivity by rolling andwire drawing
The electrical conductivity of alloys is affected bydislocation density, grain boundary density, and solute atomconcentration. With increasing these values, the electricalconductivity becomes lower. It is generally known that thesolute concentration in the Cu matrix has the greatest effecton electrical conductivity.7) Therefore, in the present study,it can be considered that the increase of Zr solute atoms inthe Cu matrix is the main reason of the decrease in electricalconductivity during rolling and wire drawing. Since the fccprecipitates have the cube-on-cube orientation relationshipwith the Cu matrix, it can be presumed that they arerepeatedly cut by dislocations during rolling and wiredrawing, resulting in dissolution of the fcc precipitates inthe Cu matrix and a decrease in electrical conductivity of thewire. First, this presumption will be examined.
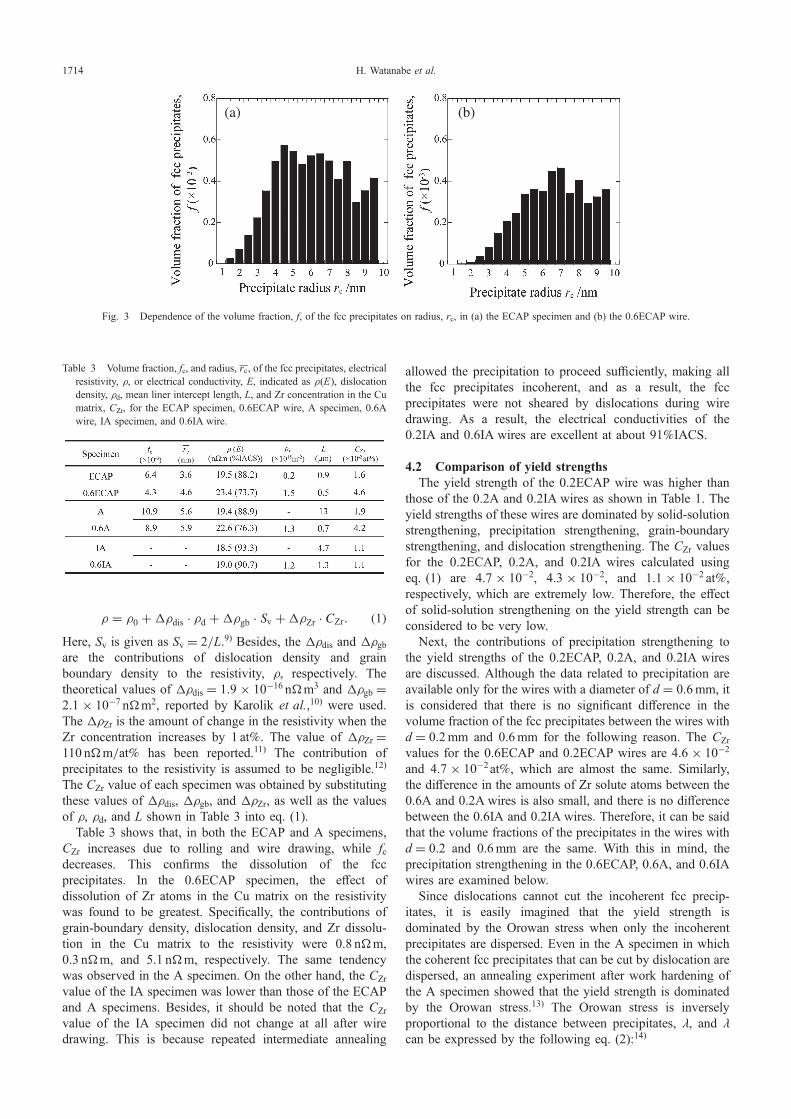
Figure 3(a) and (b) show the volume fractions, f, of thecoherent fcc precipitates with certain ranges of radius as afunction of the radius, rc, of the fcc precipitates observed inthe ECAP specimen and 0.6ECAP wire. The values of fwere obtained from (4/3)³rc3N, where N is the numberdensity of the fcc precipitates with a certain range of radiusper unit volume. The volumes were obtained by measuringthe thickness of the TEM specimens using grain boundaries.A comparison of Fig. 3(a) and (b) reveals that all the fvalues of the fcc precipitates are reduced by rolling and wiredrawing. In particular, the f values of the fcc precipitateswith smaller radii were significantly decreased. These resultsindicate that the fcc precipitates were mechanically dissolvedinto the Cu matrix during rolling and wire drawing.Especially, the dissolution of the smaller fcc precipitateswere significant.
Table 3 lists the volume fraction, fc, and mean radius, rc,of the coherent fcc precipitates in the ECAP specimen,0.6ECAP wire, A specimen, and 0.6A wire. Rolling andwire drawing of both ECAP and A specimens decreasedthe values of fc and increased the values of rc. Thus, it isevident that the value of fc was reduced due to mechanicaldissolution of the smaller fcc precipitates more than the largerones.
Table 3 also shows the resistivity, μ, (the electricalconductivity, E), the dislocation density, μd, the averageintercept length, L, which is equivalent to grain size, and theamount of Zr solute atoms, CZr, of the ECAP specimen,0.6ECAP wire, A specimen, 0.6A wire, IA specimen and0.6IA wire. The values of CZr were calculated as follows.
The μ value of each specimen can be expressed using μ0,μd, grain boundary density, Sv, and CZr as follows:8)
Table 2 Average grain size, D, and dislocation density, μd, for the0.2ECAP, 0.2A and 0.2IA wires, and precipitate radius, rci, volumefraction, fci, and inter-precipitate spacing, , for the 0.6ECAP, 0.6A and0.6IA wires.
Effect of Thermo-Mechanical Treatment on Electrical Conductivity and Strength of Cu0.29mass%Zr Alloy Wires 1713
μ ¼ μ0 þ�μdis � μd þ�μgb � Sv þ�μZr � CZr: ð1ÞHere, Sv is given as Sv = 2/L.9) Besides, the ¦μdis and ¦μgbare the contributions of dislocation density and grainboundary density to the resistivity, μ, respectively. Thetheoretical values of ¦μdis = 1.9 © 10¹16 n³m3 and ¦μgb =2.1 © 10¹7 n³m2, reported by Karolik et al.,10) were used.The ¦μZr is the amount of change in the resistivity when theZr concentration increases by 1 at%. The value of ¦μZr =110 n³m/at% has been reported.11) The contribution ofprecipitates to the resistivity is assumed to be negligible.12)
The CZr value of each specimen was obtained by substitutingthese values of ¦μdis, ¦μgb, and ¦μZr, as well as the valuesof μ, μd, and L shown in Table 3 into eq. (1).
Table 3 shows that, in both the ECAP and A specimens,CZr increases due to rolling and wire drawing, while fcdecreases. This confirms the dissolution of the fccprecipitates. In the 0.6ECAP specimen, the effect ofdissolution of Zr atoms in the Cu matrix on the resistivitywas found to be greatest. Specifically, the contributions ofgrain-boundary density, dislocation density, and Zr dissolu-tion in the Cu matrix to the resistivity were 0.8 n³m,0.3 n³m, and 5.1 n³m, respectively. The same tendencywas observed in the A specimen. On the other hand, the CZr
value of the IA specimen was lower than those of the ECAPand A specimens. Besides, it should be noted that the CZr
value of the IA specimen did not change at all after wiredrawing. This is because repeated intermediate annealing
allowed the precipitation to proceed sufficiently, making allthe fcc precipitates incoherent, and as a result, the fccprecipitates were not sheared by dislocations during wiredrawing. As a result, the electrical conductivities of the0.2IA and 0.6IA wires are excellent at about 91%IACS.
4.2 Comparison of yield strengthsThe yield strength of the 0.2ECAP wire was higher than
those of the 0.2A and 0.2IA wires as shown in Table 1. Theyield strengths of these wires are dominated by solid-solutionstrengthening, precipitation strengthening, grain-boundarystrengthening, and dislocation strengthening. The CZr valuesfor the 0.2ECAP, 0.2A, and 0.2IA wires calculated usingeq. (1) are 4.7 © 10¹2, 4.3 © 10¹2, and 1.1 © 10¹2 at%,respectively, which are extremely low. Therefore, the effectof solid-solution strengthening on the yield strength can beconsidered to be very low.
Next, the contributions of precipitation strengthening tothe yield strengths of the 0.2ECAP, 0.2A, and 0.2IA wiresare discussed. Although the data related to precipitation areavailable only for the wires with a diameter of d = 0.6mm, itis considered that there is no significant difference in thevolume fraction of the fcc precipitates between the wires withd = 0.2mm and 0.6mm for the following reason. The CZr
values for the 0.6ECAP and 0.2ECAP wires are 4.6 © 10¹2
and 4.7 © 10¹2at%, which are almost the same. Similarly,the difference in the amounts of Zr solute atoms between the0.6A and 0.2A wires is also small, and there is no differencebetween the 0.6IA and 0.2IA wires. Therefore, it can be saidthat the volume fractions of the precipitates in the wires withd = 0.2 and 0.6mm are the same. With this in mind, theprecipitation strengthening in the 0.6ECAP, 0.6A, and 0.6IAwires are examined below.
Since dislocations cannot cut the incoherent fcc precip-itates, it is easily imagined that the yield strength isdominated by the Orowan stress when only the incoherentprecipitates are dispersed. Even in the A specimen in whichthe coherent fcc precipitates that can be cut by dislocation aredispersed, an annealing experiment after work hardening ofthe A specimen showed that the yield strength is dominatedby the Orowan stress.13) The Orowan stress is inverselyproportional to the distance between precipitates, , and
can be expressed by the following eq. (2):14)
Table 3 Volume fraction, fc, and radius, rc, of the fcc precipitates, electricalresistivity, μ, or electrical conductivity, E, indicated as μ(E), dislocationdensity, μd, mean liner intercept length, L, and Zr concentration in the Cumatrix, CZr, for the ECAP specimen, 0.6ECAP wire, A specimen, 0.6Awire, IA specimen, and 0.6IA wire.
(a) (b)
Fig. 3 Dependence of the volume fraction, f, of the fcc precipitates on radius, rc, in (a) the ECAP specimen and (b) the 0.6ECAP wire.
H. Watanabe et al.1714

¼ rsfð2³=3fsÞ1=2 � 1:63g; ð2Þwhere rs and fs are the average radius and volume fractionof the spherical precipitates. In the present study, rs is theaverage radius, rci, of the coherent and incoherent fccprecipitates, and the fs is the sum of the volume fractions, fci,of the coherent and incoherent fcc precipitates. Table 2 showsthe values of rci, fci and calculated from eq. (2) for the0.6ECAP, 0.6A and 0.6IAwires, respectively. Although thereare slight differences in the values for these wires, it can bejudged that the contribution of precipitation strengtheningto the differences in yield strengths among the three wiresis low. Therefore, it can be said that the differences in theyield strengths of the drawn wires are mainly caused by thedifferences in the amounts of dislocation strengthening andgrain-boundary strengthening. In Tables 1 and 2, the highestyield strength of the 0.2ECAP wire is attributed to thesmallest D and the highest μd values. In contrast, the lowestyield strength of the 0.2IA wire was caused by the largest Dand lowest μd values.
4.3 Fabrication of an alloy with good strength, ductility,and electrical conductivity
The above results and discussions lead to two importantpoints for producing alloy wires with good strength, ductility,and electrical conductivity. The first thing is to utilizerecrystallization to change coherent fcc precipitates aftersufficient precipitation into incoherent fcc precipitates. Thesecond point is as follows. After finishing the process ofobtaining incoherent fcc precipitates by recrystallization, agrain-refinement process such as severe plastic deformationprocessing, and final wire drawing are performed.
Phillips15) has been reported that when a Cu1.07Zr alloywas rolled and then aged at 500°C, no recrystallizationoccurred and Cu5Zr precipitates were preferentially formedon dislocations. Therefore, after wire drawing of the castalloy to d = 5mm and introducing dislocations, the electricalconductivity, E, was increased to 90.6%IACS by preferen-tially precipitating Cu5Zr on the dislocations throughannealing at 500°C for 3 h. Then, annealing was performedat 650°C for 15min in order to change the fcc precipitatesand Cu5Zr precipitates into incoherent ones by recrystalliza-tion. The recrystallized grain size after annealing was 7 µm.Then, ECAP processing was performed for four times viaroute Bc16) so as to improve the strength and ductility ofthe alloy by grain refinement. The grain size was decreasedto 0.3 µm. Finally, the wire drawing was carried out tod = 0.2mm. This wire is referred to as 0.2IM wire. The grainsize of the 0.2IM wire was decreased to 100 nm. As shownin Table 1, we obtained the 0.2IM wire with high values of·u = 820MPa and ¾t = 4.0% while maintaining a high valueof E = 86.9%IACS.
In the present study, we succeeded in fabricating wireswith better balance of mechanical and electrical propertiesin laboratory-scale experiments. Our future challenges arehow to incorporate the above mentioned process into anindustrial-scale manufacturing process of wires.
5. Conclusions
(1) The 0.2ECAP wire exhibited a 0.2% proof stress, ·0.2,of 730MPa and a tensile strength, ·u, of 790MPa.These values were higher than the ones of ·0.2 =650MPa and ·u = 710MPa of the 0.2A wire, and thevalues of ·0.2 = 580MPa and ·u = 610MPa of the0.2IA wire. The strength of the 0.2ECAP wire was thehighest because the grain size was extremely refined to120 nm and the dislocation density was the highest.
(2) The electrical conductivities, E, of the 0.2ECAP and0.2A wires were decreased from about 90%IACS to73.0 and 74.1%IACS by rolling and wire drawing,respectively. This is because the ordered fcc precip-itates, which were formed during casting process andnewly found in the present study, were cut bydislocations and mechanically dissolved into the Cumatrix during wire drawing. On the other hand, the0.2IA wire showed a high value of E = 90.5%IACS.This is due to the low concentration of Zr solute atomsin the Cu matrix caused by the sufficient precipitationprocess through the repeated intermediate annealing,and the fact that the fcc precipitates became incoherentby recrystallization and thus did not mechanicallydissolved into the Cu matrix during wire drawing.
(3) Based on the above mentioned findings in the wire-fabrication process, first of all, recrystallization wascarried out to make the precipitates incoherent aftersufficient precipitation process by annealing. After that,the ECAP process was incorporated followed by finalwire drawing. As a result, an alloy wire with highstrength, ductility, and electrical conductivity was ableto be fabricated. The wire with a small grain size of100 nm exhibited high values of ·u = 820MPa, ¾t =4.0%, and E = 86.9%IACS.
REFERENCES
1) Furukawa Electric Co., Ltd.: Copper wires, CCwire (C18200). https://www.furukawa.co.jp/copper/en/product/copper_wires.html, (accessedMay 6, 2021).
2) N. Muramatsu, H. Kimura and A. Inoue: Mater. Trans. 54 (2013) 176183.
3) N. Muramatsu, T. Nakajima, T. Fukuoka and R. Monzen: J. Jpn. Inst.Copper 56 (2017) 3944.
4) K. Nomura, T. Nakajima, N. Muramatsu, H. Watanabe and R. Monzen:J. Jpn. Inst. Copper 57 (2018) 107111.
5) T. Kunieda, M. Nakai, Y. Murata, T. Koyama and M. Morinaga: ISIJInt. 45 (2005) 19091914.
6) H. Okamoto: J. Phase Equilibria Diffus. 33 (2012) 417418.7) S. Komatsu and T. Muramatsu: J. JILM 50 (2000) 518526.8) Y. Miyajima, S. Komatsu, M. Mitsuhara, S. Hata, H. Nakashima and N.
Tsuji: Philos. Mag. 90 (2010) 44754488.9) Y. Adachi: J. JILM 61 (2011) 7884.10) A.S. Karolik and A.A. Luhvich: J. Phys. Condens. Matter 6 (1994)
873886.11) S. Komatsu: J. Jpn. Inst. Copper 41 (2002) 19.12) A. Boltax: Trans. Metall. Soc. AIME 218 (1960) 812821.13) H. Watanabe: Master Thesis, Kanazawa University (2019).14) J.W. Martin: Micromechanisms in Particle-Hardened Alloys, (Cam-
bridge University Press, Cambridge, 1980) pp. 4456.15) V.A. Phillips: Metallography 7 (1974) 137155.16) R.Z. Valiev and T.G. Langdon: Prog. Mater. Sci. 51 (2006) 881981.
Effect of Thermo-Mechanical Treatment on Electrical Conductivity and Strength of Cu0.29mass%Zr Alloy Wires 1715