Embed Size (px)
DESCRIPTION
Â
Citation preview

EG Cube工程圖學教具

EG Cube工程圖學教具
Y. C. Chen, H. L. Chi, W. H. Hung, and S. C. Kang, "Use of Tangible and Augmented Reality Models in Engineering Graphics Courses," Journal of Professional Issues in Engineering Education and Practice, vol. 137, pp. 267-276, Oct 2011.
Related references1.
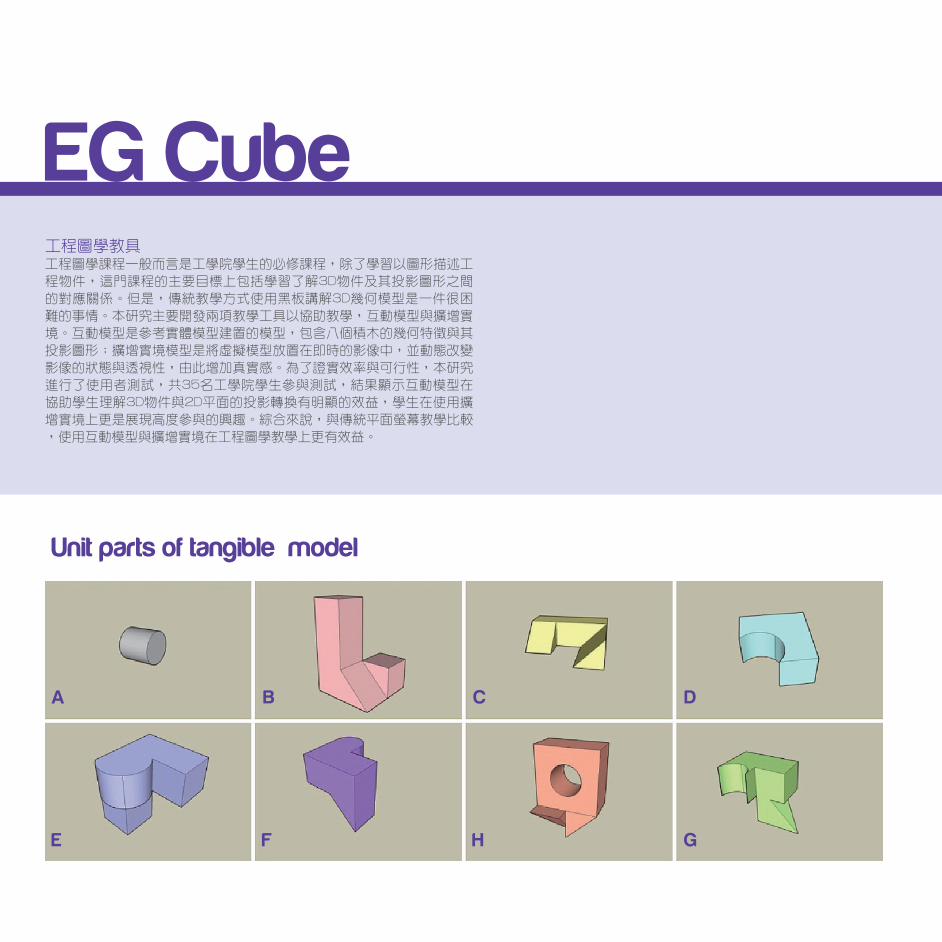
工程圖學教具工程圖學課程一般而言是工學院學生的必修課程,除了學習以圖形描述工
程物件,這門課程的主要目標上包括學習了解3D物件及其投影圖形之間
的對應關係。但是,傳統教學方式使用黑板講解3D幾何模型是一件很困
難的事情。本研究主要開發兩項教學工具以協助教學,互動模型與擴增實
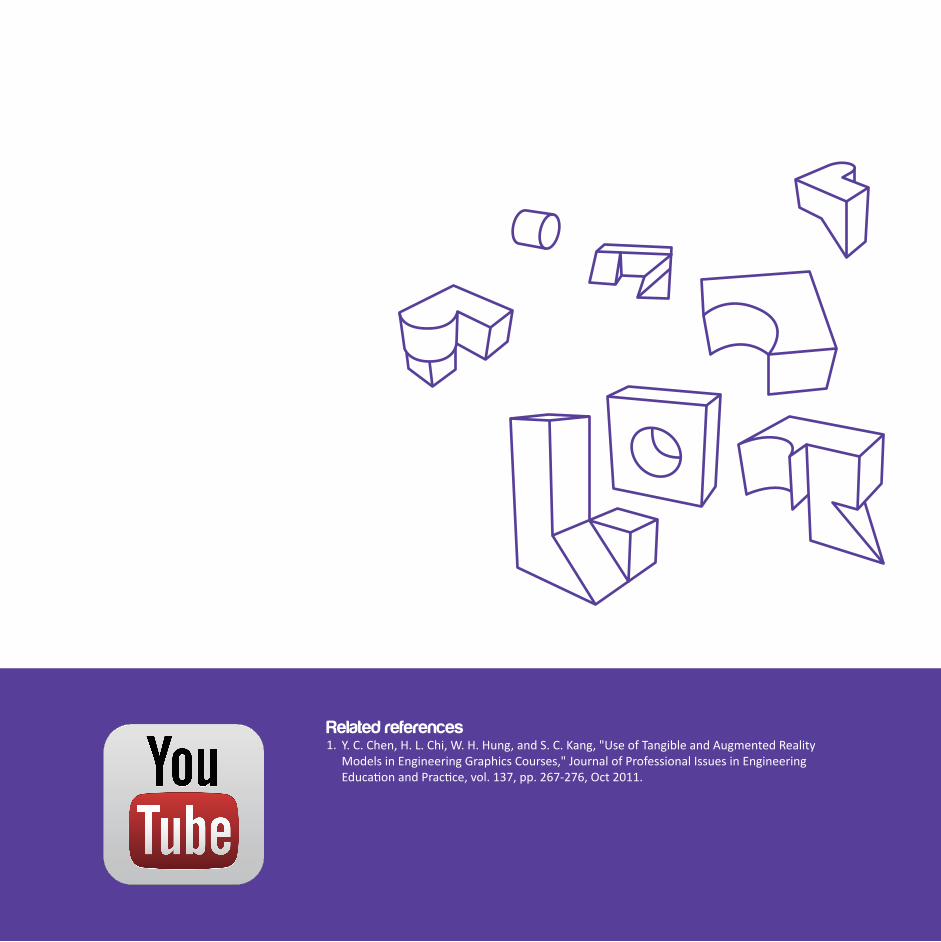
境。互動模型是參考實體模型建置的模型,包含八個積木的幾何特徵與其
投影圖形;擴增實境模型是將虛擬模型放置在即時的影像中,並動態改變
影像的狀態與透視性,由此增加真實感。為了證實效率與可行性,本研究
進行了使用者測試,共35名工學院學生參與測試,結果顯示互動模型在
協助學生理解3D物件與2D平面的投影轉換有明顯的效益,學生在使用擴
增實境上更是展現高度參與的興趣。綜合來說,與傳統平面螢幕教學比較
,使用互動模型與擴增實境在工程圖學教學上更有效益。
Unit parts of tangible model
EG Cube

EG CubeEngineering graphics courses are typically a requirement for engineering students around the world. Besides understanding and depicting graphic representation of engineering objects, the goal of these courses is to provide students with an understanding of the relationship between three-dimensional (3D) objects and their projections. However, it is very difficult to explain 3D geometry using only drawings on paper or at the blackboard. The research presented herein aims to develop two teaching aids; a tangible model and an augmented reality (AR) model, to help students better understand the relationship between 3D objects and their projections. Tangible models refer to the physical objects which are comprised of a set of differently shaped pieces. The tangible model includes eight wooden blocks that include all the main geometrical features with respect to their 3D projections. The AR models are the virtual models which can superimpose 3D graphics of typical geometries on real-time video and dynamically vary view perspective in real-time to be seen as real objects. To verify the effectiveness and applicability of the models we developed, we conducted a user test on 35 engineering-major students. The statistical results indicated that the tangible model significantly increased the learning performance of students in their abilities to transfer 3D objects onto two-dimensional (2D) projections. Students also demonstrated higher engagement with the AR model during the learning process. Compared to using the screen-based orthogonal and pictorial images, the tangible model and augmented reality model were evaluated to be more effective teaching aids for engineering graphics courses.
Augmented reality: (a) marker; (b) marker and virtual object

EG Cube
Augmented reality interface used in this research
Test structure
Spatialorganization
tangiblemodel
paper-basedmodel
augmentedreality model
paper-basedmodel
augmentedreality model
2D 3D3D 2D

Results of Scores Results of Efficiency with which Questions Were Answered
Mean
95% Confidence intervalof differences
Lower Upper tSig.
(2-tailed)Std.
deviation
T-P
T-A
P-A
P-A
T-P
T-A
P-A
P-A
T-P
T-A
P-A
P-A
b
b
b
c
b
b
b
c
b
b
b
c
2.117
0.753
-1.377
0.179
1.296
0.688
-0.580
-0.275
2.349
0.742
-1.743
0.561
1.561
1.697
2.149
1.783
1.524
1.651
1.904
1.561
1.582
1.768
2.246
1.906
1.589
0.171
-2.115
-0.433
0.756
0.071
-1.292
-1.107
1.629
-0.110
-2.825
-0.357
2.645
1.336
-0.638
0.791
1.837
1.305
0.130
0.557
3.069
1.594
-0.660
1.479
8.138
2.627
-3.790
0.594
4.886
2.282
-1.669
-0.704
6.803
1.829
-3.382
1.283
0.000
0.013
0.008
0.577
0.000
0.030
0.106
0.492
0.000
0.084
0.003
0.216
a
a
a
a
a
a
a
All participants
High scoring group
Low scoring group
Mean
95% Confidence intervalof differences
Lower Upper tSig.
(2-tailed)Std.
deviation
T-P
T-A
P-A
P-A
T-P
T-A
P-A
P-A
T-P
T-A
P-A
P-A
b
b
b
c
b
b
b
c
b
b
b
c
-0.0070
0.0047
0.0107
0.0260
0.0011
-0.0002
0.0001
0.0258
-0.0893
0.0063
0.1457
0.0262
0.0151
0.0147
0.3021
0.0176
0.0139
0.0142
0.0128
0.0160
0.0193
0.0183
0.0269
0.0193
-0.0122
-0.0004
0.0036
0.0030
-0.039
-0.0054
-0.0047
0.0173
-0.1772
-0.0025
0.0016
0.0169
-0.0019
0.0098
0.0179
0.0321
0.0060
0.0051
0.0049
0.0343
-0.0001
0.0152
0.0275
0.0355
-2.7900
1.8830
3.0650
8.7490
0.4680
-0.0580
0.0039
6.4640
-2.1210
1.5060
2.3590
5.9220
0.0080
0.0680
0.0040
0.0000
0.6430
0.9540
0.9690
0.0000
L
0.0470
0.1490
0.0300
0.0000
a
a
a
a
a
a
a
All participants
High scoring group
Low scoring group

Shih-Chung Jessy [email protected]
![V -CUBE m |4 · ± V -cube USA, Inc. B T ] ¼ ¬C ± V -cube Global Services Pte. Ltd. B i ¥ ^ 4 C ± V -cube Global Operations Pte. Ltd. B i ¥ ^ 4 C ± V -cube Singapore Pte. Ltd](https://img.pdfslide.tips/doc/110x75/5e90f5de5df08341ae2467c3/v-cube-m-4-v-cube-usa-inc-b-t-c-v-cube-global-services-pte-ltd.jpg)