Embed Size (px)
Citation preview
KTH Chemical Science
and Engineering
Electrode degradation in proton
exchange membrane fuel cells
Alejandro Oyarce
Doctoral Thesis
Applied Electrochemistry, School of Chemical Science and Engineering Kungliga Tekniska Högskolan, Stockholm 2013
Akademisk avhandling som med tillstånd av Kungliga Tekniska högskolan i Stockholm, framlägges till offentlig granskning för avläggande av teknologie doktorsexamen
fredagen den 22 november 2013, kl.10.00 i sal Kollegisalen, Brinellvägen 8, plan04, KTH

All rights reserved © Alejandro Oyarce 2013 Printed in Sweden E-Print, Stockholm 2013 TRITA-CHE Report 2013:43 ISSN 1654-1081 ISBN 978-91-7501-890-4

Till Graham Försöker ständigt leva det liv du aldrig fick chansen att leva
Abstract The topic of this thesis is the degradation of fuel cell electrodes in proton exchange
membrane fuel cells (PEMFCs). In particular, the degradation associated with localized fuel
starvation, which is often encountered during start-ups and shut-downs (SUs/SDs) of
PEMFCs. At SU/SD, O2 and H2 usually coexist in the anode compartment. This situation
forces the opposite electrode, i.e. the cathode, to very high potentials, resulting in the
corrosion of the carbon supporting the catalyst, referred to as carbon corrosion. The aim of
this thesis has been to develop methods, materials and strategies to address the issues
associated to carbon corrosion in PEMFC.
The extent of catalyst degradation is commonly evaluated determining the
electrochemically active surface area (ECSA) of fuel cell electrode. Therefore, it was
considered important to study the effect of RH, temperature and type of accelerated
degradation test (ADT) on the ECSA. Low RH decreases the ECSA of the electrode,
attributed to re-structuring the ionomer and loss of contact with the catalyst.
In the search for more durable supports, we evaluated different accelerated
degradation tests (ADTs) for carbon corrosion. Potentiostatic holds at 1.2 V vs. RHE were
found to be too mild. Potentiostatic holds at 1.4 V vs. RHE were found to induce a large
degree of reversibility, also attributed to ionomer re-structuring. Triangle-wave potential
cycling was found to irreversibly degrade the electrode within a reasonable amount of time,
closely simulating SU/SD conditions.
Corrosion of carbon-based supports not only degrades the catalyst by
lowering the ECSA, but also has a profound effect on the electrode morphology. Decreased
electrode porosity, increased agglomerate size and ionomer enrichment all contribute to the
degradation of the mass-transport properties of the cathode. Graphitized carbon fibers were
found to be 5 times more corrosion resistant than conventional carbons, primarily attributed
to their lower surface area. Furthermore, fibers were found to better maintain the integrity
of the electrode morphology, generally showing less degradation of the mass-transport
losses. Different system strategies for shut-down were evaluated. Not doing anything to the
fuel cell during shut-downs is detrimental for the fuel cell. O2 consumption with a load and
H2 purge of the cathode were found to give around 100 times lower degradation rates
compared to not doing anything and almost 10 times lower degradation rate than a simple
air purge of the anode. Finally, in-situ measurements of contact resistance showed that the
contact resistance between GDL and BPP is highly dynamic and changes with operating
conditions.
Keywords: PEMFC; PEFC; Porous electrodes; Carbon corrosion; Carbon nanotubes; Carbon fibers;
Polyhedral carbon nanofoams; Phosphonated hydrocarbon ionomer; Mass-transport losses; Electrode
morphology; Electrode collapse; Start-up and shut-down; System strategies; Stainless steel; Bi-polar plates;
In-situ contact resistance.
Sammanfattning Denna doktorsavhandling behandlar degraderingen av
polymerelektrolytbränslecellselektroder. polymerelektrolytbränslecellselektroder. Den
handlar särskilt om nedbrytningen av elektroden kopplad till en degraderingsmekanism som
heter ”localized fuel starvation” oftast närvarande vid uppstart och nedstängning av
bränslecellen. Vid start och stopp kan syrgas och vätgas förekomma samtidigt i anoden.
Detta leder till väldigt höga elektrodpotentialer i katoden. Resultatet av detta är att
kolbaserade katalysatorbärare korroderar och att bränslecellens livslängd förkortas. Målet
med avhandlingen har varit att utveckla metoder, material och strategier för att både öka
förståelsen av denna degraderingsmekanism och för att maximera katalysatorbärarens
livslängd.
Ett vanligt tillvägagångsätt för att bestämma graden av katalysatorns
degradering är genom mätning av den elektrokemiskt aktiva ytan hos
bränslecellselektroderna. I denna avhandling har dessutom effekten av temperatur och
relativ fukthalt studerats. Låga fukthalter minskar den aktiva ytan hos elektroden, vilket
sannolikt orsakas av en omstrukturering av jonomeren och av kontaktförlust mellan
jonomer och katalysator.
Olika accelererade degraderingstester för kolkorrosion har använts.
Potentiostatiska tester vid 1.2 V mot RHE visade sig vara för milda. Potentiostatiska tester
vid 1.4 V mot RHE visade sig däremot medföra en hög grad av reversibilitet, som också den
tros vara orsakad av en omstrukturering av jonomeren. Cykling av elektrodpotentialen
degraderade istället elektroden irreversibelt, inom rimlig tid och kunde väldigt nära simulera
förhållandena vid uppstart och nedstängning.
Korrosionen av katalysatorbäraren medför degradering av katalysatorn och
har också en stor inverkan på elektrodens morfologi. En minskad elektrodporositet, en ökad
agglomeratstorlek och en anrikning av jonomeren gör att elektrodens
masstransportegenskaper försämras. Grafitiska kolfibrer visade sig vara mer resistenta mot
kolkorrosion än konventionella kol, främst p.g.a. deras låga ytarea. Grafitiska kolfibrer visade
också en förmåga att bättre bibehålla elektrodens morfologi efter accelererade tester, vilket
resulterade i lägre masstransportförluster.
Olika systemstrategier för nedstängning jämfördes. Att inte göra något
under nedstängning är mycket skadligt för bränslecellen. Förbrukning av syre med en last
och spolning av katoden med vätgas visade 100 gånger lägre degraderingshastighet av
bränslecellsprestanda jämfört med att inte göra något alls och 10 gånger lägre
degraderingshastighet jämfört med spolning av anoden med luft. In-situ
kontaktresistansmätningar visade att kontaktresistansen mellan bipolära plattor och GDL är
dynamisk och kan ändras beroende på driftförhållandena.
List of Papers The work presented in this thesis is based on the following papers, referred to in the text by
their Roman numerals, and appended at the end of the thesis.
I. Active Area Determination of Porous Pt Electrodes Used in Polymer
Electrolyte Fuel Cells: Temperature and Humidity Effects
R. W. Lindström, K. Kortsdottir, M. Wesselmark, A. Oyarce, C. Lagergren, and G.
Lindbergh, J. Electrochem. Soc., 157 (12) B1795-B1801 (2010).
II. Performance of Phosphonated Hydrocarbon Ionomer in the Fuel Cell
Cathode Catalyst Layer
R. W. Lindström, A. Oyarce, L. G. Aguinaga, D. Ubeda, M. Ingratta, P. Jannasch and
G. Lindbergh, J. Electrochem. Soc., 160 (3) F269-F277 (2013).
III. Graphitised Carbon Nanofibers as Catalyst Support for PEMFC
E. Yli-Rantala, A. Pasanen, P. Kauranen, V. Ruiz, M. Borghei, E. Kauppinen, A.
Oyarce, G. Lindbergh, C. Lagergren, M. Darab, S. Sunde, M. Thomassen, S. Ma-
Andersen, and E. Skou, Fuel Cells 11 (2011) 715–725.
IV. The Electrochemical Response of a Corroded PEMFC Cathode-
Mass-transport at low RH
A. Oyarce, C. Lagergren and G. Lindbergh, Manuscript
V. Polyhedral Carbon Nanofoams as Support in PEMFC Cathodes
A. Oyarce, L. L. Hussami, R. W. Corkery, C. Lagergren, L. Kloo and G. Lindbergh,
Manuscript
VI. Comparison of Shut-down Strategies for Proton Exchange Membrane
Fuel Cells
A. Oyarce, E. Zakrisson, M. Ivity, C. Lagergren, A. Bodén and G. Lindbergh. Submitted
to J. Power Sources.
VII. Operating Conditions Affecting the Contact Resistance of Bi-polar
Plates in Proton Exchange Membrane Fuel Cells
A. Oyarce, N. Holmström, A. Bodén, C. Lagergren and G. Lindbergh, J. Power Sources
231 (2013) 246-255
The CO-stripping measurements in paper I were carried out by R. W. Lindström and K.
Kortsdottir and the accelerated degradation tests were carried out in cooperation with M.
Wesselmark. In paper II, the ionomer were developed and synthetized at Lund University.
In paper III, the pre-treatment, synthesis and physical characterization of the catalysts was
carried out by Aalto University, the electrochemical measurements were carried out in
cooperation with E. Yli-Rantala and the FTIR measurements were made by M. Thomassen
at SINTEF. In paper V, the synthesis of the carbon nanofoams was carried out by L.
Hussami.
Papers not appended
Direct Sorbitol Proton Exchange Membrane Fuel Cell Using Moderate Catalyst
Loadings
A. Oyarce, C. Gonzalez, R. B. Lima, R.W. Lindström, C. Lagergren and G. Lindbergh. Submitted to
Electrochim. Acta.
In-situ Measurements of Contact Resistance and In-situ Durability studies of Steels and Coatings to be used as Bipolar Plates in PEMFCs A. Oyarce, N. Holmström, A. Bodén, S. Randström and G. Lindbergh, ECS Trans, 25 (2009) 1791-
1801.
Table of contents
Abstract List of Papers
1 Introduction, context and outline ......................................................................................... 1
1.1 Introduction ............................................................................................................................... 1
1.2 Research context .................................................................................................................... 2
1.3 Thesis outline ........................................................................................................................... 3
2 Components, irreversible losses and degradation ............................................................ 4
2.1 General description of a PEMFC ...................................................................................... 4
2.2 PEMFC components ............................................................................................................ 5
2.2.1 Membrane ........................................................................................................................... 5
2.2.2 Catalyst layer ....................................................................................................................... 6
2.2.3 Gas diffusion layers ........................................................................................................... 8
2.2.4 Bi-polar plates ..................................................................................................................... 8
2.3 Irreversible losses ................................................................................................................... 9
2.4 Degradation and mitigation strategies ......................................................................... 13
2.4.1 Pt degradation ................................................................................................................... 13
2.4.1.1 Pt dissolution and loss of ECSA ........................................................................ 13
2.4.1.2 Mitigation of Pt dissolution ................................................................................. 15
2.4.2 Carbon corrosion ............................................................................................................. 15
2.4.2.1 Kinetics of carbon corrosion .............................................................................. 15
2.4.2.2 Mechanism of carbon corrosion ......................................................................... 17
2.4.2.3 Effect of carbon corrosion on the cathode performance .............................. 18
2.4.2.4 Mitigation strategies .............................................................................................. 19
2.4.2.4.1 Alternative electrode materials ............................................................. 19
2.4.2.4.2 System strategies ..................................................................................... 20
2.4.3 Membrane and electrode ionomer durability .............................................................. 21
2.4.3.1 Membrane degradation .......................................................................................... 21
2.4.3.2 Ionomer degradation ............................................................................................. 22
2.4.4 GDL degradation ............................................................................................................. 23
2.4.5 Stainless steel bi-polar plate degradation...................................................................... 24
3 Scope of the thesis .................................................................................................................... 25
4 Experimental .............................................................................................................................. 26
4.1 Support materials ................................................................................................................... 26
4.2 Pre-treatment of alternative support ............................................................................... 26
4.2.1 Oxidative treatment ......................................................................................................... 27
4.2.2 Polyaniline treatment ....................................................................................................... 27
4.3 Catalyst synthesis .................................................................................................................. 27
4.4 MEA preparation ................................................................................................................... 28
4.4.1 Membrane pre-treatment ................................................................................................ 28
4.4.2 Ink preparation ................................................................................................................. 28
4.4.3 Catalyst coated membranes (CCMs) ............................................................................. 28
4.5 Fuel cell hardware ................................................................................................................. 29
4.6 In-situ electrochemical characterization methods ..................................................... 29
4.6.1 Cyclic voltammetry and CO-stripping .......................................................................... 29
4.6.2 Linear sweep voltammetry.............................................................................................. 30
4.6.3 Electrochemical impedance spectroscopy (EIS) in N2 .............................................. 31
4.6.4 Symmetric H2/H2 cell ..................................................................................................... 32
4.6.5 Polarization curves and EIS ........................................................................................... 32
4.6.6 Ex-situ and in-situ contact resistance ........................................................................... 33
4.7 Accelerated degradation tests (ADTs) for carbon corrosion ................................... 34
4.7.1 Potentiostatic hold ........................................................................................................... 34
4.7.2 Potential cycling ............................................................................................................... 34
4.7.3 Simulated start-ups and shut-downs ............................................................................. 35
5 Results .......................................................................................................................................... 37
5.1 Effect of operating conditions on the ECSA ............................................................... 37
5.2 Effect of RH on the performance of PSUgPVPA ionomer ..................................... 39
5.3 Potentiostatic holds as ADT for carbon corrosion ..................................................... 41
5.4 Screening for more durable carbons ............................................................................... 44
5.5 The electrochemical response of a corroded cathode ............................................... 50
5.6 Performance of polyhedral carbon nanofoams ........................................................... 55
5.7 System strategies for shut-down operation .................................................................. 58
5.8 In-situ contact resistance of bi-polar plates ................................................................ 62
6 Conclusions and outlook ........................................................................................................ 65
6.1 Conclusions ............................................................................................................................ 65
6.1.1 Effect of RH on ECSA ................................................................................................... 65
6.1.2 Accelerated degradation tests ......................................................................................... 66
6.1.3 Electrochemical response of a corroded cathode ...................................................... 66
6.1.4 Alternative carbons .......................................................................................................... 67
6.1.5 Shut-down strategies........................................................................................................ 69
6.1.6 GDL and BPP degradation related to SU/SD ........................................................... 69
6.2 Outlook for future work ..................................................................................................... 70
Acknowledgments ............................................................................................................................ 71
References ........................................................................................................................................... 72
1
Chapter 1
Introduction, research context and
outline
1.1 Introduction The proton exchange membrane fuel cell (PEMFC) or polymer electrolyte fuel cell (PEFC)
is one of several fuel cell technologies that enable the conversion of the chemical energy
within an energy carrier, e.g. hydrogen, methanol, ethanol or even glucose, into electricity.
The theoretical efficiency of this conversion is higher than for an internal combustion
process, which is subjected to the Carnot efficiency limit. On the other hand, many of these
energy carriers have to be produced, stored and transported. These facts, in combination
with efficiency losses due to the need for powering additional components of the fuel cell
system, may considerably decrease the total efficiency of the actual application. The use of
fuel cells may on the other hand provide the opportunity for generating power in an oil-
independent and environmentally friendly manner, with little or zero emissions and
pollutants, as long as the energy carrier is being produced from renewable resources, e. g
sun, wind or biomass. Because the same may be argued for other electrochemical devices,
such as batteries, the debate of fuel cell vs. batteries is often encountered. Without having a
long discussion about this subject, it is important to emphasize that both technologies have
their advantages and disadvantages depending on the specific application. Sometimes these
two electrochemical devices may even be working together as part of a hybrid system. There
is no doubt that in the future, all existing, as well as not yet discovered, environmentally
friendly technologies will be needed in order to meet the Nordic countries’ ambitious
emission targets [1].
The PEMFC was introduced in the 1960’s by the NASA space program.
However, lack of performance, high cost, insufficient lifetime, as well as issues concerning
hydrogen production and storage, have hindered the large scale commercialization of this
device. In the last few of decades a great deal of work has been carried out to improve the
performance of the catalyst layers, membrane materials and other components, e.g. gas
diffusion layers (GDL), bi-polar plates (BPP), as well as the balance-of-plant equipment.
Remarkably, these improvements have been accompanied by simultaneous reduction in cost
and increased durability, presently bringing many PEMFC systems out of the laboratories
2
and into the market [2]. Despite all these achievements, further improvements related to
cost and durability are still necessary for PEMFCs to have a more important role in the
power-generating market and especially for automotive applications. In order to compete
with internal combustion engines (ICE) vehicles, the cost and durability of the PEMFC have
to be comparable to the ICE. This includes that PEMFC must endure hundreds of
thousands of load cycles and several tens of thousands start-ups and shut-downs (SUs/SDs)
during the lifetime of the device. The present thesis, although it comprises the results from a
variety of studies and from different fuel cell components, has special focus on issues
concerning lifetime and durability. In particular, the serious degradation that may affect the
fuel cell electrodes during SU/SD operation.
1.2 Research context The main part of this thesis summarizes the work carried out within the Nanoduramea
research project [3]. This Nordic project started in 2008 and included partners from Finland
(VTT and Aalto), from Norway (NTNU and SINTEF), as well as partners from Denmark
(SDU) and was financed by The Northern European Innovative Energy Research
Programme (N-INNER). The general objective of the project was to synthesize and test the
durability of carbon nanotubes and carbon nanofibers as support for Pt-based cathodes in
PEMFCs. My role was to develop accelerated degradation tests (ADTs) and in-situ
characterization methods to determine the viability of these alternative materials as support
for the Pt catalyst. Furthermore, synthesis and testing of polyhedral carbon nanofoams-
based cathodes was carried out in collaboration with the Division of Inorganic Chemistry at
KTH. This project was also aimed at finding a catalyst support with better performance and
higher durability.
In parallel to the above work, a cooperation with the Swedish company
PowerCell, which develops PEMFC-based auxiliary power units (APUs), resulted in a
project aimed at evaluating different system strategies to increase the lifetime of the
electrodes during SU/SD.
Another project carried out outside Nanoduramea, in collaboration with the
Department of Chemistry, Polymer and Materials Chemistry at Lund University aimed at
finding new and more durable proton-conductive polymer materials. My contribution was to
test the initial performance of phosphonated hydrocarbons as ionomer in the cathode of a
PEMFC.
Further cooperation with the company PowerCell resulted in a project
aimed at developing an in-situ technique to evaluate the performance of metallic bi-polar
plates (BPPs). Although this work was not specifically related to the catalyst layer or
SUs/SDs, it is suggested that this in-situ technique has the potential to be very useful in
studies related to fuel starvation using metallic bi-polar plates. Furthermore, this technique
3
was highly appreciated by the Swedish steel company Sandvik AB and was used to study
coated stainless steel BPPs.
1.3 Thesis outline Chapter 2 The first part of this chapter provides a very general description of the PEMFC
and the most commonly used components. This part also gives a description of the main
irreversible losses present in PEMFCs. For readers having basic knowledge in the field of
fuel cells and electrochemistry, these sections are not a necessity.
The second part of this chapter gives an overview of the most important
degradation mechanisms affecting PEMFCs, with a special emphasis on the degradation that
is or may be present during SUs/SDs. The aim is to give an in-depth look of the degradation
mechanism of carbon corrosion, including its effect on the fuel cell performance and
possible mitigation strategies. However, for experts in PEMFC degradation issues, this
section is not essential in order to comprehend the rest of the thesis.
Chapter 3 contains the scope of the thesis.
Chapter 4 covers the experimental part of this thesis. It explains the catalyst
synthesis methods used in paper III and paper V and describes the electrochemical
characterization methods that were used. It further gives a description of the accelerated
degradation tests (ADT) for carbon corrosion implemented in papers I, III-VI.
Chapter 5 contains the results from several of the papers referred to in this
thesis including: i) the effect of operating conditions on the electrochemically active surface
area (ECSA) (paper I), ii) the performance of a phosphonated hydrocarbon ionomer as the
proton-conducting phase in the cathode catalyst layer at different relative humidity (RH)
(paper II), iii) the search for a proper accelerated degradation test (ADT) for carbon
corrosion (paper I), iv) screening for durable supports, in particular the comparison between
conventional carbon-based supports and graphitized carbon fibers (paper III), v) the effect
of carbon corrosion on the performance of a commercial PEMFC cathodes (paper IV), vi)
the evaluation polyhedral carbon nanofoam (PNF-C) as catalyst support (paper V), vii) the
comparison of different system strategies for the mitigation of carbon corrosion during
shut-down (paper VI) and viii) the results from paper VII, in which it is discussed how
operating conditions, including time, may affect the contact resistance of metallic BPPs at
the cathode of a PEMFC.
Chapter 6 contains some of the most important conclusions and outlook for
future work.
4
Chapter 2
Components, irreversible losses and
degradation
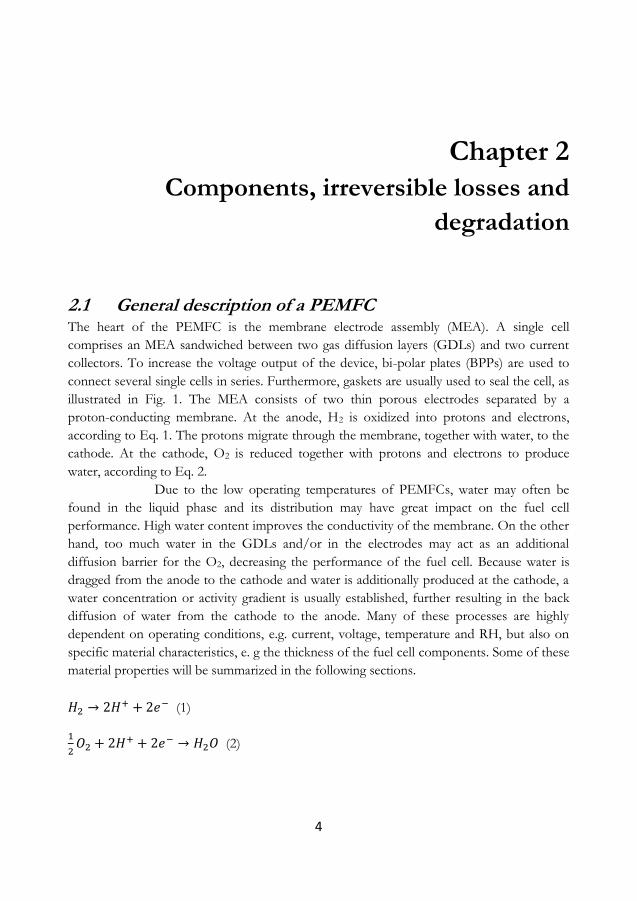
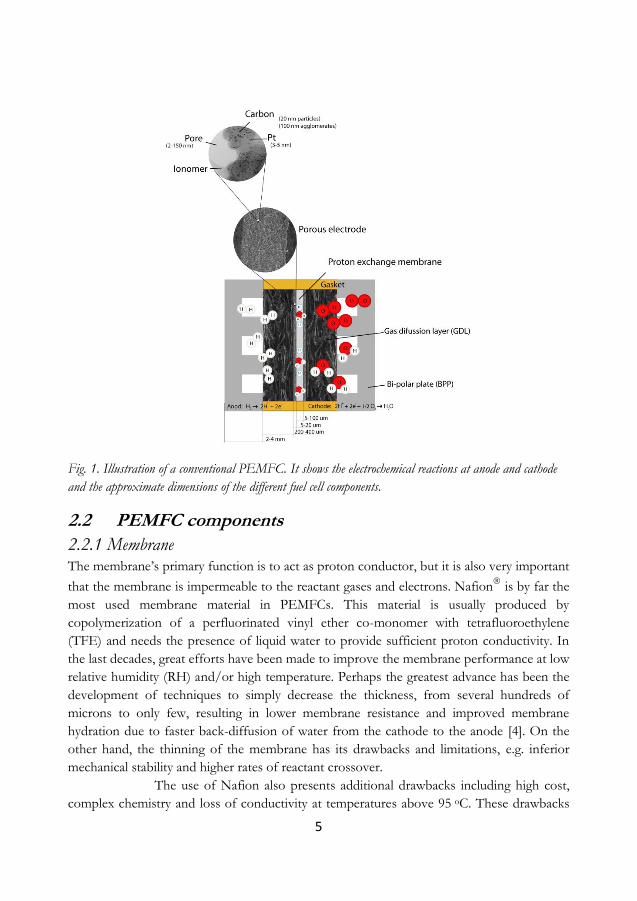
2.1 General description of a PEMFC The heart of the PEMFC is the membrane electrode assembly (MEA). A single cell
comprises an MEA sandwiched between two gas diffusion layers (GDLs) and two current
collectors. To increase the voltage output of the device, bi-polar plates (BPPs) are used to
connect several single cells in series. Furthermore, gaskets are usually used to seal the cell, as
illustrated in Fig. 1. The MEA consists of two thin porous electrodes separated by a
proton-conducting membrane. At the anode, H2 is oxidized into protons and electrons,
according to Eq. 1. The protons migrate through the membrane, together with water, to the
cathode. At the cathode, O2 is reduced together with protons and electrons to produce
water, according to Eq. 2.
Due to the low operating temperatures of PEMFCs, water may often be
found in the liquid phase and its distribution may have great impact on the fuel cell
performance. High water content improves the conductivity of the membrane. On the other
hand, too much water in the GDLs and/or in the electrodes may act as an additional
diffusion barrier for the O2, decreasing the performance of the fuel cell. Because water is
dragged from the anode to the cathode and water is additionally produced at the cathode, a
water concentration or activity gradient is usually established, further resulting in the back
diffusion of water from the cathode to the anode. Many of these processes are highly
dependent on operating conditions, e.g. current, voltage, temperature and RH, but also on
specific material characteristics, e. g the thickness of the fuel cell components. Some of these
material properties will be summarized in the following sections.
(1)
(2)
5
Fig. 1. Illustration of a conventional PEMFC. It shows the electrochemical reactions at anode and cathode
and the approximate dimensions of the different fuel cell components.
2.2 PEMFC components
2.2.1 Membrane The membrane’s primary function is to act as proton conductor, but it is also very important
that the membrane is impermeable to the reactant gases and electrons. Nafion
is by far the
most used membrane material in PEMFCs. This material is usually produced by
copolymerization of a perfluorinated vinyl ether co-monomer with tetrafluoroethylene
(TFE) and needs the presence of liquid water to provide sufficient proton conductivity. In
the last decades, great efforts have been made to improve the membrane performance at low
relative humidity (RH) and/or high temperature. Perhaps the greatest advance has been the
development of techniques to simply decrease the thickness, from several hundreds of
microns to only few, resulting in lower membrane resistance and improved membrane
hydration due to faster back-diffusion of water from the cathode to the anode [4]. On the
other hand, the thinning of the membrane has its drawbacks and limitations, e.g. inferior
mechanical stability and higher rates of reactant crossover.
The use of Nafion also presents additional drawbacks including high cost,
complex chemistry and loss of conductivity at temperatures above 95 oC. These drawbacks
6
have forced the development of dimensionally stable PEMs, such as cross-linked electrolyte
membranes [5], non-fluorinated membranes [6] and composite membranes using nanofibers
[7], nanooxides [8] and different kinds of porous substrates. Some of the most important
performance and technical targets include low resistance at low RH (<20 mΩ cm2), low
hydrogen cross-over (< 2 mA cm-2) and low cost (<20 $ m-2) [9]. The company 3M is
currently developing high-temperature PEMs that are very close to these targets [10]. They
have introduced multiple acid groups per side chain, with the incorporation of a superacid
bis sulfonyl imide group within the side chain, allowing the conductivity to remain high even
under dry conditions.
2.2.2 The catalyst layer The catalyst layers or electrodes are the main topic of this thesis. These components may
generally be described as porous structures containing a catalyst with high activity for the
hydrogen oxidation reaction (HOR) at the anode (see Eq. 1) and for the oxygen reduction
reaction (ORR) at the cathode (see Eq. 2). The catalyst can be divided in precious catalysts
(based on Pt or Pt alloys) and non-precious catalysts (usually metal/nitrogen/carbon-based
[11]). The catalyst can either be supported on different substrates, such as C [12], Ti-based
[13], SnO2 [14], SiO2 [15], W-based [16] and crystalline organic whiskers [17] or be un-
supported [18].
The present thesis will especially focus on conventional Pt-based catalyst
supported on high surface area carbon blacks (Pt/C), by far the most used type of catalyst in
current fuel cell applications. As illustrated in Fig. 1, typical electrodes consist of nanometer-
sized Pt particles (3-5 nm), supported on high surface area carbons, usually carbon blacks.
The size of the carbon particles may vary between 20 and 30 nm and they are generally
described as having a decreasing graphitic nature toward the particle center [19]. These
particles also have a tendency to self-aggregate into agglomerates with a size in the range of
50-100 nm in diameter. The resulting electrodes are usually between 5 and 20 µm thick
(depending on the Pt loading), comprising a large amount of meso-and macro-pores (5-100
nm), which are self-assembled during the electrode fabrication process. Appropriate
electrode porosity is believed to be crucial for the diffusion of gases and transport of water.
However, since gas, electrons and protons need to have simultaneous access to each
particular reaction site on the surface of the catalyst, an ionic-conductive polymer, also called
ionomer, has to be included during the electrode fabrication. The ionomer content in the
electrode needs to be optimized. Insufficient amount of ionomer may result in low catalyst
utilization and high ionic resistance, especially when operating the fuel cell under dry
conditions [20]. On the other hand, an excess of ionomer may decrease the porosity of the
electrode limiting the transport of reactants and products in and out of the catalyst layer
[21].
7
A few groups have studied the Nafion ionomer interaction with the Pt/C
catalyst [22-27]. Uribe et al. [22], as well as Chlistunoff et al. [23,24] proposed that the
Nafion ionomer may undergo re-structuring depending on the nature of the contacting
surface. When Nafion is in contact with bare Pt, the hydrophilic part of the polymer is
pushed away from the surface. On the other hand, when the polymer is in contact with PtO,
the hydrophobic part is instead pushed away from the surface. These processes were further
suggested to be strongly affected by the level of hydration of the polymer, i.e. the RH. Ma et
al. [25] studied the adsorption of Nafion using 19F Nuclear Magnetic Resonance
Spectroscopy (NMR). They concluded that the adsorption equilibrium constant also
depends on the contacting surface, where the interaction between carbon and Nafion was
stronger than the interaction between Pt and Nafion, suggesting that the adsorption is
achieved via hydrophilic bonding. Finally, Wood et al. [26] used Neutron Reflectometry to
confirm the findings of Uribe et al. and Chlistunoff et al. They further showed that the
nature of the contacting surface also affects the long-range structural properties of Nafion.
This has also been observed by Modestino et al. [27], who stated that when ionomer films
are in contact with hydrophilic surfaces, they re-structure favoring water sorption and
swelling.
State-of-the-art PEMFCs Pt/C electrodes currently use Pt loadings of
around 0.4 mgPt cm-2 on the cathode and 0.3 mgPt cm-2 on the anode. However, there is a
great need for reducing the Pt loading in order to reduce the cost of the stack. At the same
time this is a great challenge, since reduction of the Pt loading of the cathode usually has a
negative impact on the performance of the fuel cell. The total surface area (m2Pt) of Pt in the
electrode decreases with decreasing Pt loadings. As reported by Gasteiger et al. [28], this will
have a considerable effect on the activity of the fuel cell according to Eq. 3:
[ ] (3)
where [Pt] is the Pt loading of the cathode and b is the Tafel slope. This equation implies
that the change in cell voltage with the logarithm of the Pt loading is proportional to b and
that a loading reduction by a factor two would at least imply a 20 mV decrease in voltage
over the entire polarization curve (with b approximately 70 mV decade-1). Additionally,
electrodes having low Pt loadings (<0.2 mg cm2) have been shown to have a negative effect
on the mass-transport losses (see section 2.3).
Table 1 shows the performance targets for PEMFC electrodes, where a total
Pt loading of 0.125 mgPt cm-2 is suggested. This loading implies that the total amount of Pt
needed for a fuel cell vehicle would be 8 g, which is similar to what internal combustion
engines vehicles have today.
8
Table 1. Catalyst layer performance target according to the U.S. Department of Energy (DOE) [9].
Targets
2017 2020
Platinum group metal total content (both electrodes) g kW-1 (rated) 0.125 0.125
Platinum group metal total content (both electrodes) mg cm-2 0.125 0.125
Mass activity A mgPt-1 @ 900 mV iR-free 0.44 0.44
Non-Pt catalyst activity per volume of supported catalyst A cm-3 @ 800 mV iR-free 300 300
The company 3M is currently developing catalysts that are approaching these targets. The
so-called nanostructured thin films (NSTFs) [17] are showing very promising results in terms
of performance, durability and cost. Physical vapor deposition (PVD) is used to coat Pt or
Pt-alloy onto a thin monolayer of oriented organic whiskers (1 m tall). The result is a
compact and continuous polycrystalline film of catalyst. The NSTFs are about 10-20 times
thinner than conventional Pt/C electrodes and do not have the need of incorporating
ionomer. Furthermore, these electrodes show much better performance at low Pt loadings
(0.15 mgPt cm-2 total in MEA) than conventional Pt/C catalysts, despite of having lower
ECSAs [29].
2.2.3 Gas diffusion layers Gas diffusion layers (GDLs) usually consist of a substrate of porous carbon fibers, e.g.
carbon paper (non-woven) or carbon cloth (woven) with a thickness between 200-400 m
and another thinner layer called the microporous layer (MPL) (approximately 100 m). In
addition, a hydrophobic agent e.g. polytetrafluoroethylene (PTFE) is added. The GDLs
distribute the reactant gases over the electrodes and they also conduct electricity and heat
between the electrodes and BPPs. Perhaps even more important, GDLs play an important
role in the water management of the fuel cell [30,31]. The main challenge for this fuel cell
component may have more technical character, i.e. the lack of high-volume production
which makes the GDL costs a considerable portion of the total cost of the fuel cell stack.
Current DOE cost estimates are based on the non-woven dual MPL by the company Ballard
Power Systems at $ 4.45 m-2 (high volume production 500.000 stacks per year) [32].
2.2.4 Bi-polar plates (BPP) The operating voltage of a single PEMFC is between 0.6-0.8 V. Thus, several fuel cells are
needed to be connected in series in order to increase the output voltage to that required by
some particular application. BPPs are used to distribute and separate the reactant gases
between each cell. BPPs also assist in the water management, and the transport of heat, as
well as functioning as current collectors and mechanical support. Presently, metallic BPPs
have emerged as the main candidate for PEMFC application [33]. These materials provide
the opportunity for mass producing very thin BPPs, increasing the volumetric power density
9
of the fuel cell stack, as well as lowering manufacturing costs. The main challenges with
metallic BPP are: i) contact resistance and ii) possible corrosion.
2.3 Irreversible losses In order to have a proper discussion about PEMFC degradation, it is essential to understand
the different sources of irreversible losses and their effect on the fuel cell performance.
In PEMFC, hydrogen, either pure or from reformate, is used as fuel at the
anode and pure oxygen or air as oxidant at the cathode, reacting according to Eqs. 1 and 2.
Therefore, the total reaction can be written as:
(4)
The Nernst equation (Eq. 5) gives the reversible open circuit potential of a PEMFC at a
specific temperature (T) and partial pressure of the reactants (Pi).
(
) (5)
where Eoeq is the standard potential, according to:
(6)
and go is the Gibbs free energy of Eq. 4. When a PEM fuel cell is assembled it is found that
the potential is less than the theoretical potential (Eeq), especially when current is started to
be drawn. A common approach to describe the output voltage of a PEMFC is given by Eq.
7. [34], where several types of irreversible losses () are contributing to the lowering of the
cell voltage.
| | (7)
The so called crossover losses (cross) are generated from fuel and oxidant crossing the
membrane and may have a large impact on the open circuit voltage of the cell. It is especially
important to consider when determining the activity of the fuel cell at low current densities.
The crossover current density (ix) of H2 may be quantified using linear sweep voltammetry
(LSV), usually having a magnitude in the order of 1-10 mA cm-2 depending on the type, and
the thickness MEA, as well as on the operating conditions. The ix may be used to correct the
measured current density (i), according to:
(8)
10
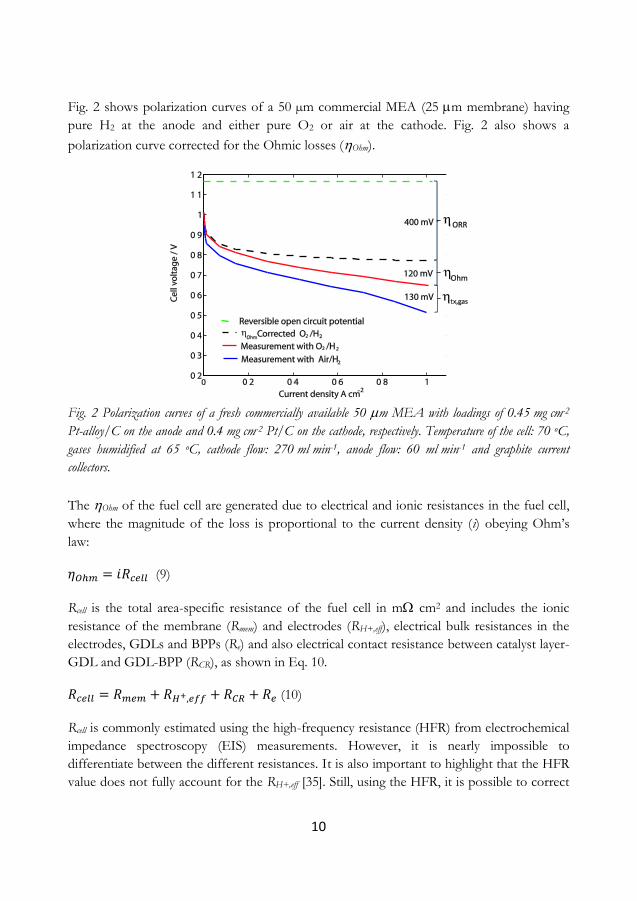
Fig. 2 shows polarization curves of a 50 µm commercial MEA (25 m membrane) having
pure H2 at the anode and either pure O2 or air at the cathode. Fig. 2 also shows a
polarization curve corrected for the Ohmic losses (Ohm).
Fig. 2 Polarization curves of a fresh commercially available 50 m MEA with loadings of 0.45 mg cm-2
Pt-alloy/C on the anode and 0.4 mg cm-2 Pt/C on the cathode, respectively. Temperature of the cell: 70 oC,
gases humidified at 65 oC, cathode flow: 270 ml min-1, anode flow: 60 ml min-1 and graphite current
collectors.
The Ohm of the fuel cell are generated due to electrical and ionic resistances in the fuel cell,
where the magnitude of the loss is proportional to the current density (i) obeying Ohm’s
law:
(9)
Rcell is the total area-specific resistance of the fuel cell in m cm2 and includes the ionic
resistance of the membrane (Rmem) and electrodes (RH+,eff), electrical bulk resistances in the
electrodes, GDLs and BPPs (Re) and also electrical contact resistance between catalyst layer-
GDL and GDL-BPP (RCR), as shown in Eq. 10.
(10)
Rcell is commonly estimated using the high-frequency resistance (HFR) from electrochemical
impedance spectroscopy (EIS) measurements. However, it is nearly impossible to
differentiate between the different resistances. It is also important to highlight that the HFR
value does not fully account for the RH+,eff [35]. Still, using the HFR, it is possible to correct

11
the measured cell voltage, obtaining the iR-corrected cell voltage (EiR-free) according to Eq.
11.
| | (11)
Anode activation losses (HOR) and cathode activation losses (ORR) are caused by slow
reaction kinetics. However, it has been shown that the losses at the cathode due to the ORR
are several orders of magnitude larger than the activation losses of the anode (HOR). Thus,
HOR in Eq. 11 is usually neglected for pristine PEMFCs. Furthermore, polarization curves
obtained using pure gases, i.e. O2 and H2 at the cathode and anode, respectively, can be
considered as having negligible mass-transport losses. Thus, ORR may be estimated using
Eq. 12.
(12)
Furthermore, the ORR for Pt/C electrodes is usually proportional to the Tafel equation (Eq.
13):
(13)
The Tafel slope b can more easily be depicted when plotting EiR-free vs. log (iix-free) at low
current densities (or at voltages above 0.8 V), also called a Tafel plot. Fig. 2 further shows
that ORR can be as large as 400 mV for a fresh commercial Pt/C cathode, which is a
significant portion of the generated voltage. It is outside the scope of this thesis to have an
extensive discussion about the ORR kinetics, reaction mechanisms and rate-determining
steps in order to explain the origin of ORR. However, an often encountered expression
describing the current density of the ORR, is a form of the Butler-Volmer equation,
assuming the first electron transfer to be rate determining [36,37]:
(
) (
) (14)
One of the important parameters of this equation is the surface coverage by adsorbed
spectator species (Θad). In order to minimize the ORR it is very important to maximize the
number of available catalytic sites (1- Θad).
At even higher current densities, the voltage/current curve starts to bend
slightly (see the measurement with air/H2 at high current densities in Fig. 2). Mass-transport
losses (tx,gas) are generated due to the reactants being consumed at a faster rate than it takes
for them to reach the catalyst surface. The tx,gas are sometimes estimated by comparing the
cell voltage using either O2 or air, also commonly called O2-gain.
12
(15)
This is of course not a true measure of the tx,gas, i.e. the difference in voltage will also
include the difference in voltage as predicted from the Nernst equation (Eq. 5).
Furthermore, the voltage difference at a given current density may also include kinetic
contributions, as the Tafel slope has a tendency to change below 0.8 V. Although other
methods to estimate tx,gas are perhaps more accurate [34,38], O2-gain has widely been used
to compare the transport properties between different GDLs, as well as between different
catalyst layers [39,40].
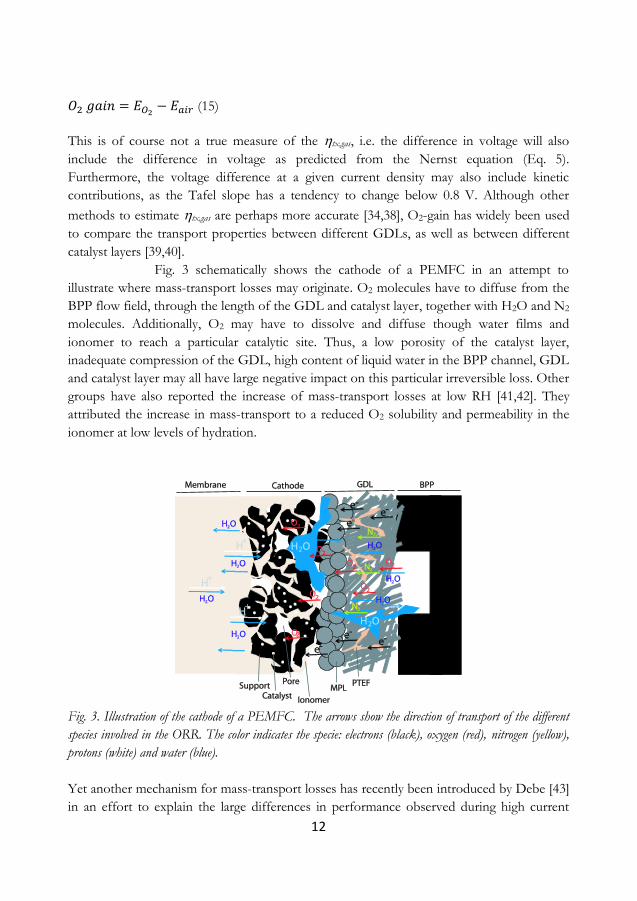
Fig. 3 schematically shows the cathode of a PEMFC in an attempt to
illustrate where mass-transport losses may originate. O2 molecules have to diffuse from the
BPP flow field, through the length of the GDL and catalyst layer, together with H2O and N2
molecules. Additionally, O2 may have to dissolve and diffuse though water films and
ionomer to reach a particular catalytic site. Thus, a low porosity of the catalyst layer,
inadequate compression of the GDL, high content of liquid water in the BPP channel, GDL
and catalyst layer may all have large negative impact on this particular irreversible loss. Other
groups have also reported the increase of mass-transport losses at low RH [41,42]. They
attributed the increase in mass-transport to a reduced O2 solubility and permeability in the
ionomer at low levels of hydration.
Fig. 3. Illustration of the cathode of a PEMFC. The arrows show the direction of transport of the different
species involved in the ORR. The color indicates the specie: electrons (black), oxygen (red), nitrogen (yellow),
protons (white) and water (blue).
Yet another mechanism for mass-transport losses has recently been introduced by Debe [43]
in an effort to explain the large differences in performance observed during high current
13
density operation between low Pt-loaded Pt/C and NSTF air cathodes. Debe proposed a
collision frequency pre-exponential scaling factor f(,s) in the Butler-Volmer equation (Eq.
14), accounting for O2 molecules probably undergoing repetitive physisorption, desorption
and re-adsorption before successfully chemisorbing on the surface of the catalyst. It is
suggested that a successful event therefore depends on the gas phase molecular velocity in
the Knudsen regime over distances of one mean free path length () above the catalyst
surface [43]. In addition, the probability of reaction also depends on a spatial distribution
function of the active surface area (s) (in cm2Pt cm-3). The implications of such a model are
that catalyst layers having their entire active surface area compacted to a narrow space
increase the molecule/surface collision rate, therefore also increasing the probability for O2
chemisorption and reduction.
2.4 Degradation and mitigation strategies In the context of transport or portable applications, the fuel cell must endure a considerable
amount of load cycles and start-ups and shut-downs (SUs/SDs) during the lifetime of the
device. In general, these transient conditions are always more detrimental to the fuel cell
compared to steady-state continuous operation.
An estimation of the number of SUs/SDs that a fuel cell for vehicle
application has to experience during its lifetime can easily be carried out assuming at least a
10 year lifetime. During this period the fuel cell will probably undergo between 2 and 3
SUs/SDs per day, resulting in a total of 15000-20000 SUs/SDs and implying the same
number of temperature, RH and voltage/current cycles.
According to the DOE targets [44], the voltage loss related to this number
of SUs/SDs should not exceed than 30 mV (at rated power), which implies a degradation
rate smaller than 2 µV cycle-1. In the following sections an overview of the degradation
mechanisms that are or could be present during SUs/SDs of fuel cells will be given.
Additionally, an effort is made to review or to propose mitigation strategies that may
alleviate these problems.
2.4.1 Pt degradation
2.4.1.1 Pt dissolution and loss of ECSA
As discussed above, the current that can be drawn from a fuel cell is in many ways directly
related to the number of available sites on the catalyst for the O2 molecules to adsorb and
react to form water. The relationship between ECSA and output voltage is said to follow a
similar dependence as Eq. 3 in section 2.2.2 [45]. The relationship implies that a 50 %
reduction of the ECSA would correspond to at least a 20 mV decrease in voltage over the
entire polarization curve. Thus, one of the most concerning issues affecting PEMFC
durability, is the loss of electrochemically active surface area (ECSA).

14
Several mechanisms for ECSA loss have been identified: i) crystal migration
of atoms and clusters on the surface of the support [46], ii) dissolution of small clusters and
ions, which later may redeposit on larger clusters or diffuse into the ionomer and
subsequently precipitate in the ionomer or membrane via reduction from H2 crossover
(modified Ostwald ripening) [47] and iii) detachment of Pt particles due to carbon corrosion
[48-50]. For many years, there was a long-lasting debate about which is the primary
mechanism for loss of ECSA during normal fuel cell operation. However, it is now well
established that the mechanism for loss of ECSA depends on the operating conditions, in
particular the voltage of the fuel cell.
Wilson et al. [46] investigated the average Pt particle size and distribution
using transmission electron microscopy (TEM) of MEAs operated at constant voltage
(0.5 V) for almost 4000 h. They found that the Pt particle size distribution was asymptotic,
with a tail at large particle size and suggested that the decrease in ECSA was consistent with
mechanism i). On the contrary, during SU/SD the voltage of the fuel cell will inevitably
experience transient conditions. Thus, Pt degradation according to mechanism i) may be
considered as negligible.
Ferreira et al. [47] studied the potential dependence of Pt degradation. They
observed that Pt degradation was higher close to open circuit voltage (0.95 V) than under
load (0.75 V). Furthermore, an accelerated ECSA loss was observed following cycling of the
potential of the fuel cell between 1.0 and 0.6 V for 10.000 cycles. TEM analysis showed that
the loss of ECSA (from 63 to 23 m2 g-1) was due to the increase in Pt particle size. This in
turn occurred via two different processes: Ostwald ripening at the nanometer scale, and
migration of soluble oxidized Pt species on the micrometer scale, and chemical precipitation
in the ionomer phase, according to mechanism ii). Darling and Meyers [51,52] further
developed models for Pt dissolution of PEMFCs cathode. They considered dissolution of Pt
metal, oxidation of metallic Pt and chemical dissolution of the surface oxide. The model
predicts that Pt oxidation is limited and therefore relatively stable at low potentials. At high
potentials (>1.2 V) the Pt is protected from dissolution by surface oxides. However, at
intermediate potentials (0.6-1.1 V) the partial surface oxide coverage may facilitate the rapid
dissolution of Pt. As mentioned earlier, potential cycling is unavoidable during a SUs/SDs;
thus, Pt degradation mechanism ii) should always be considered during SU/SD operation.
Yet another form of Pt degradation is believed to occur at very high
potentials (>1.2 V), even though Pt is protected by oxides. At these potentials carbon-based
supports become unstable, oxidizing and corroding. The corrosion may cause Pt particles to
aggregate or even cause entire Pt/C segments to become electronically isolated from the rest
of the electrode [50]. This degradation mechanism is believed to be one of the most
important degradation mechanisms affecting the ECSA during SUs/SDs. As it will be
discussed in section 2.4.2, electrode potentials >1.2 V are unfortunately often encountered
during SU/SD.
15
2.4.1.2 Mitigation of Pt dissolution
Voltage cycling clearly affects Pt dissolution to a higher extent than steady state operation.
Unfortunately, voltage cycling is difficult to avoid in real applications, in particular in
automotive applications. From a system point of view it is suggested that the loss of ECSA
caused by voltage cycling could be reduced by using the fuel cell stack in combination with a
super capacitor or a battery. In such a configuration, the fuel cell could operate at more
constant voltages, thus decreasing the impact of potential or load transients [53]. Another
strategy for decreasing Pt degradation has been suggested by Mathias et al. [54]. They
showed that the loss of ECSA could be minimized when the fuel cell was operated at lower
RH and temperatures.
From a materials perspective, there is a vast amount of literature reporting
alterative catalysts and combined catalyst/supports with enhanced catalyst durability
compared to conventional Pt/C electrodes [48,55]. In general, Pt-alloys, e.g. PtCo, have
been reported to show higher stability than Pt/C upon potential cycling [34,56]. However,
dissolution of the alloy component has also been reported [57]. Antolini et al. [58] have
reviewed Pt-alloy stability and concluded that the stability of the Pt-alloy catalyst may
depend on the synthesis method, alloying degree and catalyst particle size. The particle size
or grain size of the catalyst has a large effect on the degradation rate of the ECSA. Smaller
catalyst particles are generally more unstable. This is one of the explanations given by Debe
et al. [59] to explain the much improved stability of extended Pt-films, e.g. NSTFs,
compared to conventional Pt/C electrodes.
2.4.2 Carbon corrosion
2.4.2.1 Kinetics of carbon corrosion
Carbon blacks, e. g Vulcan XC-72, Ketjen black, Pearl 200 and others, are still widely being
used as catalyst supports in PEMFCs due to their good performance, low cost and high
availability. These carbons are obtained from the pyrolysis of different hydrocarbons, which
results in almost spherical carbon particles with a diameter less than 30 nm, providing a large
surface area (~240-1500 m2g-1) for the dispersion of the Pt catalyst. It has been suggested
that at potentials higher than 0.2 V vs. RHE, the support is able to thermodynamically
oxidize to carbon dioxide (CO2) and carbon monoxide (CO), according to Eqs. 16 and
17[60].
Eo=0.207 V vs. RHE (16)
Eo=0.518 V vs. RHE (17)
At these low potentials, or even at potentials that are normally found during fuel cell
operation (0.6-0.9 V vs. RHE), the kinetics of these corrosion reactions is still quite slow. In
16
practice, elevated potentials, greater than 1.2 V vs. RHE, are required to corrode the carbon
at sufficiently high reaction rates [61]. R. Makharia et al. [45] carried out a detailed study on
the effect of temperature, potential and time, on the CO2 corrosion currents of Pt/C
electrodes. Measured carbon weight loss from the MEAs, using potential holds of 0.9, 0.95,
1.05, 1.2 and 1.3 V, showed that carbon corrosion rates may increase by approximately one
order of magnitude with every 0.1 V increase above 0.9 V. They also showed that the
corrosion kinetics can be described by the following empirical equation:
(18)
Where b is the Tafel slope, Ea is an activation energy and m a time-decay exponent. The
logarithm of the measured CO2 current has a tendency to decrease linearly with the
logarithm of time; the physical origin of this behavior has not yet fully been clarified [45].
However, it can be summarized that the corrosion of the support in conventional Pt/C
PEMFC electrodes is complex. Some of the factors influencing the carbon corrosion are:
i) The structure of the carbon particle, conventional carbon blacks, e.g. Vulcan,
have an amorphous core and a graphitic surface which could lead to different
corrosion kinetics as function of time [62].
ii) Carbon surface coverage by surface oxides, having the role of both
intermediates and protective passive layer [63], also changing with time.
iii) Changes in Pt oxide coverage or Pt surface in contact with the carbon; Pt has
been shown to catalyze carbon corrosion [64].
iv) The presence of water, which is directly involved in producing carbon surface
oxides, as well as their further oxidation to CO2 [65].
It has been well documented that the surface area or Brunauer-Emmet-Teller (BET) surface
area of the support has a large impact on carbon corrosion rates, e.g. low surface area
carbons corrodes less than high surface area carbons [66,67]. Ball et al. [66] showed that the
carbon weight loss increases almost linearly with increasing BET between 50-800 m2g-1.
Additionally, heat treatment or graphitization also has a positive effect on the carbon
corrosion resistance. Both Stevens et al. and Ball et al. showed that carbons with similar
BET, but with different degrees of graphitization also presented different degrees of
stability, with the graphitic carbons being much more durable. Yu et al. [68] have recently
shown that graphitic carbons do not follow the same time-dependent behavior as
conventional carbons, i.e. they display a constant carbon corrosion rate as function of time.
17
2.4.2.2 Mechanisms for carbon corrosion
There are four major unwanted operating conditions that may induce high enough electrode
potentials to increase the kinetics of carbon corrosion. These four mechanisms may in turn
be divided into two categories: i) gross fuel starvation and ii) localized fuel starvation.
Gross fuel starvation may happen if one or several cells in a fuel cell stack
completely lack sufficient H2 to produce the current that is being drawn. It has been shown
that the particular starved cell reverses, showing negative cell voltages [69]. What happens is
that in the absence of H2, the anode potential starts to increase so that the current is instead
provided by carbon corrosion and oxygen evolution at the anode, resulting in a higher anode
potential compared to the cathode.
Localized fuel starvation refers to the unwanted situation of simultaneously
having both H2 and O2 at the anode compartment of a fuel cell. There is a number of
undesired fuel cell operating modes during which this actually may happen. These
conditions may include: i) start-ups, i.e. H2 is introduced into an air-filled anode, ii)
prolonged shut-downs, when O2 eventually diffuses into the H2-filled anode via the anode
exhaust, the anode inlet when purging with air or through the membrane due to O2
crossover and iii) local fuel blockage, e.g. by water droplets during normal or dead-end
operation [70]; in these starved regions, O2 may cross over from the cathode side creating
local H2/O2 fronts.
In contrast to the gross fuel starvation mechanism, localized fuel starvation
is not easily monitored or detected by measuring individual cell voltages, even though the
electrode potential of the cathode may reach extremely high values. It is therefore
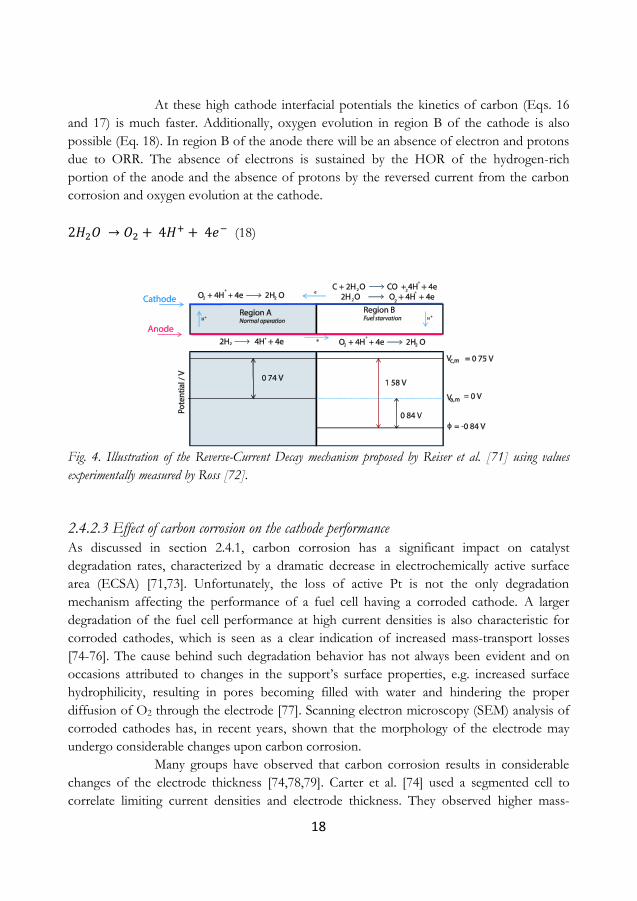
considered as a much more difficult problem to manage for fuel cells. Fig. 4 shows a
schematic illustration of the so-called Reverse-Current Decay mechanism proposed by Reiser et
al. [71], which explains localized fuel starvation. In short, when the fuel cell is first
assembled, both the anode and the cathode electrode potentials, Va,m and Vc,m are close to
the equilibrium potential of oxygen (VO21.0 V) with respect to the membrane potential ().
This results in a voltage difference between the two electrodes of approximately 0 V
(Vcell=Vc,m-Va,m). In the case where H2 and O2 coexist at the anode, the potential of the
hydrogen-rich portion of the anode (region A) will be close to the equilibrium potential of
hydrogen (VH2=0 V), raising Vcell close to 0.75 V in this region. However, the high
electronic conductivity in the electrode, GDL and BPP will maintain the same electrode
potential (Va,m) along the anode, forcing the in the oxygen-rich portion of the anode
(region B) to be lowered, resulting in an interfacial potential difference between membrane
and anode of Va,m-0.84 V in region B. At the cathode, the electrode potential (Vc,m) is also
maintained due to the high electron conductivity. However, because of the lower of in
region B the interfacial potential difference between membrane and cathode will be higher
than VO2, and as high as V c,m-1.58 V, according to the measurements of Dross et al. [72].
18
At these high cathode interfacial potentials the kinetics of carbon (Eqs. 16
and 17) is much faster. Additionally, oxygen evolution in region B of the cathode is also
possible (Eq. 18). In region B of the anode there will be an absence of electron and protons
due to ORR. The absence of electrons is sustained by the HOR of the hydrogen-rich
portion of the anode and the absence of protons by the reversed current from the carbon
corrosion and oxygen evolution at the cathode.
(18)
Fig. 4. Illustration of the Reverse-Current Decay mechanism proposed by Reiser et al. [71] using values
experimentally measured by Ross [72].
2.4.2.3 Effect of carbon corrosion on the cathode performance
As discussed in section 2.4.1, carbon corrosion has a significant impact on catalyst
degradation rates, characterized by a dramatic decrease in electrochemically active surface
area (ECSA) [71,73]. Unfortunately, the loss of active Pt is not the only degradation
mechanism affecting the performance of a fuel cell having a corroded cathode. A larger
degradation of the fuel cell performance at high current densities is also characteristic for
corroded cathodes, which is seen as a clear indication of increased mass-transport losses
[74-76]. The cause behind such degradation behavior has not always been evident and on
occasions attributed to changes in the support’s surface properties, e.g. increased surface
hydrophilicity, resulting in pores becoming filled with water and hindering the proper
diffusion of O2 through the electrode [77]. Scanning electron microscopy (SEM) analysis of
corroded cathodes has, in recent years, shown that the morphology of the electrode may
undergo considerable changes upon carbon corrosion.
Many groups have observed that carbon corrosion results in considerable
changes of the electrode thickness [74,78,79]. Carter et al. [74] used a segmented cell to
correlate limiting current densities and electrode thickness. They observed higher mass-
19
transport losses in areas where the electrode had experienced thinning. The same group [80]
later showed that carbon corrosion due to local H2 starvation took place in an inside-out
mode with the carbon agglomerate as the basic corrosion unit and that the corrosion
eventually results in the collapse of the electrode’s porous structure. Young et al. [76]
suggested that the collapse of the electrode structure inhibits the transport of both gas and
water into the catalyst layer, resulting in higher mass-transport losses and higher ohmic
losses. Additionally, polarization curves carried out at different RH, indicated that the
degradation of the performance was higher at saturated conditions, attributed to the
presences of liquid water causing flooding of the catalyst layer. A similar effect has earlier
been observed by our group, when studying corroded Pt/Vulcan electrodes [3]. However,
Fairweather et al. [81] have recently used neutron imaging to study the through-plane water
distribution of corroded cathodes in commercial MEAs. They did not observe flooding, on
the contrary, they observed a dramatic decrease in the ability of the MEA to retain water,
attributed to an increase in heat generation. They concluded that increased mass-transport
losses were due to the collapse of the porous electrode, instead of increased liquid water
blockage of O2.
2.4.2.4 Mitigation strategies for carbon corrosion
2.4.2.4.1 Alternative electrode materials
Although the present thesis focuses on the issue of local fuel starvation, in particular support
degradation due to SU/SDs, there is a common mitigation strategy that could be adopted
for all degradation mechanisms concerning carbon corrosion, i.e. more durable support
materials. These materials could be classified as: i) alternative carbon materials that are able
to better sustain corrosion, e.g. low surface area carbons, graphitic carbons or
nanostructured carbons and ii) not to use carbon as support for the catalyst, e.g. using non-
carbonaceous and/or inorganic oxide/carbide supports, nanostructured thin films (NSTFs)
or un-supported catalysts.
Additionally, carbon corrosion at the cathode could be minimized by adding
catalysts with high activity towards the oxygen evolution reaction (OER) to the Pt-based
cathode [82] and/or to add catalysts with low activity towards the oxygen reduction reaction
(ORR) to the Pt-based anode [83]. A similar strategy could be adopted in the case of gross
fuel starvation to minimize carbon corrosion at the anode, i.e. including catalysts with high
activity towards the OER on the Pt-based anode.
Because the present thesis has primarily focused on alternative carbons, the
following paragraphs contain a short summary of alternative carbons that could be used as
catalyst support for PEMFCs, as well as some general guidelines that could be considered in
the search for more stable carbons for PEMFCs. Carbon nanotubes (CNT), carbon
nanofibers (CNF), mesoporous carbons, nano- and doped diamonds and graphene have all
been considered as alternative supports instead of conventional carbon blacks. The literature
20
including nanostructured carbons as catalyst support for PEMFC is vast [84-87]. However,
some general conclusions may be drawn: i) the fabrication process of alternative carbons, in
particular nanostructured carbons, is generally more complex, expensive and time
consuming than the fabrication process of carbon blacks, which will inevitably increase the
cost of the fuel cell application, ii) there are several studies claiming that the use of materials
such as CNT and CNF as support are able to achieve similar or better fuel cell performance,
having lower Pt loadings than conventional carbon blacks[88,89], attributed to higher
catalyst utilization and/or support-catalyst interactions, iii) the highly ordered (sp2) and inert
surface of these nanostructured carbons present a challenge for the catalyst deposition. The
lack of anchoring sites for Pt usually requires a pretreatment involving surface
functionalization [90], iv) unfortunately, the same functionalization process that it is required
to achieve high and well dispersed catalyst loadings on CNT and CNF, generally implies a
lowering of the corrosion resistance of the material [91], v) despite surface functionalization,
CNT and CNF have been shown to be more corrosion resistant that conventional carbon
blacks (Vulcan) [92] and vi) there are many studies concerning activity and stability of CNT
and CNF in liquid electrolyte, e.g. in sulfuric acid. However, when converting these catalysts
to porous fuel cell electrodes with the addition of a proton-conducting ionomer,
complications related to increased mass-transport losses are usually encountered [93].
2.4.2.4.2 System strategies
A much more cost-effective way to mitigate carbon corrosion is to apply system strategies to
start-up or shut-down the fuel cell. The most suitable strategy will of course depend on the
specific application; a strategy implemented for vehicle application may not be feasible for
portable applications. Furthermore, even the same application may have different SU/SD
strategies depending on the climate conditions, e.g. SUs/SDs of fuel cells for vehicle
application in Sweden during winter may be different from strategies implemented in
warmer climates. At sub-zero temperatures the shut-down may have to include drying out or
keeping the stack warm to avoid ice formation in the MEA.
An effective system approach for minimizing the detrimental effects caused
by unprotected SU/SD is to control certain fuel cell operating parameters. Cho et al. [79,94]
have shown that low cathode humidity and low cell temperature during SU/SD may
increase the lifetime of the fuel cell. On the other hand, simply controlling these operating
conditions is thought not to be sufficient to reach automotive durability targets [44]. The
simplest way to avoid the detrimental effects caused by O2/H2 fronts at the anode during
SU/SD is to purge the anode side with an inert gas, e.g. N2, as it is usually carried out in
laboratories. However, for real applications this is unfeasible. Ofstad et al. [95] showed that
using high flow rates of H2 during start-ups and high flow rates of air purge of the anode
during shut-down minimized carbon corrosion. This is attributed to a simple reduction of
time in which H2 and O2 co-exist at the anode during SU/SD. Another type of purge
21
strategy is the H2 purge of the cathode. However, references to this method can only be
found in the patent literature [96,97].
Perhaps the method most referred to in the literature is the start-up and
shut-down with a dummy-load. The dummy-load may be used to consume residual O2
during the start-up or the shut-down process [98-100] or to consume residual H2 during the
shut-down process [101]. Among the lowest reported SU/SD degradation rates are the ones
published by Perry et al. [100] that compared protected and unprotected start-ups using a
dummy-load while using air purge for shut-down. The degradation rate of unprotected start-
up was 100 µV cycle-1, while the protected start-up rate was only 4 µV cycle-1 at 0.4 A cm-2.
During the start-up, a dummy-load is engaged in order to consume O2 present at the
cathode while the H2 is introduced. During this period the air supply to the cathode is off,
forcing the cathode potential to low values. Crucial for this type of start-up is the ability for
the fuel inlet-manifold design to evenly distribute H2 to all the cells in the stack
simultaneously, as applying a load over a cell in the absence of fuel may cause gross fuel
starvation.
A protected shut-down with a dummy-load may be carried out in the
reversed order, i.e. shutting of the air supply and engaging the load. As the voltage of the
stack approaches 0 V, two alternatives may be selected: i) for short stops is it possible to
leave the H2 at the anode, in this case H2 will unavoidably crossover to the cathode resulting
in a H2/H2 cell with a voltage of 0 V and ii) for prolonged stops it is better to secure the
stack by purging the anode with air, resulting in an air/air cell. Furthermore, in the case of
shutting down the cell using alternative i) no protective start-up is needed, as the anode is
already filled with H2 [100].
The use of a dummy-load to consume residual O2 at the cathode implies
that the cathode or parts of the cathode may experience O2 starvation. Although
degradation due to O2 starvation has not been studied in direct relation to SU/SD, a few
groups have reported degradation of the catalyst [102,103]. Taniguchi et al. [102] observed
cell reversal and degradation of the fuel cell performance upon O2 starvation experiments.
Gerad et al. [103] however, suggested that O2 starvation has no considerable impact on the
cathode degradation when operating at steady-state applying low currents, but the
degradation could be more severe during current transients.
2.4.3 Membrane and electrode ionomer durability
2.4.3.1 Membrane degradation
The durability target for fuel cell components is closely related to the specific application,
e.g. buses and passenger vehicles need to have a durability of 20 000 h and 5 000 h,
respectively. In either case, the lifetime of the fuel cell is generally dependent on the lifetime
of the membrane, as membrane failure not only implies a decrease in performance, but is
equivalent to the end-of-life of the fuel cell. The three main degradation mechanisms
22
affecting the membrane durability are: i) chemical degradation, ii) mechanical degradation
and iii) thermal degradation, all three generally resulting in increased permeation rates and
characterized by an increase in the hydrogen crossover. Chemical degradation refers to the
attack of the polymer chains and end-groups, e.g. carboxylic end-groups by hydroxyl (OH)
and peroxyl (OOH) radicals [104]. These radicals are believed to be formed from hydrogen
peroxide decomposition, which in turn is produced during the ORR [105] or during reactant
gas crossover [106]. Chemical degradation leads to membrane thinning and can be evaluated
in situ by measuring fluoride release from the fuel cell and increased gas crossover rates.
Little work has been carried out to study the effect of high potential transients (>1.2 V)
during SU/SD on membrane and ionomer durability. However, operating conditions such
as extensive periods at OCV (~1 V) and low RH have been reported to have a large impact
on the chemical degradation of the membrane [106]. Thus, it is highly probable that
chemical degradation of the membrane is present during SUs/SDs.
Mechanical degradation occurs when the membrane experiences creeping,
cracking or formation of pinholes. Possible causes for this type of degradation are many,
e.g. fabrication defects, improper MEA assembly by the seals, edges or by inhomogeneous
compression of BPPs. Additionally, temperature and humidity cycling, differences in gas
pressure between anode and cathode, as well as the spatial distribution along the flow
channel of these conditions may also degrade the mechanical properties of the membrane
[107]. These types of conditions, in particular temperature and humidity cycles, should
definitely be expected to be present during SUs/SDs.
Thermal degradation occurs at high temperatures. Above 200 oC the loss of
sulfonate groups begins to occur [108]. Consequently, during normal fuel cell operating
temperatures (below 100 oC), thermal decomposition of membrane is often neglected. On
the other hand, it has been proposed that membrane defects may allow the permeation of
hydrogen to the cathode side, where it is likely to catalytically combust and produce local
hotspots [107]. Yet another mechanism that may result in high enough temperatures to
degrade the membrane may occur under transient conditions, e.g. when the fuel cell operates
under gross fuel starvation [69] or under air starvation [102]. In the case of gross fuel
starvation, it was shown that the high potentials generated at the anode resulted in local heat
generation and holes in the membrane [69]. Therefore, it is reasonable to think that thermal
degradation could be present during SUs/SDs operation as well.
2.4.3.2 Ionomer degradation
The ionomer in the catalyst layer is believed to be susceptible to many of the same
degradation mechanisms as the membrane. Although pinhole formation and increased gas
permeability are, for obvious reasons not of great concern, it is widely assumed that the
dissolution of the ionomer in the catalyst layer occurs during long-term operation [109],
causing loss of contact with the catalyst particles and decreased ionic conductivity. However,
23
characterization of the ionomer degradation is very challenging due to difficulties in
distinguishing the ionomer from the Pt/C phase using traditional morphology
characterization methods, such as scanning electron microscopy (SEM). Furthermore,
measurements of fluoride release from effluent water do not discriminate between
membrane and catalyst layer ionomer degradation. Zhang et al. [110] used X-ray
photoelectron spectroscopy (XPS) to show that the catalyst layer ionomer dissolves and/or
decomposes after 300 h of operation at high current densities. The degradation was
characterized by a decreased concentration of CF3 and CF2 species. Wood III et al. [26]
used neutron reflectometry (NR) to study the interaction between idealized layers of Nafion
on either glassy carbon or Pt. They observed that the thickness of Nafion films increased
with aging time, attributed to irreversible swelling. There are no studies on ionomer
degradation related to fuel starvation conditions. However, Young [76] studied the
performance of cathodes having different ionomer contents subjected to simulated SU/SD
conditions. They found that the conductivity of the ionomer increased at low RH, but
decreased at high RH after 30 h of degradation.
2.4.4 GDL degradation Although there is a vast amount of literature investigating the properties of the GDLs and
how these properties may affect the performance of the fuel cell, degradation studies of
GDLs are much fewer. Cindrella et al. [30] reviewed the key parameters affecting GDL
performance, e.g. structure, porosity, hydrophobicity, hydrophilicity, gas permeability,
transport properties, water management and surface morphology. Although GDL
degradation studies are few, several degradation mechanisms that could influence the
above-mentioned properties have been proposed. The loss of PTFE is said to cause
changes in the hydrophobic properties of the GDL. The modeling work of Seidenberge et
al. [111] has shown that more and larger water clusters are formed in the GDL when the
content of PTFE decreases over time. M. Schulze et al. [112] suggested that the degradation
of the PTFE induced two times higher performance loss than Pt agglomeration after 1600 h
of operation.
Oxidation or corrosion of the carbon in the GDL is another degradation
mechanism of concern. Frisk et al. [113] used very aggressive ex-situ accelerated degradation
tests (ADTs), i.e. using H2O2 to induce GDL oxidation. These were later used at the
cathode of a PEMFC and had a large negative impact on the performance at high current
densities. As the corrosion of the support during SUs/SDs became generally accepted, the
corrosion of the micro porous layer (MPL) of the GDL also became an issue of concern.
Owejan et al. [114] investigated the corrosion of the MPL using potentiostatic holds of 1.2 V
and SU/SD simulation by air purging the anode. They suggest that carbon corrosion of the
MPL at the GDL/electrode interface causes an increase of the mass-transport losses and
that graphitized carbons in the MPL may be used to mitigate this type of degradation.
24
Young et al. [76] simulated SUs/SDs while measuring carbon corrosion rates from the
cathode exhaust. They found that the accumulative carbon loss was higher than the total
carbon loading of the electrode, attributing the difference to corrosion of the MPL. On the
other hand, others have found little or no degradation of the MPL upon high operating
voltages of 1.5 V [115]. There are no reports on changes in MPL morphology or collapse of
the MPL’s porous structure and it is clearly an area of PEMFC research that needs more
attention.
2.4.5 Stainless steel bi-polar plates (BPPs) degradation There are two main issues concerning the durability of stainless steels as BPPs, these are: i)
the corrosion of the stainless steels, releasing multivalent cations and ii) the increase in
contact resistance between BPP and GDL due to surface oxides. Many research groups have
reported the presence of metal ions either in the MEA or in the effluent water when using
stainless steel BPPs [116-118]. It is suggested that metal ions diffuse into the membrane or
catalyst layer ionomer, get trapped in the ion exchange sites decreasing the ionic conductivity
of the ionic phase. It has also been suggested that metal ions, especially Fe ions, may react
with peroxides formed during the ORR, producing hydroxyl radicals and increasing the
chemical degradation of the membrane and ionomer [117]. Very little work has been carried
out in the context of fuel starvation conditions and metallic BPPs. One possible reason for
this is that the BPP is not expected to experience the same high potentials as the electrodes
during these transients; since, the BPP is not in contact with the electrolyte. Yet, Eom et al.
[119] have recently evaluated the durability of fuel cells using graphite, uncoated 316L and
CrN-coated 316L BPPs under simulated SU/SD conditions at 1.4 V. As expected all three
set-ups showed signs of carbon corrosion in the cathode catalyst layer. Interestingly, there
were large differences in degradation of the fuel cell performance depending on the BPP
material. Although the cell resistance was not measured in situ, the larger performance
degradation exhibited by the fuel cell using uncoated 316 L was attributed to metal ion
contamination of the membrane. This is also an area of PEMFC research that needs further
attention.
25
Chapter 3
Scope of the thesis
As mentioned in Chapter 2, high cathode potentials are often encountered every time fuel
and air coexist at the anode, e.g. every time the fuel cell undergoes start-ups and shut-downs
(SUs/SDs). The aim of this thesis is to develop methods, materials and strategies for
maximizing the lifetime of the support in Pt/C cathodes during these high potential
transients.
Determining the electrochemically active surface area (ECSA) of fuel cell
electrodes is a common method of evaluating both fresh and degraded catalysts. Therefore,
the first objective of this thesis is to establish how operating conditions, e.g. relative
humidity (RH), may affect the ECSA of fresh Pt/C cathodes. This is considered an
interesting starting-point to the thesis, as corroded cathodes may display an altered water
content [81]. Furthermore, in an attempt to clarify some aspects of the ECSA dependence
on the RH, a PSUgPVPA ionomer is used as the ionic-conducting phase in a conventional
Pt/C cathode and studied at different RH.
The second objective of the thesis is to find a suitable accelerated
degradation test (ADT) for carbon corrosion. In order to effectively develop more durable
catalysts, ADTs should attempt to: i) degrade the electrode within a reasonable amount of
time, ii) minimize the degradation of other fuel cell components and iii) simulate the
transient conditions encountered during SUs/SDs. Three types of ADT are evaluated using
standard electrochemical methods and reversible effects associated to the ionomer are
discussed.
The third objective of the thesis is to review part of the work carried out
searching for more durable supports. The durability of cathodes using several intrinsically
different carbons as support for the Pt catalyst is evaluated using an ADT closely simulating
the SU/SDs conditions. An important part of the work also includes identifying and
discussing key challenges and difficulties when searching for alternative support materials.
The fourth objective of the thesis is to give an enhanced understanding of
the effect of carbon corrosion on the performance of PEMFCs. In particular, to determine
the source for mass-transport limitations in commercially available MEAs subjected to
carbon corrosion. The electrochemical behavior of corroded cathodes, at different RH, is
correlated with changes in electrode morphology.
The final objective is to investigate the possibility of addressing the issues
related to carbon corrosion during SUs/SDs from a system perspective. The durability of
commercially available MEAs is evaluated using different shut-down strategies.
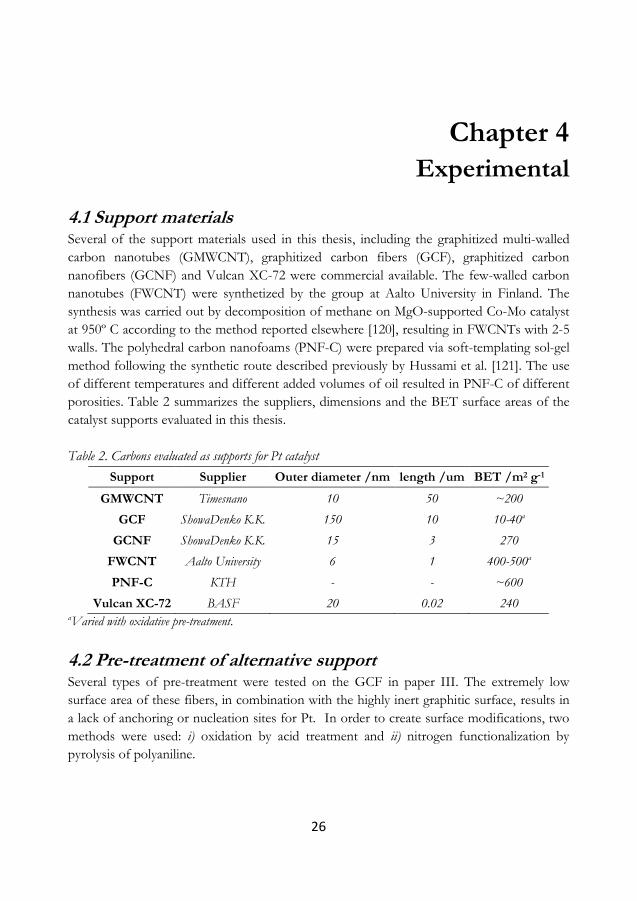
26
Chapter 4
Experimental
4.1 Support materials Several of the support materials used in this thesis, including the graphitized multi-walled
carbon nanotubes (GMWCNT), graphitized carbon fibers (GCF), graphitized carbon
nanofibers (GCNF) and Vulcan XC-72 were commercial available. The few-walled carbon
nanotubes (FWCNT) were synthetized by the group at Aalto University in Finland. The
synthesis was carried out by decomposition of methane on MgO-supported Co-Mo catalyst
at 950º C according to the method reported elsewhere [120], resulting in FWCNTs with 2-5
walls. The polyhedral carbon nanofoams (PNF-C) were prepared via soft-templating sol-gel
method following the synthetic route described previously by Hussami et al. [121]. The use
of different temperatures and different added volumes of oil resulted in PNF-C of different
porosities. Table 2 summarizes the suppliers, dimensions and the BET surface areas of the
catalyst supports evaluated in this thesis.
Table 2. Carbons evaluated as supports for Pt catalyst
Support Supplier Outer diameter /nm length /um BET /m2 g-1
GMWCNT Timesnano 10 50 ~200
GCF ShowaDenko K.K. 150 10 10-40a
GCNF ShowaDenko K.K. 15 3 270
FWCNT Aalto University 6 1 400-500a
PNF-C KTH - - ~600
Vulcan XC-72 BASF 20 0.02 240 aVaried with oxidative pre-treatment.
4.2 Pre-treatment of alternative support Several types of pre-treatment were tested on the GCF in paper III. The extremely low
surface area of these fibers, in combination with the highly inert graphitic surface, results in
a lack of anchoring or nucleation sites for Pt. In order to create surface modifications, two
methods were used: i) oxidation by acid treatment and ii) nitrogen functionalization by
pyrolysis of polyaniline.
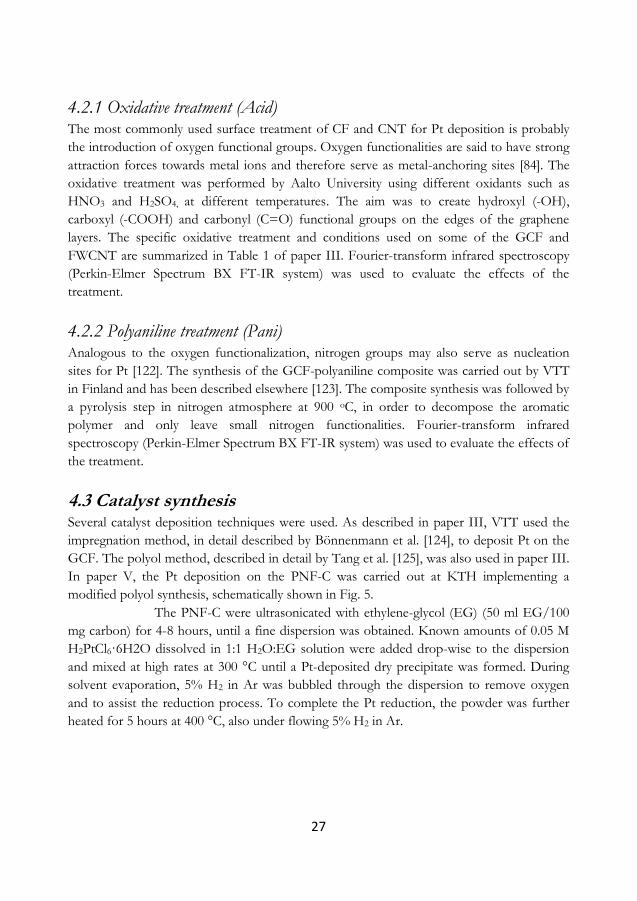
27
4.2.1 Oxidative treatment (Acid) The most commonly used surface treatment of CF and CNT for Pt deposition is probably
the introduction of oxygen functional groups. Oxygen functionalities are said to have strong
attraction forces towards metal ions and therefore serve as metal-anchoring sites [84]. The
oxidative treatment was performed by Aalto University using different oxidants such as
HNO3 and H2SO4, at different temperatures. The aim was to create hydroxyl (-OH),
carboxyl (-COOH) and carbonyl (C=O) functional groups on the edges of the graphene
layers. The specific oxidative treatment and conditions used on some of the GCF and
FWCNT are summarized in Table 1 of paper III. Fourier-transform infrared spectroscopy
(Perkin-Elmer Spectrum BX FT-IR system) was used to evaluate the effects of the
treatment.
4.2.2 Polyaniline treatment (Pani) Analogous to the oxygen functionalization, nitrogen groups may also serve as nucleation
sites for Pt [122]. The synthesis of the GCF-polyaniline composite was carried out by VTT
in Finland and has been described elsewhere [123]. The composite synthesis was followed by
a pyrolysis step in nitrogen atmosphere at 900 oC, in order to decompose the aromatic
polymer and only leave small nitrogen functionalities. Fourier-transform infrared
spectroscopy (Perkin-Elmer Spectrum BX FT-IR system) was used to evaluate the effects of
the treatment.
4.3 Catalyst synthesis Several catalyst deposition techniques were used. As described in paper III, VTT used the
impregnation method, in detail described by Bönnenmann et al. [124], to deposit Pt on the
GCF. The polyol method, described in detail by Tang et al. [125], was also used in paper III.
In paper V, the Pt deposition on the PNF-C was carried out at KTH implementing a
modified polyol synthesis, schematically shown in Fig. 5.
The PNF-C were ultrasonicated with ethylene-glycol (EG) (50 ml EG/100
mg carbon) for 4-8 hours, until a fine dispersion was obtained. Known amounts of 0.05 M
H2PtCl6·6H2O dissolved in 1:1 H2O:EG solution were added drop-wise to the dispersion
and mixed at high rates at 300 °C until a Pt-deposited dry precipitate was formed. During
solvent evaporation, 5% H2 in Ar was bubbled through the dispersion to remove oxygen
and to assist the reduction process. To complete the Pt reduction, the powder was further
heated for 5 hours at 400 °C, also under flowing 5% H2 in Ar.
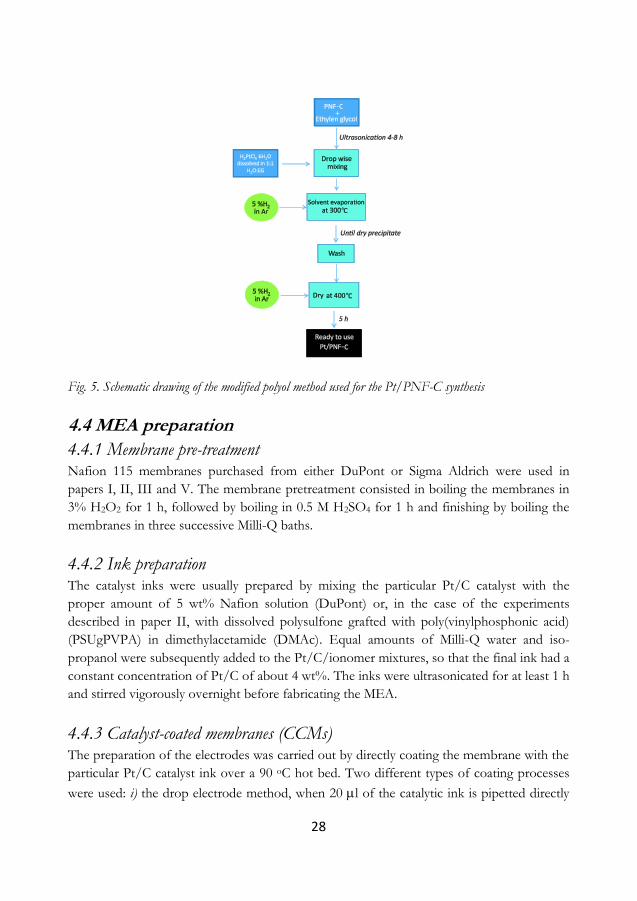
28
Fig. 5. Schematic drawing of the modified polyol method used for the Pt/PNF-C synthesis
4.4 MEA preparation
4.4.1 Membrane pre-treatment Nafion 115 membranes purchased from either DuPont or Sigma Aldrich were used in
papers I, II, III and V. The membrane pretreatment consisted in boiling the membranes in
3% H2O2 for 1 h, followed by boiling in 0.5 M H2SO4 for 1 h and finishing by boiling the
membranes in three successive Milli-Q baths.
4.4.2 Ink preparation The catalyst inks were usually prepared by mixing the particular Pt/C catalyst with the
proper amount of 5 wt% Nafion solution (DuPont) or, in the case of the experiments
described in paper II, with dissolved polysulfone grafted with poly(vinylphosphonic acid)
(PSUgPVPA) in dimethylacetamide (DMAc). Equal amounts of Milli-Q water and iso-
propanol were subsequently added to the Pt/C/ionomer mixtures, so that the final ink had a
constant concentration of Pt/C of about 4 wt%. The inks were ultrasonicated for at least 1 h
and stirred vigorously overnight before fabricating the MEA.
4.4.3 Catalyst-coated membranes (CCMs) The preparation of the electrodes was carried out by directly coating the membrane with the
particular Pt/C catalyst ink over a 90 oC hot bed. Two different types of coating processes
were used: i) the drop electrode method, when 20 l of the catalytic ink is pipetted directly
29
on to the membrane (papers I, II and III) and ii) spray-painting the membrane using an
airbrush (papers II and V). The drop electrode method has several advantages, e.g. excellent
control of catalyst loading (0.1 mg Pt), little waste, and fast electrode preparation, which
makes this method convenient for catalyst screening [126]. However, the main disadvantage
of using this method is the lack of control of the electrode’s area, and thus the thickness.
This is a crucial parameter when comparing mass-transport losses between different
electrodes. The MEA preparation was finished by hot pressing a commercial gas diffusion
electrode (ETEK, 30 wt% Pt/Vulcan) as the anode electrode.
As accounted for in paper III, some MEAs were prepared by IRD Fuel
Cells A/S [127] using a spray coating technique. The MEAs consisted of a commercial
catalyst (Johnson Matthey, 60 wt% Pt on Vulcan XC-72) on the anode side and either acid-
treated Pt/GCF catalyst, or a reference catalyst (BASF, 20 wt% Pt on Vulcan XC-72), on
the cathode side. The catalyst loading on the anode and cathode was 0.3 and 0.5 mg cm–2,
respectively. The electrode area was 3 cm2.
Commercially available MEAs (W. L. GORE & Associated, Inc.) were used
in papers IV, V and VII. The MEAs had catalyst loadings of 0.45 mg cm-2 Pt-alloy/C on the
anode and 0.4 mg cm-2 Pt/C on the cathode, respectively. This state-of-the-art MEA not
only delivered good fuel cell performance, but also provided a very high reproducibility. The
standard deviation between different MEAs was ± 10 mV for the entire polarization curve,
using pure gases.
4.5 Fuel cell hardware With the exception of the work described in paper I and part of the work described in paper
II, most of the experimental work was carried out in a modified version of Ihonen’s fuel cell
design [128]. The two most important features of this in-house cell are: i) the clamping
pressure is separated from the sealing pressure, allowing the precise control of the GDL
compression and ii) the construction material of the cell body is polyether-ether ketone
(PEEK), which allows the installation of probes to measure the potential. The cell has two
movable cylindrical current collectors made of graphite KC-673 (Svenska Tanso AB) with
an active area and flow field of 7 cm2. The temperature was measured and controlled with a
K-type thermocouple placed 1 mm away from the flow field and the heat was supplied by
four heating elements inserted in the PEEK cell body.
4.6 In-situ electrochemical characterization methods
4.6.1Cyclic voltammetry (CV) and CO stripping In-situ cyclic voltammetry (CV) was implemented in almost all of the papers in this thesis to
determine the electrochemically active surface area (ECSA) of the electrodes. A flow of inert
gas over the working electrode (WE) and H2 over the combined reference/counter electrode
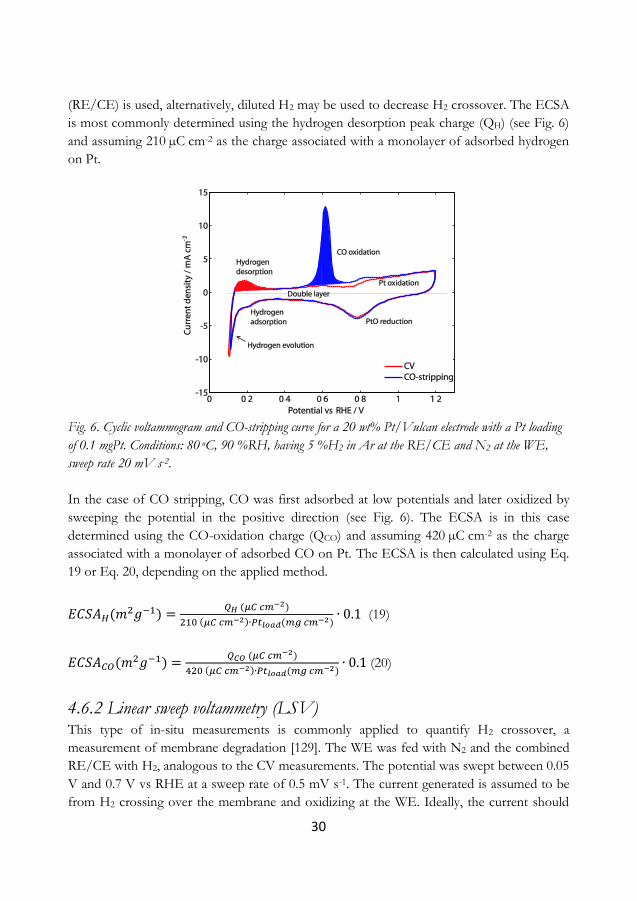
30
(RE/CE) is used, alternatively, diluted H2 may be used to decrease H2 crossover. The ECSA
is most commonly determined using the hydrogen desorption peak charge (QH) (see Fig. 6)
and assuming 210 µC cm-2 as the charge associated with a monolayer of adsorbed hydrogen
on Pt.
Fig. 6. Cyclic voltammogram and CO-stripping curve for a 20 wt% Pt/Vulcan electrode with a Pt loading
of 0.1 mgPt. Conditions: 80 oC, 90 %RH, having 5 %H2 in Ar at the RE/CE and N2 at the WE,
sweep rate 20 mV s-2.
In the case of CO stripping, CO was first adsorbed at low potentials and later oxidized by
sweeping the potential in the positive direction (see Fig. 6). The ECSA is in this case
determined using the CO-oxidation charge (QCO) and assuming 420 µC cm-2 as the charge
associated with a monolayer of adsorbed CO on Pt. The ECSA is then calculated using Eq.
19 or Eq. 20, depending on the applied method.
(19)
(20)
4.6.2 Linear sweep voltammetry (LSV) This type of in-situ measurements is commonly applied to quantify H2 crossover, a
measurement of membrane degradation [129]. The WE was fed with N2 and the combined
RE/CE with H2, analogous to the CV measurements. The potential was swept between 0.05
V and 0.7 V vs RHE at a sweep rate of 0.5 mV s-1. The current generated is assumed to be
from H2 crossing over the membrane and oxidizing at the WE. Ideally, the current should
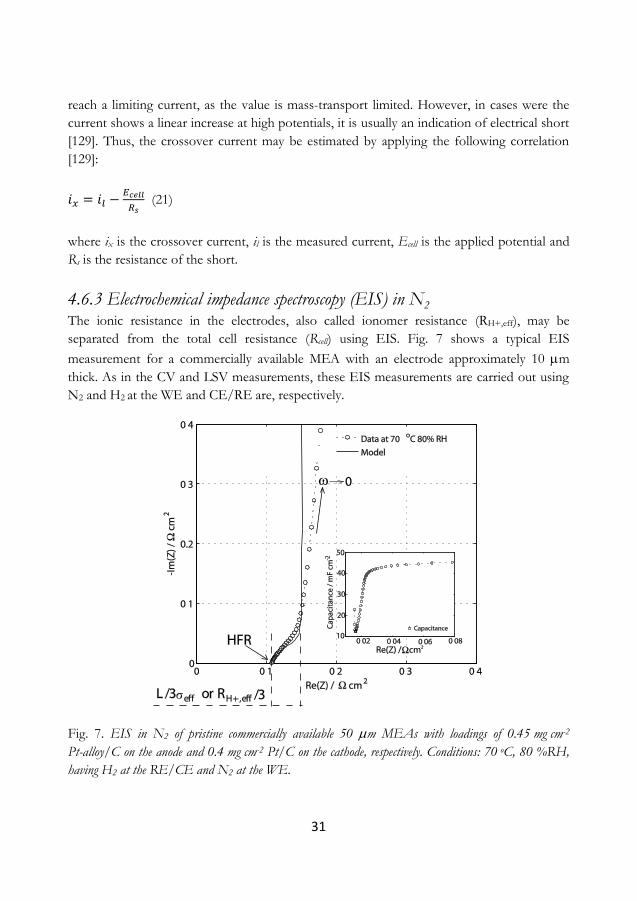
31
reach a limiting current, as the value is mass-transport limited. However, in cases were the
current shows a linear increase at high potentials, it is usually an indication of electrical short
[129]. Thus, the crossover current may be estimated by applying the following correlation
[129]:
(21)
where ix is the crossover current, il is the measured current, Ecell is the applied potential and
Rs is the resistance of the short.
4.6.3 Electrochemical impedance spectroscopy (EIS) in N2
The ionic resistance in the electrodes, also called ionomer resistance (RH+,eff), may be
separated from the total cell resistance (Rcell) using EIS. Fig. 7 shows a typical EIS
measurement for a commercially available MEA with an electrode approximately 10 m
thick. As in the CV and LSV measurements, these EIS measurements are carried out using
N2 and H2 at the WE and CE/RE are, respectively.
Fig. 7. EIS in N2 of pristine commercially available 50 m MEAs with loadings of 0.45 mg cm-2
Pt-alloy/C on the anode and 0.4 mg cm-2 Pt/C on the cathode, respectively. Conditions: 70 oC, 80 %RH,
having H2 at the RE/CE and N2 at the WE.
32
In papers IV and V, the measurements were carried out at a constant potential (0.4 V vs.
RHE), the applied amplitude was 10 mV and the frequency was varied between 10 kHz-
1Hz. The data was analyzed using Eq. 21 in the work of Jaounen and Lindbergh [130]. This
model predicts a 45 o region at high frequencies, followed by a vertical line at low
frequencies. The magnitude of the real part of the impedance (Re(Z)) is dependent on the
cathode thickness (L) and converges to L/3σeff or RH+,eff/3 at low frequencies [130]. The
measurements deviate from the predicted model behavior at low frequencies. However, the
high frequency part was considered to be in agreement with the model showing a distinct
45 o region. Additionally, Fig. 7 shows that EIS in N2 may also provide a measurement of
the electrode’s capacitance by plotting 1/(-Im(Z)*) as function of frequency or Re(Z), as
previously carried out by Easton and Pickup [131].
4.6.4 Symmetric H2/H2 cell The symmetric H2/H2 cell or proton pump, using pure hydrogen on both anode and
cathode, was used to evaluate the resistance of the cell (Rcell), in papers I, II and III. The
voltage was swept between -0.2 and 0.2 V vs. RHE, at a sweep rate of 20 mV s-1. Normally,
the current density increases linearly with increasing voltage due to the fast hydrogen
kinetics and negligible mass-transport. Thus, the resulting slope was taken as an
approximation of Rcell. In these studies, the measured resistance was used to correct
polarization curves for the iR drop of the cell.
It is important to point out, that measurements of the cell resistance carried
out in N2/H2 or H2/H2 may not be representative for a fuel cell operating in H2/O2,
especially at low RH and/or at high current densities. The water produced at the cathode
due to the ORR, water drag from anode to cathode, as well as the back diffusion of water
from cathode to anode will change the water content in the cell as a function of current and
thus the ionic resistance of the membrane and electrodes [4].
4.6.5 Polarization curves and EIS Polarization curves were taken at constant temperature, inlet humidity and reactant flow
rates. In papers I, II, III and V the polarization curves were taken by sweeping the voltage
between OCV and approximately 0.4 V at a sweep rate of 1 mV s-1. In some cases, a
semi-log plot was constructed by plotting the iR-corrected potentials vs. current density, for
an H2/O2 cell. In this configuration the mass-transport losses are neglected and the resulting
slope was taken as a measurement of the Tafel slope. It is important to emphasize that the
relatively high sweep rates (1 mV s-1) used to take the measurements implies that the fuel cell
is never at equilibrium. Consequently, the performance is probably overestimated at high
RH and underestimated at low RH. The reported performances are therefore not
benchmarked against literature values, but are used for comparison between samples.
33
In papers IV, VI and VII the polarization curves were instead performed in
a galvanostatic mode, from low to high current densities. In these measurements, the cell is
equilibrated for at least 5 minutes at each point, which for thin membranes (~25 µm) is
believed to be sufficient to reach equilibrium. At the end of each current level an impedance
spectrum was recorded. The frequency range was between 10 kHz and 100 mHz and the
amplitude of the sinusoidal ac current was 5 % of the dc current. With these EIS
measurements, the polarization curves may be iR-corrected at each current density using the
high frequency resistance (HFR), i.e. the real resistance (Re(Z)) at 1 kHz, a much more
accurate value in comparison to the H2/H2 cell.
Impedance spectra are usually fitted to an equivalent circuit model or
physics-based models in order to obtain information about kinetics or mass-transport.
However, in the present thesis no such efforts were made, and EIS results are only analyzed
qualitatively. Mass-transport losses (tx,gas) are in this thesis characterized by evaluating the
difference between polarization curves, or EIS spectra taken in either O2/H2 or air/H2.
These measurements are taken in galvanostatic mode and at constant flow rates in order to
assure identical water content in the cell independently of the oxidant gas. As it was
discussed in chapter 2, section 2.3, this is of course not a true measure of the tx,gas.
However, it is a method for identifying differences in mass-transport losses between
different materials or degradation of the mass-transport properties of the fuel cell as
function of time.
4.6.6 Ex-situ and in-situ contact resistance Fig. 8 shows the modifications made to the in-house fuel cell in order to carry out both ex-
situ and in-situ measurements of contact resistance between GDL and BPP. Pt probes to
measure the potentials at the GDL (Probe I and Probe II) are inserted through the PEEK
cell body.
When evaluating the performance of metallic BPPs, the potential at the plate
was measured using a Pt probe (probe III) inserted through the graphite current collector
and isolated with an alumina tube (see Fig. 8a). To evaluate the effect of operating fuel cell
conditions, e.g. temperature and the presence of water, the contact resistance was measured
ex-situ. Fig. 8b shows how a piece of electronically conductive Papyex graphite foil
(Carbon Nordic AB) was used to separate the two compartments and measure the pressure
drop though the flow field/GDL. Fig. 8c shows the replacement of the graphite foil by a
MEA in order to measure the contact resistance in-situ.
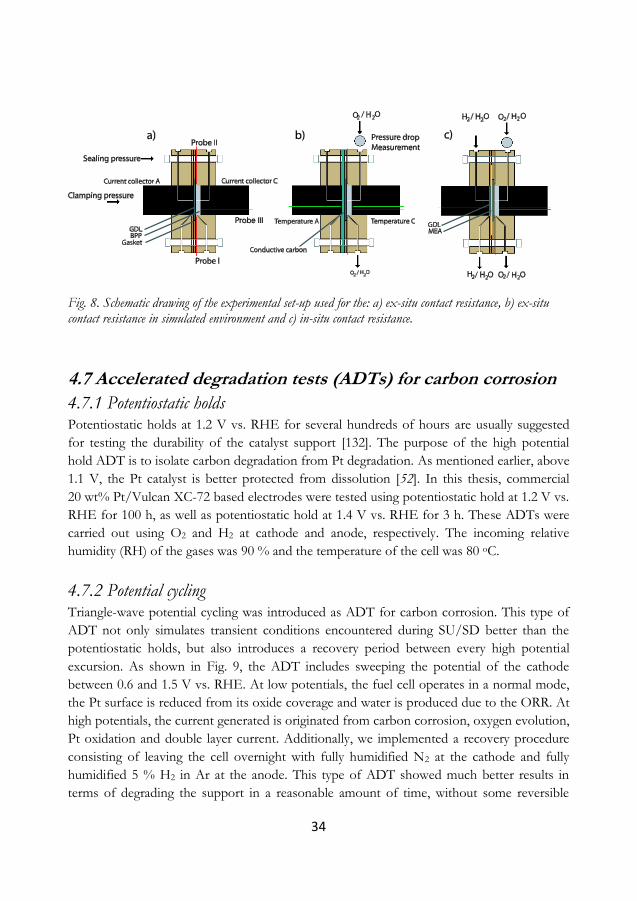
34
Fig. 8. Schematic drawing of the experimental set-up used for the: a) ex-situ contact resistance, b) ex-situ contact resistance in simulated environment and c) in-situ contact resistance.
4.7 Accelerated degradation tests (ADTs) for carbon corrosion
4.7.1 Potentiostatic holds Potentiostatic holds at 1.2 V vs. RHE for several hundreds of hours are usually suggested
for testing the durability of the catalyst support [132]. The purpose of the high potential
hold ADT is to isolate carbon degradation from Pt degradation. As mentioned earlier, above
1.1 V, the Pt catalyst is better protected from dissolution [52]. In this thesis, commercial
20 wt% Pt/Vulcan XC-72 based electrodes were tested using potentiostatic hold at 1.2 V vs.
RHE for 100 h, as well as potentiostatic hold at 1.4 V vs. RHE for 3 h. These ADTs were
carried out using O2 and H2 at cathode and anode, respectively. The incoming relative
humidity (RH) of the gases was 90 % and the temperature of the cell was 80 oC.
4.7.2 Potential cycling Triangle-wave potential cycling was introduced as ADT for carbon corrosion. This type of
ADT not only simulates transient conditions encountered during SU/SD better than the
potentiostatic holds, but also introduces a recovery period between every high potential
excursion. As shown in Fig. 9, the ADT includes sweeping the potential of the cathode
between 0.6 and 1.5 V vs. RHE. At low potentials, the fuel cell operates in a normal mode,
the Pt surface is reduced from its oxide coverage and water is produced due to the ORR. At
high potentials, the current generated is originated from carbon corrosion, oxygen evolution,
Pt oxidation and double layer current. Additionally, we implemented a recovery procedure
consisting of leaving the cell overnight with fully humidified N2 at the cathode and fully
humidified 5 % H2 in Ar at the anode. This type of ADT showed much better results in
terms of degrading the support in a reasonable amount of time, without some reversible
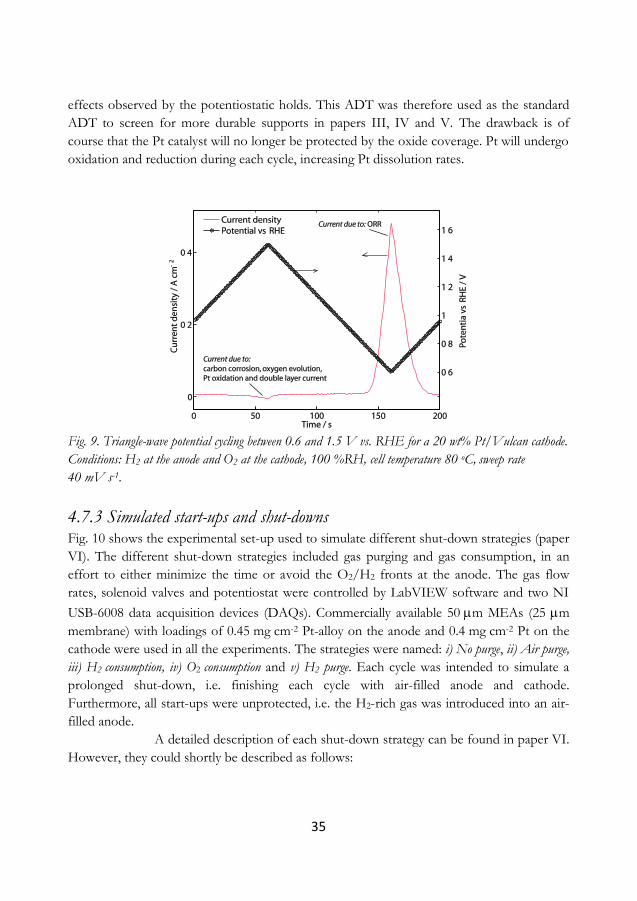
35
effects observed by the potentiostatic holds. This ADT was therefore used as the standard
ADT to screen for more durable supports in papers III, IV and V. The drawback is of
course that the Pt catalyst will no longer be protected by the oxide coverage. Pt will undergo
oxidation and reduction during each cycle, increasing Pt dissolution rates.
Fig. 9. Triangle-wave potential cycling between 0.6 and 1.5 V vs. RHE for a 20 wt% Pt/Vulcan cathode.
Conditions: H2 at the anode and O2 at the cathode, 100 %RH, cell temperature 80 oC, sweep rate
40 mV s-1.
4.7.3 Simulated start-ups and shut-downs Fig. 10 shows the experimental set-up used to simulate different shut-down strategies (paper
VI). The different shut-down strategies included gas purging and gas consumption, in an
effort to either minimize the time or avoid the O2/H2 fronts at the anode. The gas flow
rates, solenoid valves and potentiostat were controlled by LabVIEW software and two NI
USB-6008 data acquisition devices (DAQs). Commercially available 50 m MEAs (25 m
membrane) with loadings of 0.45 mg cm-2 Pt-alloy on the anode and 0.4 mg cm-2 Pt on the
cathode were used in all the experiments. The strategies were named: i) No purge, ii) Air purge,
iii) H2 consumption, iv) O2 consumption and v) H2 purge. Each cycle was intended to simulate a
prolonged shut-down, i.e. finishing each cycle with air-filled anode and cathode.
Furthermore, all start-ups were unprotected, i.e. the H2-rich gas was introduced into an air-
filled anode.
A detailed description of each shut-down strategy can be found in paper VI.
However, they could shortly be described as follows:
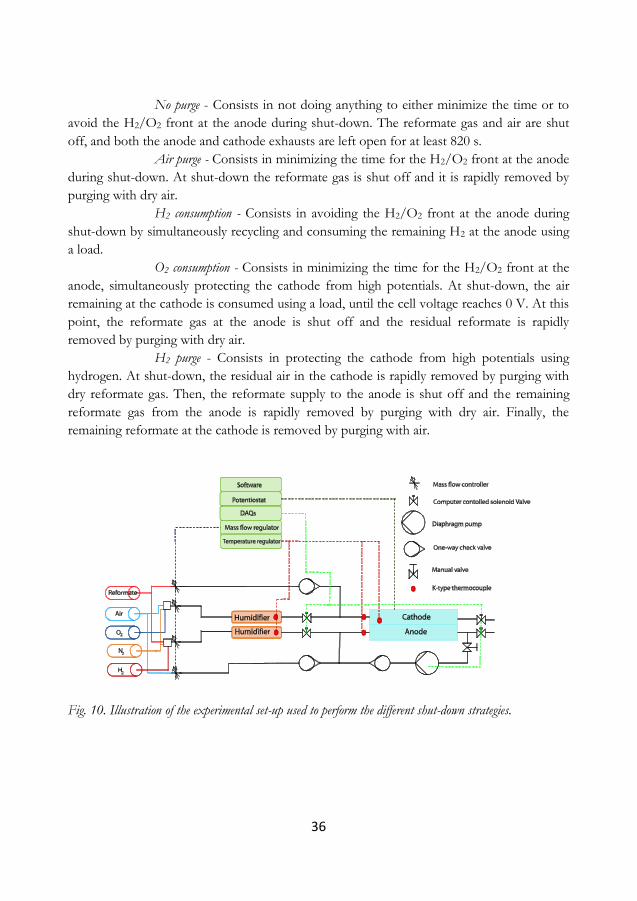
36
No purge - Consists in not doing anything to either minimize the time or to
avoid the H2/O2 front at the anode during shut-down. The reformate gas and air are shut
off, and both the anode and cathode exhausts are left open for at least 820 s.
Air purge - Consists in minimizing the time for the H2/O2 front at the anode
during shut-down. At shut-down the reformate gas is shut off and it is rapidly removed by
purging with dry air.
H2 consumption - Consists in avoiding the H2/O2 front at the anode during
shut-down by simultaneously recycling and consuming the remaining H2 at the anode using
a load.
O2 consumption - Consists in minimizing the time for the H2/O2 front at the
anode, simultaneously protecting the cathode from high potentials. At shut-down, the air
remaining at the cathode is consumed using a load, until the cell voltage reaches 0 V. At this
point, the reformate gas at the anode is shut off and the residual reformate is rapidly
removed by purging with dry air.
H2 purge - Consists in protecting the cathode from high potentials using
hydrogen. At shut-down, the residual air in the cathode is rapidly removed by purging with
dry reformate gas. Then, the reformate supply to the anode is shut off and the remaining
reformate gas from the anode is rapidly removed by purging with dry air. Finally, the
remaining reformate at the cathode is removed by purging with air.
Fig. 10. Illustration of the experimental set-up used to perform the different shut-down strategies.
37
Chapter 5
Results
5.1 Effect of operating conditions on the ECSA Traditionally, the Pt surface area of a PEMFC catalyst is measured ex-situ by cyclic
voltammetry in an aqueous solution containing H2SO2 or HClO4 at room temperature.
However, fuel cell operating conditions, the fuel cell hardware, e.g. BPP channel/rib
dimensions, as well as the electrode composition may all have a large impact on the in-situ
electrochemically active surface area (ECSA). Therefore, the questions of how operating
conditions and aggressive ADTs for carbon corrosion may affect the ECSA were
investigated in paper I.
Fig. 11 shows the effect of temperature and relative humidity (RH), on the
hydrogen desorption charge and peak position (Fig. 11a) and the CO oxidation charge and
peak position (Fig. 11b). Both the H2-desoption and CO-oxidation peak positions have a
tendency to shift negatively with increasing temperature, indicating faster kinetics, in
agreement with studies performed in liquid solution [133]. On the other hand, both peak
positions shift positively with decreasing humidity. For the CO-oxidation peak it has been
shown that the partial pressure of water is crucial for the CO oxidation to occur [134].
Fig 11a additionally shows that the hydrogen desorption charge experiences a significant
decrease with increasing temperature, as well as with decreasing RH. This observation is in
contrast to what is usually observed in aqueous solutions. The cause behind the effect of
temperature is suggested to have its origin in the magnitude of the flow of the inert gas used
in the in-situ CV measurements. The gas velocity is believed to increase with increasing
temperature, facilitating the off-transport of evolved hydrogen. This in turn shifts the
equilibrium of the cathodic hydrogen evolution reaction (HER), enhancing the hydrogen
evolution current. As a result, a larger portion of the hydrogen desorption current is
overlapped or hidden by this strong cathodic current [135]. On the other hand, the CO
oxidation charge is found to be independent of temperature at high RH, suggesting that the
strongly absorbed CO is not affected by the flow of inert gas. At low RH however, just as
the hydrogen desorption charge, the CO oxidation charge decreases. This is interpreted as a
clear indication that the ECSA is actually decreasing at low RH and it is suggested that it
may be caused by changes in the ionomer interaction with the Pt/C catalyst at low water
content. More specifically, the decreased charges at low RH are attributed to ionomer re-
structuring, resulting in a lower degree of wetting and loss of contact between the ionomer
and the Pt catalyst. Additionally, a decrease of the double layer capacitance (Cdl) also
indicates that less Pt/C is in contact with the ionomer at low RH. This hypothesis is in
accordance with other studies suggesting that the structure of the ionomer and its
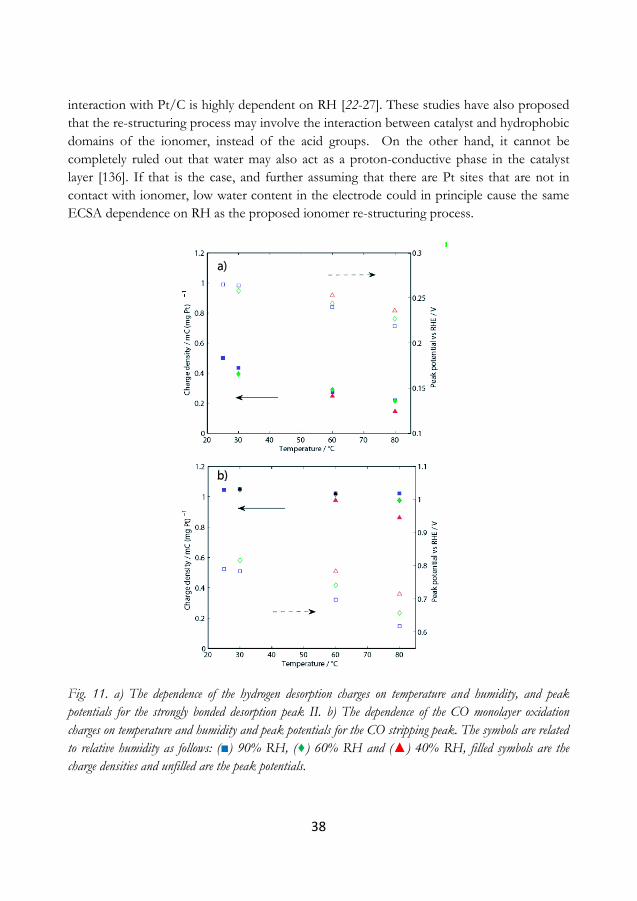
38
interaction with Pt/C is highly dependent on RH [22-27]. These studies have also proposed
that the re-structuring process may involve the interaction between catalyst and hydrophobic
domains of the ionomer, instead of the acid groups. On the other hand, it cannot be
completely ruled out that water may also act as a proton-conductive phase in the catalyst
layer [136]. If that is the case, and further assuming that there are Pt sites that are not in
contact with ionomer, low water content in the electrode could in principle cause the same
ECSA dependence on RH as the proposed ionomer re-structuring process.
Fig. 11. a) The dependence of the hydrogen desorption charges on temperature and humidity, and peak
potentials for the strongly bonded desorption peak II. b) The dependence of the CO monolayer oxidation
charges on temperature and humidity and peak potentials for the CO stripping peak. The symbols are related
to relative humidity as follows: () 90% RH, (♦) 60% RH and () 40% RH, filled symbols are the
charge densities and unfilled are the peak potentials.
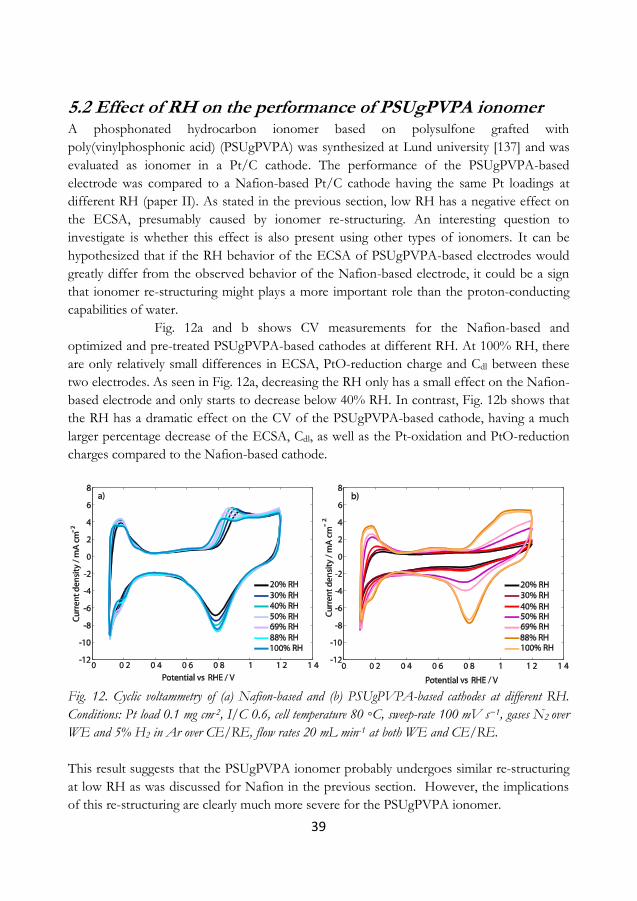
39
5.2 Effect of RH on the performance of PSUgPVPA ionomer A phosphonated hydrocarbon ionomer based on polysulfone grafted with
poly(vinylphosphonic acid) (PSUgPVPA) was synthesized at Lund university [137] and was
evaluated as ionomer in a Pt/C cathode. The performance of the PSUgPVPA-based
electrode was compared to a Nafion-based Pt/C cathode having the same Pt loadings at
different RH (paper II). As stated in the previous section, low RH has a negative effect on
the ECSA, presumably caused by ionomer re-structuring. An interesting question to
investigate is whether this effect is also present using other types of ionomers. It can be
hypothesized that if the RH behavior of the ECSA of PSUgPVPA-based electrodes would
greatly differ from the observed behavior of the Nafion-based electrode, it could be a sign
that ionomer re-structuring might plays a more important role than the proton-conducting
capabilities of water.
Fig. 12a and b shows CV measurements for the Nafion-based and
optimized and pre-treated PSUgPVPA-based cathodes at different RH. At 100% RH, there
are only relatively small differences in ECSA, PtO-reduction charge and Cdl between these
two electrodes. As seen in Fig. 12a, decreasing the RH only has a small effect on the Nafion-
based electrode and only starts to decrease below 40% RH. In contrast, Fig. 12b shows that
the RH has a dramatic effect on the CV of the PSUgPVPA-based cathode, having a much
larger percentage decrease of the ECSA, Cdl, as well as the Pt-oxidation and PtO-reduction
charges compared to the Nafion-based cathode.
Fig. 12. Cyclic voltammetry of (a) Nafion-based and (b) PSUgPVPA-based cathodes at different RH.
Conditions: Pt load 0.1 mg cm-2, I/C 0.6, cell temperature 80 C, sweep-rate 100 mV s−1, gases N2 over
WE and 5% H2 in Ar over CE/RE, flow rates 20 mL min-1 at both WE and CE/RE.
This result suggests that the PSUgPVPA ionomer probably undergoes similar re-structuring
at low RH as was discussed for Nafion in the previous section. However, the implications
of this re-structuring are clearly much more severe for the PSUgPVPA ionomer.
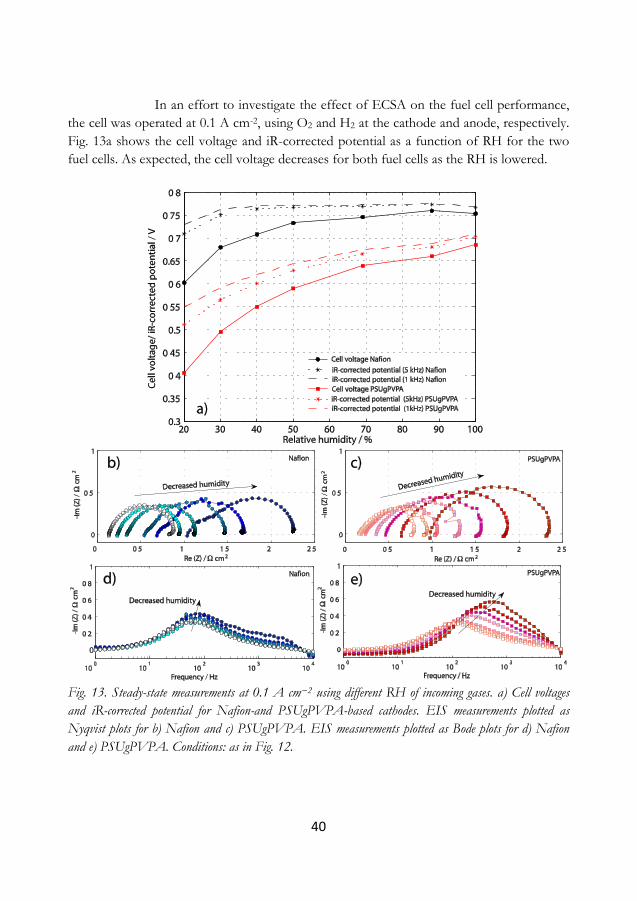
40
In an effort to investigate the effect of ECSA on the fuel cell performance,
the cell was operated at 0.1 A cm-2, using O2 and H2 at the cathode and anode, respectively.
Fig. 13a shows the cell voltage and iR-corrected potential as a function of RH for the two
fuel cells. As expected, the cell voltage decreases for both fuel cells as the RH is lowered.
Fig. 13. Steady-state measurements at 0.1 A cm−2 using different RH of incoming gases. a) Cell voltages
and iR-corrected potential for Nafion-and PSUgPVPA-based cathodes. EIS measurements plotted as
Nyqvist plots for b) Nafion and c) PSUgPVPA. EIS measurements plotted as Bode plots for d) Nafion
and e) PSUgPVPA. Conditions: as in Fig. 12.
41
Part of this performance decrease is attributed to an increase of the ohmic losses of the cell;
the membrane dehydrates, resulting in a higher cell resistance. This is more clearly seen
when the cell voltage is iR-corrected, e.g. using the Re(Z) at 5 kHz. In this case, the iR-
corrected potential of the Nafion-based electrode does not experience any considerable
decrease until 40% RH. The iR-corrected potential of the PSUgPVPA-based cathode, on the
other hand, shows that even when correcting for the iR-drop of the cell there is still a
dramatic loss of performance as the RH is decreased. In an effort to capture part of the
ionomer resistance, the cell voltage is instead corrected with the Re(Z) at 1 kHz. This clearly
improves the iR-corrected potential of the PSUgPVPA-based electrode. However, it does
not account for the entire voltage loss at low RH.
Fig. 13b and c show the corresponding EIS measurements plotted as
Nyquist plots and Fig. 13d and e show the Bode plot of the same measurements. The
diameter of the capacitive semi-circle of the Nyquist plots is commonly denoted as charge
transfer resistance and corresponds to the Tafel slope at this particular current density. Low
water content increases the magnitude of these semi-circles for both electrodes, attributed to
an increase in the ionomer resistance, affecting the current distribution in the electrodes
and/or a decreased proton activity, affecting the kinetics of the ORR. Nevertheless, this
increase is only slightly more pronounced for the PSUgPVPA-based cathode, from 0.74 Ω
cm2 to 1.3 Ω cm2, in comparison to 0.70 Ω cm2 to 1.19 Ω cm2 for the Nafion electrode,
suggesting similar ORR kinetics between electrodes.
A more significant difference in the impedance spectra is the shift in peak
frequency towards higher values using dry gases (Fig. 13d and e). This effect has been
proposed to be related to a decrease of the capacitance of the electrode [4,138], as well as a
higher partial pressure of oxygen. A lower capacitance is in turn a sign that less ionomer is in
contact with the Pt/C catalyst. It is therefore concluded that the large performance loss
observed for the PSUgPVPA-based cathode at low RH is mainly attributable to a lowering
of the activity of the fuel cell, caused by a lower amount of catalytic active sites. This
happens as the ionomer undergoes what has been suggested to be re-structuring of the
ionomer, losing contact with the catalyst.
5.3 Potentiostatic holds as ADT for carbon corrosion In the search for more durable supports it is crucial to have a fast, yet representative test to
screen for alternative materials. Additionally, the test ought to be designed to specifically
target the support, without degrading the other fuel cell components. Potentiostatic holds
are by far the most used ADT to study carbon stability [132]. However, how well this ADT
represents local fuel starvation conditions, such as SU/SD operation, is highly questionable.
Fig. 14 shows polarization curves and cyclic voltammetry of conventional
20 wt% Pt/Vulcan (BASF) cathodes subjected to two different ADTs for carbon corrosion.
The Fig. 14a shows CVs and polarization curves during an ADT consisting of a
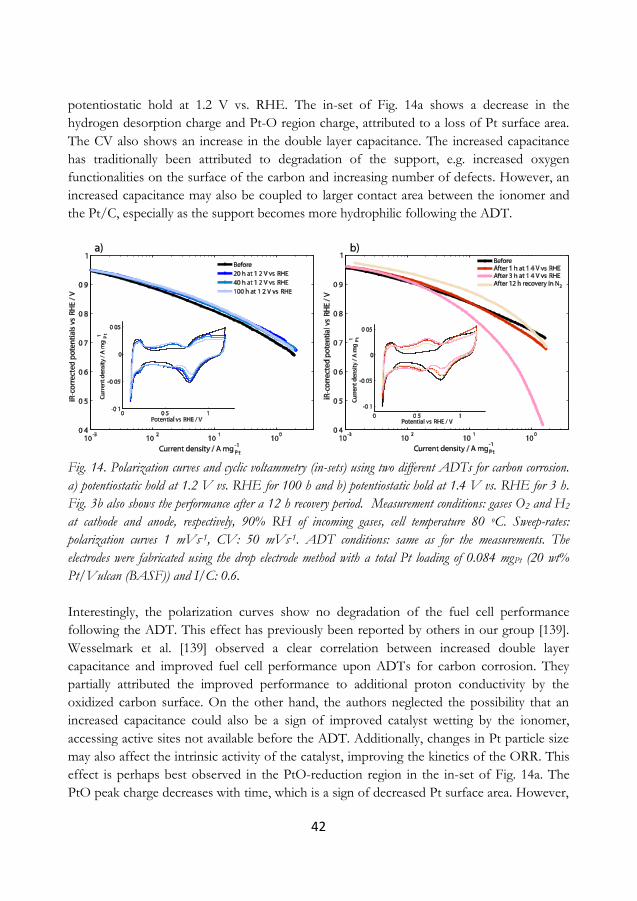
42
potentiostatic hold at 1.2 V vs. RHE. The in-set of Fig. 14a shows a decrease in the
hydrogen desorption charge and Pt-O region charge, attributed to a loss of Pt surface area.
The CV also shows an increase in the double layer capacitance. The increased capacitance
has traditionally been attributed to degradation of the support, e.g. increased oxygen
functionalities on the surface of the carbon and increasing number of defects. However, an
increased capacitance may also be coupled to larger contact area between the ionomer and
the Pt/C, especially as the support becomes more hydrophilic following the ADT.
Fig. 14. Polarization curves and cyclic voltammetry (in-sets) using two different ADTs for carbon corrosion.
a) potentiostatic hold at 1.2 V vs. RHE for 100 h and b) potentiostatic hold at 1.4 V vs. RHE for 3 h.
Fig. 3b also shows the performance after a 12 h recovery period. Measurement conditions: gases O2 and H2
at cathode and anode, respectively, 90% RH of incoming gases, cell temperature 80 oC. Sweep-rates:
polarization curves 1 mVs-1, CV: 50 mVs-1. ADT conditions: same as for the measurements. The
electrodes were fabricated using the drop electrode method with a total Pt loading of 0.084 mgPt (20 wt%
Pt/Vulcan (BASF)) and I/C: 0.6.
Interestingly, the polarization curves show no degradation of the fuel cell performance
following the ADT. This effect has previously been reported by others in our group [139].
Wesselmark et al. [139] observed a clear correlation between increased double layer
capacitance and improved fuel cell performance upon ADTs for carbon corrosion. They
partially attributed the improved performance to additional proton conductivity by the
oxidized carbon surface. On the other hand, the authors neglected the possibility that an
increased capacitance could also be a sign of improved catalyst wetting by the ionomer,
accessing active sites not available before the ADT. Additionally, changes in Pt particle size
may also affect the intrinsic activity of the catalyst, improving the kinetics of the ORR. This
effect is perhaps best observed in the PtO-reduction region in the in-set of Fig. 14a. The
PtO peak charge decreases with time, which is a sign of decreased Pt surface area. However,
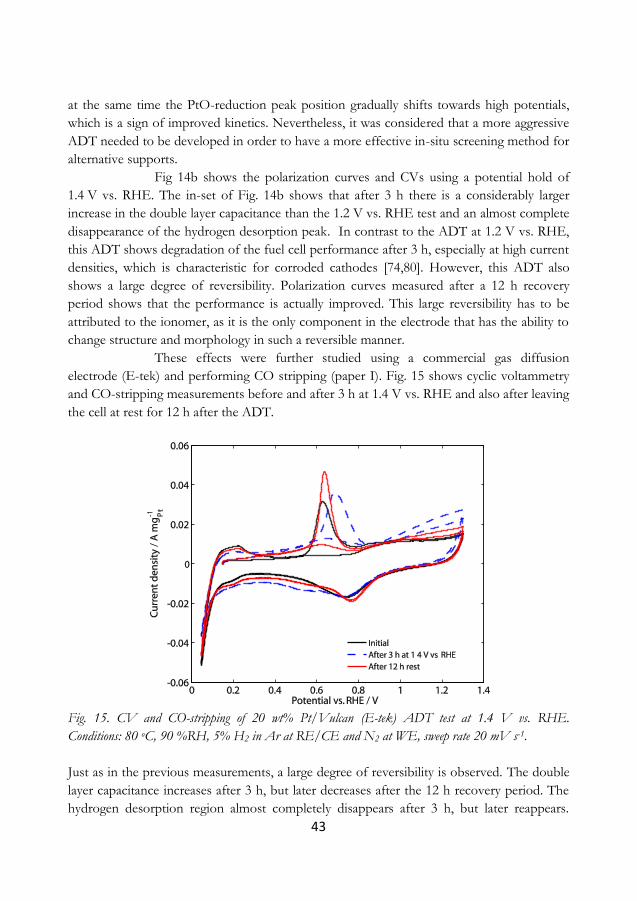
43
at the same time the PtO-reduction peak position gradually shifts towards high potentials,
which is a sign of improved kinetics. Nevertheless, it was considered that a more aggressive
ADT needed to be developed in order to have a more effective in-situ screening method for
alternative supports.
Fig 14b shows the polarization curves and CVs using a potential hold of
1.4 V vs. RHE. The in-set of Fig. 14b shows that after 3 h there is a considerably larger
increase in the double layer capacitance than the 1.2 V vs. RHE test and an almost complete
disappearance of the hydrogen desorption peak. In contrast to the ADT at 1.2 V vs. RHE,
this ADT shows degradation of the fuel cell performance after 3 h, especially at high current
densities, which is characteristic for corroded cathodes [74,80]. However, this ADT also
shows a large degree of reversibility. Polarization curves measured after a 12 h recovery
period shows that the performance is actually improved. This large reversibility has to be
attributed to the ionomer, as it is the only component in the electrode that has the ability to
change structure and morphology in such a reversible manner.
These effects were further studied using a commercial gas diffusion
electrode (E-tek) and performing CO stripping (paper I). Fig. 15 shows cyclic voltammetry
and CO-stripping measurements before and after 3 h at 1.4 V vs. RHE and also after leaving
the cell at rest for 12 h after the ADT.
Fig. 15. CV and CO-stripping of 20 wt% Pt/Vulcan (E-tek) ADT test at 1.4 V vs. RHE.
Conditions: 80 oC, 90 %RH, 5% H2 in Ar at RE/CE and N2 at WE, sweep rate 20 mV s-1.
Just as in the previous measurements, a large degree of reversibility is observed. The double
layer capacitance increases after 3 h, but later decreases after the 12 h recovery period. The
hydrogen desorption region almost completely disappears after 3 h, but later reappears.
44
Interestingly, the CO oxidation experience a 10 % decrease upon the ADT and does not
experience further changes after the 12 h recovery period. Apparently, the hydrogen
adsorption/desorption region is not able to account for this, as it is smeared out by the
changes in capacitance. On the other hand, the CO oxidation-peak position experiences a
considerable shift towards high potentials after the 3 h ADT and could be a sign that the
electrode has dried out, changing the local conditions between Pt and ionomer, analogous to
what was discussed in section 5.1. After the recovery period, the peak position returns to its
original position, interpreted as the electrode being re-humidified.
These results imply that ADTs consisting of high potentials for extended
periods may reduce the water content in the electrode and also change the surface properties
of both Pt and C, all of which may have a strong influence on the structure of the ionomer
and its interaction with the Pt/C catalyst [26,27]. It is further suggested that the ionomer
may experience some type of swelling during the ADT, which may in part explain the
reversible changes in performance loss at high current densities.
These findings motivated the use of yet another type of ADT for carbon
corrosion. Triangle-wave potential cycling was introduced as ADT, which not only simulates
the transient conditions encountered during SU/SD better than the potentiostatic hold, but
also introduces a recovery period between each high potential transient.
5.4 Screening for more durable carbons The durability of several intrinsically different carbon-supported Pt electrodes was studied
in-situ and compared to commercially available Pt/Vulcan XC-72 (BASF). The cathodes
were fabricated using the fast drop electrode technique having an approximate Pt loading of
0.1 ± 0.02 mg Pt. To compare the stability of the supports, the electrodes were degraded
applying 300 potential cycles between 0.6 and 1.5 V vs. RHE with a sweep rate of 40 mV s-1.
Fig. 16 shows polarization curves and CVs before and after the ADT. All
the cathodes showed an increase in double layer capacitance; as discussed in section 5.3 and
as seen in a few of the results in Fig. 16, it is apparent that an increased capacitance not
necessarily implies a decrease in fuel cell performance. Thus, to have a quantitative
measurement of carbon instability, CO2 emission should be measured on-line [45,61]. For
screening purposes, CVs and polarization curves are considered to be sufficiently good
characterization methods in order to evaluate the overall stability of the PEMFC cathode. In
the following paragraphs, a summary of the screening is presented.
Pt/GMWCNT - The impregnation method was used to deposit 20 wt% Pt
on the commercial GMWCNT resulting in an average Pt particle size of 3.1 nm (XRD). It
was difficult to make homogeneous catalytic inks out of the Pt/GMWCNT catalyst, which
could be related to their high degree of hydrophobicity.
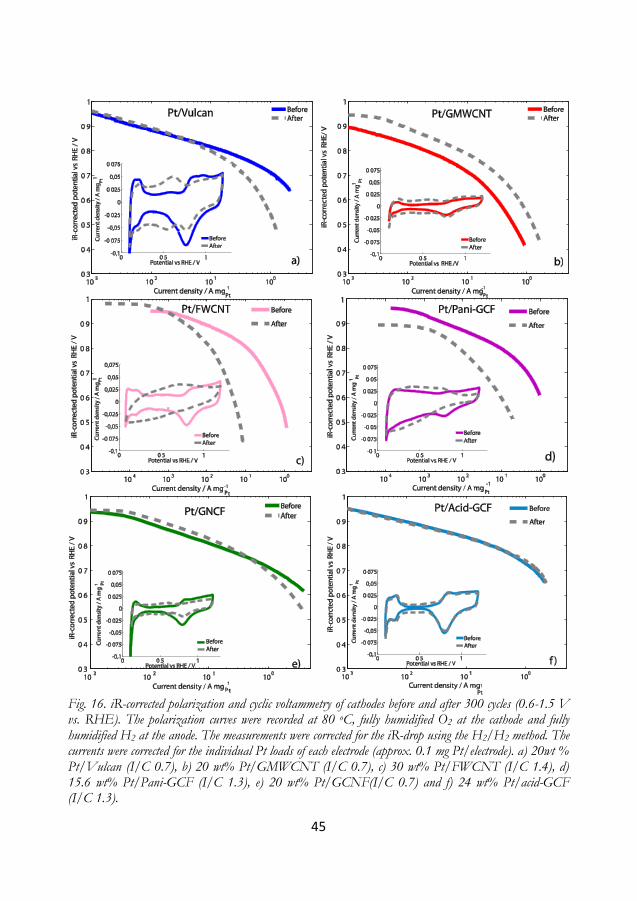
45
Fig. 16. iR-corrected polarization and cyclic voltammetry of cathodes before and after 300 cycles (0.6-1.5 V vs. RHE). The polarization curves were recorded at 80 oC, fully humidified O2 at the cathode and fully humidified H2 at the anode. The measurements were corrected for the iR-drop using the H2/H2 method. The currents were corrected for the individual Pt loads of each electrode (approx. 0.1 mg Pt/electrode). a) 20wt % Pt/Vulcan (I/C 0.7), b) 20 wt% Pt/GMWCNT (I/C 0.7), c) 30 wt% Pt/FWCNT (I/C 1.4), d) 15.6 wt% Pt/Pani-GCF (I/C 1.3), e) 20 wt% Pt/GCNF(I/C 0.7) and f) 24 wt% Pt/acid-GCF (I/C 1.3).
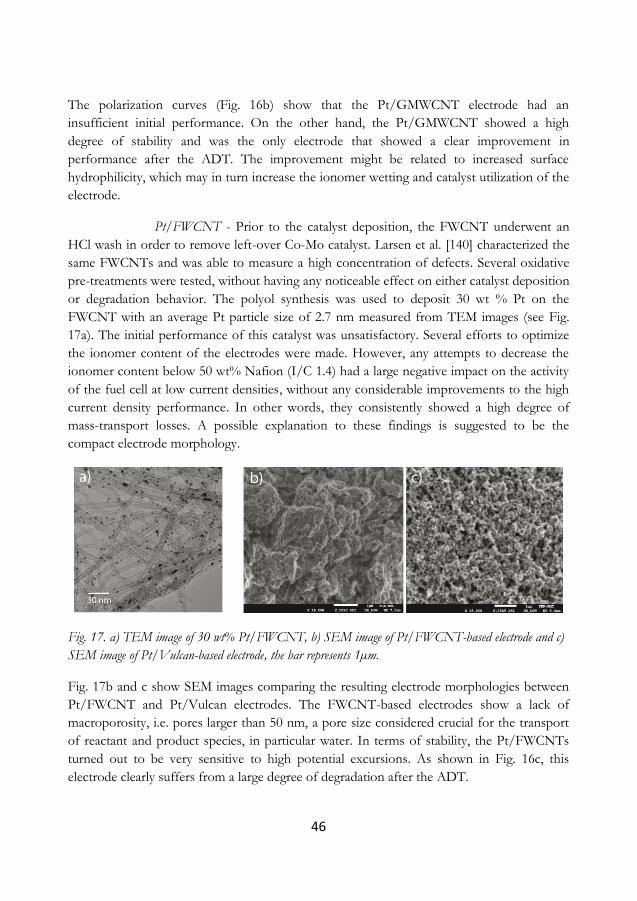
46
The polarization curves (Fig. 16b) show that the Pt/GMWCNT electrode had an
insufficient initial performance. On the other hand, the Pt/GMWCNT showed a high
degree of stability and was the only electrode that showed a clear improvement in
performance after the ADT. The improvement might be related to increased surface
hydrophilicity, which may in turn increase the ionomer wetting and catalyst utilization of the
electrode.
Pt/FWCNT - Prior to the catalyst deposition, the FWCNT underwent an
HCl wash in order to remove left-over Co-Mo catalyst. Larsen et al. [140] characterized the
same FWCNTs and was able to measure a high concentration of defects. Several oxidative
pre-treatments were tested, without having any noticeable effect on either catalyst deposition
or degradation behavior. The polyol synthesis was used to deposit 30 wt % Pt on the
FWCNT with an average Pt particle size of 2.7 nm measured from TEM images (see Fig.
17a). The initial performance of this catalyst was unsatisfactory. Several efforts to optimize
the ionomer content of the electrodes were made. However, any attempts to decrease the
ionomer content below 50 wt% Nafion (I/C 1.4) had a large negative impact on the activity
of the fuel cell at low current densities, without any considerable improvements to the high
current density performance. In other words, they consistently showed a high degree of
mass-transport losses. A possible explanation to these findings is suggested to be the
compact electrode morphology.
Fig. 17. a) TEM image of 30 wt% Pt/FWCNT, b) SEM image of Pt/FWCNT-based electrode and c)
SEM image of Pt/Vulcan-based electrode, the bar represents 1µm.
Fig. 17b and c show SEM images comparing the resulting electrode morphologies between
Pt/FWCNT and Pt/Vulcan electrodes. The FWCNT-based electrodes show a lack of
macroporosity, i.e. pores larger than 50 nm, a pore size considered crucial for the transport
of reactant and product species, in particular water. In terms of stability, the Pt/FWCNTs
turned out to be very sensitive to high potential excursions. As shown in Fig. 16c, this
electrode clearly suffers from a large degree of degradation after the ADT.
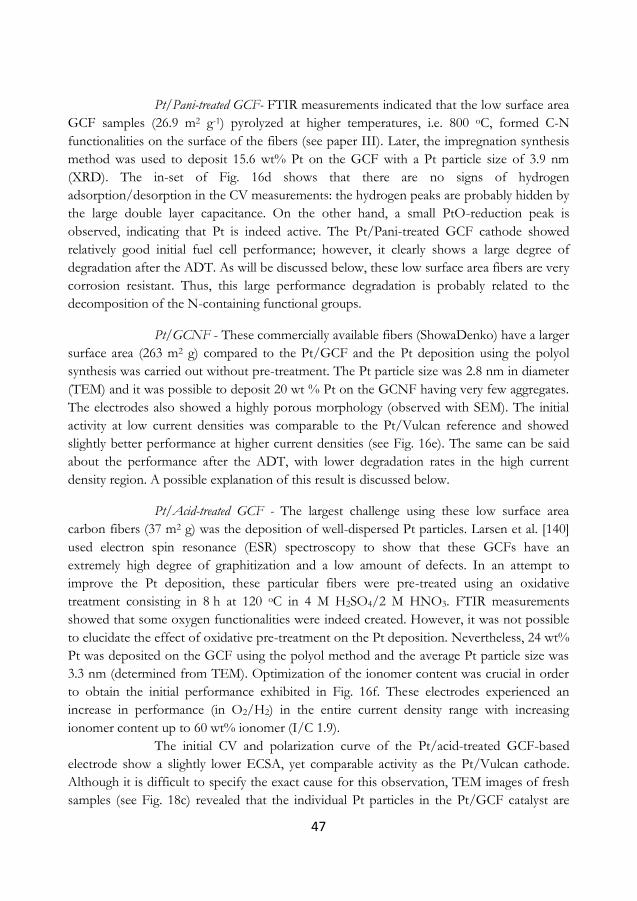
47
Pt/Pani-treated GCF- FTIR measurements indicated that the low surface area
GCF samples (26.9 m2 g-1) pyrolyzed at higher temperatures, i.e. 800 oC, formed C-N
functionalities on the surface of the fibers (see paper III). Later, the impregnation synthesis
method was used to deposit 15.6 wt% Pt on the GCF with a Pt particle size of 3.9 nm
(XRD). The in-set of Fig. 16d shows that there are no signs of hydrogen
adsorption/desorption in the CV measurements: the hydrogen peaks are probably hidden by
the large double layer capacitance. On the other hand, a small PtO-reduction peak is
observed, indicating that Pt is indeed active. The Pt/Pani-treated GCF cathode showed
relatively good initial fuel cell performance; however, it clearly shows a large degree of
degradation after the ADT. As will be discussed below, these low surface area fibers are very
corrosion resistant. Thus, this large performance degradation is probably related to the
decomposition of the N-containing functional groups.
Pt/GCNF - These commercially available fibers (ShowaDenko) have a larger
surface area (263 m2 g) compared to the Pt/GCF and the Pt deposition using the polyol
synthesis was carried out without pre-treatment. The Pt particle size was 2.8 nm in diameter
(TEM) and it was possible to deposit 20 wt % Pt on the GCNF having very few aggregates.
The electrodes also showed a highly porous morphology (observed with SEM). The initial
activity at low current densities was comparable to the Pt/Vulcan reference and showed
slightly better performance at higher current densities (see Fig. 16e). The same can be said
about the performance after the ADT, with lower degradation rates in the high current
density region. A possible explanation of this result is discussed below.
Pt/Acid-treated GCF - The largest challenge using these low surface area
carbon fibers (37 m2 g) was the deposition of well-dispersed Pt particles. Larsen et al. [140]
used electron spin resonance (ESR) spectroscopy to show that these GCFs have an
extremely high degree of graphitization and a low amount of defects. In an attempt to
improve the Pt deposition, these particular fibers were pre-treated using an oxidative
treatment consisting in 8 h at 120 oC in 4 M H2SO4/2 M HNO3. FTIR measurements
showed that some oxygen functionalities were indeed created. However, it was not possible
to elucidate the effect of oxidative pre-treatment on the Pt deposition. Nevertheless, 24 wt%
Pt was deposited on the GCF using the polyol method and the average Pt particle size was
3.3 nm (determined from TEM). Optimization of the ionomer content was crucial in order
to obtain the initial performance exhibited in Fig. 16f. These electrodes experienced an
increase in performance (in O2/H2) in the entire current density range with increasing
ionomer content up to 60 wt% ionomer (I/C 1.9).
The initial CV and polarization curve of the Pt/acid-treated GCF-based
electrode show a slightly lower ECSA, yet comparable activity as the Pt/Vulcan cathode.
Although it is difficult to specify the exact cause for this observation, TEM images of fresh
samples (see Fig. 18c) revealed that the individual Pt particles in the Pt/GCF catalyst are
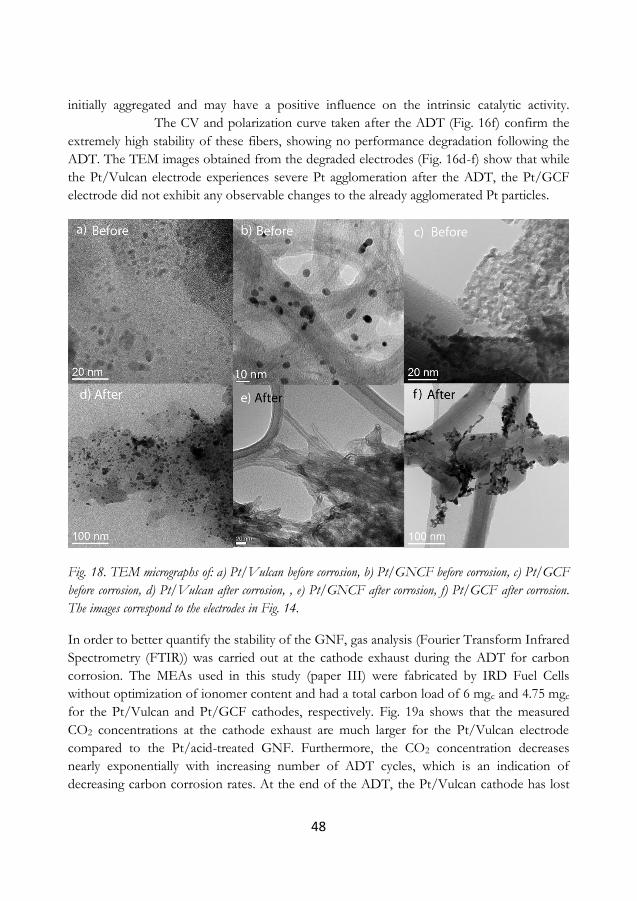
48
initially aggregated and may have a positive influence on the intrinsic catalytic activity.
The CV and polarization curve taken after the ADT (Fig. 16f) confirm the
extremely high stability of these fibers, showing no performance degradation following the
ADT. The TEM images obtained from the degraded electrodes (Fig. 16d-f) show that while
the Pt/Vulcan electrode experiences severe Pt agglomeration after the ADT, the Pt/GCF
electrode did not exhibit any observable changes to the already agglomerated Pt particles.
Fig. 18. TEM micrographs of: a) Pt/Vulcan before corrosion, b) Pt/GNCF before corrosion, c) Pt/GCF
before corrosion, d) Pt/Vulcan after corrosion, , e) Pt/GNCF after corrosion, f) Pt/GCF after corrosion.
The images correspond to the electrodes in Fig. 14.
In order to better quantify the stability of the GNF, gas analysis (Fourier Transform Infrared
Spectrometry (FTIR)) was carried out at the cathode exhaust during the ADT for carbon
corrosion. The MEAs used in this study (paper III) were fabricated by IRD Fuel Cells
without optimization of ionomer content and had a total carbon load of 6 mgc and 4.75 mgc
for the Pt/Vulcan and Pt/GCF cathodes, respectively. Fig. 19a shows that the measured
CO2 concentrations at the cathode exhaust are much larger for the Pt/Vulcan electrode
compared to the Pt/acid-treated GNF. Furthermore, the CO2 concentration decreases
nearly exponentially with increasing number of ADT cycles, which is an indication of
decreasing carbon corrosion rates. At the end of the ADT, the Pt/Vulcan cathode has lost
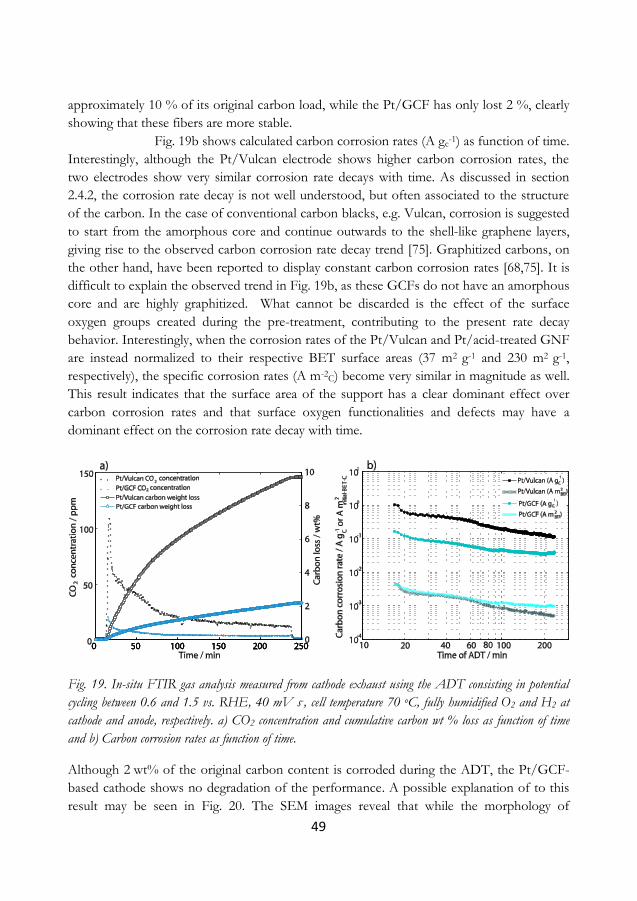
49
approximately 10 % of its original carbon load, while the Pt/GCF has only lost 2 %, clearly
showing that these fibers are more stable.
Fig. 19b shows calculated carbon corrosion rates (A gc-1) as function of time.
Interestingly, although the Pt/Vulcan electrode shows higher carbon corrosion rates, the
two electrodes show very similar corrosion rate decays with time. As discussed in section
2.4.2, the corrosion rate decay is not well understood, but often associated to the structure
of the carbon. In the case of conventional carbon blacks, e.g. Vulcan, corrosion is suggested
to start from the amorphous core and continue outwards to the shell-like graphene layers,
giving rise to the observed carbon corrosion rate decay trend [75]. Graphitized carbons, on
the other hand, have been reported to display constant carbon corrosion rates [68,75]. It is
difficult to explain the observed trend in Fig. 19b, as these GCFs do not have an amorphous
core and are highly graphitized. What cannot be discarded is the effect of the surface
oxygen groups created during the pre-treatment, contributing to the present rate decay
behavior. Interestingly, when the corrosion rates of the Pt/Vulcan and Pt/acid-treated GNF
are instead normalized to their respective BET surface areas (37 m2 g-1 and 230 m2 g-1,
respectively), the specific corrosion rates (A m-2C) become very similar in magnitude as well.
This result indicates that the surface area of the support has a clear dominant effect over
carbon corrosion rates and that surface oxygen functionalities and defects may have a
dominant effect on the corrosion rate decay with time.
Fig. 19. In-situ FTIR gas analysis measured from cathode exhaust using the ADT consisting in potential
cycling between 0.6 and 1.5 vs. RHE, 40 mV s-, cell temperature 70 oC, fully humidified O2 and H2 at
cathode and anode, respectively. a) CO2 concentration and cumulative carbon wt % loss as function of time
and b) Carbon corrosion rates as function of time.
Although 2 wt% of the original carbon content is corroded during the ADT, the Pt/GCF-
based cathode shows no degradation of the performance. A possible explanation of to this
result may be seen in Fig. 20. The SEM images reveal that while the morphology of
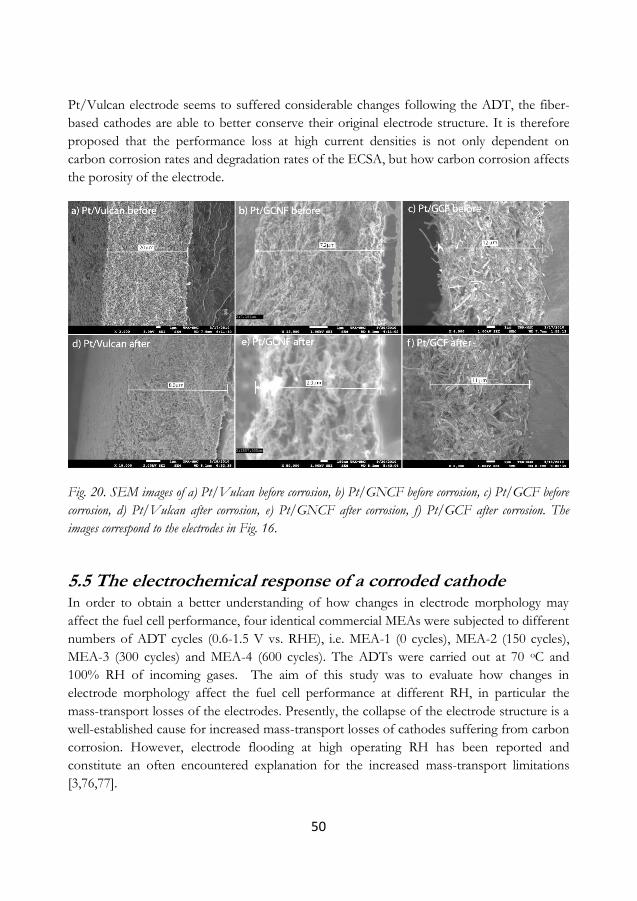
50
Pt/Vulcan electrode seems to suffered considerable changes following the ADT, the fiber-
based cathodes are able to better conserve their original electrode structure. It is therefore
proposed that the performance loss at high current densities is not only dependent on
carbon corrosion rates and degradation rates of the ECSA, but how carbon corrosion affects
the porosity of the electrode.
Fig. 20. SEM images of a) Pt/Vulcan before corrosion, b) Pt/GNCF before corrosion, c) Pt/GCF before
corrosion, d) Pt/Vulcan after corrosion, e) Pt/GNCF after corrosion, f) Pt/GCF after corrosion. The
images correspond to the electrodes in Fig. 16.
5.5 The electrochemical response of a corroded cathode In order to obtain a better understanding of how changes in electrode morphology may
affect the fuel cell performance, four identical commercial MEAs were subjected to different
numbers of ADT cycles (0.6-1.5 V vs. RHE), i.e. MEA-1 (0 cycles), MEA-2 (150 cycles),
MEA-3 (300 cycles) and MEA-4 (600 cycles). The ADTs were carried out at 70 oC and
100% RH of incoming gases. The aim of this study was to evaluate how changes in
electrode morphology affect the fuel cell performance at different RH, in particular the
mass-transport losses of the electrodes. Presently, the collapse of the electrode structure is a
well-established cause for increased mass-transport losses of cathodes suffering from carbon
corrosion. However, electrode flooding at high operating RH has been reported and
constitute an often encountered explanation for the increased mass-transport limitations
[3,76,77].
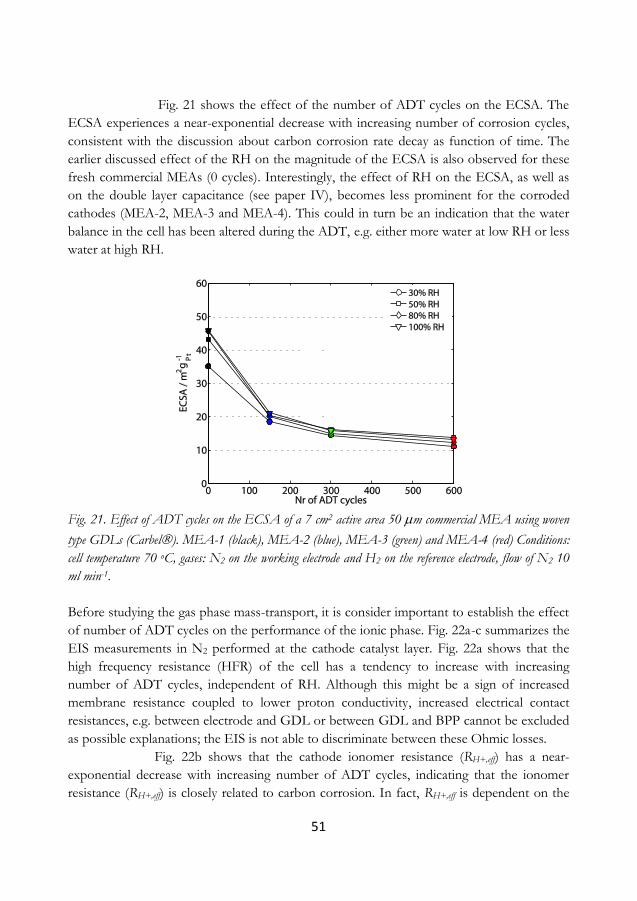
51
Fig. 21 shows the effect of the number of ADT cycles on the ECSA. The
ECSA experiences a near-exponential decrease with increasing number of corrosion cycles,
consistent with the discussion about carbon corrosion rate decay as function of time. The
earlier discussed effect of the RH on the magnitude of the ECSA is also observed for these
fresh commercial MEAs (0 cycles). Interestingly, the effect of RH on the ECSA, as well as
on the double layer capacitance (see paper IV), becomes less prominent for the corroded
cathodes (MEA-2, MEA-3 and MEA-4). This could in turn be an indication that the water
balance in the cell has been altered during the ADT, e.g. either more water at low RH or less
water at high RH.
Fig. 21. Effect of ADT cycles on the ECSA of a 7 cm2 active area 50 m commercial MEA using woven
type GDLs (Carbel). MEA-1 (black), MEA-2 (blue), MEA-3 (green) and MEA-4 (red) Conditions:
cell temperature 70 oC, gases: N2 on the working electrode and H2 on the reference electrode, flow of N2 10
ml min-1.
Before studying the gas phase mass-transport, it is consider important to establish the effect
of number of ADT cycles on the performance of the ionic phase. Fig. 22a-c summarizes the
EIS measurements in N2 performed at the cathode catalyst layer. Fig. 22a shows that the
high frequency resistance (HFR) of the cell has a tendency to increase with increasing
number of ADT cycles, independent of RH. Although this might be a sign of increased
membrane resistance coupled to lower proton conductivity, increased electrical contact
resistances, e.g. between electrode and GDL or between GDL and BPP cannot be excluded
as possible explanations; the EIS is not able to discriminate between these Ohmic losses.
Fig. 22b shows that the cathode ionomer resistance (RH+,eff) has a near-
exponential decrease with increasing number of ADT cycles, indicating that the ionomer
resistance (RH+,eff) is closely related to carbon corrosion. In fact, RH+,eff is dependent on the
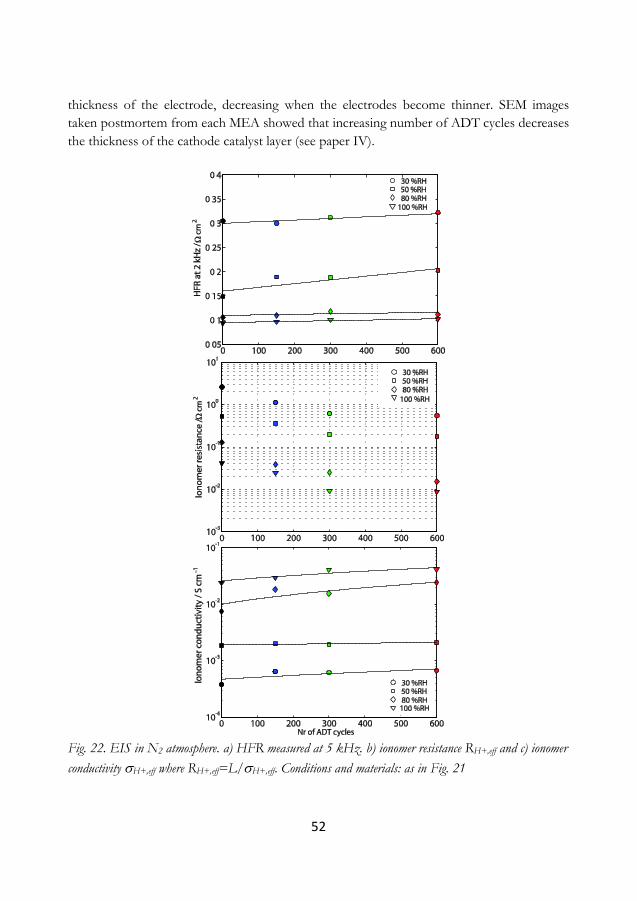
52
thickness of the electrode, decreasing when the electrodes become thinner. SEM images
taken postmortem from each MEA showed that increasing number of ADT cycles decreases
the thickness of the cathode catalyst layer (see paper IV).
Fig. 22. EIS in N2 atmosphere. a) HFR measured at 5 kHz. b) ionomer resistance RH+,eff and c) ionomer
conductivity H+,eff where RH+,eff=L/H+,eff. Conditions and materials: as in Fig. 21
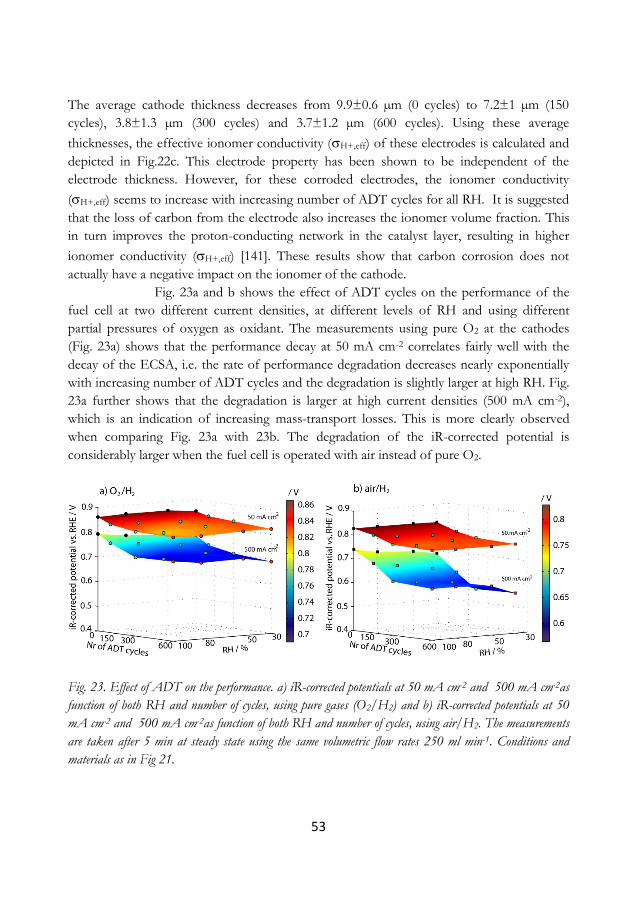
53
The average cathode thickness decreases from 9.9±0.6 µm (0 cycles) to 7.2±1 µm (150
cycles), 3.8±1.3 µm (300 cycles) and 3.7±1.2 µm (600 cycles). Using these average
thicknesses, the effective ionomer conductivity (H+,eff) of these electrodes is calculated and
depicted in Fig.22c. This electrode property has been shown to be independent of the
electrode thickness. However, for these corroded electrodes, the ionomer conductivity
(H+,eff) seems to increase with increasing number of ADT cycles for all RH. It is suggested
that the loss of carbon from the electrode also increases the ionomer volume fraction. This
in turn improves the proton-conducting network in the catalyst layer, resulting in higher
ionomer conductivity (H+,eff) [141]. These results show that carbon corrosion does not
actually have a negative impact on the ionomer of the cathode.
Fig. 23a and b shows the effect of ADT cycles on the performance of the
fuel cell at two different current densities, at different levels of RH and using different
partial pressures of oxygen as oxidant. The measurements using pure O2 at the cathodes
(Fig. 23a) shows that the performance decay at 50 mA cm-2 correlates fairly well with the
decay of the ECSA, i.e. the rate of performance degradation decreases nearly exponentially
with increasing number of ADT cycles and the degradation is slightly larger at high RH. Fig.
23a further shows that the degradation is larger at high current densities (500 mA cm-2),
which is an indication of increasing mass-transport losses. This is more clearly observed
when comparing Fig. 23a with 23b. The degradation of the iR-corrected potential is
considerably larger when the fuel cell is operated with air instead of pure O2.
Fig. 23. Effect of ADT on the performance. a) iR-corrected potentials at 50 mA cm-2 and 500 mA cm-2as
function of both RH and number of cycles, using pure gases (O2/H2) and b) iR-corrected potentials at 50
mA cm-2 and 500 mA cm-2as function of both RH and number of cycles, using air/H2. The measurements
are taken after 5 min at steady state using the same volumetric flow rates 250 ml min-1. Conditions and
materials as in Fig 21.
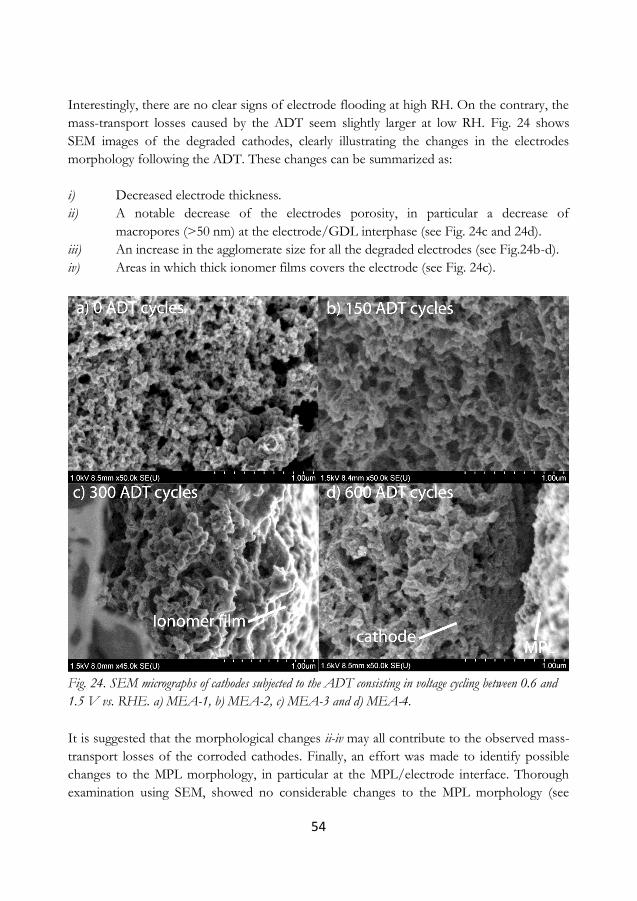
54
Interestingly, there are no clear signs of electrode flooding at high RH. On the contrary, the
mass-transport losses caused by the ADT seem slightly larger at low RH. Fig. 24 shows
SEM images of the degraded cathodes, clearly illustrating the changes in the electrodes
morphology following the ADT. These changes can be summarized as:
i) Decreased electrode thickness.
ii) A notable decrease of the electrodes porosity, in particular a decrease of
macropores (>50 nm) at the electrode/GDL interphase (see Fig. 24c and 24d).
iii) An increase in the agglomerate size for all the degraded electrodes (see Fig.24b-d).
iv) Areas in which thick ionomer films covers the electrode (see Fig. 24c).
Fig. 24. SEM micrographs of cathodes subjected to the ADT consisting in voltage cycling between 0.6 and
1.5 V vs. RHE. a) MEA-1, b) MEA-2, c) MEA-3 and d) MEA-4.
It is suggested that the morphological changes ii-iv may all contribute to the observed mass-
transport losses of the corroded cathodes. Finally, an effort was made to identify possible
changes to the MPL morphology, in particular at the MPL/electrode interface. Thorough
examination using SEM, showed no considerable changes to the MPL morphology (see
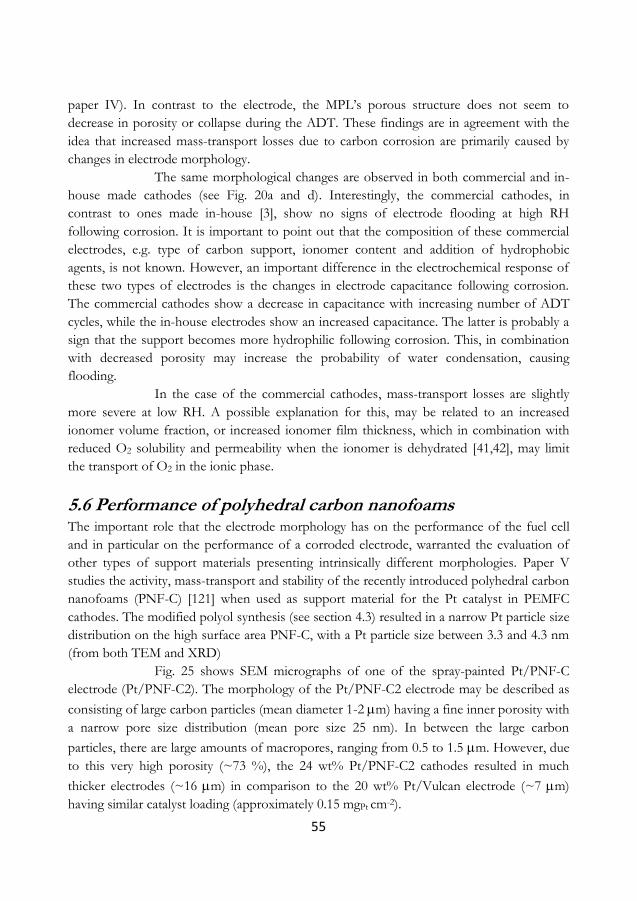
55
paper IV). In contrast to the electrode, the MPL’s porous structure does not seem to
decrease in porosity or collapse during the ADT. These findings are in agreement with the
idea that increased mass-transport losses due to carbon corrosion are primarily caused by
changes in electrode morphology.
The same morphological changes are observed in both commercial and in-
house made cathodes (see Fig. 20a and d). Interestingly, the commercial cathodes, in
contrast to ones made in-house [3], show no signs of electrode flooding at high RH
following corrosion. It is important to point out that the composition of these commercial
electrodes, e.g. type of carbon support, ionomer content and addition of hydrophobic
agents, is not known. However, an important difference in the electrochemical response of
these two types of electrodes is the changes in electrode capacitance following corrosion.
The commercial cathodes show a decrease in capacitance with increasing number of ADT
cycles, while the in-house electrodes show an increased capacitance. The latter is probably a
sign that the support becomes more hydrophilic following corrosion. This, in combination
with decreased porosity may increase the probability of water condensation, causing
flooding.
In the case of the commercial cathodes, mass-transport losses are slightly
more severe at low RH. A possible explanation for this, may be related to an increased
ionomer volume fraction, or increased ionomer film thickness, which in combination with
reduced O2 solubility and permeability when the ionomer is dehydrated [41,42], may limit
the transport of O2 in the ionic phase.
5.6 Performance of polyhedral carbon nanofoams The important role that the electrode morphology has on the performance of the fuel cell
and in particular on the performance of a corroded electrode, warranted the evaluation of
other types of support materials presenting intrinsically different morphologies. Paper V
studies the activity, mass-transport and stability of the recently introduced polyhedral carbon
nanofoams (PNF-C) [121] when used as support material for the Pt catalyst in PEMFC
cathodes. The modified polyol synthesis (see section 4.3) resulted in a narrow Pt particle size
distribution on the high surface area PNF-C, with a Pt particle size between 3.3 and 4.3 nm
(from both TEM and XRD)
Fig. 25 shows SEM micrographs of one of the spray-painted Pt/PNF-C
electrode (Pt/PNF-C2). The morphology of the Pt/PNF-C2 electrode may be described as
consisting of large carbon particles (mean diameter 1-2 m) having a fine inner porosity with
a narrow pore size distribution (mean pore size 25 nm). In between the large carbon
particles, there are large amounts of macropores, ranging from 0.5 to 1.5 m. However, due
to this very high porosity (~73 %), the 24 wt% Pt/PNF-C2 cathodes resulted in much
thicker electrodes (~16 m) in comparison to the 20 wt% Pt/Vulcan electrode (~7 m)
having similar catalyst loading (approximately 0.15 mgPt cm-2).
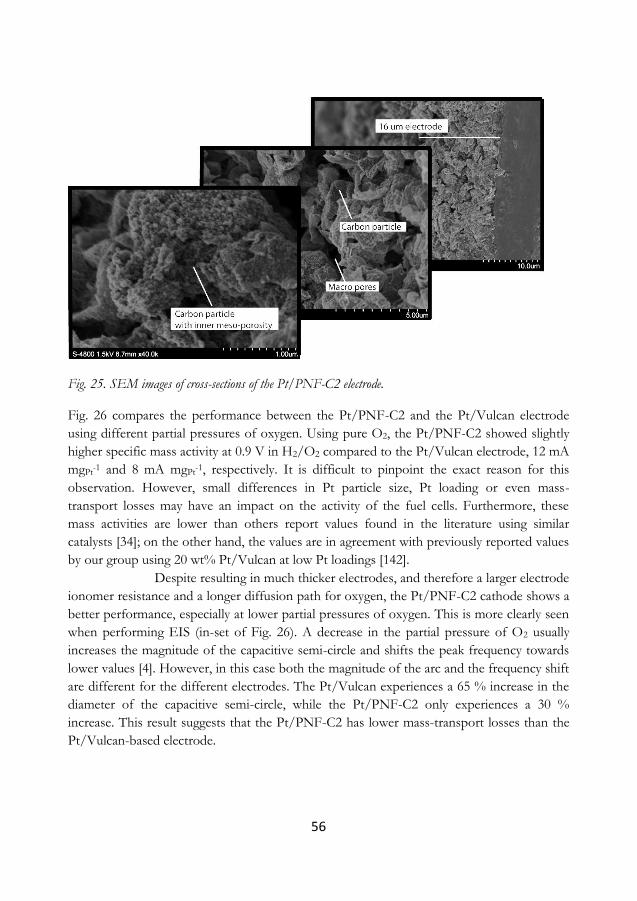
56
Fig. 25. SEM images of cross-sections of the Pt/PNF-C2 electrode.
Fig. 26 compares the performance between the Pt/PNF-C2 and the Pt/Vulcan electrode
using different partial pressures of oxygen. Using pure O2, the Pt/PNF-C2 showed slightly
higher specific mass activity at 0.9 V in H2/O2 compared to the Pt/Vulcan electrode, 12 mA
mgPt-1 and 8 mA mgPt
-1, respectively. It is difficult to pinpoint the exact reason for this
observation. However, small differences in Pt particle size, Pt loading or even mass-
transport losses may have an impact on the activity of the fuel cells. Furthermore, these
mass activities are lower than others report values found in the literature using similar
catalysts [34]; on the other hand, the values are in agreement with previously reported values
by our group using 20 wt% Pt/Vulcan at low Pt loadings [142].
Despite resulting in much thicker electrodes, and therefore a larger electrode
ionomer resistance and a longer diffusion path for oxygen, the Pt/PNF-C2 cathode shows a
better performance, especially at lower partial pressures of oxygen. This is more clearly seen
when performing EIS (in-set of Fig. 26). A decrease in the partial pressure of O2 usually
increases the magnitude of the capacitive semi-circle and shifts the peak frequency towards
lower values [4]. However, in this case both the magnitude of the arc and the frequency shift
are different for the different electrodes. The Pt/Vulcan experiences a 65 % increase in the
diameter of the capacitive semi-circle, while the Pt/PNF-C2 only experiences a 30 %
increase. This result suggests that the Pt/PNF-C2 has lower mass-transport losses than the
Pt/Vulcan-based electrode.
57
Fig. 26. iR-corrected polarization curves using either O2 or air at the cathode. Flow rates of 120 ml min-1
H2 and 60 ml min-1 (O2 or air) at the anode and cathode, respectively. Cell temperature: 80 oC, 100 %RH
and sweep rate 1 mV s-1. The in-sets show galvanostatic EIS at idc=0.2 A cm-2 with frequency ranging
between 100 kHz and 100 mHz and an amplitude of 10 mA. a) 20 wt% Pt/Vulcan, loading: 0.146
mgPt, area: 1 cm2, b) 24wt% Pt/PNF-C2, loading: 0.148 mgPt, area: 1 cm2.
It was hypothesized that the particular electrode morphology shown by the Pt/PNF-C2
cathode could present an advantage with respect to carbon corrosion durability. Despite
having larger BET surface area, there were hopes that the electrode would not collapse in
the same manner as previously seen for the Pt/Vulcan-based electrodes. The stability of the
Pt/PNF-C2 cathode was evaluated by sweeping the potential of the cell 300 times between
0.6 and 1.5 V.
Both the Pt/PNF-C2 and the Pt/Vulcan cathodes suffer from a high degree
of Pt surface area loss. Between 60 % and 70 % of the ECSA is lost for both these cathodes
following the ADT (see paper V). Fig 27 shows the loss of performance of these fuel cells at
200 mA cm-2 using different partial pressures of oxygen. As expected, the performance
degradation using pure O2 is not only small, but also comparable between the two cathodes.
However, when the voltage loss is evaluated using air instead of pure O2, clear differences
are observed. Unfortunately, the mass-transport losses of the Pt/PNF-C2 cathode are more
severely affected by the ADT.
The in-set of Fig. 27 may partially explain the large loss in H2/air
performance experienced by the Pt/PNF-C2. It seems as the large carbon particles (1-2 m)
have a tendency to lose their inner mesoporosity (25 nm pores). The pore structure of these
carbon particles either collapses or becomes covered by the Nafion ionomer, resulting in
higher mass-transport losses. Further studies, e.g. measurements of carbon corrosion rates,
are needed to have a more complete evaluation of the stability of these materials.
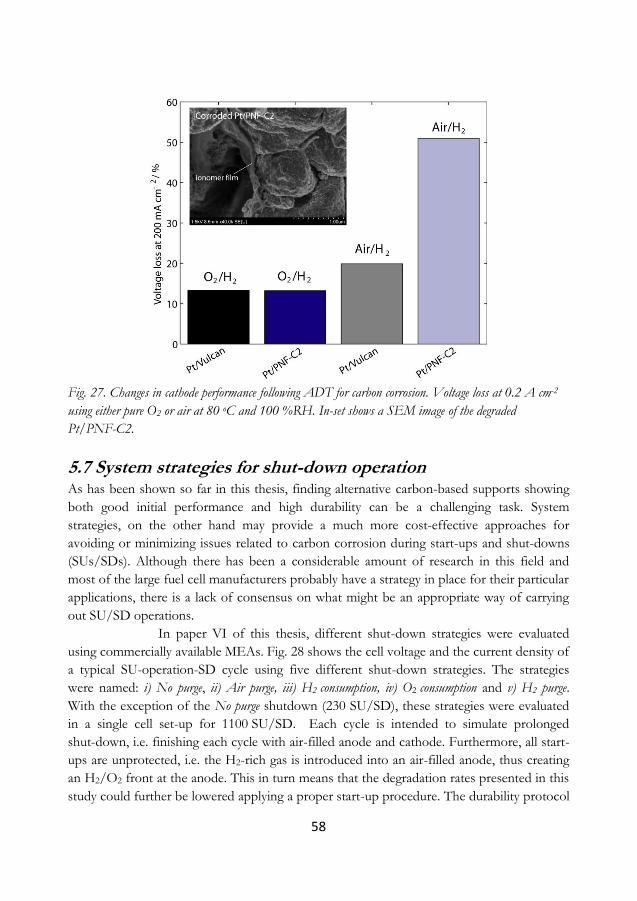
58
Fig. 27. Changes in cathode performance following ADT for carbon corrosion. Voltage loss at 0.2 A cm-2
using either pure O2 or air at 80 oC and 100 %RH. In-set shows a SEM image of the degraded
Pt/PNF-C2.
5.7 System strategies for shut-down operation As has been shown so far in this thesis, finding alternative carbon-based supports showing
both good initial performance and high durability can be a challenging task. System
strategies, on the other hand may provide a much more cost-effective approaches for
avoiding or minimizing issues related to carbon corrosion during start-ups and shut-downs
(SUs/SDs). Although there has been a considerable amount of research in this field and
most of the large fuel cell manufacturers probably have a strategy in place for their particular
applications, there is a lack of consensus on what might be an appropriate way of carrying
out SU/SD operations.
In paper VI of this thesis, different shut-down strategies were evaluated
using commercially available MEAs. Fig. 28 shows the cell voltage and the current density of
a typical SU-operation-SD cycle using five different shut-down strategies. The strategies
were named: i) No purge, ii) Air purge, iii) H2 consumption, iv) O2 consumption and v) H2 purge.
With the exception of the No purge shutdown (230 SU/SD), these strategies were evaluated
in a single cell set-up for 1100 SU/SD. Each cycle is intended to simulate prolonged
shut-down, i.e. finishing each cycle with air-filled anode and cathode. Furthermore, all start-
ups are unprotected, i.e. the H2-rich gas is introduced into an air-filled anode, thus creating
an H2/O2 front at the anode. This in turn means that the degradation rates presented in this
study could further be lowered applying a proper start-up procedure. The durability protocol

59
further included normal fuel cell operation in each cycle, in which the current density is
cycled between 0 and 0.5 A cm-2. In order to separate the SU/SD degradation rates from
current cycling degradation rates, an additional test, including exclusively current cycling
(0-0.5 A cm-2) was carried out (no SU/SD).
Fig. 28. Cell voltage and current density during a typical start-up/operation/shut-down cycle using: a) No purge, b) Air purge, c) H2 consumption, d) O2 consumption and e) H2 purge. Conditions: cell temperature 70 oC, fue:l synthetic reformate, oxidant: air, RH: 80 %.
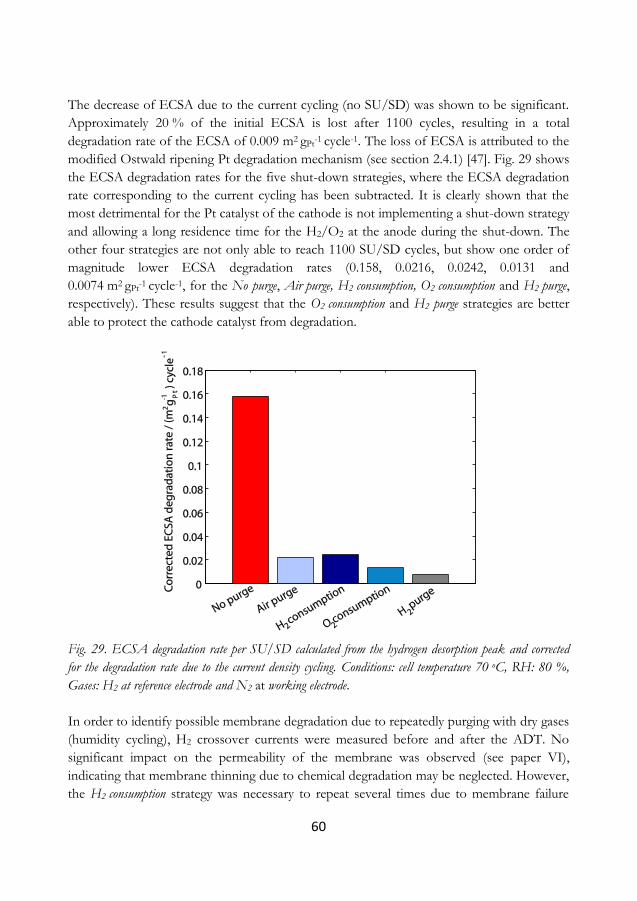
60
The decrease of ECSA due to the current cycling (no SU/SD) was shown to be significant.
Approximately 20 % of the initial ECSA is lost after 1100 cycles, resulting in a total
degradation rate of the ECSA of 0.009 m2 gPt-1
cycle-1. The loss of ECSA is attributed to the
modified Ostwald ripening Pt degradation mechanism (see section 2.4.1) [47]. Fig. 29 shows
the ECSA degradation rates for the five shut-down strategies, where the ECSA degradation
rate corresponding to the current cycling has been subtracted. It is clearly shown that the
most detrimental for the Pt catalyst of the cathode is not implementing a shut-down strategy
and allowing a long residence time for the H2/O2 at the anode during the shut-down. The
other four strategies are not only able to reach 1100 SU/SD cycles, but show one order of
magnitude lower ECSA degradation rates (0.158, 0.0216, 0.0242, 0.0131 and
0.0074 m2 gPt-1
cycle-1, for the No purge, Air purge, H2 consumption, O2 consumption and H2 purge,
respectively). These results suggest that the O2 consumption and H2 purge strategies are better
able to protect the cathode catalyst from degradation.
Fig. 29. ECSA degradation rate per SU/SD calculated from the hydrogen desorption peak and corrected
for the degradation rate due to the current density cycling. Conditions: cell temperature 70 oC, RH: 80 %,
Gases: H2 at reference electrode and N2 at working electrode.
In order to identify possible membrane degradation due to repeatedly purging with dry gases
(humidity cycling), H2 crossover currents were measured before and after the ADT. No
significant impact on the permeability of the membrane was observed (see paper VI),
indicating that membrane thinning due to chemical degradation may be neglected. However,
the H2 consumption strategy was necessary to repeat several times due to membrane failure
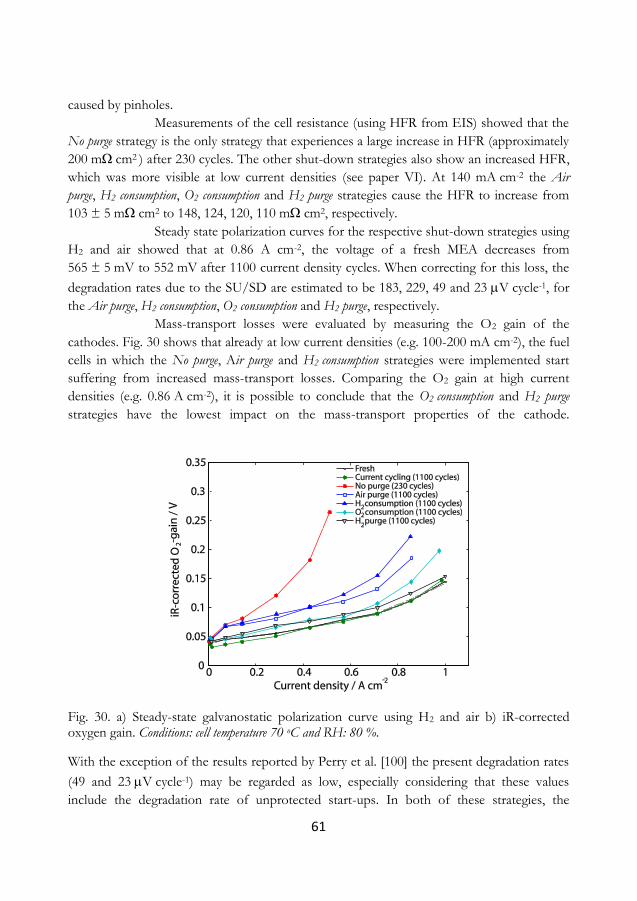
61
caused by pinholes.
Measurements of the cell resistance (using HFR from EIS) showed that the
No purge strategy is the only strategy that experiences a large increase in HFR (approximately
200 mΩ cm2 ) after 230 cycles. The other shut-down strategies also show an increased HFR,
which was more visible at low current densities (see paper VI). At 140 mA cm-2 the Air
purge, H2 consumption, O2 consumption and H2 purge strategies cause the HFR to increase from
103 ± 5 mΩ cm2 to 148, 124, 120, 110 mΩ cm2, respectively.
Steady state polarization curves for the respective shut-down strategies using
H2 and air showed that at 0.86 A cm-2, the voltage of a fresh MEA decreases from
565 ± 5 mV to 552 mV after 1100 current density cycles. When correcting for this loss, the
degradation rates due to the SU/SD are estimated to be 183, 229, 49 and 23 V cycle-1, for
the Air purge, H2 consumption, O2 consumption and H2 purge, respectively.
Mass-transport losses were evaluated by measuring the O2 gain of the
cathodes. Fig. 30 shows that already at low current densities (e.g. 100-200 mA cm-2), the fuel
cells in which the No purge, Air purge and H2 consumption strategies were implemented start
suffering from increased mass-transport losses. Comparing the O2 gain at high current
densities (e.g. 0.86 A cm-2), it is possible to conclude that the O2 consumption and H2 purge
strategies have the lowest impact on the mass-transport properties of the cathode.
Fig. 30. a) Steady-state galvanostatic polarization curve using H2 and air b) iR-corrected oxygen gain. Conditions: cell temperature 70 oC and RH: 80 %.
With the exception of the results reported by Perry et al. [100] the present degradation rates
(49 and 23 V cycle-1) may be regarded as low, especially considering that these values
include the degradation rate of unprotected start-ups. In both of these strategies, the
62
cathode is protected from high electrode potentials by H2. In the case of O2 consumption, the
hydrogen at the cathode comes from H2 crossover, which may result in incomplete
protection. In the case of the H2 purge, the protection from high electrode potential is
believed to be more complete.
5.8 In-situ contact resistance of BPPs The evaluation of new metallic BPP materials is usually carried out in terms of both
corrosion resistance and contact resistance, primarily using ex-situ methods. The
ultimate test is of course to assemble a fuel cell stack using the specific BPPs and
operate it for thousands of hours. This is on the other hand costly and time consuming.
It has also been noticed that when different types of BPPs are compared in real fuel cell
operation, the previously measured ex-situ contact resistance values do not always
correlate with the differences in fuel cell performance [142,144,145]. The in-situ
evaluation of new BPP becomes even more complicated if degradation of the fuel cell
performance starts to occur. This is because standard electrochemical methods used to
measure the total ohmic resistance of the cell, e.g. EIS, are unable to distinguish and
separate changes in contact resistance between GDL and BPP from all the other ohmic
losses in the fuel cell, i.e. membrane resistance, electronic resistance in electrode and
GDL and, as mentioned earlier, the contact resistance between electrode and GDL.
Fig. 31 shows a typical ex-situ measurement of contact resistance as
function of the clamping pressure using graphite, uncoated stainless steel 316L or gold-
coated 316L BPPs. An increase in clamping pressure deforms the GDL and creates an
increasing number of contact points between the two materials, resulting in a decrease
of the contact resistance. Fig. 31 also illustrates how crucial the effective contact area
between BPP and GDL is for the magnitude of the contact resistance, especially when
using poorly conductive materials, such as uncoated 316L. It can therefore be predicted
that when using uncoated 316 L, slight changes in the number of contact points
between these two components may result in large variations of the contact resistance.
In paper VII of this thesis it is argued that different operating conditions, e.g.
temperature, RH or the presence of liquid water affects the contact resistance between
GDL and BPP. However, the magnitude of these changes depends on the type of BPP
material and the initial clamping pressure. High temperature has a positive effect on the
contact resistance. This is related to thermal expansion of the fuel cell components
upon heating, which in turn leads to the compression of the GDL and a decreased
contact resistance. Increased relative humidity of incoming gases also has a positive
effect on the contact resistance.
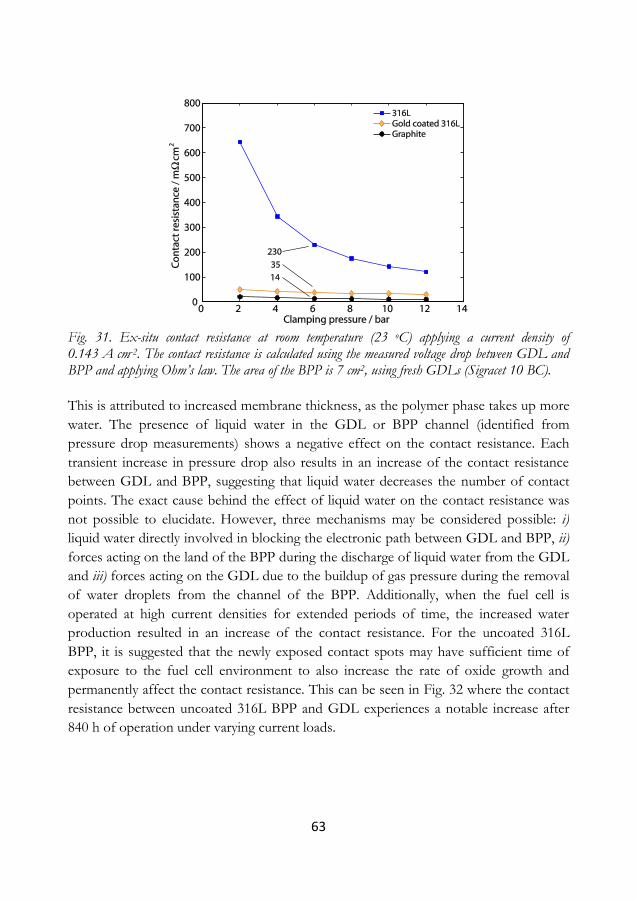
63
Fig. 31. Ex-situ contact resistance at room temperature (23 oC) applying a current density of 0.143 A cm-2. The contact resistance is calculated using the measured voltage drop between GDL and BPP and applying Ohm’s law. The area of the BPP is 7 cm2, using fresh GDLs (Sigracet 10 BC).
This is attributed to increased membrane thickness, as the polymer phase takes up more
water. The presence of liquid water in the GDL or BPP channel (identified from
pressure drop measurements) shows a negative effect on the contact resistance. Each
transient increase in pressure drop also results in an increase of the contact resistance
between GDL and BPP, suggesting that liquid water decreases the number of contact
points. The exact cause behind the effect of liquid water on the contact resistance was
not possible to elucidate. However, three mechanisms may be considered possible: i)
liquid water directly involved in blocking the electronic path between GDL and BPP, ii)
forces acting on the land of the BPP during the discharge of liquid water from the GDL
and iii) forces acting on the GDL due to the buildup of gas pressure during the removal
of water droplets from the channel of the BPP. Additionally, when the fuel cell is
operated at high current densities for extended periods of time, the increased water
production resulted in an increase of the contact resistance. For the uncoated 316L
BPP, it is suggested that the newly exposed contact spots may have sufficient time of
exposure to the fuel cell environment to also increase the rate of oxide growth and
permanently affect the contact resistance. This can be seen in Fig. 32 where the contact
resistance between uncoated 316L BPP and GDL experiences a notable increase after
840 h of operation under varying current loads.
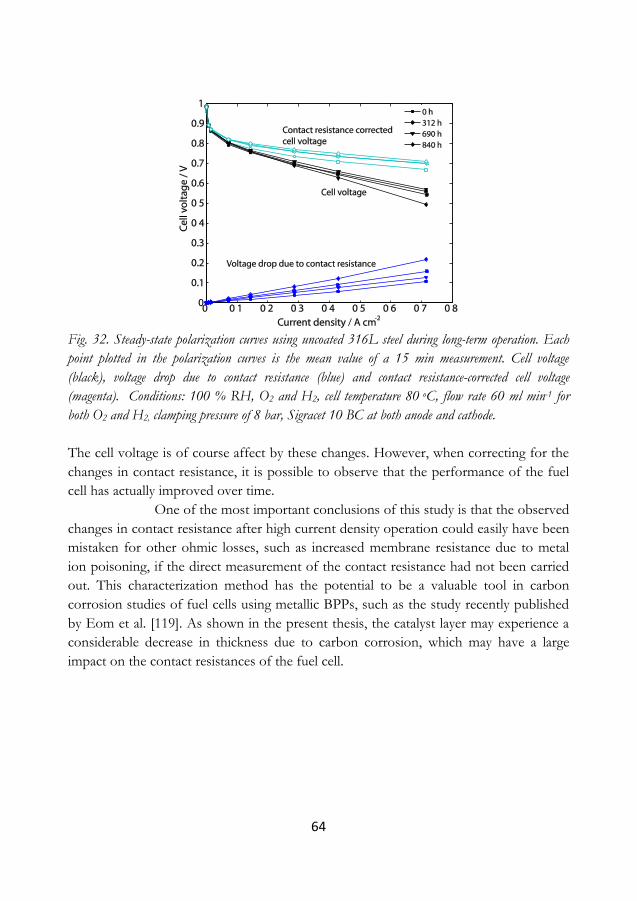
64
Fig. 32. Steady-state polarization curves using uncoated 316L steel during long-term operation. Each
point plotted in the polarization curves is the mean value of a 15 min measurement. Cell voltage
(black), voltage drop due to contact resistance (blue) and contact resistance-corrected cell voltage
(magenta). Conditions: 100 % RH, O2 and H2, cell temperature 80 oC, flow rate 60 ml min-1 for
both O2 and H2, clamping pressure of 8 bar, Sigracet 10 BC at both anode and cathode.
The cell voltage is of course affect by these changes. However, when correcting for the
changes in contact resistance, it is possible to observe that the performance of the fuel
cell has actually improved over time.
One of the most important conclusions of this study is that the observed
changes in contact resistance after high current density operation could easily have been
mistaken for other ohmic losses, such as increased membrane resistance due to metal
ion poisoning, if the direct measurement of the contact resistance had not been carried
out. This characterization method has the potential to be a valuable tool in carbon
corrosion studies of fuel cells using metallic BPPs, such as the study recently published
by Eom et al. [119]. As shown in the present thesis, the catalyst layer may experience a
considerable decrease in thickness due to carbon corrosion, which may have a large
impact on the contact resistances of the fuel cell.
65
Chapter 6
Conclusions and outlook
6.1 Conclusions
6.1.1 Effect of RH on the ECSA The proton-conducting phase (membrane and ionomer) in PEMFCs is highly dependent on
water in order to have high proton conductivity. It is also well known that Nafion-based
membranes change thickness and structure depending on the water content. Therefore, the
same is assumed for the ionomer in the electrodes. Additionally, for thin ionomer films in
contact with a substrate, their thickness, morphology and interaction with the surface may
also be dependent on the nature of the substrate, e.g. if the substrate is hydrophobic or
hydrophilic.
In this thesis, we have shown that the ECSA of Pt/C electrodes changes
with water content in the electrode (see sections 5.1, 5.2 and 5.5). Although the loss of
ECSA at low RH was observed using cyclic voltammetry and integrating the hydrogen
desorption peak, the ECSA measured in this way may be underestimated due to the
interference of H2 evolution current. Therefore, CO stripping, which is not affected by H2
evolution, may provide a more accurate measure of the ECSA. Alternatively, low or zero N2
flow may be used in the case of using the hydrogen desorption peak.
The effect of RH on the ECSA and capacitance has in this thesis mainly
been attributed to ionomer re-structuring, causing the loss of contact between ionomer and
Pt/C at low RH. However, it may be argued that the ECSA dependency on the RH may be
related to the ability of water to conduct protons, acting as proton-conducting phase. In that
case, catalytic sites with lack of both water and ionomer would indeed cause the same
lowering of the ECSA. This argument is not completely discarded. However, the RH affects
the ECSA differently depending on the content and type of ionomer (PSUgPVPA ionomer,
section 5.2). Therefore, ionomer re-structuring may have a more contributing role to the
lowering of the ECSA at low RH.
One of the implications of this effect is the loss of specific activity of the
fuel cell (section 5.2). It was shown that for Nafion-based cathodes the iR-corrected
potential at 0.1 A cm-2 started to be affected by the low water content at around 40 %RH.
For the PSUgPVPA-based cathode this re-structuring process starts at much higher RH,
having a much more severe effect on the activity of the fuel cell. These findings suggest that
more attention should be focused on understanding ionomer re-structuring at low RH and
applying this knowledge when designing new types of ionomers.
66
6.1.2 Accelerated degradation tests (ADT) Pontentiostatic hold at 1.2 V vs. RHE using 20 wt% Pt/Vulcan as catalyst did not induce
any considerable degradation to the cathode catalyst layer after 100 h. On the contrary, the
electrode performance improved. This does not mean that the support is not degrading, as it
is possible to observe an increase in double layer capacitance and a decrease in the Pt surface
area. However, it is not possible to quantify the extent of carbon corrosion from
electrochemical measurements, because the increased double layer capacitance may be
related to both carbon oxidation and increased ionomer wetting. If the initial catalyst
utilization of the electrode is low, improved catalyst wetting could result in the access of
active sites not available before the ADT.
Pontentiostatic hold at 1.4 V vs. RHE resulted instead in a large degree of
reversibility of the fuel cell performance. After 3 h at 1.4 V the performance at low current
densities improved, while the performance at high current densities showed a considerable
degradation. Remarkably, the large degradation observed at high current densities is
completely recuperated after a 12 h recovery period. This large degree of reversibility is
attributed to changes of the ionomer structure and its interaction with the Pt/C catalyst.
Unfortunately, the standard electrochemical characterization methods used in this thesis
were not sufficient in order to elucidate a detailed description of these reversible processes.
However, it is proposed that ionomer swelling may be involved in the process.
The introduction of the triangle-wave potential cycling as ADT showed no
signs of reversibility. This is partially because the ADT introduces a recovery period at low
potentials during which water is produced. This ADT also manages to degrade the support
in a reasonable amount of time, more closely simulating the transient conditions
encountered during SU/SD.
6.1.3 Electrochemical response of a corroded cathode Commercial 50 µm MEAs were subjected to different lengths of the triangle-wave potential
ADT and later analyzed postmortem using SEM. This allowed us to correlate the
electrochemical response of each individual cathode with changes in electrode morphology.
The ECSA decreases with increasing number of corrosion cycles. When the
catalyst support is corroded, the Pt particles are assumed to agglomerate and detach
lowering the surface area of the catalyst. The decrease is almost exponential, consistent with
the discussion of decreasing carbon corrosion rates with time. Carbon corrosion results in a
thinning of the electrodes, which together with the enrichment of ionomer, not only results
in a decrease of the ionomer resistance, but also in the increase of the effective ionomer
conductivity. It is therefore suggested that carbon corrosion does not have a negative impact
on the ionomer of the cathode.
The iR-corrected potential of the fuel cell at low current densities and using
pure gases correlates fairly well with the changes in ECSA. However, the degradation of the
67
iR-corrected potential is considerably larger at high current densities. This result is a good
indication that carbon corrosion not only affects the Pt surface area, thus the activation
losses, but also the mass-transport losses of the fuel cell. These losses are better observed
when the fuel cell is operated with air instead of pure O2. The total fuel cell performance
degradation rate after 600 cycles was 160 µV cycle-1 (0.5 A cm-2, 70 oC, 90 %RH, air/H2).
From the postmortem SEM analysis of cathode cross-sections we observed
profound changes to the electrode morphology. The cathodes showed a notable decrease of
the electrode porosity, in particular a decrease of macropores (>50 nm) at the
electrode/GDL interphase, an increase in the agglomerate size and areas in which thick
ionomer films completely covered the electrode. Furthermore, SEM analysis of the GDLs
did not show any signs of MPL degradation upon repeated exposure to high potentials. The
porous structure of the MPLs seemed intact. Thus, the morphological changes of the
cathode are believed to be the main cause of the increase in mass-transport losses.
Interestingly, we did not observed any signs of electrode flooding at high RH. On the
contrary, mass-transport losses caused by the ADT are in these commercial MEAs slightly
larger at low RH and could be related to decreased O2 solubility and permeability in the
ionic phase.
Finally, according to the mass-transport mechanism recently proposed by
Debe [43], the dramatic loss of ECSA observed for corroded cathodes could also be
affecting the performance of the fuel cell at high current densities. However, this was not
considered in the analysis of the performance degradation following carbon corrosion in this
thesis.
6.1.4 Alternative carbons Although several of the tested nanostructured carbons showed improved fuel cell durability
in comparison to the conventional Vulcan support, the feasibility of incorporating these
materials into commercial MEAs has to be questioned. The cost of these alternative
carbons, in particular carbon nanotubes and fibers, is at least one order of magnitude larger
than the price of carbon blacks. This will inevitably add cost to the already expensive fuel
cell system. Additionally, some of these alternative carbons required a purification step
and/or pretreatment involving surface functionalization before the Pt deposition synthesis,
clearly making the process much more complex and expensive.
Both Pt/FWCNTs and Pt/GMWCNT gave unsatisfactory initial
performance at high current densities, which was attributed to a very dense electrode
structure with lack of meso-and macropores. The FWCNT-based cathodes were very
sensitive to high electrode potentials and showed considerable fuel cell performance
degradation. The GMWCNT-based cathodes on the other hand were the only catalysts that
showed a considerable improvement upon the triangle-wave potential ADT.
68
The low surface area graphitized carbon fibers (GCF) showed a high degree
of stability. However, the inert graphitic surface was an issue for the Pt deposition.
Functionalization using polyaniline had a positive effect on the fuel cell performance.
However, the Pt/Pani-GCF was among the catalysts that were most sensitive to high
electrode potentials.
Several types of acid pretreatments were tested on the GCF. These
treatments introduced some differences in the oxygen content and BET surface area of the
samples. However, these differences were difficult to quantify, having very similar initial fuel
cell performance and almost no differences in fuel cell performance degradation following
ADT for carbon corrosion.
CO2 emissions out of the cathode exhaust showed that the Pt/acid-treated
GCFs were five times more durable than conventional Pt/Vulcan catalyst, displaying lower
carbon corrosion rates than Pt/Vulcan. Interestingly, both catalysts showed very similar
carbon corrosion rate decays with time. The corrosion rate decay behavior is presently not
well understood, but often attributed to the structure of the carbon. In this thesis, we
propose that the surface area of the support has a dominant effect over carbon corrosion
rates and that surface oxygen functionalities and defects may have a dominant effect on the
corrosion rate decay with time.
Both Pt/GCF and Pt/GCNF were able to better conserve the integrity of
their electrode morphologies following ADT for carbon corrosion, e.g. the porous structure
of these fiber-based cathodes does not collapse. It is therefore suggested that the
performance loss at high current densities is not only dependent on carbon corrosion rates
and degradation rates of the ECSA, but on how carbon corrosion affects the morphology of
the electrode.
In the search for cathodes with improved mass-transport properties,
polyhedral carbon nanofoams (PNF-C) were tested as support material for the Pt catalyst in
PEMFC cathodes. The morphology of the Pt/PNF-C2 electrode consisted of large carbon
particles having a fine inner porosity with a narrow pore size distribution. Additionally, the
electrode showed a large amount of macropores. This highly porous cathode also resulted in
more than twice the thickness of Pt/Vulcan electrodes having the same catalyst loading.
Despite having higher electrode ionomer resistance, the Pt/PNF-C2 showed slightly better
fuel cell performance, especially at lower partial pressures of oxygen, which was attributed to
better transport properties. Unfortunately, the Pt/PNF-C2 showed a larger degradation of
the high current density performance using H2/air than the Pt/Vulcan cathode during the
ADT for carbon corrosion. Postmortem SEM analysis displayed that the large carbon
particles have a tendency to lose their inner mesoporosity.
69
6.1.5 Shut-down strategies A few of the most common shut-down strategies were evaluated using commercial 50 µm
MEAs. It is important to point out that each cycle simulates a prolonged shut-down. This
means that at some point during the shut-down air is introduced to the previously H2-filled
anode, finishing each cycle having air at both anode and cathode.
Not doing anything to avoid or minimize the time of the H2/O2 front at the
anode during shut-downs is detrimental for the fuel cell. Consequently, all the applied
strategies in this study showed considerably lower degradation rates than the no purge
strategy. The no purge shows an ECSA degradation rate of 0.176 m2g-1cycle-1 and a fuel cell
performance degradation rate of 1.75 mV cycle-1 (at 0.5 A cm-2, 70 oC, 90 %RH, air/H2).
It is interesting to compare this value with the degradation rate using the
triangle-wave potential cycling as ADT using the same MEAs and same conditions (see
6.1.3). Clearly, the ADT is not designed to simulate the severe consequences of the no purge
strategy. Instead the ADT was design to simulate the air purge strategy which shows a
degradation rate of 130 µV cycle-1 (at 0.5 A cm-2, 70 oC, 90 %RH, air/H2). The air purge
only minimizes the time for the H2/O2 front at the anode and therefore only minimized the
time for high cathode potentials.
The O2 consumption and H2 purge showed at least one order of magnitude
lower corrected degradation rates than the other strategies, 49 and 23 µV cycle-1, respectively
(at 0.86 A cm-2, 70 oC, 90 %RH, air/H2). With the exception of the results reported by M. L.
Perry et al. [100] these degradation rates can be regarded as low, especially considering that
these values include the degradation rate of unprotected start-ups. In both of these
strategies, the cathode is protected from high electrode potentials by H2. In the case of
O2 consumption, the hydrogen present at the cathode comes from H2 crossover, which could
result in incomplete protection. In the case of the H2 purge however, the protection from
high electrode potentials is believed to be more complete. Another advantage of the H2 purge
is that it is simple to implement and could potentially be used during start-ups as well, with
no additional components or complex devices as in the case of dummy-loads. The main
disadvantage is the possible degradation of the anode, especially if the anode is alloy-based.
For fuel cell applications having air breathing cathodes, e.g. portable
PEMFCs, the choice of shut-down strategy is limited, as it is not possible to purge or
consume the air at the cathode. However, the H2 consumption strategy may provide a
possibility to increase the lifetime the cathode.
6.1.6 GDL and BPP degradation related to SU/SD Carbon corrosion has a profound effect on activation losses and mass-transport losses.
However, we were also able to identify increased ohmic losses for fuel cells with corroded
cathodes (section 5.5 and 5.7). The HFR of the cell increases with increasing degree of
70
carbon corrosion. Unfortunately, EIS does not allow identifying whether these changes are
due to increased membrane resistance or increased contact resistances. However, it
rationalized that the decreased electrode thickness of a corroded cathode most probably has
a negative effect on the contact resistance between cathode and GDL. Furthermore, it
cannot be discarded that the contact resistance between GDL and BPP may also be affected.
As it was shown in paper VII the effective contact area between BPP and GDL is crucial for
the magnitude of the contact resistance, especially when using poorly conductive materials,
such as uncoated 316L. Small changes in the thickness of the fuel cell components may have
a considerable impact on the GDL/BPP contact resistance.
Furthermore, increased contact resistances may also increase the heat
production at these interfaces, changing the entire water balance of the cell. A dryer cell
would not only further increase the HFR of the cell, but may also decrease the thickness of
the membrane, causing even higher contact resistances.
6. 2 Outlook for future work In the search for less expensive and more durable membrane materials for PEMFC or high
temperature PEMFC, new alternative ionomers are constantly being developed. However,
these ionomer are very seldom tested as proton-conductive phase in the electrodes. As we
have seen in this thesis, the active surface area of the electrode is considerably altered
depending on the type of ionomer and operating conditions. Clearly, more work is needed in
order to understand these interactions and hopefully design new materials more rationally.
Neutron reflectometry (NR) and in-situ grazing-incidence small-angle X-ray scattering
(GISAXS) are techniques that may be used to study these interactions.
A low catalyst loading at the cathode, without compromising performance
and durability, is essential for the PEMFC in order to have a larger impact in the power-
generating market. It is the authors’ opinion that carbon-supported Pt catalysts will never
meet all the required demands. Low catalyst loadings (< 0.1 mg cm2) have a significant
impact on activation, mass-transport losses and lifetime. Furthermore, alternative carbons
with improved durability are more expensive than conventional ones. Even though new
types of catalyst, e.g. nanostructured thin films (NSTFs), are presently emerging as a
promising alternative in terms of cost, durability and manufacturability, further
improvements are still needed in order to meet future cost and durability targets. The natural
alternative would be to move away from precious metal-based catalysts, e.g.
metal/nitrogen/carbon-based catalyst. Presently there are a few groups making great
advances in this field in terms of performance. However, a large question mark has to be put
on electrode durability, in particular regarding the issues related to carbon corrosion.
Both present and future applications using carbon-based catalysts for the
ORR would benefit from the development of fuel cell models able to physically describe and
account for the morphology of a corroded cathode. Full cell physical models have been
71
developed at our department for many years [4,130,138,142,143]. However, it is suggested
that the cathode model may be modified by including Knudsen diffusivity in the electrode
and a spatial distribution of the electrode porosity and agglomerate size along the electrodes
thickness. This would most probably result in a gradient of the partial pressure of O2 in the
electrode with increased mass-transport losses at low electrode porosities. Finally, it is also
proposed that this model should include a collision frequency pre-exponential scaling factor
in the Butler-Volmer equation, as proposed by Debe [43] in order to account for mass-
transport limitations generated as a result of decreased and/or re-distribution of ECSA.
Recently, Eom et al. [119] have proposed that metallic bi-polar plates may
suffer from corrosion during fuel starvation conditions, poisoning the membrane with metal
ions and resulting in decreased membrane conductivity. In this context, it would be highly
interesting to study the effect of SU/SD and electrode thinning on the contact resistance
between GDL and BPP using our fuel cell set-up.
Acknowledgement The Northern European Innovative Energy Research Programme (N-INNER) and the Division of Applied Electrochemistry at KTH are thankfully acknowledged for financing this work. I want in particular thank Professor Göran Lindbergh and Associate Professor Carina Lagergren for their support, supervision and for giving me this wonderful experience. These have been by far the best five years of my life, both professionally and personally. Everybody at Applied Electrochemistry will forever have a special place in my heart. Thanks everyone for the wonderful time, the trips, conferences, lunch and fika. Nicklas Holmström, Sophie von Kraemer and Maria Wesselmark are specially acknowledged for their disposition to share their fuel cell knowledge with me. I also want to thank all the partners of the Nanoduramea project. Especially, Virginia Ruiz and Maryam Borghei from Aalto University, Elina Yli-Rantala and Antti T. Pasanen from VTT, Mahdi Darab from NTNU and Magnus Thomassen from SINTEF. Andreas Bodén and Axel Baumann Ofstad at PowerCell are acknowledged for the collaboration and supervision.
Finally, I want to thank my beautiful wife Claudia for having endless patience and kindness, as well as my son Tobias and my daughter Alicia. With children like you, it is fun to come home in the evening.
72
References [1] Nordic energy research (2013), Available online: http://www.nordicenergy.org/, accessed: 08-10-2013.
[2] FuelCell Today, The fuel cell Industry review 2012, Available online:
http://www.fuelcelltoday.com/analysis/industry-review/2012/the-industry-review-2012, accessed: 08-10-
2013.
[3] E. Yli-Rantala, M. Borghei, S. Ma-Andersen, S. Veltzé, A. Oyarce, M. Thomassen, Final Scientific
Report for N-INNER, Available online: http://www.nordicenergy.org/wp-
content/uploads/2012/01/Nanoduramea-Final-scientific-report.pdf, accessed: 08-10-2013.
[4] N. Holmström, K. Wiezell, G. Lindbergh, J. Electroc. Soc., 159 (8) (2012) F369-F378.
[5] N. Zhang, G. Zhang, D. Xu, C. Zhao, W. Ma, H. Li, Y. Zhang, S.Xu, H. Jiang, H. Sun, H.
Na, Int. J. Hydrogen Energy, 36 (2011) 11025-1033.
[6] K. Miyatake, M. Watanabe, J. Mater. Chem., 16 (2006) 4465–4467.
[7] P. N. Pintauro, P. T. Mather, U.S. DOE Hydrogen Program Annual Merit Review and Peer
Evaluation, Arlington, VA, USA, 2012.
[8] B. R. Matos, E. I. Santiago, F. C. Fonseca, M. Linardi, V. Lavayen, R. G. Lacerda, L. O.
Ladeira, A. S. Ferlauto, J. Electrochem. Soc., 154 (12) (2007) B1358-B1361.
[9] Fuel Cell Technologies Program Multi-Year Research, Development and Demonstration Plan, 2011.
Available online: http://www1.eere.energy.gov/hydrogenandfuelcells/mypp/pdfs/fuel_cells.pdf, accessed: 08-
10-2013.
[10] S. Hamrock, U.S. DOE Hydrogen, Program Annual Merit Review and Peer Evaluation, 2011,
Available online:http://www.hydrogen.energy.gov/annual_review11_fuelcells.html#membranes, accessed:
08-10-2013.
[11] E. Proietti, F. Jaouen, M. Lefèvre, N. Larouche, J. Tian, J. Herranz, J.-P. Dodelet, Nature
Communications 2 (2011) 416.
[12] K. Lee, J. Zhang, H. Wang, D. P. Wilkinson, J. Appl. Electrochem. 36 (2006) 507–522.
[13] E. Antolini, E. R. Gonzalez, Solid State Ionics 180 (2009) 746–763.
[14] P. Zhang, S.-Y. Huang, B. N. Popov, J. Electrochem. Soc., 157 (8) (2010) B1163-B1172.
[15] B. Seger, A. Kongkanand, K. Vinodgopal, P.V. Kamat, J. Electroanal. Chem. 621 (2008) 198–
204.
[16] E. Antolini, E. R. Gonzalez, Appl. Catal. B: Environ. 96 (2010) 245–266.
[17] M. K. Debe, ECS Trans., 45 (2) (2012) 47-68.
[18] E. Antolini, J. Perez, J. Mater. Sci., 46 (2011) 4435–4457.
[19] M. Wissler, J. Power Sources, 156 (2006) 142–150.
[20] S. Jeon, J. Lee, G. M. Rios, H.-J. Kim, S.-Y. Lee, E. Cho, T.-H. Lim, J. H. Jang, Int. J.
Hydrogen Energy, 35 (2010) 9678-9686.
[21] P. Gode, F. Jaouen , G. Lindbergh, A. Lundblad, G. Sundholm, Electrochim. Acta, 48 (2003)
4175–4187.
[22] F. A. Uribe, T. E. Springer, S. Gottesfeld, J. Electrochem. Soc., 139 (3) (1992).
[23] J. Chlistunoff, F. Uribe, B. Pivovar, ECS Trans., 1(6) (2006) 137–146.
73
[24] J. Chlistunoff, B. Pivovar, ECS Trans., 11 (1) (2007) 1115–1125. [25] S. Ma, Q. Chen, F. H. Jøgensen, P.C. Stein, E. M. Skou, Solid State Ionics 178 (2007) 1568–1575. [26] D. L. Wood III, J. Chlistunoff, J. Majewski, R. L. Borup, J. Am. Chem. Soc., 131 (2009) 18096–18104. [27] M. A. Modestino, A. Kusoglu, A. Hexemer, A. Z. Weber, R. A. Segalman, Macromolecules, 45 (2012) 4681−4688. [28] H. A. Gasteiger, J. E. Panels, S.G. Yan, J. Power Sources 127 (2004) 162–171. [29] M. K. Debe, U.S. Department of Energy Hydrogen and Fuel Cells Program 2011 Annual Merit
Review Proceedings, 2011, Available online:
http://www.hydrogen.energy.gov/pdfs/review11/fc001_debe_2011_o.pdf, accessed: 08-10-2013.
[30] L. Cindrella, A.M. Kannan, J.F. Lin, K. Saminathan, Y. Ho, C.W. Lin, J. Wertz, J. Power Sources, 194 (2009) 146–160. [31] A. Arvay, E. Yli-Rantala, C.-H. Liu, X.-H. Peng, P. Koski, L. Cindrella, P. Kauranen, P. M. Wilde, A. M. Kannan, J. Power Sources, 213 (2012) 317-337. [32] J. Morgan, Ballard Power Systems, DOE Annual Merit Review, May 2011, Available online: http://www.hydrogen.energy.gov/annual_progress11_manufacturing.html, accessed: 08-10-2013. [33] H. Wang, A. Turner, Fuel Cells, 10 (4) (2010) 510–519. [34] H. A. Gasteiger, S. S. Kocha, B. Sompalli, F.T. Wagner, Applied Catalysis B: Environmental 56 (2005) 9–35. [35] R. Makharia, M. F. Mathias, D. R. Bakerb, J. Electrochem. Soc., 152 (5) (2005) A970-A977. [36] D. B. Sepa, M. V. Voinovic, Electrochim. Acta, 26 (1981) 781-793. [37] N. M. Marković, P. N. Ross Jr., Surf. Sci. Rep., 45 (2002) 117-229. [38] A. Ohma, T. Mashio, K. Sato, H. Iden, Y. Ono, K. Sakai, K. Akizuki, S. Takaichi, K. Shinohara, Electrochim. Acta, 56 (2011) 10832– 10841. [39] M. Prasanna, H. Y. Ha, E. A. Cho, S.-A. Hong, I.-H. Oh, J. Power Sources, 137 (2004) 1-8. [40] Y.-G. Yoon, G.-G. Park, T.-H. Yang, J.-N. Han, W.-Y. Lee, C.-S. Kim, Int. J. Hydrogen Energy, 28 (2003) 657-662. [41] S. Nakamura, H. Nishikawa, T. Aoki, Y. Ogami, J. Power Sources, 186 (2009) 278–285. [42] Z. Xie, X. S. Zhao, J. Gazzarri, Q. Wang, T. Navessin, S. Holdcroft, ECS Trans., 25 (1) (2009)1187-1192. [43] M. K. Debe, J. Electrochem. Soc., 159 (1) (2012) B53-B66. [44] U. S department of energy (DOE), Annual progress report, Fuel cells, Catalyst (2012), Available online: http://www.hydrogen.energy.gov/annual_progress.html, accessed: 08-10-2013. [45] R. Makharia, S. S. Kocha, P. T. Yu, M. A. Sweikart, W. Gu, F. T. Wagner, H. A. Gasteiger, ECS Transactions, 1 (8)(2006) 3-18. [46] M. S. Wilson, F. H. Garzon, K. E. Sickafus, S. Gottesfeld, J. Electrochem. Soc.,140 (1993) 2872–2877. [47] P. J. Ferreira, G.J. la O’, Y. Shao-Horn, D. Morgan, R. Makharia, S. Kocha, H. A.Gasteiger, J. Electrochem. Soc., 152 (2005) A2256-A2271. [48] Y. Shao, G. Yin, Y. Gao, J. Power Sources, 171 (2007) 558–566. [49] Y. Shao-Horn, W. C. Sheng, S. Chen, P. J. Ferreira, E. F. Holby, D. Morgan, Top Catal., 46 (2007) 285–305. [50] W. Zhu, J. P. Zheng, R. Liang, B. Wang, C. Zhang, G. Au, E. J. Plichta, J. Electrochem. Soc., 156 (9) (2009) B1099-B1105.
74
[51] R. M. Darling, J. P. Meyers, J. Electrochem. Soc., 150 (11) (2003) A1523-A1527. [52] R. M. Darling, J. P. Meyers, J. Electrochem. Soc., 152 (1) (2005) A242-A247. [53] B. G. Pollet, I. Staffell, J. L. Shang, Electrochim. Acta, 84 (2012) 235– 249.
[54] M. F. Mathias, R. Makharia, H. A. Gasteiger, J. J. Conley, T. J. Fuller, G. J. Gittleman, S. S.
Kocha, D. P. Miller, C. K. Mittelsteadt, T. Xie, S.G. Yan, P. T. Yu, Electrochem. Soc. Interf., 14
(2005) 24–35.
[55] J. Wu, X. Z. Yuan, J. J. Martin, H. Wang, J. Zhang, J. Shen, S.Wu, W. Merida, J. Power
Sources, 184 (2008) 104–119.
[56] P. Yu, M. Pemberton, P. Plasse, J. Power Sources, 144 (2005) 11–20.
[57] H. R. Colon-Mercado, B. N. Popov, J. Power Sources, 155 (2006) 253.
[58] E. Antolini, J. R. C. Salgado, E. R. Gonzalez, J. Power Sources, 160 (2006) 957.
[59] M. K. Debe, A. K. Schmoeckel, G. D. Vernstrom, R. Atanasoski, J. Power Sources 161 (2006)
1002–1011.
[60] M. Pourbaix, Atlas of Electrochemical Equilibria in Aqueous Solutions, p. 453, National Association of Corrosion Engineers, Houston, TX (1979) [61] S. Maass, F. Finsterwalder, G. Frank , R. Hartmann, C. Merten, J. Power Sources, 176 (2008) 444–451. [62] Z. Y. Liu, J. L. Zhang, P. T. Yu, J. X. Zhang, R. Makharia, K. L. More, E. A. Stachc, J. Electrochem. Soc., 157 (6) (2010) B906-B913. [63] K. Kinoshita, J. Bett, Carbon 11(1973) 237. [64] L. M. Roen, C. H. Paik, T. D. Jarvi, Electrochem. Solid-State Lett., 7 (1) (2004) A19-A22. [65] W. Li, A. M. Lane, Electrochim. Acta, 55 (2010) 6926–6931. [66] S.C. Ball, S.L. Hudson, D. Thompsett, B. Theobald, J. Power Sources, 171 (2007) 18–25. [67] D. A. Stevens, M. T. Hicks, G. M. Haugen, J. R. Dahn, J. Electrochem. Soc., 152 (12) (2005)
A2309-A2315.
[68] P. T. Yu, Z. Liu, R. Makharia, J. Electrochem. Soc., 160 (6) (2013) F645-F650.
[69] A. Taniguchi, T. Akita, K.Yasuda, Y. Miyazaki, J. Power Sources 130 (2004) 42–49.
[70] J. Chen, J. B. Siegel, T. Matsuura, A. G. Stefanopoulou, J. Electrochem. Soc., 158 (9) (2011)
B1164-B1174.
[71] C. A. Reiser, L. Bregoli, T. W. Patterson, J. S. Yi, J. D. Yang, M.L. Perry, T. D. Jarvi,
Electrochem. Solid-State Lett., 8 (6) (2005) A273-A276.
[72] R. Dross, B. Maynard, ECS Trans., 11 (1) (2007) 1059-1068.
[73] H. Tang, Z. Qi, M. Ramani, J. F. Elter, J. Power Sources, 158 (2006) 1306–1312.
[74] R. N. Carter, B. K. Brady, K. Subramanian, T. Tighe, H. A. Gasteiger, ECS Trans., 11 (1)
(2007) 423-433.
[75] P. T. Yu, W. Gu, R. Makharia, F. T. Wagner, H. A. Gasteiger, ECS Trans., 3 (1) (2006)797-
809.
[76] A. P. Young, J. Stumper, E. Gyenge, J. Electrochem. Soc., 156 (8) (2009) B913-B922.
[77] R. Borup, J. Meyers, B. Pivovar, Y. S. Kim, R. Mukundan, N. Garland, D. Myers, M. Wilson, F.
Garzon, D. Wood, P. Zelenay, K. More, K. Stroh, T. Zawodzinski, J. Boncella,J. E. McGrath, M.
75
Inaba, K. Miyatake, M. Hori, K. Ota, Z. Ogumi, S. Miyata, A. Nishikata, Z. Siroma, Y. Uchimoto,
K. Yasuda, K. Kimijima, N. Iwashita, Chem. Rev., 107 (2007) 3904.
[78] T. W. Patterson, R. M. Darling, Electrochem. Solid-State Lett., 9 (4) (2006) A183-A185.
[79] Y. Y. Jo, E. Cho, J. H. Kim, T.-H. Lim, I.-H. Oh, S.-K. Kim, H.-J. Kim, J. H. Jang, J. Power
Sources 196, (2011) 9906-9915.
[80] Z. Y. Liu, B. K. Brady, R. N. Carter, B. Litteer, M. Budinski, J. K. Hyun, D. A. Muller, J.
Electrochem. Soc., 155 (10) (2008) B979-B984.
[81] J. D. Fairweather, D. Spernjak, A. Z. Weber, D. Harvey, S. Wessel, D. S. Hussey, D. L.
Jacobson, K. Artyushkova, R. Mukundan, R. L. Borup, J. Electrochem. Soc., 160 (9) (2013) F980-
F993.
[82] R. T. Atanasoski, L. L. Atanasoska, D. A. Cullen, G. M. Haugen, K, L. More, G. D.
Vernstrom, Electrocatal., (2012) 284–297.
[83] B. Genorio, D. Strmcnik, R. Subbaraman, D. Tripkovic, G. Karapetrov, V. R. Stamenkovic, S.
Pejovnik, N. M. Markovic, Nature Mat., (9) (2010).
[84] X. Sun, M. S. Saha, PEM Fuel Cell Electrocatalysts and Catalyst Layers, Springer London (2008)
pp. 655-714.
[85] S. Sharma, B. G. Pollet, J. Power Sources, 208 (2012) 96–119.
[86] P. Serp, M. Corrias, P. Kalck, Appl. Catal. A: General, 253 (2003) 337–358.
[87] S. Shrestha, Y. Liu, W.E. Mustain, Catal. Rev., 53(3) (2011) 256-336.
[88] J. M. Tang, K. Jensen, M. Waje, W. Li, P. Larsen, K. Pauley, Z. Chen, P. Ramesh, M. E. Itkis,
Y. Yan, R. C. Haddon, J. Phys. Chem. C, 111 (48) (2007) 17901-17904.
[89] F. Alcaide, G. Álvarez, O. Miguel, M. J. Lázaro, R. Moliner, A. López-Cudero, J. Solla-Gullón,
E. Herrero, A. Aldaz, Electrochem. Commun., 11 (2009) 1081–1084.
[90] K. Lee. J. Zhang, H. Wang, D. P. Wilkinson, J. Appl. Electrochem., 36 (2006) 507–522.
[91] H.-S. Oh, K. Kim, Y.-J. Ko, H. Kim, Int. J. Hydrogen Energy, 35 (2010) 701-708.
[92] S. M. Andersen, M. Borghei, P. Lund, Y.-R. Elina, A. Pasanen, E. Kauppinen, V. Ruiz , P.
Kauranen, E. M. Skou, Solid State Ionics, 231 (2013) 94–101.
[93] P. Ramesh, M. E. Itkis, J. M. Tang, R. C. Haddon, J. Phys. Chem. C, 112 (2008) 9089–9094.
[94] J. H. Kim, E.A. Cho, J.H. Jang, H.J. Kim, T.H. Lim, I.H. Oh, J.J. Ko, S.C. Oh, J. Electrochem.
Soc., 157 (2010) B104–B112.
[95] A. B. Ofstad, J. R. Davey, S. Sunde, R. L. Borup, ECS Trans., 16 (2) (2008)1301-1311.
[96] C. A. Reiser, D. Yang, R.D. Sawyer, U.S. Patent 6,887,599 B2 (2005).
[97] P.T. Yu, F.T. Wagner, U.S. Patent Appl. 0046106 A1 (2006).
[98] H.-J. Kim, S. J. Lim, J. W. Lee , I.-G. Min, S.-Y. Lee, E. A Cho, I.-H. Oh, J. H. Lee, S.-C.
Oh, T.-W. Lim, T.-H. Lim, J. Power Sources, 180 (2008) 814–820.
[99] J. H. Kim, E. A. Cho, J. H. Jang, H. J. Kim, T.-H. Lim, I.-H. Oh, J. J. Ko, S. C. Oh, J.
Electrochem. Soc., 157 (1) (2010) B118-B124.
[100] M. L. Perry, T. W. Patterson, C. Reiser, ECS Trans., 3 (1) (2006) 783-795.
[101] Y. Yu, G. Wanga, Z. Tu, Z. Zhan, M. Pan, Electrochim. Acta, 71 (2012) 181– 193.
76
[102] A. Taniguchi, T. Akita, K. Yasuda, Y. Miyazaki, Int. J. Hydrogen Energy, 33 (208) 2323-
2329.
[103] M. Gerard, J.-P. Poirot-Crouvezier, D. Hissel, M.-C. Pera, Int. J. Hydrogen Energy, 35 (2010)
12295-12307.
[104] D. E. Curtin, R. D. Lousenberg, T. J. Henry, P. C. Tangeman, M. E. Tisack, J. Power Sources,
131 (2004) 41–48.
[105] A. Collier, H. Wang, X. Z. Yuan, J. Zhang, D. P. Wilkinson, Int. J. Hydrogen Energy, 31
(2006) 1838-1854.
[106] M. Inaba, T. Kinumoto, M. Kiriake, R. Umebayashi, A. Tasaka, Z. Ogumi, Electrochim. Acta,
51 (2006) 5746–5753.
[107] S. Kreitmeier, G. A. Schuler, A. Wokaun, F. N. Büchi, J. Power Sources, 212 (2012) 139-147.
[108] A. B. Laconti, M. Hamdan, R. C. McDonald, Handbook of fuel cells: fundamentals, technology,
and applications, Wiley, vol. 3 (2003) pp. 647–62.
[109] J. Xie, D. L. Wood III, D. M. Wayne, T. A. Zawodzinski, P. Atanassov, R. L. Borup, J.
Electrochem. Soc., 152 (1) (2005) A104-A113.
[110] F.-Y. Zhang, S.G. Advani, A. K. Prasad, M. E. Boggs, S. P. Sullivan, T. P. Beebe Jr.,
Electrochim. Acta, 54 (2009) 4025–4030.
[111] K. Seidenberge, F. Wilhelm, T. Schmitt, W. Lehnert, J. Scholta, J. Power Sources, 196 (2011)
5317–5324.
[112] M. Schulze, N. Wagner, T. Kaz, K.A. Friedrich, Electrochim. Acta, 52 (2007) 2328–2336.
[113] J. W. Frisk, M. T. Hicks, R. T. Atanasoski, W. M. Boand, A. K. Schmoeckel, M. J.
Kurkowski, Presented at the 2004 Fuel Cell Seminar, San Antonio, TX, November 2004.
[114] J. E. Owejan, P. T. Yu, R. Makharia, ECS Trans., 11 (1) (2007) 1049-1057.
[115] T. Aoki, A. Matsunaga, Y.Ogami, A. Maekawa, S. Mitsushima, K.-ichiro Ota, H. Nishikawa,
J. Power Sources, 195 (2010) 2182–2188.
[116] J. Wind, R. Späh, W. Kaiser, G. Böhm, J. Power Sources, 105 (2002) 256-260.
[117] A. Pozio, R.F. Silva, M. De Francesco, L. Giorgi, Electrochim. Acta, 48 (2003) 154-1549.
[118] R. C. Makkus, A. H. H. Janssen, F. A. De Bruijn, R. K. A. M. Mallant, J. Power Sources, 86
(2000) 274-282.
[119] K. Eom, E. Cho, S.-W. Nam, T.-H. Lim, J. H. Jang, H.-J. Kim, B. K. Hong, Y. C. Yang,
Electrochim. Acta, 78 (2012) 324– 330.
[120] Yu.V. Gavrilov, D. A. Grishin, H. Jiang, N. G. Digurov, A. G. Nasibulin, E. I. Kauppinen,
Russian J. Phys. Chem. A, 81 (9) (2007)1502–1506.
[121] L.L. Hussami, R. Corkery, L. Kloo, Carbon, 48 (2010) 3121-3130.
[122] L. Lin, H. Niu, M. Zhang, W. Song, Z. Wang, X. Bai, Appl. Surf. Sci., 254(2008) 7250.
[123] K. Immonen, K. Nättinen, J. Sarlin, J. Hartikainen, J. Appl. Polym. Sci., 144 (2009) 1494.
[124] H. Bönnemann, W. Brijoux, R. Brinkmann, R. Fretzen, T. Joussen, R. Köppler, B. Korall, P.
Neiteler, J. Richter, J. Mol. Catal., 86 (1994) 129.
77
[125] J. M. Tang, K. Jensen, M. Waje, W. Li, P. Larsen, K. Pauley, Z. Chen, P. Ramesh, M. E. Itkis,
Y. Yan, R. C. Haddon, J. Phys. Chem. C, 111(2007) 17901.
[126] H. Ekström, Ph.D. Thesis, KTH School of Chemical, Science and Engineering, Stockholm, 2007.
[127] IRD, Available online: http://www.ird.dk/, accessed: 08-10-2013.
[128] J. Ihonen, F. Jaouen, G. Lindbergh, G. Sundholm, Electrochim. Acta, 46 (2001) 2899-2911.
[129] S. S. Kocha, J. D. Yang, J. S. Yi, AIChE, 52 (2006) 1916.
[130] F. Jaouen and G. Lindbergh, J Electrochem Soc, 150 (2003) A1699-A1710.
[131] E. B. Easton, P. G. Pickup, Electrochim. Acta, 50 (2005) 2469–2474.
[132] U.S. DRIVE, Fuel Cell Tech Team, Cell Component Accelerated Stress Test and Polarization
Curve Protocols, Available online: http://www.uscar.org/commands/files_download.php?files_id=267,
accessed: 08-10-2013.
[133] A. Zolfaghari, M. Chayer, G. Jerkiewicz, J. Electrochem. Soc., 144 (1997) 3034.
[134] T. Ioroi, K. Yasuda, and Y. Miyazaki, Phys. Chem. Chem. Phys., 4 (2002) 2337.
[135] I. A. Schneider, D. Kramer, A. Wokaum, G. G. Scherer, Electrochem. Commun., 9 (2007) 1607.
[136] M. Eikerling, J. Electrochem. Soc., 153 (2006) E58.
[137] J. Parvole, P. Jannasch, Macromolecules, 41, 3893 (2008).
[138] K. Wiezell, N. Holmström, G. Lindbergh, J. Electrochem. Soc., 159, F379 (2012).
[139] M. Wesselmark, C. Lagergren, G. Lindbergh, ECS Trans., 25 (1) (2009) 1241-1250.
[140] M. J. Larsen, E. M. Skou, J. Power Sources, 202 (2012) 35–46.
[141] Y, Liu, C. Ji,W. Gu, D. R. Baker, J. Jorne, H. A. Gasteiger, J.Electrochem. Soc., 157 (8) (2010)
B1154-B1162.
[142] F. Jaouen, G.Lindbergh, K. Wiezell, J. Electrochem. Soc., 150 (12) (2003) A1711-A1717.
[143] D.P. Davies, P.L. Adcock, M. Turpin, S.J. Rowen, J. Power Sources, 86 (2000) 237-242.
[144] S.-H. Wang, J. Peng, W.-B. Lui, J.-S. Zhang, J. Power Sources, 162 (2006) 486-491.
[145] P. Yi, L. Peng, L. Feng, P. Gan, X. Lai, J. Power Sources, 195 (2010) 7061-7066.