Embed Size (px)
Citation preview
UNIVERSIDADE ESTADUAL DE CAMPINAS
FACULDADE DE ENGENHARIA DE ALIMENTOS
ELSON ROGERIO TAVARES FILHO
DEVELOPMENT AND SENSORY CHARACTERIZATION OF
LOW SODIUM TOMATO SAUCE
DESENVOLVIMENTO E CARACTERIZAÇÃO SENSORIAL DE
MOLHO DE TOMATE COM TEOR DE SÓDIO REDUZIDO
CAMPINAS
2019
ELSON ROGERIO TAVARES FILHO
DEVELOPMENT AND SENSORY CHARACTERIZATION OF
LOW SODIUM TOMATO SAUCE
DESENVOLVIMENTO E CARACTERIZAÇÃO SENSORIAL DE
MOLHO DE TOMATE COM TEOR DE SÓDIO REDUZIDO
CAMPINAS
2019
Thesis presented to the Faculty of Food Engineering of State
University of Campinas to obtain the degree of Doctor in Food
and Nutrition, with focus on Consumption and Food Quality.
Tese apresentada à Faculdade de Engenharia de Alimentos da
Universidade Estadual de Campinas para a obtenção do título
de Doutor em Alimentos e Nutrição, na área de Consumo e
Qualidade de Alimentos.
Supervisor/Orientadora: Prof.ª Dr. Helena Maria André Bolini
ESTE EXEMPLAR CORRESPONDE À VERSÃO
FINAL DA TESE DEFENDIDA PELO ALUNO
ELSON ROGERIO TAVARES FILHO, ORIENTADO
PELA PROFA. DRA. HELENA MARIA ANDRÉ
BOLINI.
Ficha catalográficaUniversidade Estadual de Campinas
Biblioteca da Faculdade de Engenharia de AlimentosClaudia Aparecida Romano - CRB 8/5816
Tavares Filho, Elson Rogerio, 1991- T197d TavDesenvolvimento e caracterização sensorial de molho de tomate com teor
de sódio reduzido / Elson Rogerio Tavares Filho. – Campinas, SP : [s.n.], 2019.
TavOrientador: Helena Maria André Bolini. TavTese (doutorado) – Universidade Estadual de Campinas, Faculdade de
Engenharia de Alimentos.
Tav1. Redução de sal. 2. Cloreto de potássio. 3. Análise sensorial. 4.
Eletroencefalografia. I. Bolini, Helena Maria André. II. Universidade Estadual deCampinas. Faculdade de Engenharia de Alimentos. III. Título.
Informações para Biblioteca Digital
Título em outro idioma: Development and sensory characterization of low sodium tomatosaucePalavras-chave em inglês:Sodium reductionPotassium chlorideSensory evaluationElectroencephalographyÁrea de concentração: Consumo e Qualidade de AlimentosTitulação: Doutor em Alimentos e NutriçãoBanca examinadora:Helena Maria André Bolini [Orientador]Flávio Luís SchmidtDiogo Thimoteo da CunhaMarta Regina Verruma-BernardiDaniela Cardoso Umbelino CavalliniData de defesa: 18-06-2019Programa de Pós-Graduação: Alimentos e Nutrição
Identificação e informações acadêmicas do(a) aluno(a)- ORCID do autor: 0000-0002-9825-0627- Currículo Lattes do autor: http://lattes.cnpq.br/4824153923112777
Powered by TCPDF (www.tcpdf.org)
BANCA EXAMINADORA
__________________________________________
Profa. Dra. Helena Maria André Bolini - Orientador
Universidade Estadual de Campinas
__________________________________________
Dr. Flávio Luís Schmidt – Membro titular
Universidade Estadual de Campinas
__________________________________________
Dr. Diogo Thimoteo da Cunha – Membro titular
Universidade Estadual de Campinas
__________________________________________
Dra. Marta Regina Verruma-Bernardi – Membro titular
Universidade Federal de São Carlos
__________________________________________
Dra. Daniela Cardoso Umbelino Cavallini – Membro titular
Universidade Estadual Paulista
A Ata da defesa assinada pelos membros da Comissão Examinadora, consta no SIGA/Sistema de Fluxo de
Dissertação/Tese e na Secretaria do Programa da Unidade.

DEDICATÓRIA
Aos meus pais Ivonete e Elson,
à minha avó Edith e
ao meu irmão Eduardo.
AGRADECIMENTOS
Aos meus pais, pelo amor e apoio incondicional.
Ao meu irmão Eduardo e nosso eterno amigo Treu.
A Mariana pelo apoio e presença fundamental;
À Profª Dra. Helena Bolini pelo exemplo de profissionalismo.
À minha segunda família de Ilicínea, que permitiu que tudo acontecesse: Rômulo,
Tiago, Alba e Ramón.
Ao Prof. Dr. Erick Esmerino, pela mentoria fundamental. Aos amigos Juliana
(Wolva), Adriano, Erick, Geina, Alê, Valfredo pela grande amizade, companheirismo, além
da essencial ajuda e compreensão no desenvolvimento deste trabalho;
Aos companheiros de república Brunno, Marcelino, Michael, Ricardo, Thiago,
Ronaldo, Adriano e Janaína.
A todos os provadores pela ajuda essencial que possibilitou este estudo.
Aos membros da banca examinadora pelas contribuições e sugestões apresentadas;
Ao CNPq, pela concessão de bolsa e auxílio que colaboraram para a existência deste
trabalho.
O presente trabalho foi realizado com apoio da Coordenação de Aperfeiçoamento de
Pessoal de Nível Superior - Brasil (CAPES) - Código de Financiamento 001.
A Alexandra Elbakyan, por sua enorme contribuição para ciência.

"It isn't all over; everything has not been invented;
the human adventure is just beginning."
Gene Roddenberry
RESUMO GERAL
As diretrizes que orientam a redução do sódio em alimentos processados, estão cada vez mais
rigorosas devido à forte correlação entre a ingestão excessiva de sal e o desenvolvimento de
doenças crônicas não transmissíveis. O molho de tomate é um alimento processado de grande
consumo, contudo, apresenta elevado teor de sódio em sua composição. Neste cenário, faz-se
necessário desenvolver estratégias que possibilitem a substituição do cloreto de sódio assim
como a conservação das características sensoriais do produto. O presente trabalho teve por
objetivos: 1) Utilizar a escala JAR para determinar a concentração de sal considerada ideal
pelos consumidores brasileiros. 2) Utilizar a análise tempo intensidade (TI) para determinar a
equivalência de poder salgante entre o cloreto de sódio (NaCl) e o cloreto de potássio (KCl). 3)
Produzir seis formulações de molho de tomate com 50% de substituição do NaCl. 4)
Caracterizar os molhos pela percepção de provadores treinados e consumidores, utilizando
análise descritiva quantitativa (ADQ) e check all that apply (CATA); e também de forma
dinâmica utilizando TI e temporal dominance of sensations (TDS). 5) Avaliar a aceitação dos
molhos de forma clássica e dinâmica, utilizando o teste de aceitação e o teste de aceitação
temporal. 6) Utilizar a eletroencefalografia (EEG) e a escala hedônica para avaliar a resposta
neuronal de indivíduos ao consumir molho de tomate com redução de sal. A concentração ideal
de NaCl foi de 0,87%. O KCl possuiu 75% da capacidade salgante do NaCl em uma relação
1:1 (m/m), seja de forma isolada ou associada ao glutamato monossódico, inosinato dissódico,
Aji-100 (kokumi aroma) e lisina. Contudo, quando associado a mistura inosinato + guanilato
dissódico (50%\50% m/m), o poder salgante do KCl foi reduzido para 60%. As amostras
apresentaram maiores diferenças relacionadas aos atributos do sabor, em detrimento aos da
aparência, aroma e textura. Na ADQ, diferenças significativas nos gostos: doce, amargo e
metálico foram evidenciadas, no CATA apenas o amargo diferiu. A análise TI evidenciou
menor valor de gosto amargo na amostra NaCl comparada as demais, todavia, o principal
achado do método foi o tempo de duração do gosto amargo (TTOT). A presença de realçador
de sabor na amostra não afetou o tempo de surgimento do gosto amargo, contudo reduziu sua
duração. As amostras contendo substâncias promotoras de umami (MSG, IG, IMP e AJI-100)
tiveram menor duração de gosto amargo. O TDS caracterizou como atributos dominantes
sabores que não apresentaram intensidade alta nos outros testes (e.g., sabor de
condimentos/ervas, e gosto ácido). A estimulação dos córtices frontal e temporal desempenha
um papel importante na aceitação dos alimentos, e a associação do glutamato monossódico ou
inosinato dissódico com o KCL estimulou fortemente essa região. A utilização de cloreto de
potássio como substituto do cloreto de sódio em molho de tomate se fez mais eficiente se
realizada de forma parcial, i.e., que se faça a substituição de no máximo 60% do NaCl. Também
é importante frisar a melhora sensorial do KCl na presença de pequenas concentrações dos
realçadores de sabor, glutamato monossódico e inosinato dissódico.
Palavras-chave: Intensificadores de sabor, redução de sal, cloreto de potássio, análise
sensorial.
ABSTRACT
Guidelines for reducing sodium in processed foods are becoming stricter due to the strong
correlation between excessive salt intake and the development of chronic noncommunicable
diseases. Tomato sauce is a highly consumed processed food but contains a high sodium
content. In this scenario, it is necessary to develop strategies that enable the replacement of
sodium chloride as well as the conservation of sensory characteristics of the product. The
present study aimed to: 1) Use the JAR scale to determine the salt concentration considered
ideal by Brazilian consumers. 2) Use the time intensity analysis (TI) to determine the salt power
equivalence between sodium chloride (NaCl) and potassium chloride (KCl). 3) Produce six
tomato sauce formulations with 50% NaCl substitution. 4) Characterize the sauces produced by
the perception of trained tasters and consumers, using quantitative descriptive analysis (ADQ)
and check all that apply (CATA); and dynamically using TI and temporal dominance of
sensations (TDS). 5) Evaluate the acceptance of the sauces in a classic and dynamic way, using
the acceptance test and the temporal acceptance test. 6) Use electroencephalography (EEG) and
hedonic scale to evaluate the neuronal response of individuals when consuming salt-reduced
tomato sauce. The ideal concentration of NaCl was 0.87%. KCl had 75% of the salty capacity
of NaCl in a 1: 1 ratio (w / w), either alone or in association with monosodium glutamate,
disodium inosinate, Aji-100 (kokumi aroma) and lysine. However, if combined with disodium
inosinate + disodium guanylate (50% \ 50%; w / w) mixture, the salty power of KCl was reduced
to 60%. The samples showed a larger differences related to the attributes of the flavor, in
detriment to the appearance, aroma and texture. In ADQ, significant differences in taste: sweet,
bitter and metallic were evidenced, while in CATA the bitter taste differed between the samples.
The TI analysis showed lower absolute value of bitter taste in the NaCl sample when compared
to the others, however, the main finding of the method was the duration of bitter taste (TTOT).
It was observed that the time of onset of bitter taste did not change in the presence of flavor
enhancers, while the time of disappearance showed significant differences. Samples containing
umami promoting substances (MSG, IG, IMP and AJI-100) had a shorter duration of bitter taste
compared to others containing potassium chloride (KCL and LYS). TDS was efficient in
describing the samples, characterizing as dominant attributes those which did not necessarily
demonstrate high intensity in the other tests (e.g., flavoring / herbs, and acidic taste). The
stimulation of frontal and temporal cortices plays an important role in food acceptance, and
monosodium glutamate or disodium inosinate association with KCL strongly stimulated this
region. The use of potassium chloride as a substitute for sodium chloride in tomato sauce was
most efficient if carried out partially, i.e., the replacement of a maximum of 60% NaCl. It is
also important to emphasize the sensory improvement of KCl in the presence of small
concentrations of flavor enhancers, monosodium glutamate and disodium inosinate.
Keywords: Flavor enhancers, salt reduction, potassium chloride, sensory analysis.
SUMÁRIO
1. INTRODUÇÃO GERAL ................................................................................................... 12
2. OBJETIVOS ....................................................................................................................... 17
2.1 Objetivo Geral .................................................................................................................... 17 2.2 Objetivos Específicos ......................................................................................................... 17
3. REVISÃO BIBLIOGRÁFICA .......................................................................................... 18
3.1 Tomate ................................................................................................................................ 18 3.2 Consumo de sal e saúde ...................................................................................................... 21 3.3 Redução De Sódio .............................................................................................................. 23
3.3.1 Cloreto de potássio ..................................................................................................... 26 3.3.2 Realçadores de sabor .................................................................................................. 28
3.4 Análise Sensorial ................................................................................................................ 29 3.4.1 Análise Descritiva Quantitativa (ADQ) ...................................................................... 32 3.4.2 Análise Tempo – Intensidade ...................................................................................... 33 3.4.3 Check All That Apply .................................................................................................. 34
3.4.4 Temporal Dominance of Sensations ........................................................................... 34 3.4.5 Teste de Aceitação ...................................................................................................... 35
3.4.6 Teste de Aceitação Temporal. ..................................................................................... 37 3.4.7 Teste do ideal (Just-about-right/JAR) ......................................................................... 37
3.5 Eletroencefalografia............................................................................................................ 38
ARTICLE 1: THE IMPACT OF SODIUM REDUCTION AND FLAVOR
ENHANCERS ADDITION ON THE CLASSICAL AND CONSUMER-BASED
SENSORY PROFILING OF TOMATO SAUCE. .............................................................. 39
1. INTRODUCTION .............................................................................................................. 41
2. MATERIAL AND METHODS ......................................................................................... 42
2.1 Tomato ingredients ............................................................................................................. 42 2.2 Salts and flavor enhancers .................................................................................................. 42
2.3 Tomato sauce elaboration ................................................................................................... 42 2.3.1 Experimental design ................................................................................................... 43
2.4 Sensory Analysis ................................................................................................................ 43
2.5 Just About Right Test ......................................................................................................... 44 2.6 Time-Intensity Analysis ..................................................................................................... 44 2.7 Quantitative Descriptive Analysis ...................................................................................... 44 2.8 Check-all-that-apply and Acceptance Test ......................................................................... 45 2.9 Multiple Factor Analysis .................................................................................................... 46
3. RESULTS AND DISCUSSION ......................................................................................... 46
3.1 JAR-Test ............................................................................................................................. 46 3.2 Salty taste equivalence through Time-Intensity Analysis .................................................. 46
3.3 Quantitative Descriptive Analysis ...................................................................................... 48 3.4 Check-all-that-apply (CATA) ............................................................................................ 50 3.5 Acceptance Test .................................................................................................................. 51 3.6 External Preference Map .................................................................................................... 52
3.7 Multiple Factor Analysis .................................................................................................... 53
4. CONCLUSIONS ................................................................................................................. 55
5. REFERENCES ................................................................................................................... 56
ARTICLE 2: DYNAMIC ASPECTS OF SALT REDUCTION IN TOMATO SAUCE
BY USE OF FLAVOR ENHANCERS AND BITTER BLOCKER .................................. 62
1. INTRODUTION ................................................................................................................. 64
2. MATERIAL AND METHODS ......................................................................................... 65
2.1 Tomato sauce and salts ....................................................................................................... 65
2.2 Sensory Analysis ................................................................................................................ 66
2.2.1 Time-Intensity ............................................................................................................. 66 2.2.2 Temporal Dominance of Sensations (TDS) ................................................................ 67 2.2.3 Temporal Acceptance Analysis ................................................................................... 68
2.3 Data Analysis ...................................................................................................................... 68
3. RESULTS AND DISCUSSION ......................................................................................... 68
3.1 Time-Intensity Analysis (TI) .............................................................................................. 68
3.2 Temporal Dominance of Sensations (TDS)........................................................................ 72 3.3 Temporal Acceptance Analysis .......................................................................................... 73
4. CONCLUSIONS ................................................................................................................. 75
SHORT CONTRIBUTION: ELECTROENCEPHALOGRAPHY AND HEDONIC
SCALE TO EVALUATE SALT REDUCTION EFFICACY IN TOMATO SAUCE. .... 81
ABSTRACT ............................................................................................................................ 82
2. MATERIAL AND METHODS............................................................................................ 84
2.1 Tomato sauce base .............................................................................................................. 84 2.2 Salts .................................................................................................................................... 84
2.3 Participants ......................................................................................................................... 84 2.4 Stimulating taste ................................................................................................................. 85 2.5 Sensory analysis ................................................................................................................. 85 2.6 Procedure ............................................................................................................................ 85 2.7 Electrodes and data collection ............................................................................................ 86
2.8 Results analysis .................................................................................................................. 86
3. RESULTS AND DISCUSSION ......................................................................................... 86
4. CONCLUSION ................................................................................................................... 92
5. REFERENCES ................................................................................................................... 93
4. DISCUSSÃO GERAL ........................................................................................................ 98
5. CONCLUSÃO GERAL ................................................................................................... 102
6. REFERÊNCIAS BIBLIOGRÁFICAS ........................................................................... 103
12
1. INTRODUÇÃO GERAL
O sal de cozinha é composto por cloreto de sódio (NaCl), iodato de potássio e os
antiumectantes: ferrocianeto de sódio e dióxido de silício. O NaCl é o constituinte majoritário,
e também a principal substância responsável pelo gosto salgado (BANNWART; PINTO e
SILVA; VIDAL, 2015). Considerado um dos ingredientes mais antigos utilizados no preparo
dos alimentos, o sal, tem como funções sensoriais principais a estimulação do gosto salgado e
também realce do sabor, por promover supressão seletiva sobre sabores indesejáveis como o
amargo (BRESLIN; BEAUCHAMP, 1997). Além da função sensorial o cloreto de sódio exerce
funções tecnológicas importantes nos alimentos como a modificação da solubilidade de
proteínas e o auxílio no processo conservativo, principalmente pela redução do valor de
atividade de água (Aw) (ALBARRACÍN et al., 2011).
O sódio (Na+) é um dos elementos mais comuns, sendo encontrado principalmente
solúvel em águas oceânicas, lacustre, e em regiões onde os antigos mares, agora evaporados,
banhavam. O Na+ é componente vital de praticamente todas as formas de vida terrestres, dentre
outras funções, regulando a osmolaridade dos tecidos. O corpo humano contém
aproximadamente 100 gramas de Na+, contudo por participar ativamente dos processos
envolvendo balanço de líquidos, nosso organismo espolia sódio constantemente, fazendo
necessária sua reposição pela ingestão (ROYAL SOCIETY OF CHEMISTRY, 2019). O sódio
é um micronutriente essencial para dieta humana, visto que um consumo mínimo de
aproximadamente 200 mg por dia se faz necessário para manutenção da saúde (AL-OTAIBI;
WILBEY, 2006). Contudo, seu consumo excessivo está fortemente associado à ocorrência de
algumas Doenças Crônicas Não Transmissíveis (DCNT), como hipertensão arterial, doença
cardiovascular e doenças renais (MCLEAN, 2014; MENETON et al., 2005).
As DCNT matam aproximadamente 38 milhões de pessoas a cada ano, destas
mortes calcula-se que 42% ocorrem em indivíduos com idade inferior aos 70 anos,
categorizando-se como mortes prematuras. O relatório da Organização Mundial da Saúde
(OMS) aponta maior prevalência das mortes prematuras ocasionadas por DCNT em países de
média e baixa renda (WHO, 2015). O grupo de estudo cooperativo Intersalt, bem como dados
combinados de outros estudos, têm evidenciado em centros industrializadas, uma média de
ingestão de sódio variando entre 3000-4500 mg por dia, o equivalente à uma ingestão diária
entre 7,7-11,5g de sal de cozinha (BROWN et al., 2009; LAW; FROST; WALD, 1991). Esses
dados contrastam com a proposta da Organização Mundial de Saúde (OMS/WHO), que
13
recomenda uma ingestão máxima diária de 2000mg de sódio, equivalente a cinco gramas de sal
culinário (WHO, 2012). Foram identificadas iniciativas de redução de sal em trinta e dois
países, entre eles: Brasil, Inglaterra, Estados Unidos, Japão. As estratégias adotadas são
multifacetadas e geralmente elaboradas e lideradas pelos governos. Essas consistem
principalmente na reformulação dos alimentos, iniciativas de conscientização do consumidor e
ações de rotulagem (WEBSTER et al., 2011). Para os alimentos industrializados são
desenvolvidas diretrizes que estimulam sua reformulação reduzindo o sódio de forma parcial e
progressiva ao decorrer dos anos (NILSON et al., 2017).
Alimentos processados e refeições preparadas em restaurantes são as principais
fontes de sódio da dieta de países desenvolvidos, chegando a constituir 75% do sódio ingerido
diariamente (BROWN et al., 2009). O sucesso de mercado de produtos industrializados pode
ser relacionado à evolução da tecnologia de alimentos e as mudanças ocorridas no padrão
alimentar das sociedades contemporâneas, que tem buscado cada vez mais comodidade e
praticidade no preparo e consumo de alimentos. Entre os alimentos processados de maior
consumo, e que se destacam como alvos de políticas de redução de sódio destacam-se: pães,
produtos cárneos processados, queijos, temperos, molhos e refeições congeladas (MHURCHU
et al., 2011).
Ao avaliar a concentração média de sódio em molhos de tomate industrializados
comercializados no Brasil; Silva, Coutinho e Azevedo, (2015) reportaram que a faixa de sódio
encontrada em uma porção de 100g de produto variava de 443,33mg - 868,33. Yonamine et
al., (2005) produziram molhos de tomate sem adição de sal e para efetuar a redução do sal,
avaliaram compêndios de tabelas de valor nutricional brasileiros encontrando um valor médio
de 325 - 488 mg de sódio por 100g como valor referência para molhos de tomate brasileiros.
O molho de tomate é o produto do processamento de tomate — atomatado — mais
consumido em todo o mundo (MARTÍNEZ-HUÉLAMO et al., 2015). Neste cenário, a
industrialização do tomate representa uma importante demanda comercial, pois além de resultar
em produtos de maior valor nutricional, com propriedades funcionais, ainda evita perdas e
desvalorização comercial da safra, por atuar como método conservativo reduzindo o teor de
água livre (CAMARGO; HAJ-ISA; QUEIROZ, 2007; DA-SILVA et al., 2010).
O aumento de valor nutricional observado em atomatados é dado principalmente
pelo aumento do teor e da disponibilidade de licopeno quando comparado ao tomate fresco in
14
natura (GÄRTNER; STAHL; SIES, 1997). Todavia esse apelo funcional pode ser prejudicado
pelo alto teor de sódio encontrado em molhos de tomate, e isso, pode interferir no seu consumo
dado a tendência crescente pelo consumo de alimentos com menor teor de sódio (BURTON;
WANG; WORSLEY, 2015; YONAMINE et al., 2005).
O desenvolvimento de molho de tomate com teor de sódio reduzido deve conservar
ao máximo o sabor característico da receita tradicional, preservando as características sensoriais
e a aceitação do produto. Alguns sais são utilizados como substitutos do NaCl, como cloreto de
cálcio, magnésio e potássio. Dentre esses, cloreto de potássio é o mais semelhante
sensorialmente e tecnologicamente. Todavia, ainda apresenta sabor amargo e metálico, sendo
muitas vezes associado a realçadores de sabor para amenizar seus defeitos sensoriais.
A utilização de substituintes de cloreto de sódio (NaCl) como cloreto de potássio
(KCl), e realçadores de sabor como glutamato monossódico, inosinato dissódico, guanilato
dissódico, Aji-100 (aroma de kokumi) e lisina, representam uma estratégia viável para redução
de sódio em alimentos (BARYŁKO-PIKIELNA; KOSTYRA, 2007; CAMPAGNOL; DOS
SANTOS; et al., 2012; DOS SANTOS, et al., 2015; FELTRIN et al., 2015; KILCAST; DEN
RIDDER, 2007; PIETRASIK; GAUDETTE, 2014; SHAH et al., 2010; ZHUANG et al., 2016).
Para o uso de alegações no rótulo de baixo, muito baixo e isento de sódio, os alimentos prontos
para o consumo devem fornecer no máximo 120mg, 40mg e 5mg de sódio por 100g,
respectivamente. As alegações comparativas de redução de sódio podem ser utilizadas quando
o alimento tiver uma redução mínima de 25 % no seu teor de sódio e essa redução for
equivalente a no mínimo 120mg de sódio por 100g ou 100ml de alimento (ANVISA, 2012).
Trabalhos vêm sendo desenvolvidos com o intuito de reduzir o teor de sódio em
diversos alimentos industrializados como: margarina (LOPES et al., 2014), salsicha
(GELABERT et al., 2003; PAULSEN et al., 2014), queijo (CRUZ et al., 2011), presunto cozido
(PIETRASIK; GAUDETTE, 2014) e molho de queijo (WEST; SEETHARAMAN; DUIZER,
2013). Entretanto, trabalhos considerando a redução de sódio na matriz molho de tomate foram
pobremente explorados e são ainda escassos.
Esse tipo de modificação pode interferir na qualidade sensorial do produto,
prejudicando a sua aceitação junto aos consumidores e consequentemente seu sucesso
comercial. Desta forma, a fim de minimizar possíveis prejuízos financeiros com a modificação
15
dos alimentos “tradicionais”, é importante que se realizem estudos sensoriais ao decorrer do
processo de reformulação dos alimentos (BAYARRI et al., 2011; SIRÓ et al., 2008).
As indústrias e centros de pesquisas em alimentos utilizam diferentes abordagens
nos estudos sensoriais. Pela via clássica os métodos mais utilizados são a Análise Descritiva
Quantitativa (ADQ) e Análise Tempo-Intensidade (TI), por fornecerem informações valiosas,
robustas e precisas para auxiliar o desenvolvimento, reformulação e marketing de produtos,
através do julgamento de provadores treinados (SOKOLOWSKY; ROSENBERGER;
FISCHER, 2015). Quando o perfil sensorial precisa ser gerado de forma rápida, as
metodologias Check-All-That-Apply (CATA), Temporal dominance of sensations (TDS) e
suas variações que também fornecem valiosas informações à cerca do produto, são as mais
aplicadas (BRAGHIERI et al., 2016; KREMER et al., 2016). Além da caracterização e do perfil
sensorial, são necessários testes que avaliam a percepção dos consumidores sobre os produtos,
assim como suas preferências. O teste de aceitação sensorial com escala hedônica não
estruturada é a metodologia mais utilizada a fim de aferir o gostar e desgostar dos consumidores
em relação a um produto (JUYUN, 2011).
Dados oriundos das vias neurais responsáveis pela integração do sinal gerado com
o consumo de um alimento são importantes para consolidar o fenômeno envolvido no consumo.
Assim, a utilização da eletroencefalografia para analisar os sinais bioelétricos neurofisiológicos
envolvidos com o estimulo do gosto salgado na língua, promovido tanto pelo NaCl quanto pelo
KCl e intensificadores de sabor podem agregar conhecimento ao estudo sensorial (HASHIDA
et al., 2005).
O EEG popularmente utilizado como ferramenta para auxilio de diagnóstico em
neurologia é uma ferramenta capaz de monitorar a atividade elétrica do cérebro. O método é de
baixo custo, não invasivo, onde os eletrodos são posicionados em regiões delimitadas da cabeça
e medem as flutuações de tensão resultante da corrente iônica dentro dos neurônios do cérebro
(NUNEZ; SRINIVASAN, 2009). O EEG já foi utilizado com êxito para avaliar o
comportamento da estimulação neural de chicletes sem sabor e saborizados (YAGYU et al.,
1998), discriminação dos estímulos doce e salgado em solução aquosa (HASHIDA et al., 2005),
aceitação de cerveja (GONZALEZ VIEJO et al., 2018), soluções adoçadas com sacarose e
edulcorantes (ANDERSEN et al., 2018). Contudo a resposta neural do gosto salgado quando
promovido por diferentes íons, como K+, ou até mesmo por nucleotídeos como, inosinato e
guanilato dissódico, ainda não foi observada.
16
Diante das propostas e estratégias internacionais implementadas em prol da redução
do conteúdo de sódio nos alimentos, e dos benefícios do consumo do tomate na forma de molho,
estudos que investigam as propriedades tecnológicas e sensoriais da redução de NaCl e sua
consequente substituição por KCl, afim de continuar a gerar o gosto salgado no alimento se
mostram importantes por produzirem informações valiosas à cerca da compreensão da redução
de sódio e o desenvolvimento do produto.
17
2. OBJETIVOS
2.1 Objetivo Geral
O trabalho teve por objetivo, elaborar diferentes tipos de molho de tomate com
redução e substituição parcial de sódio, assim como caracterizar as amostras de molho de
tomate utilizando a Análise Descritiva Quantitativa (ADQ) e Check-All-That-Apply (CATA),
determinar o perfil sensorial dinâmico através dos métodos Análise Tempo Intensidade e
Temporal Dominance of Sensations (TDS), coletar informações dos consumidores sobre sua
aceitação de molhos de tomate com redução de sódio e também por meio de
eletroencefalografia, a respeito da resposta neural promovida pelo gosto salgado.
2.2 Objetivos Específicos
• Determinar a quantidade ideal de NaCl que será adicionada ao molho de tomate
padrão desenvolvido, por meio da utilização do teste do ideal (JAR) para o gosto salgado.
• Determinar a equivalência do gosto salgado nas amostras com redução de sódio
por meio da metodologia da Análise Tempo-Intensidade.
• Elaborar formulações de molho de tomate com redução e substituição parcial de
50% do sódio, utilizando cloreto de potássio (KCl), glutamato monossódico, inosinato
dissódico, guanilato dissódico, kokumi e o aminoácido lisina, em concentrações equivalentes a
concentração determinada como ideal para molho de tomate.
• Avaliar os perfis descritivos gerados pela percepção de assessores treinados e
consumidores respectivamente pelos testes: Análise Descritiva Quantitativa (ADQ) e Check-
All-That-Apply (CATA). Correlacionar os dados descritivos com dados hedônicos obtidos por
meio do teste de aceitação.
• Avaliar os perfis descritivos dinâmicos das amostras, pela percepção de assessores
treinados e consumidores respectivamente pelos testes Tempo-intensidade (TI) e Temporal
Dominance of Sensations (TDS). Correlacionar os dados descritivos com dados hedônicos
obtidos por meio do teste de aceitação temporal.
• Avaliar por eletroencefalograma a resposta neural do estimulo salgado gerado por
diferentes sais como: NaCl, KCl, e KCl + realçadores de sabor.
18
3. REVISÃO BIBLIOGRÁFICA
3.1 Tomate
O tomate (Lycopersicum escullentun mill) é o fruto proveniente do tomateiro que
pertence à família Solanácea (PEREIRA, 2007). Originário da parte ocidental das Américas
Central e do Sul, o cultivo do fruto foi propagado para todos os continentes (DE-MELO, 2012).
Desta forma o tomate se tornou uma mercadoria de comercialização internacional, sendo
considerado uma importante commodity, com produção anual de tendência crescente (FAO,
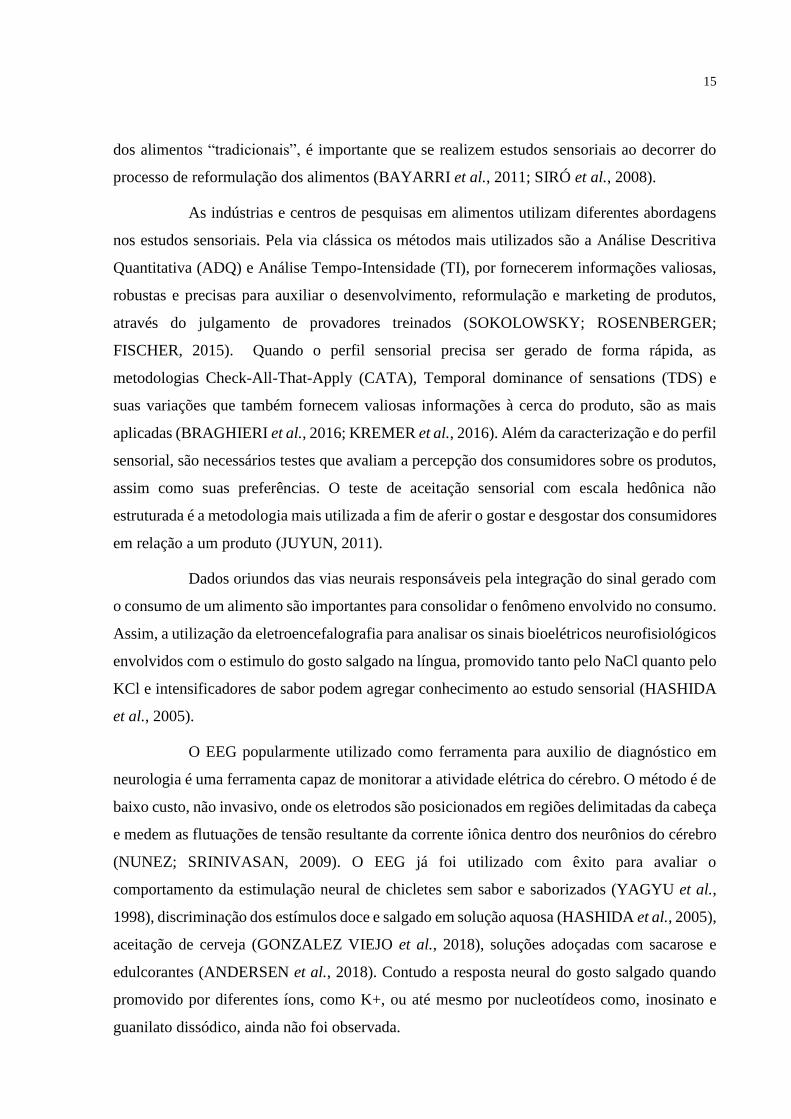
2019; HELYES; LUGASI; PÉK, 2012). Atingiu em 2017 valores de produtividade superiores
a 182 milhões de toneladas (Figura 1), e somente no Brasil a produção foi superior a 4 milhões
de toneladas em 2017 (Figura 2). Nos dados de produtividade estão incluídos o tomate de mesa
e o destinado ao processamento nas formas de extrato de tomate, tomate em conservas, molhos
de tomate (FAO, 2019).
Figura 1. Produção mundial de tomate. Fonte: FAOSTAT, 2019. (http://www.fao.org/faostat/en/#compare)
19
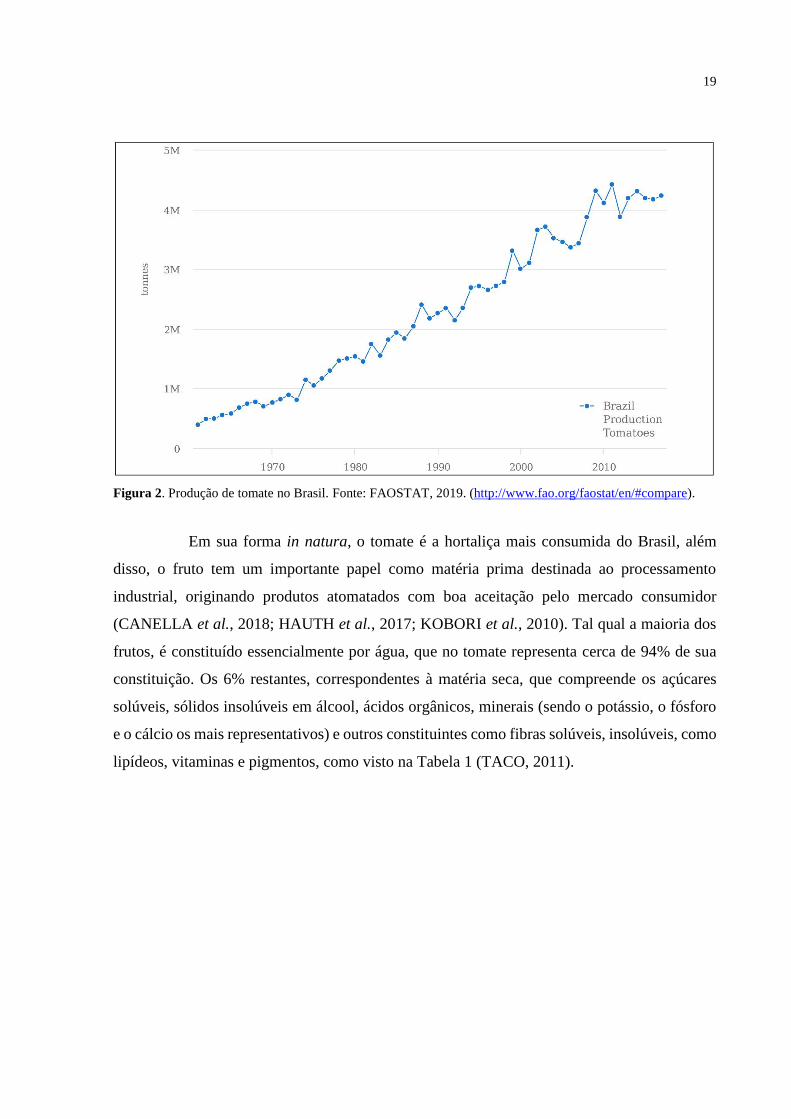
Figura 2. Produção de tomate no Brasil. Fonte: FAOSTAT, 2019. (http://www.fao.org/faostat/en/#compare).
Em sua forma in natura, o tomate é a hortaliça mais consumida do Brasil, além
disso, o fruto tem um importante papel como matéria prima destinada ao processamento
industrial, originando produtos atomatados com boa aceitação pelo mercado consumidor
(CANELLA et al., 2018; HAUTH et al., 2017; KOBORI et al., 2010). Tal qual a maioria dos
frutos, é constituído essencialmente por água, que no tomate representa cerca de 94% de sua
constituição. Os 6% restantes, correspondentes à matéria seca, que compreende os açúcares
solúveis, sólidos insolúveis em álcool, ácidos orgânicos, minerais (sendo o potássio, o fósforo
e o cálcio os mais representativos) e outros constituintes como fibras solúveis, insolúveis, como
lipídeos, vitaminas e pigmentos, como visto na Tabela 1 (TACO, 2011).
20
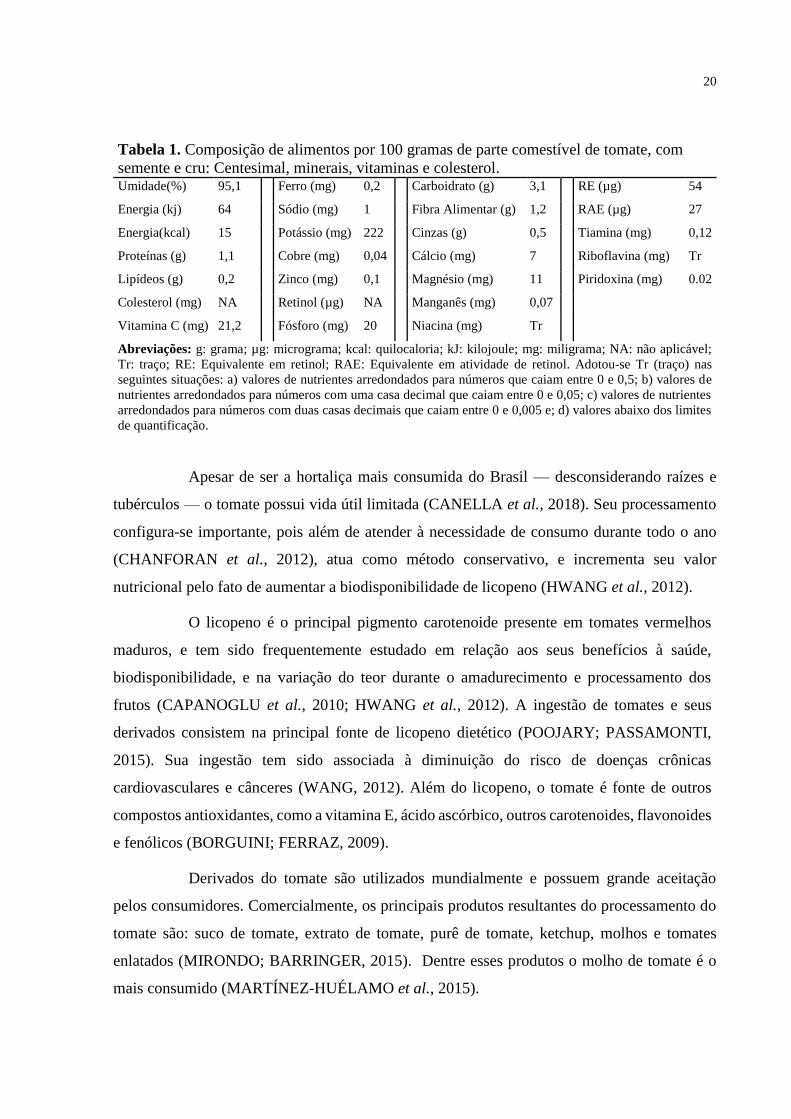
Tabela 1. Composição de alimentos por 100 gramas de parte comestível de tomate, com
semente e cru: Centesimal, minerais, vitaminas e colesterol. Umidade(%) 95,1 Ferro (mg) 0,2 Carboidrato (g) 3,1 RE (µg) 54
Energia (kj) 64 Sódio (mg) 1 Fibra Alimentar (g) 1,2 RAE (µg) 27
Energia(kcal) 15 Potássio (mg) 222 Cinzas (g) 0,5 Tiamina (mg) 0,12
Proteínas (g) 1,1 Cobre (mg) 0,04 Cálcio (mg) 7 Riboflavina (mg) Tr
Lipídeos (g) 0,2 Zinco (mg) 0,1 Magnésio (mg) 11 Piridoxina (mg) 0.02
Colesterol (mg) NA Retinol (µg) NA Manganês (mg) 0,07
Vitamina C (mg) 21,2 Fósforo (mg) 20 Niacina (mg) Tr
Abreviações: g: grama; µg: micrograma; kcal: quilocaloria; kJ: kilojoule; mg: miligrama; NA: não aplicável;
Tr: traço; RE: Equivalente em retinol; RAE: Equivalente em atividade de retinol. Adotou-se Tr (traço) nas
seguintes situações: a) valores de nutrientes arredondados para números que caiam entre 0 e 0,5; b) valores de
nutrientes arredondados para números com uma casa decimal que caiam entre 0 e 0,05; c) valores de nutrientes
arredondados para números com duas casas decimais que caiam entre 0 e 0,005 e; d) valores abaixo dos limites
de quantificação.
Apesar de ser a hortaliça mais consumida do Brasil — desconsiderando raízes e
tubérculos — o tomate possui vida útil limitada (CANELLA et al., 2018). Seu processamento
configura-se importante, pois além de atender à necessidade de consumo durante todo o ano
(CHANFORAN et al., 2012), atua como método conservativo, e incrementa seu valor
nutricional pelo fato de aumentar a biodisponibilidade de licopeno (HWANG et al., 2012).
O licopeno é o principal pigmento carotenoide presente em tomates vermelhos
maduros, e tem sido frequentemente estudado em relação aos seus benefícios à saúde,
biodisponibilidade, e na variação do teor durante o amadurecimento e processamento dos
frutos (CAPANOGLU et al., 2010; HWANG et al., 2012). A ingestão de tomates e seus
derivados consistem na principal fonte de licopeno dietético (POOJARY; PASSAMONTI,
2015). Sua ingestão tem sido associada à diminuição do risco de doenças crônicas
cardiovasculares e cânceres (WANG, 2012). Além do licopeno, o tomate é fonte de outros
compostos antioxidantes, como a vitamina E, ácido ascórbico, outros carotenoides, flavonoides
e fenólicos (BORGUINI; FERRAZ, 2009).
Derivados do tomate são utilizados mundialmente e possuem grande aceitação
pelos consumidores. Comercialmente, os principais produtos resultantes do processamento do
tomate são: suco de tomate, extrato de tomate, purê de tomate, ketchup, molhos e tomates
enlatados (MIRONDO; BARRINGER, 2015). Dentre esses produtos o molho de tomate é o
mais consumido (MARTÍNEZ-HUÉLAMO et al., 2015).
21
Entre os atomatados, apenas ketchup e concentrados possuem definição pela
legislação brasileira. Ketchup é tido como o produto elaborado a partir da polpa de frutos
maduros do tomateiro (Lycopersicum esculentum L.), adicionados ou não de ingredientes, desde
que, não descaracterize o produto final (ANVISA, 2005). Concentrado de tomate é o produto
obtido da polpa de frutos do tomateiro, devendo conter, no mínimo 6% de sólidos solúveis
naturais de tomate, podendo ser adicionado de sal e ou açúcar (ANVISA, 2005, BACARAT,
2018). De acordo com a legislação da ANVISA — Resolução RDC nº.276, de 22 de setembro
de 2005, que se estende à molhos derivados de tomate: “molhos são produtos em forma líquida,
pastosa, emulsão ou suspensão à base de especiaria(s) e ou tempero(s) e ou outro(s)
ingrediente(s), fermentados ou não, utilizados para preparar e ou agregar sabor ou aroma aos
alimentos e bebidas” (ANVISA, 2005).
Tradicionalmente, para obtenção do molho de tomate, retira-se a pele e as sementes
dos tomates, e posteriormente os mesmos são picados e misturados com óleo vegetal, açúcar,
sal e condimentos. Os condimentos mais utilizados na fabricação de molho de tomate são: alho,
cebola e especiarias (Alecrim, Manjericão, Orégano, Tomilho e Salsa). Esta mistura é então
aquecida, até que se obtenha um líquido viscoso pronto para o consumo (MONTEIRO, 2008).
3.2 Consumo de sal e saúde
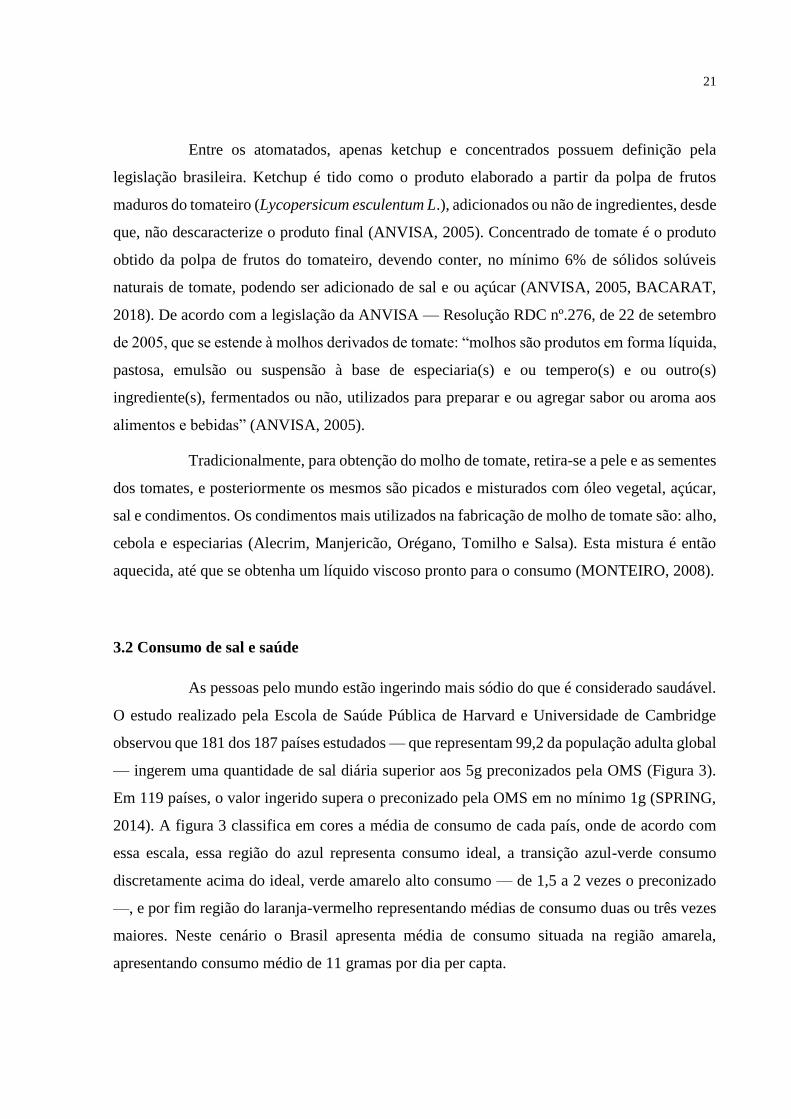
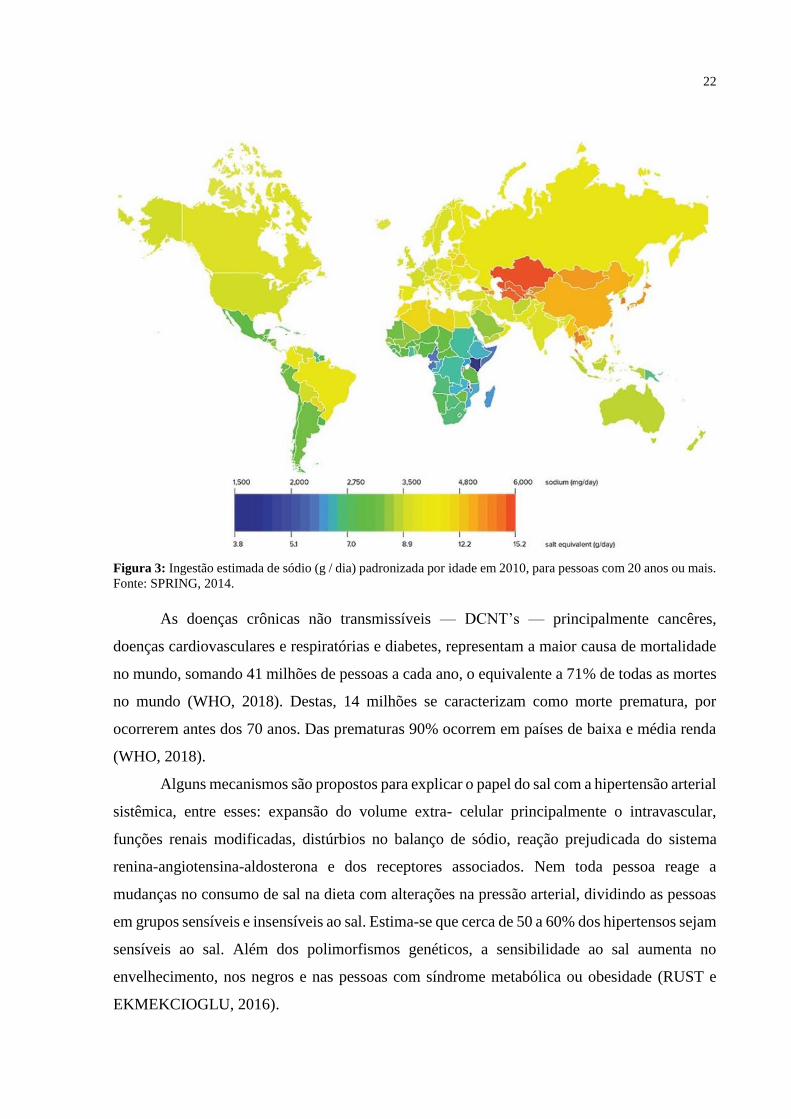
As pessoas pelo mundo estão ingerindo mais sódio do que é considerado saudável.
O estudo realizado pela Escola de Saúde Pública de Harvard e Universidade de Cambridge
observou que 181 dos 187 países estudados — que representam 99,2 da população adulta global
— ingerem uma quantidade de sal diária superior aos 5g preconizados pela OMS (Figura 3).
Em 119 países, o valor ingerido supera o preconizado pela OMS em no mínimo 1g (SPRING,
2014). A figura 3 classifica em cores a média de consumo de cada país, onde de acordo com
essa escala, essa região do azul representa consumo ideal, a transição azul-verde consumo
discretamente acima do ideal, verde amarelo alto consumo — de 1,5 a 2 vezes o preconizado
—, e por fim região do laranja-vermelho representando médias de consumo duas ou três vezes
maiores. Neste cenário o Brasil apresenta média de consumo situada na região amarela,
apresentando consumo médio de 11 gramas por dia per capta.
22
Figura 3: Ingestão estimada de sódio (g / dia) padronizada por idade em 2010, para pessoas com 20 anos ou mais.
Fonte: SPRING, 2014.
As doenças crônicas não transmissíveis — DCNT’s — principalmente cancêres,
doenças cardiovasculares e respiratórias e diabetes, representam a maior causa de mortalidade
no mundo, somando 41 milhões de pessoas a cada ano, o equivalente a 71% de todas as mortes
no mundo (WHO, 2018). Destas, 14 milhões se caracterizam como morte prematura, por
ocorrerem antes dos 70 anos. Das prematuras 90% ocorrem em países de baixa e média renda
(WHO, 2018).
Alguns mecanismos são propostos para explicar o papel do sal com a hipertensão arterial
sistêmica, entre esses: expansão do volume extra- celular principalmente o intravascular,
funções renais modificadas, distúrbios no balanço de sódio, reação prejudicada do sistema
renina-angiotensina-aldosterona e dos receptores associados. Nem toda pessoa reage a
mudanças no consumo de sal na dieta com alterações na pressão arterial, dividindo as pessoas
em grupos sensíveis e insensíveis ao sal. Estima-se que cerca de 50 a 60% dos hipertensos sejam
sensíveis ao sal. Além dos polimorfismos genéticos, a sensibilidade ao sal aumenta no
envelhecimento, nos negros e nas pessoas com síndrome metabólica ou obesidade (RUST e
EKMEKCIOGLU, 2016).
23
3.3 Redução De Sódio
O sódio e o potássio são minerais essenciais para a regulação dos fluidos
intracelulares e extracelulares. O fluido extracelular é composto principalmente de sódio,
cloreto e íons de bicarbonato, enquanto o líquido intracelular difere significativamente do
líquido extracelular, por apresentar, por exemplo, grandes quantidades de íons de potássio,
magnésio e fosfato, em vez dos íons de sódio e cloreto, encontrados no liquido extracelular. A
homeostase dos líquidos corporais é essencial para a atividade celular e tecidual, e se relaciona
com parâmetros sistêmicos como a regulação da pressão arterial (HALL; GUYTON, 2017).
A identificação das fontes modernas de sódio na dieta, principalmente aquelas
relacionadas aos alimentos, é crítica para se desenvolver estratégias que promovam a redução
da ingestão de sódio em todo o mundo (ANDERSON et al., 2010). Alimentos processados
(BROWN et al., 2009) e refeições consumidas foras de casa (HARNACK et al., 2017)
representam a principal fonte de sódio na dieta de países industrializados, chegando a constituir
valores superiores a dois terços da ingesta diária total.
O sal de cozinha, constituído majoritariamente por cloreto de sódio, é
predominantemente utilizado como tempero salgante no preparo de alimentos. Contudo
também é utilizado como conservante e realçador de gosto doce. O NaCl, assim como outras
substâncias que contêm sódio em sua composição, como glutamato monossódico, além da
utilização caseira, são largamente adicionados nos alimentos processados industrialmente. O
consumo de alimentos processados ricos em açucares, gorduras e sódio, deve ser limitado de
maneira a reduzir o risco do desenvolvimento de doenças crônicas não transmissíveis (DCNT),
como por exemplo, doenças coronarianas, hipertensão e câncer (MOREIRA et al., 2018;
RAUBER et al., 2018).
O consumo excessivo de sódio tem sido relacionado a vários tipos de doenças
crônicas, e entre elas destacam-se a doença renal (DRC) (ANDERSON et al., 2015), câncer
gástrico (TSUGANE et al., 2004), asma (CAREY; LOCKE; COOKSON, 1993), osteoporose
(MARTINI et al., 2000), e principalmente a hipertensão arterial sistêmica e doenças
cardiovasculares (SINNAKIROUCHENAN; KOTCHEN, 2014). Desde 2007, a Organização
Mundial de Saúde (OMS) tem apoiado o desenvolvimento e implementação de estratégias
nacionais de redução do consumo de sal, por criação de redes de parceria com as organizações
regionais ao redor do mundo (WHO, 2008). Observa-se hoje que a grande maioria dos países
24
possuem programas de redução da ingestão de sódio, e os que ainda não tem estão em fase de
desenvolvimento (WEBSTER et al., 2011).
No Brasil o plano de Ações Estratégicas para o Enfrentamento das Doenças
Crônicas Não-Transmissíveis 2011–2022, foi proposto pelo governo federal a fim de promover
a redução dos fatores de risco associados às DCNT. Uma das ações propostas pelo plano é a
redução do consumo de sal pela população em geral, visto que o brasileiro consome
praticamente o dobro da quantidade de sal recomendada pela Organização Mundial da Saúde
(MINISTÉRIO DA SAÚDE, 2011).
As estratégias propostas para a redução do consumo de sódio no Brasil foram:
Promoção da alimentação saudável (estímulo ao consumo de frutas, hortaliças e racionalização
da utilização de sal como tempero). Realização de ações educativas visando a importância da
redução da adição de sal nos alimentos para profissionais de saúde, manipuladores, fabricantes
de alimentos e para população, e reformulação dos alimentos processados (BRASIL, 2018).
No Brasil, em novembro de 2010, com a renovação do Fórum de Alimentação
Saudável, entre o Ministério da Saúde e a Associação Brasileira de Indústrias de Alimentos
(ABIA), foi definido o compromisso pela redução voluntária do teor de sódio nos alimentos
processados, como contribuição do setor produtivo às ações para a redução do consumo de
sal/sódio no Brasil, cujo objetivo é a redução do consumo de para abaixo de 5g de sal per capita
diários (equivalentes a 2000mg de sódio) até 2020 (BRASIL, 2018).
Além disso, foram realizados acordos com a indústria para a redução do teor das
gorduras trans e, recentemente, novos acordos voluntários de metas de redução de sal em 10%
ao ano até 2022, em massas instantâneas, pão de forma industrializado, bisnaguinha
industrializada, pão francês, bolo pronto sem recheio, bolo pronto recheado, rocambole,
misturas para bolo aerado, bolo cremoso, salgadinhos de milho, batatas fritas e palhas, biscoito
doce, biscoito salgado, biscoito doce recheado, caldos líquidos e em gel, caldos em pó e em
cubos, temperos em pasta, temperos para arroz, demais temperos, queijo muçarela, requeijão,
hambúrgueres, linguiça cozida (conservada em temperatura ambiente), linguiça cozida
(conservada em refrigeração), linguiça frescal, mortadela (conservada em refrigeração),
mortadela (conservada em temperatura ambiente), salsicha, presuntaria, empanados, sopas
individuais/instantâneas (IDEC, 2014; MINISTÉRIO DA SAÚDE, 2011).
25
Desde o início da pesquisa envolvendo a redução de sódio, diferentes sais foram
propostos e testados como sais substitutos ao NaCl, entre esses: cloreto de magnésio (MgCl2),
cloreto de cálcio (CaCl2) e cloreto de potássio (KCl). Em relação aos outros, KCl é o que
apresenta melhor correspondência sensorial, além de promover efeitos nutricionais positivos
(CEPANEC et al., 2017) quando comparado ao sódio, i.e., sua baixa correlação com a
hipertensão arterial. A baixa ingestão de potássio associada a alta relação plasmática Na+/K+
apresenta forte associação dose-resposta com a hipertensão arterial (DU et al., 2013). Assim,
em relação ao apelo à saúde, o potássio é a melhor escolha para substituir o sódio,
principalmente nos casos relacionados à alta incidência de hipertensão.
No entanto, apesar da maior similaridade sensorial do KCl em relação ao NaCl —
quando comparado ao MgCl2 e ao CaCl2 — diferenças consideráveis ainda são reconhecidas
entre os sais. Tecnologicamente, observam-se alterações na velocidade das reações enzimáticas
e no efeito conservante. Sensorialmente, o cloreto de potássio é reconhecido presença de gostos
desagradáveis como amargo e metálico (Thibaudeau, Roy e St-Gelais, 2015; Wu et al., 2016;
Yotsuyanagi et al., 2016). A principal estratégia utilizada para corrigir os defeitos sensoriais do
KCl é a sua combinação com realçadores de sabor para melhorar seu gosto salgado e mascarar
outros sabores indesejáveis. Entre esses, os mais utilizados são: glutamato monossódico,
inosinato de sódio, guanilato de sódio, hidrolisado proteico vegetal e ácido guanílico.
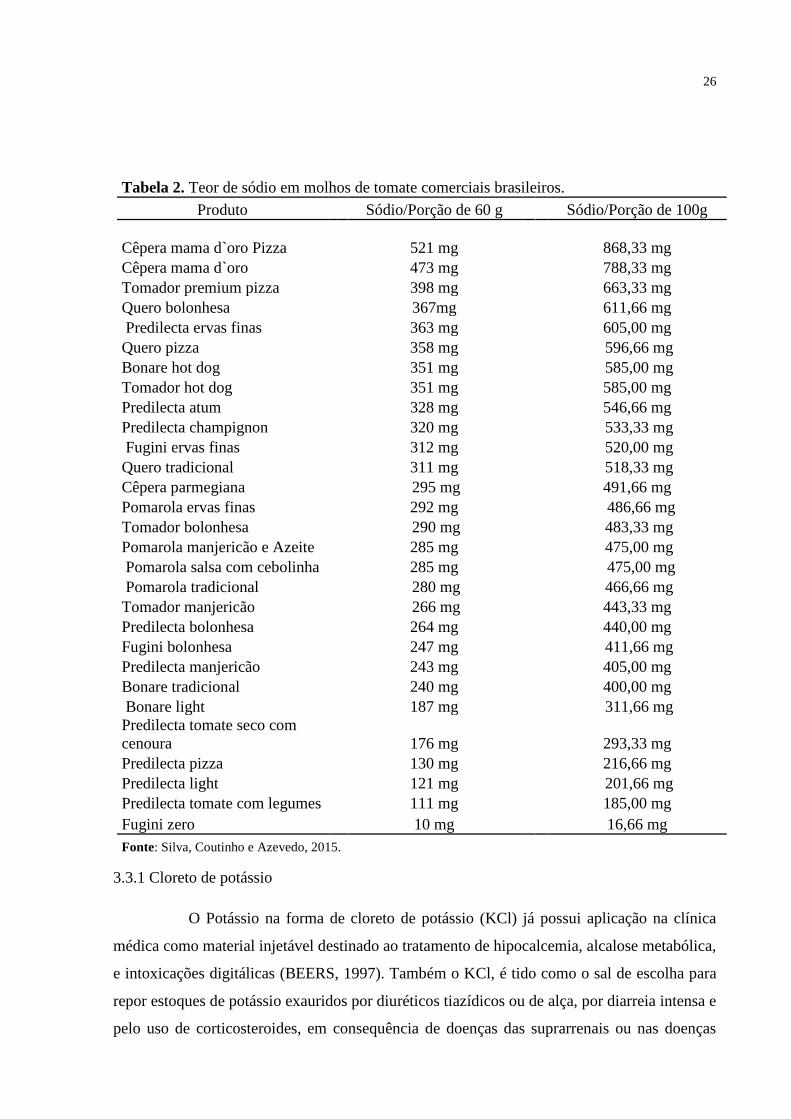
Em molhos de tomate industrializados, Yonamine et al., (2005) encontraram um
elevado teor de sódio 325 - 488 mg por 100g de produto. Silva; Coutinho e Azevedo, (2015)
que avaliaram o teor de sódio em molhos de tomate comerciais no Brasil, a faixa de sódio
encontrada foi ainda mais ampla, como pode ser observado na Tabela 2. Enquanto Huynh e
Danhi (2016), realizaram um estudo piloto para determinar a concentração de sódio ideal em
molhos de tomate por consumidores do produto e encontraram valor médio de 1280mg/100g
do produto.
Para o uso de alegações no rótulo de baixo, muito baixo e isento de sódio, os
alimentos prontos para o consumo devem fornecer no máximo 120mg, 40mg e 5mg de sódio
por 100g ou ml, respectivamente. A INC, também chamada de declaração de propriedade
nutricional ou de alegação nutricional, exige redução ou aumento de no mínimo 25% na
quantidade do nutriente objeto da INC comparativa, ou seja, para alegação de molho de tomate
com redução de sódio, uma redução mínima de 25% do teor de sódio do produto original deve
ser realizada (ANVISA, 2017).
26
Tabela 2. Teor de sódio em molhos de tomate comerciais brasileiros.
Produto Sódio/Porção de 60 g Sódio/Porção de 100g
Cêpera mama d`oro Pizza 521 mg 868,33 mg
Cêpera mama d`oro 473 mg 788,33 mg
Tomador premium pizza 398 mg 663,33 mg
Quero bolonhesa 367mg 611,66 mg
Predilecta ervas finas 363 mg 605,00 mg
Quero pizza 358 mg 596,66 mg
Bonare hot dog 351 mg 585,00 mg
Tomador hot dog 351 mg 585,00 mg
Predilecta atum 328 mg 546,66 mg
Predilecta champignon 320 mg 533,33 mg
Fugini ervas finas 312 mg 520,00 mg
Quero tradicional 311 mg 518,33 mg
Cêpera parmegiana 295 mg 491,66 mg
Pomarola ervas finas 292 mg 486,66 mg
Tomador bolonhesa 290 mg 483,33 mg
Pomarola manjericão e Azeite 285 mg 475,00 mg
Pomarola salsa com cebolinha 285 mg 475,00 mg
Pomarola tradicional 280 mg 466,66 mg
Tomador manjericão 266 mg 443,33 mg
Predilecta bolonhesa 264 mg 440,00 mg
Fugini bolonhesa 247 mg 411,66 mg
Predilecta manjericão 243 mg 405,00 mg
Bonare tradicional 240 mg 400,00 mg
Bonare light 187 mg 311,66 mg
Predilecta tomate seco com
cenoura 176 mg 293,33 mg
Predilecta pizza 130 mg 216,66 mg
Predilecta light 121 mg 201,66 mg
Predilecta tomate com legumes 111 mg 185,00 mg
Fugini zero 10 mg 16,66 mg
Fonte: Silva, Coutinho e Azevedo, 2015.
3.3.1 Cloreto de potássio
O Potássio na forma de cloreto de potássio (KCl) já possui aplicação na clínica
médica como material injetável destinado ao tratamento de hipocalcemia, alcalose metabólica,
e intoxicações digitálicas (BEERS, 1997). Também o KCl, é tido como o sal de escolha para
repor estoques de potássio exauridos por diuréticos tiazídicos ou de alça, por diarreia intensa e
pelo uso de corticosteroides, em consequência de doenças das suprarrenais ou nas doenças
27
tubulares renais. Pode também ser usado em pacientes nos quais a depleção de potássio
representa risco elevado, como pacientes cirróticos ou digitalizados (BRUNTON; CHABNER;
KNOLLMANN, 2012).
A carência dietética de potássio, assim como o consumo exacerbado de sódio, são
comuns em dietas modernas. A principal consequência disso é o aumento da pressão arterial.
Um dos mecanismos que descreve esse aumento é mostra que a deficiência dietética de potássio
ativa o cotransportador Na+-Cl- sensível à tiazida, mesmo em situações onde ocorre alta
ingestão de NaCl, causando retenção de sódio e assim promovendo aumento da pressão arterial
(TERKER et al., 2015). Assim, uma nova utilização para o KCl tem emergido quando
comercializado na forma de sal hipossódico, para fim alimentar. Segundo à ANVISA na
portaria nº 54, de 04 de julho de 1995 como “produto elaborado a partir da mistura de cloreto
de sódio, cloreto de potássio e iodo com outros sais, de modo que a mistura final mantenha
poder salgante semelhante ao do sal de mesa fornecendo, no máximo, 50% do teor de sódio na
mesma quantidade de cloreto de sódio” (ANVISA, 1995).
O cloreto de potássio (KCl) é o principal substituto do cloreto de sódio utilizado na
reformulação de alimentos (BAMPI et al., 2016), apresentando aproximadamente 80% da
capacidade de salgar, contudo, se utilizado em grande quantidade, apresenta sabor metálico e
amargo, o que restringe a substituição total ou em grande proporção do cloreto de sódio (CRUZ
et al., 2011). Muitos trabalhos desenvolveram diferentes tipos de alimentos com substituição
parcial de cloreto de sódio por cloreto de potássio: Salsichas Bologna (CAMPAGNOL;
ESPINDOLA; et al., 2012); Bacon defumado (WU et al., 2015); salame (RIBEIRO et al.,
2014); queijo halloumi (TOUFEILI et al., 2012); mortadela (HORITA et al., 2011) e queijo
minas frescal (FARIA et al., 2011). Observou-se em todos os trabalhos, a nível sensorial, a
existência de uma proporção adequada para as substituições dos sais a fim de preservar a
aceitação e as características dos produtos desenvolvidos.
Feltrin et al., (2015) testaram vários substituintes de NaCl em solução aquosa por meio
do método de equivalência de gosto salgado utilizando a metodologia de estimativa de
magnitude (STONE; OLIVER, 1969), e os valores encontrados de potência do gosto salgado
de: cloreto de potássio, glutamato de monossódico, fosfato de potássio, lactato de cálcio e
lactato de potássio (comparados à uma solução aquosa de cloreto de sódio a 0,75%), foram
74,75%, 59,52%, 60,48%, 11,40% e 4,96% respectivamente.
28
Uma avaliação posterior dos perfis sensoriais temporais dos sais substitutos (cloreto de
potássio, glutamato de monossódico, fosfato de potássio, lactato de cálcio e lactato de potássio)
revelou que o gosto salgado era percebido no início do consumo, porém, outros gostos,
incluindo amargo, ácido, umami e um sabor indesejável não identificado, eram percebidos após
a sensação do gosto salgado (FELTRIN et al., 2015). O cloreto de potássio foi o único que
apresentou perfil sensorial temporal análogo ao do cloreto de sódio, e com menor produção de
sabores indesejados (BANNWART; PINTO E SILVA; VIDAL, 2015).
3.3.2 Realçadores de sabor
3.3.2.1 Glutamato monossódico
O glutamato monossódico (GSM) é a principal substância responsável pelo gosto
umami (PHAT; MOON; LEE, 2016). O mesmo é conhecido mundialmente por melhorar o
sabor dos alimentos, realçando o sabor de carnes e vegetais, sopas e molhos (MALULY;
ARISSETO-BRAGOTTO; REYES, 2017; YAMAGUCHI; NINOMIYA, 2018). Sais de ácido
glutâmico foram descobertos pela primeira vez em 1908, quando o professor Kikunae Ikeda,
um cientista japonês identificou e isolou o gosto “umami” atribuído ao ácido glutâmico, ele
classificou o umami como quinto gosto básico, se juntando ao gosto doce, ácido, salgado, e
amargo (JINAP; HAJEB, 2010).
GSM é o sal sódico do ácido glutâmico que atua como um realçador de sabor.
Amplamente utilizado em alimentos, visa intensificar por meio do ácido glutâmico, sabores
relacionados ao gosto salgado. O glutamato ocorre naturalmente em alimentos proteicos, como
carnes, frutos do mar, ensopados, sopas e molhos (RANGAN; BARCELOUX, 2008).
O Codex Alimentarius classifica o glutamato e seus principais sais, glutamato
monossódico, glutamato monopotássico, diglutamato de cálcio, glutamato monoamônio e
diglutamato de magnésio, como intensificadores de sabor (CAC, 2018). Geralmente, na
produção de alimentos industrializados adiciona-se GSM na concentração de 0,1-0,8%, o que
é semelhante à concentração de glutamato livre em tomates ou parmesão (BEYREUTHER et
al., 2007). Em diversos trabalhos observa-se a versatilidade da adição de GSM nos alimentos,
como: caldo de galinha (DAGET; GUION, 1989), hambúrguer com carne de peixe
(QUADROS et al., 2015); rissole de carne de porco (GAO; ZHANG; ZHOU, 2014); salsicha
(PAULSEN et al., 2014) e queijos (GRUMMER et al., 2012).
29
3.3.2.2 Guanilato Dissódico
Segundo o Comitê de Especialistas da FAO/WHO em Aditivos Alimentares –
JECFA (1993), o guanilato dissódico, também conhecido como 5'-Guanilato dissódico, é o sal
dissódico do intensificador de sabor monofosfato de guanosina (GMP). Apresenta-se como um
pó cristalino, inodoro, incolor ou esbranquiçado, normalmente utilizado em sinergia com o
glutamato monossódico. É ainda um aditivo alimentar que pode ser usado segundo as boas
práticas de fabricações delineadas no preâmbulo do Codex GSFA (General Standard for Food
Additives), em diversos gêneros alimentícios entre eles: embutidos, aperitivos, sopas
instantâneas, molhos, pratos prontos e queijos processados (CAC, 2018).
3.3.2.3 Inosinato Dissódico
Segundo o Comitê de Especialistas da FAO/WHO em Aditivos Alimentares –
JECFA (1993), o inosinato dissódico, também conhecido como Disodium inosine-5'-
monophosphate, é o sal dissódico do intensificador de sabor inosina monofosfato (IMP),
encontrado em forma de um pó cristalino, inodoro, incolor ou esbranquiçado, normalmente
usado em sinergia com o glutamato monossódico e o guanilato dissódico. Também pode ser
usado segundo as boas práticas de fabricações delineadas no preâmbulo do Codex GSFA
(General Standard for Food Additives), em diversos gêneros alimentícios entre eles: embutidos,
aperitivos, sopas instantâneas, molhos, pratos prontos e queijos processados (CAC, 2018).
3.4 Análise Sensorial
Compreender as causas que direcionam a escolha de certos alimentos em relação a
outros pelos consumidores é um desafio para os pesquisadores da área de alimentos, pois os
consumidores não detêm de conhecimento técnico e na maioria das vezes se expressam de
forma intuitiva e pessoal (DONOGHUE, 2000). Com isso, a forma de processar seus dados e
assim interpretar suas preferências pode ser a chave para o sucesso de produtos alimentícios
(ASTROM, GOLDMAN E HEINIO, 2006).
Os testes sensoriais têm evoluído com o desenvolvimento humano, desde seu início
onde humanos primitivos avaliavam a viabilidade de um alimento colhido ou armazenado,
quando de forma sistemática passaram a utilizar os órgãos do sentido para determinar a
viabilidade de alimentos, água, abrigo e tudo que poderia ser usado ou consumido. Contudo, o
surgimento da comercialização gerou a necessidade de se realizar testes sensoriais um pouco
30
mais formais, como por exemplo os mercadores, que retiravam pequenas amostras de um
carregamento e provavam afim de melhor conhecer as mercadorias negociadas (TEIXEIRA,
2009). Com o tempo, foram desenvolvidas técnicas para classificar vinhos, chás, cafés,
manteigas, peixes e carnes, alguma delas permanecem até hoje (MEILGAARD; CIVILLE;
CARR, 2016).
Na Contemporaneidade, a análise sensorial, também denominada avaliação
sensorial, é definida como a ciência que estuda as formas de medir, analisar e interpretar as
reações das pessoas aos produtos percebidos pelos sentidos da visão, olfato, tato, paladar e
audição. O valor da ciência reside no uso de um número limitado de consumidores para chegar
a decisões que podem ser extrapoladas para populações maiores com confiança (STONE,
2018). A análise sensorial tem aplicabilidade em diferentes etapas da produção e
comercialização de um alimento, que vão dos processos de fabricação aos estudos de vida de
prateleira e comercialização (DUTCOSKY, 2013; VIDIGAL et al., 2015). As metodologias
sensoriais podem ser divididas em três grandes grupos: métodos discriminativos, métodos
analíticos ou descritivos e métodos afetivos. Onde cada grupo abrange diferentes testes, com
objetivos específicos e conjunto de provadores distintos (TEIXEIRA, 2009).
Os testes sensoriais discriminativos ou de diferença são considerados métodos
objetivos que possuem como característica minimizar o hedonismo dos provadores. Os
atributos são avaliados pela discriminação simples, indicado por comparações, e os dados
gerados visam indicar se existem ou não diferenças estatísticas entre amostras. Os testes
discriminativos ou de diferença mais empregados em análise sensorial são o triangular, duo-
trio, ordenação, comparação pareada e comparação múltipla ou diferença do controle
(ZENEBON; PASCUET; TIGLEA, 2008).
Os testes sensoriais analíticos ou descritivos descrevem os atributos ou parâmetros
sensoriais que são percebidos nas amostras, podendo analisar de modo estático ou dinâmico
(DEVEZEAUX DE LAVERGNE et al., 2015). Os testes descritivos são agrupados em dois
grandes grupos: metodologias clássicas (representada principalmente pela ADQ) e
metodologias rápidas (ARES, 2015). Na via clássica, destacam-se as metodologias Análise
Descritiva Quantitativa (ADQ) e Análise Tempo-Intensidade (TI). Apesar da primeira utilizar
abordagem estática e a segunda dinâmica, tais metodologias conservam características
semelhantes como:
31
1 – Utilização de métodos para levantamento de atributos, como repertory grid
onde a equipe sensorial define previamente os termos relativos às propriedades mais relevantes
do produto e sua sequência os avaliam.
2 – Utilizam equipe de provadores aprovados em testes de aptidão sensorial básica,
como teste triangular e duo-trio.
3 – Os provadores aptos recebem treinamento em relação ao uso da escala e das
referências, e após o treinamento são avaliados estatisticamente quanto a sua repetibilidade e
reprodutibilidade.
4 – As analises são realizadas geralmente em triplicatas ou quadruplicatas.
A fim de melhor complementar os perfis descritivos dos produtos, é comum
combinar as metodologias ADQ e TI (ALBERT et al., 2011). Essas metodologias são
características por seus resultados consistentes, robustos e reprodutíveis, gerando resultados
detalhados acerca de atributos presentes nas amostras (CADENA; BOLINI, 2011; LAWLESS;
HEYMANN, 2010; TAYLOR; PANGBORN, 1990). Contudo, o rigor metodológico proposto
nas abordagens clássicas possuem como características negativas a dispendiosidade e a
laboriosidade, o que estimulou o desenvolvimento das metodologias descritivas classificadas
neste estudo como rápidas ( LAWLOR, 2014).
Na prática industrial cotidiana, a necessidade de informação descritiva é agora
muito diversificada, e os serviços sensoriais são frequentemente sobrecarregados com
demandas de partes interessadas que podem ter múltiplos objetivos. Assim, as metodologias
descritivas rápidas surgem com intuito de agilizar o processo de avaliação e conseguir a grande
demanda por velocidade e inovação do mercado alimentar. Dentre os diversos métodos
desenvolvidos destacam-se: Flash Profile, Check All That Apply, Temporal Dominance of
Sensations, Temporal Check All That Apply, Polarized Sensory Positioning e Temporal Liking
(ARES; VARELA, 2018; BREDIE et al., 2017; CASTURA et al., 2016; GALMARINI;
VISALLI; SCHLICH, 2017; MEYNERS, 2016a; VIDAL et al., 2018). As seguintes
características em comum são encontradas nas metodologias rápidas:
1 – Podem utilizar painel de consumidores.
2 – Dispensam treinamento.
32
3 – Se realizados com consumidores, utilizam “n” amostral grande (n >50),
dispensando replicatas.
Os testes afetivos são uma importante ferramenta, pois obtém diretamente a opinião
(preferência ou aceitação) do consumidor em relação a ideias, características específicas ou
globais de determinado produto, sendo, por isso, também denominados testes de consumidor.
Os dados da aceitação geralmente são usados indiretamente para indicar a preferência do
consumidor, por meio de análises estatísticas (STONE; BLEIBAUM; THOMAS, 2012).
3.4.1 Análise Descritiva Quantitativa (ADQ)
A Análise Descritiva Quantitativa surgiu como uma possibilidade de caracterizar
produtos, permitindo assim que produtos semelhantes pudessem ser analisados de forma
minuciosa, aferindo seus atributos e assim permitindo uma visualização das semelhanças e
diferenças. E com isso, ao se correlacionar com os dados de aceitação, fica melhor evidente
quais atributos são relevantes e que consequentemente causam maior impacto na aceitação de
um produto (STONE; BLEIBAUM; THOMAS, 2012).
A princípio a ADQ agrupa os atributos em quatro grupos relacionados aos órgãos
do sentido: sabor, textura, aparência e aroma (CIVILLE; CARR, 2015). Os atributos são
escolhidos através de metodologias de triagem como o Kelly’s Repertory Grid (método de
Rede) (BRUZZONE et al., 2015). A ideia consiste em produzir um perfil sensorial com alto
grau de detalhamento, como por exemplo no estudo de Cadena et al., (2014) que avaliando
iogurtes funcionais encontrou os seguintes descritores: gosto doce, gosto azedo, sabor de leite,
sabor baunilha, sabor doce residual e sabor azedo residual
A ADQ é versátil e sua aplicação pode ser feita em produtos comerciais,
ingredientes, processos de desenvolvimento e armazenamento, determinação da vida útil de
prateleira, visualização de diferenças sensoriais em produtos concorrentes, verificação do perfil
sensorial de produtos em desenvolvimento, controle de qualidade de produtos industriais e
obtenção de dados que se correlacionem com propriedades físico-químicas (MEILGAARD;
CIVILLE; CARR, 2016).
Devido ao maior grau de precisão e refino, a ADQ, utiliza um menor número de
provadores — 8 à 12 geralmente —, onde a fim de garantir maior confiabilidade os mesmos
passam por um processo pré-seleção, levantamento de termos descritores, reuniões de consenso,
33
treinamento e seleção (STONE; BLEIBAUM; THOMAS, 2012). A análise estatística de dados
resultantes de testes sensoriais tem aproximado os resultados de medidas sensoriais com
resultados de medidas instrumentais, isso aumenta a confiabilidade e a precisão dos testes
sensoriais (BETT et al., 1993).
Utiliza-se vários procedimentos estatísticos para análise de dados oriundos de testes
sensoriais, entre eles histograma de frequência, análise de variância (ANOVA) e análises
multivariadas. A análise de componentes principais (ACP) representa uma das a principais
análises multivariada aplicada em testes sensoriais (STONE; BLEIBAUM; THOMAS, 2012).
ACP objetiva transformar um grande conjunto de variáveis em um conjunto menor
de variáveis independentes, realçando uma estrutura subjacente que possa existir em um grande
conjunto de dados. Possibilitando a visualização da relação de um grande número de variáveis
em dimensões denominadas fatores (componentes), que permitem explicar a variação (em %)
dos dados observados (VARELLA, 2008).
3.4.2 Análise Tempo – Intensidade
O tempo é reconhecidamente importante na música e nos esportes, porém também
é unidade fundamental no consumo de alimentos e bebidas (LUCIA et al., 2004; LYTRA et al.,
2016). O papel do tempo em relação aos alimentos é evidenciado nas mudanças que ocorrem
no sabor, aroma e textura durante a degustação. A apreciação do amargor da cerveja, do frutado
em doces, da condimentação de embutidos, está fortemente relacionada às características
temporais desses estímulos (DIJKSTERHUIS; PIGGOTT, 2000).
Na TI os provadores são continuamente monitorados. O software é encarregado de
coletar e armazenar toda a variação da resposta gerada pelo estímulo, desde o início da análise
(momento em que colocam o alimento na boca) até o final (após a deglutição ao ouvir o sinal
sonoro soado pelo programa). Como essa análise também utiliza um número reduzido de
provadores — 10 a 12—, é necessária etapa de pré-seleção e monitoramento dos provadores,
através de análise de consenso e de valores de repetibilidade e discriminação das amostras. O
analista sensorial está apto para quantificar as contínuas mudanças na percepção que ocorrem
no respectivo atributo ao longo do tempo previamente determinado (LAWLESS; HEYMANN,
2010).
34
Os dados oriundos da Análise tempo-intensidade são expressos geralmente na
forma de curvas tempo x intensidade que mostram as variações da intensidade em relação ao
tempo durante a percepção sensorial do provador (DIJKSTERHUIS; PIGGOTT, 2000). Vários
parâmetros podem ser extrapolados a partir destas curvas, e entre eles os mais explorados em
análise sensorial são a intensidade máxima, tempo de intensidade máxima, área total da curva
e tempo total (CADENA; BOLINI, 2011; GOODSTEIN et al., 2014; SOKOLOWSKY;
FISCHER, 2012), que permitem a avaliação objetiva das mudanças temporárias, bem como a
comparação entre as curvas TI obtidas para diferentes produtos, provadores ou sessões
(LORIDO et al., 2015).
3.4.3 Check All That Apply
O questionário CATA permite que os consumidores selecionem os atributos que
são relevantes para eles em relação a um produto, diferente da ADQ eles não são forçados a
selecionar e marcar atributos que não reconhecem. Desta forma CATA foi relatado como mais
intuitivo, mais amigável ao consumidor e com impacto mínimo na percepção do consumidor
sobre o produto e, portanto, minimiza o processamento cognitivo (NG; CHAYA; HORT, 2013).
O questionário CATA é um formato de perguntas nas quais os respondentes são
apresentados a uma lista estruturada de termos e solicitados a selecionar todos aqueles que se
aplicam à amostra focal (JAEGER et al., 2015). A principal vantagem de um questionário
CATA é que ele permite que vários atributos sejam selecionados, uma análise em conjunto, não
havendo a limitação de individualizar a resposta ou desviar a atenção e avaliar atributos
específicos (DOS-SANTOS et al., 2015).
Uma vez que o CATA se trata da seleção de atributos percebidos, contidos em uma
lista finita de descritores, pode-se utilizar inicialmente o teste Q de Cochran por se tratar de
respostas binárias de um experimento em blocos não repetidos. E assim como as metodologias
clássicas, pode-se avaliar os resultados do CATA junto ao teste de consumidores, por meio do
mapa externo de preferencias (PARENTE, 2011).
3.4.4 Temporal Dominance of Sensations
A metodologia TDS foi criada no Centre Européen des Sciences du Goût, mais
precisamente no laboratório LIRIS em 1999, sendo apresentada a comunidade cientifica no
Pangborn Symposium por Pineau, Cordelle e Schlich no ano de 2003 (RODRIGUES, 2017). O
35
princípio do método consiste em avaliar a sequência de sensações dominantes de um produto
em um intervalo de tempo, assim o teste identifica a evolução (início, meio e fim) das sensações
presentes no produto. Os provadores são instruídos a marcar o atributo que está exercendo
dominância sobre o outro e mantê-lo selecionado até que uma nova sensação assuma a
dominância (PINEAU et al., 2009). O termo “Dominante" é definido para os provadores como
como a sensação que atrai mais atenção, sendo a mais marcante naquele momento, não se
tratando necessariamente da mais intensa (ESMERINO et al., 2017).
A característica que melhor define o TDS quando comparado a outras metodologias
descritivas, é o seu perfil de avaliação do tipo multiatributo e de dominância, ou seja, o teste
permite avaliar todos atributos em simultâneo aplicando o conceito de dominância ao invés da
abordagem de intensidade clássica. O TDS é uma metodologia versátil e sua utilização foi
exitosa em diferentes tipos de produtos como: vinhos tintos parcialmente desalcoolizados,
amargor em vinho branco, azeites extra virgem oriundos de diferentes regiões da Itália, palitos
de peixe e chocolates com diferentes teores de cacau (ALBERT et al., 2012; DINNELLA et
al., 2012; MEILLON; URBANO; SCHLICH, 2009; RODRIGUES, F. M. et al., 2016;
SOKOLOWSKY; FISCHER, 2012).
Rotineiramente os dados coletados durante o TDS são: nome da sensação
dominante, momento (tempo) em que a dominância foi detectada e duração da dominância,
assim os dados são representados em curvas, denotando a taxa de dominância de cada sensação
ao decorrer do tempo estipulado pela amostra (PINEAU et al., 2009). O tempo total de amostra
pode ser determinado previamente pelos pesquisadores, ou pode ser livre. Na segunda forma é
considerado fim do teste quando o marcador “Nenhuma sensação” é selecionado pelo provador.
Assim o eixo x representa o curso do tempo de teste (segundos) enquanto o eixo y representa a
taxa de dominância das sensações. Além disso duas linhas — chance e significância — são
plotadas para auxiliar a interpretação dos resultados. A linha chance marca o limite da
probabilidade de um atributo ter sido marcado ao acaso, já a linha de significância corresponde
ao valor mínimo para o atributo em questão ser considerado como sendo significativamente
dominante (CORRÊA et al., 2015).
3.4.5 Teste de Aceitação
A Análise de Aceitação é uma metodologia tradicional, que se mostra valiosa e
presente em praticamente todos os estudos sensoriais realizados. A classificação hedônica
36
representa uma característica natural da resposta humana aos alimentos e seus estímulos.
Envolve o gostar e desgostar de uma pessoa, influenciando diversas atitudes, como: preferência
entre dois ou mais produtos, aceitação de produtos, frequência de consumo e intenção de
compra (MOSKOWITZ, 1983). A análise de aceitação tem como objetivo obter informações
importantes e relevantes dos consumidores de um determinado produto, refletidas no grau em
que os consumidores gostaram ou desgostaram de tal produto (STONE.; BLEIBAUM;
THOMAS, 2012).
Os consumidores podem ser claros sobre quais produtos gostam e não gostam,
contudo nem sempre são capazes de descrever especificamente por que gostam ou não de um
produto (STOKES; O’SULLIVAN; KERRY, 2017). Além disso, quando os dados da aceitação
são analisados por técnicas estatísticas uni variadas, assume-se que o critério de aceitabilidade
dos consumidores seja homogêneo, o que implica que os valores obtidos desta forma, podem
não refletir a média real. Por esta razão a variabilidade individual dos dados deve também ser
considerada, e a estrutura dos dados analisada. Tais análises podem ser realizadas pelo método
estatístico denominado Mapa de Preferência Interno (CARDELLO-BOLINI E FARIA, 2000).
O mapa de preferência interno (MDPREF) é uma importante ferramenta para
identificar a preferência individual do consumidor ou de um grupo de consumidores em relação
aos outros, algo que não é possível através dos testes de médias (MACFIE e THOMSON, 1988).
Nesse caso, os critérios avaliados são identificados como dimensões que ocupam posições
ortogonais em uma representação gráfica. Assim, permitem que as amostras sejam
representadas como pontos e os consumidores com critério principal de preferência, como
vetores. Aliada à análise de variância e testes de médias, o Mapa de Preferência Interno pode
complementar a análise de aceitação de um produto, explicando as preferências dos
consumidores, que tornam-se assim informações valiosas (CARDELLO; SILVA; DAMÁSIO,
2006).
A análise de regressão de mínimos quadrados parciais (Partial Least Squares
Regression – PLSR) correlaciona os dados obtidos pelo teste de aceitação com os dados obtidos
pelos testes descritivos do consumidor. Por meio desta relação entre dados descritivos
sensoriais e dados hedônicos, as características sensoriais associadas com o produto ideal para
os consumidores podem ser identificadas (DE MELO, 2008). A Regressão por Mínimos
Quadrados Parciais é uma técnica útil na análise de preferência do consumidor, que generaliza
e combina características da análise de componentes principais (ACP) e regressão múltipla
37
(ABDI; WILLIAMS, 2013). Para essas correlações, é importante que os produtos testados
estejam em número suficientemente grande e sejam diferentes entre si(THYBO; KÜHN;
MARTENS, 2004).
3.4.6 Teste de Aceitação Temporal.
A percepção da intensidade dos atributos varia em relação ao tempo, e como
consequência a isso a aceitação também se comporta dinamicamente (MEYNERS, 2016b).
Desta forma a metodologia Aceitação Temporal (TA), pode ser aplicada a fim de produzir notas
de aceitação em diferentes pontos do tempo e assim permitir uma correlação temporal com
dados obtidos das metodologias TDS e TI.
O teste de aceitação temporal, assim como o teste de aceitação clássico, pede que o
consumidor determine o quanto ele gosta ou desgosta dos parâmetros intrínsecos dos produtos
como: aparência, aroma, sabor, textura e impressão global. Contudo, diferente do teste clássico
que avalia apenas o momento imediatamente posterior ao consumo, o teste temporal pede que
o consumidor refaça a avaliação em momentos padronizados após a ingestão.
3.4.7 Teste do ideal (Just-about-right/JAR)
A escala do ideal é um dos métodos sensoriais mais utilizados para se mensurar a
quantidade ideal de um determinado componente a ser adicionado para provocar a melhor
aceitação e preferência de um grupo de provadores (ESMERINO et al., 2013). A escala do ideal
é um dos métodos mais utilizados devido a sua validade e confiabilidade que os resultados
apresentam (POPPER et al., 2004). Na determinação da concentração ideal, a equipe de
provadores avalia as amostras e registra suas respostas em escala específica, indicando o quão
ideal estas amostras estão, em relação ao atributo que se deseja avaliar, como por exemplo, a
doçura ou gosto salgado (ESMERINO, et al., 2013; VICKERS, 1988).
Os dados obtidos por teste do ideal são normalmente submetidos a análises estatísticas
como regressão linear simples, e também gráficos de distribuição (em porcentagem), onde as
respostas sensoriais se encontram em função da concentração do componente que varia
(CARDOSO; BATTOCHIO; CARDELLO, 2006).
38
3.5 Eletroencefalografia
Os potenciais elétricos cerebrais possuem uma frequência particular de
acontecimentos, isso ocorre pela alteração do potencial de membrana de populações de
neurônios. O fluxo elétrico produzido pelos potenciais pós-sinápticos a partir dos potenciais de
ação dos axônios, funcionam como uma rede de transferência de informação que integra os
neurônios conectados (BONINI-ROCHA et al., 2008). A teoria da polarização clássica diz que
eventos extrínsecos promovem a propagação de corrente elétrica de um determinado axônio
para os dendritos da fenda conseguinte (GANONG, 2003).
A eletroencefalografia (EEG) é uma técnica que monitora os sinais elétricos
cerebrais, pela captação dos sinais bioelétricos da superfície do couro cabeludo, utilizando pares
de eletrodos com ventosas e pasta condutora, não sendo invasivo ao paciente. Assim a EEG é
formada geralmente por 20 eletrodos posicionados em regiões especificas, correspondentes as
regiões de interesse do cérebro, como frontal, temporal e parietal amplificadores de sinal
(contendo filtros compatíveis), dispositivo para aquisição de dados e um sistema de
processamento de sinais (CANTARELLI ; STEVAN-JR, 2016).
Classicamente EEG é utilizado em diagnostico de condições patológicas cerebrais
como hemorragias, tumores, isquemia, abuso de álcool e drogas, cefaleias e enxaquecas,
epilepsia e distúrbios do sono (como narcolepsia). Porém como o cérebro integras diversos
estímulos, o eletroencefalograma pode ser extrapolado para produzir respostas coerentes dos
estímulos gustatórios básicos, doce, salgado, amargo, ácido e umami, a aplicação da
metodologia pode-se mostrar valida visando correlacionar com dados de analise sensorial
(ANDERSEN et al., 2018; GONZALEZ VIEJO et al., 2018; HASHIDA et al., 2005).
O EEG já foi utilizado com êxito para avaliar o comportamento da estimulação
neural de chicletes sem sabor e saborizados (YAGYU et al., 1998), discriminação dos estímulos
doce e salgado em solução aquosa (HASHIDA et al., 2005), aceitação de cerveja (GONZALEZ
VIEJO et al., 2018), soluções adoçadas com sacarose e edulcorantes (ANDERSEN et al., 2018).
39
ARTICLE 1: THE IMPACT OF SODIUM REDUCTION AND FLAVOR ENHANCERS
ADDITION ON THE CLASSICAL AND CONSUMER-BASED SENSORY
PROFILING OF TOMATO SAUCE.
Elson Rogério Tavares Filho1, Erick Almeida Esmerino2, Alessandra Cazzelato Lins da Silva1,
Helena Maria André Bolini1.
1State University of Campinas (UNICAMP), Food and Nutrition Department, Cidade
Universitária “Zeferino Vaz”, s/n, Campinas, São Paulo, Brazil, 13083-862
2 Federal Rural University of Rio de Janeiro (UFRRJ) - DTA, Seropédica – RJ- 23.890-000,
Brasil.
Author for correspondence:
Elson Rogério Tavares Filho.
State University of Campinas – FEA, Food and Nutrition Department
80 Monteiro Lobato (St), Campinas, São Paulo, Brasil, Zip code: 13083862
Tel: +55 (19) 3521-4059
40
ABSTRACT
An increase in the demand for lower-sodium foods which provide health benefits or prevent
diseases, has contributed to the reformulation of processed foods. The objective of this work
was to reduce the sodium content in tomato sauce by 50% and assess its impact on the sensory
profile. In order to develop a healthier tomato sauce with reduced sodium content and preserve
both sensory and commercial characteristics, the current work used methodologies of sensory
analysis: Just About Right (JAR), Time-Intensity (TI), Quantitative Descriptive Analysis
(QDA), Check All That Apply (CATA) and Acceptance Test. Samples of MSG and IMP
presented the most similar sensory profile when compared to the control sample (NaCl) and a
greater difference among the samples KCl and LIS. MSG and IMP were also related to higher
acceptance scores among consumers, which allowed a 50% sodium reduction without impairing
sensory quality and acceptance. Flavor enhancers have been widely used to reformulate
processed foods in order to reduce sodium content, while preserving sensory acceptance.
Therefore, this study provides information on how different flavor enhancers affect the sensory
profile of tomato sauce.
Keywords: Sodium reduction, flavor enhancers, sensory profiling, tomato sauce, consumer
perception.
Practical applications: This study provides information on the use of potassium chloride and
flavor enhancers to replace sodium chloride in tomato sauce. Developing a product suitable for
the global trend of sodium reduction and preserving the sensory characteristics and acceptance
by consumers.
41
1. INTRODUCTION
Flavor, practicality, extended shelf-life, and availability are factors that have
increasingly boosting the consumption of processed foods (Moubarac et al., 2017). However,
this has also promoted increased consumption of salt, sugar, and fat. Table salt is the main
source of sodium in food, present on a large scale in processed foods such as tomato sauces.
Webster et al., (2010) analyzed Australia's commercial tomato sauces and found on average
835mg per 100g of product, similar to the values encountered in Brazilian products — ranging
from 443.33mg to 868.33 per 100g of product (Silva, A. S.; Coutinho, V. F.; Azevedo, 2015).
Excess ingested sodium is related to hypertension, increased risk of heart disease, stroke, and
chronic kidney disease.
Potassium chloride is the main salt used to replace sodium chloride because of its
sensory and technological similarity. In addition, higher potassium intake is associated with
improved blood pressure control (Fellendorf et al., 2016, Grummer et al., 2012, Du et al., 2013).
Other strategies have been applied to improve sensory acceptance of products containing KCl,
which aim to enhance its salty taste and mask undesirable flavors. Among these strategies, the
combination of KCl with flavor enhancers can be highlighted (Dos Santos Alves et al., 2017;
Felicio et al., 2016; Grummer et al., 2013).
The use of salt replacements and flavor enhancers represents a viable strategy to
reduce the sodium content in food. However, this change must be followed by careful sensory
monitoring (Campagnol et al., 2012; Dos Santos et al., 2015; Feltrin et al., 2015; Pietrasik and
Gaudette, 2014). In this context, descriptive methodologies such as Quantitative Descriptive
Analysis (QDA) (Stone and Sidel, 2012), which utilize trained assessors, produce robust and
reliable results. However, irrelevant attributes might be raised by the consumers, also
evidencing the need of a sensory characterization based on the consumer’s perception (Stone
and Sidel, 2012; Voorpostel et al., 2014). Among these methodologies the Check-All-That-
Apply (CATA) questions can be highlighted for being practical and easily applicable (Coelho
et al., 2016; Feltrin et al., 2015; Jorge et al., 2015). To evaluate the correlation between the
descriptive methods, Multiple Factor Analysis (MFA) can be used. This multivariate approach
verifies the similarity between different groups of variables from different methods as measured
from the same set of samples. Visual inspection of maps and RV coefficient analysis are the
main ways of assessing correlation and similarity between methods (Esmerino et al., 2017).
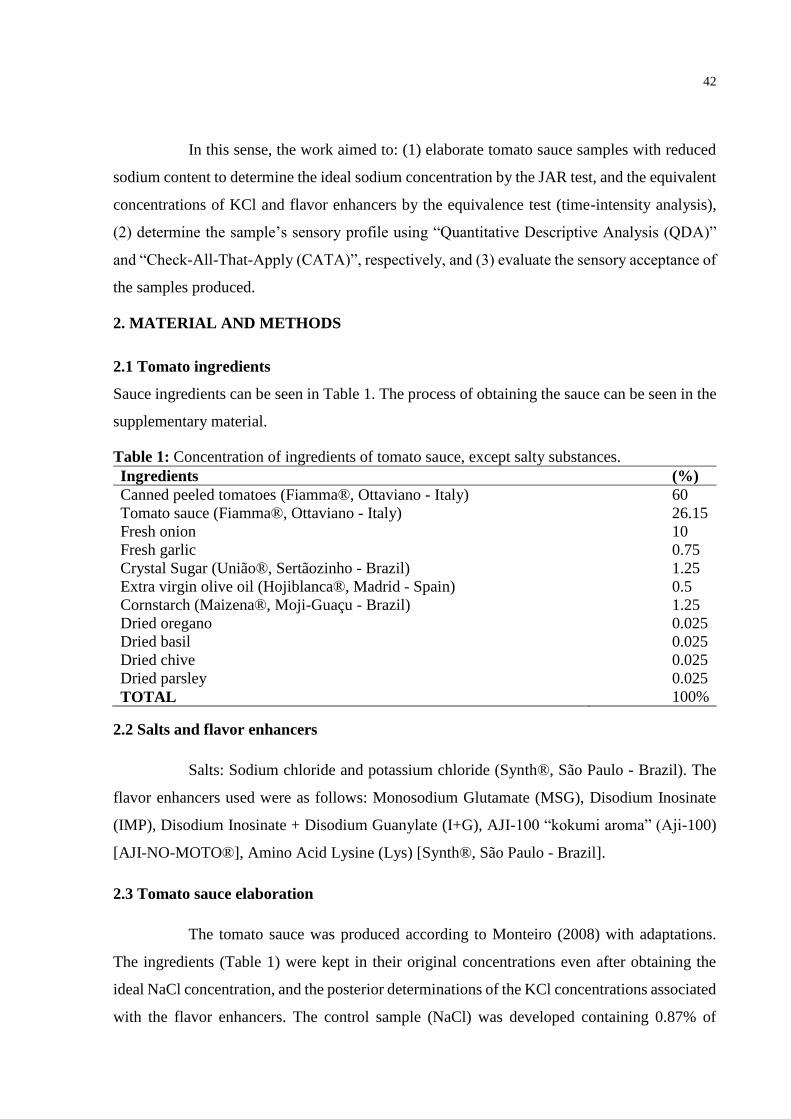
42
In this sense, the work aimed to: (1) elaborate tomato sauce samples with reduced
sodium content to determine the ideal sodium concentration by the JAR test, and the equivalent
concentrations of KCl and flavor enhancers by the equivalence test (time-intensity analysis),
(2) determine the sample’s sensory profile using “Quantitative Descriptive Analysis (QDA)”
and “Check-All-That-Apply (CATA)”, respectively, and (3) evaluate the sensory acceptance of
the samples produced.
2. MATERIAL AND METHODS
2.1 Tomato ingredients
Sauce ingredients can be seen in Table 1. The process of obtaining the sauce can be seen in the
supplementary material.
Table 1: Concentration of ingredients of tomato sauce, except salty substances.
Ingredients (%)
Canned peeled tomatoes (Fiamma®️, Ottaviano - Italy) 60
Tomato sauce (Fiamma®️, Ottaviano - Italy) 26.15
Fresh onion 10
Fresh garlic 0.75
Crystal Sugar (União®️, Sertãozinho - Brazil) 1.25
Extra virgin olive oil (Hojiblanca®️, Madrid - Spain) 0.5
Cornstarch (Maizena®️, Moji-Guaçu - Brazil) 1.25
Dried oregano 0.025
Dried basil 0.025
Dried chive 0.025
Dried parsley 0.025
TOTAL 100%
2.2 Salts and flavor enhancers
Salts: Sodium chloride and potassium chloride (Synth®️, São Paulo - Brazil). The
flavor enhancers used were as follows: Monosodium Glutamate (MSG), Disodium Inosinate
(IMP), Disodium Inosinate + Disodium Guanylate (I+G), AJI-100 “kokumi aroma” (Aji-100)
[AJI-NO-MOTO®️], Amino Acid Lysine (Lys) [Synth®️, São Paulo - Brazil].
2.3 Tomato sauce elaboration
The tomato sauce was produced according to Monteiro (2008) with adaptations.
The ingredients (Table 1) were kept in their original concentrations even after obtaining the
ideal NaCl concentration, and the posterior determinations of the KCl concentrations associated
with the flavor enhancers. The control sample (NaCl) was developed containing 0.87% of
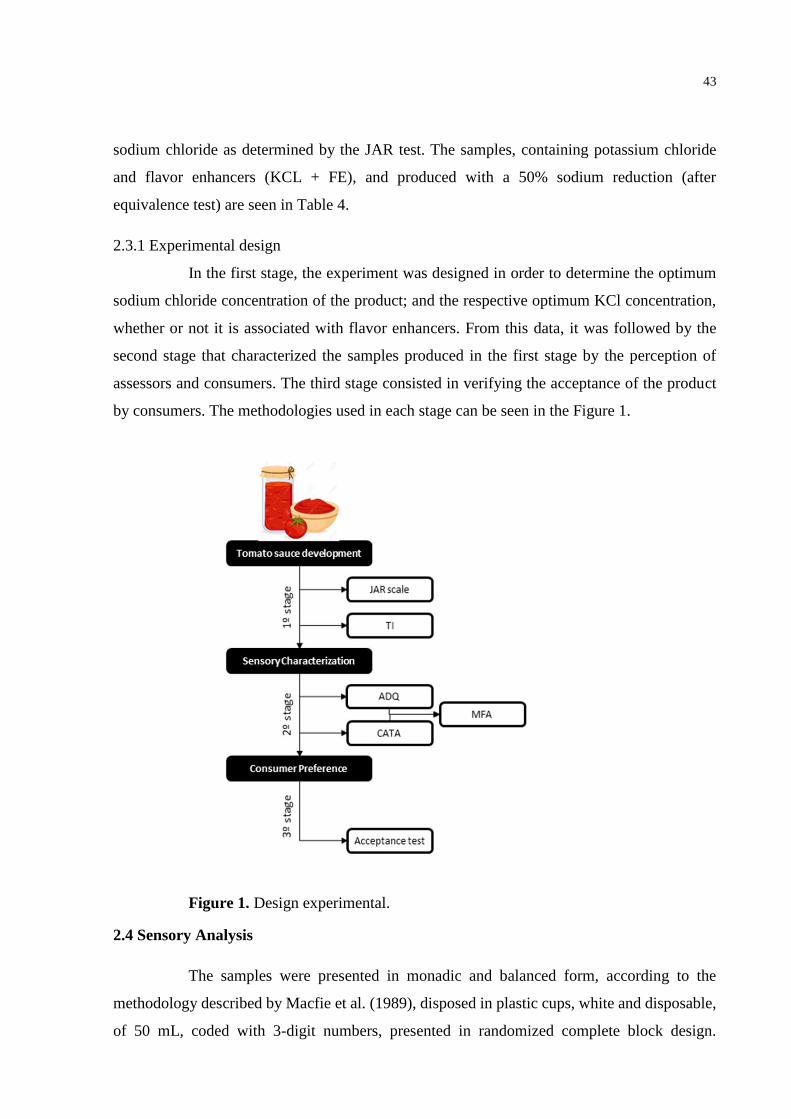
43
sodium chloride as determined by the JAR test. The samples, containing potassium chloride
and flavor enhancers (KCL + FE), and produced with a 50% sodium reduction (after
equivalence test) are seen in Table 4.
2.3.1 Experimental design
In the first stage, the experiment was designed in order to determine the optimum
sodium chloride concentration of the product; and the respective optimum KCl concentration,
whether or not it is associated with flavor enhancers. From this data, it was followed by the
second stage that characterized the samples produced in the first stage by the perception of
assessors and consumers. The third stage consisted in verifying the acceptance of the product
by consumers. The methodologies used in each stage can be seen in the Figure 1.
Figure 1. Design experimental.
2.4 Sensory Analysis
The samples were presented in monadic and balanced form, according to the
methodology described by Macfie et al. (1989), disposed in plastic cups, white and disposable,
of 50 mL, coded with 3-digit numbers, presented in randomized complete block design.
44
Participants were also provided with water and unsalted crackers for palate cleansing (Esmerino
et al. 2017). The sensorial analyzes were conducted at the Laboratory of Sensory Science and
Consumer Studies of Unicamp-Brazil (LCSEC / UNICAMP) in accordance with ISO standards
8589: 2007.
2.5 Just About Right Test
The ideal NaCl concentration to be added to the tomato sauce was determined by
120 consumers using the Just-About-Right scale (JAR) (Meilgaard, M. C.; Civille, G. V.; Carr,
2006). Five formulations of tomato sauce were prepared with different concentrations of
sodium chloride (0.55%, 0.65%, 0.75%, 0.85%, 0.95% [m/m] ). The median value (0,75%) was
determined through estimates based on the NaCl concentrations in commercial sauces and on
previous data (Monteiro, 2008; Silva ; Coutinho and Azevedo, 2015). The obtained results were
converted with FIZZ Software (Biosystemes, Couternon, France), and analyzed by simple
linear regression to determine the optimum NaCl concentration, as suggested by Vickers,
(1988), utilizing the software Excel 2013 for Windows.
2.6 Time-Intensity Analysis
Twelve assessors performed the salty taste equivalence using Time-Intensity
analysis. Five training sessions were conducted with two tomato sauce samples (0% and 1.2%
[m/m] of sodium chloride) to represent the reference of a strong salty taste and null salty taste.
The flavor enhancer concentrations utilized were chosen based on the literature and guides
developed by food industries (Campagnol et al., 2012; dos Santos et al., 2014).
The following concentrations were utilized: Monosodium Glutamate (0.6%);
Disodium Inosinate + Disodium Guanylate (0.03%), Disodium Inosinate (0.03%), AJI-100
“kokumi aroma” (0.03%) and Lysine (0.3%). The data obtained was evaluated by ANOVA and
Tukey's range test utilizing the SAS System for Windows (Statistical Analysis System 2013)
(Lorido et al., 2016).
2.7 Quantitative Descriptive Analysis
A new team of 12 evaluators was trained and selected to conduct ADQ. The
selection criteria were: discrimination capacity (p <0.30) and repeatability (p> 0.05). Nineteen
descriptors were elicited using Kelly's repertory Grid: Red Color (RED), Brightness (BRI),
45
Apparent Viscosity (VIA), Sweet Aroma (SWS), Acid Aroma (ACS), Tomato Sauce Aroma
(TSS), Condiments/Herbs Aroma (CHS), Sweet Taste (SWT), Acid Taste (ACT), Bitter Taste
(BTT), Salty Taste (STT), Umami Taste (UMT), Residual Salty Flavor (SAR),
Condiments/Herbs Flavor (CHF), Tomato Sauce Flavor (TSF), Metallic Flavor (MEF), Full-
Bodied (FUL), Viscosity (VIS), Granularity/Presence of Particles (GRA). The data was
submitted to ANOVA and Tukey’s range test to the level of 5% of significance, using the SAS
System for Windows (Statistical Analysis System) (2013).
2.8 Check-all-that-apply and Acceptance Test
The CATA questionnaire and the acceptance test were performed with the same
group of 120 consumers. The samples were presented and the participants provided their
hedonistic responses and then answered the CATA questionnaire (Jaeger et al., 2017). For
CATA questions, they were instructed to check all terms describing the sample and for
acceptance were instructed to evaluate the samples for appearance, aroma, taste, texture and
overall liking. Jaeger et al., (2015b) hypothesized that performing the hedonistic scale test with
CATA may increase the discriminatory power of CATA.
Using FIZZ software (Biosysteme, Couternon, France), a list — with the same 19
terms descriptors of QDA — was presented to consumers, randomizing the presentation to each
taster. The presentation of the samples was balanced between participants following a
Williams' Latin square experimental design (Esmerino et al., 2017), in which consumers were
requested to check all the terms they considered appropriate to describe the tomato sauce (Cruz
et al., 2013).
The mention frequency of each sensory attribute was determined and the Cochran’s
Q test was applied. To obtain the samples’ sensory map, a Correspondence Analysis (CA) was
applied to the contingency table. Then, the results from the acceptance test and CATA were
grouped to generate an external preference map. The Correspondence Analysis and the external
preference map, in the form of an acceptance zones map were generated with the software
XLSTAT 2015.5 for Microsoft Excel (Addinsoft, Paris-France).
Acceptance was determined by utilizing a non-structured linear hedonic scale of 9-
cm (Stone and Sidel, 2012). Consumers were instructed to evaluate the samples regarding
appearance, aroma, flavor, texture and overall liking. The data obtained in the acceptance test
46
was submitted to ANOVA and Tukey’s range test, which verified the occurrence of significant
differences between averages (p≤0.05) (Meilgaard, M. C.; Civille, G. V.; Carr, 2006; Stone and
Sidel, 2012).
2.9 Multiple Factor Analysis
The RV coefficient and the MFA were calculated using the cross-reference matrix
and the first two dimensions of each methodology, in each possible combination. The RV
corresponds to the correlation coefficient between two individual spaces, ranging from 0
(totally at odds) to 1 (perfect agreement) (Albert et al., 2011). The MFA and RV coefficient
were calculated using the software XLSTAT 2019.1.3 (Addinsoft, 2019), which generated the
map with spatial arrangement of the samples (Fonseca et al., 2016).
3. RESULTS AND DISCUSSION
3.1 JAR-Test
According to the consumer, the optimum concentration of NaCl was 0.87%. This
value is higher than in North America (0.65%), however, it is very close to the Australian 0,83%
and Brazilian commercial averages (Bielamowicz, 2017; Canada, 2008; Webster et al., 2010),
confirming the desirability of high sodium content in tomato sauces.
3.2 Salty taste equivalence through Time-Intensity Analysis
The time intensity analysis was performed at two different times. Initially, the
capacity of potassium chloride to produce salty taste in sauce samples without the use of sodium
chloride was verified. It was observed that potassium chloride has 75% of the salting potential
of sodium chloride, whether alone or associated with: monosodium glutamate, disodium
inosinate, AJI-100 “kokumi aroma,” and lysine.
When associated with a 50% / 50% mixture of disodium inosinate and disodium
guanylate, potassium chloride has 60% of the salting potential of sodium chloride (Table 2).
Feltrin et al., (2015), showed that potassium chloride has 75% of the salting capacity of sodium
chloride.
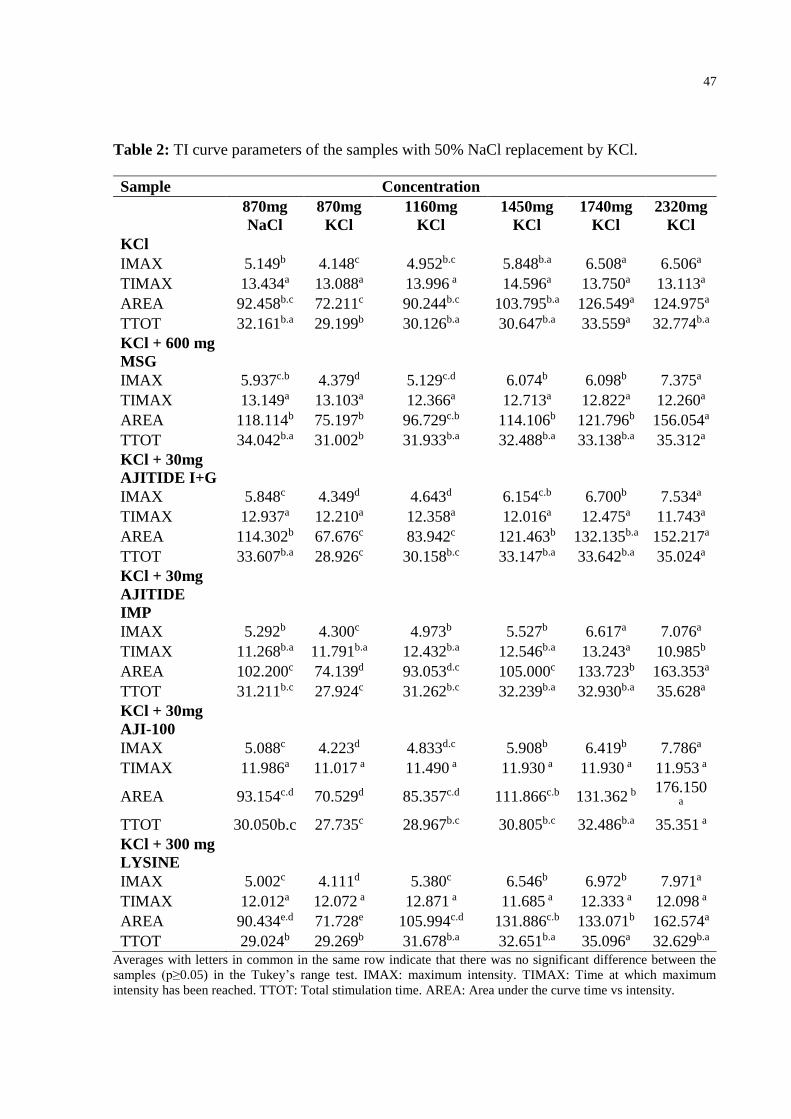
47
Table 2: TI curve parameters of the samples with 50% NaCl replacement by KCl.
Sample Concentration
870mg
NaCl
870mg
KCl
1160mg
KCl
1450mg
KCl
1740mg
KCl
2320mg
KCl
KCl
IMAX 5.149b 4.148c 4.952b.c 5.848b.a 6.508a 6.506a
TIMAX 13.434a 13.088a 13.996 a 14.596a 13.750a 13.113a
AREA 92.458b.c 72.211c 90.244b.c 103.795b.a 126.549a 124.975a
TTOT 32.161b.a 29.199b 30.126b.a 30.647b.a 33.559a 32.774b.a
KCl + 600 mg
MSG
IMAX 5.937c.b 4.379d 5.129c.d 6.074b 6.098b 7.375a
TIMAX 13.149a 13.103a 12.366a 12.713a 12.822a 12.260a
AREA 118.114b 75.197b 96.729c.b 114.106b 121.796b 156.054a
TTOT 34.042b.a 31.002b 31.933b.a 32.488b.a 33.138b.a 35.312a
KCl + 30mg
AJITIDE I+G
IMAX 5.848c 4.349d 4.643d 6.154c.b 6.700b 7.534a
TIMAX 12.937a 12.210a 12.358a 12.016a 12.475a 11.743a
AREA 114.302b 67.676c 83.942c 121.463b 132.135b.a 152.217a
TTOT 33.607b.a 28.926c 30.158b.c 33.147b.a 33.642b.a 35.024a
KCl + 30mg
AJITIDE
IMP
IMAX 5.292b 4.300c 4.973b 5.527b 6.617a 7.076a
TIMAX 11.268b.a 11.791b.a 12.432b.a 12.546b.a 13.243a 10.985b
AREA 102.200c 74.139d 93.053d.c 105.000c 133.723b 163.353a
TTOT 31.211b.c 27.924c 31.262b.c 32.239b.a 32.930b.a 35.628a
KCl + 30mg
AJI-100
IMAX 5.088c 4.223d 4.833d.c 5.908b 6.419b 7.786a
TIMAX 11.986a 11.017 a 11.490 a 11.930 a 11.930 a 11.953 a
AREA 93.154c.d 70.529d 85.357c.d 111.866c.b 131.362 b 176.150
a
TTOT 30.050b.c 27.735c 28.967b.c 30.805b.c 32.486b.a 35.351 a
KCl + 300 mg
LYSINE
IMAX 5.002c 4.111d 5.380c 6.546b 6.972b 7.971a
TIMAX 12.012a 12.072 a 12.871 a 11.685 a 12.333 a 12.098 a
AREA 90.434e.d 71.728e 105.994c.d 131.886c.b 133.071b 162.574a
TTOT 29.024b 29.269b 31.678b.a 32.651b.a 35.096a 32.629b.a Averages with letters in common in the same row indicate that there was no significant difference between the
samples (p≥0.05) in the Tukey’s range test. IMAX: maximum intensity. TIMAX: Time at which maximum
intensity has been reached. TTOT: Total stimulation time. AREA: Area under the curve time vs intensity.

48
For the second stage of the equivalence test, a new TI analysis was performed to
verify if the salting potential found previously for samples with 100% sodium chloride
replacement was maintained in 50% reduction samples (Table 3). The second TI assay
confirmed the equivalence between sodium chloride and potassium chloride, so the final sample
set of tomato sauce containing potassium chloride and flavor enhancer is shown in Table 4.
Table 3: Time-Intensity curve parameters of the samples with 50% NaCl replacement by KCl.
NaCl KCl MSG IG IMP AJI-100 LIS
IMAX 5.77 a 6.12 a 6.24 a 6.37 a 6.32 a 5.92 a 6.03 a
TIMAX 13.90 a 12.20 a 11.63 a 12.20 a 12.84 a 11.84 a 11.80 a
AREA 93.08 a 101.40 a 116.48 a 118.80 a 113.64 a 118.09 a 104.25 a
TTOT 32.64 a 33.45 a 31.07 a 29.81 a 30.67 a 30.12 a 29.08 a
Averages with letters in common in the same row indicate that there was no significant difference between the
samples (p≥0.05) in the Tukey’s range test. TIMAX: Time at which maximum intensity has been reached. TTOT:
Total stimulation time. AREA: Area under the curve time vs intensity.
Table 4: Set of tomato sauce samples containing potassium chloride and flavor enhancers.
Sample
Name Composition
NaCl 0.87% sodium chloride
KCl 0.58% potassium chloride + 0.435% sodium chloride
MSG 0.58% potassium chloride + 0.435% sodium chloride + 0.6% monosodium
glutamate
IG 0.725% potassium chloride + 0.435% sodium chloride + 0.03% disodium
inosinate/disodium guanylate
IMP 0.58% potassium chloride + 0.435% sodium chloride + 0.03% disodium
inosinate
AJI-100 0.58% potassium chloride + 0.435% sodium chloride + 0.03% Aji-Aroma® M-
M100
LIS 0.58% potassium chloride + 0.435% sodium chloride + 0.3% lysine
3.3 Quantitative Descriptive Analysis
Table 5 indicates that the addition of KCL + FE did not affect the appearance and
aroma attributes. Different results were found in other sodium-reduction studies, such as white
bread that showed significant differences in the yeast and toasted aromas, and alligator steaks
in both baked and spices aromas (Canto et al., 2014; Raffo et al., 2018). Among the attributes
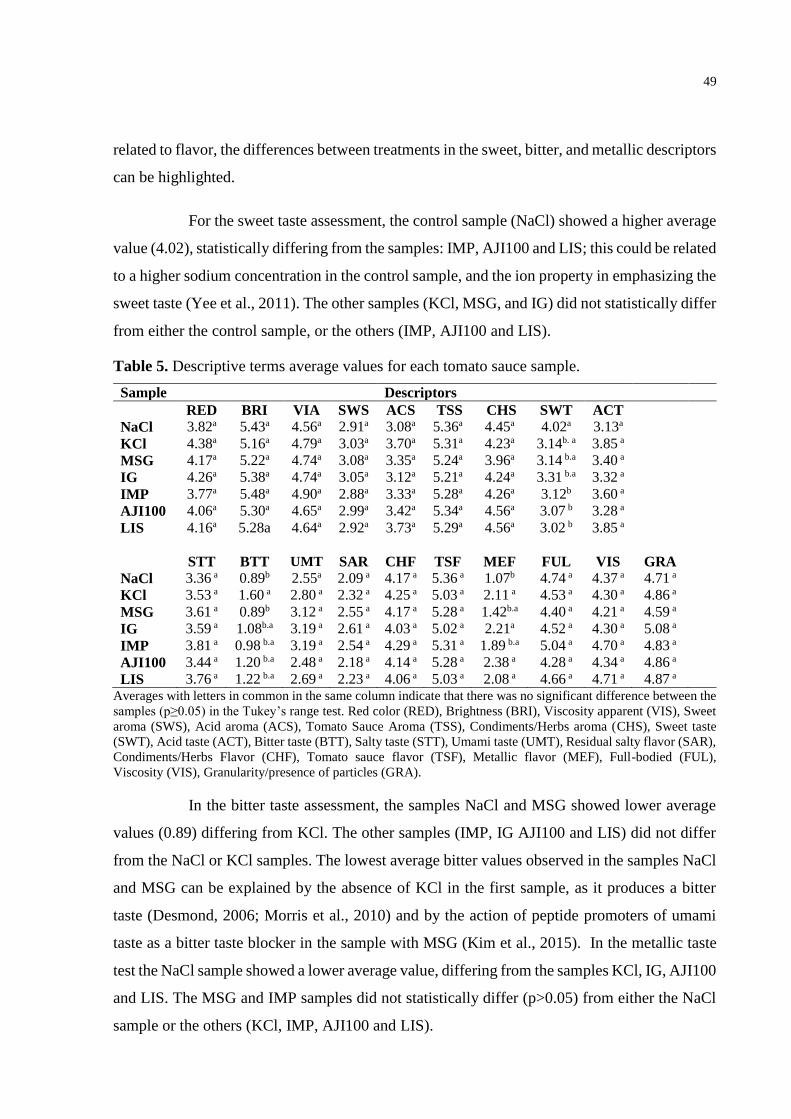
49
related to flavor, the differences between treatments in the sweet, bitter, and metallic descriptors
can be highlighted.
For the sweet taste assessment, the control sample (NaCl) showed a higher average
value (4.02), statistically differing from the samples: IMP, AJI100 and LIS; this could be related
to a higher sodium concentration in the control sample, and the ion property in emphasizing the
sweet taste (Yee et al., 2011). The other samples (KCl, MSG, and IG) did not statistically differ
from either the control sample, or the others (IMP, AJI100 and LIS).
Table 5. Descriptive terms average values for each tomato sauce sample.
Sample Descriptors
RED BRI VIA SWS ACS TSS CHS SWT ACT
NaCl 3.82a 5.43a 4.56a 2.91a 3.08a 5.36a 4.45a 4.02a 3.13a
KCl 4.38a 5.16a 4.79a 3.03a 3.70a 5.31a 4.23a 3.14b. a 3.85 a
MSG 4.17a 5.22a 4.74a 3.08a 3.35a 5.24a 3.96a 3.14 b.a 3.40 a
IG 4.26a 5.38a 4.74a 3.05a 3.12a 5.21a 4.24a 3.31 b.a 3.32 a
IMP 3.77a 5.48a 4.90a 2.88a 3.33a 5.28a 4.26a 3.12b 3.60 a
AJI100 4.06a 5.30a 4.65a 2.99a 3.42a 5.34a 4.56a 3.07 b 3.28 a
LIS 4.16a 5.28a 4.64a 2.92a 3.73a 5.29a 4.56a 3.02 b 3.85 a
STT BTT UMT SAR CHF TSF MEF FUL VIS GRA
NaCl 3.36 a 0.89b 2.55a 2.09 a 4.17 a 5.36 a 1.07b 4.74 a 4.37 a 4.71 a
KCl 3.53 a 1.60 a 2.80 a 2.32 a 4.25 a 5.03 a 2.11 a 4.53 a 4.30 a 4.86 a
MSG 3.61 a 0.89b 3.12 a 2.55 a 4.17 a 5.28 a 1.42b.a 4.40 a 4.21 a 4.59 a
IG 3.59 a 1.08b.a 3.19 a 2.61 a 4.03 a 5.02 a 2.21a 4.52 a 4.30 a 5.08 a
IMP 3.81 a 0.98 b.a 3.19 a 2.54 a 4.29 a 5.31 a 1.89 b.a 5.04 a 4.70 a 4.83 a
AJI100 3.44 a 1.20 b.a 2.48 a 2.18 a 4.14 a 5.28 a 2.38 a 4.28 a 4.34 a 4.86 a
LIS 3.76 a 1.22 b.a 2.69 a 2.23 a 4.06 a 5.03 a 2.08 a 4.66 a 4.71 a 4.87 a Averages with letters in common in the same column indicate that there was no significant difference between the
samples (p≥0.05) in the Tukey’s range test. Red color (RED), Brightness (BRI), Viscosity apparent (VIS), Sweet
aroma (SWS), Acid aroma (ACS), Tomato Sauce Aroma (TSS), Condiments/Herbs aroma (CHS), Sweet taste
(SWT), Acid taste (ACT), Bitter taste (BTT), Salty taste (STT), Umami taste (UMT), Residual salty flavor (SAR),
Condiments/Herbs Flavor (CHF), Tomato sauce flavor (TSF), Metallic flavor (MEF), Full-bodied (FUL),
Viscosity (VIS), Granularity/presence of particles (GRA).
In the bitter taste assessment, the samples NaCl and MSG showed lower average
values (0.89) differing from KCl. The other samples (IMP, IG AJI100 and LIS) did not differ
from the NaCl or KCl samples. The lowest average bitter values observed in the samples NaCl
and MSG can be explained by the absence of KCl in the first sample, as it produces a bitter
taste (Desmond, 2006; Morris et al., 2010) and by the action of peptide promoters of umami
taste as a bitter taste blocker in the sample with MSG (Kim et al., 2015). In the metallic taste
test the NaCl sample showed a lower average value, differing from the samples KCl, IG, AJI100
and LIS. The MSG and IMP samples did not statistically differ (p>0.05) from either the NaCl
sample or the others (KCl, IMP, AJI100 and LIS).
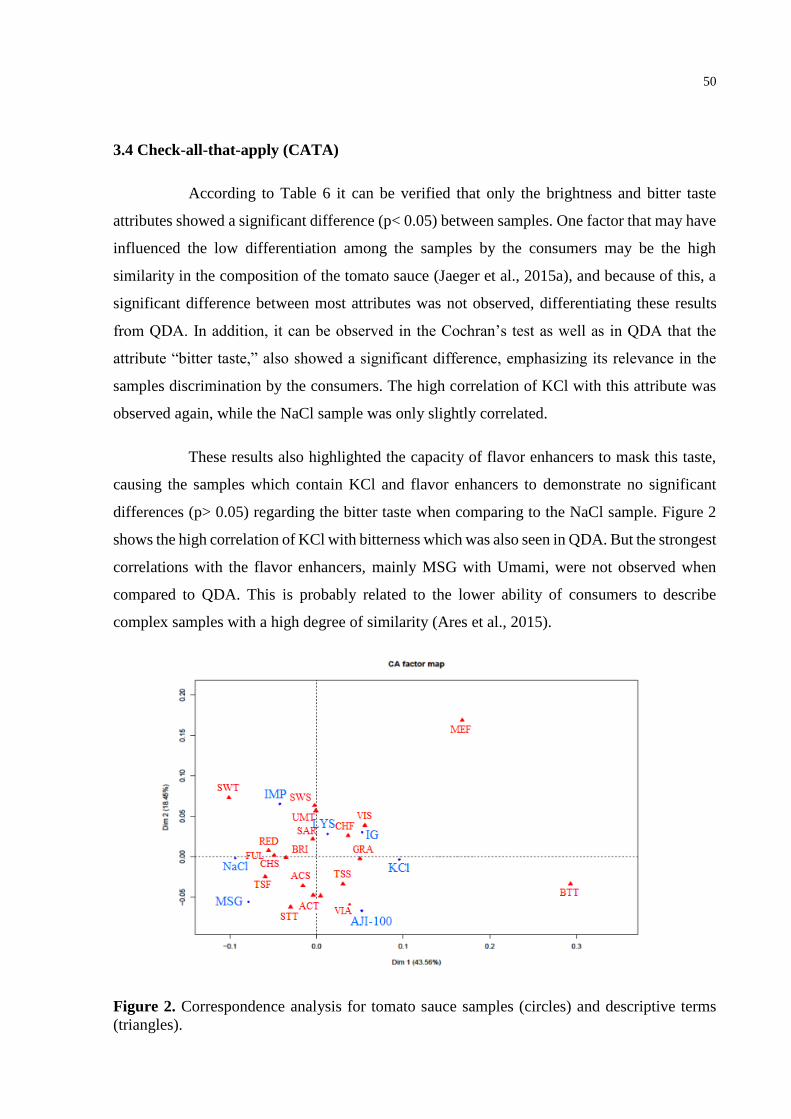
50
3.4 Check-all-that-apply (CATA)
According to Table 6 it can be verified that only the brightness and bitter taste
attributes showed a significant difference (p< 0.05) between samples. One factor that may have
influenced the low differentiation among the samples by the consumers may be the high
similarity in the composition of the tomato sauce (Jaeger et al., 2015a), and because of this, a
significant difference between most attributes was not observed, differentiating these results
from QDA. In addition, it can be observed in the Cochran’s test as well as in QDA that the
attribute “bitter taste,” also showed a significant difference, emphasizing its relevance in the
samples discrimination by the consumers. The high correlation of KCl with this attribute was
observed again, while the NaCl sample was only slightly correlated.
These results also highlighted the capacity of flavor enhancers to mask this taste,
causing the samples which contain KCl and flavor enhancers to demonstrate no significant
differences (p> 0.05) regarding the bitter taste when comparing to the NaCl sample. Figure 2
shows the high correlation of KCl with bitterness which was also seen in QDA. But the strongest
correlations with the flavor enhancers, mainly MSG with Umami, were not observed when
compared to QDA. This is probably related to the lower ability of consumers to describe
complex samples with a high degree of similarity (Ares et al., 2015).
Figure 2. Correspondence analysis for tomato sauce samples (circles) and descriptive terms
(triangles).
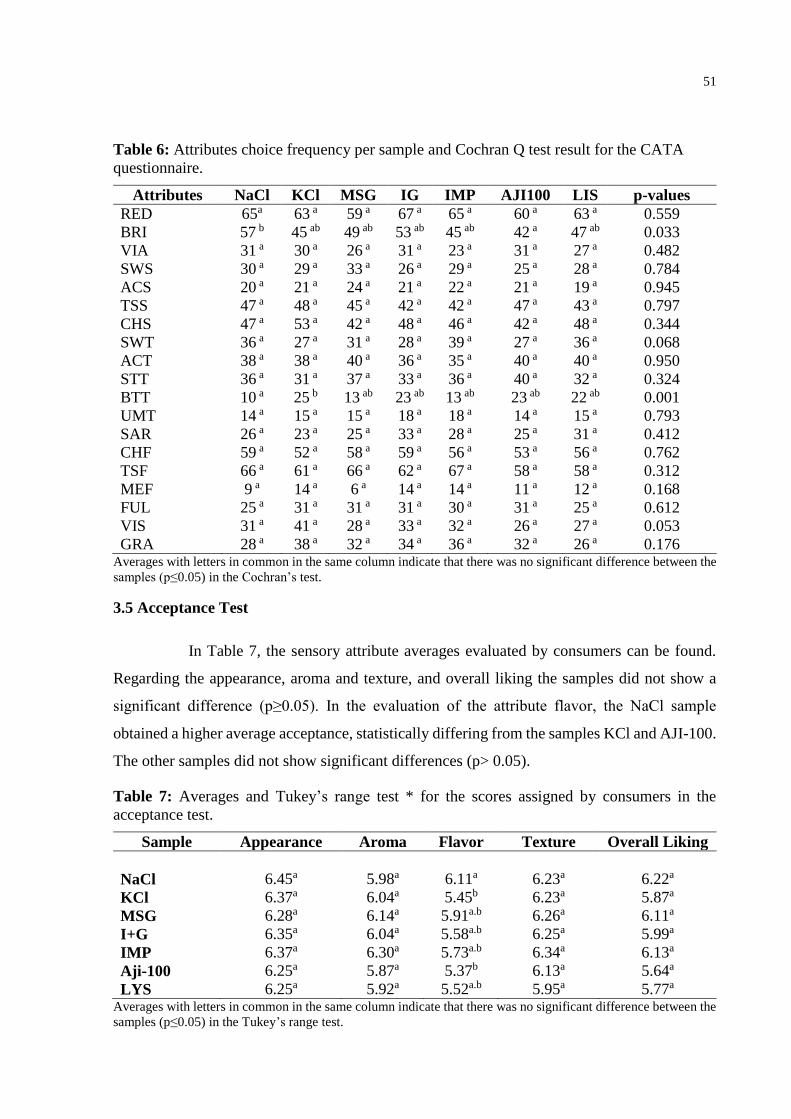
51
Table 6: Attributes choice frequency per sample and Cochran Q test result for the CATA
questionnaire.
Attributes NaCl KCl MSG IG IMP AJI100 LIS p-values
RED 65a 63 a 59 a 67 a 65 a 60 a 63 a 0.559
BRI 57 b 45 ab 49 ab 53 ab 45 ab 42 a 47 ab 0.033
VIA 31 a 30 a 26 a 31 a 23 a 31 a 27 a 0.482
SWS 30 a 29 a 33 a 26 a 29 a 25 a 28 a 0.784
ACS 20 a 21 a 24 a 21 a 22 a 21 a 19 a 0.945
TSS 47 a 48 a 45 a 42 a 42 a 47 a 43 a 0.797
CHS 47 a 53 a 42 a 48 a 46 a 42 a 48 a 0.344
SWT 36 a 27 a 31 a 28 a 39 a 27 a 36 a 0.068
ACT 38 a 38 a 40 a 36 a 35 a 40 a 40 a 0.950
STT 36 a 31 a 37 a 33 a 36 a 40 a 32 a 0.324
BTT 10 a 25 b 13 ab 23 ab 13 ab 23 ab 22 ab 0.001
UMT 14 a 15 a 15 a 18 a 18 a 14 a 15 a 0.793
SAR 26 a 23 a 25 a 33 a 28 a 25 a 31 a 0.412
CHF 59 a 52 a 58 a 59 a 56 a 53 a 56 a 0.762
TSF 66 a 61 a 66 a 62 a 67 a 58 a 58 a 0.312
MEF 9 a 14 a 6 a 14 a 14 a 11 a 12 a 0.168
FUL 25 a 31 a 31 a 31 a 30 a 31 a 25 a 0.612
VIS 31 a 41 a 28 a 33 a 32 a 26 a 27 a 0.053
GRA 28 a 38 a 32 a 34 a 36 a 32 a 26 a 0.176 Averages with letters in common in the same column indicate that there was no significant difference between the
samples (p≤0.05) in the Cochran’s test.
3.5 Acceptance Test
In Table 7, the sensory attribute averages evaluated by consumers can be found.
Regarding the appearance, aroma and texture, and overall liking the samples did not show a
significant difference (p≥0.05). In the evaluation of the attribute flavor, the NaCl sample
obtained a higher average acceptance, statistically differing from the samples KCl and AJI-100.
The other samples did not show significant differences (p> 0.05).
Table 7: Averages and Tukey’s range test * for the scores assigned by consumers in the
acceptance test.
Sample Appearance Aroma Flavor Texture Overall Liking
NaCl 6.45a 5.98a 6.11a 6.23a 6.22a
KCl 6.37a 6.04a 5.45b 6.23a 5.87a
MSG 6.28a 6.14a 5.91a.b 6.26a 6.11a
I+G 6.35a 6.04a 5.58a.b 6.25a 5.99a
IMP 6.37a 6.30a 5.73a.b 6.34a 6.13a
Aji-100 6.25a 5.87a 5.37b 6.13a 5.64a
LYS 6.25a 5.92a 5.52a.b 5.95a 5.77a Averages with letters in common in the same column indicate that there was no significant difference between the
samples (p≤0.05) in the Tukey’s range test.
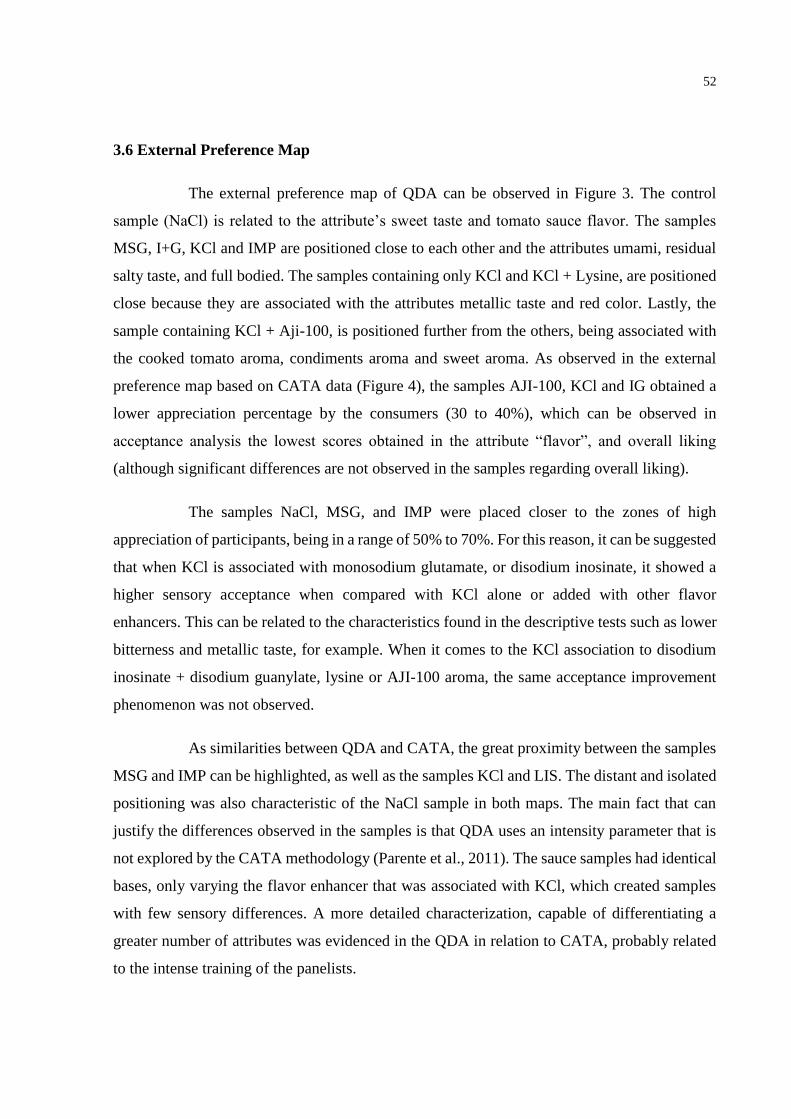
52
3.6 External Preference Map
The external preference map of QDA can be observed in Figure 3. The control
sample (NaCl) is related to the attribute’s sweet taste and tomato sauce flavor. The samples
MSG, I+G, KCl and IMP are positioned close to each other and the attributes umami, residual
salty taste, and full bodied. The samples containing only KCl and KCl + Lysine, are positioned
close because they are associated with the attributes metallic taste and red color. Lastly, the
sample containing KCl + Aji-100, is positioned further from the others, being associated with
the cooked tomato aroma, condiments aroma and sweet aroma. As observed in the external
preference map based on CATA data (Figure 4), the samples AJI-100, KCl and IG obtained a
lower appreciation percentage by the consumers (30 to 40%), which can be observed in
acceptance analysis the lowest scores obtained in the attribute “flavor”, and overall liking
(although significant differences are not observed in the samples regarding overall liking).
The samples NaCl, MSG, and IMP were placed closer to the zones of high
appreciation of participants, being in a range of 50% to 70%. For this reason, it can be suggested
that when KCl is associated with monosodium glutamate, or disodium inosinate, it showed a
higher sensory acceptance when compared with KCl alone or added with other flavor
enhancers. This can be related to the characteristics found in the descriptive tests such as lower
bitterness and metallic taste, for example. When it comes to the KCl association to disodium
inosinate + disodium guanylate, lysine or AJI-100 aroma, the same acceptance improvement
phenomenon was not observed.
As similarities between QDA and CATA, the great proximity between the samples
MSG and IMP can be highlighted, as well as the samples KCl and LIS. The distant and isolated
positioning was also characteristic of the NaCl sample in both maps. The main fact that can
justify the differences observed in the samples is that QDA uses an intensity parameter that is
not explored by the CATA methodology (Parente et al., 2011). The sauce samples had identical
bases, only varying the flavor enhancer that was associated with KCl, which created samples
with few sensory differences. A more detailed characterization, capable of differentiating a
greater number of attributes was evidenced in the QDA in relation to CATA, probably related
to the intense training of the panelists.
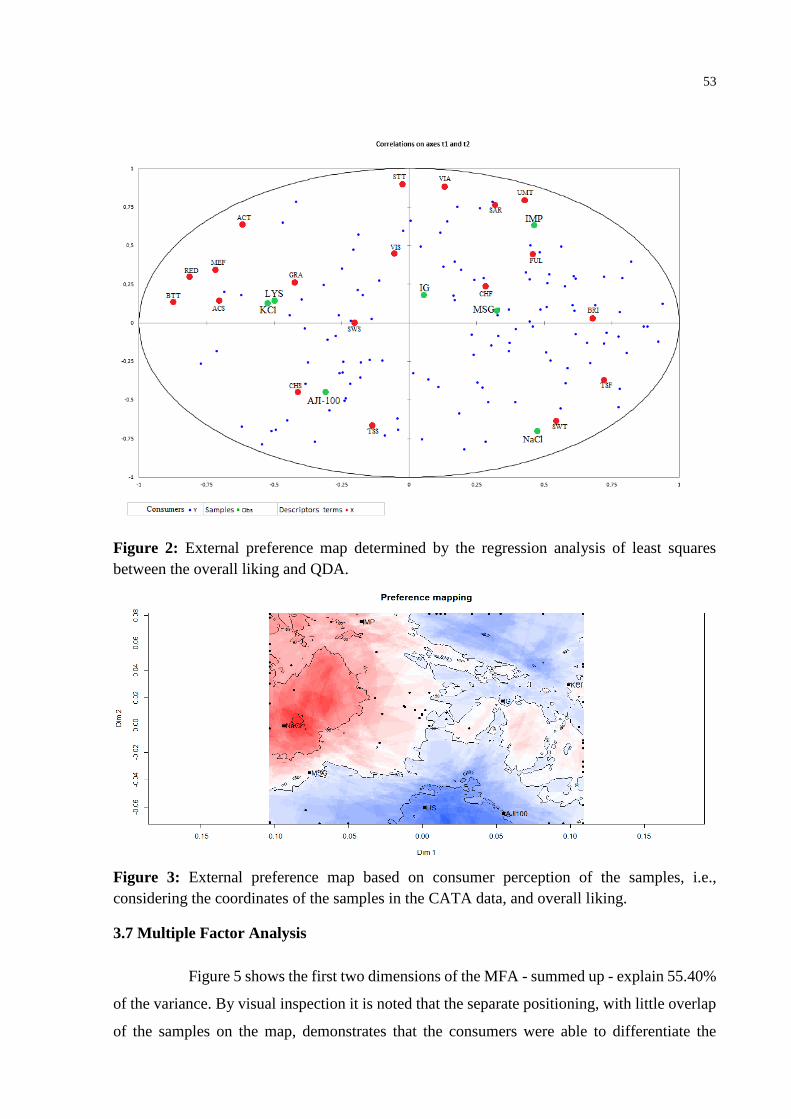
53
Figure 2: External preference map determined by the regression analysis of least squares
between the overall liking and QDA.
Figure 3: External preference map based on consumer perception of the samples, i.e.,
considering the coordinates of the samples in the CATA data, and overall liking.
3.7 Multiple Factor Analysis
Figure 5 shows the first two dimensions of the MFA - summed up - explain 55.40%
of the variance. By visual inspection it is noted that the separate positioning, with little overlap
of the samples on the map, demonstrates that the consumers were able to differentiate the
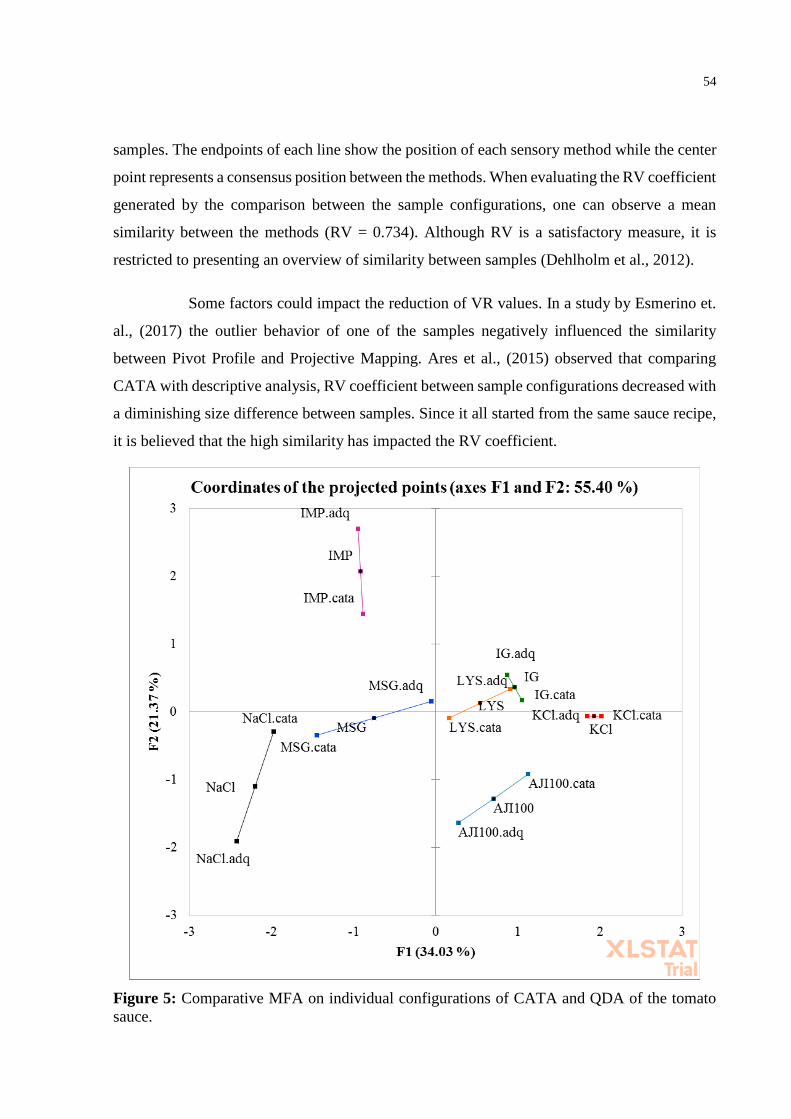
54
samples. The endpoints of each line show the position of each sensory method while the center
point represents a consensus position between the methods. When evaluating the RV coefficient
generated by the comparison between the sample configurations, one can observe a mean
similarity between the methods (RV = 0.734). Although RV is a satisfactory measure, it is
restricted to presenting an overview of similarity between samples (Dehlholm et al., 2012).
Some factors could impact the reduction of VR values. In a study by Esmerino et.
al., (2017) the outlier behavior of one of the samples negatively influenced the similarity
between Pivot Profile and Projective Mapping. Ares et al., (2015) observed that comparing
CATA with descriptive analysis, RV coefficient between sample configurations decreased with
a diminishing size difference between samples. Since it all started from the same sauce recipe,
it is believed that the high similarity has impacted the RV coefficient.
Figure 5: Comparative MFA on individual configurations of CATA and QDA of the tomato
sauce.
55
4. CONCLUSIONS
It was observed that potassium chloride presented about 75% of sodium chloride
salting power. In contrast, when associated with IG the KCl showed a saltiness potential of
60%. The determination of the salting potential allowed for the substitution of NaCl by KCl to
be successfully reached. Both the external preference map generated by QDA and the CATA
data showed a proximity between the samples MSG and IMP, also the samples KCl and LIS
and a distant and isolated position was also characteristic of the NaCl sample in both maps.
In order to optimize the sodium content reduction in tomato sauce, a correlation
between the data from assessors and consumers was required. Thereby, it can be said that for
the reduction of NaCl in tomato sauce the association of KCl + Monosodium Glutamate, or
Sodium Inosinate seems more aligned when compared to the other enhancers, as those showed
minor differences in the sensory profile when compared to the great acceptance of NaCl.
Therefore, potassium chloride + monosodium glutamate or sodium Inosinate are the best
options for industrial production of tomato sauce with reduced sodium content.
Acknowledgments
For their support: National Council for Scientific and Technological Development (CNPq).
This study was approved by the "Human Research Ethics Committee" of Brazil, under
the CAAE Verification Number: 49137615.3.0000.5404.
56
5. REFERENCES
Albert, A., Varela, P., Salvador, A., Hough, G., & Fiszman, S. (2011). Overcoming the issues
in the sensory description of hot served food with a complex texture. Application of
QDA®, flash profiling and projective mapping using panels with different degrees of
training. Food Quality and Preference, 22(5), 463-473.
Ares G, Antúnez L, Bruzzone F, et al. (2015) Comparison of sensory product profiles generated
by trained assessors and consumers using CATA questions: Four case studies with
complex and/or similar samples. Food Quality and Preference 45: 75–86. DOI:
10.1016/j.foodqual.2015.05.007.
Bielamowicz MK (2017) EB-1400: The Sodium Content of Your Food. Available at:
http://www.agrilifebookstore.org/Sodium-Content-of-Your-Food-p/eb-1400.html
(accessed 18 December 2017).
Campagnol PCB, dos Santos BA, Terra NN, et al. (2012) Lysine, disodium guanylate and
disodium inosinate as flavor enhancers in low-sodium fermented sausages. Meat Science
91(3): 334–338. DOI: https://doi.org/10.1016/j.meatsci.2012.02.012.
Canada H (2008) No TitleNutrient Value of Some Common Foods. 1st ed. Ottawa: Publications.
Canto ACVCS, Lima BRCC, Suman SP, et al. (2014) Physico-chemical and sensory attributes
of low-sodium restructured caiman steaks containing microbial transglutaminase and salt
replacers. Meat Science 96(1): 623–632. DOI: 10.1016/j.meatsci.2013.08.003.
Coelho M, Rocha C, Cunha LM, et al. (2016) Influence of harvesting factors on sensory
attributes and phenolic and aroma compounds composition of Cymbopogon citratus leaves
infusions. Food Research International 89: 1029–1037. DOI:
https://doi.org/10.1016/j.foodres.2016.07.008.
Cruz AG, Cadena RS, Castro WF, et al. (2013) Consumer perception of probiotic yogurt:
Performance of check all that apply (CATA), projective mapping, sorting and intensity
scale. Food Research International 54(1): 601–610. DOI: 10.1016/j.foodres.2013.07.056.
Dehlholm, C., Brockhoff, P. B., Meinert, L., Aaslyng, M. D., & Bredie, W. L. P. (2012).
Rapid descriptive sensory methods – Comparison of Free Multiple Sorting, Partial
Napping, Napping, Flash Profiling and conventional profiling. Food Quality and
57
Preference, 26(2), 267-277.
Desmond E (2006) Reducing salt: A challenge for the meat industry. Meat Science 74(1): 188–
196. DOI: https://doi.org/10.1016/j.meatsci.2006.04.014.
Dos Santos Alves LAA, Lorenzo JM, Goncalves CAA, et al. (2017) Impact of lysine and liquid
smoke as flavor enhancers on the quality of low-fat Bologna-type sausages with 50%
replacement of NaCl by KCl. Meat science 123. England: 50–56. DOI:
10.1016/j.meatsci.2016.09.001.
dos Santos BA, Campagnol PCB, Morgano MA, et al. (2014) Monosodium glutamate,
disodium inosinate, disodium guanylate, lysine and taurine improve the sensory quality
of fermented cooked sausages with 50% and 75% replacement of NaCl with KCl. Meat
science 96(1). England: 509–513. DOI: 10.1016/j.meatsci.2013.08.024.
Dos Santos BA, Bastianello Campagnol PC, da Cruz AG, et al. (2015) Check all that apply and
free listing to describe the sensory characteristics of low sodium dry fermented sausages:
Comparison with trained panel. Food Research International 76: 725–734. DOI:
https://doi.org/10.1016/j.foodres.2015.06.035.
Esmerino EA, Tavares Filho ER, Thomas Carr B, et al. (2017) Consumer-based product
characterization using Pivot Profile, Projective Mapping and Check-all-that-apply
(CATA): A comparative case with Greek yogurt samples. Food Research International
99. DOI: 10.1016/j.foodres.2017.06.001.
Felicio TL, Esmerino EA, Vidal VAS, et al. (2016) Physico-chemical changes during storage
and sensory acceptance of low sodium probiotic Minas cheese added with arginine. Food
Chemistry 196: 628–637. DOI: https://doi.org/10.1016/j.foodchem.2015.09.102.
Fellendorf S, O’Sullivan MG and Kerry JP (2016) Impact of ingredient replacers on the
physicochemical properties and sensory quality of reduced salt and fat black puddings.
Meat Science 113: 17–25. DOI: https://doi.org/10.1016/j.meatsci.2015.11.006.
Feltrin AC, de Souza VR, Saraiva CG, et al. (2015) Sensory study of different sodium chloride
substitutes in aqueous solution. International Journal of Food Science & Technology
50(3): 730–735. DOI: 10.1111/ijfs.12670.
Fonseca, F. G., Esmerino, E. A., Filho, E. R., Ferraz, J. P., da Cruz, A. G., & Bolini, H. M.
(2016). Novel and successful free comments method for sensory characterization of
58
chocolate ice cream: A comparative study between pivot profile and comment analysis. J
Dairy Sci, 99(5), 3408-3420.
Grummer J, Karalus M, Zhang K, et al. (2012) Manufacture of reduced-sodium Cheddar-style
cheese with mineral salt replacers. Journal of Dairy Science 95(6): 2830–2839. DOI:
https://doi.org/10.3168/jds.2011-4851.
Grummer J, Bobowski N, Karalus M, et al. (2013) Use of potassium chloride and flavor
enhancers in low sodium Cheddar cheese. Journal of Dairy Science 96(3): 1401–1418.
DOI: https://doi.org/10.3168/jds.2012-6057.
Jaeger SR, Beresford MK, Paisley AG, et al. (2015a) Check-all-that-apply (CATA) questions
for sensory product characterization by consumers: Investigations into the number of terms
used in CATA questions. Food Quality and Preference 42: 154–164. DOI:
10.1016/j.foodqual.2015.02.003.
Jaeger, S. R., Hunter, D. C., Kam, K., Beresford, M. K., Jin, D., Paisley, A. G., ... & Ares, G.
(2015b). The concurrent use of JAR and CATA questions in hedonic scaling is unlikely to
cause hedonic bias, but may increase product discrimination. Food quality and preference,
44, 70-74.
Jaeger, S. R., Kim, K. O., Lee, S. M., Hunter, D. C., Kam, K., Chheang, S. L., ... & Ares, G.
(2017). Concurrent elicitation of hedonic and CATA/RATA responses with Chinese and
Korean consumers: Hedonic bias is unlikely to occur. Food quality and preference, 56,
130-137.
Jorge É da C, Mendes ACG, Auriema BE, et al. (2015) Application of a check-all-that-apply
question for evaluating and characterizing meat products. Meat Science 100: 124–133.
DOI: https://doi.org/10.1016/j.meatsci.2014.10.002.
Kim MJ, Son HJ, Kim Y, et al. (2015) Umami–bitter interactions: The suppression of bitterness
by umami peptides via human bitter taste receptor. Biochemical and Biophysical Research
Communications 456(2): 586–590. DOI: https://doi.org/10.1016/j.bbrc.2014.11.114.
Lorido L, Hort J, Estevez M, et al. (2016) Reporting the sensory properties of dry-cured ham
using a new language: Time intensity (TI) and temporal dominance of sensations (TDS).
Meat science 121. England: 166–174. DOI: 10.1016/j.meatsci.2016.06.009.
Macfie Hj, Bratchell N, Greenhoff K, Et Al. (1989) Designs To Balance The Effect Of Order
59
Of Presentation And First-Order Carry-Over Effects In Hall Tests. Journal of Sensory
Studies 4(2). Blackwell Publishing Ltd: 129–148. DOI: 10.1111/j.1745-
459X.1989.tb00463.x.
Martínez-Huélamo M, Tulipani S, Estruch R, et al. (2015) The tomato sauce making process
affects the bioaccessibility and bioavailability of tomato phenolics: A pharmacokinetic
study. Food Chemistry 173: 864–872. DOI:
https://doi.org/10.1016/j.foodchem.2014.09.156.
Meilgaard, M. C.; Civille, G. V.; Carr BT (2006) Sensory Evaluation Techniques. CRC press.
Monteiro CS (2008) Desenvolvimento de molho de tomate Lycopersicon esculentum Mill
formulado com cogumelo Agaricus brasiliensis. Universidade Federal do Paraná.
Morris C, Labarre C, Koliandris A-L, et al. (2010) Effect of pulsed delivery and bouillon base
on saltiness and bitterness perceptions of salt delivery profiles partially substituted with
KCl. Food Quality and Preference 21(5): 489–494. DOI:
https://doi.org/10.1016/j.foodqual.2010.01.002.
Moubarac J-C, Batal M, Louzada ML, et al. (2017) Consumption of ultra-processed foods
predicts diet quality in Canada. Appetite 108. England: 512–520. DOI:
10.1016/j.appet.2016.11.006.
Parente Me, Manzoni Anav And Ares G (2011) External Preference Mapping Of Commercial
Antiaging Creams Based On Consumers’ Responses To A Check-All-That-Apply
Question. Journal of Sensory Studies 26(2). Blackwell Publishing Inc: 158–166. DOI:
10.1111/j.1745-459X.2011.00332.x.
Pietrasik Z and Gaudette NJ (2014) The impact of salt replacers and flavor enhancer on the
processing characteristics and consumer acceptance of restructured cooked hams. Meat
Science 96(3): 1165–1170. DOI: https://doi.org/10.1016/j.meatsci.2013.11.005.
Raffo A, Carcea M, Moneta E, et al. (2018) Influence of different levels of sodium chloride and
of a reduced-sodium salt substitute on volatiles formation and sensory quality of wheat
bread. Journal of Cereal Science 79: 518–526. DOI:
https://doi.org/10.1016/j.jcs.2017.12.013.
Silva, A. S.; Coutinho, V. F.; Azevedo CH (2015) Análise do teor de sódio em molhos de tomate
industrializados: um alerta para hipertensão. Saber Científico 4(1): 38–46.
60
Stone H and Sidel JI (2012) Sensory Evaluation Pratices. Elsevier I. Academic Press.
VICKERS Z (1988) Sensory Specific Satiety in Lemonade Using a Just Right Scale for
Sweetness. Journal of Sensory Studies 3(1): 1–8. DOI: 10.1111/j.1745-
459X.1988.tb00425.x.
Voorpostel CR, Dutra MB de L and Bolini HMA (2014) Sensory profile and drivers of liking
for grape nectar among smoker and nonsmoker consumers. Food Science and Technology
(Campinas) 34(1): 164–173. DOI: 10.1590/S0101-20612014000100024.
Webster JL, Dunford EK and Neal BC (2010) A systematic survey of the sodium contents of
processed foods. American Journal of Clinical Nutrition 91(2): 413–420. DOI:
10.3945/ajcn.2009.28688.
Yee KK, Sukumaran SK, Kotha R, et al. (2011) Glucose transporters and ATP-gated K+
(KATP) metabolic sensors are present in type 1 taste receptor 3 (T1r3)-expressing taste
cells. Proceedings of the National Academy of Sciences 108(13): 5431–5436. DOI:
10.1073/pnas.1100495108.
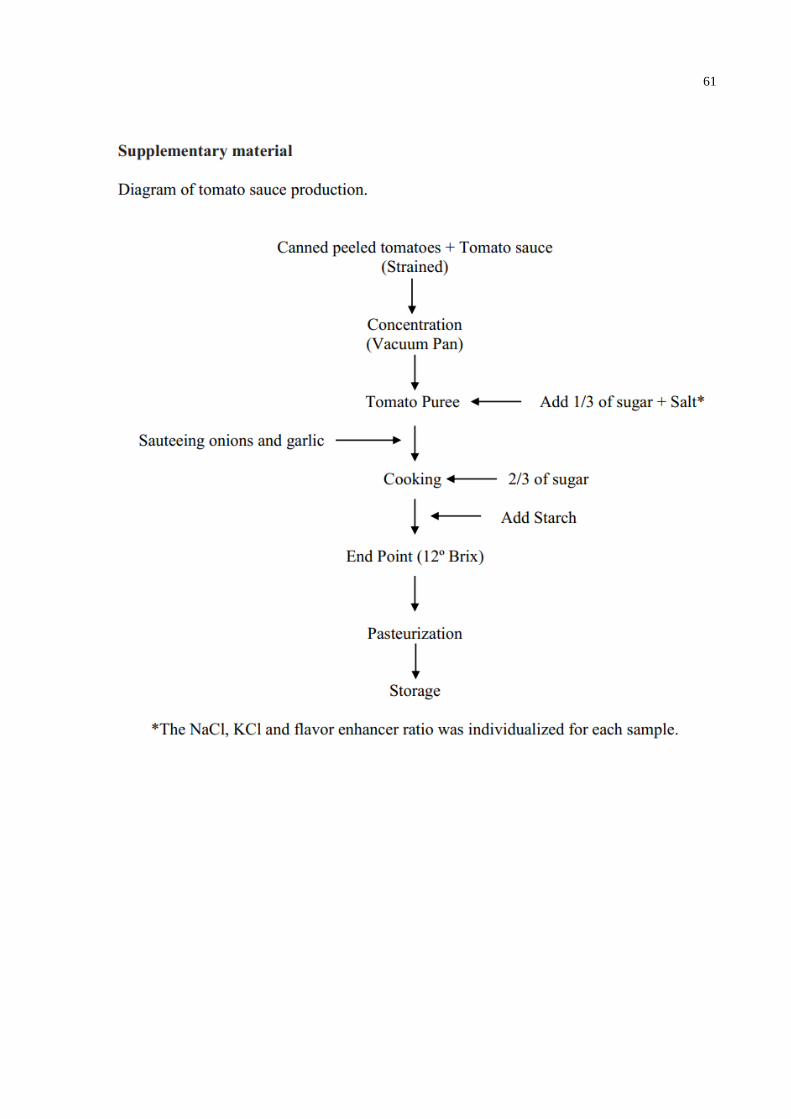
61
62
ARTICLE 2: DYNAMIC ASPECTS OF SALT REDUCTION IN TOMATO SAUCE
BY USE OF FLAVOR ENHANCERS AND BITTER BLOCKER
Elson Rogério Tavares Filho1, Erick Almeida Esmerino2, Valfredo de Almeida Santos-Junior1,
Alessandra Cazzelato Lins da Silva1, Helena Maria André Bolini1.
1State University of Campinas (UNICAMP), Food and Nutrition Department, Cidade
Universitária “Zeferino Vaz”, s/n, Campinas, São Paulo, Brazil, 13083-862
2 Federal Rural University of Rio de Janeiro (UFRRJ) - DTA, Seropédica – RJ- 23.890-000,
Brasil.
Author for correspondence:
Elson Rogério Tavares Filho.
State University of Campinas – FEA, Food and Nutrition Department
80 Monteiro Lobato (St), Campinas, São Paulo, Brazil, Zip code: 13083862
Tel: +55 (19) 3521-4059
63
ABSTRACT
Several government agencies have established guidelines for the food industry to reduce sugar,
fat, and salt in processed foods. The objective of this study was to determine the dynamic
sensory profile of tomato sauce formulated with flavor enhancers, bitter blocker and 50%
sodium content reduction. Temporal dominance of sensations (TDS) and temporal acceptance
(TAA) were used to verify consumer perceptions while time-intensity (TI) evaluated the
perception of the trained panel. Time acceptance indicated that flavor enhancers improve initial
acceptance of the sample but that its masking effect weakens after 30 seconds of ingestion. TI
showed that despite promoting salty equivalence, substitute salts were not able to completely
suppress the bitter taste characteristic of potassium chloride and the addition of lysine as a bitter
blocker was the least effective strategy. In TDS the bitter taste was not dominant in any of the
samples. However, the presence of unusual flavors to the consumers like metal and umami
seems to have interfered negatively in the evaluation of the tasters. Flavor enhancers have been
widely used to reformulate processed foods in order to reduce sodium content, preserving
sensory acceptance. This study provides information on how different salt substitutes behave
dynamically.
Practical Application: The use of salt substitutes by food industries is common practice in
reformulated products to reduce sodium content. This study provides information on how these
substitutes behave dynamically in food tasting, offering a modern sensory profile for efficient
substitution.
Keywords: Temporal, sensory evaluation, sodium, potassium, monosodium glutamate.
64
1. INTRODUTION
Despite the practicality, processed and ready-to-eat foods are often rich in salt,
sugar, and fat. These ingredients are related to some chronic non-communicable diseases
(NCDs) such as cancer, high blood pressure and kidney disease. This association prompted
governmental health agencies to create guidelines for reformulating processed foods, with
emphasis on the target-foods, for their large consumption and high content of salt (WHO,
2015). Among the target food categories for reformulation are sauces.
Strategies have been applied to reduce sodium in foods, including partial
replacement of traditional salt (NaCl) with KCl (Bidlas & Lambert, 2008; Dos Santos Alves et
al., 2017; Ferrão et al., 2016; Tamm, Bolumar, Bajovic, & Toepfl, 2016). Potassium, besides
promoting salty taste, has a different action than sodium in relation to arterial hypertension.
Low potassium intake, and high Na/K ratio have strong independent dose-response associations
with hypertension (Du et al., 2013). Thus, in relation to the health appeal, potassium is the
optimal choice to replace sodium, especially if related to high incidence of hypertension.
However, marked differences are recognized between KCl and NaCl. Regarding
the technological properties, differences in the speed of the enzymatic reactions and alterations
in the conservative effect are noticed. In sensory properties, KCl is recognized for its greater
intensity of bitter, metallic taste and the presence of off-flavors (Thibaudeau, Roy, & St-Gelais,
2015; Wu et al., 2016; Yotsuyanagi et al., 2016). The combination of KCl with flavor
enhancers, as monosodium glutamate, sodium inosinate, sodium guanylate and kokumi aroma
is successfully applied in improving the KCl sensory acceptance, which aim to enhance its salty
taste and mask other undesired flavors (Felicio et al., 2016; Grummer et al., 2013; Dos Santos
Alves et al., 2017; dos Santos et al., 2014). In the case of lysine, rather than enhancing the flavor
of the product, it has been studied promoting the bitter taste blockade of NaCl substitutes (Dos
Santos Alves et al., 2017).
Developing or reformulating a product using sensory evaluation methods allows a
complete view of the sensory profile. Statistical methodologies have been widely used to
determine the sensorial profile as the Quantitative Descriptive Analysis (QDA®) (Meilgaard,
Civille, & Carr, 2016). Dynamic sensorial methodologies have also been applied to approach
the actual consumption process, which involves more detailed monitoring of interactions
between food components over time (Ares et al., 2016; Oliveira et al., 2016).

65
Traditionally, the classical methodology to the dynamic evaluation is the Time-
Intensity Analysis (Lawless & Heymann, 2010). However, it requires intensive training and
statistical validation steps (Sokolowsky, Rosenberger, & Fischer, 2015), which makes it
expensive and time-consuming. In this sense, methodologies that provide faster responses using
consumers’ perception have become increasingly popular. One of them is the Temporal
Dominance of Sensations (TDS), a descriptive, temporal and multi-attribute method (Schlich,
2017). It has been used successfully in different products such as Merlot wine, dark chocolate,
Lucaniam dry-sausage (Braghieri et al., 2016; Frost, Blackman, Ebeler, & Heymann, 2018;
Oberrauter, Januszewska, Schlich, & Majchrzak, 2018) and in the reformulation and
characterization of low sodium products as dry-cured loins, and low-sodium Mozzarella cheese
(Bemfeito, Rodrigues, Silva, & Abreu, 2016; L. Lorido, Estévez, & Ventanas, 2018; J F
Rodrigues, Gonçalves, Pereira, Carneiro, & Pinheiro, 2014).
The acceptance of a product can behave dynamically (Meyners, 2016). Acceptance
tests are important because they produce hedonistic data from consumers and the association
of these data with descriptive statistics produces valuable information for the development and
reformulation of a commercial product. The methodology Temporal Liking (TL) (Ramsey et
al., 2018), was modified and named Temporal Acceptance Analysis (TA), to correlate its data
with the data obtained from the TDS and TI methodologies.
In this perspective, the objective of this study was to develop a tomato sauce
containing potassium assessing the impact of the substitution of 50% of the sodium content of
processed tomato sauce through the dynamic perception of consumers and trained panel.
Samples containing KCl associated with flavor enhancers: monosodium glutamate, disodium
inosinate, disodium guanylate and Aji-100 aroma were used to verify their ability to highlight
the desired tastes of tomato sauce and to mask the sensory defects of KCl (Jinap et al., 2016;
Campagnol et al., 2011; Pasin et al., 1989) . Lysine was added to the study if its ability to block
the bitter taste was perceived in tomato sauce (dos Santos et al., 2014).
2. MATERIAL AND METHODS
2.1 Tomato sauce and salts
Sauce ingredients are seen in Table 1. Salts: NaCl and KCl (Synth®️, São Paulo - Brazil). Flavor
enhancers: Monosodium Glutamate (MSG), Disodium Inosinate (IMP), Disodium Inosinate +
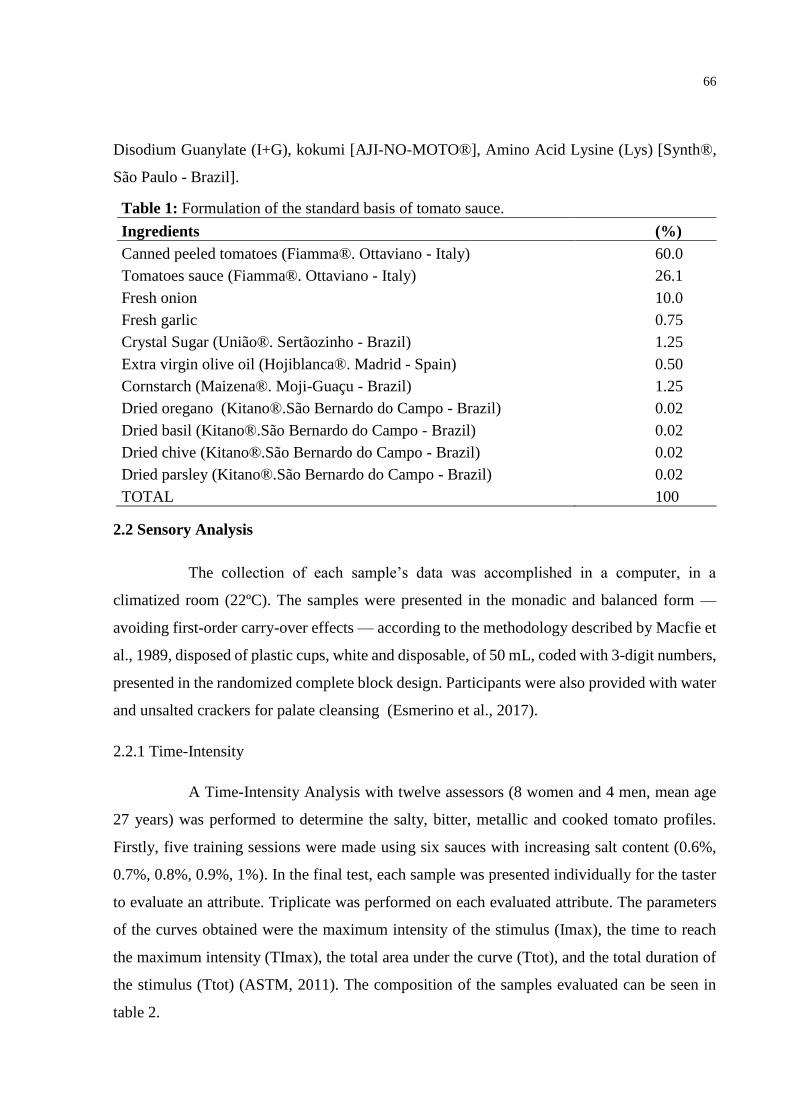
66
Disodium Guanylate (I+G), kokumi [AJI-NO-MOTO®️], Amino Acid Lysine (Lys) [Synth®️,
São Paulo - Brazil].
Table 1: Formulation of the standard basis of tomato sauce.
Ingredients (%)
Canned peeled tomatoes (Fiamma®️. Ottaviano - Italy) 60.0
Tomatoes sauce (Fiamma®️. Ottaviano - Italy) 26.1
Fresh onion 10.0
Fresh garlic 0.75
Crystal Sugar (União®️. Sertãozinho - Brazil) 1.25
Extra virgin olive oil (Hojiblanca®️. Madrid - Spain) 0.50
Cornstarch (Maizena®️. Moji-Guaçu - Brazil) 1.25
Dried oregano (Kitano®️.São Bernardo do Campo - Brazil) 0.02
Dried basil (Kitano®️.São Bernardo do Campo - Brazil) 0.02
Dried chive (Kitano®️.São Bernardo do Campo - Brazil) 0.02
Dried parsley (Kitano®️.São Bernardo do Campo - Brazil) 0.02
TOTAL 100
2.2 Sensory Analysis
The collection of each sample’s data was accomplished in a computer, in a
climatized room (22ºC). The samples were presented in the monadic and balanced form —
avoiding first-order carry-over effects — according to the methodology described by Macfie et
al., 1989, disposed of plastic cups, white and disposable, of 50 mL, coded with 3-digit numbers,
presented in the randomized complete block design. Participants were also provided with water
and unsalted crackers for palate cleansing (Esmerino et al., 2017).
2.2.1 Time-Intensity
A Time-Intensity Analysis with twelve assessors (8 women and 4 men, mean age
27 years) was performed to determine the salty, bitter, metallic and cooked tomato profiles.
Firstly, five training sessions were made using six sauces with increasing salt content (0.6%,
0.7%, 0.8%, 0.9%, 1%). In the final test, each sample was presented individually for the taster
to evaluate an attribute. Triplicate was performed on each evaluated attribute. The parameters
of the curves obtained were the maximum intensity of the stimulus (Imax), the time to reach
the maximum intensity (TImax), the total area under the curve (Ttot), and the total duration of
the stimulus (Ttot) (ASTM, 2011). The composition of the samples evaluated can be seen in
table 2.
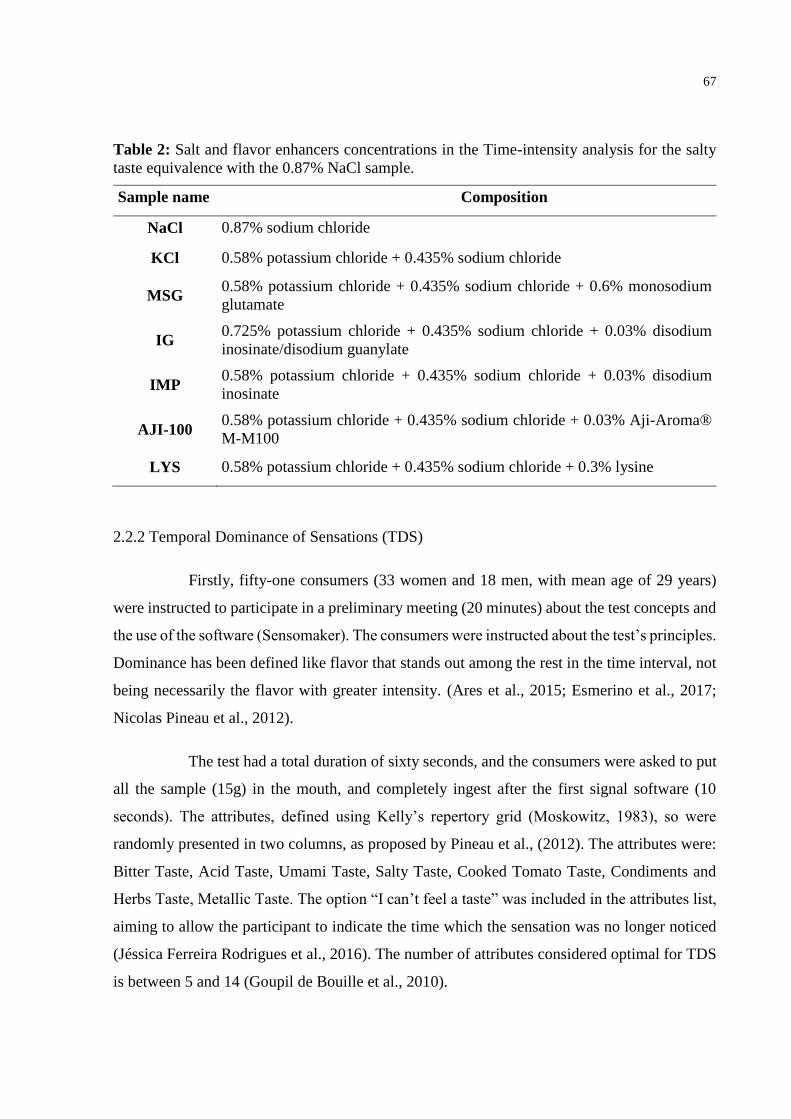
67
Table 2: Salt and flavor enhancers concentrations in the Time-intensity analysis for the salty
taste equivalence with the 0.87% NaCl sample.
Sample name Composition
NaCl 0.87% sodium chloride
KCl 0.58% potassium chloride + 0.435% sodium chloride
MSG 0.58% potassium chloride + 0.435% sodium chloride + 0.6% monosodium
glutamate
IG 0.725% potassium chloride + 0.435% sodium chloride + 0.03% disodium
inosinate/disodium guanylate
IMP 0.58% potassium chloride + 0.435% sodium chloride + 0.03% disodium
inosinate
AJI-100 0.58% potassium chloride + 0.435% sodium chloride + 0.03% Aji-Aroma®
M-M100
LYS 0.58% potassium chloride + 0.435% sodium chloride + 0.3% lysine
2.2.2 Temporal Dominance of Sensations (TDS)
Firstly, fifty-one consumers (33 women and 18 men, with mean age of 29 years)
were instructed to participate in a preliminary meeting (20 minutes) about the test concepts and
the use of the software (Sensomaker). The consumers were instructed about the test’s principles.
Dominance has been defined like flavor that stands out among the rest in the time interval, not
being necessarily the flavor with greater intensity. (Ares et al., 2015; Esmerino et al., 2017;
Nicolas Pineau et al., 2012).
The test had a total duration of sixty seconds, and the consumers were asked to put
all the sample (15g) in the mouth, and completely ingest after the first signal software (10
seconds). The attributes, defined using Kelly’s repertory grid (Moskowitz, 1983), so were
randomly presented in two columns, as proposed by Pineau et al., (2012). The attributes were:
Bitter Taste, Acid Taste, Umami Taste, Salty Taste, Cooked Tomato Taste, Condiments and
Herbs Taste, Metallic Taste. The option “I can’t feel a taste” was included in the attributes list,
aiming to allow the participant to indicate the time which the sensation was no longer noticed
(Jéssica Ferreira Rodrigues et al., 2016). The number of attributes considered optimal for TDS
is between 5 and 14 (Goupil de Bouille et al., 2010).
68
2.2.3 Temporal Acceptance Analysis
One hundred and twenty consumers were recruited. The acceptance was determined
by using a non-structured hedonic and linear scale of 9 cm (Stone & Sidel, 1993), anchored in
its ends, to the left “extremely disliked” and to the right “extremely liked.” At the first
evaluation (time = 0 seconds) they answered the traditional questions of the acceptance test,
such as appearance, aroma, taste, texture and overall liking. At the end of these responses, the
consumers were only evaluating the overall liking (Ramsey et al., 2018; Wakeling & MacFie,
1995).
The consumer was advised to answer questions of "appearance" and "aroma"
acceptance before placing the sample in the mouth, immediately after placing the sample in the
mouth the consumer was asked to answer the "taste" and "texture" questions, and immediately
after swallowing it to respond on the overall impression (considered t = 0s). Thus, as soon as
the overall impression question was answered, the time counting was started and after 30
seconds (30 seconds after swallowing the sample) and 60 seconds (60 seconds after swallowing
the sample) the consumer was asked to respond again to question about global printing.
2.3 Data Analysis
The data obtained through Time Intensity and Temporal Acceptance was submitted
to ANOVA (repeated measures) with post-hoc Tukey’s test to the level of 5% of significance,
using the SAS System for Windows (Statistical Analysis System) (2013).
The TDS data were collected and analyzed by the SensoMaker software to compute
the TDS curves. The curves were plotted (smooth = 0.5) and used for visual interpretation (N
Pineau et al., 2009). The graph lines represent the “chance level” and the “significance level.”
The “chance level” is the dominance rate that an attribute can obtain by chance, and the
“significance level” is the minimum value that the dominance rate should equal to be considered
to be significant (N Pineau et al., 2009; Ramsey et al., 2018).
3. RESULTS AND DISCUSSION
3.1 Time-Intensity Analysis (TI)
The salty taste was the first stimulus to be evaluated by the panelist. Significant
differences were not observed (p≥0.05) among the samples averages for Imax, Timax, Area,
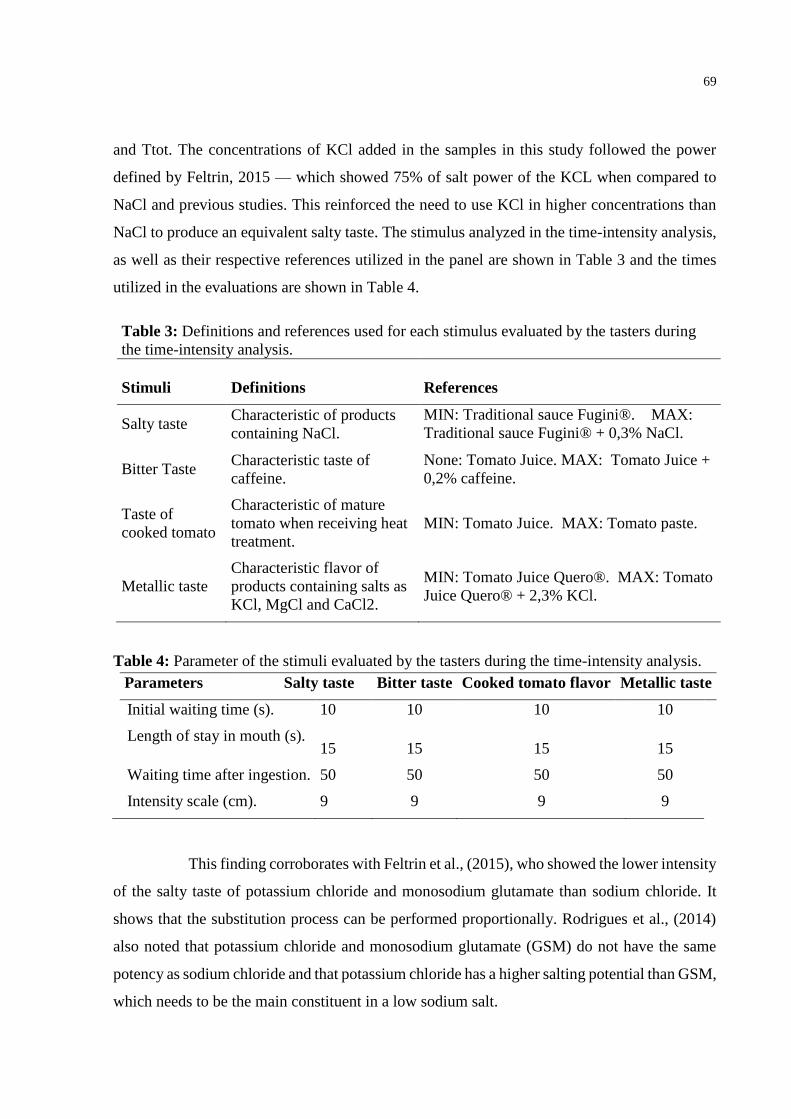
69
and Ttot. The concentrations of KCl added in the samples in this study followed the power
defined by Feltrin, 2015 — which showed 75% of salt power of the KCL when compared to
NaCl and previous studies. This reinforced the need to use KCl in higher concentrations than
NaCl to produce an equivalent salty taste. The stimulus analyzed in the time-intensity analysis,
as well as their respective references utilized in the panel are shown in Table 3 and the times
utilized in the evaluations are shown in Table 4.
Table 3: Definitions and references used for each stimulus evaluated by the tasters during
the time-intensity analysis.
Stimuli Definitions References
Salty taste Characteristic of products
containing NaCl.
MIN: Traditional sauce Fugini®. MAX:
Traditional sauce Fugini® + 0,3% NaCl.
Bitter Taste Characteristic taste of
caffeine.
None: Tomato Juice. MAX: Tomato Juice +
0,2% caffeine.
Taste of
cooked tomato
Characteristic of mature
tomato when receiving heat
treatment.
MIN: Tomato Juice. MAX: Tomato paste.
Metallic taste
Characteristic flavor of
products containing salts as
KCl, MgCl and CaCl2.
MIN: Tomato Juice Quero®. MAX: Tomato
Juice Quero® + 2,3% KCl.
Table 4: Parameter of the stimuli evaluated by the tasters during the time-intensity analysis.
Parameters Salty taste Bitter taste Cooked tomato flavor Metallic taste
Initial waiting time (s). 10 10 10 10
Length of stay in mouth (s). 15 15 15 15
Waiting time after ingestion. 50 50 50 50
Intensity scale (cm). 9 9 9 9
This finding corroborates with Feltrin et al., (2015), who showed the lower intensity
of the salty taste of potassium chloride and monosodium glutamate than sodium chloride. It
shows that the substitution process can be performed proportionally. Rodrigues et al., (2014)
also noted that potassium chloride and monosodium glutamate (GSM) do not have the same
potency as sodium chloride and that potassium chloride has a higher salting potential than GSM,
which needs to be the main constituent in a low sodium salt.
70
The bitter taste is an undesirable characteristic of KCl (Guàrdia, Guerrero, Gelabert,
Gou, & Arnau, 2008). When evaluating the maximum intensity (IMAX) it was observed that
the standard sample (NaCl) was the lesser bitter, while the samples containing umami taste
promoters (MSG, I + G, IMP, and AJI-100) presented medium intensity of bitter taste. The
higher bitter taste intensity was observed in the KCL and LYS samples.
Similar results were observed by Rodrigues et al., (2016) and Dos Santos et al.,
(2014) where flavor enhancers have minimized bitter taste. Among the flavor enhancers, only
those recognized as having umami taste promoted a significant reduction of bitter taste
(monosodium glutamate, disodium inosinate, disodium guanylate, and Kokumi aroma).
Interestingly, the amino acid lysine reported as a blocker of KCL sensory limitation doesn’t
show this effect in tomato sauce (Campagnol, dos Santos, Terra, & Pollonio, 2012; dos Santos
et al., 2014).
The TIMAX parameter did not show significant difference between the samples,
indicating that the time to reach the maximum bitter taste intensity was not altered by the flavor
enhancers. Monosodium glutamate, sodium inosinate, sodium guanylate, and kokumi in
addition to reducing the intensity of bitter taste (IMAX) also positively acted reducing its total
duration (TTOT). This effect of reducing the duration of bitter taste beyond its intensity has
great value because the bitter-aftertaste also compromises the sensory quality and acceptance
of the product (Galvão, Moura, Barretto, & Pollonio, 2014; Sinopoli & Lawless, 2012).
The metallic taste is common in products containing KCl and others low sodium
salts and is considered as a limitation of KCL (Desmond, 2006). The parameters of metallic
taste can be verified in Table 5. About IMAX, the umami taste promoters were efficient in
reducing the intensity of the metallic taste. The addition of the amino acid Lysine increase the
metallic taste observed both in the intensity and in the curve’s final area. As expected, the
sample NaCl showed the lowest IMAX value for the metallic taste, without differences from
MSG, IG and AJI-100. These samples showed significantly lower metallic taste values than the
KCL sample, indicating good masking for KCL’s metallic taste.
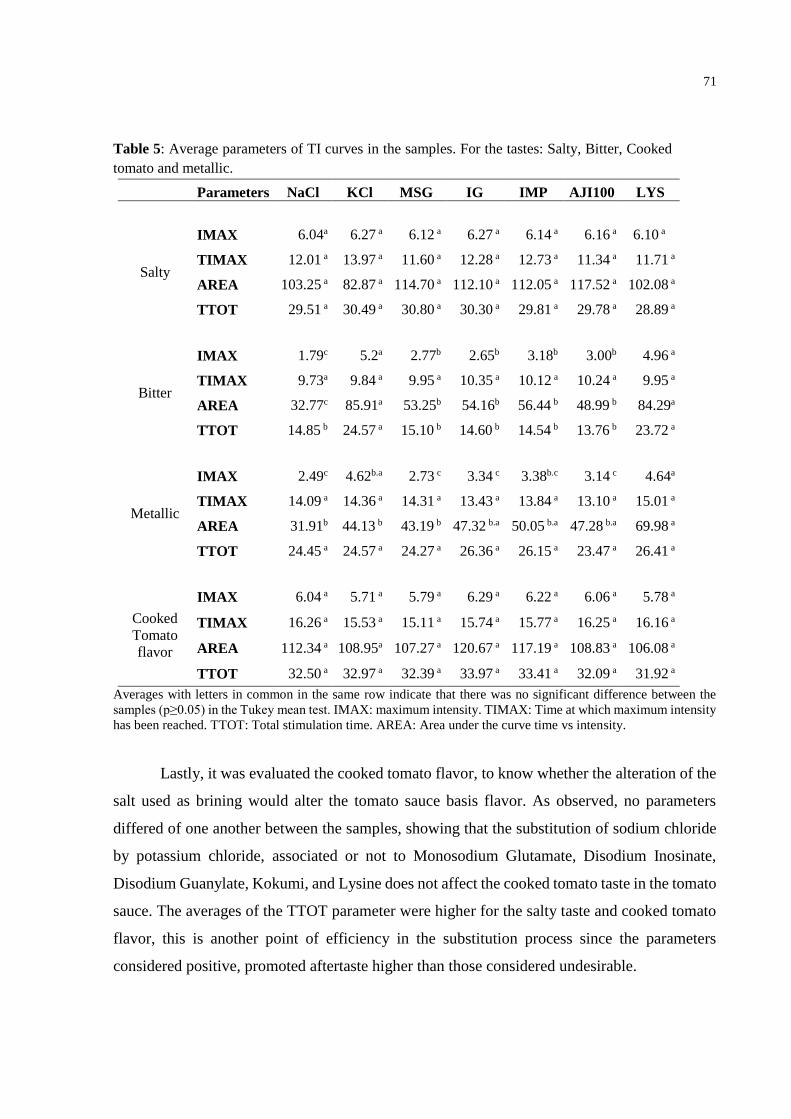
71
Table 5: Average parameters of TI curves in the samples. For the tastes: Salty, Bitter, Cooked
tomato and metallic.
Parameters NaCl KCl MSG IG IMP AJI100 LYS
Salty
IMAX 6.04a 6.27 a 6.12 a 6.27 a 6.14 a 6.16 a 6.10 a
TIMAX 12.01 a 13.97 a 11.60 a 12.28 a 12.73 a 11.34 a 11.71 a
AREA 103.25 a 82.87 a 114.70 a 112.10 a 112.05 a 117.52 a 102.08 a
TTOT 29.51 a 30.49 a 30.80 a 30.30 a 29.81 a 29.78 a 28.89 a
Bitter
IMAX 1.79c 5.2a 2.77b 2.65b 3.18b 3.00b 4.96 a
TIMAX 9.73a 9.84 a 9.95 a 10.35 a 10.12 a 10.24 a 9.95 a
AREA 32.77c 85.91a 53.25b 54.16b 56.44 b 48.99 b 84.29a
TTOT 14.85 b 24.57 a 15.10 b 14.60 b 14.54 b 13.76 b 23.72 a
Metallic
IMAX 2.49c 4.62b.a 2.73 c 3.34 c 3.38b.c 3.14 c 4.64a
TIMAX 14.09 a 14.36 a 14.31 a 13.43 a 13.84 a 13.10 a 15.01 a
AREA 31.91b 44.13 b 43.19 b 47.32 b.a 50.05 b.a 47.28 b.a 69.98 a
TTOT 24.45 a 24.57 a 24.27 a 26.36 a 26.15 a 23.47 a 26.41 a
Cooked
Tomato
flavor
IMAX 6.04 a 5.71 a 5.79 a 6.29 a 6.22 a 6.06 a 5.78 a
TIMAX 16.26 a 15.53 a 15.11 a 15.74 a 15.77 a 16.25 a 16.16 a
AREA 112.34 a 108.95a 107.27 a 120.67 a 117.19 a 108.83 a 106.08 a
TTOT 32.50 a 32.97 a 32.39 a 33.97 a 33.41 a 32.09 a 31.92 a
Averages with letters in common in the same row indicate that there was no significant difference between the
samples (p≥0.05) in the Tukey mean test. IMAX: maximum intensity. TIMAX: Time at which maximum intensity
has been reached. TTOT: Total stimulation time. AREA: Area under the curve time vs intensity.
Lastly, it was evaluated the cooked tomato flavor, to know whether the alteration of the
salt used as brining would alter the tomato sauce basis flavor. As observed, no parameters
differed of one another between the samples, showing that the substitution of sodium chloride
by potassium chloride, associated or not to Monosodium Glutamate, Disodium Inosinate,
Disodium Guanylate, Kokumi, and Lysine does not affect the cooked tomato taste in the tomato
sauce. The averages of the TTOT parameter were higher for the salty taste and cooked tomato
flavor, this is another point of efficiency in the substitution process since the parameters
considered positive, promoted aftertaste higher than those considered undesirable.
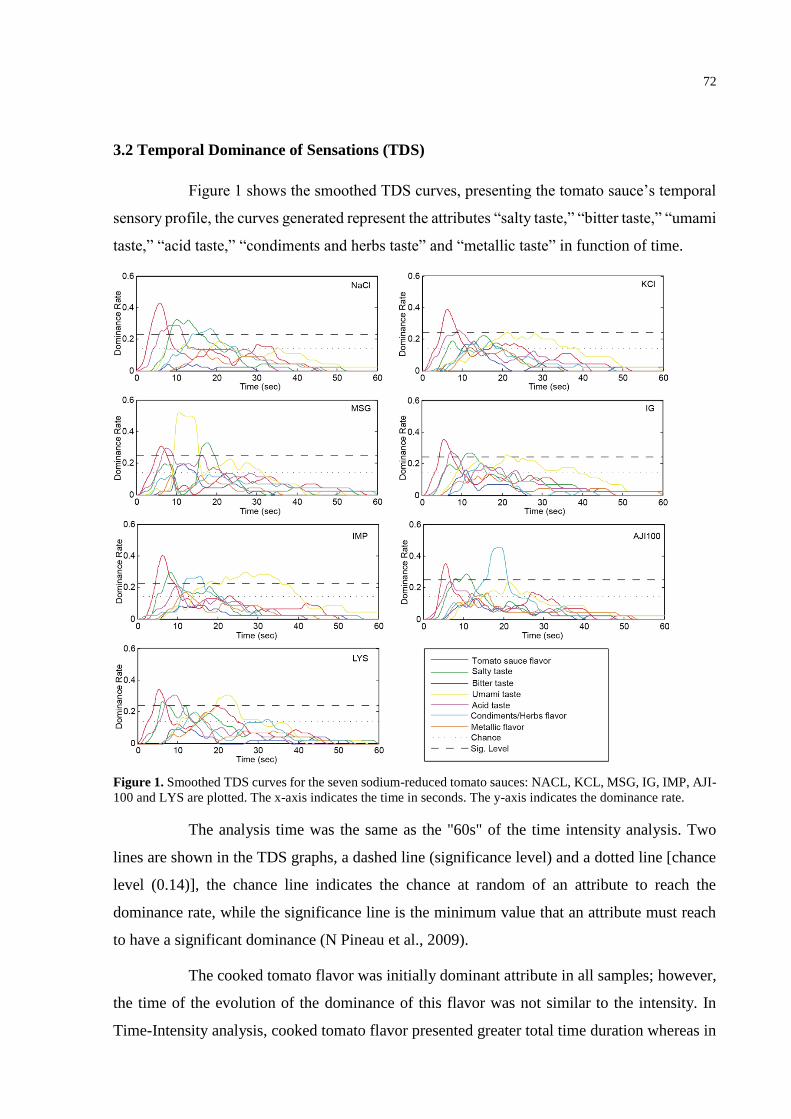
72
3.2 Temporal Dominance of Sensations (TDS)
Figure 1 shows the smoothed TDS curves, presenting the tomato sauce’s temporal
sensory profile, the curves generated represent the attributes “salty taste,” “bitter taste,” “umami
taste,” “acid taste,” “condiments and herbs taste” and “metallic taste” in function of time.
Figure 1. Smoothed TDS curves for the seven sodium-reduced tomato sauces: NACL, KCL, MSG, IG, IMP, AJI-
100 and LYS are plotted. The x-axis indicates the time in seconds. The y-axis indicates the dominance rate.
The analysis time was the same as the "60s" of the time intensity analysis. Two
lines are shown in the TDS graphs, a dashed line (significance level) and a dotted line [chance
level (0.14)], the chance line indicates the chance at random of an attribute to reach the
dominance rate, while the significance line is the minimum value that an attribute must reach
to have a significant dominance (N Pineau et al., 2009).
The cooked tomato flavor was initially dominant attribute in all samples; however,
the time of the evolution of the dominance of this flavor was not similar to the intensity. In
Time-Intensity analysis, cooked tomato flavor presented greater total time duration whereas in
73
the TDS the dominance did not reach significance after the 10 seconds range. After the
dominance of the tomato taste ends, there are posterior dominance differences between samples
(Fig 1).
As seen in figure 1, for the sample NaCl the dominant attributes was “acid taste”,
“salty taste”, “condiments and herbs taste”; for the KCl was just “acid taste” and subtly
“umami” and the MSG showed dominance in the “acid taste”, followed by a strong dominance
in the “umami taste” and “salty taste”. For the sample IG, it was observed a dominance in the
attributes “acid taste”, “salty taste,” “condiments and herbs taste” and “umami”; the samples
IMP showed “salty taste”, “condiments and herbs taste” and “umami taste”; AJI-100 presented
“salty taste” and “condiments and herbs taste,” and the LYS shows “salty taste”, “acid taste”
and “umami taste” dominance sequence. Bitter and metallic taste showed no dominance in any
of the samples, which suggests that although it was present in the samples, it was not enough
to be dominant in any of the samples. Partial reductions in sodium chloride and their substitution
by potassium chloride can minimize the dominance of bitter taste and other undesirable tastes
and flavors (Lorido et al., 2018).
Unexpectedly, LYS and KCL showed the dominance of "umami taste." This
suggested that Lysine and Potassium Chloride may have promoted some unknown flavor for
consumers which led to classify as "umami". The definition of Umami taste is confusing to
consumers and varies according to their age and degree of education, and sometimes this taste
can be confused with even textured or holistic concepts (Marques, Reis, Moura, Bonadimann,
& Mitterer-Daltoé, 2018). For this reasons umami taste is not so common and appeared as
available for choice in the TDS panel.
3.3 Temporal Acceptance Analysis
The sensory attributes evaluated by the consumers is presented in table 6. The
appearance, aroma, and texture of the samples did not show a significant difference (p≥0.05).
Regarding the attribute flavor, only the samples I+G and AJI-100 showed lower values than the
standard sample NaCl. Tomato sauce is a complex product because it has an expected texture
and it seasonality causes strong aromatic characteristics. Therefore, the analysis of the flavor
alone did not correspond directly to that found in the overall liking, where the taster was asked
to evaluate how he felt after the product tasting experience. As the overall liking does not deal
with a specific characteristic such as flavor or texture, it has a more subjective character and
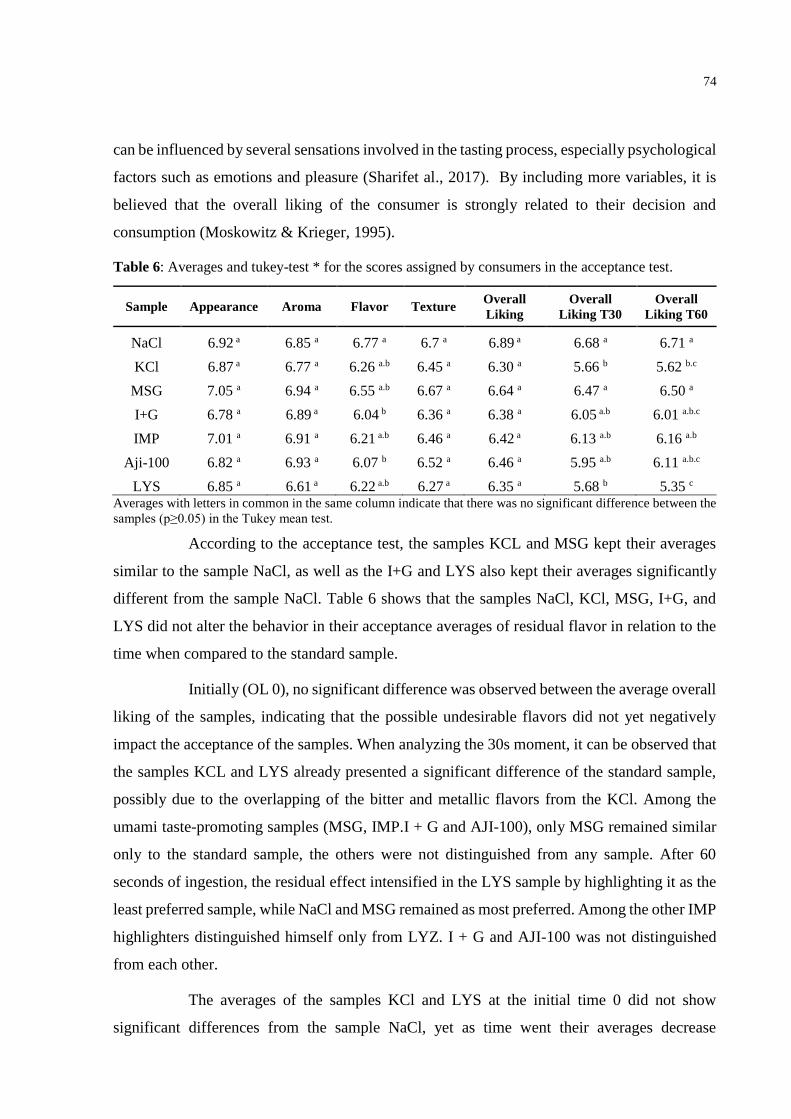
74
can be influenced by several sensations involved in the tasting process, especially psychological
factors such as emotions and pleasure (Sharifet al., 2017). By including more variables, it is
believed that the overall liking of the consumer is strongly related to their decision and
consumption (Moskowitz & Krieger, 1995).
Table 6: Averages and tukey-test * for the scores assigned by consumers in the acceptance test.
Sample Appearance Aroma Flavor Texture Overall
Liking
Overall
Liking T30 Overall
Liking T60
NaCl 6.92 a 6.85 a 6.77 a 6.7 a 6.89 a 6.68 a 6.71 a
KCl 6.87 a 6.77 a 6.26 a.b 6.45 a 6.30 a 5.66 b 5.62 b.c
MSG 7.05 a 6.94 a 6.55 a.b 6.67 a 6.64 a 6.47 a 6.50 a
I+G 6.78 a 6.89 a 6.04 b 6.36 a 6.38 a 6.05 a.b 6.01 a.b.c
IMP 7.01 a 6.91 a 6.21 a.b 6.46 a 6.42 a 6.13 a.b 6.16 a.b
Aji-100 6.82 a 6.93 a 6.07 b 6.52 a 6.46 a 5.95 a.b 6.11 a.b.c
LYS 6.85 a 6.61 a 6.22 a.b 6.27 a 6.35 a 5.68 b 5.35 c Averages with letters in common in the same column indicate that there was no significant difference between the
samples (p≥0.05) in the Tukey mean test.
According to the acceptance test, the samples KCL and MSG kept their averages
similar to the sample NaCl, as well as the I+G and LYS also kept their averages significantly
different from the sample NaCl. Table 6 shows that the samples NaCl, KCl, MSG, I+G, and
LYS did not alter the behavior in their acceptance averages of residual flavor in relation to the
time when compared to the standard sample.
Initially (OL 0), no significant difference was observed between the average overall
liking of the samples, indicating that the possible undesirable flavors did not yet negatively
impact the acceptance of the samples. When analyzing the 30s moment, it can be observed that
the samples KCL and LYS already presented a significant difference of the standard sample,
possibly due to the overlapping of the bitter and metallic flavors from the KCl. Among the
umami taste-promoting samples (MSG, IMP.I + G and AJI-100), only MSG remained similar
only to the standard sample, the others were not distinguished from any sample. After 60
seconds of ingestion, the residual effect intensified in the LYS sample by highlighting it as the
least preferred sample, while NaCl and MSG remained as most preferred. Among the other IMP
highlighters distinguished himself only from LYZ. I + G and AJI-100 was not distinguished
from each other.
The averages of the samples KCl and LYS at the initial time 0 did not show
significant differences from the sample NaCl, yet as time went their averages decrease
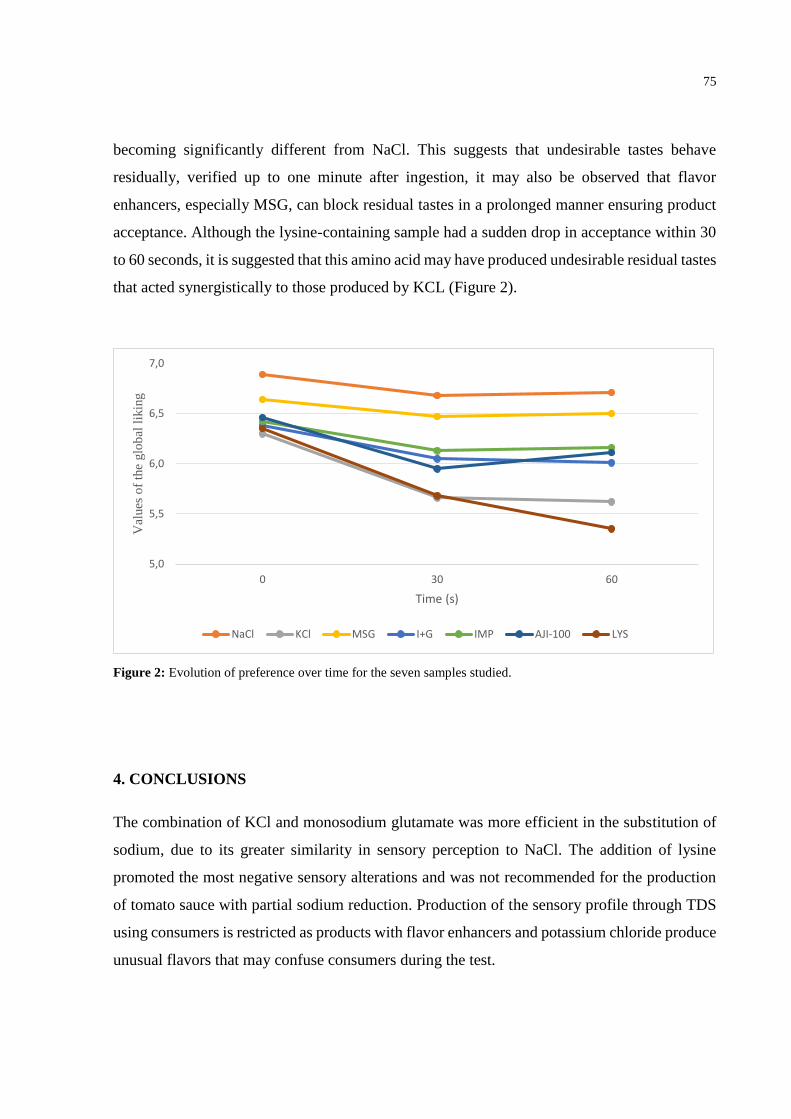
75
becoming significantly different from NaCl. This suggests that undesirable tastes behave
residually, verified up to one minute after ingestion, it may also be observed that flavor
enhancers, especially MSG, can block residual tastes in a prolonged manner ensuring product
acceptance. Although the lysine-containing sample had a sudden drop in acceptance within 30
to 60 seconds, it is suggested that this amino acid may have produced undesirable residual tastes
that acted synergistically to those produced by KCL (Figure 2).
Figure 2: Evolution of preference over time for the seven samples studied.
4. CONCLUSIONS
The combination of KCl and monosodium glutamate was more efficient in the substitution of
sodium, due to its greater similarity in sensory perception to NaCl. The addition of lysine
promoted the most negative sensory alterations and was not recommended for the production
of tomato sauce with partial sodium reduction. Production of the sensory profile through TDS
using consumers is restricted as products with flavor enhancers and potassium chloride produce
unusual flavors that may confuse consumers during the test.
5,0
5,5
6,0
6,5
7,0
0 30 60
Val
ues
of
the
glo
bal
lik
ing
Time (s)
NaCl KCl MSG I+G IMP AJI-100 LYS
76
5. REFERENCES
Ares, G., Antúnez, L., Bruzzone, F., Vidal, L., Giménez, A., Pineau, B., … Jaeger, S. R. (2015).
Comparison of sensory product profiles generated by trained assessors and consumers
using CATA questions: Four case studies with complex and/or similar samples. Food
Quality and Preference, 45, 75–86. https://doi.org/10.1016/j.foodqual.2015.05.007
Ares, G., Vidal, L., Allegue, G., Giménez, A., Bandeira, E., Moratorio, X., … Curutchet, M. R.
(2016). Consumers’ conceptualization of ultra-processed foods. Appetite, 105, 611–617.
https://doi.org/https://doi.org/10.1016/j.appet.2016.06.028
ASTM. (2011). ASTM E1909 - 11 Standard Guide for Time Intensity Evaluation of Sensory
Attributes. West Conshohocken, PA: ASTM International. Retrieved from
http://www.astm.org/Standards/E1909.htm
Bemfeito, R. M., Rodrigues, J. F., Silva, J. G. e, & Abreu, L. R. (2016). Temporal dominance
of sensations sensory profile and drivers of liking of artisanal Minas cheese produced in
the region of Serra da Canastra, Brazil. Journal of Dairy Science, 99(10), 7886–7897.
https://doi.org/10.3168/jds.2016-11056
Bidlas, E., & Lambert, R. J. W. (2008). Comparing the antimicrobial effectiveness of NaCl and
KCl with a view to salt/sodium replacement. International Journal of Food Microbiology,
124(1), 98–102. https://doi.org/10.1016/j.ijfoodmicro.2008.02.031
Braghieri, A., Piazzolla, N., Galgano, F., Condelli, N., De Rosa, G., & Napolitano, F. (2016).
Effect of preservative addition on sensory and dynamic profile of Lucanian dry-sausages
as assessed by quantitative descriptive analysis and temporal dominance of sensations.
Meat Science, 122, 68–75. https://doi.org/10.1016/j.meatsci.2016.07.020
Campagnol, P. C. B., dos Santos, B. A., Morgano, M. A., Terra, N. N., & Pollonio, M. A. R.
(2011). Application of lysine, taurine, disodium inosinate and disodium guanylate in
fermented cooked sausages with 50% replacement of NaCl by KCl. Meat science, 87(3),
239-243.
Campagnol, P. C. B., dos Santos, B. A., Terra, N. N., & Pollonio, M. A. R. (2012). Lysine,
disodium guanylate and disodium inosinate as flavor enhancers in low-sodium fermented
sausages. Meat Science, 91(3), 334–338.
https://doi.org/https://doi.org/10.1016/j.meatsci.2012.02.012
Desmond, E. (2006). Reducing salt: A challenge for the meat industry. Meat Science, 74(1),
188–196. https://doi.org/https://doi.org/10.1016/j.meatsci.2006.04.014
Dos Santos Alves, L. A. A., Lorenzo, J. M., Goncalves, C. A. A., Dos Santos, B. A., Heck, R.
T., Cichoski, A. J., & Campagnol, P. C. B. (2017). Impact of lysine and liquid smoke as
flavor enhancers on the quality of low-fat Bologna-type sausages with 50% replacement
of NaCl by KCl. Meat Science, 123, 50–56. https://doi.org/10.1016/j.meatsci.2016.09.001
dos Santos, B. A., Campagnol, P. C. B., Morgano, M. A., & Pollonio, M. A. R. (2014).
Monosodium glutamate, disodium inosinate, disodium guanylate, lysine and taurine
improve the sensory quality of fermented cooked sausages with 50% and 75% replacement
77
of NaCl with KCl. Meat Science, 96(1), 509–513.
https://doi.org/10.1016/j.meatsci.2013.08.024
Drake, S. L., & Drake, M. A. (2011). Comparison of salty taste and time intensity of sea and
land salts from around the world. Journal of Sensory Studies.
https://doi.org/10.1111/j.1745-459X.2010.00317.x
Du, S., Neiman, A., Batis, C., Wang, H., Zhang, B., Zhang, J., & Popkin, B. M. (2013).
Understanding the patterns and trends of sodium intake, potassium intake, and sodium to
potassium ratio and their effect on hypertension in China. The American journal of
clinical nutrition, 99(2), 334-343.
Esmerino, E. A., Castura, J. C., Ferraz, J. P., Tavares Filho, E. R., Silva, R., Cruz, A. G., …
Bolini, H. M. A. (2017). Dynamic profiling of different ready-to-drink fermented dairy
products: A comparative study using Temporal Check-All-That-Apply (TCATA),
Temporal Dominance of Sensations (TDS) and Progressive Profile (PP). Food Research
International (Ottawa, Ont.), 101, 249–258. https://doi.org/10.1016/j.foodres.2017.09.012
Felicio, T.L., Esmerino, E.A., Vidal, V.A.S., Cappato, L.P., Garcia, R.K.A., Cavalcanti, R.N.,
Freitas, M.Q., et al. (2016), “Physico-chemical changes during storage and sensory
acceptance of low sodium probiotic Minas cheese added with arginine”, Food Chemistry,
Vol. 196, pp. 628–637.
Feltrin, A. C., de Souza, V. R., Saraiva, C. G., Nunes, C. A., & Pinheiro, A. C. M. (2015).
Sensory study of different sodium chloride substitutes in aqueous solution. International
Journal of Food Science & Technology, 50(3), 730–735.
https://doi.org/10.1111/ijfs.12670
Ferrão, L. L., Silva, E. B., Silva, H. L. A., Silva, R., Mollakhalili, N., Granato, D., … Cruz, A.
G. (2016). Strategies to develop healthier processed cheeses: Reduction of sodium and fat
contents and use of prebiotics. Food Research International, 86, 93–102.
https://doi.org/https://doi.org/10.1016/j.foodres.2016.04.034
Frost, S. C., Blackman, J. W., Ebeler, S. E., & Heymann, H. (2018). Analysis of temporal
dominance of sensation data using correspondence analysis on Merlot wine with differing
maceration and cap management regimes. Food Quality and Preference, 64, 245–252.
https://doi.org/10.1016/j.foodqual.2016.11.011
Galvão, M. T. E. L., Moura, D. B., Barretto, A. C. S., & Pollonio, M. A. R. (2014). Effects of
micronized sodium chloride on the sensory profile and consumer acceptance of turkey ham
with reduced sodium content. Food Science and Technology (Campinas), 34(1), 189–194.
https://doi.org/10.1590/S0101-20612014005000009
Goupil de Bouille, A., Pineau, N., Meyners, M., Martin, N., & Schlich, P. (2010, February).
How do panelists use the list of attributes during a temporal dominance of sensations
experiment. In Proceedings of the 11th European Symposium on Statistical Methods for
the Food Industry (AgroStat) (p. 179).
78
Grummer, J., Bobowski, N., Karalus, M., Vickers, Z. and Schoenfuss, T. (2013), “Use of
potassium chloride and flavor enhancers in low sodium Cheddar cheese”, Journal of Dairy
Science, Vol. 96 No. 3, pp. 1401–1418
Guàrdia, M. D., Guerrero, L., Gelabert, J., Gou, P., & Arnau, J. (2008). Sensory characterisation
and consumer acceptability of small calibre fermented sausages with 50% substitution of
NaCl by mixtures of KCl and potassium lactate. Meat Science, 80(4), 1225–1230.
https://doi.org/https://doi.org/10.1016/j.meatsci.2008.05.031
Heymann, H., & Ebeler, S. E. (2016). Sensory and Instrumental Evaluation of Alcoholic
Beverages. Sensory and Instrumental Evaluation of Alcoholic Beverages.
https://doi.org/10.1016/B978-0-12-802727-1/00018-1
Jinap, S., Hajeb, P., Karim, R., Norliana, S., Yibadatihan, S., & Abdul-Kadir, R. (2016).
Reduction of sodium content in spicy soups using monosodium glutamate. Food &
nutrition research, 60(1), 30463.
Lawless, H. T., & Heymann, H. (2010). Sensory Evaluation of Food.
https://doi.org/10.1007/978-1-4419-6488-5
Lorido, L., Estévez, M., Ventanas, J., & Ventanas, S. (2015). Comparative study between
Serrano and Iberian dry-cured hams in relation to the application of high hydrostatic
pressure and temporal sensory perceptions. LWT - Food Science and Technology, 64(2),
1234–1242. https://doi.org/https://doi.org/10.1016/j.lwt.2015.07.029
Lorido, L., Estévez, M., & Ventanas, S. (2018). Fast and dynamic descriptive techniques (Flash
Profile, Time-intensity and Temporal Dominance of Sensations) for sensory
characterization of dry-cured loins. Meat Science, 145, 154–162.
https://doi.org/10.1016/j.meatsci.2018.06.028
Macfie, H. J., Bratchell, N., Greenhoff, K., & Vallis, L. V. (1989). Designs to balance the effect
of order of presentation and first-order carry-over effects in hall tests. Journal of Sensory
Studies, 4(2), 129–148. https://doi.org/10.1111/j.1745-459X.1989.tb00463.x
Marques, C., Reis, A., Moura, C., Bonadimann, F. S., & Mitterer-Daltoé, M. L. (2018).
<b>Consumer insight into the monosodium glutamate. Acta Scientiarum.
Technology, 40(1), 30838. https://doi.org/10.4025/actascitechnol.v40i1.30838
Meilgaard, M., Civille, G. V., & Carr, T. B. (2016). Sensory Evaluation Techniques, 448.
Meyners, M. (2016). Temporal liking and CATA analysis of TDS data on flavored fresh cheese.
Food Quality and Preference, 47, 101–108.
https://doi.org/https://doi.org/10.1016/j.foodqual.2015.02.005
Monteiro CS. (2008). Desenvolvimento de molho de tomate Lycopersicon esculentum Mill
formulado com cogumelo Agaricus brasiliensis. Universidade Federal do Paraná.
Moskowitz, H. R. (1983). Product testing and sensory evaluation of foods : marketing and
R&D approaches.
79
Moskowitz, H. R., & Krieger, B. (1995). The contribution of sensory liking to overall liking:
An analysis of six food categories. Food Quality and Preference, 6(2), 83–90.
https://doi.org/10.1016/0950-3293(95)98552-T
Moubarac, J.-C., Batal, M., Louzada, M. L., Martinez Steele, E., & Monteiro, C. A. (2017).
Consumption of ultra-processed foods predicts diet quality in Canada. Appetite, 108, 512–
520. https://doi.org/10.1016/j.appet.2016.11.006
Oberrauter, L. M., Januszewska, R., Schlich, P., & Majchrzak, D. (2018). Sensory evaluation
of dark origin and non-origin chocolates applying Temporal Dominance of Sensations
(TDS). Food Research International, 111, 39–49.
https://doi.org/10.1016/j.foodres.2018.05.007
Oliveira, D., Machín, L., Deliza, R., Rosenthal, A., Walter, E. H., Giménez, A., & Ares, G.
(2016). Consumers’ attention to functional food labels: Insights from eye-tracking and
change detection in a case study with probiotic milk. LWT - Food Science and Technology,
68, 160–167. https://doi.org/10.1016/j.lwt.2015.11.066
Palazzo, A. B., & Bolini, H. M. A. (2009). Multiple time-intensity analysis and acceptance of
raspberry-flavored gelatiN. Journal of Sensory Studies, 24(5), 648–663.
https://doi.org/10.1111/j.1745-459X.2009.00231.x
Pasin, G., O'Mahony, M., York, G., Weitzel, B., Gabriel, L., & Zeidler, G. (1989). Replacement
of Sodium Chloride by Modified Potassium Chloride (Cocrystalized Disodium‐5′‐Inosinate and Disodium‐5’‐Guanylate with Potassium Chloride) in Fresh Pork Sausages:
Acceptability Testing using Signal Detection Measures. Journal of Food Science, 54(3),
553-555.
Pineau, N., de Bouillé, A. G., Lepage, M., Lenfant, F., Schlich, P., Martin, N., & Rytz, A.
(2012). Temporal Dominance of Sensations: What is a good attribute list? Food Quality
and Preference, 26(2), 159–165.
https://doi.org/https://doi.org/10.1016/j.foodqual.2012.04.004
Pineau, N., Schlich, P., Cordelle, S., Mathonnière, C., Issanchou, S., Imbert, A., … Köster, E.
(2009). Temporal Dominance of Sensations: Construction of the TDS curves and
comparison with time–intensity. Food Quality and Preference, 20(6), 450–455.
https://doi.org/https://doi.org/10.1016/j.foodqual.2009.04.005
Ramsey, I., Ross, C., Ford, R., Fisk, I., Yang, Q., Gomez-Lopez, J., & Hort, J. (2018). Using a
combined temporal approach to evaluate the influence of ethanol concentration on liking
and sensory attributes of lager beer. Food Quality and Preference, 68, 292–303.
https://doi.org/10.1016/j.foodqual.2018.03.019
Rodrigues, J. F., Gonçalves, C. S., Pereira, R. C., Carneiro, J. D. S., & Pinheiro, A. C. M.
(2014). Utilization of temporal dominance of sensations and time intensity methodology
for development of low-sodium Mozzarella cheese using a mixture of salts. Journal of
Dairy Science, 97(8), 4733–4744. https://doi.org/https://doi.org/10.3168/jds.2014-7913
Rodrigues, J. F., Souza, V. R. de, Lima, R. R., Carneiro, J. de D. S., Nunes, C. A., & Pinheiro,
A. C. M. (2016). Temporal dominance of sensations (TDS) panel behavior: A preliminary
80
study with chocolate. Food Quality and Preference, 54, 51–57.
https://doi.org/https://doi.org/10.1016/j.foodqual.2016.07.002
Schlich, P. (2017). Temporal Dominance of Sensations (TDS): a new deal for temporal sensory
analysis Origin of TDS: from intensity to dominance. Current Opinion in Food Science,
15, 38–42. https://doi.org/10.1016/j.cofs.2017.05.003
Sharif, M. K., Butt, M. S., Sharif, H. R., & Nasir, M. (2017). Sensory Evaluation and Consumer
Acceptability. In Handbook of Food Science and Technology (pp. 362–386).
Sinopoli, D. A., & Lawless, H. T. (2012). Taste Properties of Potassium Chloride Alone and in
Mixtures with Sodium Chloride Using a Check-All-That-Apply Method. Journal of Food
Science, 77(9). https://doi.org/10.1111/j.1750-3841.2012.02862.x
Sokolowsky, M., Rosenberger, A., & Fischer, U. (2015). Sensory impact of skin contact on
white wines characterized by descriptive analysis, time–intensity analysis and temporal
dominance of sensations analysis. Food Quality and Preference, 39, 285–297.
https://doi.org/https://doi.org/10.1016/j.foodqual.2014.07.002
Stone, H., & Sidel, J. L. (1993). Sensory Evaluation Practices. Sensory Evaluation Practices.
https://doi.org/10.1016/B978-0-12-672482-0.50019-8
Tamm, A., Bolumar, T., Bajovic, B., & Toepfl, S. (2016). Salt (NaCl) reduction in cooked ham
by a combined approach of high pressure treatment and the salt replacer KCl. Innovative
Food Science and Emerging Technologies. https://doi.org/10.1016/j.ifset.2016.07.010
Thibaudeau, E., Roy, D., & St-Gelais, D. (2015). Production of brine-salted Mozzarella cheese
with different ratios of NaCl/KCl. International Dairy Journal, 40, 54–61.
https://doi.org/https://doi.org/10.1016/j.idairyj.2014.07.013
Wakeling, I. N., & MacFie, H. J. H. (1995). Designing consumer trials balanced for first and
higher orders of carry-over effect when only a subset of k samples from t may be tested.
Food Quality and Preference, 6(4), 299–308. https://doi.org/10.1016/0950-
3293(95)00032-1
WHO. (2015). Media centre: Noncommunicable diseases. Retrieved from
www.who.int/mediacentre/factsheets/fs355/en/
Wu, H., Yan, W., Zhuang, H., Huang, M., Zhao, J., & Zhang, J. (2016). Oxidative stability and
antioxidant enzyme activities of dry-cured bacons as affected by the partial substitution of
NaCl with KCl. Food Chemistry, 201, 237–242.
https://doi.org/10.1016/j.foodchem.2016.01.025
Yotsuyanagi, S. E., Contreras-Castillo, C. J., Haguiwara, M. M. H., Cipolli, K. M. V. A. B.,
Lemos, A. L. S. C., Morgano, M. A., & Yamada, E. A. (2016). Technological, sensory and
microbiological impacts of sodium reduction in frankfurters. Meat Science, 115, 50–59.
https://doi.org/10.1016/j.meatsci.2015.12.016
81
SHORT CONTRIBUTION: ELECTROENCEPHALOGRAPHY AND HEDONIC
SCALE TO EVALUATE SALT REDUCTION EFFICACY IN TOMATO SAUCE.
Elson Rogério Tavares Filho1, Erick Almeida Esmerino2, Valfredo de Almeida Santos-
Junior1, Eduardo Jose Soares Tavares3, Renato Ortolani Marcondes de Castro3, Helena
Maria André Bolini1.
1 State University of Campinas – FEA, Food and Nutrition Department, Campinas- Zip code:
13083-862, Brazil.
2 Federal Rural University of Rio de Janeiro (UFRRJ) - DTA, Seropédica – RJ- Zip code:
23.890-000, Brazil.
3 Federal University of Alfenas – MED, Medicine Department. Alfenas – MG. Zip code:
37130-000, Brazil.
Author for correspondence:
Elson Rogério Tavares Filho.
State University of Campinas – FEA, Food and Nutrition Department
80 Monteiro Lobato (St), Campinas, São Paulo, Brasil, Zip code: 13083862
Tel: +55 (19) 3521-4059
Short version of title: (Neural response of salt substitutes)
Journal of Food Science: Sensory and Food Quality
ABSTRACT
The association of excessive salt consumption with development of noncommunicable
diseases has created initiatives for the reformulation of processed foods aiming to reduce
the salt content. A neurophysiological and sensory approach provides valuable
information to ensure that a reformulated product retains its acceptability to consumers.
This study evaluated consumer perception during the ingestion of tomato sauce which
was low in sodium by using an electroencephalogram and hedonic acceptance scale.
Monosodium glutamate promoted a large increase in cortical activity and also generated
a higher rate of acceptance. Disodium inosinate also promoted increased electrical
activity and had a similar acceptance to sodium chloride. The sample containing
potassium chloride without flavor enhancer was the one that generated the least electrical
activity and acceptance. The addition of flavor enhancers — umami taste promoters —
masks the sensory defects of KCl and this effect seems to be related to increased electrical
activity in brain regions related to taste and reward/pleasure.
Keywords: Electrophysiology, umami, salt substitutes, food choice, neural response.
Practical Application: Neural and sensory response data on salt substitution aim to
provide information on how to reduce sodium in a product without compromising its
acceptance by the consumer.
1. INTRODUCTION
Diets with frequent consumption of processed foods are related to a high
intake of salt, sugar, and saturated fats. This dietary habit is strongly related to the
development of noncommunicable diseases (NCDs) such as hypertension, diabetes
mellitus, chronic kidney disease, cancer, heart attack, and “stroke (Beaglehole et al.,
2011). Several health agencies around the world such as WHO, ANVISA, AWASH,
Health Canada, and Public Health England propose guidelines aimed at reducing
excessive salt consumption by means of educational policies, an increased consumption
of potassium, and reformulating industrialized foods (Joffres, Campbell, Manns, & Tu,
2007; E. A. F. Nilson, Jaime, & Resende, 2012; Ogbu & Arah, 2016; Public Health
England, 2017; Webb et al., 2017; Webster et al., 2015; World Health Organization,
2010).
Some foods have been established as a priority for salt reduction due to high
sodium content provided per portion. These include sausage meats, bread, dairy products,
sauces like tomato sauce, ketchup, soy sauce, and mayonnaise (WHO & PAHO, 2013).
However, it is not enough to reduce the sodium of the formulation; it is necessary to
replace it in order to not reduce consumer product acceptance. As a result, strategies like
sensory analysis and neurophysiological approaches yield valuable insights for
preserving the commercial success of a product (Tomadoni, Fiszman, Moreira, &
Tarrega, 2018).
Acceptance testing using a hedonistic scale is effective in obtaining
subjective data related to consumer preference (Meilgaard, Civille, & Carr, 2016). In
addition to classical sensory analysis, new methodologies have been used to aggregate
information related to food consumption and acceptance. Among them,
electroencephalograph (EEG) provides information about neural response, and it can be
used to understand how the brain responds to gustatory stimuli (Crouzet, Busch, & Ohla,
2015; Park, Looney, & Mandic, 2011).
The EEG is a low-cost, non-invasive method of monitoring cortical electrical
activity (Nunez & Srinivasan, 2009). EEGs have been successfully used to evaluate the
behavior of neural stimulation of flavorless and flavored chewing gum, discrimination of
sweet and salty stimuli in aqueous solutions, acceptance of beer, and sweetened solutions
with sucrose and sweeteners (Andersen et al., 2018; Gonzalez Viejo, Fuentes, Howell,
Torrico, & Dunshea, 2018; Hashida, Silva, Souto, & Costa, 2005; Yagyu et al., 1998).
The present study used EEG and a hedonic scale to explore the neuronal
response of individuals when consuming standard tomato sauce (salted only with sodium
chloride [NaCl]) and also sauces containing the replacement of 50% of sodium chloride
with potassium chloride (KCl), mixed or not with monosodium glutamate (MSG), and
inosinate disodium (IMP).
2. MATERIAL AND METHODS
2.1 Tomato sauce base
The tomato sauce samples were elaborated in the Laboratory of Food
Technology at the Federal University of Alfenas. For its preparation it was used: Canned
peeled tomatoes (Fiamma Vesuviana®, Ottaviano-Italy), extra virgin olive oil
(Hojiblanca®, Madrid-Spain), dehydrated oregano (Kitano®, São Bernardo do Campo-
Brazil), dehydrated basil (Kitano®, São Bernardo do Campo-Brazil), dehydrated chives
(Kitano®, São Bernardo do Campo-Brazil), dehydrated parsley (Kitano®, São Bernardo
do Campo-Brazil), corn starch (MAIZENA®, Moji-Guaçu -Brazil), crystal sugar
(União®, Sertaozinho, Brazil), fresh onion, fresh garlic.
2.2 Salts
NaCl and KCl (Synth®, São Paulo-Brazil), disodium inosinate + disodium
guanylate (AJITIDE I + G®, AJI-NO-MOTO®, São Paulo - Brazil).
2.3 Participants
Twenty tasters were recruited to compose the panel in the Federal University
of Alfenas medical school, through dissemination in the information networks of the
university. The recruitment conditions consisted of consuming tomato sauce (at least once
a week) and availability of time to participate in the sessions.
After screening, nine volunteers (five men and four women) were recruited
to participate in the study. The exclusion criteria for participation in the study were:
people who were ill or using medication for chronic illness, smokers, pregnant, chemical
dependents, minors, people with any taste disorders, people presenting allergies to any
component of the formula or having already presented any adverse reaction to
examinations similar to an EEG. Participants were instructed to not ingest water or food
for at least two hours before the examination.
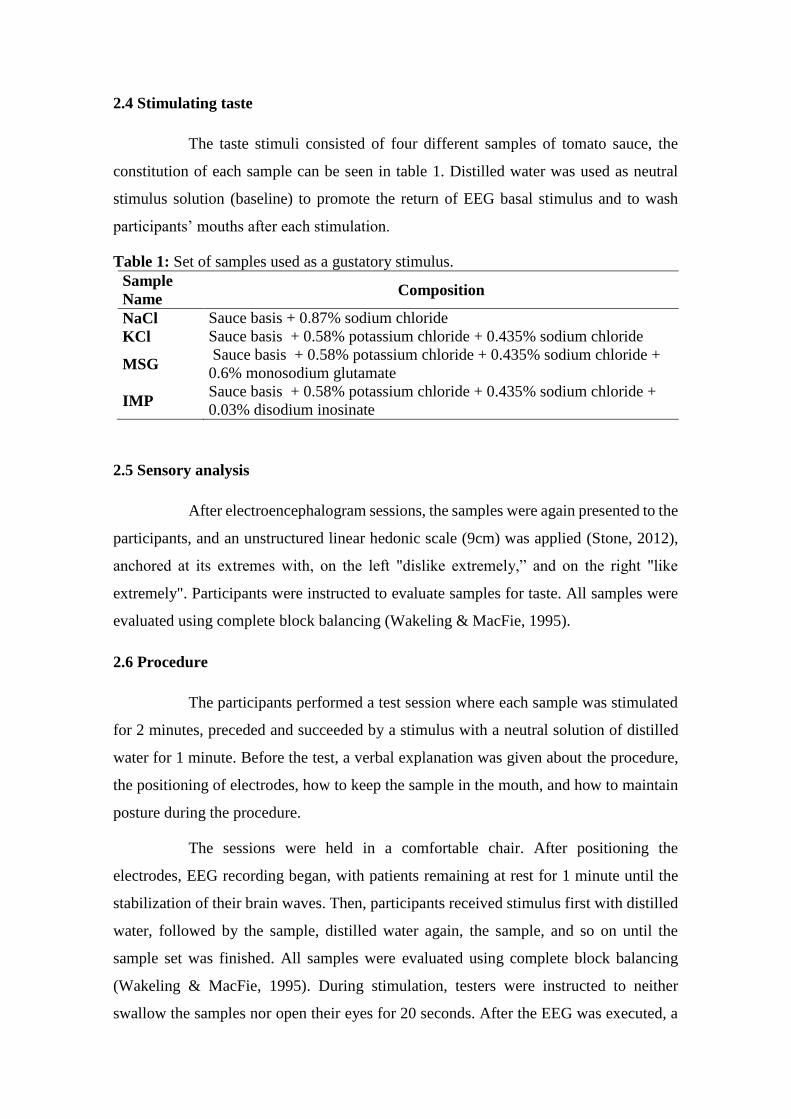
2.4 Stimulating taste
The taste stimuli consisted of four different samples of tomato sauce, the
constitution of each sample can be seen in table 1. Distilled water was used as neutral
stimulus solution (baseline) to promote the return of EEG basal stimulus and to wash
participants’ mouths after each stimulation.
Table 1: Set of samples used as a gustatory stimulus.
Sample
Name Composition
NaCl Sauce basis + 0.87% sodium chloride
KCl Sauce basis + 0.58% potassium chloride + 0.435% sodium chloride
MSG Sauce basis + 0.58% potassium chloride + 0.435% sodium chloride +
0.6% monosodium glutamate
IMP Sauce basis + 0.58% potassium chloride + 0.435% sodium chloride +
0.03% disodium inosinate
2.5 Sensory analysis
After electroencephalogram sessions, the samples were again presented to the
participants, and an unstructured linear hedonic scale (9cm) was applied (Stone, 2012),
anchored at its extremes with, on the left "dislike extremely,” and on the right "like
extremely". Participants were instructed to evaluate samples for taste. All samples were
evaluated using complete block balancing (Wakeling & MacFie, 1995).
2.6 Procedure
The participants performed a test session where each sample was stimulated
for 2 minutes, preceded and succeeded by a stimulus with a neutral solution of distilled
water for 1 minute. Before the test, a verbal explanation was given about the procedure,
the positioning of electrodes, how to keep the sample in the mouth, and how to maintain
posture during the procedure.
The sessions were held in a comfortable chair. After positioning the
electrodes, EEG recording began, with patients remaining at rest for 1 minute until the
stabilization of their brain waves. Then, participants received stimulus first with distilled
water, followed by the sample, distilled water again, the sample, and so on until the
sample set was finished. All samples were evaluated using complete block balancing
(Wakeling & MacFie, 1995). During stimulation, testers were instructed to neither
swallow the samples nor open their eyes for 20 seconds. After the EEG was executed, a
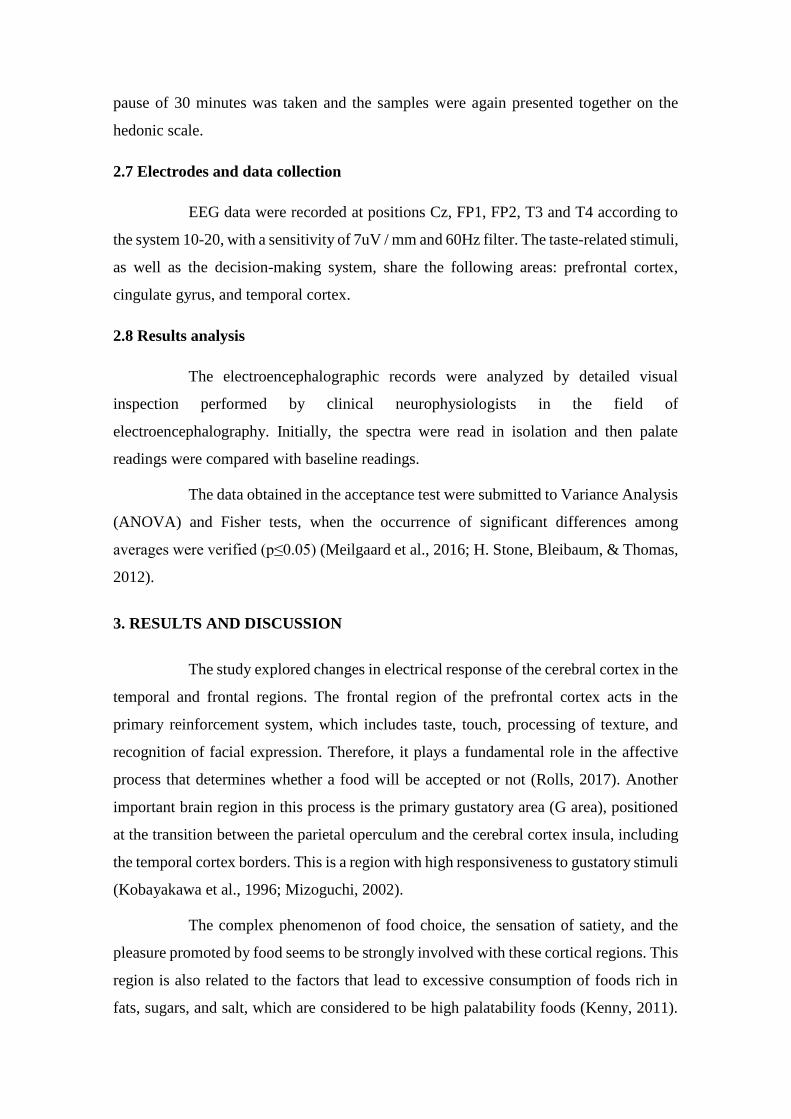
pause of 30 minutes was taken and the samples were again presented together on the
hedonic scale.
2.7 Electrodes and data collection
EEG data were recorded at positions Cz, FP1, FP2, T3 and T4 according to
the system 10-20, with a sensitivity of 7uV / mm and 60Hz filter. The taste-related stimuli,
as well as the decision-making system, share the following areas: prefrontal cortex,
cingulate gyrus, and temporal cortex.
2.8 Results analysis
The electroencephalographic records were analyzed by detailed visual
inspection performed by clinical neurophysiologists in the field of
electroencephalography. Initially, the spectra were read in isolation and then palate
readings were compared with baseline readings.
The data obtained in the acceptance test were submitted to Variance Analysis
(ANOVA) and Fisher tests, when the occurrence of significant differences among
averages were verified (p≤0.05) (Meilgaard et al., 2016; H. Stone, Bleibaum, & Thomas,
2012).
3. RESULTS AND DISCUSSION
The study explored changes in electrical response of the cerebral cortex in the
temporal and frontal regions. The frontal region of the prefrontal cortex acts in the
primary reinforcement system, which includes taste, touch, processing of texture, and
recognition of facial expression. Therefore, it plays a fundamental role in the affective
process that determines whether a food will be accepted or not (Rolls, 2017). Another
important brain region in this process is the primary gustatory area (G area), positioned
at the transition between the parietal operculum and the cerebral cortex insula, including
the temporal cortex borders. This is a region with high responsiveness to gustatory stimuli
(Kobayakawa et al., 1996; Mizoguchi, 2002).
The complex phenomenon of food choice, the sensation of satiety, and the
pleasure promoted by food seems to be strongly involved with these cortical regions. This
region is also related to the factors that lead to excessive consumption of foods rich in
fats, sugars, and salt, which are considered to be high palatability foods (Kenny, 2011).
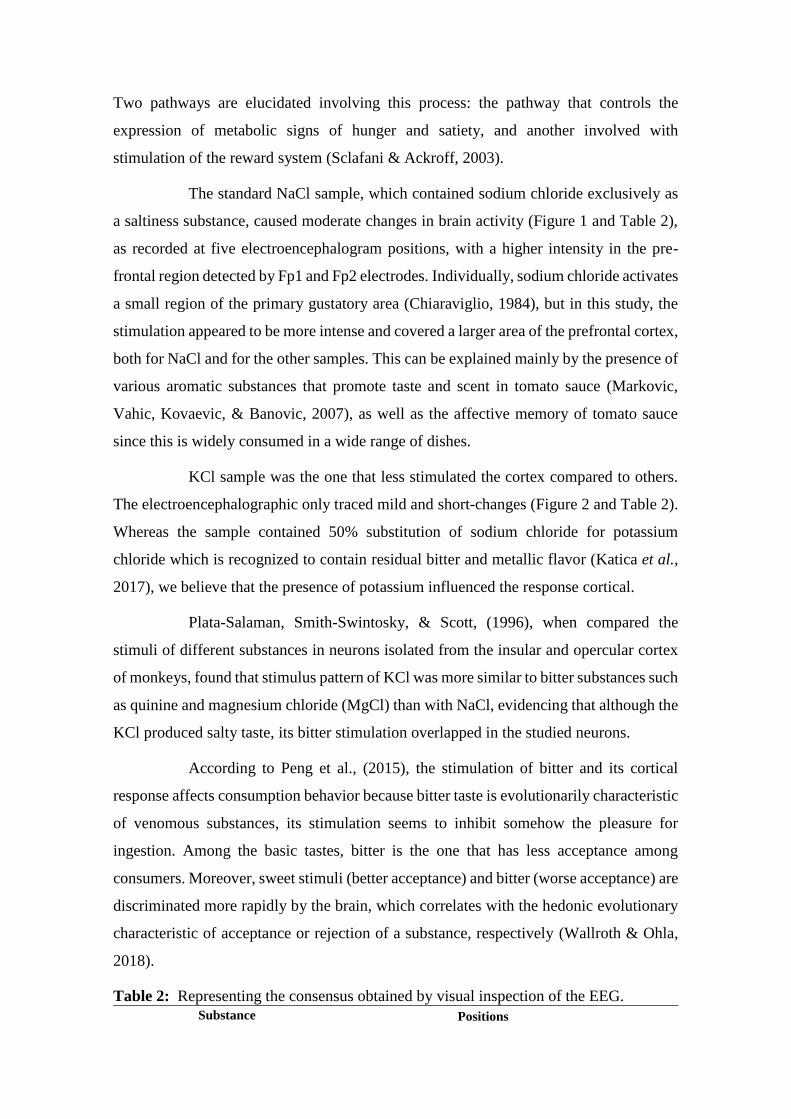
Two pathways are elucidated involving this process: the pathway that controls the
expression of metabolic signs of hunger and satiety, and another involved with
stimulation of the reward system (Sclafani & Ackroff, 2003).
The standard NaCl sample, which contained sodium chloride exclusively as
a saltiness substance, caused moderate changes in brain activity (Figure 1 and Table 2),
as recorded at five electroencephalogram positions, with a higher intensity in the pre-
frontal region detected by Fp1 and Fp2 electrodes. Individually, sodium chloride activates
a small region of the primary gustatory area (Chiaraviglio, 1984), but in this study, the
stimulation appeared to be more intense and covered a larger area of the prefrontal cortex,
both for NaCl and for the other samples. This can be explained mainly by the presence of
various aromatic substances that promote taste and scent in tomato sauce (Markovic,
Vahic, Kovaevic, & Banovic, 2007), as well as the affective memory of tomato sauce
since this is widely consumed in a wide range of dishes.
KCl sample was the one that less stimulated the cortex compared to others.
The electroencephalographic only traced mild and short-changes (Figure 2 and Table 2).
Whereas the sample contained 50% substitution of sodium chloride for potassium
chloride which is recognized to contain residual bitter and metallic flavor (Katica et al.,
2017), we believe that the presence of potassium influenced the response cortical.
Plata-Salaman, Smith-Swintosky, & Scott, (1996), when compared the
stimuli of different substances in neurons isolated from the insular and opercular cortex
of monkeys, found that stimulus pattern of KCl was more similar to bitter substances such
as quinine and magnesium chloride (MgCl) than with NaCl, evidencing that although the
KCl produced salty taste, its bitter stimulation overlapped in the studied neurons.
According to Peng et al., (2015), the stimulation of bitter and its cortical
response affects consumption behavior because bitter taste is evolutionarily characteristic
of venomous substances, its stimulation seems to inhibit somehow the pleasure for
ingestion. Among the basic tastes, bitter is the one that has less acceptance among
consumers. Moreover, sweet stimuli (better acceptance) and bitter (worse acceptance) are
discriminated more rapidly by the brain, which correlates with the hedonic evolutionary
characteristic of acceptance or rejection of a substance, respectively (Wallroth & Ohla,
2018).
Table 2: Representing the consensus obtained by visual inspection of the EEG.
Substance Positions
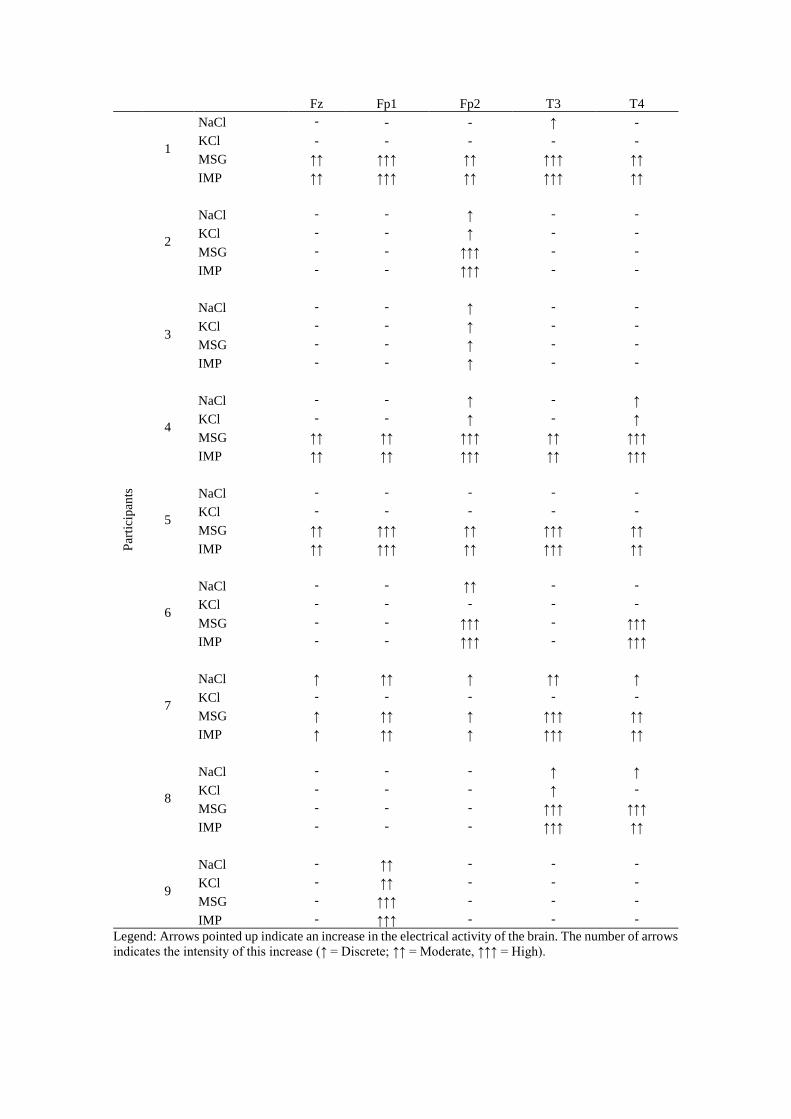
Fz Fp1 Fp2 T3 T4
Par
tici
pan
ts
1
NaCl - - - ↑ -
KCl - - - - -
MSG ↑↑ ↑↑↑ ↑↑ ↑↑↑ ↑↑
IMP ↑↑ ↑↑↑ ↑↑ ↑↑↑ ↑↑
2
NaCl - - ↑ - -
KCl - - ↑ - -
MSG - - ↑↑↑ - -
IMP - - ↑↑↑ - -
3
NaCl - - ↑ - -
KCl - - ↑ - -
MSG - - ↑ - -
IMP - - ↑ - -
4
NaCl - - ↑ - ↑
KCl - - ↑ - ↑
MSG ↑↑ ↑↑ ↑↑↑ ↑↑ ↑↑↑
IMP ↑↑ ↑↑ ↑↑↑ ↑↑ ↑↑↑
5
NaCl - - - - -
KCl - - - - -
MSG ↑↑ ↑↑↑ ↑↑ ↑↑↑ ↑↑
IMP ↑↑ ↑↑↑ ↑↑ ↑↑↑ ↑↑
6
NaCl - - ↑↑ - -
KCl - - - - -
MSG - - ↑↑↑ - ↑↑↑
IMP - - ↑↑↑ - ↑↑↑
7
NaCl ↑ ↑↑ ↑ ↑↑ ↑
KCl - - - - -
MSG ↑ ↑↑ ↑ ↑↑↑ ↑↑
IMP ↑ ↑↑ ↑ ↑↑↑ ↑↑
8
NaCl - - - ↑ ↑
KCl - - - ↑ -
MSG - - - ↑↑↑ ↑↑↑
IMP - - - ↑↑↑ ↑↑
9
NaCl - ↑↑ - - -
KCl - ↑↑ - - -
MSG - ↑↑↑ - - -
IMP - ↑↑↑ - - -
Legend: Arrows pointed up indicate an increase in the electrical activity of the brain. The number of arrows
indicates the intensity of this increase (↑ = Discrete; ↑↑ = Moderate, ↑↑↑ = High).
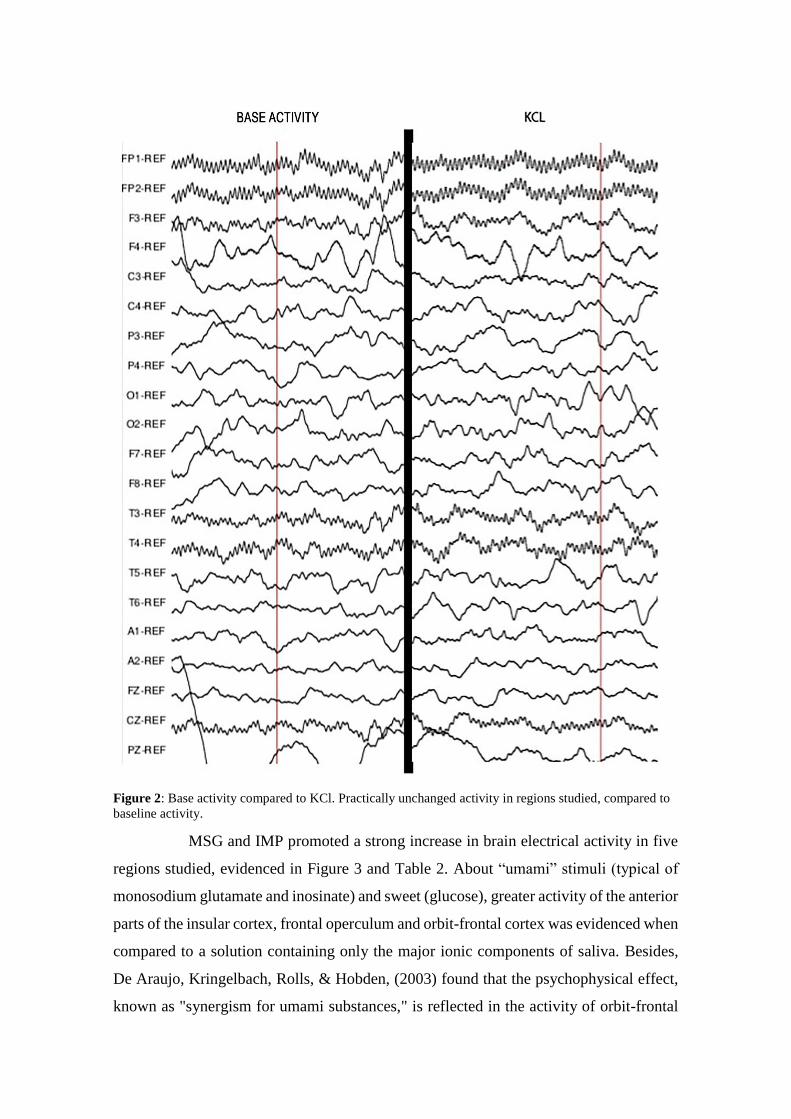
Figure 2: Base activity compared to KCl. Practically unchanged activity in regions studied, compared to
baseline activity.
MSG and IMP promoted a strong increase in brain electrical activity in five
regions studied, evidenced in Figure 3 and Table 2. About “umami” stimuli (typical of
monosodium glutamate and inosinate) and sweet (glucose), greater activity of the anterior
parts of the insular cortex, frontal operculum and orbit-frontal cortex was evidenced when
compared to a solution containing only the major ionic components of saliva. Besides,
De Araujo, Kringelbach, Rolls, & Hobden, (2003) found that the psychophysical effect,
known as "synergism for umami substances," is reflected in the activity of orbit-frontal
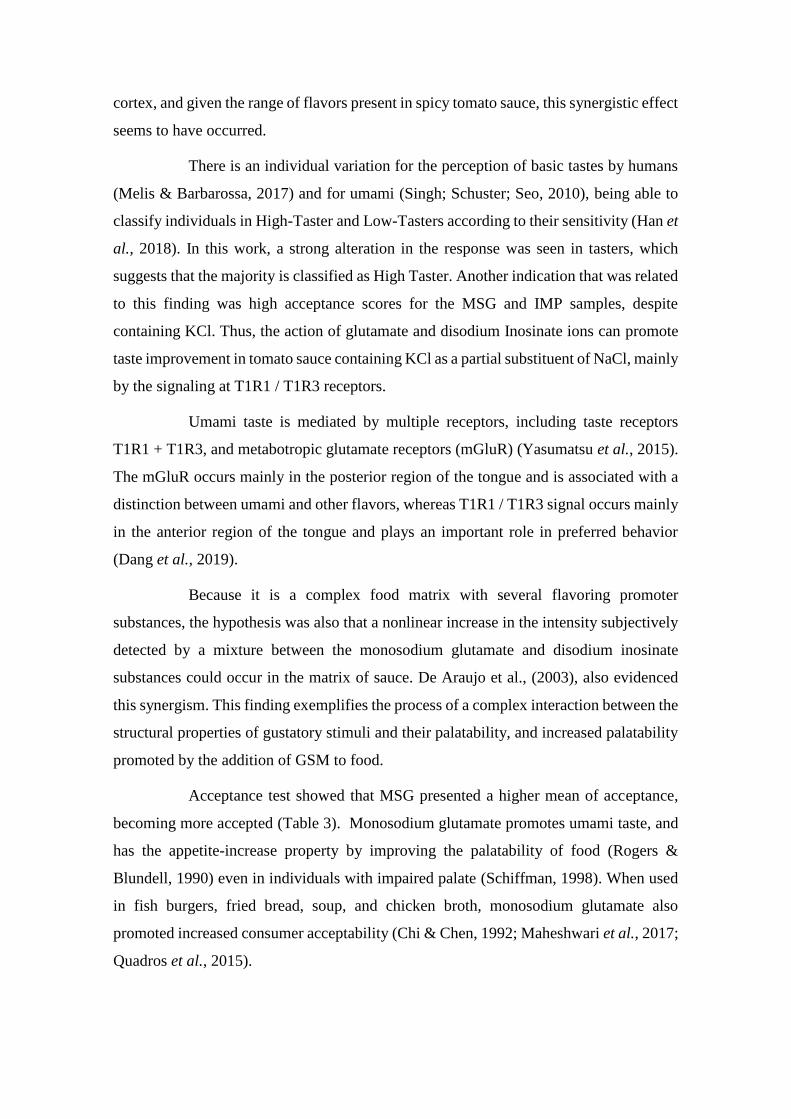
cortex, and given the range of flavors present in spicy tomato sauce, this synergistic effect
seems to have occurred.
There is an individual variation for the perception of basic tastes by humans
(Melis & Barbarossa, 2017) and for umami (Singh; Schuster; Seo, 2010), being able to
classify individuals in High-Taster and Low-Tasters according to their sensitivity (Han et
al., 2018). In this work, a strong alteration in the response was seen in tasters, which
suggests that the majority is classified as High Taster. Another indication that was related
to this finding was high acceptance scores for the MSG and IMP samples, despite
containing KCl. Thus, the action of glutamate and disodium Inosinate ions can promote
taste improvement in tomato sauce containing KCl as a partial substituent of NaCl, mainly
by the signaling at T1R1 / T1R3 receptors.
Umami taste is mediated by multiple receptors, including taste receptors
T1R1 + T1R3, and metabotropic glutamate receptors (mGluR) (Yasumatsu et al., 2015).
The mGluR occurs mainly in the posterior region of the tongue and is associated with a
distinction between umami and other flavors, whereas T1R1 / T1R3 signal occurs mainly
in the anterior region of the tongue and plays an important role in preferred behavior
(Dang et al., 2019).
Because it is a complex food matrix with several flavoring promoter
substances, the hypothesis was also that a nonlinear increase in the intensity subjectively
detected by a mixture between the monosodium glutamate and disodium inosinate
substances could occur in the matrix of sauce. De Araujo et al., (2003), also evidenced
this synergism. This finding exemplifies the process of a complex interaction between the
structural properties of gustatory stimuli and their palatability, and increased palatability
promoted by the addition of GSM to food.
Acceptance test showed that MSG presented a higher mean of acceptance,
becoming more accepted (Table 3). Monosodium glutamate promotes umami taste, and
has the appetite-increase property by improving the palatability of food (Rogers &
Blundell, 1990) even in individuals with impaired palate (Schiffman, 1998). When used
in fish burgers, fried bread, soup, and chicken broth, monosodium glutamate also
promoted increased consumer acceptability (Chi & Chen, 1992; Maheshwari et al., 2017;
Quadros et al., 2015).
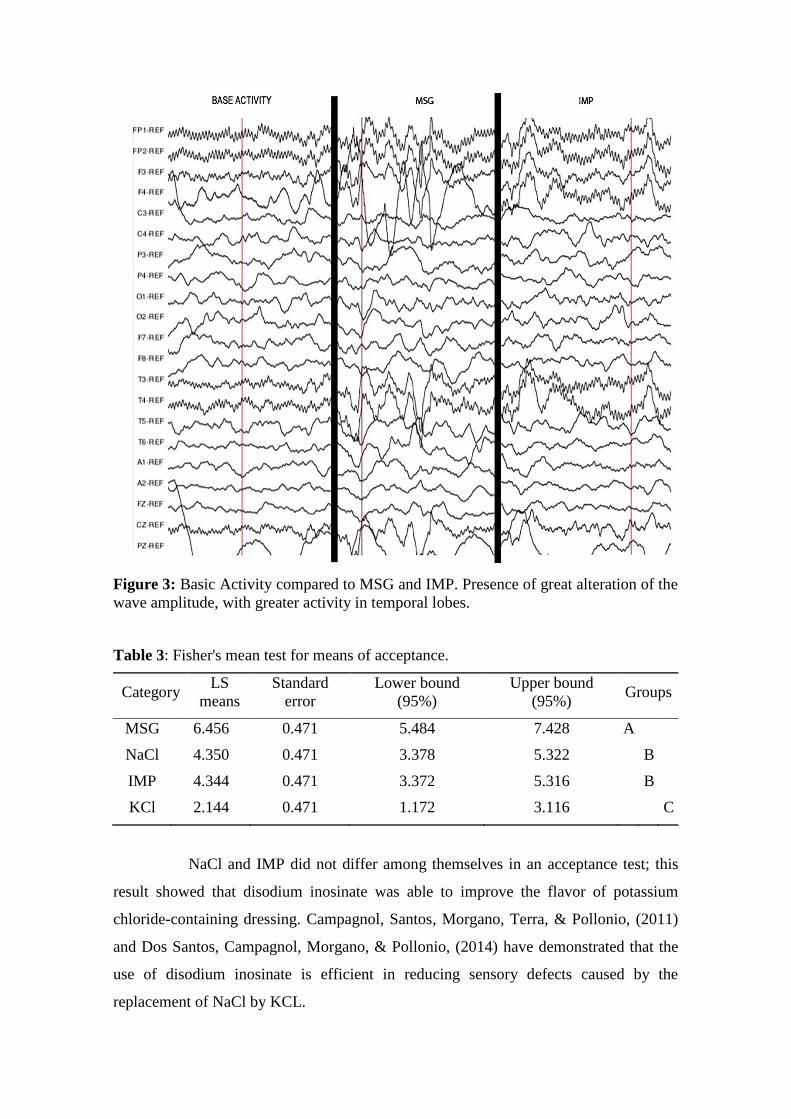
Figure 3: Basic Activity compared to MSG and IMP. Presence of great alteration of the
wave amplitude, with greater activity in temporal lobes.
Table 3: Fisher's mean test for means of acceptance.
Category LS
means
Standard
error
Lower bound
(95%)
Upper bound
(95%) Groups
MSG 6.456 0.471 5.484 7.428 A
NaCl 4.350 0.471 3.378 5.322 B
IMP 4.344 0.471 3.372 5.316 B
KCl 2.144 0.471 1.172 3.116 C
NaCl and IMP did not differ among themselves in an acceptance test; this
result showed that disodium inosinate was able to improve the flavor of potassium
chloride-containing dressing. Campagnol, Santos, Morgano, Terra, & Pollonio, (2011)
and Dos Santos, Campagnol, Morgano, & Pollonio, (2014) have demonstrated that the
use of disodium inosinate is efficient in reducing sensory defects caused by the
replacement of NaCl by KCL.
The sample containing KCl presented the lowest acceptance mark
distinguishing from all others. This result is associated with KCl sensory defects when
used in large proportion as bitter and metallic taste. Wu et al., (2015) reported that
replacing NaCl with KCl without adjuvant strategies in proportions greater than 40%
promotes serious sensory defects.
4. CONCLUSION
The addition of umami flavor substances are indicated to improve acceptance of products
containing potassium chloride as a sodium chloride replacement. The stimulation of
frontal and temporal cortices plays an important role in food acceptance. Use of
substances that stimulate them seems to be an effective strategy in the process of
restructuring a food, especially one with the addition of less palatable ingredients.
Acknowledgments
For their support: National Council for Scientific and Technological Development
(CNPq).
Author Contributions
Tavares-Filho E.R, Esmerino E.A, and Santos-Junior V.A. designed the study, conducted
the tests, collected/analyzed the data and drafted the manuscript. Tavares E.J.S.,
conducted sensory/EEG tests, collected data and revised the work critically improving
the intellectual content. Bolini H.M.A and Castro R.O.M worked on the study design
process, analyze the results, edited the draft, reviewed all documents critically, and
approved the final manuscript for submission to the Journal.
The present study was approved by the Research Ethics Committee of the Federal
University of Alfenas-MG, under the number of accepted opinion 2398232.
5. REFERENCES
Andersen, C. A., Kring, M. L., Andersen, R. H., Larsen, O. N., Kjær, T. W., Kidmose,
U., … Kidmose, P. (2018). EEG discrimination of perceptually similar tastes.
Journal of Neuroscience Research. doi:10.1002/jnr.24281
Beaglehole, R., Bonita, R., Horton, R., Adams, C., Alleyne, G., Asaria, P., … Watt, J.
(2011). Priority actions for the non-communicable disease crisis. The Lancet,
377(9775), 1438–1447. doi:http://dx.doi.org/10.1016/S0140-6736(11)60393-0
Campagnol, P. C. B., Santos, B. A. dos, Morgano, M. A., Terra, N. N., & Pollonio, M.
A. R. (2011). Application of lysine, taurine, disodium inosinate and disodium
guanylate in fermented cooked sausages with 50% replacement of NaCl by KCl.
Meat Science, 87(3), 239–243. doi:10.1016/j.meatsci.2010.10.018
Chi, S. P., & Chen, T. C. (1992). Predicting optimum monosodium glutamate and
sodium chloride concentrations in chicken broth as affected by spice addition.
Journal of Food Processing and Preservation, 16(5), 313–326.
doi:10.1111/j.1745-4549.1992.tb00212.x
Chiaraviglio, E. (1984). Sodium chloride intake following electrochemical stimulation
of the frontal lobe cortex in the rat. Physiology and Behavior, 33(4), 547–551.
doi:10.1016/0031-9384(84)90369-X
Crouzet, S. M., Busch, N. A., & Ohla, K. (2015). Taste quality decoding parallels taste
sensations. Current Biology, 25(7), 890–896. doi:10.1016/j.cub.2015.01.057
Dang, Y., Hao, L., Cao, J., Sun, Y., Zeng, X., Wu, Z., & Pan, D. (2019). Molecular
docking and simulation of the synergistic effect between umami peptides,
monosodium glutamate and taste receptor T1R1/T1R3. Food Chemistry, 271, 697–
706. doi:10.1016/j.foodchem.2018.08.001
de Araujo, I. E. T., Kringelbach, M. L., Rolls, E. T., & Hobden, P. (2003).
Representation of Umami Taste in the Human Brain. Journal of Neurophysiology,
90(1), 313–319. doi:10.1152/jn.00669.2002
dos Santos, B. A., Campagnol, P. C. B., Morgano, M. A. Ô., & Pollonio, M. A. R.
(2014). Monosodium glutamate, disodium inosinate, disodium guanylate, lysine
and taurine improve the sensory quality of fermented cooked sausages with 50%
and 75% replacement of NaCl with KCl. Meat Science, 96(1), 509–513.
doi:10.1016/j.meatsci.2013.08.024
Gonzalez Viejo, C., Fuentes, S., Howell, K., Torrico, D. D., & Dunshea, F. R. (2018).
Integration of non-invasive biometrics with sensory analysis techniques to assess
acceptability of beer by consumers. Physiology and Behavior.
doi:10.1016/j.physbeh.2018.02.051
Hashida, J. C., Silva, A. C. S., Souto, S., & Costa, E. J. X. (2005). EEG pattern
discrimination between salty and sweet taste using adaptive Gabor transform.
Neurocomputing, 68(1–4), 251–257. doi:10.1016/j.neucom.2005.04.004
Joffres, M. R., Campbell, N. R. C., Manns, B., & Tu, K. (2007). Estimate of the benefits
of a population-based reduction in dietary sodium additives on hypertension and its
related health care costs in Canada. Canadian Journal of Cardiology, 23(6), 437–
443. doi:10.1016/S0828-282X(07)70780-8
Kenny, P. J. (2011). Reward Mechanisms in Obesity: New Insights and Future
Directions. Neuron, 69(4), 664–679. doi:10.1016/j.neuron.2011.02.016
Kobayakawa, T., Endo, H., Ayabe-Kanamura, S., Kumagai, T., Yamaguchi, Y.,
Kikuchi, Y., … Ogawa, H. (1996). The primary gustatory area in human cerebral
cortex studied by magnetoencephalography. Neuroscience Letters, 212(3), 155–
158. doi:10.1016/0304-3940(96)12798-1
Maheshwari, H., Prabhavathi, S., Devisetti, R., & Prakash, J. (2017). Determining
Efficacy of Monosodium Glutamate for Salt Reduction in Plain and Spiced
‘Poories’ Through Sensory Responses. Journal of Experimental Food Chemistry,
03(03). doi:10.4172/2472-0542.1000129
Markovic, K., Vahic, N., Kovaevic, K., & Banovic, M. (2007). Aroma volatiles of
tomatoes and tomato products evaluated by solid-phase microextraction. Flavour
and Fragrance Journal, (5), 395–400. doi:10.1002/ffj
Meilgaard, M., Civille, G. V., & Carr, T. B. (2016). Sensory Evaluation Techniques,
448.
Melis, M., & Barbarossa, I. T. (2017). Taste perception of sweet, sour, salty, bitter, and
Umami and changes due to L-arginine supplementation, as a function of genetic
ability to taste 6-n-propylthiouracil. Nutrients, 9(6). doi:10.3390/nu9060541
Mizoguchi, C. (2002). Gustatory Evoked Cortical Activity in Humans Studied by
Simultaneous EEG and MEG Recording. Chemical Senses, 27(7), 629–634.
doi:10.1093/chemse/27.7.629
Nilson, E. A. F., Jaime, P. C., & Resende, D. de O. (2012). Iniciativas desenvolvidas no
Brasil para a redução do teor de sódio em alimentos processados. Revista
Panamericana de Salud Pública, 32(4), 287–292. doi:10.1590/S1020-
49892012001000007
Nunez, P. L., & Srinivasan, R. (2009). Electric Fields of the Brain: The neurophysics of
EEG. Electric Fields of the Brain: The Neurophysics of EEG, 1–611.
doi:10.1093/acprof:oso/9780195050387.001.0001
Ogbu, U. C., & Arah, O. A. (2016). World Health Organization. International
Encyclopedia of Public Health, 461–467. doi:10.1016/B978-0-12-803678-
5.00499-9
Park, C., Looney, D., & Mandic, D. P. (2011). Estimating human response to taste using
EEG. Proceedings of the Annual International Conference of the IEEE
Engineering in Medicine and Biology Society, EMBS, 6331–6332.
doi:10.1109/IEMBS.2011.6091563
Peng, Y., Gillis-Smith, S., Jin, H., Tränkner, D., Ryba, N. J. P., & Zuker, C. S. (2015).
Sweet and bitter taste in the brain of awake behaving animals. Nature, 527(7579),
512–515. doi:10.1038/nature15763
Plata-Salaman, C. R., Smith-Swintosky, V. L., & Scott, T. R. (1996). Gustatory neural
coding in the monkey cortex: mixtures. Journal of Neurophysiology, 75(6), 2369–
2379. doi:10.1152/jn.1996.75.6.2369
Public Health England. (2017). Salt Reduction Targets for 2017, (March). Retrieved
from www.gov.uk/phe%0Awww.facebook.com/PublicHealthEngland
Quadros, D. A. de, Rocha, I. F. de O., Ferreira, S. M. R., & Bolini, H. M. A. (2015).
Low-sodium fish burgers: Sensory profile and drivers of liking. LWT - Food
Science and Technology, 63(1), 236–242. doi:10.1016/j.lwt.2015.03.083
Rogers, P. J., & Blundell, J. E. (1990). Umami and appetite: Effects of monosodium
glutamate on hunger and food intake in human subjects. Physiology and Behavior,
48(6), 801–804. doi:10.1016/0031-9384(90)90230-2
Rolls, E. T. (2017). The orbitofrontal cortex and emotion in health and disease,
including depression. Neuropsychologia.
doi:10.1016/j.neuropsychologia.2017.09.021
Schiffman, S. S. (1998). Sensory enhancement of foods for the elderly with
monosodium glutamate and flavors. Food Reviews International, 14(2–3), 321–
333. doi:10.1080/87559129809541164
Sclafani, A., & Ackroff, K. (2003). Reinforcement value of sucrose measured by
progressive ratio operant licking in the rat. Physiology and Behavior, 79(4–5),
663–670. doi:10.1016/S0031-9384(03)00143-4
Stone, H. (2012). Sensory Evaluation Practices. Sensory Evaluation Practices.
doi:10.1016/C2009-0-63404-8
Stone, H., Bleibaum, R., & Thomas, H. A. (2012). Chapter 7: Affective Testing.
Sensory Evaluation Practices, 291–325. doi:10.1016/B978-0-12-382086-0.00007-
8
Tomadoni, B., Fiszman, S., Moreira, M. R., & Tarrega, A. (2018). The Role of the
Dynamic Sensory Perception in the Reformulation of Shakes: Use of TDS for
Studying the Effect of Milk, Fiber, and Flavor Addition. Journal of Food Science,
83(1), 198–204. doi:10.1111/1750-3841.14008
Wakeling, I. N., & MacFie, H. J. H. (1995). Designing consumer trials balanced for first
and higher orders of carry-over effect when only a subset of k samples from t may
be tested. Food Quality and Preference, 6(4), 299–308. doi:10.1016/0950-
3293(95)00032-1
Wallroth, R., & Ohla, K. (2018). As Soon as You Taste It: Evidence for Sequential and
Parallel Processing of Gustatory Information. Eneuro, 5(5), ENEURO.0269-
18.2018. doi:10.1523/ENEURO.0269-18.2018
Webb, M., Fahimi, S., Singh, G. M., Khatibzadeh, S., Micha, R., Powles, J., &
Mozaffarian, D. (2017). Cost effectiveness of a government supported policy
strategy to decrease sodium intake: Global analysis across 183 nations. BMJ
(Online), 356. doi:10.1136/bmj.i6699
Webster, J., Trieu, K., Dunford, E., Nowson, C., Jolly, K.-A., Greenland, R., … Bolam,
B. (2015). Salt reduction in Australia: from advocacy to action. Cardiovascular
Diagnosis and Therapy Reformulation; Review of Strategies on Salt Reduction in
Australia. Worth a Look, but No New Data Presented, 5(3 LB-reformulation;
review of strategies on salt reduction in Australia. Worth a look, but no new data
presented), 207–18 reformulation; review of strategies on sal.
doi:10.3978/j.issn.2223-3652.2015.04.02
WHO, & PAHO. (2013). A guide for setting targets and timelines to reduce the salt
content of food. Retrieved from
http://www.paho.org/hq/index.php?option=com_docman&task=doc_view&gid=21
493+&Itemid=999999&lang=en
World Health Organization. (2010). Creating an enabling environment for population-
based salt reduction strategies: report of a joint technical meeting held by WHO
and the Food Standards Agency. World Health Organization, 42. Retrieved from
http://apps.who.int/iris/bitstream/10665/44474/1/9789241500777_eng.pdf
Wu, H., Zhuang, H., Zhang, Y., Tang, J., Yu, X., Long, M., … Zhang, J. (2015).
Influence of partial replacement of NaCl with KCl on profiles of volatile
compounds in dry-cured bacon during processing. Food Chemistry, 172, 391–399.
doi:10.1016/j.foodchem.2014.09.088
Yagyu, T., Kondakor, I., Kochi, K., Koenig, T., Lehmann, D., Kinoshita, T., … Yagyu,
T. (1998). Smell and taste of chewing gum affect frequency domain EEG source
localizations. International Journal of Neuroscience, 93(3–4), 205–216.
doi:10.3109/00207459808986426
Yasumatsu, K., Manabe, T., Yoshida, R., Iwatsuki, K., Uneyama, H., Takahashi, I., &
Ninomiya, Y. (2015). Involvement of multiple taste receptors in umami taste:
Analysis of gustatory nerve responses in metabotropic glutamate receptor 4
knockout mice. Journal of Physiology, 593(4), 1021–1034.
doi:10.1113/jphysiol.2014.284703
4. DISCUSSÃO GERAL
Para os consumidores de molho de tomate, com ênfase naqueles hipertensos, a
utilização do cloreto de potássio como substituto de cloreto de sódio, promove um duplo
benefício em relação a saúde, pois além de reduzir o conteúdo de sódio total, contribui com o
aumento da ingestão de potássio. O papel da ingestão de potássio nos mecanismos de controle
e prevenção de hipertensão arterial sistêmica tem atraído a atenção dos profissionais de saúde
tornando-se base para tanto clínica e recomendação nutricional e para estabelecer valores de
referência dietéticos para este elemento (DICKINSON et al., 2006; FILIPPINI et al., 2017).
A suplementação de potássio reduz a pressão arterial em pacientes hipertensos que
ingerem quantidades normais de sódio. O mecanismo de alterações induzidas pelo potássio na
pressão arterial não é bem compreendido, contudo a depleção de potássio induz
consistentemente a retenção de sódio e como resposta o aumento de pressão. A ingestão de
3.500mg de potássio e ≥ 2.000mg de sódio, apresenta resultados benéficos a população
(KRISHNA, 1990; FILIPPINI et al., 2017). O molho desenvolvido neste estudo provem
aproximadamente 182,47mg de potássio por porção (60g).
O teste do ideal com escalas Just About Right (JAR) realizado em 120 consumidores
brasileiros, identificou a concentração de 0,87% como valor ideal para adição de cloreto de
sódio em molhos de tomate. Entretanto se avaliarmos indiretamente apenas a concentração do
íon sódio presente no sal, observamos que a concentração ideal para os consumidores é de 0,
34%. Assim considerando o consumo da porção de rotulagem (60g) estabelecida pela legislação
brasileira, deve-se levar em consideração a ingestão de 205,2 mg de Na+, o que corresponde a
10,25% da ingestão máxima diária preconizada pela OMS. Para molhos comercializados no
Brasil, a situação se agrava.
Silva e Coutinho (2015), ao analisarem 30 tipos de molho de tomate
comercializados no Brasil, encontraram um teor médio de 0,47% de sódio, e evidenciaram que
23 deles são classificados como: “alto teor de sódio”, por possuir quantidade igual ou superior
a 400 mg de sódio por 100g ou 100 ml na forma como está exposto à venda (ANVISA, 2010).
O teor médio em molhos estadunidenses e canadense são respectivamente 0,65% e 0,68%,
enquanto na Austrália os valores atingem 0,83% (BIELAMOWICZ, 2017; CANADA, 2008;
WEBSTER; DUNFORD; NEAL, 2010).
Os resultados demonstram que o gosto salgado é importante para o consumidor de
molho de tomate. Contudo a utilização apenas de sódio como íon salgante favorece o consumo
excessivo e está relacionado ao desenvolvimento das doenças crônicas não transmissíveis
(DCNT). Associado a isso, a OMS preconiza um aumento da ingestão diária de potássio, visto
que novas evidências mostram uma redução da pressão arterial de adultos, com aumento da
ingesta (FILIPPINI et al., 2017). Este fator associado a característica salgante do cloreto de
potássio, fez com que ele se tornasse o sal de escolha para substituir parcialmente o NaCl na
reformulação do molho. Além disso, quando comparado a outros sais que promovem gosto
salgado (e.g. cloreto de cálcio e de magnésio), o KCl é aquele com menores defeitos sensoriais,
como gosto amargo e metálico (FELLENDORF; O’SULLIVAN; KERRY, 2016; GRUMMER
et al., 2012).
A utilização da análise tempo intensidade (TI) como teste de equivalência teve
como finalidade determinar a concentração correta de KCl a ser utilizada para reduzir 50% do
NaCl do molho produzido, que continha inicialmente 870mg/100g. Além disso, cinco
realçadores de sabor foram utilizados para auxiliar no mascaramento do gosto amargo do KCl
sendo estes: MSG, IG, IMP, AJI-100, LYS. Os resultados observados indicaram que o KCl
sozinho apresentou 75% de potencial salgante do NaCl, resultado semelhante ao encontrado
por Feltrin et al. (2014), que determinou 74.75% de potência em solução aquosa. Associado aos
realçadores de sabor o KCl conservou sua potência salgante, exceto para a associação com a
mistura (50/50) de inosinato e guanilato dissódico, onde o valor foi de 60%.
Testes de equivalência são eficazes para auxiliar o processo de reformulação dos
alimentos, uma vez que um mesmo ingrediente pode se comportar de maneira distinta em
matrizes alimentares complexas com alto grau de similaridade. Desta forma quando associado
a uma mistura de inosinato dissódico e guanilato dissódico (50/50), e adicionado a molho de
tomate, o KCl apresentou menor gosto salgado. Além de afetar o gosto salgado, a alteração na
receita afeta toda a matriz, e para melhor esclarecer a diferença entre os perfis, utilizou-se
metodologias descritivas para melhor caracterizar as amostras, explorando tanto a percepção de
assessores por meio da ADQ e TI, quanto a percepção de consumidores através do CATA e
TDS.
As quatro metodologias descritivas podem ser segmentadas em diferentes grupos,
de acordo com a observação a qual se deseja categorizar. Desta forma os trabalhos foram
segmentados primeiramente entre metodologias estáticas e dinâmicas. ADQ e CATA
representam as metodologias estáticas, enquanto TI e TDS as dinâmicas. Metodologias estáticas
assim como as dinâmicas, produzem o perfil descritivo das amostras, contudo não levam em
consideração a evolução do tempo durante a avaliação do produto. Desta forma, visando cobrir
a limitação das técnicas estáticas foram desenvolvidas as técnicas dinâmicas (NGUYEN; NÆS;
VARELA, 2018).
Além da classificação das metodologias em relação ao tempo, pode-se também
categorizá-las de acordo com a constituição do painel avaliador. Desta forma, ADQ e TI foram
definidas como métodos clássicos — painel de assessores com treinamento — enquanto TDS
e CATA foram definidas como metodologias rápidas pois utilizaram consumidores sem
treinamento. Na ADQ não foram observadas diferenças nos atributos relacionados a aparência
e aroma e textura. Nos atributos de sabor da ADQ, foram vistas diferenças significativas no
gosto doce, amargo e metálico. No CATA, apenas o gosto amargo diferiu.
A baixa discriminação no CATA pode estar relacionada ao alto grau de similaridade
entre as amostras, uma vez que o molho base utilizado foi idêntico, diferindo apenas quanto as
substâncias salgantes. Testes utilizando provadores treinados são conhecidos por gerar maior
detalhamento do perfil sensorial quando comparado aos que usam consumidores (MELLO;
ALMEIDA; MELO, 2019). Essa capacidade de maior detalhamento, oriunda do alto grau de
treinamento e especificidade é controversa para alguns autores, umas vez que atributos
extremamente peculiares podem ser impercebíveis para os consumidores e assim não impactar
sua decisão de compra e consumo (FONSECA et al., 2016; SYMONEAUX; GALMARINI;
MEHINAGIC, 2012; VARELA et al., 2014).
Foram analisados pela TI os atributos amargo, salgado, metálico e gosto de tomate
cozido. Conforme a ADQ e CATA, a TI evidenciou menor valor absoluto de gosto amargo na
amostra NaCl quando comparada as demais. Contudo o principal achado do método foi
referente ao tempo de duração do gosto amargo (TTOT), foi evidenciado que o tempo de
surgimento e ápice do gosto amargo não mudou em relação a presença do realçador de sabor,
enquanto a duração final sim, as amostras contendo substâncias promotoras de umami (MSG,
IG, IMP e AJI-100) tiveram menor duração de gosto amargo se comparado as outras contendo
KCL (KCL e LYS). O gosto metálico apresentou diferenças apenas na intensidade máxima e
apenas as amostras LYS e KCl apresentaram maior intensidade do gosto maior do que a amostra
NaCl. O gosto tomate cozido e gosto salgado não apresentou diferença em nenhum dos
parâmetros avaliados para nenhuma das amostras. Desta forma o TI mostrou-se importante para
caracterizar o sabor residual do produto, que pode ser vital no processo de decisão de compra e
consumo (ZHANG et al., 2016).
A análise TI, não difere da ADQ apenas no quesito temporalidade, outra diferença
a ser ressaltada é o número de atributos a serem avaliados em simultâneo. A ADQ é considerada
um método multiatributo, pois em cada sessão com a amostra, o provador é requerido a marcar
todos os atributos da lista gerada pelas reuniões de consenso e método de rede. Já a analise TI,
avalia um atributo por sessão do provador com a amostra, sendo, portanto, considerada método
mono atributo. Assim, visando otimizar o uso do TI, mais laborioso e dispendioso do que ADQ,
costuma-se realizar TI apenas nos atributos considerados estratégicos no produto, onde muitas
vezes são utilizados os resultados do ADQ afim de selecionar quais atributos serão analisados.
TDS também é um método multiatributo, contudo diferente do CATA e da ADQ o
mesmo não suporta uma lista grande de atributos a serem avaliados por vez. O número de
atributos considerados ótimos para o TDS está entre 5 e 14 (GOUPIL DE BOUILLE et al.,
2010). TDS foi eficiente em descrever as amostras, caracterizando como dominante, atributos
que não demonstraram alta intensidade nos outros testes, como sabor de condimentos e ervas,
e ácido. Essa caracterização é importante pois traz a luz da avaliação atributos que as vezes
passam desapercebidos por não serem muito intensos.
Ao se avaliar a aceitação das amostras em três momentos diferentes, imediatamente
após o consumo, 30 e 60 segundos após a ingestão notou-se que apesar das amostras não se
distinguirem do padrão no momento t=0, no final do processo (t=60), apenas as amostras IG,
IMP, MSG e AKI-100, mantiveram-se semelhante a padrão. Desta forma a utilização da
aceitação temporal é útil, principalmente em produtos que podem apresentar sabores residuais.
5. CONCLUSÃO GERAL
Inosinato dissódico e glutamato monossódico são os realçadores de sabor mais
indicados para serem associados ao cloreto de potássio em molho de tomate com redução de
sódio; tanto o perfil sensorial quanto o eletroencefálico corroboram essa afirmação. Os defeitos
sensoriais do KCl tem caráter residual, sendo mais evidente um minuto após a ingestão.
O perfilamento sensorial mostrou que a análise descritiva quantitativa descreveu as
amostras com maior número de descritores quando comparada ao CATA, porém o gosto
amargo, um dos atributos primordiais no processo de redução de sódio, foi significante em
ambos métodos. Na análise temporal, TI foi eficiente em demonstrar o surgimento e evolução
dos sabores residuais enquanto TDS descreveu as amostras levantando atributos que não foram
significativos nas metodologias baseadas em intensidade. Assim observou-se que o uso da
análise sensorial como ferramenta para reformulação dos alimentos é eficiente, e seus achados
demonstraram a importância tanto para as indústrias quanto a comunidade científica. A
eletroencefalografia produziu dados que auxiliam na elucidação do fenômeno sensorial, onde
pode-se observar o estreitamento da relação entre a composição do alimento e o sistema de
prazer e recompensa representado pelo córtex pré-frontal.
O entendimento das competências e limitações de cada teste permite que o analista
sensorial atue de forma estratégica. O processo de consumo de um determinado alimento é um
fenômeno relacionado a fatores biológicos, psicológicos e estatísticos. Embora este trabalho
seja um avanço dentro da compreensão da relação entre neurofisiologia e comportamento do
consumidor, outros aspectos poderiam ser explorados por novas pesquisas. Desta forma, é de
grande importância realizar novas pesquisas que relacione a análise sensorial com metodologias
neurofisiológicas mais avançadas como a ressonância magnética funcional e psicológicas como
entrevistas questionários e análise de conteúdo.
6. REFERÊNCIAS BIBLIOGRÁFICAS
ABDI, Hervé; WILLIAMS, Lynne J. Partial least squares methods: Partial least squares
correlation and partial least square regression. Methods in Molecular Biology, v. 930, p. 549–
579, 2013.
AL-OTAIBI, Mutlag M.; WILBEY, R. Andrew. Effect of chymosin reduction and salt
substitution on the properties of white salted cheese. International Dairy Journal, v. 16, n. 8,
p. 903–909, 2006.
ALBARRACÍN, William et al. Salt in food processing; usage and reduction: A review.
International Journal of Food Science and Technology, v. 46, n. 7, p. 1329–1336, 2011.
ALBERT, A. et al. Comparison between temporal dominance of sensations (TDS) and key-
attribute sensory profiling for evaluating solid food with contrasting textural layers: Fish sticks.
Food Quality and Preference, v. 24, n. 1, p. 111–118, 2012.
ALBERT, A. et al. Overcoming the issues in the sensory description of hot served food with a
complex texture. Application of QDA®, flash profiling and projective mapping using panels
with different degrees of training. Food Quality and Preference, v. 22, n. 5, p. 463–473, 1 jul.
2011. Disponível em:
<https://www.sciencedirect.com/science/article/pii/S0950329311000437>. Acesso em: 25 fev.
2018.
ANDERSEN, Camilla Arndal et al. EEG discrimination of perceptually similar tastes. Journal
of Neuroscience Research, 2018.
ANDERSON, Cheryl A.M. et al. Dietary Sources of Sodium in China, Japan, the United
Kingdom, and the United States, Women and Men Aged 40 to 59 Years: The INTERMAP
Study. Journal of the American Dietetic Association, v. 110, n. 5, p. 736–745, 2010.
ANDERSON, Cheryl A M et al. Results of a novel screening tool measuring dietary sodium
knowledge in patients with chronic kidney disease. BMC Nephrology, v. 16, n. 1, 2015.
ANVISA. Perguntas e respostas: Informação nutricional complementar. . Brasilia: [s.n.],
2017. Disponível em:
<http://portal.anvisa.gov.br/documents/33916/2810640/Alegações+nutricionais/ce12a551-
b015-47f4-8469-4b26c02fdf29>.
ANVISA. RESOLUÇÃO DA DIRETORIA COLEGIADA – RDC No 54, DE 12 DE
NOVEMBRO DE 2012. Disponível em: <http://portal.anvisa.gov.br/documents/
33880/2568070/rdc0054_12_11_2012.pdf/c5ac23fd-974e-4f2c-9fbc-48f7e0a31864>. Acesso
em: 20 fev. 2019.
ANVISA, Agência Nacional de Vigilância Sanitária. Resolução – Regulamento técnico para
especiarias, temperos e molhos. Disponível em:
<http://portal.anvisa.gov.br/wps/wcm/connect/c8b2040047457a8c873cd73fbc4c6735/>.
Acesso em: 5 mar. 2019.
ARES, Gaston. Methodological challenges in sensory characterization. Current Opinion in
Food Science, v. 3, p. 1-5, 2015.
ARES, G; VARELA, P. Methods in Consumer Research, Volume 1: New Approaches to
Classic Methods. p. 582, 2018. Disponível em:
<https://books.google.ch/books?id=saXRDgAAQBAJ>.
B LAWLOR, M Rogeaux J Delarue. Rapid Sensory Profiling Techniques: Applications in New
Product Development and Consumer Research. v. 28, p. 584, 2014. Disponível em:
<https://books.google.com/books?id=mNBzAwAAQBAJ&pgis=1>.
BAMPI, M. et al. Influence of vacuum application, acid addition and partial replacement of
NaCl by KCl on the mass transfer during salting of beef cuts. LWT - Food Science and
Technology, v. 74, p. 26–33, 2016.
BANNWART, Gisele Cristina Maziero de Campos; PINTO E SILVA, Maria Elisabeth
Machado; VIDAL, Gisele. Redução de sódio em alimentos: panorama atual e impactos
tecnológicos, sensoriais e de saúde pública. Nutrire, v. 39, n. 3, p. 348–365, 2015.
BARYŁKO-PIKIELNA, N; KOSTYRA, E. Sensory interaction of umami substances with
model food matrices and its hedonic effect. Food Quality and Preference, v. 18, n. 5, p. 751–
758, 2007. Disponível em:
<http://www.sciencedirect.com/science/article/pii/S0950329307000122>.
BAYARRI, S. et al. Impact of sensory differences on consumer acceptability of yoghurt and
yoghurt-like products. International Dairy Journal, v. 21, n. 2, p. 111–118, 2011.
BETT, K.L. et al. Reducing the noise contained in descriptive sensory data. J. Sensory Studies,
v. 8, p. 13–29, 1993.
BEYREUTHER, K et al. Consensus meeting: monosodium glutamate – an update. European
Journal of Clinical Nutrition, v. 61, p. 304–313, 2007.
BIELAMOWICZ, Mary K. EB-1400: The Sodium Content of Your Food. Disponível em:
<http://www.agrilifebookstore.org/Sodium-Content-of-Your-Food-p/eb-1400.html>. Acesso
em: 18 dez. 2017.
BONINI-ROCHA, Ana Clara et al. Metodologia para observação e quantificação de sinais de
EEG relativos a evidências cognitivas de aprendizagem motora. Ciências & Cognição, v. 13,
n. 2, p. 27–50, 2008. Disponível em:
<http://www.cienciasecognicao.org/revista/index.php/cec/article/download/218/117>.
BORGUINI, Renata Galhardo da Silva Torres; FERRAZ, Elizabeth. Tomatoes and tomato
products as dietary sources of antioxidants. Food Reviews International, v. 25, n. 4, p. 313–
325, 2009.
BRAGHIERI, Ada et al. Effect of preservative addition on sensory and dynamic profile of
Lucanian dry-sausages as assessed by quantitative descriptive analysis and temporal dominance
of sensations. Meat Science, v. 122, p. 68–75, 2016.
BRASIL. MONITORAMENTO DO PLANO NACIONAL DE REDUÇÃO DO SÓDIO EM
ALIMENTOS PROCESSADOS. . Brasília: [s.n.], 2018. Disponível em:
<http://189.28.128.100/dab/docs/portaldab/documentos/promocao/relatorio_motitoramento_c
onsolidado_17_18.pdf>.
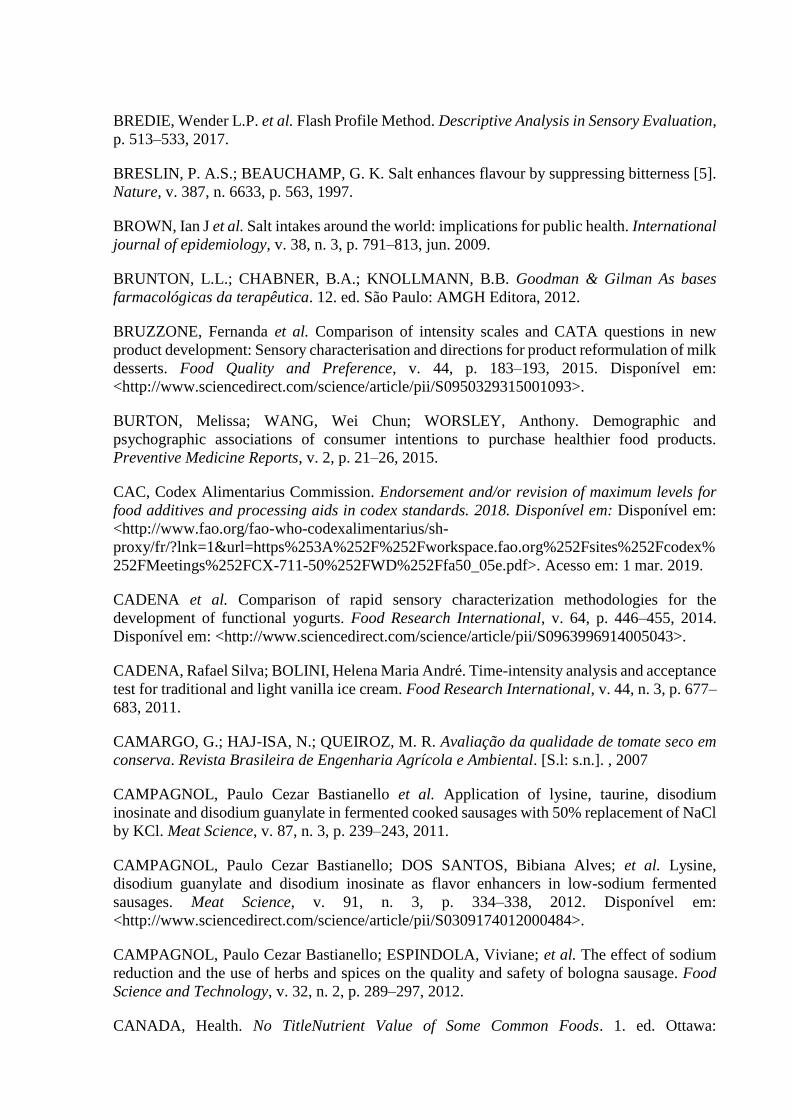
BREDIE, Wender L.P. et al. Flash Profile Method. Descriptive Analysis in Sensory Evaluation,
p. 513–533, 2017.
BRESLIN, P. A.S.; BEAUCHAMP, G. K. Salt enhances flavour by suppressing bitterness [5].
Nature, v. 387, n. 6633, p. 563, 1997.
BROWN, Ian J et al. Salt intakes around the world: implications for public health. International
journal of epidemiology, v. 38, n. 3, p. 791–813, jun. 2009.
BRUNTON, L.L.; CHABNER, B.A.; KNOLLMANN, B.B. Goodman & Gilman As bases
farmacológicas da terapêutica. 12. ed. São Paulo: AMGH Editora, 2012.
BRUZZONE, Fernanda et al. Comparison of intensity scales and CATA questions in new
product development: Sensory characterisation and directions for product reformulation of milk
desserts. Food Quality and Preference, v. 44, p. 183–193, 2015. Disponível em:
<http://www.sciencedirect.com/science/article/pii/S0950329315001093>.
BURTON, Melissa; WANG, Wei Chun; WORSLEY, Anthony. Demographic and
psychographic associations of consumer intentions to purchase healthier food products.
Preventive Medicine Reports, v. 2, p. 21–26, 2015.
CAC, Codex Alimentarius Commission. Endorsement and/or revision of maximum levels for
food additives and processing aids in codex standards. 2018. Disponível em: Disponível em:
<http://www.fao.org/fao-who-codexalimentarius/sh-
proxy/fr/?lnk=1&url=https%253A%252F%252Fworkspace.fao.org%252Fsites%252Fcodex%
252FMeetings%252FCX-711-50%252FWD%252Ffa50_05e.pdf>. Acesso em: 1 mar. 2019.
CADENA et al. Comparison of rapid sensory characterization methodologies for the
development of functional yogurts. Food Research International, v. 64, p. 446–455, 2014.
Disponível em: <http://www.sciencedirect.com/science/article/pii/S0963996914005043>.
CADENA, Rafael Silva; BOLINI, Helena Maria André. Time-intensity analysis and acceptance
test for traditional and light vanilla ice cream. Food Research International, v. 44, n. 3, p. 677–
683, 2011.
CAMARGO, G.; HAJ-ISA, N.; QUEIROZ, M. R. Avaliação da qualidade de tomate seco em
conserva. Revista Brasileira de Engenharia Agrícola e Ambiental. [S.l: s.n.]. , 2007
CAMPAGNOL, Paulo Cezar Bastianello et al. Application of lysine, taurine, disodium
inosinate and disodium guanylate in fermented cooked sausages with 50% replacement of NaCl
by KCl. Meat Science, v. 87, n. 3, p. 239–243, 2011.
CAMPAGNOL, Paulo Cezar Bastianello; DOS SANTOS, Bibiana Alves; et al. Lysine,
disodium guanylate and disodium inosinate as flavor enhancers in low-sodium fermented
sausages. Meat Science, v. 91, n. 3, p. 334–338, 2012. Disponível em:
<http://www.sciencedirect.com/science/article/pii/S0309174012000484>.
CAMPAGNOL, Paulo Cezar Bastianello; ESPINDOLA, Viviane; et al. The effect of sodium
reduction and the use of herbs and spices on the quality and safety of bologna sausage. Food
Science and Technology, v. 32, n. 2, p. 289–297, 2012.
CANADA, Health. No TitleNutrient Value of Some Common Foods. 1. ed. Ottawa:
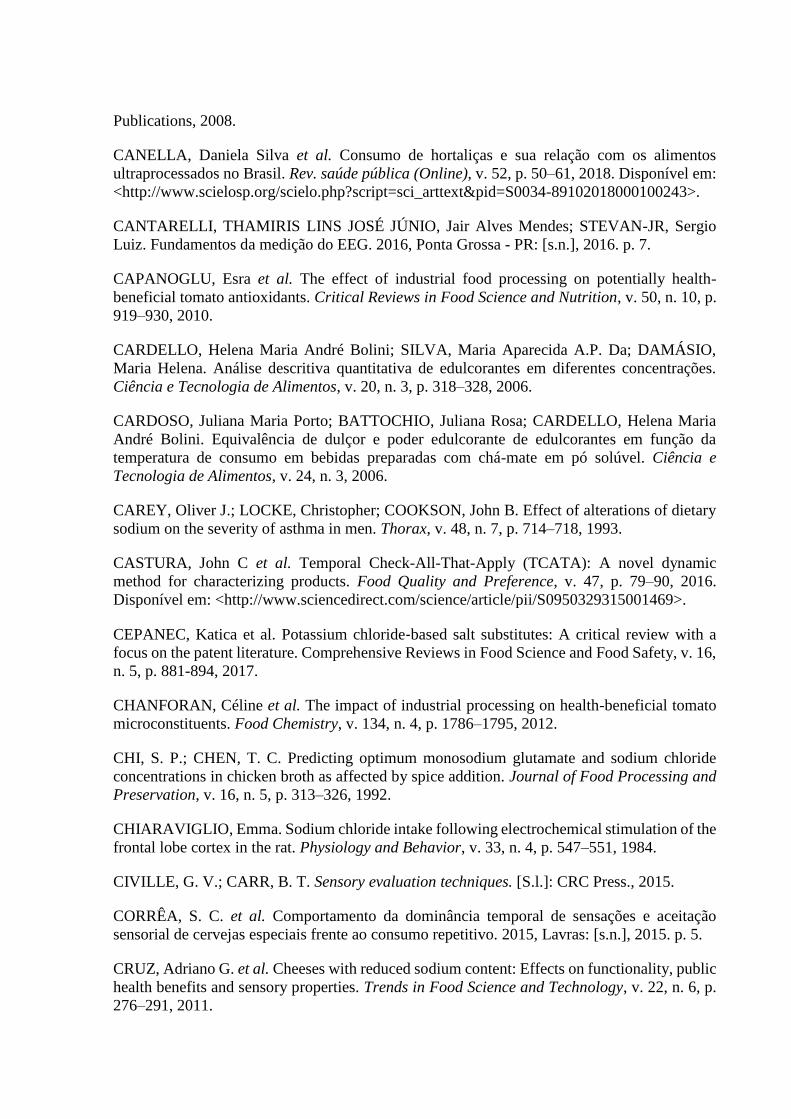
Publications, 2008.
CANELLA, Daniela Silva et al. Consumo de hortaliças e sua relação com os alimentos
ultraprocessados no Brasil. Rev. saúde pública (Online), v. 52, p. 50–61, 2018. Disponível em:
<http://www.scielosp.org/scielo.php?script=sci_arttext&pid=S0034-89102018000100243>.
CANTARELLI, THAMIRIS LINS JOSÉ JÚNIO, Jair Alves Mendes; STEVAN-JR, Sergio
Luiz. Fundamentos da medição do EEG. 2016, Ponta Grossa - PR: [s.n.], 2016. p. 7.
CAPANOGLU, Esra et al. The effect of industrial food processing on potentially health-
beneficial tomato antioxidants. Critical Reviews in Food Science and Nutrition, v. 50, n. 10, p.
919–930, 2010.
CARDELLO, Helena Maria André Bolini; SILVA, Maria Aparecida A.P. Da; DAMÁSIO,
Maria Helena. Análise descritiva quantitativa de edulcorantes em diferentes concentrações.
Ciência e Tecnologia de Alimentos, v. 20, n. 3, p. 318–328, 2006.
CARDOSO, Juliana Maria Porto; BATTOCHIO, Juliana Rosa; CARDELLO, Helena Maria
André Bolini. Equivalência de dulçor e poder edulcorante de edulcorantes em função da
temperatura de consumo em bebidas preparadas com chá-mate em pó solúvel. Ciência e
Tecnologia de Alimentos, v. 24, n. 3, 2006.
CAREY, Oliver J.; LOCKE, Christopher; COOKSON, John B. Effect of alterations of dietary
sodium on the severity of asthma in men. Thorax, v. 48, n. 7, p. 714–718, 1993.
CASTURA, John C et al. Temporal Check-All-That-Apply (TCATA): A novel dynamic
method for characterizing products. Food Quality and Preference, v. 47, p. 79–90, 2016.
Disponível em: <http://www.sciencedirect.com/science/article/pii/S0950329315001469>.
CEPANEC, Katica et al. Potassium chloride‐based salt substitutes: A critical review with a
focus on the patent literature. Comprehensive Reviews in Food Science and Food Safety, v. 16,
n. 5, p. 881-894, 2017.
CHANFORAN, Céline et al. The impact of industrial processing on health-beneficial tomato
microconstituents. Food Chemistry, v. 134, n. 4, p. 1786–1795, 2012.
CHI, S. P.; CHEN, T. C. Predicting optimum monosodium glutamate and sodium chloride
concentrations in chicken broth as affected by spice addition. Journal of Food Processing and
Preservation, v. 16, n. 5, p. 313–326, 1992.
CHIARAVIGLIO, Emma. Sodium chloride intake following electrochemical stimulation of the
frontal lobe cortex in the rat. Physiology and Behavior, v. 33, n. 4, p. 547–551, 1984.
CIVILLE, G. V.; CARR, B. T. Sensory evaluation techniques. [S.l.]: CRC Press., 2015.
CORRÊA, S. C. et al. Comportamento da dominância temporal de sensações e aceitação
sensorial de cervejas especiais frente ao consumo repetitivo. 2015, Lavras: [s.n.], 2015. p. 5.
CRUZ, Adriano G. et al. Cheeses with reduced sodium content: Effects on functionality, public
health benefits and sensory properties. Trends in Food Science and Technology, v. 22, n. 6, p.
276–291, 2011.
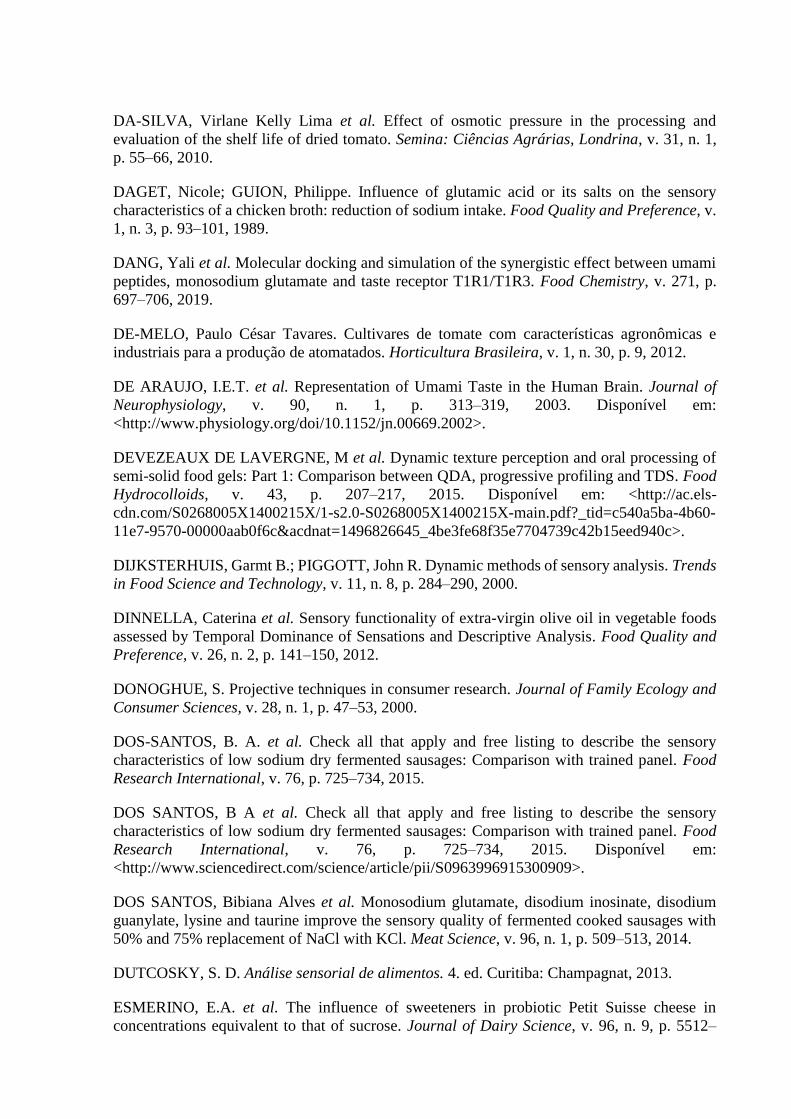
DA-SILVA, Virlane Kelly Lima et al. Effect of osmotic pressure in the processing and
evaluation of the shelf life of dried tomato. Semina: Ciências Agrárias, Londrina, v. 31, n. 1,
p. 55–66, 2010.
DAGET, Nicole; GUION, Philippe. Influence of glutamic acid or its salts on the sensory
characteristics of a chicken broth: reduction of sodium intake. Food Quality and Preference, v.
1, n. 3, p. 93–101, 1989.
DANG, Yali et al. Molecular docking and simulation of the synergistic effect between umami
peptides, monosodium glutamate and taste receptor T1R1/T1R3. Food Chemistry, v. 271, p.
697–706, 2019.
DE-MELO, Paulo César Tavares. Cultivares de tomate com características agronômicas e
industriais para a produção de atomatados. Horticultura Brasileira, v. 1, n. 30, p. 9, 2012.
DE ARAUJO, I.E.T. et al. Representation of Umami Taste in the Human Brain. Journal of
Neurophysiology, v. 90, n. 1, p. 313–319, 2003. Disponível em:
<http://www.physiology.org/doi/10.1152/jn.00669.2002>.
DEVEZEAUX DE LAVERGNE, M et al. Dynamic texture perception and oral processing of
semi-solid food gels: Part 1: Comparison between QDA, progressive profiling and TDS. Food
Hydrocolloids, v. 43, p. 207–217, 2015. Disponível em: <http://ac.els-
cdn.com/S0268005X1400215X/1-s2.0-S0268005X1400215X-main.pdf?_tid=c540a5ba-4b60-
11e7-9570-00000aab0f6c&acdnat=1496826645_4be3fe68f35e7704739c42b15eed940c>.
DIJKSTERHUIS, Garmt B.; PIGGOTT, John R. Dynamic methods of sensory analysis. Trends
in Food Science and Technology, v. 11, n. 8, p. 284–290, 2000.
DINNELLA, Caterina et al. Sensory functionality of extra-virgin olive oil in vegetable foods
assessed by Temporal Dominance of Sensations and Descriptive Analysis. Food Quality and
Preference, v. 26, n. 2, p. 141–150, 2012.
DONOGHUE, S. Projective techniques in consumer research. Journal of Family Ecology and
Consumer Sciences, v. 28, n. 1, p. 47–53, 2000.
DOS-SANTOS, B. A. et al. Check all that apply and free listing to describe the sensory
characteristics of low sodium dry fermented sausages: Comparison with trained panel. Food
Research International, v. 76, p. 725–734, 2015.
DOS SANTOS, B A et al. Check all that apply and free listing to describe the sensory
characteristics of low sodium dry fermented sausages: Comparison with trained panel. Food
Research International, v. 76, p. 725–734, 2015. Disponível em:
<http://www.sciencedirect.com/science/article/pii/S0963996915300909>.
DOS SANTOS, Bibiana Alves et al. Monosodium glutamate, disodium inosinate, disodium
guanylate, lysine and taurine improve the sensory quality of fermented cooked sausages with
50% and 75% replacement of NaCl with KCl. Meat Science, v. 96, n. 1, p. 509–513, 2014.
DUTCOSKY, S. D. Análise sensorial de alimentos. 4. ed. Curitiba: Champagnat, 2013.
ESMERINO, E.A. et al. The influence of sweeteners in probiotic Petit Suisse cheese in
concentrations equivalent to that of sucrose. Journal of Dairy Science, v. 96, n. 9, p. 5512–
5521, 2013. Disponível em: <http://www.scopus.com/inward/record.url?eid=2-s2.0-
84882837270&partnerID=40&md5=93b14f40b8b8c8c8742b7c6218ca30d8>.
ESMERINO, Erick A. et al. Dynamic profiling of different ready-to-drink fermented dairy
products: A comparative study using Temporal Check-All-That-Apply (TCATA), Temporal
Dominance of Sensations (TDS) and Progressive Profile (PP). Food Research International, v.
101, p. 249–258, 2017.
FAO, Food and Agriculture Organization. Faostat – Statistics Database. Disponível em:
<http://faostat3.fao.org/browse/Q/QC/E. Acesso em: 05 mar. 2019.>. Acesso em: 5 mar. 2019.
FARIA, J.A.F. et al. Manufacture of low-sodium Minas fresh cheese: Effect of the partial
replacement of sodium chloride with potassium chloride. Journal of Dairy Science, v. 94, n. 6,
p. 2701–2706, 2011.
FELLENDORF, Susann; O’SULLIVAN, Maurice G; KERRY, Joseph P. Impact of ingredient
replacers on the physicochemical properties and sensory quality of reduced salt and fat black
puddings. Meat Science, v. 113, p. 17–25, 2016. Disponível em:
<http://www.sciencedirect.com/science/article/pii/S0309174015301212>.
FELTRIN, Ana Carolina et al. Sensory study of different sodium chloride substitutes in
aqueous solution. International Journal of Food Science & Technology, v. 50, n. 3, p. 730–735,
2015. Disponível em: <http://dx.doi.org/10.1111/ijfs.12670>.
FILIPPINI, Tommaso et al. The effect of potassium supplementation on blood pressure in
hypertensive subjects: A systematic review and meta-analysis. International Journal of
Cardiology, v. 230, p. 127–135, 2017.
FONSECA, Fernando G.A. et al. Novel and successful free comments method for sensory
characterization of chocolate ice cream: A comparative study between pivot profile and
comment analysis. Journal of Dairy Science, v. 99, n. 5, p. 3408–3420, 2016.
GALMARINI, M. V.; VISALLI, M.; SCHLICH, P. Advances in representation and analysis of
mono and multi-intake Temporal Dominance of Sensations data. Food Quality and Preference,
v. 56, p. 247–255, 2017.
GAO, Xueqin; ZHANG, Wangang; ZHOU, Guanghong. Effects of glutinous rice flour on the
physiochemical and sensory qualities of ground pork patties. LWT - Food Science and
Technology, v. 58, n. 1, p. 135–141, 2014.
GÄRTNER, Christine; STAHL, Wilhelm; SIES, Helmut. Lycopene is more bioavailable from
tomato paste than from fresh tomatoes. American Journal of Clinical Nutrition, v. 66, n. 1, p.
116–122, 1997.
GELABERT, J. et al. Effect of sodium chloride replacement on some characteristics of
fermented sausages. Meat Science, v. 65, n. 2, p. 833–839, 2003.
GONZALEZ VIEJO, Claudia et al. Integration of non-invasive biometrics with sensory
analysis techniques to assess acceptability of beer by consumers. Physiology and Behavior,
2018.
GOODSTEIN, Emily S. et al. Perception of flavor finish in model white wine: A time-intensity
study. Food Quality and Preference, v. 36, p. 50–60, 2014.
GOUPIL DE BOUILLE, A. et al. How do panelists use the list of attributes during a temporal
dominance of sensations experiment. 2010, [S.l: s.n.], 2010. p. 179.
GRUMMER, J et al. Manufacture of reduced-sodium Cheddar-style cheese with mineral salt
replacers. Journal of Dairy Science, v. 95, n. 6, p. 2830–2839, 2012. Disponível em:
<http://www.sciencedirect.com/science/article/pii/S0022030212002597>.
HALL, John Edward; GUYTON, Arthur C. Guyton & Hall tratado de fisiologia médica. 13.
ed. Rio de Janeiro: Elsevier, 2017.
HAN, Pengfei et al. Different Neural Processing of Umami and Salty Taste Determined by
Umami Identification Ability Independent of Repeated Umami Exposure. Neuroscience, v.
383, p. 74–83, 2018.
HARNACK, Lisa J. et al. Sources of sodium in US adults from 3 geographic regions.
Circulation, v. 135, n. 19, p. 1775–1783, 2017.
HASHIDA, J. C. et al. EEG pattern discrimination between salty and sweet taste using adaptive
Gabor transform. Neurocomputing, v. 68, n. 1–4, p. 251–257, 2005.
HAUTH, M. R. et al. Qualidade de tomates para processamento industrial. 2017, Embrapa
Mato Grosso: Embrapa Agrossilvipastoril, 2017. p. 4.
HELYES, Lajos; LUGASI, Andrea; PÉK, Zoltán. Effect of irrigation on processing tomato
yield and antioxidant components. Turkish Journal of Agriculture and Forestry, v. 36, n. 6, p.
702–709, 2012.
“HIGHER FUNCTIONS OF THE NERVOUS SYSTEM”: CONDITIONED REFLEXES,
LEARNING, RELATED PHENOMENA. In: GANONG, W.F. Review of Medical Book of
Physiology. (pp. 259-269). 21a Ed. New York: McGraw Hill. 21. ed. [S.l.]: New York: McGraw
Hill, 2003.
HORITA, C N et al. Physico-chemical and sensory properties of reduced-fat mortadella
prepared with blends of calcium, magnesium and potassium chloride as partial substitutes for
sodium chloride. Meat Science, v. 89, n. 4, p. 426–433, 2011. Disponível em:
<http://www.sciencedirect.com/science/article/pii/S0309174011001872>.
HUYNH, Hue Linh; DANHI, Robert; YAN, See Wan. Using Fish Sauce as a Substitute for
Sodium Chloride in Culinary Sauces and Effects on Sensory Properties. Journal of Food
Science, v. 81, n. 1, p. S150–S155, 2016.
HWANG, Eun Sun et al. Effects of Heat Treatment on the Carotenoid and Tocopherol
Composition of Tomato. Journal of Food Science, v. 77, n. 10, 2012.
IDEC. Redução de sódio em alimentos: uma análise dos acordos voluntários no Brasil. São
Paulo: Instituto Brasileiro de Defesa do Consumidor., 2014. v. 1.
JAEGER, Sara R. et al. Check-all-that-apply (CATA) questions for sensory product
characterization by consumers: Investigations into the number of terms used in CATA
questions. Food Quality and Preference, v. 42, p. 154–164, 2015.
JINAP, S.; HAJEB, P. Glutamate. Its applications in food and contribution to health. Appetite,
v. 55, n. 1, p. 1–10, 2010.
JUYUN, Lim. Hedonic scaling: A review of methods and theory. Food quality and preference,
v. 22, n. 8, p. 733–747, 2011. Disponível em:
<http://www.sciencedirect.com/science/article/pii/S0950329311000954>.
KATICA, Cepanec et al. Potassium Chloride‐Based Salt Substitutes: A Critical Review with a
Focus on the Patent Literature. Comprehensive Reviews in Food Science and Food Safety, v.
16, n. 5, p. 881–894, 2017. Disponível em: <https://doi.org/10.1111/1541-4337.12291>.
KENNY, Paul J. Reward Mechanisms in Obesity: New Insights and Future Directions. Neuron,
v. 69, n. 4, p. 664–679, 2011.
KILCAST, D.; DEN RIDDER, C. Sensory issues in reducing salt in food products. Reducing
Salt in Foods: Practical Strategies, p. 201–220, 2007.
KOBAYAKAWA, Tatsu et al. The primary gustatory area in human cerebral cortex studied by
magnetoencephalography. Neuroscience Letters, v. 212, n. 3, p. 155–158, 1996.
KOBORI, CN et al. Teores de carotenoides em produtos de tomate. Rev Inst Adolfo Lutz, v. 69,
n. 1, p. 78–83, 2010.
KREMER, Stefanie et al. Insights on older adults’ perception of at-home sensory-hedonic
methods: A case of Ideal Profile Method and CATA with ideal. Food Quality and Preference,
v. 53, p. 29–38, 2016.
LAW, MR; FROST, CD; WALD, NJ. By how much does dietary salt reduction lower blood
pressure? I--Analysis of observational data among populations. Bmj, v. Apr 6;302, n. 6780, p.
811–815, 1991.
LAWLESS, Harry T.; HEYMANN, Hildegarde. Sensory Evaluation of Food. 2010. Disponível
em: <http://link.springer.com/10.1007/978-1-4419-6488-5>.
LOPES, Cristiane de Oliveira et al. Effect of the addition of spices on reducing the sodium
content and increasing the antioxidant activity of margarine. LWT - Food Science and
Technology, v. 58, n. 1, p. 63–70, 2014.
LORIDO, Laura et al. Comparative study between Serrano and Iberian dry-cured hams in
relation to the application of high hydrostatic pressure and temporal sensory perceptions. LWT
- Food Science and Technology, v. 64, n. 2, p. 1234–1242, 2015. Disponível em:
<http://www.sciencedirect.com/science/article/pii/S0023643815300463>.
LUCIA, Alejandro et al. Which laboratory variable is related with time trial performance time
in the Tour de France? British Journal of Sports Medicine, v. 38, n. 5, p. 636–640, 2004.
LYTRA, Georgia et al. How do esters and dimethyl sulphide concentrations affect fruity aroma
perception of red wine? Demonstration by dynamic sensory profile evaluation. Food Chemistry,
v. 194, p. 196–200, 2016.
MAHESHWARI, HM et al. Determining Efficacy of Monosodium Glutamate for Salt
Reduction in Plain and Spiced ‘Poories’ Through Sensory Responses. Journal of Experimental
Food Chemistry, v. 03, n. 03, 2017. Disponível em: <https://www.omicsonline.org/open-
access/determining-efficacy-of-monosodium-glutamate-for-salt-reduction-inplain-and-spiced-
poories-through-sensory-responses-2472-0542-1000129.php?aid=92329>.
MALULY, Hellen D.B.; ARISSETO-BRAGOTTO, Adriana P.; REYES, Felix G.R.
Monosodium glutamate as a tool to reduce sodium in foodstuffs: Technological and safety
aspects. Food Science and Nutrition, v. 5, n. 6, p. 1039–1048, 2017.
MARKOVIC, K et al. Aroma volatiles of tomatoes and tomato products evaluated by solid-
phase microextraction. Flavour and Fragrance Journal, n. 5, p. 395–400, 2007.
MARTÍNEZ-HUÉLAMO, Miriam et al. The tomato sauce making process affects the
bioaccessibility and bioavailability of tomato phenolics: A pharmacokinetic study. Food
Chemistry, v. 173, p. 864–872, 2015. Disponível em:
<http://www.sciencedirect.com/science/article/pii/S0308814614015453>.
MCLEAN, Rachael M. Measuring population sodium intake: A review of methods. Nutrients,
v. 6, n. 11, p. 4651–4662, 2014.
MEILGAARD, Morten; CIVILLE, Gail Vance; CARR, Thomas B. Sensory Evaluation
Techniques. p. 448, 2016.
MEILLON, S; URBANO, C; SCHLICH, P. Contribution of the Temporal Dominance of
Sensations (TDS) method to the sensory description of subtle differences in partially
dealcoholized red wines. Food Quality and Preference, v. 20, n. 7, p. 490–499, 2009.
Disponível em: <http://www.sciencedirect.com/science/article/pii/S0950329309000627>.
MELIS, Melania; BARBAROSSA, Iole Tomassini. Taste perception of sweet, sour, salty,
bitter, and Umami and changes due to L-arginine supplementation, as a function of genetic
ability to taste 6-n-propylthiouracil. Nutrients, v. 9, n. 6, 2017.
MELLO, Lívia Silva Simões; ALMEIDA, Eveline Lopes; MELO, Lauro. Discrimination of
sensory attributes by trained assessors and consumers in semi-sweet hard dough biscuits and
their drivers of liking and disliking. Food Research International, 2019.
MENETON, Pierre et al. Links Between Dietary Salt Intake, Renal Salt Handling, Blood
Pressure, and Cardiovascular Diseases. Physiological Reviews, v. 85, n. 2, p. 679–715, 2005.
MEYNERS, Michael. Temporal liking and CATA analysis of TDS data on flavored fresh
cheese. Food Quality and Preference, v. 47, p. 101–108, 2016a. Disponível em:
<http://www.sciencedirect.com/science/article/pii/S0950329315000361>.
MEYNERS, Michael. Temporal liking and CATA analysis of TDS data on flavored fresh
cheese. Food Quality and Preference, v. 47, p. 101–108, 2016b.
MHURCHU, Cliona Ni et al. Sodium content of processed foods in the United Kingdom :
analysis of. October, n. 10, p. 594–600, 2011.
MINISTÉRIO DA SAÚDE, Brasil. Plano de ações estratégicas para o enfrentamento das
doenças crônicas não transmissíveis (DCNT) no Brasil, 2011-2022. 2011.
MIRONDO, Rita; BARRINGER, Sheryl. Improvement of Flavor and Viscosity in Hot and
Cold Break Tomato Juice and Sauce by Peel Removal. Journal of Food Science, v. 80, n. 1, p.
S171–S179, 2015.
MIZOGUCHI, C. Gustatory Evoked Cortical Activity in Humans Studied by Simultaneous
EEG and MEG Recording. Chemical Senses, v. 27, n. 7, p. 629–634, 2002. Disponível em:
<https://academic.oup.com/chemse/article-lookup/doi/10.1093/chemse/27.7.629>.
MONTEIRO, CS. Desenvolvimento de molho de tomate Lycopersicon esculentum Mill
formulado com cogumelo Agaricus brasiliensis. 2008. 176 f. Universidade Federal do Paraná,
2008.
MOREIRA, Márlon Martins et al. Inadequação no consumo de sódio e o impacto nos custos de
internações por doenças cardiovasculares. Revista Brasileira de Educação e Cultura, n. 17, p.
140–148, 2018.
MOSKOWITZ, Howard R. Product testing and sensory evaluation of foods : marketing and
R&D approaches. [S.l: s.n.], 1983.
NG, M.; CHAYA, C.; HORT, J. Beyond liking: Comparing the measurement of emotional
response using EsSense Profile and consumer defined check-all-that-apply methodologies.
Food Quality and Preference, v. 28, n. 1, p. 193–205, 2013.
NGUYEN, Quoc Cuong; NÆS, Tormod; VARELA, Paula. When the choice of the temporal
method does make a difference: TCATA, TDS and TDS by modality for characterizing semi-
solid foods. Food Quality and Preference, v. 66, p. 95–106, 2018.
NILSON, Eduardo et al. Sodium reduction in processed foods in Brazil: analysis of food
categories and voluntary targets from 2011 to 2017. Nutrients, v. 9, n. 7, p. 742, 2017.
NUNEZ, Paul L.; SRINIVASAN, Ramesh. Electric Fields of the Brain: The neurophysics of
EEG. Electric Fields of the Brain: The neurophysics of EEG, p. 1–611, 2009.
PARENTE, ME. External Preference Mapping of Commercial Antiaging Creams Based on
Consumers’Responses To a Check‐All‐That‐Apply. Journal of Sensory …, v. 26, p. 158–166,
2011. Disponível em: <http://onlinelibrary.wiley.com/doi/10.1111/j.1745-
459X.2011.00332.x/full>.
PAULSEN, Morten T et al. Effects of NaCl substitution on the sensory properties of sausages:
Temporal aspects. Meat Science, v. 98, n. 2, p. 164–170, 2014. Disponível em:
<http://www.sciencedirect.com/science/article/pii/S030917401400151X>.
PENG, Yueqing et al. Sweet and bitter taste in the brain of awake behaving animals. Nature, v.
527, n. 7579, p. 512–515, 2015.
PEREIRA, S. Processamento de tomates (Lycopersicom escullentun Mill.), cv. Débora
cultivados de forma tradicional e orgânica, para obtenção de extratos. 2007. 75 f. Universidade
Rural do Rio de Janeiro, 2007.
PHAT, Chanvorleak; MOON, Bokyung; LEE, Chan. Evaluation of umami taste in mushroom
extracts by chemical analysis, sensory evaluation, and an electronic tongue system. Food
Chemistry, v. 192, p. 1068–1077, 2016.
PIETRASIK, Z; GAUDETTE, N J. The impact of salt replacers and flavor enhancer on the
processing characteristics and consumer acceptance of restructured cooked hams. Meat
Science, v. 96, n. 3, p. 1165–1170, 2014. Disponível em:
<http://www.sciencedirect.com/science/article/pii/S0309174013006037>.
PINEAU, N et al. Temporal Dominance of Sensations: Construction of the TDS curves and
comparison with time–intensity. Food Quality and Preference, v. 20, n. 6, p. 450–455, 2009.
Disponível em: <http://www.sciencedirect.com/science/article/pii/S0950329309000603>.
PLATA-SALAMAN, C. R.; SMITH-SWINTOSKY, V. L.; SCOTT, T. R. Gustatory neural
coding in the monkey cortex: mixtures. Journal of Neurophysiology, v. 75, n. 6, p. 2369–2379,
1996. Disponível em: <http://www.physiology.org/doi/10.1152/jn.1996.75.6.2369>.
POOJARY, Mahesha M.; PASSAMONTI, Paolo. Extraction of lycopene from tomato
processing waste: Kinetics and modelling. Food Chemistry, v. 173, p. 943–950, 2015.
POPPER, Richard et al. The effect of attribute questions on overall liking ratings. Food Quality
and Preference, v. 15, n. 7–8 SPEC.ISS., p. 853–858, 2004.
QUADROS, Diomar Augusto De et al. Low-sodium fish burgers: Sensory profile and drivers
of liking. LWT - Food Science and Technology, v. 63, n. 1, p. 236–242, 2015.
RANGAN, Cyrus; BARCELOUX, Donald. Food Additives and Sensitivities. Medical
Toxicology of Natural Substances: Foods, Fungi, Medicinal Herbs, Plants, and Venomous
Animals, p. 22–33, 2008.
RAUBER, Fernanda et al. Ultra-Processed Food Consumption and Chronic Non-
Communicable Diseases-Related Dietary Nutrient Profile in the UK (2008–2014). Nutrients, v.
10, n. 5, p. 587, 2018.
RIBEIRO, F.A. et al. Sensory acceptability of partial replacement of sodium chloride by
potassium chloride and calcium chloride in production of salami with low sodium. Meat
Science, v. 101, p. 104–105, 2014.
ROCA, M. Valorização do Tomate Nacional-Extração de licopeno por CO2 supercrítico a
partir de repiso de tomate. 2009. 80 f. Universidade Técnica de Lisboa, 2009.
RODRIGUES, F. M. et al. Alternatives to reduce sodium in processed foods and the potential
of high pressure technology. Food Science and Technology (Campinas), v. 36, n. 1, p. 1–8,
2016. Disponível em: <http://www.scielo.br/scielo.php?script=sci_arttext&pid=S0101-
20612016000100001&lng=en&nrm=iso&tlng=en>.
RODRIGUES, J F. Investigações sobre técnicas sensoriais: um estudo sobre a metodologia de
Dominância Temporal das Sensações (TDS). p. 96, 2017.
ROLLS, Edmund T. The orbitofrontal cortex and emotion in health and disease, including
depression. Neuropsychologia, 2017.
ROYAL SOCIETY OF CHEMISTRY. Periodic Table. Disponível em:
<http://www.rsc.org/periodic-table/element/11/sodium>. Acesso em: 15 fev. 2019.
SCHIFFMAN, Susan S. Sensory enhancement of foods for the elderly with monosodium
glutamate and flavors. Food Reviews International, v. 14, n. 2–3, p. 321–333, 1998.
SCLAFANI, Anthony; ACKROFF, Karen. Reinforcement value of sucrose measured by
progressive ratio operant licking in the rat. Physiology and Behavior, v. 79, n. 4–5, p. 663–670,
2003.
SHAH, A.K.M.A. et al. Identification and sensory evaluation of flavour enhancers in Japanese
traditional dried herring (Clupea pallasii) fillet. Food Chemistry, v. 122, n. 1, p. 249–253, 2010.
Disponível em: <http://www.sciencedirect.com/science/article/pii/S0308814610002566>.
SILVA, A. S; COUTINHO, V. F; AZEVEDO, C. H. Análise do teor de sódio em molhos de
tomate industrializados: um alerta para hipertensão. Saber Científico, v. 4, n. 1, p. 38–46, 2015.
SINGH, P. B.; SCHUSTER, B.; SEO, H. S. Variation in umami taste perception in the German
and Norwegian population. European Journal of Clinical Nutrition, v. 64, n. 10, p. 1248–1250,
2010.
SINNAKIROUCHENAN, Ramapriya; KOTCHEN, Theodore A. Role of Sodium Restriction
and Diuretic Therapy for “Resistant” Hypertension in Chronic Kidney Disease. Seminars in
Nephrology, v. 34, n. 5, p. 514–519, 2014.
SIRÓ, István et al. Functional food. Product development, marketing and consumer acceptance-
A review. Appetite, v. 51, n. 3, p. 456–467, 2008.
SOKOLOWSKY, Martina; FISCHER, Ulrich. Evaluation of bitterness in white wine applying
descriptive analysis, time-intensity analysis, and temporal dominance of sensations analysis.
Analytica Chimica Acta, v. 732, p. 46–52, 2012.
SOKOLOWSKY, Martina; ROSENBERGER, Annett; FISCHER, Ulrich. Sensory impact of
skin contact on white wines characterized by descriptive analysis, time–intensity analysis and
temporal dominance of sensations analysis. Food Quality and Preference, v. 39, p. 285–297,
2015. Disponível em:
<http://www.sciencedirect.com/science/article/pii/S0950329314001499>.
STOKES, Chloe N.; O’SULLIVAN, Maurice G.; KERRY, Joseph P. Hedonic and descriptive
sensory evaluation of instant and fresh coffee products. European Food Research and
Technology, v. 243, n. 2, p. 331–340, 2017.
STONE, H.; BLEIBAUM, R.; THOMAS, H.A. Chapter 7: Affective Testing. Sensory
Evaluation Practices, p. 291–325, 2012.
STONE, Herbert. Example food: What are its sensory properties and why is that important? npj
Science of Food, v. 2, n. 1, 2018.
STONE, Herbert; BLEIBAUM, Rebecca; THOMAS, Heather. Sensory Evaluation Practices.
4. ed. [S.l.]: Academic Press, 2012.
STONE, HERBERT; OLIVER, SHIRLEY M. Measurement of the Relative Sweetness of
Selected Sweeteners and Sweetener Mixtures. Journal of Food Science, v. 34, n. 2, p. 215–222,
1969.
SYMONEAUX, R.; GALMARINI, M. V.; MEHINAGIC, E. Comment analysis of consumer’s
likes and dislikes as an alternative tool to preference mapping. A case study on apples. Food
Quality and Preference, v. 24, n. 1, p. 59–66, 2012.
TACO, NEPA. Tabela brasileira de composição de alimentos. Revista Ampliada NEPA
UNICAMP, p. 161, 2011.
TAYLOR, DENISE E.; PANGBORN, ROSE MARIE. Temporal Aspects of Hedonic
Responses. Journal of Sensory Studies, v. 4, n. 4, p. 241–247, 1990.
TEIXEIRA, LV. Sensory analysis in the food industry. Rev. Inst. Latic. “Cândido Tostes”, v.
366, n. 64, p. 12–21, 2009.
THYBO, Anette K.; KÜHN, Birka F.; MARTENS, Harald. Explaining Danish children’s
preferences for apples using instrumental, sensory and demographic/behavioural data. Food
Quality and Preference, v. 15, n. 1, p. 53–63, 2004.
TOUFEILI, I. et al. The effect of substitution of sodium chloride with potassium chloride on
the physicochemical, microbiological, and sensory properties of Halloumi cheese. Journal of
Dairy Science, v. 95, n. 3, p. 1140–1151, 2012.
TSUGANE, S. et al. Salt and salted food intake and subsequent risk of gastric cancer among
middle-aged Japanese men and women. British Journal of Cancer, v. 90, n. 1, p. 128–134,
2004.
VARELA, P. et al. The best of both worlds: Rapidity and enhanced discrimination with a
trained panel. Exploration of global and partial PSP with a descriptive step. 2014,
Copenhaguen, Denmark.: Eurosense, 2014. p. 2.
VARELLA, C. Análise multivariada aplicada as Ciências Agrárias–Análise de Componentes
Principais. Apostila de disciplina, p. 75, 2008.
VICKERS, ZATA. Sensory Specific Satiety in Lemonade Using a Just Right Scale for
Sweetness. Journal of Sensory Studies, v. 3, n. 1, p. 1–8, 1988.
VIDAL, Leticia et al. Comparison of rate-all-that-apply (RATA) and check-all-that-apply
(CATA) questions across seven consumer studies. Food Quality and Preference, v. 67, p. 49–
58, 2018.
VIDIGAL, Márcia C.T.R. et al. Food technology neophobia and consumer attitudes toward
foods produced by new and conventional technologies: A case study in Brazil. LWT - Food
Science and Technology, v. 60, n. 2, p. 832–840, 2015.
WAKELING, Ian N.; MACFIE, Halliday J.H. Designing consumer trials balanced for first and
higher orders of carry-over effect when only a subset of k samples from t may be tested. Food
Quality and Preference, v. 6, n. 4, p. 299–308, 1995.
WALLROTH, Raphael; OHLA, Kathrin. As Soon as You Taste It: Evidence for Sequential and
Parallel Processing of Gustatory Information. Eneuro, v. 5, n. 5, p. ENEURO.0269-18.2018,
2018. Disponível em: <http://eneuro.org/lookup/doi/10.1523/ENEURO.0269-18.2018>.
WANG, Xiang Dong. Lycopene metabolism and its biological significance. American Journal
of Clinical Nutrition, v. 96, n. 5, 2012.
WEBSTER, Jacqueline L et al. Salt reduction initiatives around the world. Journal of
hypertension, v. 29, n. 6, p. 1043–1050, jun. 2011.
WEBSTER, Jacqueline L; DUNFORD, Elizabeth K; NEAL, Bruce C. A systematic survey of
the sodium contents of processed foods. The American Journal of Clinical Nutrition,
10.3945/ajcn.2009.28688, v. 91, n. 2, p. 413–420, 1 fev. 2010. Disponível em:
<http://dx.doi.org/10.3945/ajcn.2009.28688>.
WEST, Ryan; SEETHARAMAN, Koushik; DUIZER, Lisa M. Whole grain macaroni: Flavour
interactions with sodium-reduced cheese sauce. Food Research International, v. 53, n. 1, p.
149–155, 2013.
WHO. Media centre: Noncommunicable diseases. Disponível em:
<www.who.int/mediacentre/factsheets/fs355/en/>.
WHO. Sodium intake for adults and children. . World Health Organization: [s.n.], 2012.
WHO, World Health Organization. European action plan for food and nutrition policy 2007-
2012. Disponível em: <http://www.euro.who.int/nutrition/ActionPlan/20080516_1>. Acesso
em: 3 mar. 2019.
WU, Haizhou et al. Influence of partial replacement of NaCl with KCl on profiles of volatile
compounds in dry-cured bacon during processing. Food Chemistry, v. 172, p. 391–399, 2015.
YAGYU, T. et al. Smell and taste of chewing gum affect frequency domain EEG source
localizations. International Journal of Neuroscience, v. 93, n. 3–4, p. 205–216, 1998.
YAMAGUCHI, Shizuko; NINOMIYA, Kumiko. Umami and Food Palatability. The Journal of
Nutrition, v. 130, n. 4, p. 921S–926S, 2018.
YASUMATSU, Keiko et al. Involvement of multiple taste receptors in umami taste: Analysis
of gustatory nerve responses in metabotropic glutamate receptor 4 knockout mice. Journal of
Physiology, v. 593, n. 4, p. 1021–1034, 2015.
YONAMINE, G. H. et al. Desenvolvimento e análise química de preparações com reduzido
teor de sódio, lipídios e colesterol. Alimentos e Nutrição Araraquara, v. 16, n. 2, p. 137–143,
2005.
ZENEBON, O; PASCUET, N; TIGLEA, P. Métodos físico-químicos para análise de alimentos.
Métodos físicos-quimicos para análise de Alimentos, p. 589–625, 2008.
ZHANG, Ying Na et al. Improving the sweet aftertaste of green tea infusion with tannase. Food
Chemistry, v. 192, p. 470–476, 2016.
ZHUANG, Mingzhu et al. Sequence, taste and umami-enhancing effect of the peptides
separated from soy sauce. Food Chemistry, v. 206, p. 174–181, 2016. Disponível em:
<http://www.sciencedirect.com/science/article/pii/S0308814616304113>.
Baracat, C. A. (2018). Percepção do consumidor a respeito da cor do molho de tomate
industrializado.
Dickinson, H. O., Nicolson, D., Campbell, F., Beyer, F. R., & Mason, J. (2006).
Potassium supplementation for the management of primary hypertension in adults. Cochrane
Database of Systematic Reviews, (3).
Filippini, T., Violi, F., D'Amico, R., & Vinceti, M. (2017). The effect of potassium
supplementation on blood pressure in hypertensive subjects: a systematic review and meta-
analysis. International journal of cardiology, 230, 127-135.
Krishna, G. G. (1990). Effect of potassium intake on blood pressure. Journal of the
American Society of Nephrology, 1(1), 43-52.
Terker, A. S., Zhang, C., McCormick, J. A., Lazelle, R. A., Zhang, C., Meermeier,
N. P., ... & Weinstein, A. M. (2015). Potassium modulates electrolyte balance and blood
pressure through effects on distal cell voltage and chloride. Cell metabolism, 21(1), 39-50.
SPRING. Failing Economy, Failing Health. Harvard public health,p.41 2014.
Alvarenga, I. (2019). OPAS/OMS Brasil - Semana Mundial pela Conscientização do Consumo
de Sódio | OPAS/OMS. [online] Pan American Health Organization / World Health
Organization. Available at:
https://www.paho.org/bra/index.php?option=com_content&view=article&id=4797:semana-
mundial-pela-conscientizacao-do-consumo-de-sodio&Itemid=820 [Accessed 29 Apr. 2019].
WHO. (2018). Media centre: Noncommunicable diseases. Retrieved from
https://www.who.int/news-room/fact-sheets/detail/noncommunicable-diseases
Rust, P., & Ekmekcioglu, C. (2016). Impact of salt intake on the pathogenesis and
treatment of hypertension. In Hypertension: from basic research to clinical practice (pp. 61-84).
Springer, Cham.
APÊNDICE
TERMO DE CONSENTIMENTO LIVRE E ESCLARECIDO
Desenvolvimento e caracterização sensorial de molho de tomate com teor de sódio reduzido.
Elson Rogerio Tavares Filho
Número do CAAE: 49137615.3.0000.5404
Você está sendo convidado a participar como voluntário de um estudo. Este documento,
chamado Termo de Consentimento Livre e Esclarecido, visa assegurar seus direitos e deveres como
participante e é elaborado em duas vias, uma que deverá ficar com você e outra com o pesquisador.
Por favor, leia com atenção e calma, aproveitando para esclarecer suas dúvidas. Se houverem
perguntas antes ou mesmo depois de assiná-lo, você poderá esclarecê-las com o pesquisador. Se preferir,
pode levar para casa e consultar seus familiares ou outras pessoas antes de decidir participar. Se você
não quiser participar ou retirar sua autorização, a qualquer momento, não haverá nenhum tipo de
penalização ou prejuízo.
Justificativa e objetivos:
Em prol do desenvolvimento de produtos alimentícios com teor de sódio reduzido, que vem
sendo estimulado tanto internacionalmente pela “Organização mundial de saúde”, quanto nacionalmente
pela “Agencia Nacional de Vigilância Sanitária” esse trabalho visa elaborar molhos de tomate com baixo
teor de sódio. Contudo, para produzir tal produto, estudos que investigam as propriedades tecnológicas
e sensoriais se fazem necessários, pois produzem informações valiosas à cerca do desenvolvimento do
produto.
Procedimentos:
Participando do estudo você está sendo convidado a: Realizar analises sensoriais, que envolvem
inspirar e provar individualmente, as 6 amostras de molho de tomate, seguidos do preenchimento de um
questionário do teste. O teste é realizado em uma única sessão com duração aproximada de 15 min, no
laboratório de análise sensorial do Departamento de Alimentos e Nutrição da Faculdade de Engenharia
de Alimentos (UNICAMP).
Desconfortos e riscos:
Não há riscos previsíveis mediante a realização do teste, contudo você não deve participar deste
estudo se for alérgico a qualquer uma das substancias abaixo: molho de tomate, sal de cozinha (cloreto
de sódio), sal light (cloreto de potássio), realçadores de sabor como Ajinomoto® (glutamato
monossódico), Ajitide® (guanilato dissódico) e Ajitide IMP® (inosinato dissódico), azeite de oliva, alho
e cebola, você também não deve participar se for gestante. A pesquisa não traz benefício direto a quem
dela participa, sendo o único intuito contribuir para a realização da pesquisa.
Benefícios:
Não haverá benefícios diretos aos participantes deste estudo. Porem os participantes, poderão
saber de todos os benefícios que a pesquisa trará. Os resultados da pesquisa serão possivelmente
publicados em revistas da área e o trabalho será mandado para congressos da área em todo o mundo, e
poderá ajudar nas metas de redução da ingestão de sódio propostas pelos países no mundo.
Acompanhamento e assistência:
Na ocorrência de qualquer acidente ou imprevisto durante a realização dos testes, o participante
deve avisar de imediato ao pesquisador que está conduzindo o teste. Medidas de emergência como
acionamento do Serviço de Atendimento Móvel de Urgência (Samu/192) pelo pesquisador, serão
tomadas sempre que a saúde do participante for comprometida, como por exemplo, na ocorrência de um
processo alérgico-alimentar.
Sigilo e privacidade:
Você tem a garantia de que sua identidade será mantida em sigilo e nenhuma informação será
dada a outras pessoas que não façam parte da equipe de pesquisadores. Na divulgação dos resultados
desse estudo, seu nome não será citado.
Ressarcimento:
Não haverá nenhum ressarcimento ou remuneração financeira pela participação na pesquisa.
Contato:
Em caso de dúvidas sobre o estudo, você poderá entrar em contato com Elson Rogerio Tavares Filho, a
qual poderá contatar /consultar a qualquer momento que julgar necessário através do endereço de e-mail
[email protected] ou através do telefone (19) 3521-4084. Fui informado (a), ainda que a
pesquisa é orientada pela Profa. Dr. Helena Maria André Bolini, a quem poderei contatar / consultar a
qualquer momento que julgar necessário, através do endereço de e-mail: [email protected].
Em caso de denúncias ou reclamações sobre sua participação no estudo, você pode entrar em contato
com a secretaria do Comitê de Ética em Pesquisa (CEP): Rua: Tessália Vieira de Camargo, 126; CEP
13083-887 Campinas – SP; telefone (19) 3521-8936; fax (19) 3521-7187; e-mail: [email protected]
Consentimento livre e esclarecido:
Após ter sido esclarecimento sobre a natureza da pesquisa, seus objetivos, métodos, benefícios
previstos, potenciais riscos e o incômodo que esta possa acarretar, aceito participar:
Nome do(a) participante: ________________________________________________________
_______________________________________________________ Data: ____/_____/______.
(Assinatura do participante ou nome e assinatura do responsável)
Responsabilidade do Pesquisador:
Asseguro ter cumprido as exigências da resolução 466/2012 CNS/MS e complementares na elaboração
do protocolo e na obtenção deste Termo de Consentimento Livre e Esclarecido. Asseguro, também,
ter explicado e fornecido uma cópia deste documento ao participante. Informo que o estudo foi
aprovado pelo CEP perante o qual o projeto foi apresentado e pela CONEP, quando pertinente.
Comprometo-me a utilizar o material e os dados obtidos nesta pesquisa exclusivamente para as
finalidades previstas neste documento ou conforme o consentimento dado pelo participante.
______________________________________________________ Data: ____/_____/______.
(Assinatura do pesquisador)

APÊNDICE
COMPROVANTES DE SUBMISSÃO DOS ARTIGOS
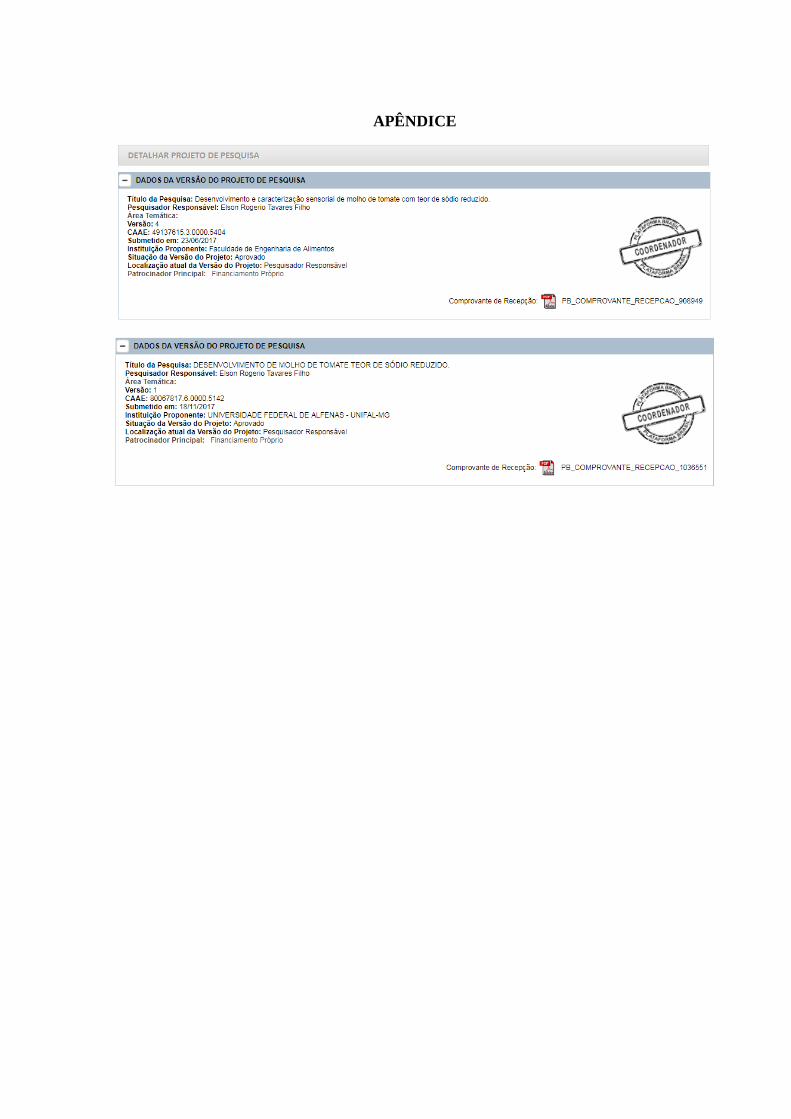
APÊNDICE