Embed Size (px)
Citation preview
Unemployment in South AfricaDescriptors & Determinants
School of Economics & Development Policy Research Unit, University of Cape TownE-mail: [email protected]: www.commerce.uct.ac.za/dpru
Fourth IZA/World Bank Conference on Employment and Development
BONNMAY 4-5, 2009
HAROON BHORAT
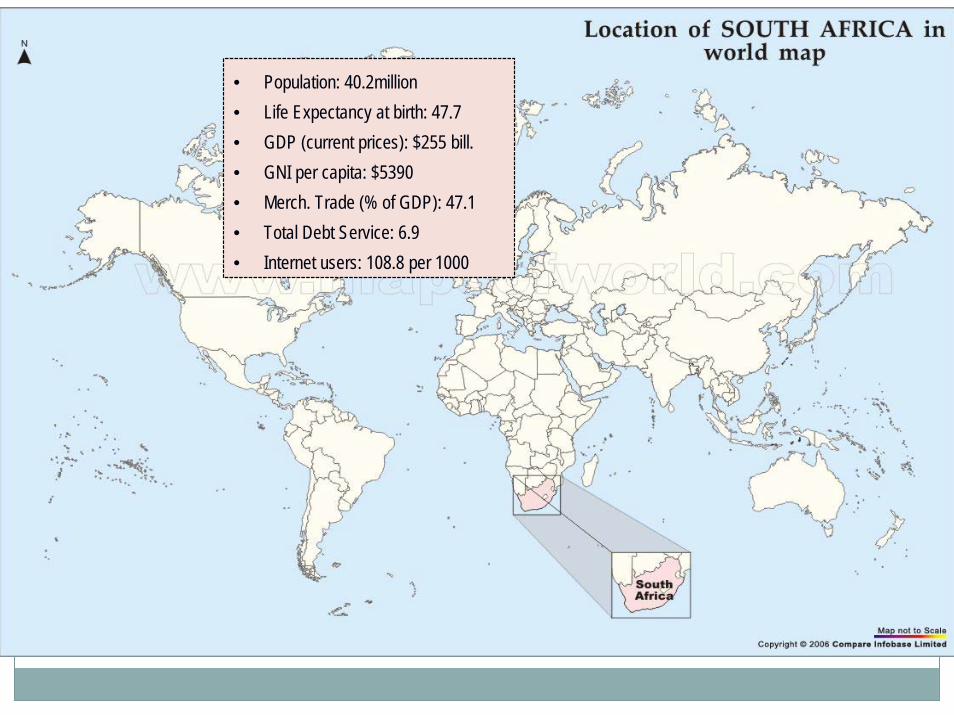
• Population: 40.2million• Life Expectancy at birth: 47.7• GDP (current prices): $255 bill.• GNI per capita: $5390• Merch. Trade (% of GDP): 47.1• Total Debt Service: 6.9• Internet users: 108.8 per 1000
OVERVIEW
A Descriptive and Econometric Overview
Causes of Unemployment in South Africa: A Line-Up of the Usual Suspects
A Menu of Possible Interventions
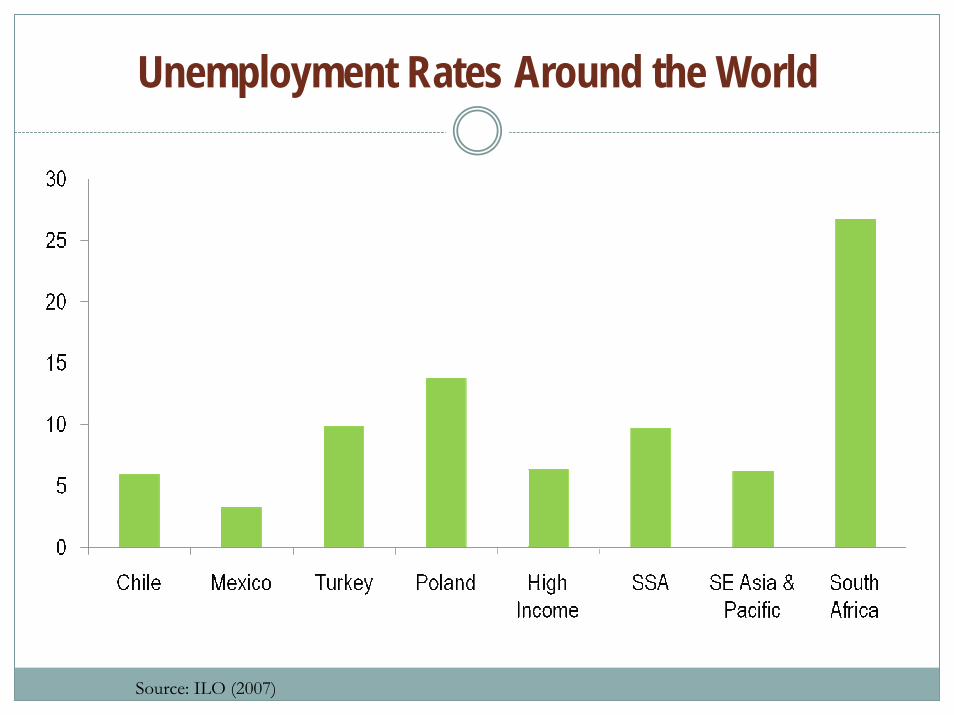
Unemployment Rates Around the World
Source: ILO (2007)

Unemployment In South Africa: The First Decade of Democracy
Unemployed numbered approximately 7.8 million individuals in 2005
Discouraged work seekers constitute 42% of broadly unemployed
Data Quality & Reliability.
National Unemployment Rate: 1995-2005
30.8
17.6
34.3
25.4
40.6
29.4
41.8
30.4
41.8
28.2
41.0
26.2
38.8
26.7
0.0
5.0
10.0
15.0
20.0
25.0
30.0
35.0
40.0
45.0
Per
cent
1995 2000 2001 2002 2003 2004 2005
Broad Unemployment Narrow Unemployment

Unemployment Rates In South Africa:Race & Gender
0
0.1
0.2
0.3
0.4
0.5
0.6
African White Total
MaleFemaleTotal
47%53%
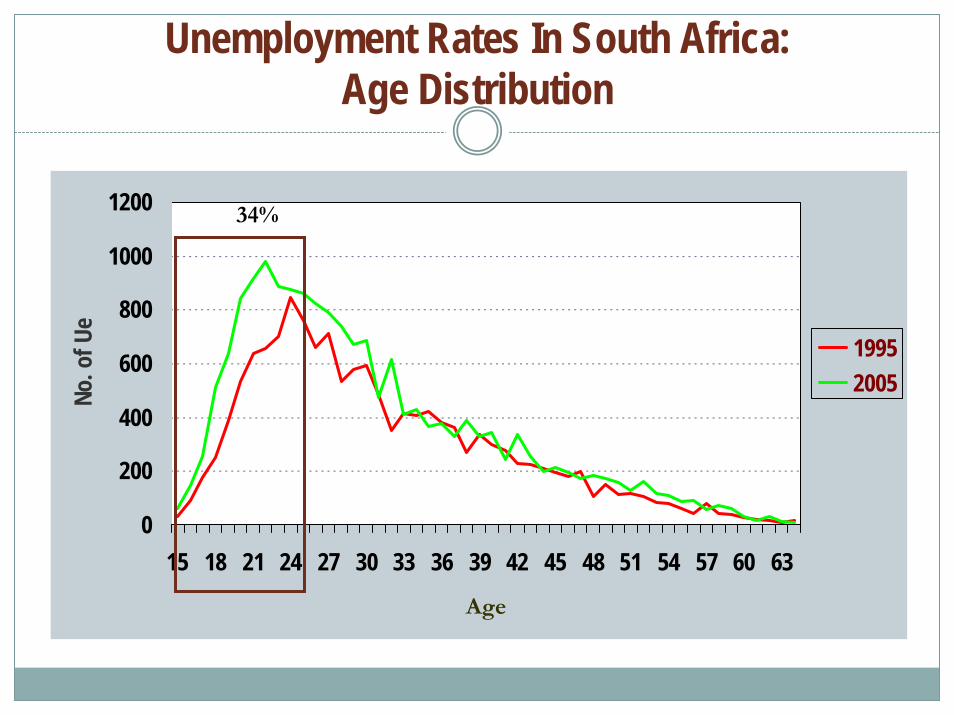
Unemployment Rates In South Africa:Age Distribution
0
200
400
600
800
1000
1200
15 18 21 24 27 30 33 36 39 42 45 48 51 54 57 60 63
Age
No. o
f Ue
19952005
34%

Youth Unemployment Rates: The Global Context
Source: KILM, 2007
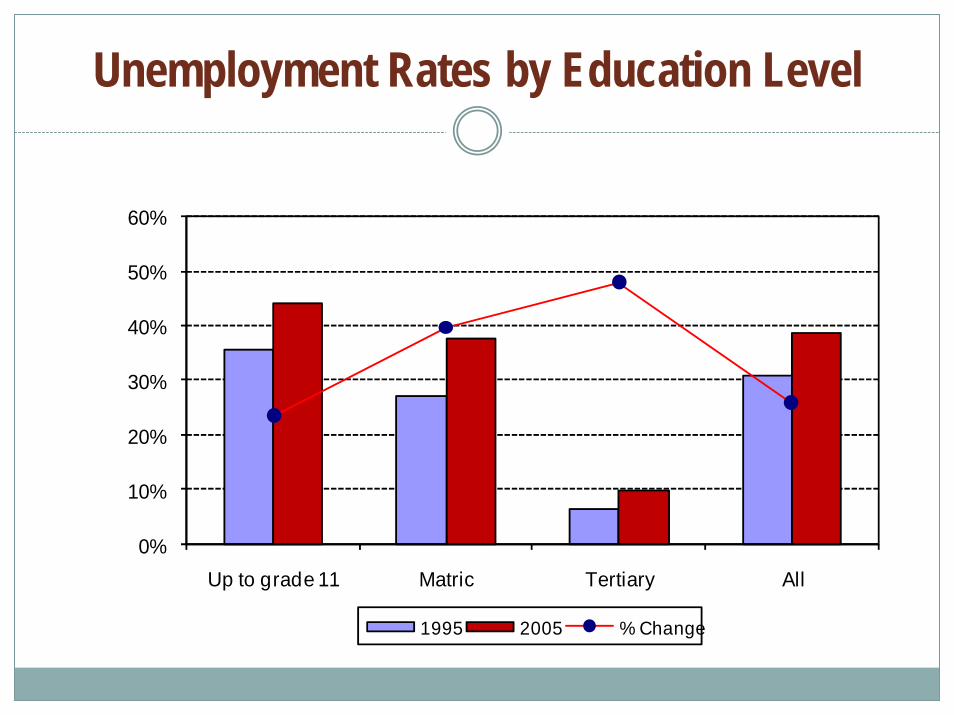
Unemployment Rates by Education Level
0%
10%
20%
30%
40%
50%
60%
Up to grade 11 Matric Tertiary All
1995 2005 % Change
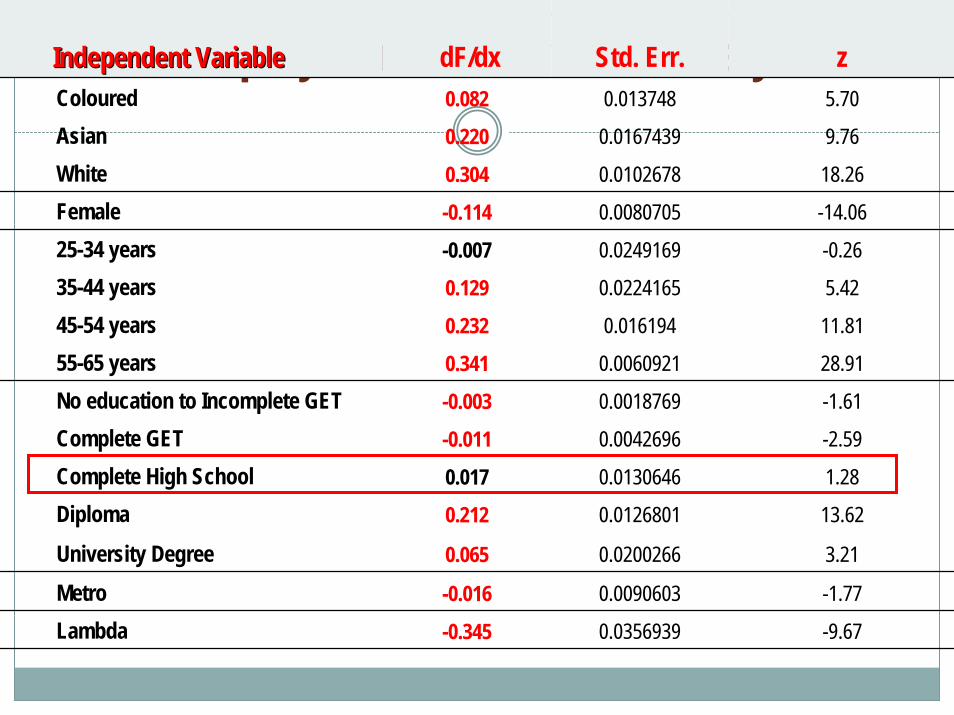
Unemployment: Multivariate AnalysisIndependent VariableIndependent Variable dF/dx Std. Err. zColoured 0.082 0.013748 5.70
Asian 0.220 0.0167439 9.76
White 0.304 0.0102678 18.26
Female -0.114 0.0080705 -14.06
25-34 years -0.007 0.0249169 -0.26
35-44 years 0.129 0.0224165 5.42
45-54 years 0.232 0.016194 11.81
55-65 years 0.341 0.0060921 28.91
No education to Incomplete GET -0.003 0.0018769 -1.61
Complete GET -0.011 0.0042696 -2.59
Complete High School 0.017 0.0130646 1.28
Diploma 0.212 0.0126801 13.62
University Degree 0.065 0.0200266 3.21
Metro -0.016 0.0090603 -1.77
Lambda -0.345 0.0356939 -9.67
The Markers of Unemployment in South Africa
Race, Gender, Age, Location & Schooling serve as the key attributes defining and explaining broad and narrow unemployment rates in South Africa.
The failure of the schooling system & in part, the further education & training System (FET) is particularly important for policy formulation.
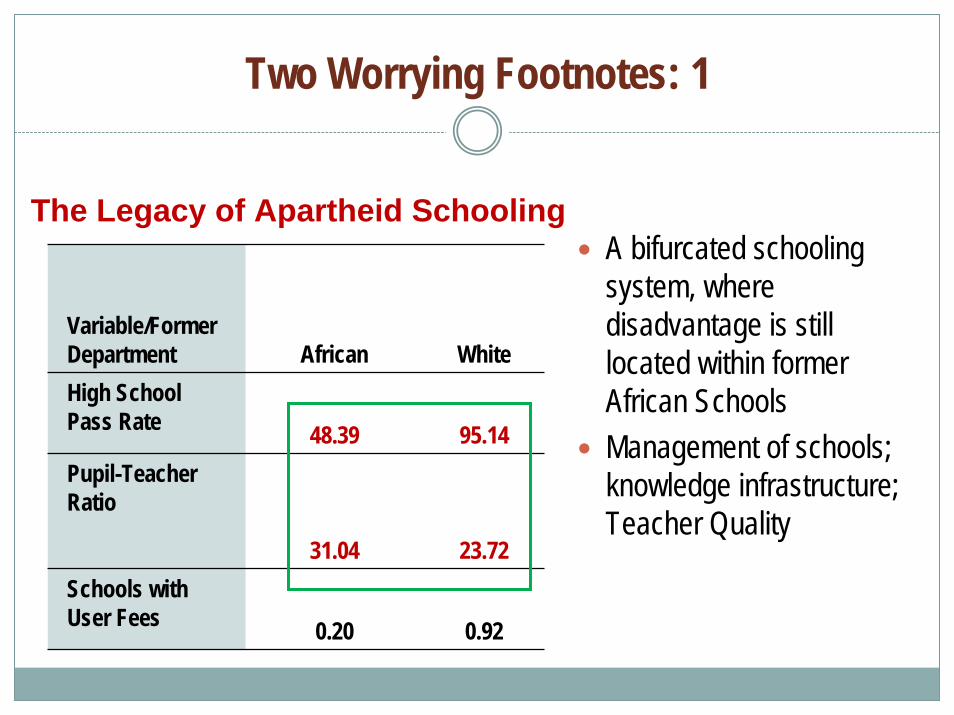
Two Worrying Footnotes: 1
Variable/Former Department African WhiteHigh School Pass Rate 48.39 95.14Pupil-Teacher Ratio
31.04 23.72Schools with User Fees 0.20 0.92
A bifurcated schooling system, where disadvantage is still located within former African SchoolsManagement of schools; knowledge infrastructure; Teacher Quality
The Legacy of Apartheid Schooling
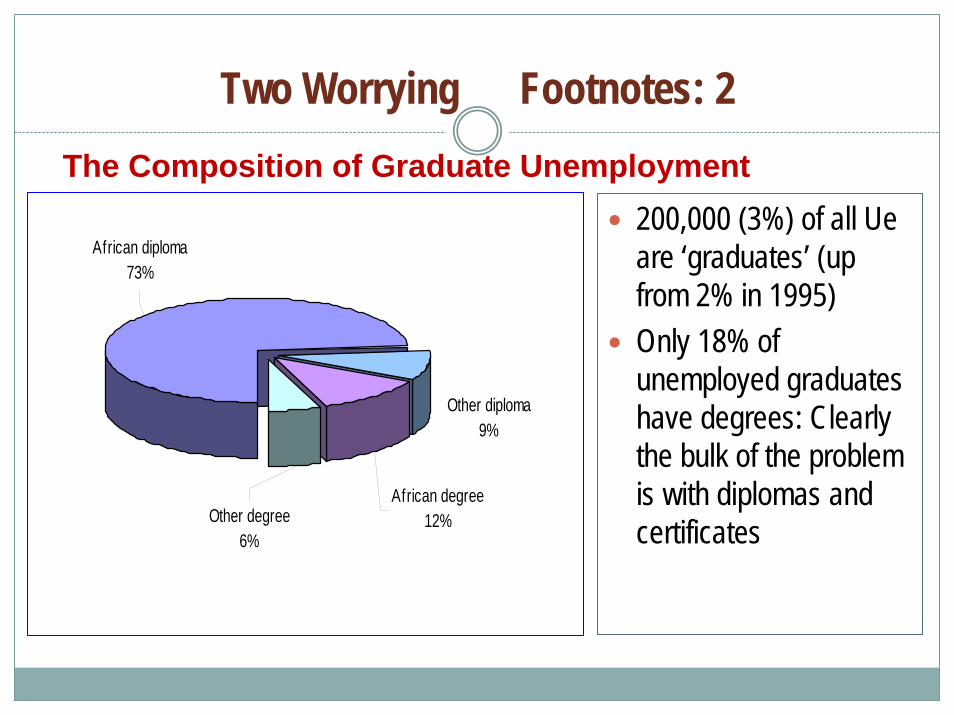
Two Worrying Footnotes: 2The Composition of Graduate Unemployment
Other degree6%
African degree12%
Other diploma9%
African diploma73%
200,000 (3%) of all Ue are ‘graduates’ (up from 2% in 1995)Only 18% of unemployed graduates have degrees: Clearly the bulk of the problem is with diplomas and certificates
Possible Causes of Unemployment in South Africa
Output & Employment
LFP Growth Rates
Labour Demand-Supply Mismatch
Wages and Employment
The Role of Trade Unions & Bargaining Councils
Labour Regulation
The Nature of Economic Growth
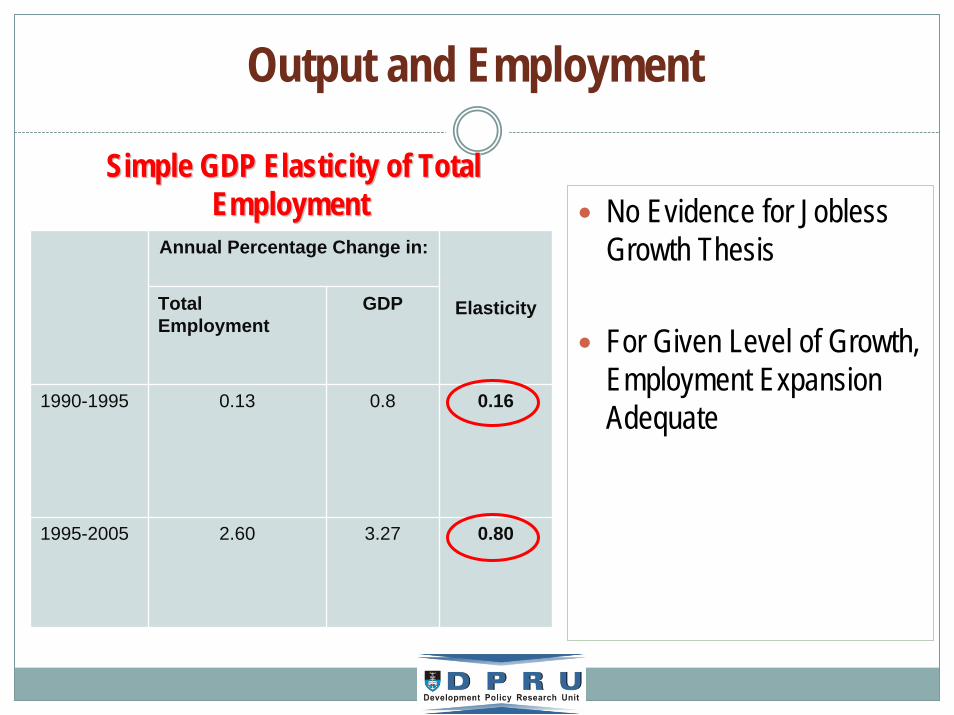
Output and Employment
Annual Percentage Change in:
Total Employment
GDP Elasticity
1990-1995 0.13 0.8 0.16
1995-2005 2.60 3.27 0.80
No Evidence for Jobless Growth Thesis
For Given Level of Growth, Employment Expansion Adequate
Simple GDP Elasticity of Total Simple GDP Elasticity of Total EmploymentEmployment
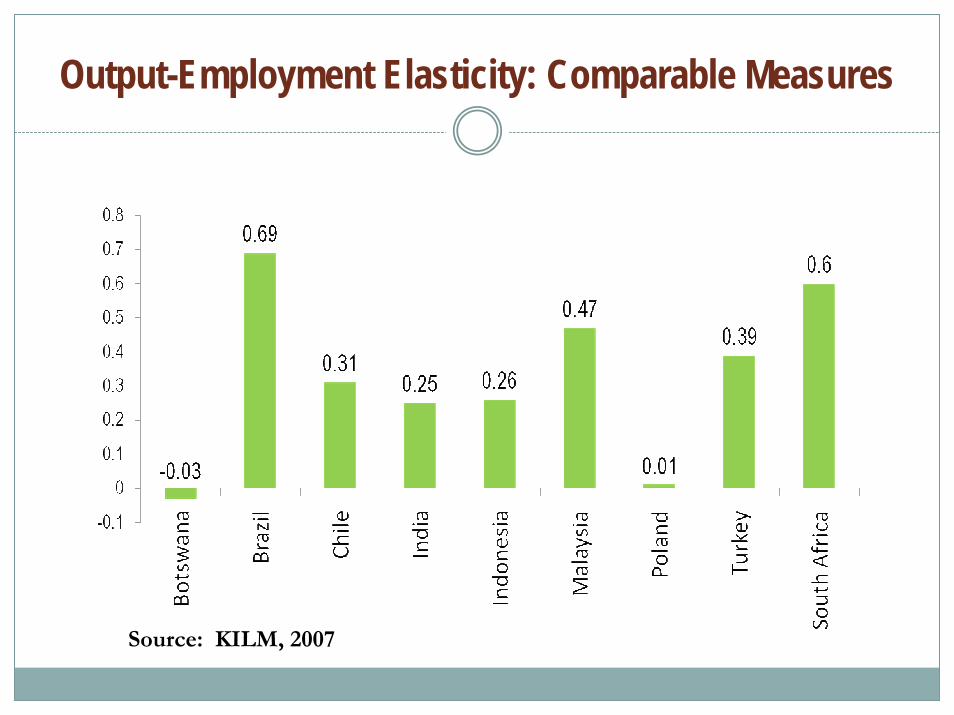
Output-Employment Elasticity: Comparable Measures
Source: KILM, 2007
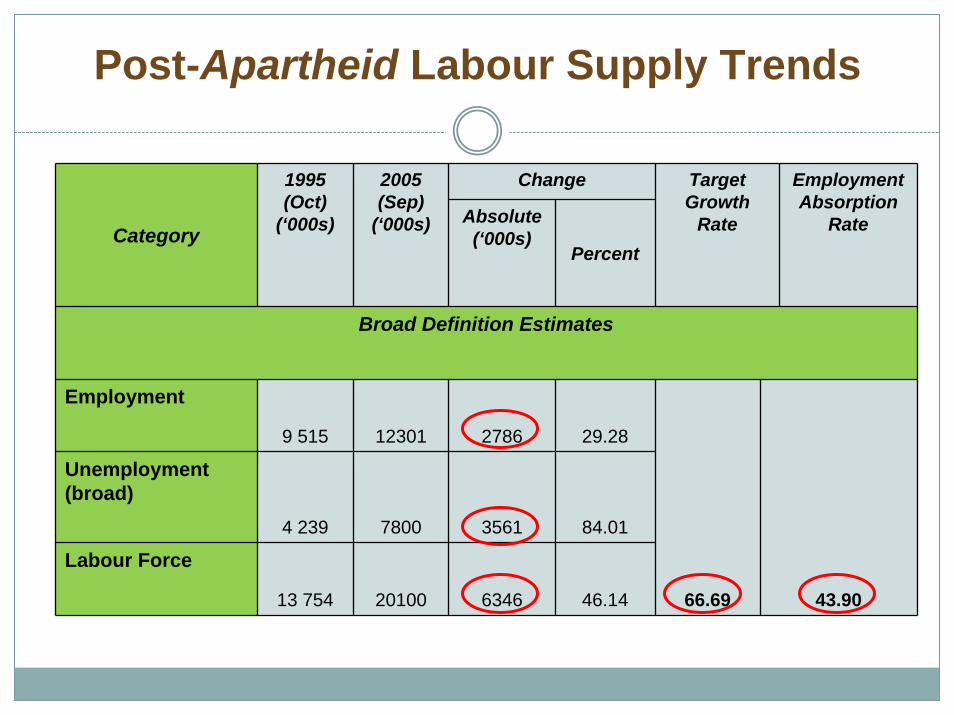
Post-Apartheid Labour Supply Trends
Change
Category
1995(Oct)
(‘000s)
2005(Sep)
(‘000s) Absolute(‘000s)
Percent
TargetGrowth
Rate
EmploymentAbsorption
Rate
Broad Definition Estimates
Employment
9 515 12301 2786 29.28
Unemployment(broad)
4 239 7800 3561 84.01
Labour Force
13 754 20100 6346 46.14 66.69 43.90
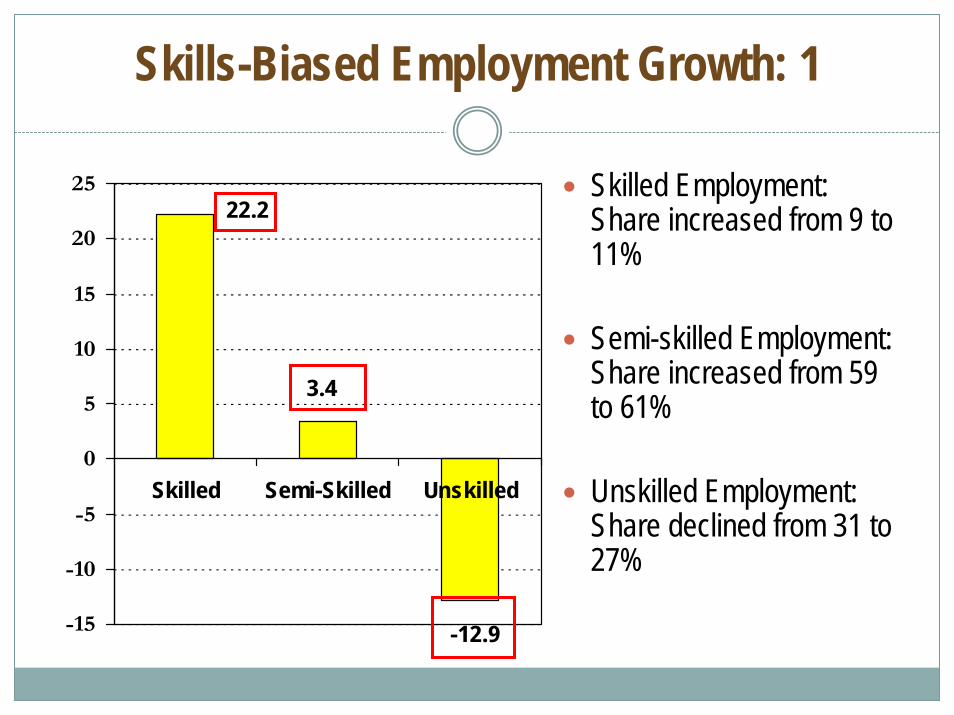
Skills-Biased Employment Growth: 1
-12.9
3.4
22.2
-15
-10
-5
0
5
10
15
20
25
Skilled Semi-Skilled Unskilled
Skilled Employment: Share increased from 9 to 11%
Semi-skilled Employment: Share increased from 59 to 61%
Unskilled Employment: Share declined from 31 to 27%
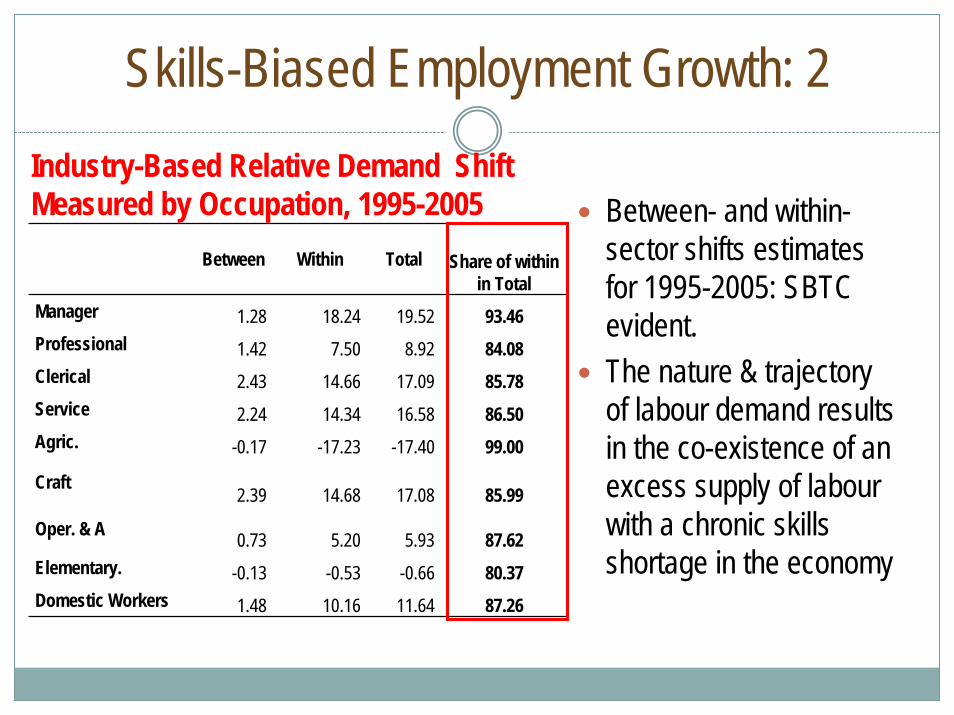
Skills-Biased Employment Growth: 2
Between Within Total Share of within in Total
Manager 1.28 18.24 19.52 93.46Professional 1.42 7.50 8.92 84.08Clerical 2.43 14.66 17.09 85.78Service 2.24 14.34 16.58 86.50Agric. -0.17 -17.23 -17.40 99.00
Craft2.39 14.68 17.08 85.99
Oper. & A 0.73 5.20 5.93 87.62Elementary. -0.13 -0.53 -0.66 80.37Domestic Workers 1.48 10.16 11.64 87.26
Between- and within-sector shifts estimates for 1995-2005: SBTC evident.The nature & trajectory of labour demand results in the co-existence of an excess supply of labour with a chronic skills shortage in the economy
Industry-Based Relative Demand ShiftMeasured by Occupation, 1995-2005
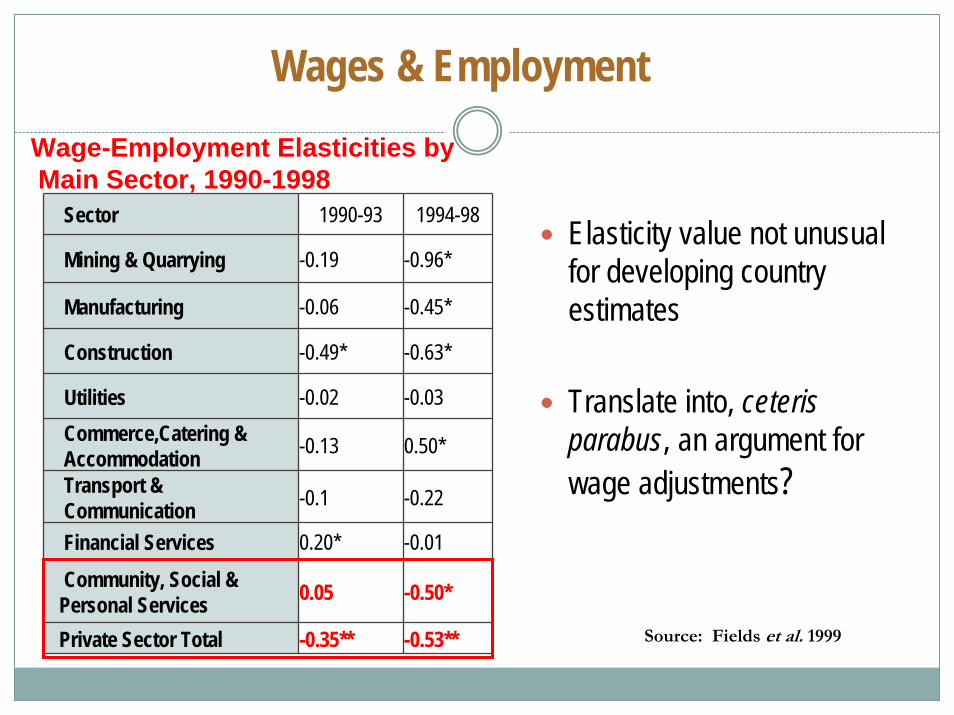
Wages & Employment
Sector 1990-93 1994-98
Mining & Quarrying -0.19 -0.96*
Manufacturing -0.06 -0.45*
Construction -0.49* -0.63*
Utilities -0.02 -0.03Commerce,Catering &Accommodation -0.13 0.50*
Transport &Communication -0.1 -0.22
Financial Services 0.20* -0.01
Community, Social &Personal Services 0.05 -0.50*
Private Sector Total -0.35** -0.53**
Elasticity value not unusual for developing country estimates
Translate into, ceteris parabus, an argument for wage adjustments?
Wage-Employment Elasticities byMain Sector, 1990-1998
Source: Fields et al. 1999

Trade Unions & Bargaining Councils
Union-Wage Premia in the SA Labour Market, 2005
Dependent Variable: Log of Monthly Earnings
Quantile:
OLS 0.1 0.25 0.5 0.75 0.9Private Sector BC Member 0.03 0.05 0.01 0.02 0.02 -0.01Public Sector BC Member 0.28* 0.32* 0.33* 0.26* 0.26* 0.19*
Union 0.23* 0.35* 0.31* 0.27* 0.21* 0.15*
Union-wage premia very high by international standards
Role of bargaining councils (and renewed power of public sector BC) not to be under-estimated
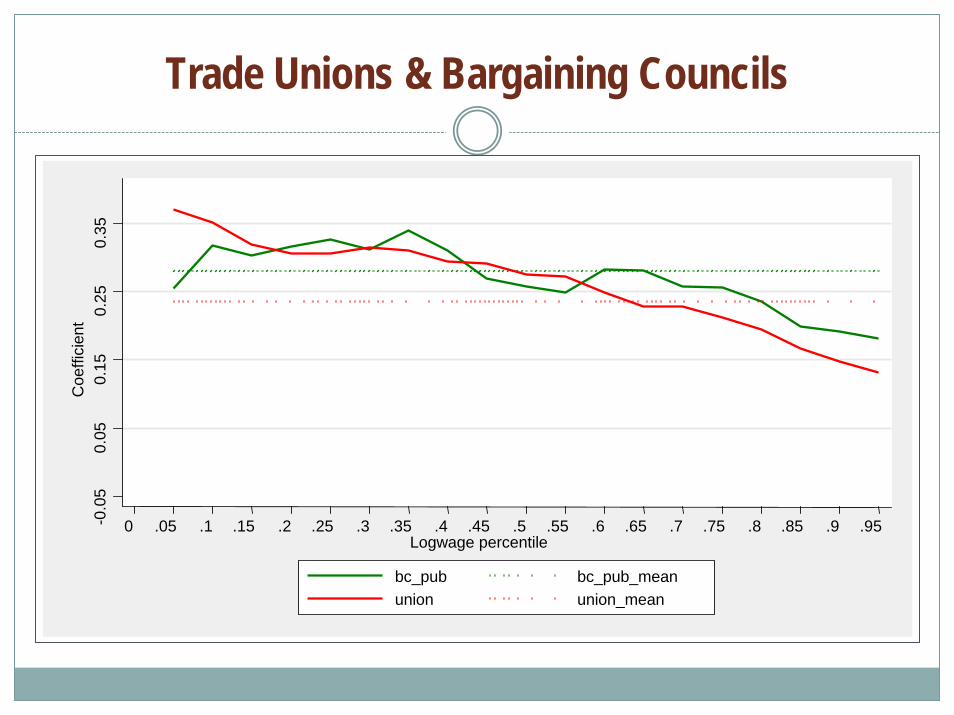
Trade Unions & Bargaining Councils-0
.05
0.05
0.15
0.25
0.35
Coe
ffici
ent
0 .05 .1 .15 .2 .25 .3 .35 .4 .45 .5 .55 .6 .65 .7 .75 .8 .85 .9 .95Logwage percentile
bc_pub bc_pub_meanunion union_mean
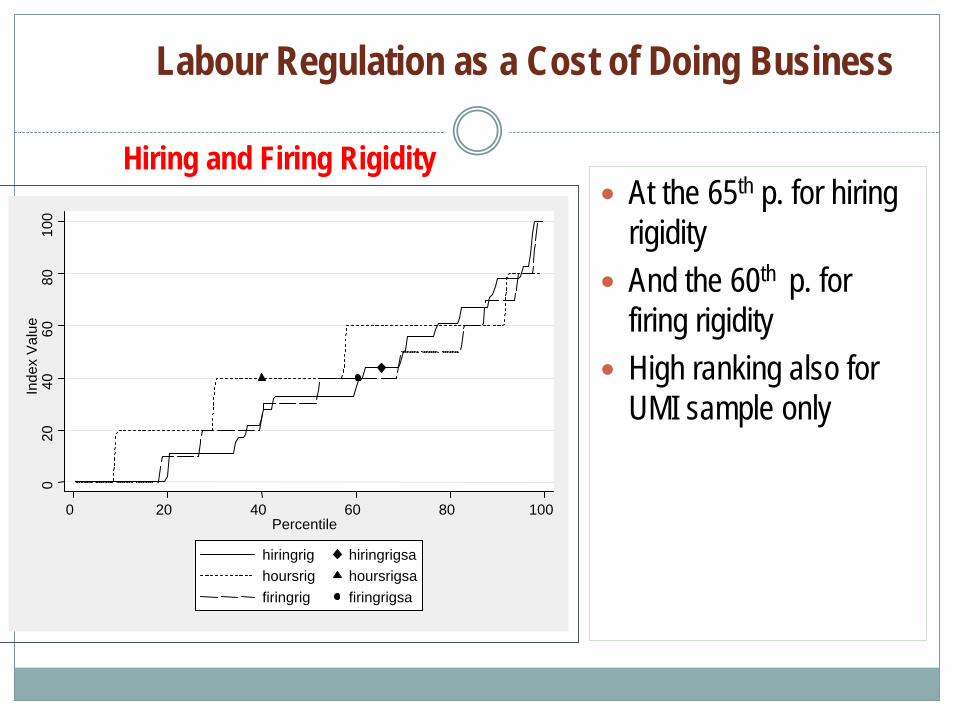
Labour Regulation as a Cost of Doing Business
At the 65th p. for hiring rigidityAnd the 60th p. for firing rigidityHigh ranking also for UMI sample only
Hiring and Firing Rigidity
020
4060
8010
0In
dex
Val
ue
0 20 40 60 80 100Percentile
hiringrig hiringrigsahoursrig hoursrigsafiringrig firingrigsa
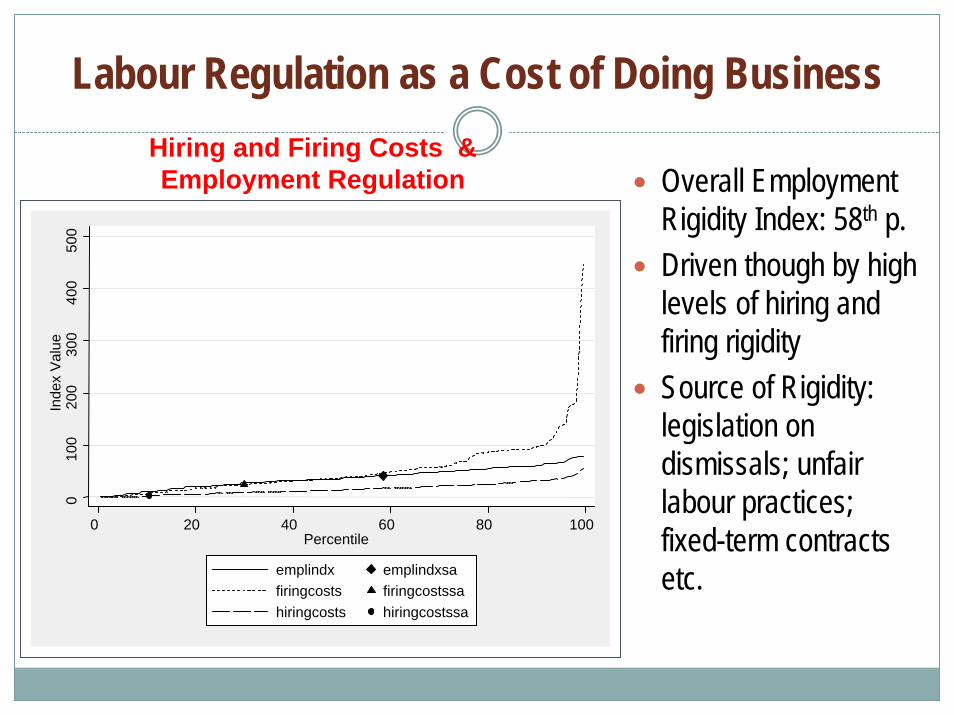
Labour Regulation as a Cost of Doing Business
Overall Employment Rigidity Index: 58th p.Driven though by high levels of hiring and firing rigiditySource of Rigidity: legislation on dismissals; unfair labour practices; fixed-term contracts etc.
Hiring and Firing Costs & Employment Regulation
010
020
030
040
050
0In
dex
Val
ue
0 20 40 60 80 100Percentile
emplindx emplindxsafiringcosts firingcostssahiringcosts hiringcostssa
The Labour Regulatory Environment: 3 Caveats
Above sub-indices measure legislative provisions, they do not measure the interpretation of this legislation by the relevant courts of law .
Institutional capabilities and efficiency: Entirely possible that neutral legislation could be rendered rigid, by virtue of a malfunctioning institutional infrastructure.
Nature of the industrial relations environment, specifically measured by the strength of employer and employee organisations can often shape the nature and extent of labour regulation, almost independent of the regulatory environment .

The Informal Economy In South Africa
Informal Employment : Share of Total Employment
0
10
20
30
40
50
60
Botswana Braz il India P oland S outhAfrica
Turkey
Unemployment in South Africa: Possible Solutions
Fix the Higher Education System to Focus on Narrowing Gap Between Supply & Demand
Improve Employment Placement (Information Asymmetries)
Labour Regulation and Regulatory Efficiency
A dual (youth/non-youth) labour marketA Youth Cadet Service for the Public Sector
Picking Winners in the Schooling SystemIncrease Opportunities to Informal Economy Signficantly